For several decades, Brooklyn was a city that looked ... · Web viewFeatured are commercial...
270
Brooklyn Decades ago, Brooklyn was a city that looked with nostalgia to the glory days of Coney Island, the Victorian Gold Coast, and the Brooklyn Dodgers. Some even gave up on their neighborhoods and moved away. But others―committed residents, nonprofit community development groups, artists, and a few hearty pioneers― refused to budge and stayed behind to rebuild. Their work was reinforced by innovative New York City policies, the Community Reinvestment Act, which encouraged bank lending, and housing tax credits, which encouraged new development. Then the private sector came along, liked what it saw, and the result has been one of the hottest real estate booms in the country. Brooklyn’s optimistic business community, elected officials, and local residents are a special breed. They believe in the potential of all people in the borough and continue to work to ensure that everyone benefits from its renaissance. They also recognize the strength of Brooklyn’s diversity and appreciate hardworking newcomers who unpack their dreams here as millions have done before them. As a result, Brooklyn today is a city that is looking forward, and there is much to look forward to. The waterfront, vibrant until the 1950s when the rise of the interstate highway system robbed the maritime industry of its monopoly on moving goods, is being restored to its 19 th Century glory as a destination for tourists, parks, housing, and even cruise lines; Luxury condominiums are replacing vacant lots in formerly forlorn areas;
-
Upload
phamkhuong -
Category
Documents
-
view
216 -
download
2
Transcript of For several decades, Brooklyn was a city that looked ... · Web viewFeatured are commercial...

Brooklyn
Decades ago, Brooklyn was a city that looked with nostalgia to the glory days of Coney Island, the Victorian Gold Coast, and the Brooklyn Dodgers.
Some even gave up on their neighborhoods and moved away. But others―committed residents, nonprofit community development groups, artists, and a few hearty pioneers― refused to budge and stayed behind to rebuild. Their work was reinforced by innovative New York City policies, the Community Reinvestment Act, which encouraged bank lending, and housing tax credits, which encouraged new development.
Then the private sector came along, liked what it saw, and the result has been one of the hottest real estate booms in the country.
Brooklyn’s optimistic business community, elected officials, and local residents are a special breed. They believe in the potential of all people in the borough and continue to work to ensure that everyone benefits from its renaissance. They also recognize the strength of Brooklyn’s diversity and appreciate hardworking newcomers who unpack their dreams here as millions have done before them.
As a result, Brooklyn today is a city that is looking forward, and there is much to look forward to.
The waterfront, vibrant until the 1950s when the rise of the interstate highway system robbed the maritime industry of its monopoly on moving goods, is being restored to its 19th Century glory as a destination for tourists, parks, housing, and even cruise lines;
Luxury condominiums are replacing vacant lots in formerly forlorn areas;
The City is changing zoning laws to preserve the character of residential neighborhoods, but is encouraging higher rise development along commercial corridors and in downtown Brooklyn;
A minor league baseball team, the Cyclones, draws thousands of fans to Coney Island each season;
Brooklyn’s beaches bring millions to the shore every year;

Residents can see sublime performances at the Brooklyn Academy of Music, and the finest art at the Brooklyn Museum;
Prospect Park has been restored to its 19th Century grandeur, offering along with the Parade Grounds and other parks in Brooklyn, Little League ball fields, soccer fields, tennis courts, swimming pools, and a skating rink, proving that the city is a terrific place to raise kids;
The Dyker Heights and Marine Park golf courses, easily reachable by public transportation, erase thoughts of suburban country clubs;
Large retail chains such Target, Home Depot, and Lowes have realized the potential of the Brooklyn market and have established a presence; and
Brooklyn may have its first major league team since the 1950s, the Brooklyn Nets, when the soon to be Brooklyn basketball team gets its own arena on Atlantic and Flatbush Avenues.
The world has fallen in love with Brooklyn again, and as with any first love, one thinks the other 2.5 million residents couldn’t possibly be more devoted suitors. But the beauty of Brooklyn is that old timers as well as greenhorns are always discovering nuggets of the borough’s rich history as well as uncovering its great potential.
Business InformationBrooklyn Chamber of Commerce, 25 Elm Place, Suite 200, Brooklyn, NY 11201, 718-875-1000, www.ibrooklyn.com
Brooklyn Economic Development Corporation (BEDC), 175 Remsen Street, Brooklyn, NY 11201, 718-522-4600, www.bedc.org
Brooklyn Business Library, 280 Cadman Plaza West, Brooklyn, NY 11201, 718-623-7000, www.biz.brooklynpubliclibrary.org
Political and Community ContactsBrooklyn Borough President Marty Markowitz, 209 Joralemon Street, Brooklyn, NY 11201, 718-802-3700

Source: NYC Department of City Planning; NYC Districting Commission, NYPIRG CMAP

Brooklyn Demographics2000 Census Report for Brooklyn.
Total Population 2,465,326 100 percent
Race/Ethnicity (one race)White 1,015,728 41.2
percentBlack 898,350 36.4
percentNative American or Alaska Native 10,117 0.4
percentAsian 185,818 7.5
percentNative Hawaiian and Other Pacific Islander 10,117 0.4
percentHispanic (any race) 487,878 19.8
percent
Sex (Total Population)Male 1,156,446 46.9 percentFemale 1,308,880 53.1 percent
Age (Total Population)

Age 0 to 4 182,599 7.4 percent 5 to 9 189,677 7.7 percent10 to 14 182,866 7.4 percent15 to 19 177,281 7.2 percent20 to 24 183,217 7.4 percent25 to 34 389,714 15.8 percent35 to 44 368,600 15.0 percent45 to 54 307,200 12.5 percent55 to 59 106,000 4.3 percent60 to 64 95,514 3.9 percent65 to 74 149,665 6.1 percent75 to 84 97,486 4.0 percent85 and over 35,507 1.4 percent
Households by TypeHouseholds with individuals under 18 years 336,47838.2 percentHouseholds with individuals 65 years and over 215,080 24.4
percentOwner-occupied housing units 238,36727.1 percentRenter-occupied housing units 642,36072.9 percent
Bath Beach
Afternoon by the Sea (Gravesend Bay), a pastel by William Merritt Chase, ca 1888.
Like Brooklyn’s other shore front neighborhoods, New York’s elite were attracted to Bath Beach in the late 19th Century because its

seaside location on Gravesend Bay made it an excellent spot for a summer resort. Soon they were building opulent villas and yacht clubs on its shores, and mansions with generous lawns. From 1893 to 1899, Bath Beach even had its own amusement park featuring rides, a dance hall, and swimming.
The affluent era came to an end, however, with the stock market crash of 1929 when mansions were abandoned and new housing was developed to accommodate residents of more modest means. More than a decade before the crash, Jewish and Italian families had begun relocating to Bath Beach from the Lower East Side after the subway system expanded.
Additional residential development followed the opening of the Belt Parkway in 1939 with the Shore Haven Apartments opening in 1949 at 21st Street near the Belt Parkway and the three high rise apartment buildings in the Contello Towers complex opening in 1960, 1963, and 1967.
The community features an ample amount of green space for recreation with its 19-acre Bensonhurst Park, 73-acre Dreier-Offerman Park, and next door in Dyker Heights, the 242-acre Dyker Beach Park, and the Dyker Beach Heights Golf Course.
Sources: The Neighborhoods of Brooklyn, Yale University Press; Old Brooklyn in Early Photographs 1865-1929 by William Lee Younger, Dover Publications, New York, NY.
Political and Community ContactsCommunity Board 13, 2900 West 8th Street, Brooklyn, NY 718-
266-3001New York City Council 47, Domenic M. Recchia Jr. 718-373-9673 [email protected] Assembly 47, William Colton, 718-236-1598,
[email protected] Senate 22, Martin J. Golden, 718-238-6044, [email protected] Congress 13, Vito Fossella, 718-346-8400,
Source: NYC Department of City Planning; NYC Districting Commission, NYPIRG CMAP
LocationThe boundaries for Bath Beach are roughly 14th Avenue, Bay Parkway, 86th Street to Gravesend Bay.
Bath Beach Demographics2000 Census Report within a .70 mile radius as noted in the map above.
Total Population 65,634 100 percent
Race/Ethnicity (Total Population)White 44,830 68.3 percentBlack 261 0.4 percentNative American 58 0.1 percentAsian 13,008 19.8 percentOther 2,153 3.3 percentHispanic (any race) 5,324 8.1 percent
Sex (Total Population)Male 31,649 48.2 percentFemale 33,985 51.8 percent
Age (Total Population)

Age 0 to 4 3,413 5.2 percent 5 to 9 3,239 4.9 percent10 to 20 9,054 13.8 percent21 to 29 8,100 12.3 percent30 to 39 9,994 15.2 percent40 to 49 9,875 15.0 percent50 to 59 6,980 10.6 percent60 to 64 3,181 4.8 percentAge 65+ 11,798 18.0 percent
Education (Population Age 25+)Total population age 25+ 46,559 100 percentLess than 9th grade 7,070 15.2 percent9-12 Grade 7,703 15.2 percentHigh School 13,718 29.5 percentSome College 5,626 12.1 percentAssociate Degree 2,929 6.3 percentBachelor Degree 6,420 13.8 percentGraduate Degree 3,723 8.0 percent
Employment Status (Population Age 16+)Total population age 16+ 53,740 100 percentNot in labor force 26,109 48.6 percentLabor force 27,634 51.4 percent
Labor Force StatusTotal Labor Force Age 16+ 27,634 100 percentArmed Forces 11 0.0 percent
Civilian 25,457 92.1 percentUnemployed 2,166 7.8 percent
Employed Civilian OccupationTotal employed civilians,Age 16+ 25,457 100 percentAgriculture 11 0.0 percentConstruction 1,481 5.8
percentEducation 2,061 8.1 percentEntertainment 1,908 7.5
percentF.I.R.E. 3,149 12.4 percentHealth 2,907 11.4
percentManufacturing 2,624 10.3
percent

Mining 0 0.0 percent
Other services 1,390 5.5 percentProf/Tech/Science 2,586 10.6 percentPublic Administration 960 3.8 percentRetail 2,695 10.6 percentTrans./Warehouse 1,827 7.2 percentWholesale 813 3.2 percent
HouseholdsTotal households 25,042 100 percentFamily households 17,312 69.1
percent
Income (Total Household)Under $10,000 3,867 15.4 percent$10,000-20,000 4,364 17.4 percent$20,000-30,000 2,859 11.4 percent$30,000-40,000 2,872 11.5 percent$40,000-50,000 2,402 9.6 percent$50,000-60,000 2,003 8.0 percent$60,000-75,000 2,197 8.8 percent$75,000-100,000 2,104 8.4 percent$100,000-150,000 1,756 7.0 percent$150,000-200,000 316 1.3 percentOver $200,000 302 1.2 percent
Occupied HousingTotal Occupied Housing 24,993 100
percentOwner Occupied 7,701 30.8 percentRenter Occupied 17,292 69.2 percent
Household Size (Total Occupied)1 person 6,786 27.2 percent2 person 7,509 30.0 percent3 person 4,496 18.0 percent4 person 3,488 14.0 percent5 person 1,483 5.9 percent6 person 702 2.8 percent
Over 7 person 529 2.1 percent
Bay Ridge

In the mid to late 19th Century, prosperous industrialists and businessmen seeking refuge from the summer heat flocked to Bay Ridge and built elaborate summer villas on the bluffs along Shore Road overlooking New York Bay. They summered with their families in a community that had been settled by the Dutch in the 17th Century and where many of the descendents of the early settlers still lived year round.
Although evidence of Bay Ridge’s brush with the Gilded Age is still visible, after New York City’s subway line was extended in 1915, middle class families discovered Bay Ridge and began moving into the neighborhood. Today the homes consist of a mix of apartments and condominiums, modest one- or two-family homes in a variety of architectural styles, attached limestone townhouses that are common in many Brooklyn neighborhoods, and grand houses with gracious lawns on tree-lined streets that would fit comfortably into any affluent New York City suburb.
The majestic Verrazano Narrows Bridge serves as the area’s major local landmark and connects Bay Ridge with Staten Island. Bay Ridge features the 16-acre Leif Ericson Park, 27-acre Owl’s Head Park, and 58-acre Shore Road Park, a two and a half mile path with views of the harbor that is ideal for jogging, walking, and roller blading. The neighborhood also is home to a number of schools including Xaverian High School, Bay Ridge Preparatory School, High School of Telecommunications, Poly Prep Country Day School, Fontbonne Hall Academy, located in one of the community’s historic mansions, and Fort Hamilton High School, built on the site of the Crescent Athletic Club that had once catered to the affluent.
Fort Hamilton, built between 1825 and 1831 at the lower end of Bay Ridge at what is now the base of the Verrazano Narrows Bridge, is one of the country’s oldest military installations and is listed on the National Register of Historic Places. The Bay Ridge community received a reprieve in May 2005 when the Department of Defense recommended that Fort Hamilton remain open. In September 2005, government officials celebrated the opening of 228 new and rehabilitated units of military housing in Fort Hamilton’s Doubleday Village.
Development Potential
To preserve the character of the Bay Ridge neighborhood, the New York City Council in March 2005 adopted recommendations from the Department of City Planning to protect a 249-block area against out-

of-scale development on the neighborhood’s limestone townhouse blocks and tripled the number of blocks where only detached homes are allowed. The Special Bay Ridge District allows Third, Fourth, and Fifth Avenues to be used as corridors for mid-rise, mixed retail/residential buildings, and supports the continuation of current commercial areas that are home to automobile showrooms and retail stores, including Century 21 Department Store on 86th Street.
Kleinfeld’s bridal shop recently moved from Bay Ridge to Manhattan, and in December 2005, a local newspaper announced that the Alpine Cinema, which opened on Fifth Avenue in 1921, was for sale.
Sources: New York City Department of City Planning; The Neighborhoods of Brooklyn, Yale University Press; Old Brooklyn in Early Photographs 1865-1929 by William Lee Younger, Dover Publications, New York, NY; Brooklyn Chamber of Commerce; Daily News, December 2, 2005. Brooklyn Daily Eagle, September 28, 2005 and May 16, 2005.
Business InformationBay Ridge/Bensonhurst Preservation Alliance9201 Fourth Avenue, Brooklyn, NY 11209718-491-1705
86th Street Bay Ridge Business Improvement District9201 4th Avenue, Brooklyn, NY 11209718-680-2420
(The Fifth Avenue Board of Trade is reportedly proposing the creation of a Business Improvement District. The Merchants of Third Avenue also represent businesses in the area.)
Source: NYC Department of Small Business Services, NYC Economic Development Corporation, BEDC, Brooklyn Chamber of Commerce.
Political and Community ContactsCommunity Board 10, 621 86th Street, Brooklyn, NY 11209718-745-6827New York City Council 43, Vincent J. Gentile, 718-748-5200 [email protected] Assembly 60, Matthew Mirones, [email protected] Senate 22, Martin J. Golden, 718-238-6044, [email protected] Congress 13, Vito Fossella, 718-346-8400,
Source: NYC Department of City Planning; NYC Districting Commission, NYPIRG CMAP

LocationThe boundaries for Bay Ridge are roughly 65th Street, Rt. 278, Shore Road, and 101st Street, although the area below 86th Street is sometimes considered another neighborhood called Fort Hamilton.
Bay Ridge Demographics2000 Census Report within a one-mile radius as noted in the map above.
Total Population 97,699 100 percent
Race/Ethnicity (Total Population)White 67,173 68.8 percentBlack 856 0.9 percentNative American 56 0.1 percentAsian 11,883 12.2 percentOther 5,813 5.9 percentHispanic (any race) 11,918 12.2 percent
Sex (Total Population)Male 46,956 48.1 percentFemale 50,743 51.9 percent

Age (Total Population)Age 0 to 4 5,788 5.9 percent
5 to 9 5,270 5.4 percent10 to 20 10,371 10.6 percent21 to 29 13,221 13.5 percent30 to 39 17,201 17.6 percent40 to 49 14,394 14.7 percent50 to 59 11,276 11.5 percent60 to 64 4,178 4.3 percentAge 65+ 16,000 16.4 percent
Education (Population Age 25+)Total population age 25+ 71,507 100 percentLess than 9th grade 6,524 9.1 percent9-12 Grade 8,045 11.3 percentHigh School 18,509 25.9 percentSome College 10,802 15.1 percentAssociate Degree 4,289 6.0 percentBachelor Degree 14,291 20.0 percentGraduate Degree 9,047 12.7 percent
Employment Status (Population Age 16+)Total population age 16+ 81,149 100 percentNot in labor force 33,735 41.6 percentLabor force 47,414 58.4 percent
Labor Force StatusTotal Labor Force Age 16+ 47,414 100 percentArmed Forces 47 0.1 percent
Civilian 44,574 94.0 percentUnemployed 2,793 5.9 percent
Employed Civilian OccupationTotal employed civilians,Age 16+ 44,574 100 percentAgriculture 15 0.0 percentConstruction 2,363 5.3
percentEducation 4,194 9.4 percentEntertainment 3,315 7.4
percentF.I.R.E. 6,679 15.0 percentHealth 5,463 12.3
percentManufacturing 3,013 6.8
percent

Mining 8 0.0 percent
Other services 1,994 4.5 percentProf/Tech/Science 4,850 10.9 percentPublic Administration 2,727 6.1 percentRetail 3,982 8.9 percentTrans./Warehouse 2,697 6.1 percentWholesale 1,184 2.7 percent
HouseholdsTotal households 42,122 100 percentFamily households 23,990 57.0
percent
Income (Total Household)Under $10,000 4,365 10.4 percent$10,000-20,000 5,584 13.3 percent$20,000-30,000 4,663 11.1 percent$30,000-40,000 4,443 10.5 percent$40,000-50,000 4,313 10.2 percent$50,000-60,000 3,642 8.6 percent$60,000-75,000 4,399 10.4 percent$75,000-100,000 4,371 10.4 percent$100,000-150,000 4,003 9.5 percent$150,000-200,000 1,264 3.0 percentOver $200,000 1,075 2.6 percent
Occupied HousingTotal Occupied Housing 41,877 100
percentOwner Occupied 13,187 31.5 percentRenter Occupied 28,680 68.5 percent
Household Size (Total Occupied)1 person 15,856 37.9 percent2 person 11,791 28.2 percent3 person 6,024 14.4 percent4 person 4,694 11.2 percent5 person 2,286 5.5 percent6 person 708 1.7 percent
Over 7 person 518 1.2 percentBedford-Stuyvesant

African-Americans were among the first residents of Bedford-Stuyvesant in the 1830s and today the neighborhood boasts the largest Black community in New York City. An economically diverse area, Bedford-Stuyvesant is known for its abundance of traditional, century old brownstones and brick and masonry houses that have attracted in recent years professionals seeking elegant, spacious homes at affordable prices; although the days of bargains have passed.
A community called Weeksville was settled in the 1830s by former slaves, and during the next 170 years many ethnic groups moved in and out of Bedford-Stuyvesant. Suburban villas were built in the 1860s, and middle class row houses and apartment buildings beginning in the 1880s. Stuyvesant Heights, an area designated as a historic district in 1971, features 12 blocks of preserved townhouses in French Second Empire, Neo-Grec, Romanesque Revival, and neo-Renaissance styles. Local residents speculate that condos will be the area’s next phase of residential development because within the last year, 65 vacant lots have been purchased by developers. Middle-class college graduates, working class residents, and the very poor populate Bedford-Stuyvesant, which is home to active neighborhood associations and community groups that have introduced and implemented many improvements. To encourage homeownership and offer quality housing in Bedford-Stuyvesant, Bridge Street Development Corporation and the Pratt Area Community Council began taking possession of dilapidated City-owned properties offered several years ago in a City-sponsored program, renovating them, and selling them to qualified families at affordable prices. In October 2005, Habitat for Humanity-New York broke ground on six new affordable, three-story townhouses that will be offered for sale on Halsey Street and Marcus Garvey Boulevard. In addition, the Pratt Area Community Council, Bedford-Stuyvesant Restoration Corporation, and other organizations are currently working with merchants and building owners to upgrade and attract businesses to the commercial corridors of Fulton Street and Nostrand Avenue that will provide the goods and services sought by the community. Private investors have spurred development in the community as demonstrated by the success of Monique Greenwood, former editor-in-chief of Essence magazine, who with her husband, Glenn Pogue, converted an 1860s Italianate Villa into the Akwaaba Mansion, a bed and breakfast that opened in 1995 at 347 MacDonough Street. Originally owned by wealthy beer barons, the mansion’s elegant interior features 14-foot ceilings, ornate fireplaces, intricate parquet wood floors, and gaslight fixtures, and celebrates the art, culture, and achievements of African-Americans. Nearby the couple opened the

Akwaaba Café, an elegant 72-seat restaurant, and their business, Akwaaba Properties, also owns the block of Lewis Avenue, between MacDonough and Decatur Streets, where they have developed the Shops of Lewis Avenue. Featured are commercial tenants who own and operate Brownstone Books, the Parlor Floor Antiques, Jones Barber Shop, Marlene’s Hair Salon, and Mirrors Coffee House.
Bedford-Stuyvesant residents take great pride in their local culture, history, and famous residents, which include Lena Horne, Shirley Chisholm, Earl Graves, Floyd Patterson, Eubie Blake, and Jackie Robinson. Weeksville’s history has been conserved by the Society for the Preservation of Weeksville and Bedford-Stuyvesant, which offers tours of houses that are city and national landmarks and a museum of African-American history and culture. The Billie Holliday Theater at Bedford-Stuyvesant Restoration Plaza, and a number of jazz clubs are located in the community. Each year the Central Brooklyn Jazz Festival offers a month of music in a variety of neighborhood venues. The area also is well-known for its vibrant and active churches.
Development Potential
Bedford-Stuyvesant Restoration Corporation is collaborating with the Brooklyn Chamber of Commerce on Fulton First, a major effort to revitalize Fulton Street by providing grants for façade and streetscape improvements. The program, created several years ago in partnership with the FleetBoston Financial Foundation, Congressman Edolphus Towns, the Office of the Mayor of the City of New York, and the New York City Department of Business Services, enabled the launch of the Fulton Street Retail Redevelopment plan, the master plan through which the community will begin to attract new business investment to the area.
The Pratt Area Community Council, which has been involved in economic development on Fulton Street since 1997, recently conducted a needs assessment for Fulton Street and found that local residents are eager for new businesses. To encourage development, the Pratt Area Community Council is seeking to establish the Fulton Street Business Improvement District (BID) along the Fort Greene and Clinton Hill sections of Fulton Street.
The area around Bedford and Myrtle Avenues has been experiencing a surge in development recently, with a large new residential building opening on Spencer Street between Myrtle and Park Avenues, Kosher food stores opening nearby on Myrtle Avenue, a new Home Depot opening at 585 DeKalb Avenue, and a new 32-unit, loft condominium

development under construction at 794-802 DeKalb Avenue at the corner of Throop Avenue.
Sources: Brooklyn Chamber of Commerce; New York City Department of Housing Preservation and Development; New York Times, September 21, 2003; New York Daily News, November 15, 2005; The Neighborhoods of Brooklyn, Yale University Press, New Haven and London; www.prattarea.org; www..restorationplaza.org; An Architectural Guidebook to Brooklyn, Gibbs-Smith Publisher, Salt Lake City; Brooklyn Daily Eagle January 7, 2005, October 28, 2005, December 23, 2005.
Business InformationPratt Area Community Council, 1224 Bedford Avenue, Brooklyn, NY 11216718-783-3549, www.prattarea.org
Bedford-Stuyvesant Restoration Corporation., 1368 Fulton Street, Brooklyn, NY 11216718-636-6900, www.restorationplaza.org
Fulton-Nostrand United Merchants Association, 718-636-6905, or [email protected]
Boricua College Small Business Development Center, 9 Graham Avenue, Brooklyn, NY 11206718-963-4112, ext. 565
Political and Community ContactsCommunity Board 3, 1360 Fulton Street, Brooklyn, NY 11216,
718-622-6601New York City Council 36, Albert Vann, 718-919-0740, [email protected] Assembly 56, Annette Robinson, 718-399-7630,
http://assembly.state.ny.us/ NYS Senate 18, Velmanette Montgomery, 718-643-6140, [email protected] Congress 10, Edolphus Towns, 718-855-8018,
www.house.gov/towns/ Source: NYC Department of City Planning; NYC Districting Commission, NYPIRG CMAP

LocationThe boundaries of Bedford-Stuyvesant are roughly Classon Avenue, Broadway, Flushing Avenue, and Atlantic Avenue or Park Place; boundaries of Stuyvesant Heights are Tompkins Avenue, Stuyvesant Avenue, Macon Street to Fulton and Chauncey Streets.
Bedford Stuyvesant Demographics2000 Census Report within a 1 mile radius as noted in the map above.
Total Population 159,570 100 percent
Race/Ethnicity (Total Population)White 1,945 1.2 percentBlack 119,496 74.9 percentNative American 259 0.2 percentAsian 1,846 1.2 percentOther 4,494 2.8 percentHispanic (any race) 31,530 19.8 percent
Sex (Total Population)Male 72,083 45.2 percentFemale 87,487 54.8 percent

Age (Total Population)Age 0 to 4 12,640 7.9 percent
5 to 9 14,402 9.0 percent10 to 20 28,713 18.0 percent21 to 29 20,798 13.0 percent30 to 39 24,604 15.4 percent40 to 49 21,754 13.6 percent50 to 59 15,260 9.6 percent60 to 64 6,036 3.8 percentAge 65+ 15,363 9.6 percent
Education (Population Age 25+)Total population age 25+ 94,307 100 percentLess than 9th grade 12,488 13.2 percent9-12 Grade 24,146 25.6 percentHigh School 27,571 29.2 percentSome College 15,294 16.2 percentAssociate Degree 4,811 5.1 percentBachelor Degree 6,420 6.8 percentGraduate Degree 3,577 3.8 percent
Employment Status (Population Age 16+)Total population age 16+ 116,185 100 percentNot in labor force 56,972 49.0 percentLabor force 59,213 51.0 percent
Labor Force StatusTotal Labor Force Age 16+ 59,213 100 percentArmed Forces 50 0.1 percentCivilian 48,729 82.3 percentUnemployed 10,434 17.6 percent
Employed Civilian OccupationTotal employed civilians,Age 16+ 48,729 100 percentAgriculture 26 0.1 percentConstruction 2,319 4.8 percentEducation 4,113 8.4 percentEntertainment 3,194 6.6 percentF.I.R.E. 4,613 9.5 percentHealth 9,148 18.8 percentManufacturing 2,720 5.6 percentMining 0 0.0 percentOther services 2,971 6.1 percentProf/Tech/Science 4,597 9.4 percent

Public Administration 3,809 7.8 percentRetail 4,170 8.6 percentTrans./Warehouse 4,385 9.0 percentWholesale 1,005 2.1 percent
HouseholdsTotal households 57,064 100 percentFamily households 36,248 63.5 percent
Income (Total Household)Under $10,000 16,759 29.4 percent$10,000-20,000 9,353 16.4 percent$20,000-30,000 8,036 14.1 percent$30,000-40,000 6,187 10.8 percent$40,000-50,000 4,556 8.0 percent$50,000-60,000 3,151 5.5 percent$60,000-75,000 3,464 6.1 percent$75,000-100,000 2,863 5.0 percent$100,000-150,000 1,743 3.1 percent$150,000-200,000 455 0.8 percentOver $200,000 497 0.9 percent
Occupied HousingTotal Occupied Housing 57,048 100 percentOwner Occupied 10,262 18.0 percentRenter Occupied 46,786 82.0 percent
Household Size (Total Occupied)1 person 17,932 31.4 percent2 person 13,499 23.7 percent3 person 9,776 17.1 percent4 person 7,288 12.8 percent5 person 4,317 7.6 percent6 person 1,957 3.4 percentOver 7 person 2,279 4.0 percent
Bensonhurst
Following the opening of the Brooklyn, Bath, and West End Railroad in 1885, real estate developer James Lynch bought land from the Benson family and created a 350-acre suburb, Bensonhurst-by-the-Sea, featuring villas for 1,000 families and 5,000 shade trees in an area from 20th Avenue to 23rd Avenue and 78th Street to Gravesend Bay. Prior to that, the area had been a farming community.

After the 4th Avenue subway line reached Bensonhurst in 1915, families found the community more accessible, and soon construction began on two- and three-family homes. In the 1920s, four- to six-floor walk-up apartment buildings were built. By 1930, Bensonhurst had 150,000 residents, many of them Italian-American and Jewish residents who had previously lived on Manhattan’s Lower East Side.
The 1950s brought an influx of Italian immigrants from southern Italy, many of whom remain in the community. Fresh pastries, pasta, and pizza, and religious celebrations serve as reminders of the old country. While nearly 80 percent of the neighborhood’s residents traced their background to Italy in 1980, the neighborhood also is home to African Americans and other families of Greek, Korean, Israeli, Polish, Arab, and Russian descent.
Part of the community’s original Dutch heritage is maintained at the New Utrecht Reformed Church at 18th Avenue and 84th Street, the same site as the original Dutch Reformed Church founded by parishioners in 1677. Members of the historic New Utrecht Reformed Church are seeking to raise $1.8 million to restore and reopen the New York City landmark, which was built in 1828.
The neighborhood also is well represented by popular culture. Ralph Kramden, Jackie Gleason’s character on The Honeymooners, lived in Bensonhurst; the movie Saturday Night Fever was set in Bensonhurst and Bay Ridge; and New Utrecht High School was the location for the television show Welcome Back Kotter. Famous Bensonhurst residents include actors Elliott Gould and Paul Sorvino, comedian Buddy Hackett, newsman Larry King, baseball pitcher Sandy Koufax, opera singer Robert Merrill, and business tycoon Laurence Tisch.
Development Potential
Commercial activity is concentrated in Bensonhurst on Bay Parkway, 65th Street, Kings Highway, Avenue U, and parts of Highlawn Avenue and Avenues O, S, and T.
Construction on three- to four-story row houses occurred through the 1980s, but in recent years taller apartment buildings have been built on mid-blocks and predominantly low-rise streets such as 65th Street. As a result, the City Planning Commission took steps in 2005 to protect the low-rise character of the neighborhood.
In June 2005, the City Council adopted a City Planning Commission proposal to make zoning changes to about 120 blocks in Bensonhurst

in the area bounded by Bay Parkway and 61st Street on the north, McDonald Avenue on the east, Avenue U on the south, and Stillwell Avenue on the west. As a result, a three-story height limit has been established where there is predominantly low-rise housing. According to the Planning Commission, the zoning preserves “the existing neighborhood scale and character with lower density and contextual zoning districts, preventing new development inconsistent with that low-rise character.”
The City is encouraging residential development on Avenue P, Quentin Road, and Kings Highway and, to some extent, Bay Parkway and 65th Street because these are wide corridors that already feature large apartment buildings and have access to mass transit. The mid-density zoning on these streets establish height limits consistent with existing apartment houses and would prohibit the development of an “overly large community facility and mixed residential/community facility buildings.”
Sources: New York City Department of City Planning; The Neighborhoods of Brooklyn, Yale University Press; Old Brooklyn in Early Photographs 1865-1929 by William Lee Younger, Dover Publications, New York, NY.
Business InformationBay Ridge/Bensonhurst Preservation Alliance9201 Fourth Avenue, Brooklyn, NY 11209718-491-1705
Source: NYC Department of Small Business Services, NYC Economic Development Corporation, BEDC, Brooklyn Chamber of Commerce.
Political and Community ContactsCommunity Board 11, 2214 Bath Avenue, Brooklyn, NY 718-266-
8800New York City Council 43, Vincent J. Gentile, 718-748-5200 [email protected] Assembly 49, Peter Abbate Jr., 718-236-1764,
[email protected] Senate 22, Martin J. Golden, 718-238-6044, [email protected] Congress 13, Vito Fossella, 718-346-8400,
Source: NYC Department of City Planning; NYC Districting Commission, NYPIRG CMAP

LocationThe boundaries for Bensonhurst are roughly 14th Avenue, to Bay Parkway and Avenue P, 65th Street to 86th Street.
Bensonhurst Demographics2000 Census Report within a .65 mile radius as noted in the map above.
Total Population 66,862 100 percent
Race/Ethnicity (Total Population)White 43,762 65.5 percentBlack 183 0.3 percentNative American 83 0.1 percentAsian 15,877 23.7 percentOther 2,032 3.0 percentHispanic (any race) 4,925 7.4 percent
Sex (Total Population)Male 32,154 48.1 percentFemale 34,708 51.9 percent

Age (Total Population)Age 0 to 4 3,484 5.2 percent
5 to 9 3,739 5.6 percent10 to 20 9,172 13.7 percent21 to 29 8,450 12.6 percent30 to 39 10,361 15.5 percent40 to 49 10,152 15.2 percent50 to 59 7,325 11.0 percent60 to 64 3,138 4.7 percentAge 65+ 11,041 16.5 percent
Education (Population Age 25+)Total population age 25+ 46,836 100 percentLess than 9th grade 8,512 18.2 percent9-12 Grade 7,726 16.5 percentHigh School 14,124 30.2 percentSome College 5,541 11.8 percentAssociate Degree 2,619 5.6 percentBachelor Degree 5,433 11.6 percentGraduate Degree 2,881 6.2 percent
Employment Status (Population Age 16+)Total population age 16+ 54,523 100 percentNot in labor force 26,609 48.8 percentLabor force 27,914 51.2 percent
Labor Force StatusTotal Labor Force Age 16+ 27,914 100 percentArmed Forces 24 0.1 percent
Civilian 25,896 92.8 percentUnemployed 1,994 7.1 percent
Employed Civilian OccupationTotal employed civilians,Age 16+ 25,896 100 percentAgriculture 13 0.1 percentConstruction 1,634 6.3
percentEducation 1,965 7.6 percentEntertainment 2,153 8.3
percentF.I.R.E. 3,064 11.8 percentHealth 2,772 10.7
percentManufacturing 2,951 11.4
percent

Mining 6 0.0 percent
Other services 1,380 5.3 percentProf/Tech/Science 2,477 9.6 percentPublic Administration 897 3.5 percentRetail 2,680 10.3 percentTrans./Warehouse 2,111 8.2 percentWholesale 885 3.4 percent
HouseholdsTotal households 24,782 100 percentFamily households 17,690 71.4
percent
Income (Total Household)Under $10,000 4,004 16.2 percent$10,000-20,000 4,477 18.1 percent$20,000-30,000 2,892 11.7 percent$30,000-40,000 2,858 11.5 percent$40,000-50,000 2,304 9.3 percent$50,000-60,000 1,966 7.9 percent$60,000-75,000 2,264 9.1 percent$75,000-100,000 2,006 8.1 percent$100,000-150,000 1,541 6.2 percent$150,000-200,000 286 1.2 percentOver $200,000 184 0.7 percent
Occupied HousingTotal Occupied Housing 24,538 100
percentOwner Occupied 7,814 31.8 percentRenter Occupied 16,724 68.2 percent
Household Size (Total Occupied)1 person 6,258 25.5 percent2 person 7,074 28.8 percent3 person 4,467 18.2 percent4 person 3,906 15.9 percent5 person 1,646 6.7 percent6 person 657 2.7 percent
Over 7 person 530 2.2 percentBoerum Hill

For years a sleepy neighborhood sandwiched between Park Slope, Cobble Hill, and downtown Brooklyn, Boerum Hill now stands at the epicenter of Brooklyn’s development boom with construction of residential buildings rapidly replacing vacant lots, parking lots, and older structures along such thoroughfares as Atlantic Avenue, Boerum Place, and Schermerhorn Street. The 1.5 mile stretch of Atlantic Avenue from Flatbush to the East River divides Boerum Hill into two parts and runs through Cobble Hill and Brooklyn Heights. Atlantic Avenue serves as a destination for shopping and dining with new boutiques, restaurants, and galleries opening their doors next to more established Middle Eastern businesses and antique shops. Twenty-five new businesses opened on Atlantic Avenue in the first half of 2005, according to the Atlantic Avenue Betterment Association, an organization made up of local merchants. To promote the avenue’s businesses and celebrate the vibrant cultures they represent, the Atlantic Avenue Local Development Corporation presents Atlantic Antic each year.
Smith Street also has emerged as a strong commercial corridor with residents from inside and outside the neighborhood flocking to its popular new restaurants and trendy boutiques. Alan Boss, who created the Chelsea and Hell’s Kitchen Flea Markets in Manhattan, opened the Annex at Smith Street Market, a flea market, at Smith and Union Streets in November 2005. Primarily developed between 1840 and 1870, the heart of Boerum Hill features tree-lined streets, pristine three- and four-story brick townhouses, and an area that was named a historic district in 1973 between Nevins, Wyckoff, Hoyt, and Pacific Streets. The community was named Boerum Hill in the 1960s, and after years of decline began attracting new homebuyers in the 1960s and 1970s. This period of gentrification in Boerum Hill serves as the setting for The Fortress of Solitude, a novel published in 2003 by Brooklyn author Jonathan Lethem, who was named one of 25 MacArthur Fellows in 2005. Other Boerum Hill attractions include the YMCA and the New York City Transit Museum at Schermerhorn Street and Boerum Place. Development Potential
A number of new residential developments have been completed or are planned in Boerum Hill including:
The Court House, 320 luxury rentals at Court Street and Atlantic Avenue, which also houses the new Dodge YMCA;
Boulevard East luxury condominiums at 53 Boerum Place;

The Smith, at 75 Smith Street, a condominium/hotel/retail development;
State Renaissance Court, a rental development at Schermerhorn, Hoyt and State Streets, which has earmarked 30 percent of the units for low-and moderate-income families;
The State Street Townhouses, 14 new, single-family townhouses for sale on State Street;
Schermerhorn House 200 new units of affordable rental housing on Schermerhorn Street;
Lookout Hill Condominiums, an 11-story, 46-unit, loft-like, condominium development at 199 State Street, between Court Street and Boerum Place and adjacent to the newly constructed Brooklyn Law School dormitories;
The Bergen, a 20-unit condominium development at 328-330 Bergen Street;
A 24-unit, affordable rental project at 344, 346, and 348 Bergen Street;
Two buildings with 226 residential units and 18,000 square feet of retail space are planned for 204 Livingston Street, between Hoyt and Bond Streets;
In December 2005, it was announced that the Mobil Gas Station site at Atlantic Avenue and Boerum Place was on the market for $26 million.
Boerum Hill is adjacent to the downtown Brooklyn business district, which was rezoned by the City Council in June 2004 to encourage new Class A office development extending from Metrotech to Fulton Mall, thereby enabling Brooklyn to compete with New Jersey for new businesses. The Downtown Plan also allows for the expansion of academic centers such as Polytech and New York City Tech in the commercial core, and new residential development with ground-floor retail in the surrounding areas along Schermerhorn and Livingston Streets and Flatbush Avenue.
Atlantic Avenue is a major transportation route to the Brooklyn Queens Expressway and the Brooklyn Bridge, and will be the southern gateway to the proposed Brooklyn Bridge Park. The 85-acre park is planned on a 1.3 mile stretch from Atlantic Avenue, including the dormant piers below Brooklyn Heights, along the East River to Jay Street, north of the Manhattan Bridge. Plans include residential condominiums at Atlantic Avenue, open plazas, restored marshlands, active indoor and outdoor recreational opportunities, including shaded sports fields, softball fields, beach volley ball courts, and playgrounds, a hotel, and retail development.

The Atlantic Avenue Association Local Development Corporation announced a plan in 2003 to identify ways to integrate Atlantic Avenue into Brooklyn Bridge Park. The local development corporation also seeks new development opportunities along the avenue where parking lots and vacant lots remain, upzoning along Atlantic Avenue, increased retail, and improvements to streetscape, parking, and intersections. The group seeks to close the now vacant Men’s House of Detention at Boerum Place and Atlantic Avenue, which the city could reopen at any time.
At intersection of Atlantic and Flatbush Avenues, an 18,000 seat arena is proposed for the Nets basketball team, making the Brooklyn Nets the first major league professional team to play in the borough since the Brooklyn Dodgers left in the 1950s. Forest City Ratner Companies, which has developed retail malls and shops and a commercial building on other corners of the intersection, purchased the Atlantic/Vanderbilt Railroad Yards from the Metropolitan Transit Authority in September 2005. The firm has proposed building the arena and 17 high rise buildings consisting of more than 4,000 units of market-rate and affordable housing and commercial and retail development on a 21-acre site along Atlantic Avenue from Flatbush Avenue to Vanderbilt Avenue. The project is now subject to the review and approval of a series of government entities.
Sources: The Neighborhoods of Brooklyn, Yale University Press, New Haven and London; An Architectural Guidebook to Brooklyn, Gibbs-Smith Publisher, Salt Lake City; www.brooklynbridgepark.org; www.atlanticave.org; www.atlanticavenuebkny.com; Brooklyn Chamber of Commerce; New York City Department of City Planning; Brooklyn Daily Eagle January 7, 2005; May 19, 2005, August 18, 2005, September 16, 21 and 29, 2005, October, 21, 2005; November 17, 23, 2005, December 6, and 9, 2005.
Business Information
Atlantic Avenue Association Local Development Corporation494 Atlantic Avenue, Brooklyn, NY 11217, 718-875-8993,
www.atlanticave.org
Atlantic Avenue Betterment Association321 Atlantic Avenue, Brooklyn, NY 11201, 718-852-7418, www.atlanticavenuebkny.com
Political and Community ContactsCommunity Board 2, 350 Jay Street, 8th Floor, Brooklyn, NY
11201, 718-596-5410New York City Council 33, David Yassky, 718-875-5200, [email protected] Assembly 52, Joan L. Millman, 718-246-4889,

NYS Senate 18, Velmanette Montgomery, 718-643-6140, [email protected] Congress 10, Edolphus Towns, 718-855-8018,
www.house.gov/towns/ Source: NYC Department of City Planning; NYC Districting Commission, NYPIRG CMAP
Location Boerum Hill bordered by Court Street, 4th Avenue, Schermerhorn Street, and on the south Wyckoff Street between Court and Bond, and Nevins and 3rd Avenue, Warren Street between Bond and Nevins, and St. Marks Place between 3rd and 4th Avenues. Boerum Hill Demographics2000 Census Report within a .45 mile radius as noted in the map above.
Total Population 26,059
Race/Ethnicity (Total Population)White 12,496 48.0 percentBlack 4,756 18.3 percentNative American 59 0.2 percent

Asian 1,052 4.0 percentOther 1,096 4.2 percentHispanic (any race) 6,600 25.3 percent
Sex (Total Population)Male 12,986 49.8 percentFemale 13,073 50.2 percent
Age (Total Population)Age 0 to 4 1,221 4.7 percent
5 to 9 1,322 5.1 percent10 to 20 2,784 10.7 percent21 to 29 4,921 18.9 percent30 to 39 5,765 22.1 percent40 to 49 3,903 15.0 percent50 to 59 2,964 11.4 percent60 to 64 805 3.1 percentAge 65+ 2,374 9.1 percent
Education (Population Age 25+)Total population age 25+ 18,968 100 percentLess than 9th grade 1,987 10.5 percent9-12 Grade 2,225 11.7 percentHigh School 2,692 14.2 percentSome College 2,073 10.9 percentAssociate Degree 568 3.0 percentBachelor Degree 4,686 24.7 percentGraduate Degree 4,737 25.0 percent
Employment Status (Population Age 16+)Total population age 16+ 22,016 100 percentNot in labor force 7,768 35.3 percentLabor force 14,248 64.7 percent
Labor Force StatusTotal Labor Force Age 16+ 14,248 100 percentArmed Forces 0 0.0 percentCivilian 13,349 93.7 percentUnemployed 899 6.3 percent
Employed Civilian OccupationTotal employed civilians,Age 16+ 13,349 100 percentAgriculture 6 0.0 percentConstruction 280 2.1 percentEducation 1,265 9.5 percent

Entertainment 1,351 10.1 percentF.I.R.E. 1,474 11.0 percentHealth 1,248 9.3 percentManufacturing 437 3.3 percentMining 0 0.0 percentOther services 646 4.8 percentProf/Tech/Science 2,909 21.8 percentPublic Administration 612 4.6 percentRetail 1,002 7.5 percentTrans./Warehouse 385 2.9 percentWholesale 272 2.0 percent
HouseholdsTotal households 11,213 100 percentFamily households 5,349 47.7 percent
Income (Total Household)Under $10,000 1,579 14.1 percent$10,000-20,000 1,160 10.3 percent$20,000-30,000 903 8.1 percent$30,000-40,000 1,015 9.1 percent$40,000-50,000 972 8.7 percent$50,000-60,000 920 8.2 percent$60,000-75,000 976 8.7 percent$75,000-100,000 1,053 9.4 percent$100,000-150,000 1,300 11.6 percent$150,000-200,000 596 5.3 percentOver $200,000 739 6.6 percent
Occupied HousingTotal Occupied Housing 11,351 100
percentOwner Occupied 2,852 25.1 percentRenter Occupied 8,499 74.9 percent
Household Size (Total Occupied)1 person 4,124 36.3 percent2 person 3,891 34.3 percent3 person 1,708 15.0 percent4 person 920 8.1 percent5 person 385 3.4 percent6 person 203 1.8 percentOver 7 person 120 1.1 percent
Borough Park

As in other sections of Brooklyn, Borough Park was farmland in the early 19th Century. A small development of cottages was built in 1887 and soon after a subdivision of homes was created east of New Utrecht Avenue.
To accommodate its growing population, including Jewish residents from the Lower East Side and Williamsburg, low-rise apartment buildings were developed after World War I. By 1930, half of Borough Park’s residents were Jewish, and throughout the 1930s, Hasidic Jews principally from the Bobover group in Poland, began moving into the community. More Hasidic Jews moved into Borough Park in the 1950s because of the 1956 uprising in Hungary, and others relocated from Williamsburg after being displaced by the development of the Brooklyn Queens Expressway in 1957.
Today the majority of Borough Park’s residents are Hasidic Jews. The location of the Bobover’s headquarters is at 15th Avenue and 48th Street, and other groups in the neighborhood include Satmar, Munkatcz, Gur, and Belzer. A smaller contingent of Orthodox Jews also lives in the community, and the largest modern Orthodox synagogue is located on 15th Avenue. The neighborhood features 300 synagogues and 50 yeshivas.
To provide additional housing for the growing number of families in the community, three- and four-family brick buildings are being built on lots that had previously held one- and two-family homes.
The commercial corridors of Borough Park are filled with small stores known as “shomer shabbos” because they observe the Jewish Sabbath and are closed from sundown Friday to at least sundown Saturday. Jewish bakeries thrive in the community and produce hand-baked matzohs, and retail stores throughout New York City buy Passover cakes and cookies from Schick’s on 16th Avenue. Hundreds of shops selling designer and name brand clothing, and kosher meat markets, pizzerias, and bakeries are located on 13th Avenue between 39th and 54th Streets. In addition, Maimonides Medical Center is located at 4802 10th Avenue.
Sources: The Neighborhoods of Brooklyn, Yale University Press, New Haven and London; The Village Voice, January 7, 2004.
Political and Community ContactsCommunity Board 12, 5910 13th Avenue, Brooklyn, NY, 11219,
718-851-0800

NYC Council 38, Sara M. Gonzalez, 718-439-9012, [email protected]
NYC Council 39, Bill deBlasio, 718-854-9791, [email protected]
NYS Assembly 48, Dov Hikind, 7180853-9616, [email protected]
NYS Assembly 49, Peter J. Abbate, Jr., 718-236-1764, [email protected]
NYS Senate 22, Martin J. Goldin, 718-238-6044, [email protected]
NYS Senate 23, Diane Savino, 718-727-9406, [email protected]
US Congress 8, Jerrold Nadler, 212-367-7350, www.house.gov/nadler/Source: NYC Department of City Planning; NYC Districting Commission, NYPIRG CMAP
LocationThe boundaries of Borough Park are roughly 8th Avenue, McDonald Avenue, Green-wood Cemetery and 36th Street, and 65th Street.

Borough Park Demographics2000 Census Report within a .80 mile radius as noted in the map above.
Total Population 113,626 100 percent
Race/Ethnicity (Total Population)White 77,303 68.0 percentBlack 1,040 0.9 percentNative American 102 0.1 percentAsian 15,663 13.8 percentOther 4,314 3.8 percentHispanic (any race) 15,204 13.4 percent
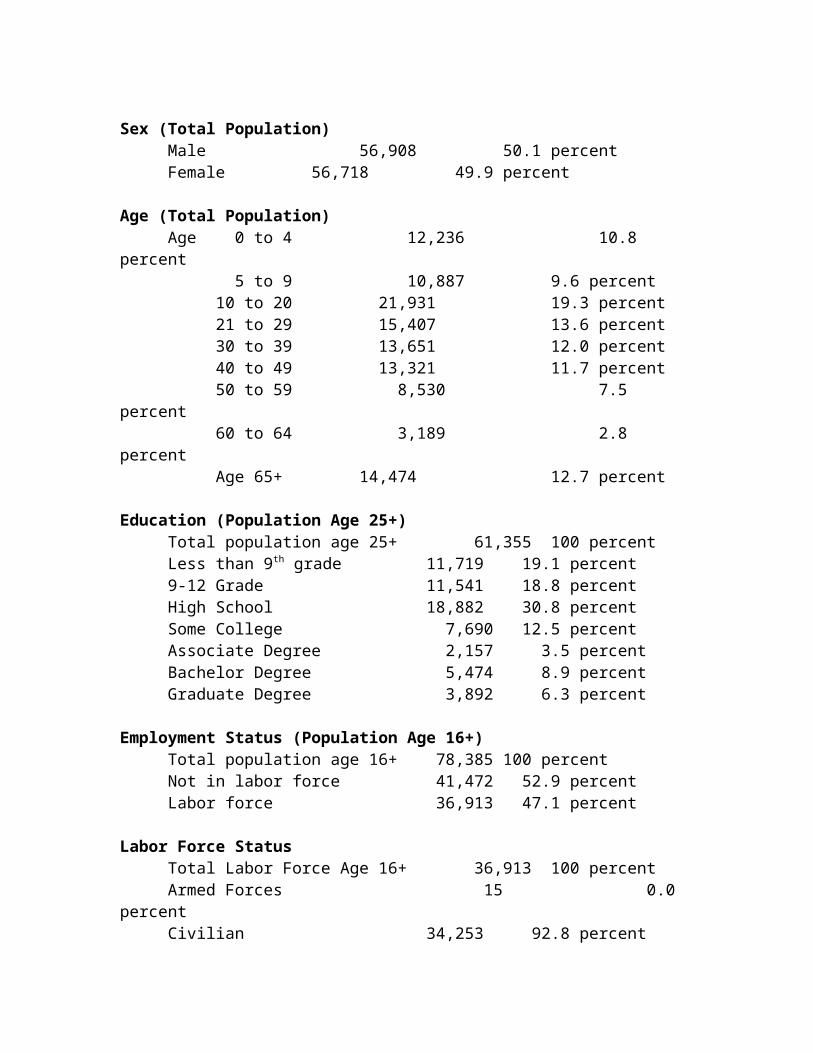
Sex (Total Population)Male 56,908 50.1 percentFemale 56,718 49.9 percent
Age (Total Population)Age 0 to 4 12,236 10.8 percent
5 to 9 10,887 9.6 percent10 to 20 21,931 19.3 percent21 to 29 15,407 13.6 percent30 to 39 13,651 12.0 percent40 to 49 13,321 11.7 percent50 to 59 8,530 7.5 percent60 to 64 3,189 2.8 percentAge 65+ 14,474 12.7 percent
Education (Population Age 25+)Total population age 25+ 61,355 100 percentLess than 9th grade 11,719 19.1 percent9-12 Grade 11,541 18.8 percentHigh School 18,882 30.8 percentSome College 7,690 12.5 percentAssociate Degree 2,157 3.5 percentBachelor Degree 5,474 8.9 percentGraduate Degree 3,892 6.3 percent
Employment Status (Population Age 16+)Total population age 16+ 78,385 100 percentNot in labor force 41,472 52.9 percentLabor force 36,913 47.1 percent
Labor Force StatusTotal Labor Force Age 16+ 36,913 100 percent

Armed Forces 15 0.0 percentCivilian 34,253 92.8 percentUnemployed 2,645 7.2 percent
Employed Civilian OccupationTotal employed civilians,Age 16+ 34,253 100 percentAgriculture 17 0.0 percentConstruction 2,034 5.9 percentEducation 4,647 13.6 percentEntertainment 2,403 7.0 percentF.I.R.E. 3,117 9.1 percentHealth 3,976 11.6 percentManufacturing 4,154 12.1 percentMining 4 0.0 percentOther services 1,764 5.1 percentProf/Tech/Science 2,670 7.8 percentPublic Administration 671 2.0 percentRetail 3,925 11.5 percentTrans./Warehouse 1,805 5.3 percentWholesale 2,142 6.3 percent
HouseholdsTotal households 33,606 100 percentFamily households 25,175 70.9 percent
Income (Total Household)Under $10,000 6,610 19.7 percent$10,000-20,000 6,742 20.1 percent$20,000-30,000 4,816 14.3 percent$30,000-40,000 3,337 9.9 percent$40,000-50,000 2,987 8.9 percent$50,000-60,000 1,936 5.8 percent$60,000-75,000 2,351 7.0 percent$75,000-100,000 2,115 6.3 percent$100,000-150,000 1,894 5.6 percent$150,000-200,000 396 1.2 percentOver $200,000 422 1.3 percent
Occupied HousingTotal Occupied Housing 33,500 100 percentOwner Occupied 9,069 27.1 percentRenter Occupied 24,431 72.9 percent
Household Size (Total Occupied)1 person 7,426 22.2 percent

2 person 8,064 24.1 percent3 person 5,018 15.0 percent4 person 4,558 13.6 percent5 person 3,258 9.7 percent6 person 2,073 6.2 percentOver 7 person 3,103 9.3 percent
Brighton BeachWhile sitting on the sand at Brighton Beach in the summer, gazing out at the vast blue ocean interrupted only by the occasional sailboat or freighter, and listening to the soothing sound of the waves and delighted squeals of children chattering in a variety of languages, it’s easy to forget that the hustle and bustle of Manhattan is merely a short subway ride away.
The appeal of Brighton Beach today is the same as it was in the 19th Century when savvy entrepreneurs began developing it as a summer playground for the middle class. William A. Engeman built the neighborhood’s first pier in 1869; a hotel, the Ocean Hotel, in 1873; a bath house on the beach in 1875; and his Brighton Beach Race Track in 1879, and Henry C. Murphy opened the Hotel Brighton in 1878. Engeman and Murphy’s attractions, the opening of Ocean Parkway in 1876, and Murphy’s New York and Brighton Beach Railroad in 1878, made the site accessible to families. The Brighton Beach Music Hall opened in 1892 and the New Brighton Theater in 1909. Brighton Beach even had is own amusement park, Brighton Beach Park, complete with a rollercoaster, midway, fireworks, and carousel.
Brighton Beach Park was converted to the Brighton Beach Baths in 1907, a 15-acre exclusive beach club that had three swimming pools, tennis, handball, miniature golf, mah-jongg, cards, and weekend entertainment provided by Milton Berle, Lionel Hampton, and Herman’s Hermits. The club was later remained the Brighton Beach Bath and Racquet Club.
At the beginning of the 20th Century, many looked to Brighton Beach as a year round residence, and to accommodate them, 30 six-story apartments were built between Coney Island Avenue and Ocean Parkway, some of which have since been converted to co-ops. In the 1930s and 1940s, summer bungalows were winterized. Membership in Brighton Beach Bath and Racquet Club peaked at 13,000 in the 1960s, but dropped in the following decades and by the early 1990s, the spot was being leased as a children’s summer camp.

The 1970s threatened the community with graffiti, urban blight, and an exodus of young residents, so locals took it upon themselves to demand improvements. About the same time same time the Soviet Union relaxed its immigration policies and large numbers of Russian immigrants began moving in, breathing new life into the neighborhood. In fact, so many Russian immigrants arrived that the area was dubbed “Little Odessa” because the neighborhood resembled the Ukrainian city on the Black Sea. Later, the Russians were joined by immigrants from Mexico, Pakistan, India, Afghanistan, Korea, and other countries.
Famous Brighton Beach residents include novelist Irwin Shaw, comedians Phil Silvers and Mel Brooks, and singer Neil Sedaka. Neil Simon made the neighborhood famous with his play and movie, Brighton Beach Memoirs, and scenes from Robin Williams’ 1984 movie Moscow on the Hudson were filmed in the National, a Russian night spot. Former students at the local high school, Abraham Lincoln High School, include Sedaka, Neil Diamond, Joseph Heller, Elizabeth Holtzman, and Harvey Keitel, and today’s students are from 40 different countries.
Development Potential
Today the site of the Brighton Beach Bath and Racquet Club is the location of the Oceania Condominium and Club made up of 14 buildings of 800 units, with construction on a 15th and final building with 50 units in the planning stages. The luxury condo development includes a 16,000 square foot club with outdoor pools, sundeck, landscaped grounds, and a health club and spa with an indoor pool. The two-, three-, and four-bedroom condos range in price from $700,000 to $21.5 million.
Additional condominiums have been developed by another firm on Brighton Fourth Street where six cottages were razed to make room for the complex.
Vacancies are rare in storefronts along the thriving 15-block commercial corridor of Brighton Beach Avenue. The dominance of the Russian culture is apparent on the avenue with Russian restaurants and shops advertising their businesses in Russian, not English. Vegas-style shows are found at the Atlantic Oceana, Imperator, National, and Odessa, and live music is available at Café Arbat, Café Paris, St. Petersburg Café, Spoon, and Pastorale.

Sources: The Neighborhoods of Brooklyn, Yale University Press, New Haven and London; Brooklyn Daily Eagle, October 19, 2005; Courier Life Publications, December 19, 2005; New York Times, July 2, 2002.
Business InformationBrighton Beach BID, 1002 Brighton Beach Avenue, Brooklyn, NY 718-934-1908
Political and Community ContactsCommunity Board 13, 2900 West 8th Street, Brooklyn, NY 718-266-3001NYC Council 48, Michael C. Nelson, 718-368-9176,
[email protected] NYS Assembly 45, Steven Cymbrowitz, 718-743-4078, [email protected] Senate 27, Carl Kruger, 718-743-8610,
[email protected] Congress 9, Anthony Weiner, 718-520-9001,
www.house.gov/weiner/ Source: NYC Department of City Planning; NYC Districting Commission, NYPIRG CMAP

LocationThe boundaries of Brighton Beach are roughly Ocean Parkway, to West End Avenue, the Belt Parkway, to the ocean.
Brighton Beach2000 Census Report within a .50 mile radius as noted in the map above.
need to updateTotal Population 39,937 100 percent
Race/Ethnicity (Total Population)White 28,201 70.6 percentBlack 735 1.8 percentNative American 103 0.3 percentAsian 4,290 10.7 percentOther 1,552 3.9 percentHispanic (any race) 5,056 12.7 percent
Sex (Total Population)Male 18,852 47.2 percentFemale 21,085 52.8 percent

Age (Total Population)Age 0 to 4 1,697 4.2 percent
5 to 9 1,651 4.1 percent10 to 20 4,371 10.9 percent21 to 29 4,480 11.2 percent30 to 39 4,881 12.2 percent40 to 49 4,965 12.4 percent50 to 59 4,870 12.2 percent60 to 64 2,741 6.9 percentAge 65+ 10,281 25.7 percent
Education (Population Age 25+)Total population age 25+ 30,157 100 percentLess than 9th grade 3,808 12.6 percent9-12 Grade 3,846 12.8 percentHigh School 7,558 25.1 percentSome College 3,454 11.5 percentAssociate Degree 2,758 9.1 percentBachelor Degree 5,538 18.4 percentGraduate Degree 3,195 10.6 percent
Employment Status (Population Age 16+)Total population age 16+ 34,246 100 percentNot in labor force 18,820 55.0 percentLabor force 15,426 45.0 percent
Labor Force StatusTotal Labor Force Age 16+ 15,526 100 percentArmed Forces 0 0.0 percentCivilian 14,303 92.7 percentUnemployed 1,123 7.3 percent
Employed Civilian OccupationTotal employed civilians,Age 16+ 14,303 100 percentAgriculture 12 0.1 percentConstruction 893 6.2 percentEducation 981 6.9 percentEntertainment 804 5.6 percentF.I.R.E. 1,574 11.0 percentHealth 2,668 18.7 percentManufacturing 1,005 7.0 percentMining 0 0.0 percentOther services 1,106 7.7 percentProf/Tech/Science 1,455 10.2 percentPublic Administration 405 2.8 percent

Retail 1,387 9.7 percentTrans./Warehouse 1,206 8.4 percentWholesale 502 3.5 percent
HouseholdsTotal households 17,387 100 percentFamily households 10,308 59.3 percent
Income (Total Household)Under $10,000 4,365 25.1 percent$10,000-20,000 3,778 21.7 percent$20,000-30,000 2,074 11.9 percent$30,000-40,000 1,617 9.3 percent$40,000-50,000 1,217 7.0 percent$50,000-60,000 1,061 6.1 percent$60,000-75,000 1,248 7.2 percent$75,000-100,000 988 5.7 percent$100,000-150,000 741 4.3 percent$150,000-200,000 173 1.0 percentOver $200,000 125 0.7 percent
Occupied HousingTotal Occupied Housing 17,408 100 percentOwner Occupied 3,497 20.1 percentRenter Occupied 13,911 79.9 percent
Household Size (Total Occupied)1 person 6,424 36.9 percent2 person 5,523 31.7 percent3 person 2,509 14.4 percent4 person 1,623 3.8 percent5 person 657 3.8 percent6 person 331 1.9 percentOver 7 person 341 2.0 percent
Brooklyn Heights
Originally settled as a suburb in the early 19th Century by New Yorkers of wealth and social prominence who commuted by ferry to Manhattan before the opening of the Brooklyn Bridge in 1883, Brooklyn Heights has remained an affluent community. Residents take great pride in their quiet, tree-lined streets, painstakingly restored brick and brownstone homes, and the Brooklyn Heights Promenade, which is located high on a bluff overlooking the East River and offers stunning views of the Manhattan skyline and annual Fourth of July fireworks.

Thanks to lobbying by local preservationists, the neighborhood was designated New York City’s first landmarked historic district in 1965, and the active Brooklyn Heights Association continues to look out for the interests of the historic community. The architectural styles of the homes in Brooklyn Heights include Federal, Queen Anne, Neo-Classic, and Greek, Gothic, Romanesque, Renaissance, and Colonial Revival. The Brooklyn Historical Society, a brick and terracotta Queen Anne-style landmark from the 1880s, is located in Brooklyn Heights at 128 Pierrepont and celebrates the history of all of the borough’s neighborhoods with tours, exhibits, and archives.
The neighborhood’s famous residents include noted abolitionist Henry Ward Beecher, who preached at Plymouth Church of the Pilgrims from 1847 to 1887; Emily Roebling, who supervised the construction of the Brooklyn Bridge, which was designed and engineered by her father-in-law and husband; poet Walt Whitman, editor of the Heights-based Brooklyn Daily Eagle; playwright Arthur Miller; writers Truman Capote, Anais Nin, Carson McCullers, and Norman Mailer, and poets Hart Crane and W. H. Auden.
Brooklyn Heights is a convenient location for Brooklynites commuting to Manhattan because it’s the first subway stop in Brooklyn on many train lines; convenient for lawyers, judges, and government workers because it is a short walk to the nearby Federal and State courthouses, Borough Hall, and the Municipal Building; and ideal for families and students because it is the location of St. Francis College, Packer Collegiate Institute, and St. Ann’s School, and a short walk to Brooklyn Friends School, Brooklyn Law School, New York Technical College, Polytechnic Institute, and Long Island University.
Development Potential
The latest enhancement proposed for Brooklyn Heights is Brooklyn Bridge Park, which is planned on a 1.3 mile stretch from Atlantic Avenue, including the dormant piers below Brooklyn Heights, along the East River to Jay Street, north of the Manhattan Bridge. Proposals for the 85-acre park include open plazas, restored marshlands, active indoor and outdoor recreational opportunities, including shaded sports fields, softball fields, beach volley ball courts, playgrounds, and 12 acres of safe paddling waters playgrounds, a hotel, retail development, and residential condominiums.
Along Court Street, on the site where a menacing abandoned building once stood, a newly constructed Barnes & Noble and 12-movie

multiplex now serves the community, and a block down on the corner of Atlantic and Court, an older commercial property was transformed into a modern pharmacy. In addition, the new Federal Court House recently opened on Cadman Plaza East.
The 1.5 mile stretch of Atlantic Avenue from Flatbush to the East River runs through the neighborhoods of Cobble Hill, Brooklyn Heights, and Boerum Hill and has been undergoing a renaissance in recent years. Atlantic Avenue serves as a destination for shopping and dining with new stores, restaurants, and galleries opening next to established Middle Eastern businesses and antique stores. Each year, Atlantic Antic is held to promote the avenue’s businesses and celebrate the vibrant cultures they represent.
A number of new residential developments have been completed or are planned in nearby Boerum Hill including the Court House, 320 luxury rentals at Court Street and Atlantic Avenue, which also houses the new Dodge YMCA; Boulevard East luxury condominiums at 53 Boerum Place; The Smith, at 75 Smith Street, a condominium/hotel/retail development; State Renaissance Court, a rental development at Schermerhorn, Hoyt and State Streets, which has earmarked 30 percent of the units for low-and moderate-income families; The State Street Townhouses, 14 new, single-family townhouses for sale on State Street; Schermerhorn House 200 new units of affordable rental housing on Schermerhorn Street; and Lookout Hill Condominiums, an 11-story, 46-unit, loft-like, condominium development at 199 State Street, between Court Street and Boerum Place and adjacent to the newly constructed Brooklyn Law School dormitories.
Two buildings with 226 residential units and 18,000 square feet of retail space are planned for 204 Livingston Street, between Hoyt and Bond Streets, and in December 2005, it was announced that the Mobil Gas Station site at Atlantic Avenue and Boerum Place was on the market for $26 million.
Sources: Old Brooklyn Heights New York’s First Suburb by Clay Lancaster, Dover Publications, New York; Brooklyn, People and Places, Past and Present, by Grace Glueck and Paul Gardner, Harry N. Abrams, Inc., New York; www.brooklynbridgepark.org; www.atlanticave.org; Brooklyn Daily Eagle January 7, 2005; May 19, 2005, August 18, 2005, September 16, 21 and 29, 2005, October, 21, 2005; November 17, 23, 2005, December 6, and 9, 2005.
Business Information
Brooklyn Economic Development Corporation (BEDC)175 Remsen Street, Brooklyn, NY 11201, 718-522-4600www.bedc.org
Brooklyn Business Library280 Cadman Plaza West, Brooklyn, NY 11201, 718-623-7000, ext. 1259 www.brooklynpubliclibrary.org
Source: NYC Department of Small Business Services, NYC Economic Development Corporation, BEDC, Brooklyn Chamber of Commerce
Political and Community ContactsCommunity Board 2, 350 Jay Street, Brooklyn, NY 11201, 718-
596-5410New York City Council 33, David Yassky, 718-875-5200, [email protected] Assembly 52, Joan L. Millman, 718-246-4889,
[email protected] Senate 25, Martin Connor, 718-298-5565, [email protected] Congress, Nydia M. Velazquez, 718-599-3658,
www.house.gov/velazquez/ Source: NYC Department of City Planning; NYC Districting Commission, NYPIRG CMAP
Location Brooklyn Heights is bounded by Court Street and Cadman Plaza, the Brooklyn Heights Promenade, Atlantic Avenue, and the Brooklyn Bridge.
Brooklyn Heights Demographics2000 Census Report within a .5 mile radius as noted in the map above.

Total Population 27,142 100 percent
Race/Ethnicity (Total Population)White 20,228 74.5 percentBlack 2,291 8.4 percentNative American 38 0.1 percentAsian 1,737 6.4 percentOther 582 2.1 percentHispanic (any race) 2,266 8.3 percent
Sex (Total Population)Male 14,027 51.7 percentFemale 13,115 48.3 percent
Age (Total Population)Age 0 to 4 1,102 4.1 percent
5 to 9 773 2.8 percent10 to 20 1,213 4.5 percent21 to 29 5,413 19.9 percent30 to 39 6,318 23.3 percent40 to 49 4,305 15.9 percent50 to 59 3,412 12.6 percent60 to 64 1,046 3.9 percentAge 65+ 3,560 13.1 percent
Education (Population Age 25+)Total population age 25+ 22,375 100 percentLess than 9th grade 752 3.4 percent9-12 Grade 891 4.0 percentHigh School 2,329 10.4 percentSome College 2,501 11.2 percentAssociate Degree 745 3.3 percentBachelor Degree 3,883 30.8 percentGraduate Degree 8,274 37.0 percent
Employment Status (Population Age 16+)Total population age 16+ 24,611 100 percentNot in labor force 7,964 32.4 percentLabor force 16,647 67.6 percent
Labor Force StatusTotal Labor Force Age 16+ 16,647 100 percentArmed Forces 28 0.2 percentCivilian 15,664 94.1 percentUnemployed 955 5.7 percent

Employed Civilian OccupationTotal employed civilians,Age 16+ 15,664 100 percentAgriculture 11 0.1 percentConstruction 179 1.1 percentEducation 1,619 10.3 percentEntertainment 1,044 6.7 percentF.I.R.E. 2,802 17.9 percentHealth 1,225 7.8 percentManufacturing 424 2.7 percentMining 0 0.0 percentOther services 666 4.3 percentProf/Tech/Science 3,586 22.9 percentPublic Administration 916 5.8 percentRetail 689 4.4 percentTrans./Warehouse 268 1.7 percentWholesale 377 2.4 percent
HouseholdsTotal households 13,427 100 percentFamily households 4,853 36.1 percent
Income (Total Household)Under $10,000 819 6.1 percent$10,000-20,000 742 5.5 percent$20,000-30,000 846 6.3 percent$30,000-40,000 1,236 9.2 percent$40,000-50,000 1,203 9.0 percent$50,000-60,000 1,198 8.9 percent$60,000-75,000 1,368 10.2 percent$75,000-100,000 1,569 11.7 percent$100,000-150,000 1,967 14.6 percent$150,000-200,000 858 6.4 percentOver $200,000 1,621 12.1 percent
Occupied HousingTotal Occupied Housing 13,526 100 percentOwner Occupied 5,799 42.9 percentRenter Occupied 7,727 57.1 percent
Household Size (Total Occupied)1 person 7,137 52.8 percent2 person 4,346 32.1 percent3 person 1,141 8.4 percent4 person 659 4.9 percent

5 person 164 1.2 percent6 person 32 0.2 percentOver 7 person 47 0.3 percent
BushwickAs Bob Dylan wrote, “the times they are a-changin’, ” and no where is that phrase more evident in Brooklyn than in the neighborhood of Bushwick. During the 1977 Blackout, Bushwick was hit by riots, looting, and arson that destroyed entire blocks of the Broadway commercial strip and resulted in the closing of one-third of the neighborhood’s stores. Within one year of the event more than 40 percent of the commercial and retail businesses shut their doors. But today, the landscape of Bushwick is being reborn with private and nonprofit partnerships producing affordable housing, government funded senior housing, luxury condominiums, and the arrival of artists, who have been at the forefront of development in many other Brooklyn neighborhoods.
The border between Bushwick and East Williamsburg is getting somewhat fuzzy these days, however. While officially Flushing Avenue is the street that divides the neighborhood, some newcomers see the border as Myrtle Avenue, while others claim it is Johnson Avenue. One thing is for certain, new businesses catering to artists living in the area are opening with hip stores springing up between the Montrose and Morgan Avenue L subway stops and one trendy restaurant spotted on Wyckoff Avenue.
Like other Brooklyn communities, Bushwick was a farming community in the 19th century and produced crops and tobacco purchased locally and exported to New York City. In the 1840s, heavy industry moved in to produce refined sugar, oil, chemicals, and glue. The inventor, manufacturer, philanthropist, and founder of Cooper Union, Peter Cooper, built his first factory in Bushwick.
Large groups of German-speaking immigrants settled in Bushwick as well as Greenpoint and Williamsburg, and by the mid-1800s they had established so many breweries and beer gardens in Bushwick that it became the “beer capital of New York” and a section was named “Brewer’s Row” because more than10 breweries were operating in a 14 block area. Beer gardens featuring oompah bands, dancing, sauerkraut and sausages were the norm. Brewers and other professionals lived in large mansions along Bushwick Avenue, and townhouses filled the side streets. Bushwick claimed only seven

breweries after World War II, however, and by 1976 even Rheingold and F. and M. Schaefer had departed.
Other groups in the community included immigrants from France, Scandinavia, and England, later immigrants came from Ireland, Russia, Poland, and Italy. After World War II African Americans and Puerto Ricans dominated, and in recent decades, immigrants from the Dominican Republican, Guyana, Ecuador, Jamaica, India, South Korea, Hong Kong, and Taiwan have moved in.
Development Potential
New housing unit issued permits have risen in Bushwick in recent years, with permits for nearly 500 buildings containing about 1,500 units issued between 2000 and 2003.
Since the mid-1980s, City agencies have actively partnered with local developers and nonprofits, such as the Ridgewood Bushwick Senior Citizens Council, to create senior housing and more than 1,000 affordable, owner-occupied homes and rentals.
In an effort to preserve housing in the community, the City announced in February 2005 that the Department of Housing Preservation and Development had conducted a comprehensive survey and analysis of 864 buildings and 91 vacant lots in a 23-square block area bordered by Central Avenue, George Street and Flushing Avneue, Irving Avenue, and DeKalb Avenue to identify properties needing improvements.
In October 2005, the government funded Gates Gardens, a residence developed by Ridgewood Bushwick Senior Citizens Council, opened for low-and middle-income seniors at 1349 Gates Avenue, and 32, two-bedroom apartments in a four-story, converted prewar factory at 101 Wyckoff were offered for sale.
Sources: The Neighborhoods of Brooklyn, Yale University Press, New Haven and London; New York Times, November 27, 2005; Brooklyn Daily Eagle, October 6, 2005, October 13, 2005; Village Voice, December 7, 2005; Department of Housing Preservation and Development; New York City Department of Planning.
Business InformationNorth Brooklyn Development Corporation126 Greenpoint Avenue, Brooklyn, NY 11222718-389-9044
East Williamsburg Valley Industrial Development Corporation (EWVIDCO)
Empire Zone Information
11-29 Catherine Street, Brooklyn, NY 11211718-388-7287, ext. 160www.ewvidco.com
Boricua College Small Business Development Center9 Graham Avenue, Brooklyn, NY 11206718-963-4112, ext. 565
Source: NYC Department of Small Business Services, NYC Economic Development Corporation, BEDC, Brooklyn Chamber of Commerce
Political and Community ContactsCommunity Board 4, 315 Wyckoff Avenue, Brooklyn, NY 11237,
718-628-8400New York City Council 37, Erik Martin Dilan, 718-642-8664, [email protected] Assembly 53, Vito J. Lopez, 718-963-7029,
[email protected] Senate 17, Martin Malave Dilan, 718-573-1726, [email protected] Congress, Nydia M. Velazquez, 718-599-3658,
www.house.gov/velazquez/ Source: NYC Department of City Planning; NYC Districting Commission, NYPIRG CMAP

LocationBushwick’s boundaries are roughly Broadway to the Queens County line on the east, from Flushing Avenue on the north to Conway Street and the L train line tracks on the south.
Bushwick Demographics 2000 Census Report within a .75 mile radius as noted in the map above
Total Population 113,022 100 percent
Race/Ethnicity (Total Population)White 5,228 4.6 percentBlack 25,432 22.5 percentNative American 150 0.1 percentAsian 5,395 4.8 percentOther 3,262 2.9 percentHispanic (any race) 73,555 65.1 percent
Sex (Total Population)Male 54,142 47.9 percentFemale 58,880 52.1 percent

Age (Total Population)Age 0 to 4 10,556 9.3 percent
5 to 9 11,552 10.2 percent10 to 20 20,841 18.4 percent21 to 29 17,675 15.6 percent30 to 39 17,997 15.9 percent40 to 49 14,781 13.1 percent50 to 59 9,172 8.1 percent60 to 64 3,272 2.9 percentAge 65+ 7,176 6.3 percent
Education (Population Age 25+)Total population age 25+ 61,809 100 percentLess than 9th grade 15,295 24.7 percent9-12 Grade 16,384 26.5 percentHigh School 15,304 24.8 percentSome College 7,744 12.5 percentAssociate Degree 2,351 3.8 percentBachelor Degree 3,168 5.1 percentGraduate Degree 1,563 2.5 percent
Employment Status (Population Age 16+)Total population age 16+ 79,521 100 percentNot in labor force 37,678 47.4 percentLabor force 41,843 52.6 percent
Labor Force StatusTotal Labor Force Age 16+ 41,843 100 percentArmed Forces 13 0.0 percentCivilian 34,925 83.5 percentUnemployed 6,905 16.5 percent
Employed Civilian OccupationTotal employed civilians,Age 16+ 34,925 100 percentAgriculture 6 0.0 percentConstruction 1,930 5.5 percentEducation 1,938 5.5 percentEntertainment 2,905 8.3 percentF.I.R.E. 2,337 6.7 percentHealth 5,022 14.4 percentManufacturing 5,296 15.2 percentMining 6 0.0 percentOther services 2,313 6.6 percentProf/Tech/Science 2,761 7.9 percent

Public Administration 1,243 3.6 percentRetail 3,943 11.3 percentTrans./Warehouse 2,747 7.9 percentWholesale 1,575 4.5 percent
HouseholdsTotal households 34,082 100 percentFamily households 25,963 76.2 percent
Income (Total Household)Under $10,000 8,943 26.2 percent$10,000-20,000 6,399 18.8 percent$20,000-30,000 5,471 16.1 percent$30,000-40,000 3,955 11.6 percent$40,000-50,000 2,773 8.1 percent$50,000-60,000 2,003 5.9 percent$60,000-75,000 1,911 5.6 percent$75,000-100,000 1,524 4.5 percent$100,000-150,000 778 2.3 percent$150,000-200,000 154 0.5 percentOver $200,000 171 0.5 percent
Occupied HousingTotal Occupied Housing 33,928 100 percentOwner Occupied 5,174 15.2 percentRenter Occupied 28,754 84.8 percent
Household Size (Total Occupied)1 person 6,741 19.9 percent2 person 6,563 19.3 percent3 person 6,693 19.7 percent4 person 6,150 18.1 percent5 person 3,946 11.6 percent6 person 2,087 6.2 percentOver 7 person 1,748 5.2 percent
CanarsieIn the mid-19th Century, thanks to the Rockaway Beach Railroad, Canarsie became a beach resort with hotels, beer gardens, and vaudeville houses overlooking Jamaica Bay. In 1907, the Golden City Amusement Park opened at Seaview Avenue and Canarsie Road featuring rides, games, dance halls, and vaudeville. Decades later the amusement park burned and the entire site was razed in 1939 to prepare for the construction of the Belt Parkway. The Canarsie Pier, a

publicly funded waterfront project, also was built about the same time on the site of the amusement park and adjoins the 132-acre Canarsie Beach Park.
At the beginning of the 20th Century the primary source of employment in Canarsie was fishing or oystering in Jamaica Bay, but by the 1930s, pollution had destroyed that industry.
In the 1950s, marshland was filled to create Seaview Village, which consisted of ranch-style, split-level houses, and attached row houses in a 40-block area in the northeastern section of the neighborhood, and two public housing developments were built in the community. In the 1960s, an area called Paerdegat on the Paerdegat Basin was developed with brick two-, three-, and four-family houses in a 15 block area between Paerdegat 1 Street and Seaview Avenue, Paerdegat Avenue N, and E 80th Street.
Early residents included African-Americans, whose ancestors had been slaves in the area, and who became founders of the Canarsie Plymouth Congregational Church in 1877 on East 96th Street. Other early residents included German-Americans, Dutch, Scottish, and Irish immigrants. In the 1920s, Italian American and Jewish families moved into the area, in the 1950s, middle-class Italian and Jewish families from Crown Heights, East New York, Brownsville, Bedford-Stuyvesant, Bushwick, and Williamsburg relocated to Canarsie. In the last decade, West Indian families, primarily from Jamaica, Guyana, Barbados, Trinidad and Tobago, and Grenada, have bought homes in the community, and have been joined by families from China, the former Soviet Union, Israel, Puerto Rico, Mexico, and the Dominican Republic.
Development Potential
Today, Fillmore Real Estate is offering luxury waterfront homes on Jamaica Bay at Seaview Estates at 108th Street and Seaview Avenue. The gated community offers waterfront views, tennis, a swimming pool, fitness facility, and tree-lined streets. The development is near the $192 million, 640,000 square foot Gateway Center, which opened in 2002 on 48 acres on Fountain Avenue and Belt Parkway on what was previously a landfill. The center includes retail stores such as BJ’s Wholesale Club, Target, Staples, Circuit City, Famous Footwear, Old Navy, Marshall’s, and Bed, Bath & Beyond. The retail development is part of the 227-acre Gateway Estates, a new neighborhood near Spring Creek.
Retail stores in Canarsie are primarily found Rockaway Parkway, Flatlands Avenue, and Avenue L. The Brooklyn Terminal Market on

Foster Avenue has been operating since 1942 and offers fresh vegetables, fruits, plants, and flowers.Sources: The Neighborhoods of Brooklyn, Yale University Press, New Haven and London; www.Seaview-Estates.com; Canarsie Courier, January 12, 2006; New York City Department of Housing Preservation and Development.
Political and Community ContactsCommunity Board 18, 5715 Avenue H, Brooklyn, NY, 11234,
718-241-0422NYC Council 42, Charles Barron, 718-649-9495/9496,
[email protected] Assembly 58, N. Nick Perry, 718-385-3336,
[email protected] Senate 19, John L. Sampson, 718-649-7653,
[email protected] Congress 10, Edolphus Towns, 718-855-8018,
www.house.gov/towns/ Source: NYC Department of City Planning; NYC Districting Commission, NYPIRG CMAP
LocationThe boundaries of Canarsie are roughly Ralph Avenue along Paerdegat Avenue to East 108th Street, from the railroad tracks and Ditmas Avenue to the Belt Parkway on the south.

Canarsie Demographics2000 Census Report within a .85 mile radius as noted in the map above.
Total Population 72,482 100 percent
Race/Ethnicity (Total Population)White 12,194 16.8 percentBlack 47,449 65.5 percentNative American 63 0.1 percentAsian 3,174 4.4 percentOther 2,260 3.1 percentHispanic (any race) 7,342 10.1 percent
Sex (Total Population)Male 32,259 44.5 percentFemale 40,223 55.5 percent
Age (Total Population)Age 0 to 4 5,195 7.2 percent
5 to 9 6,247 8.6 percent10 to 20 12,717 17.5 percent21 to 29 8,697 12.0 percent30 to 39 11,051 15.2 percent40 to 49 11,512 15.9 percent50 to 59 7,307 10.1 percent60 to 64 2,488 3.4 percentAge 65+ 7,268 10.0 percent
Education (Population Age 25+)Total population age 25+ 44,324 100 percentLess than 9th grade 3,967 9.0 percent9-12 Grade 8,030 18.1 percentHigh School 12,286 27.7 percentSome College 7,948 17.9 percentAssociate Degree 3,553 8.0 percentBachelor Degree 5,378 12.1 percentGraduate Degree 3,162 7.1 percent
Employment Status (Population Age 16+)Total population age 16+ 53,682 100 percentNot in labor force 21,625 40.3 percentLabor force 32,057 59.7 percent
Labor Force StatusTotal Labor Force Age 16+ 32,057 100 percent

Armed Forces 37 0.1 percentCivilian 28,833 89.9 percentUnemployed 3,187 9.9 percent
Employed Civilian OccupationTotal employed civilians,Age 16+ 28,833 100 percentAgriculture 0 0.0 percentConstruction 949 3.3 percentEducation 2,626 9.1 percentEntertainment 1,078 3.7 percentF.I.R.E. 2,917 10.1 percentHealth 7,598 26.4 percentManufacturing 1,418 4.9 percentMining 0 0.0 percentOther services 1,425 4.9 percentProf/Tech/Science 2,519 8.7 percentPublic Administration 1,561 5.4 percentRetail 2,291 7.9 percentTrans./Warehouse 2,813 9.8 percentWholesale 548 1.9 percent
HouseholdsTotal households 23,601 100 percentFamily households 18,182 77.0 percent
Income (Total Household)Under $10,000 3,194 13.5 percent$10,000-20,000 2,563 10.9 percent$20,000-30,000 2,620 11.1 percent$30,000-40,000 2,758 11.7 percent$40,000-50,000 2,292 9.7 percent$50,000-60,000 2,067 8.8 percent$60,000-75,000 2,730 11.6 percent$75,000-100,000 2,820 11.9 percent$100,000-150,000 2,005 8.5 percent$150,000-200,000 344 1.5 percentOver $200,000 208 0.9 percent
Occupied HousingTotal Occupied Housing 23,621 100 percentOwner Occupied 10,950 46.4 percentRenter Occupied 12,671 53.6 percent
Household Size (Total Occupied)1 person 4,790 20.3 percent

2 person 5,883 24.9 percent3 person 4,898 20.7 percent4 person 3,961 16.8 percent5 person 2,371 10.0 percent6 person 1,039 4.4 percentOver 7 person 679 2.9
percent
Carroll Gardens(Includes Gowanus and the Columbia Street Waterfront District)
Every Fourth of July not so long ago, the night sky in Carroll Gardens full with fireworks that thundered like a war zone and filled the streets with smoke as rival blocks competed for the best Independence Day display. In the 1990s, Mayor Rudy Giuliani put an end to that practice for reasons of public safety, but for old-timers it was one more indication that gentrification had caught up with the community. Irish immigrants were the first to settle in Carroll Gardens in the early 19th Century, but from the late 19th Century to the 1950s the neighborhood became a destination for Italian immigrants. For more than 100 years the community was primarily working class, and large numbers of residents worked in industries along the Red Hook waterfront, Gowanus Canal, or in the Brooklyn Navy Yard until the1950s.
Carroll Gardens is nestled in a residential enclave and removed from major thoroughfares, which is perhaps why it still retains some of its Old World charm as illustrated by the number of yards decorated with religious shrines and statues, its Good Friday processions, and the number of Italian restaurants and bakeries in operation. In recent decades, however, the quiet, tree-lined streets, spacious front yards, and gracious brownstones of Carroll Gardens have attracted young professionals and their families. Some condominiums also are available.
The first homes in Carroll Gardens were built in 1846, the brownstones with gardens between 1869 and 1884, and in 1973 a section of the neighborhood was named a historic district. Originally considered just another section of a large area called South Brooklyn, which also included Boerum Hill, Cobble Hill, Gowanus, and Red Hook, or as part of Red Hook, Carroll Gardens finally received its own identity and name in the 1960s.

Development Potential
In the1990s, a few trendy restaurants staked their claim on Smith Street and since then similar establishments have opened, making Smith Street a popular destination for sophisticated restaurant goers from all over New York City. The success of Smith Street has spread to Court Street, where new retail establishments have replaced some of the family-owned stores that had been passed down from generation to generation.
During the summer of 2005, 124 condominiums at the Court Street Lofts, 505 Court Street on the corner of Huntington Street, were put on the market for prices ranging from $475,000 to $825,000. The 10-story former commercial building had been converted to apartments more than 12 years ago.
Carroll Gardens borders the neighborhood of Gowanus, where industrial workers, artists, and residents coexist in what has traditionally been a manufacturing district with some modest housing.
Carroll Gardens, Gowanus, and Red Hook are served by the Gowanus Canal Community Development Corporation, which has developed a draft community plan that seeks to create a special zoning district for the Gowanus area. One major goal is cleaning up the Gowanus Canal, which was constructed in the mid-19th Century to serve surrounding industries, and turning it into a public amenity similar to the Riverwalk in San Antonio. Recently, developers have been buying up property in this area in anticipation of canal improvements.
The draft plan for the Gowanus area also calls for retaining and improving the industrial/commercial district to the south; reinforcing the mixed use district (residential, commercial, and industrial) to the north; encouraging the reuse of existing buildings; and improving green space. The plan has identified the intersection of 9th and Smith Streets where the F and G trains stop as a site for potential development (retail, services, or recreation), and the MTA announced plans to renovate the station. The Gowanus plan also is recommending the reuse of underused structures on 2nd Avenue, and improvements to the 2nd Avenue infrastructure to serve industries there. The new Lowe’s home improvement store is located on 2nd Avenue and 10th Street, Staples operates at 3rd Street and 4th Avenue, a Whole Foods is reportedly under construction across from Staples, and in recent years developers have proposed other retail projects in the area.
Gowanus also is served by Southwest Brooklyn Industrial Development Corporation, however, which supports the retention of manufacturing

in the community. The development corporation reports that since 1997 there has been a 25 percent increase in industrial firms and estimates that 3,000 people are employed in Gowanus. The organization’s Web site also states that businesses in the area barge approximately 2,530,000 tons of goods on the Gowanus Canal each year.
A recent New York Times article reported on the tensions between those who want residential conversions in Gowanus and those who want to maintain the area as an industrial hub and stated that so far several requests for variances to allow housing development have been blocked in the area north of 3rd Street.
On the other side of Carroll Gardens, between the East River and Brooklyn-Queens Expressway, is the Columbia Street Waterfront District, which features quaint brick row houses, restaurants, and small shops. A new, 13-unit condominium development, Carroll Gardens West, is under construction at 71 Carroll Street at Columbia Street with prices ranging from $475,000 to $1.8 million. In September 2005, the City’s Department of Transportation announced that the City would begin reconstructing Columbia Street, which runs parallel to the waterfront. In addition, local leaders in Carroll Gardens are proposing a housing/school complex for the Columbia Street Waterfront District.
Sources: The Neighborhoods of Brooklyn, Yale University Press, New Haven and London; An Architectural Guidebook to Brooklyn, Gibbs-Smith Publisher, Salt Lake City; www.gowanus.org; www.swbidc.org; New York Times, November 28, 2005; Brooklyn Daily Eagle, May 10, 2005, July 6, 2005; September 26, 2005, October, 14, 2005, November 3, 2005; November 29, 2005. Business Information
Gowanus Canal CDC, 515 Court Street, Brooklyn, NY 11231718-858-0557, www.gowanus.org
Southwest Brooklyn Industrial Development Corporation,241 41st Street, 2nd Floor, Brooklyn, NY 11232, 718-965-3100, www.swbidc.org
Political and Community ContactsCommunity Board 6, 250 Baltic Street, Brooklyn, NY 11201, 718-
643-3027New York City Council 39, Bill deBlasio, 718-854-9791,
[email protected] Assembly 52, Joan L. Millman, 718-246-4889,

NYS Senate 25, Martin Connor, 718-298-5565, [email protected] Congress 11, Major Owens, 718-773-3100,
www.house.gov/owens/ Source: NYC Department of City Planning; NYC Districting Commission, NYPIRG CMAP
Location Carroll Gardens is bordered either by Columbia Street or the Brooklyn-Queens Expressway, Hoyt Street between DeGraw and 5th Street and Smith Street between 5th Street and the Gowanus Expressway, from DeGraw Street to the Gowanus Expressway.
Gowanus is bordered by Hoyt Street between Wyckoff and 5th Streets and Smith Street between 5th Street and the Gowanus Expressway, 4th Avenue, and Wyckoff Street or Baltic Street to the Gowanus Expressway.
The Columbia Street Waterfront District is bordered by the Brooklyn-Queens Expressway, Atlantic Avenue, Hamilton Avenue, and the waterfront.
Carroll Gardens Demographics

2000 Census Report within a .45 mile radius as noted in the map above.
Total Population 23,626
Race/Ethnicity (Total Population)White 15,168 64.2 percentBlack 2,267 9.6 percentNative American 0 0.0 percentAsian 730 3.1 percentOther 998 3.1 percentHispanic (any race) 4,463 18.9 percent
Sex (Total Population)Male 10,875 46.0 percentFemale 12,751 54.0 percent
Age (Total Population)Age 0 to 4 1,065 4.5 percent
5 to 9 1,377 5.8 percent10 to 20 2,212 9.4 percent21 to 29 3,929 16.6 percent30 to 39 5,857 24.8 percent40 to 49 3,288 13.9 percent50 to 59 2,395 10.1 percent60 to 64 761 3.2 percentAge 65+ 2,742 11.6 percent
Education (Population Age 25+)Total population age 25+ 17,807 100 percentLess than 9th grade 1,484 8.3 percent9-12 Grade 1,830 10.3 percentHigh School 2,874 16.1 percentSome College 1,877 10.5 percentAssociate Degree 598 3.4 percentBachelor Degree 4,952 27.8 percentGraduate Degree 4,192 23.5 percent
Employment Status (Population Age 16+)Total population age 16+ 20,016 100 percentNot in labor force 6,101 30.5 percentLabor force 13,915 69.5 percent
Labor Force StatusTotal Labor Force Age 16+ 13,915 100 percentArmed Forces 0 0.0 percent

Civilian 13,096 94.1 percentUnemployed 819 5.9 percent
Employed Civilian OccupationTotal employed civilians,Age 16+ 13,096 100 percentAgriculture 0 0.0 percentConstruction 472 3.6 percentEducation 1,756 13.4 percentEntertainment 1,328 10.1 percentF.I.R.E. 1,421 10.9 percentHealth 1,122 8.6 percentManufacturing 464 3.5 percentMining 0 0.0 percentOther services 609 4.7 percentProf/Tech/Science 2,329 17.8 percentPublic Administration 531 4.1 percentRetail 799 6.1 percentTrans./Warehouse 424 3.2 percentWholesale 228 1.7 percent
HouseholdsTotal households 11,150 100 percentFamily households 5,542 49.1 percent
Income (Total Household)Under $10,000 1,229 11.0 percent$10,000-20,000 1,049 9.4 percent$20,000-30,000 993 8.9 percent$30,000-40,000 972 8.7 percent$40,000-50,000 1,021 9.2 percent$50,000-60,000 900 8.1 percent$60,000-75,000 1,263 11.3 percent$75,000-100,000 1,314 11.8 percent$100,000-150,000 1,167 10.5 percent$150,000-200,000 592 5.3 percentOver $200,000 650 5.8 percent
Occupied HousingTotal Occupied Housing 11,108 100 percentOwner Occupied 2,754 24.8 percentRenter Occupied 8,354 75.2 percent
Household Size (Total Occupied)1 person 4,086 36.8 percent2 person 3,994 36.0 percent

3 person 1,612 14.5 percent4 person 893 8.0 percent5 person 308 2.8 percent6 person 143 1.3 percentOver 7 person 72 0.6 percent
Clinton Hill
Although he died in 1891, the legacy of industrialist and philanthropist Charles Pratt still defines Clinton Hill today. Pratt founded the Pratt Institute in 1887 as an art and industrial school and the Brooklyn campus continues to thrive more than 100 years later on five square blocks in Clinton Hill. The Pratt Institute has more than 3,500 full-time, part-time, and graduate students studying art and design, architecture and library science, and more than 900 full-time and part-time faculty members, with many students and faculty living in the community.
Clinton Hill was discovered in the 1840s by some of Brooklyn’s wealthiest residents who began building mansions with lawns, stables, and carriage houses, and in the 1860s by developers who began building row houses for affluent professionals. But it was Pratt who inspired wealthy Brooklynites to build homes on Clinton and Washington Avenues between 1880 and 1915. Pratt owned Astral Oil Works in Greenpoint, which later merged with Standard Oil, and built a mansion at 232 Clinton Avenue in 1875. Three of Pratt’s sons also built homes on Clinton Avenue, including one house in which the Roman Catholic Bishop of Brooklyn currently resides.
Pratt’s wealthy Clinton Hill neighbors included the Pfizer family, producers of Pfizer pharmaceutical products; the Bristol family, producers of Bristol-Myers pharmaceuticals; the Underwood family, producers of Underwood Typewriters; and the Liebmann family producers of Rheingold Beer.
Pratt also financed Emmanuel Baptist Church, a landmark on Lafayette, and St. Joseph’s College has acquired a several Pratt homes. St. Joseph’s, which currently has more than 400 students, opened in Clinton Hill in 1916, and in 1918 acquired the George Dupont Pratt house at 245 Clinton Avenue; in 1935 acquired the Allison house at 265 Clinton Avenue; in 1936 acquired the Charles Pratt house at 232 Clinton Avenue as a convent for the Sisters of St. Joseph's, while the surrounding gardens became part of the Brooklyn campus; in 1965 opened McEntegart Hall Library at 222 Clinton Avenue; in 1998 acquired a five-story brownstone at 256 Clinton Avenue; and in 2001

the Brooklyn campus expanded to bordering Washington Avenue with the purchase of St. Angela Hall Academy.
Apartment buildings replaced some of the stately mansions beginning in the 1920s and 1930s and large homes were cut up into single room rentals in the 1950s and 1960s. By the 1970s, however, the downward trend was reversed as new owners began restoring the historic homes. A portion of the neighborhood became a historic district in 1981 and many buildings have landmark status.
Development Potential
Economic development initiated by the Myrtle Avenue Brooklyn Partnership has stimulated retail business on the commercial corridor in both Fort Greene and Clinton Hill. The result has been the opening of new restaurants, cafes, and other businesses that cater to local students and residents.
On the other side of Clinton Hill, the Bedford Stuyvesant Restoration Corporation is collaborating with the Brooklyn Chamber of Commerce on Fulton First, a major effort to revitalize Fulton Street by providing grants for façade and streetscape improvements. The program, launched several years ago in partnership with the FleetBoston Financial Foundation, Congressman Edolphus Towns, the Office of the Mayor of the City of New York, and the New York City Department of Business Services, enabled the launch of the Fulton Street Retail Redevelopment plan, the master plan through which the community will begin to attract new business investment to the area.
The Pratt Area Community Council, which has been involved in economic development on Fulton Street since 1997, recently conducted a needs assessment for Fulton Street and found that local residents are eager for new businesses. To spur development, the Pratt Area Community Council is seeking to establish the Fulton Street Business Improvement District (BID) along the Fort Greene and Clinton Hill sections of Fulton Street.
Sources: www.myrtleave.org; www.sjcny.edu; www.prattarea.org; www.restorationplaza.org; Brooklyn Chamber of Commerce; The Neighborhoods of Brooklyn, Yale University Press, New Haven and London; An Architectural Guidebook to Brooklyn, Gibbs-Smith Publisher, Salt Lake City.
Business InformationMyrtle Avenue Brooklyn Partnership (comprised of the Myrtle Avenue Revitalization Project Local Development Corporation and Myrtle Avenue Brooklyn Business Improvement District),

472 Myrtle Avenue, 2nd Fl, Brooklyn, NY 11205, 718.230.1689, www.myrtleave.org
Pratt Area Community Council, 1224 Bedford Avenue, Brooklyn, NY 11216718-783-3549, www.prattarea.org
Bedford Stuyvesant Restoration Corp., 1368 Fulton Street, Brooklyn, NY 11216718-636-6900, www.restorationplaza.org
Political and Community ContactsCommunity Board 2, 350 Jay Street, 8th Floor, Brooklyn, NY 718-
596-5410New York City Council 35, Letitia James, 718-260-9191, [email protected] Assembly 50, Joseph R. Lentol, 718-383-7474,
[email protected] Senate 18, Velmanette Montgomery, 718-643-6140, [email protected] Congress 10, Edolphus Towns, 718-855-8018,
www.house.gov/towns/ Source: NYC Department of City Planning; NYC Districting Commission, NYPIRG CMAP

LocationClinton Hill is bordered by Vanderbilt Avenue, Classon Avenue, Park Avenue or Flushing Avenue, and either Fulton Street or Atlantic Avenue on the south..
Clinton Hill Demographics2000 Census Report within a .40 mile radius as noted in the map above.
Total Population 30,153
Race/Ethnicity (Total Population)White 5,340 17.7 percentBlack 17,681 58.6 percentNative American 32 0.1 percentAsian 1,401 4.6 percentOther 1,177 3.9 percentHispanic (any race) 4,522 15.0 percent
Sex (Total Population)Male 13,687 45.4 percentFemale 16,466 54.6 percent
Age (Total Population)Age 0 to 4 1,827 6.1 percent
5 to 9 1,684 5.6 percent10 to 20 4,362 14.5 percent21 to 29 5,512 18.3 percent30 to 39 5,153 17.1 percent40 to 49 4,329 14.4 percent50 to 59 2,981 9.9 percent60 to 64 1,176 3.9 percentAge 65+ 3,129 10.4 percent
Education (Population Age 25+)Total population age 25+ 19,921 100 percentLess than 9th grade 1,458 7.3 percent9-12 Grade 2,426 12.2 percentHigh School 4,118 20.7 percentSome College 3,442 17.3 percentAssociate Degree 1,157 5.8 percentBachelor Degree 3,968 19.9 percentGraduate Degree 3,352 16.8 percent

Employment Status (Population Age 16+)Total population age 16+ 24,738 100 percentNot in labor force 8,866 35.9 percentLabor force 15,872 64.2 percent
Labor Force StatusTotal Labor Force Age 16+ 15,872 100 percentArmed Forces 8 0.1 percent
Civilian 13,526 85.2 percentUnemployed 2,338 14.7 percent
Employed Civilian OccupationTotal employed civilians,Age 16+ 13,526 100 percentAgriculture 0 0.0 percentConstruction 274 2.0 percentEducation 1,670 12.3 percentEntertainment 974 7.2 percentF.I.R.E. 1,257 9.3 percentHealth 1,931 14.3 percentManufacturing 477 3.5 percentMining 0 0.0 percentOther services 702 5.2 percentProf/Tech/Science 2,025 15.0 percentPublic Administration 1,122 8.3 percentRetail 986 7.3 percentTrans./Warehouse 726 5.4 percentWholesale 300 2.2 percent
HouseholdsTotal households 12,565 100 percentFamily households 6,122 48.7 percent
Income (Total Household)Under $10,000 2,115 16.8 percent$10,000-20,000 1,343 10.7 percent$20,000-30,000 1,401 11.2 percent$30,000-40,000 1,737 13.8 percent$40,000-50,000 1,171 9.3 percent$50,000-60,000 1,025 8.2 percent$60,000-75,000 1,154 9.2 percent$75,000-100,000 1,248 9.9 percent$100,000-150,000 892 7.1 percent$150,000-200,000 310 2.5 percentOver $200,000 169 1.3 percent

Occupied HousingTotal Occupied Housing 12,559 100 percentOwner Occupied 3,239 25.8 percentRenter Occupied 9,320 74.2 percent
Household Size (Total Occupied)1 person 5,077 40.4 percent2 person 3,468 27.6 percent3 person 1,959 15.6 percent4 person 982 7.8 percent5 person 650 5.2 percent6 person 197 1.6 percentOver 7 person 226 1.8 percent
Cobble Hill
Cobble Hill was transformed from a rural area to a residential neighborhood beginning in 1836 after the South Ferry began operating between Atlantic Avenue and Whitehall Street in Manhattan. The community features quiet, tree-lined streets and elegant row houses primarily built between 1840 and 1880 in Greek Revival, Italianate, Romanesque Revival, and Queen Anne styles. After suffering years of decline, young professionals reclaimed Cobble Hill in the 1960s and 1970s and today the historic houses are used as single-family homes, owner-occupied homes with rentals, co-ops, or condos. Additionally, co-ops can be found in larger residential buildings, in a 19th Century housing complex originally built for working class families, and even in a former school building.
Although separated by Atlantic Avenue, demographically Cobble Hill is very much an extension of its sister neighborhood Brooklyn Heights. Based on the 2000 Census, more than 65 percent of the population of Cobble Hill holds bachelor’s or graduate degrees, compared to more than 67 percent in Brooklyn Heights, and both are affluent communities with about 44 percent of the population earning an annual income of $75,000 or more. The community was considered either South Brooklyn or Brooklyn Heights until the 1950s when a realtor re-christened it Cobble Hill, which was the original name the Dutch had given it in the mid-17th Century.
A small park with a playground was created in Cobble Hill in 1965 at Clinton and Congress Streets on a site formerly occupied by two large houses and a church. A supermarket was originally planned for the site, but residents successfully lobbied for a park. In 1969, part of

Cobble Hill was designated a historic district by the New York City Landmark Commission, and additional houses were added in 1988.
Like Brooklyn Heights, Cobble Hill is conveniently located near the Borough Hall subway hub, allowing for an easy commute into Manhattan, and is convenient for lawyers, judges, and government workers walking to the nearby Federal and State courthouses, Borough Hall, and the Municipal Building. St. Francis College, Packer Collegiate Institute, and St. Ann’s School are located in Brooklyn Heights, and Brooklyn Friends School, Brooklyn Law School, New York Technical College, Polytechnic Institute, and Long Island University are a short walk away. In addition, Long Island College Hospital, which was established in 1848, is located in Cobble Hill as are many doctors’ offices.
Development Potential
Residents of Cobble Hill are served by the Court Street commercial corridor, a strip that has become less mom and pop and more hip in recent years in response to the influx of trendy new stores and restaurants that continue to open on nearby Smith Street.
The 1.5 mile stretch of Atlantic Avenue from Flatbush to the East River runs through the neighborhoods of Cobble Hill, Brooklyn Heights, and Boerum Hill and has been undergoing a renaissance in recent years. Atlantic Avenue serves as a destination for shopping and dining with new stores, restaurants, and galleries opening next to established Middle Eastern businesses and antique stores. The Atlantic Avenue Betterment Association, made up of local merchants, reports that 25 new businesses opened on Atlantic Avenue in the first half of 2005. Each year, the Atlantic Avenue Local Development Corporation presents Atlantic Antic to promote the avenue’s businesses and celebrate vibrant cultures they represent.
A number of new residential developments have been completed or are planned on Atlantic Avenue, including the Court House, 320 luxury rentals at Court Street and Atlantic Avenue in Boerum Hill, which also houses the new Dodge YMCA. Another new residential structure has been proposed for the corner of Atlantic Avenue and Court Street behind the former headquarters of Independence Community Bank.
Atlantic Avenue is a major transportation route to the Brooklyn Queens Expressway and the Brooklyn Bridge, and will be the southern gateway to the proposed Brooklyn Bridge Park. The 85-acre park is planned on a 1.3 mile stretch from Atlantic Avenue, including the

dormant piers below Brooklyn Heights, along the East River to Jay Street, north of the Manhattan Bridge. Plans include residential condominiums at Atlantic Avenue, open plazas, restored marshlands, active indoor and outdoor recreational opportunities, including shaded sports fields, softball fields, beach volley ball courts, and playgrounds, a hotel, and retail development.
Through a master plan announced in 2003, the Atlantic Avenue Association Local Development Corporation is identifying ways to integrate Atlantic Avenue into Brooklyn Bridge Park, looking for new development opportunities along the avenue where parking lots and vacant lots now stand, and seeking upzoning along Atlantic Avenue, increased retail, and improvements to streetscape, parking, and intersections. New condominium developments, including one housing the Dodge YMCA, have been built or are being built on Atlantic Avenue. The plan seeks to close the now vacant Men’s House of Detention at Boerum Place and Atlantic Avenue, which the city could reopen at any time.
Sources: The Neighborhoods of Brooklyn, Yale University Press, New Haven and London; An Architectural Guidebook to Brooklyn, Gibbs-Smith Publisher, Salt Lake City; www.brooklynbridgepark.org; www.atlanticave.org; Brooklyn, People and Places, Past and Present, by Grace Glueck and Paul Gardner, Harry N. Abrams, Inc. Business Information
Atlantic Avenue Association Local Development Corporation494 Atlantic Avenue, Brooklyn, NY 11217, 718-875-8993,
www.atlanticave.org
Atlantic Avenue Betterment Association321 Atlantic Avenue, Brooklyn, NY 11201, 718.852.7418, www.atlanticavenuebkny.com
Political and Community ContactsCommunity Board 6, 250 Baltic Street, Brooklyn, NY 11201, 718-
643-3027New York City Council 39, Bill deBlasio, 718-854-9791,
[email protected] Assembly 52, Joan L. Millman, 718-246-4889,
[email protected] Senate 25, Martin Connor, 718-298-5565, [email protected] Congress 11, Major Owens, 718-773-3100,
www.house.gov/owens/ Source: NYC Department of City Planning; NYC Districting Commission, NYPIRG CMAP

Location Cobble Hill is bordered by the Brooklyn Queens Expressway, Court Street, Atlantic Avenue, and DeGraw Street. The area from the Brooklyn Queens Expressway to the waterfront is known as the Columbia Street Waterfront District. Cobble Hill Demographics2000 Census Report within a .3 mile radius as noted in the map above.
Total Population 12,404
Race/Ethnicity (Total Population)White 8,673 69.9 percentBlack 519 4.2 percentNative American 0 0.0 percentAsian 953 7.7 percentOther 430 3.5 percentHispanic (any race) 1,829 14.7 percent
Sex (Total Population)Male 5,884 47.4 percentFemale 6,520 52.6 percent

Age (Total Population)Age 0 to 4 643 5.2 percent
5 to 9 461 3.7 percent10 to 20 926 7.5 percent21 to 29 2,210 17.8 percent30 to 39 3,257 26.3 percent40 to 49 1,765 14.2 percent50 to 59 1,277 10.3 percent60 to 64 398 3.2 percentAge 65+ 1,467 11.8 percent
Education (Population Age 25+)Total population age 25+ 9,847 100 percentLess than 9th grade 734 7.5 percent9-12 Grade 665 6.8 percentHigh School 886 9.0 percentSome College 849 8.6 percentAssociate Degree 288 2.9 percentBachelor Degree 3,215 32.6 percentGraduate Degree 3,210 32.6 percent
Employment Status (Population Age 16+)Total population age 16+ 10,740 100 percentNot in labor force 2,931 27.3 percentLabor force 7,809 72.7 percent
Labor Force StatusTotal Labor Force Age 16+ 7,809 100 percentArmed Forces 0 0.0 percentCivilian 7,591 97.2 percentUnemployed 218 2.8 percent
Employed Civilian OccupationTotal employed civilians,Age 16+ 7,591 100 percentAgriculture 0 0.0 percentConstruction 229 3.0 percentEducation 790 10.4 percentEntertainment 606 8.0 percentF.I.R.E. 1,034 13.6 percentHealth 738 9.7 percentManufacturing 189 2.5 percentMining 0 0.0 percentOther services 340 4.5 percentProf/Tech/Science 1,701 22.4 percent

Public Administration 325 4.3 percentRetail 370 4.9 percentTrans./Warehouse 136 1.8 percentWholesale 110 1.4 percent
HouseholdsTotal households 5,838 100 percentFamily households 2,925 50.1 percent
Income (Total Household)Under $10,000 440 7.5 percent$10,000-20,000 379 6.5 percent$20,000-30,000 385 6.6 percent$30,000-40,000 534 9.1 percent$40,000-50,000 536 9.2 percent$50,000-60,000 442 7.6 percent$60,000-75,000 552 9.5 percent$75,000-100,000 662 11.3 percent$100,000-150,000 963 16.5 percent$150,000-200,000 389 6.7 percentOver $200,000 556 9.5 percent
Occupied HousingTotal Occupied Housing 5,762 100
percentOwner Occupied 1,786 31.0 percentRenter Occupied 3,976 69.0 percent
Household Size (Total Occupied)1 person 2,014 35.0 percent2 person 2,349 40.8 percent3 person 764 13.3 percent4 person 475 8.2 percent5 person 120 2.1 percent6 person 27 0.5 percentOver 7 person 13 0.2 percent
Coney Island
For more than 100 years, Coney Island has captured the imagination of people worldwide who are familiar with its history as a major resort that catered to the masses by offering amusement parks such as Dreamland, Luna Park, and Steeplechase Park, a beach along the Atlantic Ocean where millions of bathers frolicked, and the hot dog,
which restaurateur Charles Feltman invented around 1867 and Nathan Handwerker popularized when in 1916 he opened Nathan’s Famous hot dog stand, now a New York institution and international franchise. Today an estimated 5.3 million visitors descend on Coney Island each season to visit the boardwalk, beach, the original Nathan’s Famous hot dog stand, Deno’s Wonder Wheel Amusement Park, the Cyclone roller coaster at Astroland, New York Aquarium, on the former site of Dreamland, the annual Mermaid Parade, and other attractions. In 2001 Coney Island received a boost when the Brooklyn Cyclones, a minor league baseball team affiliated with the New York Mets, brought baseball back to the borough 44 years after the Brooklyn Dodgers left. The Cyclones play at the newly constructed, fan friendly KeySpan Park, where spectators can look beyond the players on the field and gaze out on the vast Atlantic Ocean. The ball park is located on Surf Avenue on the former location of Steeplechase Park.
Development Potential
In September 2005, Mayor Michael Bloomberg unveiled the Coney Island Strategic Plan with the vision of making Coney Island a year-round destination and turning Stillwell Avenue into the Stillwell Midway, possibly adding a hotel and spa, and developing new cultural activities along the boardwalk. In addition to introducing enhanced entertainment venues, plans call for strengthening the residential community by increasing affordable housing on vacant City-owned land and introducing a job training and recreation center. A total of $83.2 million, including $7 million from the Brooklyn Borough President, $3.2 million from Congressman Jerrold Nadler, and the remainder from the City, will be used to improve the infrastructure in the area (streets, open space, parking and transportation, site preparation, and targeted projects), which could lead to as much as $1 billion in private investment over 10 years. One improvement already in place is the Metropolitan Transit Authority’s impressive $240 million restoration of the Stillwell Avenue Terminal, where the D, F, Q, and N trains stop.
During the next phase of the Strategic Plan, the Department of City Planning will be working with the Coney Island Development Corporation to refine zoning criteria for the area. However, even before the Mayor’s announcement, local newspapers were reporting that developers have been buying up lots in Coney Island and considering building new amusement parks or condominiums.
Thor Equities recently announced plans for a $1 billion waterfront hotel and entertainment complex between West 12th and West 15th Streets that would transform Coney Island in the way Times Square has been transformed. The firm proposes a four-star hotel and conference center; a giant indoor/outdoor water park; national retailers; a world-class circus; and performance spaces. Sources: Old Brooklyn in Early Photographs 1865-1929, William Lee Younger, Dover Publications, New York, NY; Office of Mayor Michael Bloomberg; Coney Island Development Corporation; http://www.pbs.org/wgbh/amex/coney/timeline/index.html; Crain’s, October 3, 2005.
Business InformationConey Island Board of Trade1402 Neptune Avenue, Brooklyn, NY 11224718-333-9000
Coney Island Development Corporationwww.cidc.org
Coney Island Chamber of Commerce1015 Surf Avenue, Brooklyn, NY 11224718-266-1234
Astella Development Corporation1618 Mermaid Avenue, Brooklyn, NY 11224718-266-4653Source: NYC Department of Small Business Services, NYC Economic Development Corporation, BEDC, Brooklyn Chamber of Commerce.
Political and Community ContactsCommunity Board 13, 2900 West 8th Street, Brooklyn, NY 11224, 718-266-3001New York City Council 47, Domenic M. Recchia, Jr., [email protected] Assembly 46, Adele Cohen, 718-266-0267,
[email protected] Senate 23, Diane Savino, 718-727-9406, [email protected] Congress 8, Jerrold Nadler, 212-367-7350,
www.house.gov/nadler/ Source: NYC Department of City Planning; NYC Districting Commission, NYPIRG CMAP

Location
Coney Island is bounded by 37th Street, Ocean Parkway, Coney Island Creek and the Belt Parkway, to the Boardwalk and Coney Island Beach.
Coney Island Demographics2000 Census Report within a .85 radius as noted in the map above.
Total Population 489,498
Race/Ethnicity (Total Population)White 26,064 52.7 percentBlack 10,688 21.6 percentNative American 69 0.1 percentAsian 2,990 6.0 percentOther 1,219 2.5 percentHispanic (any race) 8,468 17.1 percent
Sex (Total Population)Male 22,162 44.8 percentFemale 27,336 55.2 percent

Age (Total Population)Age 0 to 4 2,624 5.3 percent
5 to 9 3,205 6.5 percent10 to 20 7,090 14.3 percent21 to 29 4,908 9.9 percent30 to 39 6,005 12.1 percent40 to 49 5,902 11.9 percent50 to 59 6,020 12.2 percent60 to 64 3,050 6.2 percentAge 65+ 10,694 21.6 percent
Education (Population Age 25+)Total population age 25+ 34,506 100 percentLess than 9th grade 4,290 12.4 percent9-12 Grade 5,930 17.2 percentHigh School 10,257 29.7 percentSome College 4,758 13.8 percentAssociate Degree 2,258 6.5 percentBachelor Degree 4,697 13.6 percentGraduate Degree 2,316 6.7 percent
Employment Status (Population Age 16+)Total population age 16+ 39,753 100 percentNot in labor force 22,975 57.8 percentLabor force 16,778 42.2 percent
Labor Force StatusTotal Labor Force Age 16+ 16,778 100 percentArmed Forces 49 0.3 percent
Civilian 14,851 88.5 percentUnemployed 1,878 11.2 percent
Employed Civilian OccupationTotal employed civilians,Age 16+ 14,851 100 percentAgriculture 0 0.0 percentConstruction 621 4.2 percentEducation 1,359 9.2 percentEntertainment 780 5.3 percentF.I.R.E. 1,609 10.8 percentHealth 2,970 20.0 percentManufacturing 1,036 7.0 percentMining 0 0.0 percentOther services 844 5.7 percentProf/Tech/Science 1,177 7.9 percent

Public Administration 748 5.0 percentRetail 1,568 10.6 percentTrans./Warehouse 1,113 7.5 percentWholesale 541 3.6 percent
HouseholdsTotal households 20,277 100 percentFamily households 12,828 63.3 percent
Income (Total Household)Under $10,000 5,289 26.1 percent$10,000-20,000 4,106 20.2 percent$20,000-30,000 2,545 12.6 percent$30,000-40,000 2,228 11.0 percent$40,000-50,000 1,657 8.2 percent$50,000-60,000 1,076 5.3 percent$60,000-75,000 1,263 6.2 percent$75,000-100,000 1,056 5.2 percent$100,000-150,000 727 3.6 percent$150,000-200,000 133 0.7 percentOver $200,000 197 1.0 percent
Occupied HousingTotal Occupied Housing 20,208 100 percentOwner Occupied 4,493 22.2 percentRenter Occupied 15,715 77.8 percent
Household Size (Total Occupied)1 person 6,964 34.5 percent2 person 6,054 30.0 percent3 person 3,331 16.5 percent4 person 2,089 10.3 percent5 person 941 4.7 percent6 person 445 2.2 percentOver 7 person 384 1.9 percent
Crown Heights
Frederick Law Olmsted and Calvert Vaux, designers of Prospect Park, Grand Army Plaza, Ocean Parkway, and Central Park, also designed Eastern Parkway, an avenue so grand that the segment from Grand Army Plaza in Prospect Heights to Ralph Avenue in Crown Heights has been named a New York City scenic landmark.

Eastern Parkway divides Crown Heights into two sections and was originally created with six lanes to accommodate carriage riders, horseback riders, and pedestrians. The horses are gone, but Eastern Parkway has retained the shade trees, park benches, limestone homes, gracious apartment houses, and religious institutions that continue to make it a delightful promenade. On the neighborhood’s side streets, the residential community features one- or multi-family limestone or brownstone dwellings, some architecturally significant mansions, and apartment buildings. Crown Heights has a large West Indian population, making Eastern Parkway a fitting location for the Annual West Indian Day Parade, which celebrates the cultures of Haiti, Jamaica, Trinidad and Tobago, Barbados, and Grenada and attracts more than 1 million people every Labor Day.
The worldwide headquarters of the Lubavitch movement of Hasidic Jews is located at 770 Eastern Parkway and members of the sect live in the community. Tensions between diverse neighborhood groups resulted in riots in 1991, but powerful community leaders have worked hard to successfully heal the wounds, stress peace, and strengthen the bonds between the area’s disparate residents.
Crown Heights has a number of cultural assets including the Brooklyn Museum and Brooklyn Botanic Garden, which border it, and the Brooklyn Public Library’s Central Library at Grand Army Plaza and Prospect Park, which are a short walk away. Crown Heights also is home to the Brooklyn Children’s Museum, Medgar Evers College, and the newly constructed Jewish Children’s Museum.
Founded in 1899 as the first museum created specifically for children, the Brooklyn Children’s Museum at St. Marks and Brooklyn Avenues will double in size to 102,000 after its $39 million expansion is completed in 2007. The museum is located in a residential area next to the 7-acre Brower Park, and its ongoing exhibits attract 250,000 visitors annually. For more than 100 years, the museum’s programs have contributed to the well-being of children in the community, and its after school and summer programs are specifically designed to serve residents in the community.
Medgar Evers College at 1650 Bedford Avenue was founded in 1970 and is the newest four-year college in the City University of New York (CUNY) system. Students and faculty members at Medgar Evers College reflect the diversity of the surrounding Brooklyn community with students and their families claiming 75 countries as their native land and faculty members representing five out of seven continents.

More than 5,300 degree students and more than 4,000 continuing education students are enrolled at the school, and the college projects that 7,000 students will be enrolled by 2008. To accommodate its growth, the college opened the newly constructed, 44,950 square foot School of Business and Student Support Services Building in 2005 at 1637 Bedford Avenue. The next phase of the campus expansion will be the five-story, 194,000 square foot Academic Complex for the Sciences, which will cover about three-quarters of the block of Crown Street beginning at Bedford Avenue and will house the School of Science, Health, and Technology.
Devorah Halberstam, the mother of Ari Halberstam, 16, who was killed on the Brooklyn Bridge in 1994, when a gunman opened fire on a group of Orthodox Jewish students, was the catalyst behind the creation of the Jewish Children’s Museum. The museum opened in Ari’s honor in 2004 at 792 Eastern Parkway at Kingston Avenue. On Utica Avenue and Bergen Street in what is still considered Bedford Stuyvesant, is the community of Weeksville, which was settled in the 1830s by former slaves. Weeksville’s history has been conserved by the Society for the Preservation of Weeksville and Bedford-Stuyvesant and tours are offered of houses that are city and national landmarks and a museum of African-American history and culture.
From 1913 to 1957, before moving to Los Angeles, the legendary Brooklyn Dodgers played in Ebbets Field in what we now call Crown Heights but old-timers might refer to as Flatbush. On the site where Jackie Robinson, Roy Campanella, Duke Snider, and Pee Wee Reese once played, an apartment complex, the Ebbets Field Houses was built between 1960 and 1962 at Bedford Avenue and Sullivan Place. The only remnant of Dodger glory can be found in the Dodger memorabilia in the McDonald’s on Empire Boulevard, and a nearby elementary school named after Jackie Robinson.
Development Potential
Residents of Crown Heights are served by a number of commercial corridors that intersect Eastern Parkway including Franklin Avenue, Nostrand Avenue, and Kingston Avenue, and St. Johns Place and Empire Boulevard, which run parallel to the parkway.
For many years the Crow Hill Community Association has introduced improvements to an area bordered by Eastern Parkway, Sterling Place, Bedford Avenue, and Franklin Avenue, and worked to upgrade the commercial corridor of Franklin Avenue with new gates, awnings and improved security and lighting.

Franklin Lofts, an 18,000 square foot housing development that will create 50 live-work spaces for artists is being developed at 945 Bergen Street on the site of five industrial properties and two single-family homes along Franklin Avenue between Bergen and Dean Streets. The properties were acquired by Community Preservation Corporation and Artopolis. In addition, in 2005 the New York City Department of Housing Preservation and Development announced it had rehabbed dozens of affordable rentals throughout the neighborhood, making them available to qualified tenants.
Sources: Brooklyn Economic Development Corporation; Brooklyn Chamber of Commerce; Brooklyn Children’s Museum; Medgar Evers College; Jewish Children’s Museum; The Neighborhoods of Brooklyn, Yale University Press, New Haven and London; An Architectural Guidebook to Brooklyn, Gibbs-Smith Publisher, Salt Lake City; Brooklyn Daily Eagle, August 22, 2005 and August 29, 2005.
Business InformationLDC of Crown Heights, 230 Kingston Avenue, Brooklyn, NY 11225, 718-493-5200
Political and Community ContactsCommunity Board 8, 1291 St. Marks Avenue, Brooklyn, NY,
11213, 718-467-5574Community Board 9, 890 Nostrand Avenue, Brooklyn, NY 11225, 718-778-9279New York City Council 35, Letitia James, 718-260-9191, [email protected] York City Council 36, Albert Vann, 718-919-0740, [email protected] Assembly 43, Karim Camara,
[email protected] Assembly 57, Roger L. Green, 718-596-0100, [email protected] Senate 20, Carl Andrews, 718-284-4700,
[email protected] Congress 11, Major Owens, 718-773-3100,
www.house.gov/owens/ Source: NYC Department of City Planning; NYC Districting Commission, NYPIRG CMAP

LocationThe boundaries of Crown Heights are roughly Washington Avenue to Rutland and Sutter Avenues, from Atlantic Avenue or Park Place, depending on the source, to Empire Boulevard. (The area north of Eastern Parkway was once considered Bedford Stuyvesant, while the area south of Eastern Parkway was once considered part of Flatbush.)
Crown Heights Demographics2000 Census Report within a .85 mile radius as noted in the map above.
Total Population 133,855
Race/Ethnicity (Total Population)White 10,529 7.9 percentBlack 105,255 78.6 percentNative American 252 0.2 percentAsian 1,685 1.3 percentOther 4,986 3.7 percentHispanic (any race) 11,148 8.3 percent

Sex (Total Population)Male 59,542 44.5 percentFemale 74,313 55.5 percent
Age (Total Population)Age 0 to 4 9,722 7.3 percent
5 to 9 11,376 8.5 percent10 to 20 21,490 16.1 percent21 to 29 19,187 14.3 percent30 to 39 20,791 15.5 percent40 to 49 19,135 14.3 percent50 to 59 13,295 9.9 percent60 to 64 5,022 3.8 percentAge 65+ 13,837 10.3 percent
Education (Population Age 25+)Total population age 25+ 82,792 100 percentLess than 9th grade 7,778 9.4 percent9-12 Grade 17,310 20.9 percentHigh School 23,799 28.7 percentSome College 15,482 18.7 percentAssociate Degree 4,757 5.7 percentBachelor Degree 8,346 10.1 percentGraduate Degree 5,320 6.4 percent
Employment Status (Population Age 16+)Total population age 16+ 101,031 100 percentNot in labor force 42,237 41.8 percentLabor force 58,794 58.2 percent
Labor Force StatusTotal Labor Force Age 16+ 58,794 100 percentArmed Forces 30 0.1 percentCivilian 50,914 86.6 percentUnemployed 7,850 13.4 percent
Employed Civilian OccupationTotal employed civilians,Age 16+ 50,914 100 percentAgriculture 12 0.0 percentConstruction 2,179 4.3 percentEducation 4,816 9.5 percentEntertainment 3,315 6.5 percentF.I.R.E. 4,881 9.6 percentHealth 11,250 22.1 percentManufacturing 2,282 4.5 percent

Mining 0 0.0 percentOther services 3,223 6.3 percentProf/Tech/Science 5,052 9.9 percentPublic Administration 2,866 5.6 percentRetail 4,072 8.0 percentTrans./Warehouse 3,894 7.6 percentWholesale 1,054 2.1 percent
HouseholdsTotal households 49,941 100 percentFamily households 31,378 62.8 percent
Income (Total Household)Under $10,000 10,709 21.4 percent$10,000-20,000 7,005 14.0 percent$20,000-30,000 7,772 15.6 percent$30,000-40,000 6,778 13.6 percent$40,000-50,000 4,642 9.3 percent$50,000-60,000 3,299 6.6 percent$60,000-75,000 3,650 7.3 percent$75,000-100,000 2,971 5.9 percent$100,000-150,000 1,987 4.0 percent$150,000-200,000 536 1.1 percentOver $200,000 592 1.2 percent
Occupied HousingTotal Occupied Housing 50,119 100 percentOwner Occupied 8,106 16.2 percentRenter Occupied 42,013 83.8 percent
Household Size (Total Occupied)1 person 16,020 32.0 percent2 person 12,854 25.6 percent3 person 8,581 17.1 percent4 person 6,061 12.1 percent5 person 3,358 6.7 percent6 person 1,580 3.2 percentOver 7 person 1,665 3.3
percent
DUMBO and Vinegar HillOnce a decaying warehouse and manufacturing district, the fortunes of DUMBO (Down Under the Manhattan Bridge Overpass) began to change when artists seeking loft space discovered it in the 1970s.

Today the neighborhood is one of Brooklyn’s hottest housing districts and features charming cobblestone streets, 19th Century buildings converted to luxury condominiums with breathtaking views of Manhattan, cutting edge art galleries, trendy cafes with live music, attractive office space, new retail establishments, and direct access to Empire Fulton Ferry State Park and the East River waterfront.
DUMBO is the site of outdoor movies in the summer, art and music festivals throughout the year, and the Annual DUMBO Art Under the Bridge Festival when more than 200 neighborhood artists open their studios to the public. Bargemusic at nearby Fulton Ferry Landing offers chamber music concerts every week.
Vinegar Hill is sandwiched between DUMBO and the Brooklyn Navy Yard and like DUMBO has become an attractive haven for artists. The neighborhood takes its name from the Irish Rebellion of 1798 and initially was home to the Irish working class who were employed at nearby factories, docks, and the Brooklyn Navy Yard. Vinegar Hill is not as developed as DUMBO and its homes, both new construction and the 19th Century historic structures given landmark status in 1997, are mixed in with manufacturing firms, warehouses, and a Con Edison power plant.
The 255-acre Brooklyn Navy Yard next to Vinegar Hill was run by the U.S. Navy from 1801 to 1966 and at its peak during World War II employed more than 70,000 workers. Today it’s an industrial park filled with hundreds of small businesses including artist studios, a ship repair business, and on a 15-acre site a new enterprise, Steiner Studios, a 280,000 square foot Hollywood-style, full-service, state-of-the-art “production factory” equipped for start-to-finish production of major motion pictures, independent films, television, music videos and broadcast commercials. Development Potential
Residential development is continuing at a brisk pace in DUMBO and Vinegar Hill and one local newspaper estimated in September 2005 that more than 2,000 new units were being created in more than 20 buildings in the area, including:
The conversion of a 1919 toy warehouse to 88 residences ranging from $350,000 to $1.35 million at 99 Gold Street;
The construction of J Condo, a 33-story development with 267 units at 100 Jay Street, between York and Front Streets;
The Witnesses four-tower project at 85 Jay Street; The 23-story, 79-unit Beacon Tower at 85 Adams Street;

The conversion of a commercial building to 225 Condos at 70 Washington Street;
A 12-story building with 200 units at 38 Water Street; The Nexus, a 12-story, 56-unit building at 84 Front Street; The conversion of two commercial buildings to 33 condos at 53-
57 Front Street; The Bridgefront Condos, a 10-story, 21-unit building at 42 Main
Street. A proposal for 18 loft units at 192 Water Street. United Homes’ 12-story, 52-condo development at 133 Water
Street. The conversion of a 1900 former warehouse and soap
manufacturing plant into 58 residential units at 50 Bridge Street.
The conversion of a six-story industrial building into 56 units at 215 and 223 Water Street.
A proposal to convert a seven-story commercial building into residential at 220 Water Street.
The conversion of a former factory building into 37 condos at 79 Bridge Street.
A proposal to develop 37 Bridge Street into loft units. Vinegar Hill Village, 18, three-story, two-family homes at Evans,
Plymouth, and Little Streets. A five-story, nine-unit condominium at 85 Hudson. A two-unit residential development at 87 Hudson Street. A three-story, three-family building at 91 Hudson Street. A seven-story, 33-unit building planned at 206 Front Street. A proposed 33-unit residential unit at 253 Front Street.
To slow down the development and save 19th and 20th Century industrial buildings, some local residents are attempting to create a DUMBO Historic District.
The proposed Brooklyn Bridge Park will incorporate Empire Fulton Ferry State Park, its playground, and Civil War era warehouses in a 1.3 mile park along the waterfront from Jay Street north of the Manhattan Bridge to Atlantic Avenue and also may offer new opportunities for businesses complementing the park’s activities. Proposals for the 85-acre park include open plazas, restored marshlands, active indoor and outdoor recreational opportunities, including shaded sports fields, softball fields, beach volley ball courts, playgrounds, and 12 acres of safe paddling waters playgrounds, a hotel, retail development, and residential condominiums.
In December 2005, Mayor Michael Bloomberg created the DUMBO Business Improvement District to promote business development and

improve the quality of life in the neighborhood. The new BID will provide maintenance and sanitation services, holiday lighting and decoration, street beautification, and marketing and promotion of shopping. Sources: New York; www.brooklynbridgepark.org; The Neighborhoods of Brooklyn, Yale University Press, New Haven and London; An Architectural Guidebook to Brooklyn, Gibbs Smith Publisher, Salt Lake City; Brooklyn, A Journey Through the City of Dreams, Universe Publishing, New York, NY; Brooklyn Daily Eagle, September 29, 2005, October 21, 2005, December 2, 2005, January 6, 2006; New York Times, August 31, 2003.
Business Information
Brooklyn Economic Development Corporation (BEDC)175 Remsen Street, Brooklyn, NY 11201, 718-522-4600www.bedc.org
Brooklyn Business Library280 Cadman Plaza West, Brooklyn, NY 11201, 718-623-7000, ext. 1259 www.brooklynpubliclibrary.org
Source: NYC Department of Small Business Services, NYC Economic Development Corporation, BEDC, Brooklyn Chamber of Commerce
Political and Community ContactsCommunity Board 2, 350 Jay Street, Brooklyn, NY 11201, 718-
596-5410New York City Council 33, David Yassky, 718-875-5200, [email protected] Assembly 52, Joan L. Millman, 718-246-4889,
[email protected] Senate 25, Martin Connor, 718-298-5565, [email protected] Congress, Nydia M. Velazquez, 718-599-3658,
www.house.gov/velazquez/ US Congress 10, Edolphus Towns, 718-855-8018,
www.house.gov/towns/Source: NYC Department of City Planning; NYC Districting Commission, NYPIRG CMAP

Location The boundaries for DUMBO are roughly the East River, Main Street, Jay Street or Bridge Street, and the Brooklyn-Queens Expressway, while the boundaries of Vinegar Hill are roughly the East River, Jay Street or Bridge Street, York Street, and the Brooklyn Navy Yard. DUMBO/Vinegar Hill Demographics2000 Census Report within a .5 mile radius as noted in the map above.
Total Population 19,209
Race/Ethnicity (Total Population)White 10,512 54.7 percentBlack 4,380 22.8 percentNative American 39 0.2 percentAsian 1,285 6.7 percentOther 456 2.4 percentHispanic (any race) 2,537 13.2 percent
Sex (Total Population)Male 9,752 50.8 percentFemale 9,457 49.2 percent

Age (Total Population)Age 0 to 4 761 4.0 percent
5 to 9 810 4.2 percent10 to 20 1,609 8.4 percent21 to 29 3,747 19.5 percent30 to 39 4,183 21.8 percent40 to 49 3,093 16.1 percent50 to 59 2,220 11.6 percent60 to 64 645 3.4 percentAge 65+ 2,141 11.1 percent
Education (Population Age 25+)Total population age 25+ 14,635 100 percentLess than 9th grade 851 5.8 percent9-12 Grade 1,297 8.9 percentHigh School 2,347 16.0 percentSome College 1,855 12.7 percentAssociate Degree 694 4.7 percentBachelor Degree 3,741 25.6 percentGraduate Degree 3,850 26.3 percent
Employment Status (Population Age 16+)Total population age 16+ 16,785 100 percentNot in labor force 6,891 41.1 percentLabor force 9,894 58.9 percent
Labor Force StatusTotal Labor Force Age 16+ 9,894 100 percentArmed Forces 28 0.3 percent
Civilian 8,885 89.8 percentUnemployed 981 9.9 percent
Employed Civilian OccupationTotal employed civilians,Age 16+ 8,885 100 percentAgriculture 0 0.0 percentConstruction 170 1.9 percentEducation 915 10.3 percentEntertainment 648 7.3 percentF.I.R.E. 1,250 14.1 percentHealth 758 8.5 percentManufacturing 385 4.3 percentMining 0 0.0 percentOther services 418 4.7 percentProf/Tech/Science 1,882 21.2 percent

Public Administration 477 5.4 percentRetail 489 5.5 percentTrans./Warehouse 220 2.5 percentWholesale 309 3.5 percent
HouseholdsTotal households 8,492 100 percentFamily households 3,575 42.1 percent
Income (Total Household)Under $10,000 1,091 12.8 percent$10,000-20,000 752 8.9 percent$20,000-30,000 687 8.1 percent$30,000-40,000 846 10.0 percent$40,000-50,000 693 8.2 percent$50,000-60,000 687 8.1 percent$60,000-75,000 772 9.1 percent$75,000-100,000 751 8.8 percent$100,000-150,000 1,153 13.6 percent$150,000-200,000 437 5.1 percentOver $200,000 623 7.3 percent
Occupied HousingTotal Occupied Housing 8,440 100 percentOwner Occupied 3,506 41.5 percentRenter Occupied 4,934 58.5 percent
Household Size (Total Occupied)1 person 3,912 46.4 percent2 person 2,728 32.3 percent3 person 896 10.6 percent4 person 556 6.6 percent5 person 217 2.6 percent6 person 48 0.6 percentOver 7 person 83 1.0 percent
Dyker Heights
The pristine municipal Dyker Beach Golf Course, 242-acre Dyker Beach Park on Gravesend Bay, seasonal events at the 8.5 acre McKinley Park, and, of course, the magnificent annual display of holiday lights on area homes throughout Dyker Heights all set this community apart from other Brooklyn neighborhoods.

Since it was first founded by Dutch farmers in the 17th Century, residents of Dutch, English, Scandinavian, Irish, Italian, Russian, and Chinese origin have all called Dyker Heights their home.
Dyker Heights remained primarily farmland until after the turn of the 20th Century when the extension of the subway to surrounding communities encouraged housing development. The residential neighborhood now features single-family houses, some two-family brick homes, and a few apartment buildings, with most buildings except for churches no higher than three stories. Dyker Heights once had its share of mansions, but many were replaced by one- and two-family houses when the large homes became difficult to maintain. Local retail shops can be found along 13th Avenue.
The prestigious Poly Prep Country Day School is located at 92nd and 7th
Avenue, on the border between Dyker Heights and Fort Hamilton, and Victory Memorial Hospital Skilled Nursing Center is located at 699 92nd Street.Sources: The Neighborhoods of Brooklyn, Yale University Press; Brooklyn People and Places, Past and Present, Harry N. Abrams, Inc., New York, NY.
Business InformationBay Ridge/Bensonhurst Preservation Alliance9201 Fourth Avenue, Brooklyn, NY 11209718-491-1705
Source: NYC Department of Small Business Services, NYC Economic Development Corporation, BEDC, Brooklyn Chamber of Commerce.
Political and Community ContactsCommunity Board 10, 621, 86th Street, Brooklyn, NY 718-745-
6827New York City Council 43, Vincent J. Gentile, 718-748-5200 [email protected] Assembly 46, Adele Cohen, 718-266-0267,
[email protected] Senate 22, Martin J. Golden, 718-238-6044, [email protected] Congress 13, Vito Fossella, 718-346-8400,
Source: NYC Department of City Planning; NYC Districting Commission, NYPIRG CMAP

LocationThe boundaries for Dyker Heights are roughly 7th Avenue, to 14th Avenue, 65th Street, to the south side of Dyker Beach Park and the Belt Parkway.
Dyker Heights Demographics2000 Census Report within a .85 mile radius as noted in the map above.
Total Population 88,880 100 percent
Race/Ethnicity (Total Population)White 59,281 66.7 percentBlack 271 0.3 percentNative American 116 0.1 percentAsian 18,538 20.9 percentOther 3,284 3.7 percentHispanic (any race) 7,390 8.3 percent
Sex (Total Population)Male 43,192 48.6 percentFemale 45,688 51.4 percent

Age (Total Population)Age 0 to 4 5,479 6.2 percent
5 to 9 5,204 5.9 percent10 to 20 12,128 13.6 percent21 to 29 11,549 13.0 percent30 to 39 14,090 15.9 percent40 to 49 13,118 14.8 percent50 to 59 9,134 10.3 percent60 to 64 3,842 4.3 percentAge 65+ 14,336 16.1 percent
Education (Population Age 25+)Total population age 25+ 61,310 100 percentLess than 9th grade 10,300 16.8 percent9-12 Grade 9,723 15.9 percentHigh School 19,038 31.1 percentSome College 7,516 12.3 percentAssociate Degree 3,111 5.1 percentBachelor Degree 7,329 12.0 percentGraduate Degree 4,293 7.0 percent
Employment Status (Population Age 16+)Total population age 16+ 71,400 100 percentNot in labor force 34,145 47.8 percentLabor force 37,255 52.2 percent
Labor Force StatusTotal Labor Force Age 16+ 37,255 100 percentArmed Forces 46 0.1 percent
Civilian 34,743 93.3 percentUnemployed 2,466 6.6 percent
Employed Civilian OccupationTotal employed civilians,Age 16+ 34,743 100 percentAgriculture 13 0.0 percentConstruction 2,457 7.1
percentEducation 3,062 8.8 percentEntertainment 2,751 7.9
percentF.I.R.E. 4,135 11.9 percentHealth 3,697 10.6
percentManufacturing 3,648 10.5
percent

Mining 6 0.0 percent
Other services 1,834 5.3 percentProf/Tech/Science 3,236 9.3 percentPublic Administration 1,478 4.3 percentRetail 3,419 9.8 percentTrans./Warehouse 2,411 6.9 percentWholesale 1,429 4.1 percent
HouseholdsTotal households 32,713 100 percentFamily households 22,921 70.1
percent
Income (Total Household)Under $10,000 4,712 14.4 percent$10,000-20,000 5,172 15.8 percent$20,000-30,000 3,863 11.8 percent$30,000-40,000 3,765 11.5 percent$40,000-50,000 3,117 9.5 percent$50,000-60,000 2,433 7.4 percent$60,000-75,000 3,113 9.5 percent$75,000-100,000 2,894 8.8 percent$100,000-150,000 2,559 7.8 percent$150,000-200,000 623 1.9 percentOver $200,000 462 1.4 percent
Occupied HousingTotal Occupied Housing 32,538 100
percentOwner Occupied 12,493 38.4 percentRenter Occupied 20,045 61.6 percent
Household Size (Total Occupied)1 person 8,658 26.6 percent2 person 8,928 27.4 percent3 person 5,693 17.5 percent4 person 5,101 15.7 percent5 person 2,389 7.3 percent6 person 982 3.0 percent
Over 7 person 787 2.4 percentEast Flatbush(Includes Prospect-Lefferts Gardens, Remsen Village, Rugby, Wingate, Farragut, Erasmus, and Vanderveer Estates)

East Flatbush was founded by the Dutch in the 17th Century. Historically, the western section of East Flatbush was part of the Dutch town of Flatbush and the eastern section was part of the Dutch town Flatlands. The area remained a farming community until the turn of the 20th Century when residential neighborhood development began. Today a number of these smaller neighborhoods—Remsen Village, Rugby, Wingate, Farragut, Erasmus, and Vanderveer Estates—make up what is now knows as East Flatbush.
The area features one- and two-family brick or wood frame homes, attached, semi-attached, and detached, built in the first three decades of the 20th Century and apartment buildings built after World War II. East Flatbush is made up of a large number of residents with roots in the West Indian countries of Jamaica, Guyana, Trinidad and Tobago, and Haiti.
East Flatbush borders the neighborhood of Prospect Lefferts Gardens, which has boundaries of Flatbush Avenue, Empire Boulevard, New York Avenue, and Clarkson Avenue. This neighborhood is noted for its brick and limestone one- and two-family row houses built between 1905 and 1925; well maintained apartment buildings constructed in the 1920s and 1930s; close proximity to Prospect Park and the Botanic Garden; and active neighborhood groups that today are involved in economic development initiatives on Nostrand Avenue. A large part of the neighborhood is a historic district.
SUNY Downstate Medical Center and Kings County Hospital are major employers in the area. Together, the medical facilities employ more than 6,000 people who are potential customers for businesses along the commercial corridor of Nostrand Avenue, which is located nearby. New residential development also is planned for the area surrounding the medical center, including a condominium complex planned nearby on the site of a former factory and luxury condominiums on East New York Avenue. Currently, 19,000 residents live in an eight-block area of the medical center and hospital, and more than 50,000 residents live within a half mile radius. In addition, a new school has opened and active churches are located nearby.
Through capital funding provided by Council Member Una Clarke and now her successor, Yvette Clarke, the City is making major streetscape improvements along Nostrand Avenue from Empire Boulevard to Linden Boulevard. Trees were planted during the summer of 2005, new street lights have replaced generic street lights, and decorative medallions that illustrating different flowers of the Caribbean are being affixed to the street lights.

Of historic interest is Lefferts Homestead, which was burned by the British in 1776 and rebuilt in 1783 and was originally located on Flatbush Avenue between Maple and Midwood Streets. The house was moved and preserved in its current location on Flatbush Avenue in Prospect Park next to the Prospect Park Zoo. Programs at Lefferts Homestead give visitors an idea of what it was like to live in Brooklyn centuries ago—from how early Dutch settlers made clothes and farmed to how they celebrated Christmas.
Also, of note is the Pieter Claesen Wyckoff House, which was built in 1652 as a Dutch West India Company farm at the corner of Clarendon Road and Ralph Avenue and is the oldest building in New York City. The Dutch Colonial house was enlarged in 1740; became the first landmark designated by the New York City Landmarks Preservation Commission upon its creation in 1965, and received National Historic Landmark status in 1968. The Wyckoff House Foundation donated the house to the City in 1969, and after an exhaustive restoration it opened as a Museum in 1982. Programs explore the diverse peoples of Brooklyn's Dutch-American farming communities and include demonstrations of household and farm activities. Special events are scheduled throughout the year.
In addition, 5224 Tilden Avenue, the former home of Brooklyn Dodger Jackie Robinson who integrated major league baseball, has been designated a National Historic Landmark.
Development Potential
The potential for businesses on Nostrand Avenue to expand and thrive is great because the commercial strip is a half a block from the SUNY Downstate Biotech Park, which is made up of the new Biotechnology Incubator and two proposed bio-tech buildings in a two-block area, and one block from SUNY Downstate Medical Center and Kings County Hospital, which is undergoing a major redevelopment.
Brooklyn Economic Development Corporation (BEDC) has been coordinating a Storefront Improvement Program on Nostrand Avenue between Fenimore Street and Lenox Road. More than 23 businesses have submitted applications for the program, which is designed to help merchants and property owners improve their storefronts and make the shopping strip more attractive and welcoming to consumers.
BEDC’s staff also is helping local property owners recruit tenants for commercial storefronts. Based on focus groups and shopper surveys

conducted in 2005, BEDC has identified several kinds of stores desired by local consumers: café, bagel store, sit down lunch establishment, a children’s toy and clothing store, florist, and bookstore. Sources: Brooklyn Economic Development Corporation; www.wyckoffassociation.org; www.nostrandave.org, Brooklyn Daily Eagle, August 31, 2005; The Neighborhoods of Brooklyn, Yale University Press, New Haven and London.
Business InformationBrooklyn Economic Development Corporation and the Nostrand Avenue Merchants Association, www.nostrandave.org
Political and Community ContactsCommunity Board 17, 39 Remsen Avenue Brooklyn, NY, 11212,
718-467-3536NYC Council 40, Yvette Clarke, 718-287-8762,
[email protected] Assembly 43, Karim Camara,
[email protected] Senate 20, Carl Andrews, 718-284-4700,
[email protected] Congress 11, Major Owens, 718-773-3100,
www.house.gov/owens/ Source: NYC Department of City Planning; NYC Districting Commission, NYPIRG CMAP

LocationThe boundaries of East Flatbush are roughly Empire Boulevard, East New York Avenue, Rockaway Parkway, Ditmas Avenue, Kings Highway, Avenue H, a section of Flatbush Avenue, and Bedford and Rogers Avenues.
East Flatbush Demographics2000 Census Report within a 1.35 mile radius as noted in the map above.
Total Population 233,085
Race/Ethnicity (Total Population)White 12,824 5.5 percentBlack 191,147 82.0 percentNative American 549 0.2 percentAsian 4,522 1.9 percentOther 8,929 3.8 percentHispanic (any race) 15,115 6.5 percent
Sex (Total Population)Male 103,193 44.3 percentFemale 129,892 55.7 percent
Age (Total Population)Age 0 to 4 16,321 7.0 percent
5 to 9 17,393 7.5 percent10 to 20 39,763 17.1 percent21 to 29 30,590 13.1 percent30 to 39 34,948 15.0 percent40 to 49 35,683 15.3 percent50 to 59 26,531 11.4 percent60 to 64 10,376 4.5 percentAge 65+ 21,480 9.2 percent
Education (Population Age 25+)Total population age 25+ 145,978 100 percentLess than 9th grade 12,418 8.5 percent9-12 Grade 27,566 18.9 percentHigh School 42,697 29.2 percentSome College 26,837 18.4 percentAssociate Degree 11,648 8.0 percentBachelor Degree 16,395 11.2 percentGraduate Degree 8,417 5.8 percent

Employment Status (Population Age 16+)Total population age 16+ 177,674 100 percentNot in labor force 67,583 38.0 percentLabor force 110,091 62.0 percent
Labor Force StatusTotal Labor Force Age 16+ 110,091 100 percentArmed Forces 82 0.1 percentCivilian 97,481 88.5 percentUnemployed 12,528 11.4 percent
Employed Civilian OccupationTotal employed civilians,Age 16+ 97,481 100 percentAgriculture 44 0.0 percentConstruction 4,437 4.6 percentEducation 7,361 7.6 percentEntertainment 4,394 4.5 percentF.I.R.E. 9,801 10.1 percentHealth 27,180 27.9 percentManufacturing 3,887 4.0 percentMining 0 0.0 percentOther services 6,356 6.5 percentProf/Tech/Science 7,856 8.1 percentPublic Administration 4,826 5.0 percentRetail 7,623 7.8 percentTrans./Warehouse 8,833 9.1 percentWholesale 1,557 1.6 percent
HouseholdsTotal households 77,938 100 percentFamily households 57,813 74.2 percent
Income (Total Household)Under $10,000 11,705 15.0 percent$10,000-20,000 9,191 11.8 percent$20,000-30,000 10,703 13.7 percent$30,000-40,000 9,509 12.2 percent$40,000-50,000 7,806 10.0 percent$50,000-60,000 7,285 9.3 percent$60,000-75,000 7,440 9.5 percent$75,000-100,000 7,000 9.0 percent$100,000-150,000 5,475 7.0 percent$150,000-200,000 1,144 1.5 percentOver $200,000 680 0.9 percent

Occupied HousingTotal Occupied Housing 77,867 100 percentOwner Occupied 27,682 35.6 percentRenter Occupied 50,185 64.4 percent
Household Size (Total Occupied)1 person 17,266 22.2 percent2 person 19,309 24.9 percent3 person 15,823 20.3 percent4 person 12,113 15.6 percent5 person 7,269 9.3 percent6 person 3,626 4.7 percentOver 7 person 2,461 3.2 percent
East New York(Includes Cypress Hills, New Lots, City Line, Highland Park, and Spring Creek)
East New York was primarily a rural community in the 19th Century but flirted with industrial development in 1835 when a prosperous merchant from Connecticut named John Pitkin bought land on which he built a shoe factory at Pitkin and Williams Avenues and named the community East New York. Decades later in the late 19th Century and early 20th Century, newly constructed walk-up apartments and row houses and multi-family homes on the side streets attracted a large immigrant population—mostly German, Italian, Russian, Polish, and Lithuanian―especially following the opening of the Williamsburg Bridge in 1903 and the subway to New Lots in 1922. In later years large housing complexes were built.
New residents who moved into the community in the 1960s experienced high rates of unemployment and neighborhood life that was marked by occasional riots and arson. The decade of the1980s marked the beginning of an era of positive change for East New York as a series of economic and housing development projects were successfully launched and in the last decade the crime rate has plummeted.
In the neighborhood of Cypress Hills, the Cypress Hills Local Development Corporation was formed as a nonprofit in May 1983 by a group of activist residents and merchants. The organization has revitalized the Cypress Hills community through economic development with grants to improve retail storefronts; housing preservation by renovating buildings to create affordable housing; and

support for youth and families, including the creation of a community school.
In 1983, property owners, businesses, and other interest groups formed the East Brooklyn Business Improvement District. The nonprofit operates in an area bordered by Powell Street (in Brownsville), East New York Avenue, Atlantic Avenue, Sheffield Avenue, and Sutter Avenue, includes an industrial park featuring businesses engaged in light manufacturing or distribution and a commercial strip on the southern border. The Local Development Corporation of East New York administers the State-designated Empire Zone in East New York, which offers financial incentives and tax credits, including wage tax credits for companies hiring full-time employees in newly created jobs, and utility discounts to businesses located within the zone. The organization also offers entrepreneur programs, including those targeted at women entrepreneurs, to encourage the development of small businesses.
Beginning in the early 1980s, East Brooklyn Congregations, a group made up of more than 30 congregations, constructed nearly 3,000 Nehemiah Houses, two-story, one-family, row homes in East New York and Brownsville. In addition, subsidized housing for the elderly was built, buildings renovated, and owner-occupied houses were created.
The City’s Department of Housing Preservation and Development began disposing of City-owned housing in its portfolio beginning in 1987 and by partnering with local community groups, including East Brooklyn Congregations, helped create thousands of owner-occupied homes in East New York and renovate or build nearly 3,000 rental units.
Also in the 1980s, a new wave of immigrants began moving into East New York from the Dominican Republic, Jamaica, Guyana, Haiti, Honduras, Ecuador, Panama, and Trinidad and Tobago, while Haitian, Jamaican, Indian, Pakistani, Korean and Chinese immigrants settled in Cypress Hills.
In response to the new development in the 1980s and 1990s, a new 14-screen movie theatre opened on Linden Boulevard in 1998.
At the southern end of East New York, Starrett City (currently known as Spring Creek Towers) was built on 153 acres beginning in 1972. The federally assisted housing project features 20,000 residents living in 46 apartment buildings up to 20 stories high, ball fields, and shopping.

In the fall of 2002, the $192 million, 640,000 square foot Gateway Center opened on 48 acres on Fountain Avenue and Belt Parkway on what was previously a landfill. The center includes retail stores such as BJ’s Wholesale Club, Target, Staples, Circuit City, Famous Footwear, Old Navy, Marshall’s, and Bed, Bath & Beyond. The retail development is part of the 227-acre Gateway Estates, a new neighborhood near Spring Creek. HPD is planning a mixed use community that includes up to 2,300 units of housing, two schools, and 45 acres of parkland. In addition, East Brooklyn Congregations is developing 844 Nehemiah housing units in the area.
Development Potential
The City remains an active developer in East New York with Mayor Michael Bloomberg announcing in August 2005 that the City was releasing RFPs for new homes to be built on 248 of the last remaining vacant lots in HPD's portfolio, some of which are in East New York. In November 2005, HPD announced that beginning in 2006, nonprofit developer Restored Homes would buy and begin restoring one-to-three family federally owned properties in Cypress Hills and offer them for sale to qualified families. In addition, the New York City Housing Development Corporation announced in December 2005 that it will create 28 new apartments in six four-story row houses on Malta Street and purchase and rehabilitate two six-story buildings at 272 Pennsylvania Avenue and 2060 Pitkin Avenue with a total of 168 apartments.
Former Met Mo Vaughn announced that his company, Omni New York, would use a $12 million affordable housing loan from the City to buy and renovate 168 units in two apartment buildings at 272 Pennsylvania Avenue and 2060 Pitkin Avenue.
Sources: Brooklyn Economic Development Corporation; Mayor Michael Bloomberg; The Neighborhoods of Brooklyn, Yale University Press, New Haven and London; New York City Department of Housing Preservation and Development; Local Development Corporation of East New York; newyorkbusiness.com, November 22, 2005; Brooklyn Daily Eagle, December 21, 2005; newyorkbuisness.com, December 14, 2005.
Business InformationLocal Development Corporation of East New York, 80 Jamaica Avenue, Brooklyn, NY 11207 P: 718.385.6700, www.ldceny.org/ldceny/
East Brooklyn Business Improvement District, 80 Jamaica Avenue, Brooklyn New York 11207, (718) 385-6700, ext. 109, www.ldceny.org/ldceny/BID/bid.htm

Cypress Hills Local Development Corporation, 625 Jamaica Avenue, Brooklyn, NY 11208-1203, 718-647-2805, http://cypresshills.org/index.php
Political and Community ContactsCommunity Board 16, Thomas Boyland Street, Room 103, Brooklyn, NY 11212, 718-385-0323New York City Council 41, Darlene Mealy, 212-788-7387New York City Council 37, Erik Martin Dilan, 718-642-8664, [email protected] Assembly 55, William Boyland, Jr., 718-498-8681,
http://assembly.state.ny.us/ NYS Senate 18, Velmanette Montgomery, 718-643-6140, [email protected] Congress 10, Edolphus Towns, 718-855-8018,
www.house.gov/towns/ Source: NYC Department of City Planning; NYC Districting Commission, NYPIRG CMAP
LocationThe boundaries of East New York and Cypress Hills are Van Sinderen Avenue, Williams Avenue, and Louisiana Avenue on the west, Jamaica

Avenue on the north, the Queens County line on the east, and Belt Parkway on the south.
East New York Demographics2000 Census Report within a 1.2 mile radius as noted in the map above.
Total Population 158,214
Race/Ethnicity (Total Population)White 3,612 2.3 percentBlack 82,362 52.1 percentNative American 609 0.4 percentAsian 5,236 3.3 percentOther 6,220 3.9 percentHispanic (any race) 60,175 38.0 percent
Sex (Total Population)Male 72,485 45.8 percentFemale 85,729 54.2 percent
Age (Total Population)Age 0 to 4 13,885 8.8 percent
5 to 9 15,706 9.9 percent10 to 20 31,636 20.0 percent21 to 29 20,604 13.0 percent30 to 39 24,044 15.2 percent40 to 49 20,495 13.0 percent50 to 59 14,599 9.2 percent60 to 64 5,584 3.5 percentAge 65+ 11,661 7.4 percent
Education (Population Age 25+)Total population age 25+ 87,370 100 percentLess than 9th grade 14,600 16.7 percent9-12 Grade 22,966 26.3 percentHigh School 25,167 28.8 percentSome College 12,963 14.8 percentAssociate Degree 4,250 4.9 percentBachelor Degree 5,131 5.9 percentGraduate Degree 2,293 2.6 percent
Employment Status (Population Age 16+)Total population age 16+ 110,667 100 percentNot in labor force 54,174 49.0 percentLabor force 56,493 51.0 percent

Labor Force StatusTotal Labor Force Age 16+ 56,493 100 percentArmed Forces 52 0.1 percentCivilian 46,880 83.0 percentUnemployed 9,561 16.9 percent
Employed Civilian OccupationTotal employed civilians,Age 16+ 46,880 100 percentAgriculture 20 0.0 percentConstruction 2,297 4.9 percentEducation 3,161 6.7 percentEntertainment 2,840 6.1 percentF.I.R.E. 3,466 7.4 percentHealth 9,768 20.8 percentManufacturing 3,852 8.2 percentMining 0 0.0 percentOther services 2,795 6.0 percentProf/Tech/Science 3,833 8.2 percentPublic Administration 2,566 5.5 percentRetail 4,583 9.8 percentTrans./Warehouse 4,941 10.5 percentWholesale 1,415 3.0 percent
HouseholdsTotal households 49,612 100 percentFamily households 37,947 76.5 percent
Income (Total Household)Under $10,000 13,699 27.6 percent$10,000-20,000 7,655 15.4 percent$20,000-30,000 7,083 14.3 percent$30,000-40,000 5,913 11.9 percent$40,000-50,000 3,987 8.0 percent$50,000-60,000 3,196 6.4 percent$60,000-75,000 3,155 6.4 percent$75,000-100,000 2,648 5.3 percent$100,000-150,000 1,501 3.0 percent$150,000-200,000 414 0.8 percentOver $200,000 361 0.7 percent
Occupied HousingTotal Occupied Housing 49,314 100 percentOwner Occupied 11,914 24.2 percentRenter Occupied 37,400 75.8 percent

Household Size (Total Occupied)1 person 10,128 20.5 percent2 person 10,854 22.0 percent3 person 9,965 20.2 percent4 person 7,996 16.2 percent5 person 5,523 11.2 percent6 person 2,715 5.5 percentOver 7 person 2,133 4.3 percent
East WilliamsburgThe border between Bushwick and East Williamsburg is getting somewhat fuzzy, and residential areas that decades ago may have been considered part of Williamsburg or Bushwick are being marketed today as part of East Williamsburg. While officially Flushing Avenue is the street that divides the neighborhood, some see it as Myrtle Avenue, while others claim it is Johnson Avenue.
As in the neighboring communities, artists and their shows have arrived hip stores are springing up between the Montrose and Morgan Avenue L subway stops that cater to artists living in the surrounding area.
In spite of the recent surge in housing development, however, large sections of East Williamsburg remain zoned for manufacturing and are part of the State-designated North Brooklyn-Brooklyn Navy Yard Empire Zone, which offers businesses located within the zone financial incentives, and tax credits, including wage tax credits for companies hiring full-time employees in newly created jobs, and utility discounts.
The East Williamsburg Valley Industrial Development Corporation (EWVIDCO) serves as the administrator for the Empire Zone, which includes East Williamsburg In-Place Industrial Park, the Brooklyn Navy Yard, the industrial areas around Pfizer, Domino Sugar, and the Greenpoint Manufacturing & Design Center, and specific commercial corridors including parts of Graham Avenue, Grand Street, Havemeyer Street, Flushing Avenue, and Broadway.
Created in the early 1980s to help stimulate local businesses and help them create and retain jobs, EWVIDCO also is designated as the principal manager of the East Williamsburg Industrial Park, a 650 acre industrial park covering a large section of neighborhood next to the Queens border. The park houses a variety of businesses including firms that produce building and construction materials, metal finishing

and fabrication, home furnishings, engage in distribution and warehousing, printing, wood-related manufacturing, and garment production. The Boricua College Small Business Development Center is located nearby and also supports small businesses by offering seminars, assisting with business plans, and helping identify funding sources.
Development Potential
The areas of East Williamsburg that are zoned residential, like those in neighboring Greenpoint and Williamsburg, have been the site of substantial new housing development in recent years. Young professionals have been attracted to the area by dozens of projects, including sleek, contemporary, luxury condominiums, that have replaced vacant lots and the area’s three-story, vinyl covered homes. In the future, East Williamsburg also should benefit from rezoning along a two-mile section of the Greenpoint and Williamsburg waterfront. The new zoning designation was approved in May 2005 by the New York City Council and will bring new housing developments, a continuous public esplanade, and a new 28-acre park within blocks of East Williamsburg.Source: www.ewvidco.com, New York City Planning Commission; Williamsburg Reinvented, by Anna Bahney, New York Times, March 20, 2005; Village Voice, December 7, 2005. Business Information
North Brooklyn Development Corporation126 Greenpoint Avenue, Brooklyn, NY 11222718-389-9044
East Williamsburg Valley Industrial Development Corporation (EWVIDCO)
Empire Zone Information 11-29 Catherine Street, Brooklyn, NY 11211718-388-7287www.ewvidco.com
Boricua College Small Business Development Center9 Graham Avenue, Brooklyn, NY 11206718-963-4112, ext. 565
Graham Avenue BID/Woodhull Community DMA80 Graham Avenue, Brooklyn, NY 11206718-387-6643
Grand Street District Management Association760 Grand Street, Brooklyn, NY 11211

718-218-8836, www.grandstbklyn.com
Source: NYC Department of Small Business Services, NYC Economic Development Corporation, BEDC, Brooklyn Chamber of Commerce
Political and Community ContactsCommunity Board 1, 435 Graham Avenue, Brooklyn, NY 11211,
718-389-0009New York City Council 34, Diana Reyna, 718-963-3141, [email protected] Assembly 53, Vito J. Lopez, 718-963-7029,
[email protected] Senate 17, Martin Malave Dilan, 718-573-1726, [email protected] Congress 12, Nydia M. Velazquez, 718-599-3658,
www.house.gov/velazquez/ Source: NYC Department of City Planning; NYC Districting Commission, NYPIRG CMAP
LocationEast Williamsburg is bordered by the neighborhoods of Greenpoint, Williamsburg, and Bushwick, and the borough of Queens.
East Williamsburg Demographics

2000 Census Report within a one-mile radius as noted in the map above.
Total Population 92,113
Race/Ethnicity (Total Population)White 28,002 30.4 percentBlack 7,917 8.6 percentNative American 74 0.1 percentAsian 3,768 4.1 percentOther 2,790 3.0 percentHispanic (any race) 49,562 53.8 percent
Sex (Total Population)Male 44,660 48.5 percentFemale 47,453 51.5 percent
Age (Total Population)Age 0 to 4 6,949 7.5 percent
5 to 9 6,967 7.6 percent10 to 20 14,596 15.8 percent21 to 29 15,016 16.3 percent30 to 39 15,078 16.4 percent40 to 49 12,147 13.2 percent50 to 59 8,581 9.3 percent60 to 64 3,252 3.5 percentAge 65+ 9,527 10.3 percent
Education (Population Age 25+)Total population age 25+ 56,965 100 percentLess than 9th grade 13,280 23.3 percent9-12 Grade 13,054 22.9 percentHigh School 14,108 24.8 percentSome College 6,197 10.9 percentAssociate Degree 2,206 3.9 percentBachelor Degree 5,503 9.7 percentGraduate Degree 2,617 4.6 percent
Employment Status (Population Age 16+)Total population age 16+ 70,553 100 percentNot in labor force 33,093 46.9 percentLabor force 37,460 53.1 percent
Labor Force StatusTotal Labor Force Age 16+ 37,460 100 percentArmed Forces 9 0.0 percent

Civilian 32,938 87.9 percentUnemployed 4,513 12.0 percent
Employed Civilian OccupationTotal employed civilians,Age 16+ 32,938 100 percentAgriculture 35 0.1 percentConstruction 2,458 7.5 percentEducation 2,176 6.6 percentEntertainment 3,250 9.9 percentF.I.R.E. 2,452 7.4 percentHealth 3,293 10.0 percentManufacturing 4,435 13.5 percentMining 0 0.0 percentOther services 2,232 6.8 percentProf/Tech/Science 3,332 10.1 percentPublic Administration 1,093 3.3 percentRetail 3,216 9.8 percentTrans./Warehouse 1,971 6.0 percentWholesale 1,468 4.5 percent
HouseholdsTotal households 32,622 100 percentFamily households 20,813 63.8 percent
Income (Total Household)Under $10,000 7,420 22.7 percent$10,000-20,000 5,862 18.0 percent$20,000-30,000 4,942 15.1 percent$30,000-40,000 4,106 12.6 percent$40,000-50,000 2,996 9.2 percent$50,000-60,000 2,130 6.5 percent$60,000-75,000 1,898 5.8 percent$75,000-100,000 1,847 5.7 percent$100,000-150,000 1,028 3.2 percent$150,000-200,000 227 0.7 percentOver $200,000 166 0.5 percent
Occupied HousingTotal Occupied Housing 32,643 100 percentOwner Occupied 4,189 12.8 percentRenter Occupied 28,454 87.2 percent
Household Size (Total Occupied)1 person 8,884 27.2 percent2 person 8,757 26.8 percent
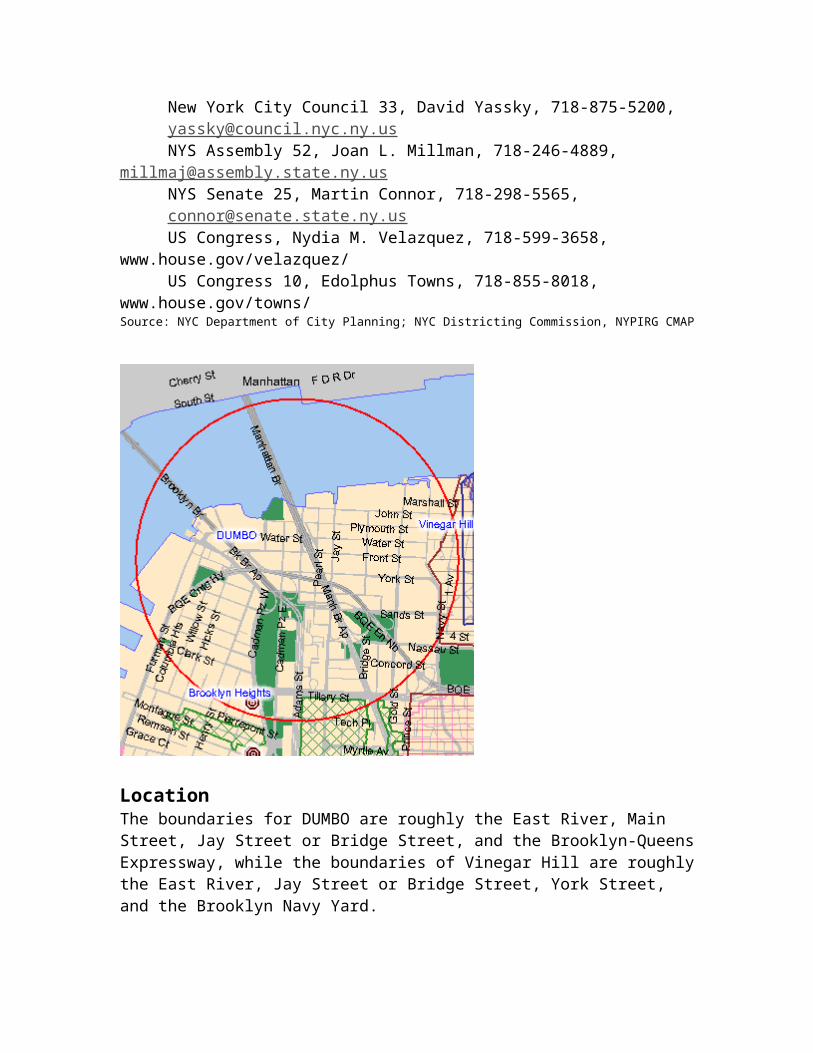
3 person 5,723 17.5 percent4 person 4,461 13.7 percent5 person 2,431 7.4 percent6 person 1,320 4.0 percentOver 7 person 1,067 3.3 percent
Flatbush(Includes Prospect Park South and Ditmas Park)
The neighborhood of Flatbush, framed by Prospect Park on the north and Brooklyn College on the south, is noted for its elegant one- and two-family Victorian homes and shady residential streets in between. In recent years, these homes have been attracting professionals who have ventured beyond the Brownstone neighborhoods to seek wider homes with larger rooms at relatively affordable prices.
Prices have been rising rapidly here, however, and in the historic district of Ditmas Park, which was created within the boundaries of Flatbush in 1902, a three-story, eight-bedroom home was recently advertised for more than $1 million.
Of particular note is the area of Prospect Park South, a community of neo-Tudor, French Revival, Queen Anne, Italian Villa, Colonial Revival, and Mission homes that would fit comfortably in the exclusive neighborhoods of any city in the country. The area’s boundaries are Coney Island Avenue to around East 18th Street from Church Avenue to Beverley Road. By 1905 its residents included business executives from leading firms such as Gillette, Fruit of the Loom, Sperry-Rand, and the Brooklyn Eagle. The neighborhood of single family homes was landmarked in 1979.
The northern edge of Flatbush borders the 585-acre Prospect Park, which was designed in the 1860s by Frederick Law Olmsted and Calvert Vaux, who also designed Central Park, Grand Army Plaza, Eastern Parkway, and Ocean Parkway. In the last 25 years the park has been restored to its original grandeur by a dedicated group of administrators, government officials, volunteers, and donors.
Today Prospect Park is the destination for millions of people annually, including weekend athletes, who walk, jog, roller blade, or bicycle along Park Drive traveling the same route that soldiers in the Continental Army under George Washington took in August 1776 as they battled the British. Children play on the park’s playgrounds and soccer, baseball, and softball fields; picnickers celebrate birthdays and holidays with family and friends; ice skaters take in the fresh air and

exercise at the Wollman Rink; and families visit the Prospect Park Zoo, Carousel, Lefferts Historic House, Picnic House, and Prospect Park Audubon Center & Visitor Center at the Boathouse. The 40-acre Parade Ground within the boundaries of Flatbush features basketball courts, baseball, softball, and soccer fields, and tennis courts.
Brooklyn College, which the Princeton Review called the “most beautiful campus in the country,” opened in 1937 and enrolls 15,000 undergraduate and graduate students. In recent years Brooklyn College opened a new library and began construction on a new building to house a state-of-the-art physical education and athletics facility and consolidate student services in one location. Brooklyn College also is the location for the Brooklyn Center for the Performing Arts, which offers first-rate musical and dance performances throughout the year.
Four- and six-story apartment buildings were built throughout the neighborhood between 1920 and 1940 and retail shops are found on the major commercial corridors of Coney Island Avenue, Flatbush Avenue, and Church Avenue.
The community’s Dutch heritage can be found at the Flatbush Reformed Dutch Church, a New York City landmark built in 1798 at 890 Flatbush Avenue. The site has been used for religious celebrations since 1654.
In recent decades the area has benefited from an influx of immigrants from Haiti, Jamaica, Guyana, Trinidad and Tobago, Grenada, Panama, Barbados, St. Vincent and the Grenadines, the Dominican Republic, Pakistan, Afghanistan, Cambodia, Korea, Central America, and the former Soviet Union.
Area high schools include Midwood High School, the high school from which Woody Allen graduated; Erasmus Hall, which was founded as Erasmus Hall Academy in 1786 and includes Neil Diamond, Barry Manilow, and Barbra Streisand among its graduates; and Edward R. Murrow High School in Midwood.
From 1913 to 1957, before moving to Los Angeles, the legendary Brooklyn Dodgers played in Ebbets Field in what we now call Crown Heights but old-timers might refer to as Flatbush. On the site where Jackie Robinson, Roy Campanella, Duke Snider, and Pee Wee Reese once played, an apartment complex, the Ebbets Field Houses was built between 1960 and 1962 at Bedford Avenue and Sullivan Place. The only remnant of Dodger glory can be found in the Dodger memorabilia

in the McDonald’s on Empire Boulevard, and a nearby elementary school named after Jackie Robinson.
Development PotentialMany residents from Prospect Park South continue drive to nearby commercial areas in neighborhoods such as Park Slope for shopping, however, Flatbush Avenue and the streets surrounding the Brooklyn College campus are filled with major fast food restaurants, a book store, Canal Jean Company, Radio Shack and other well-known retail stores that cater to the student population. New development is taking place at Avenue I and Nostrand Avenue, and major retailers, such as Target, Starbucks, Modell’s Sporting Goods, have recognized the area’s potential and are reportedly looking for space. In addition, Sears is located off Flatbush Avenue on Beverley Road and Staples is located at Flatbush and Tilden Avenue.
Sources: The Neighborhoods of Brooklyn, Yale University Press, New Haven and London; Prospect Park; Brooklyn College; New York Times, January 1, 2006; Daily News, July 20, 2005.
Business InformationFlatbush Development Corporation, 1616 Newkirk Avenue, Brooklyn, NY 11226718-859-3800
Church Avenue Merchants & Business Association, 1720 Church Avenue, Brooklyn, NY 11226, 718-282-2500
Political and Community ContactsCommunity Board 14, 1306 Avenue H, Brooklyn, NY, 11230,
718-859-6357NYC Council 40, Yvette Clarke, 718-287-8762,
[email protected] Council 45, Kendall Stewart, 718-951-8177,
[email protected] Assembly 44, James F. Brennan, 718-788-7221,
[email protected] Assembly 42, Rhoda S. Jacobs, 718-434-0446,
[email protected] Senate 20, Carl Andrews, 718-284-4700,
[email protected] Senate 21, Kevin S. Parker, 718-629-6401,
[email protected] Congress 10, Edolphus Towns, 718-855-8018,
www.house.gov/towns/

US Congress 11, Major Owens, 718-773-3100, www.house.gov/owens/ Source: NYC Department of City Planning; NYC Districting Commission, NYPIRG CMAP
LocationThe boundaries of Flatbush are roughly from Coney Island Avenue on the west, to Rogers and Flatbush Avenues on the east, from Parkside Avenue on the north, to Avenue H on the south. Flatbush Demographics2000 Census Report within a .80 mile radius as noted in the map above.
Total Population 135,701 100 percent
Race/Ethnicity (Total Population)White 22,309 16.4 percentBlack 79,073 58.3 percentNative American 191 0.1 percentAsian 7,443 5.5 percentOther 7,947 5.9 percentHispanic (any race) 18,738 13.8 percent
Sex (Total Population)Male 62,232 45.9 percent

Female 73,469 54.1 percent
Age (Total Population)Age 0 to 4 10,557 7.8 percent
5 to 9 11,502 8.5 percent10 to 20 23,111 17.0 percent21 to 29 18,501 13.6 percent30 to 39 21,110 15.6 percent40 to 49 21,560 15.9 percent50 to 59 13,346 9.8 percent60 to 64 5,018 3.7 percentAge 65+ 10,996 8.1 percent
Education (Population Age 25+)Total population age 25+ 82,306 100 percentLess than 9th grade 9,094 11.0 percent9-12 Grade 16,828 20.4 percentHigh School 22,476 27.3 percentSome College 13,022 15.8 percentAssociate Degree 5,474 6.7 percentBachelor Degree 9,136 11.1 percentGraduate Degree 6,276 7.6 percent
Employment Status (Population Age 16+)Total population age 16+ 100,896 100 percentNot in labor force 39,690 39.3 percentLabor force 61,206 60.7 percent
Labor Force StatusTotal Labor Force Age 16+ 61,206 100 percentArmed Forces 24 0.0 percentCivilian 53,677 87.7 percentUnemployed 7,505 12.3 percent
Employed Civilian OccupationTotal employed civilians,Age 16+ 53,677 100 percentAgriculture 28 0.1 percentConstruction 2,966 5.5 percentEducation 3,954 7.4 percentEntertainment 3,730 6.9 percentF.I.R.E. 4,891 9.1 percentHealth 12,437 23.2 percentManufacturing 2,916 5.4 percentMining 10 0.0 percentOther services 3,530 6.6 percent

Prof/Tech/Science 4,768 8.9 percentPublic Administration 2,002 3.7 percentRetail 5,061 9.4 percentTrans./Warehouse 4,434 8.3 percentWholesale 1,121 2.1 percent
HouseholdsTotal households 45,422 100 percentFamily households 32,839 72.3 percent
Income (Total Household)Under $10,000 8,346 18.4 percent$10,000-20,000 6,784 14.9 percent$20,000-30,000 6,759 14.9 percent$30,000-40,000 5,539 12.2 percent$40,000-50,000 4,419 9.7 percent$50,000-60,000 3,489 7.7 percent$60,000-75,000 3,546 7.8 percent$75,000-100,000 3,271 7.2 percent$100,000-150,000 2,181 4.8 percent$150,000-200,000 606 1.3 percentOver $200,000 482 1.1 percent
Occupied HousingTotal Occupied Housing 45,577 100 percentOwner Occupied 7,079 15.5 percentRenter Occupied 38,498 84.5 percent
Household Size (Total Occupied)1 person 10,491 23.0 percent2 person 11,232 24.6 percent3 person 8,898 19.5 percent4 person 6,966 15.3 percent5 person 4,159 9.1 percent6 person 2,206 4.8 percentOver 7 person 1,625 3.6
percent
FlatlandsFlatlands is a quiet, well-maintained, middle class community primarily consisting of two-story detached, semi-detached, and attached homes covered in brick, vinyl siding, and stucco that also

possess rare but highly desired amenities in Brooklyn—driveways and garages.
In the 1830s, Flatlands was a small, agricultural community with 700 people, but the extension of horse car services to Kings Highway in 1875 and the completion of Flatbush Avenue encouraged some population growth. After the Flatbush Avenue streetcars were electrified in 1893, developers began offering new homes, and after Kings Highway was extended past Flatbush, brick row houses with garages were built. The IRT Subway line stops at Flatbush and Nostrand Avenues, but Flatlands residents can reach it by bus, and the Belt Parkway, which was extended around 1940, is a 15 minute drive away. Beginning in the late 1950s, Futurama homes, new attached, brick homes with driveways and garages, were developed.
Initially Jewish, Italian, and Irish residents lived in Flatlands, beginning in the 1980s immigrants from Jamaica, Haiti, Guyana moved into the community, and in recent years Orthodox Jews arrived.
Of historic interest is the Hendrick I. Lott House, a Dutch Colonial home built around 1720. The New York City landmark has attracted students from Brooklyn College and the Science, Technology, and Research High School, who have conducted excavations to find evidence of Brooklyn’s agrarian history.
The John and Altje Baxter House, also known as the Stoothoff-Baxter-Kouwenhoven House, is a landmark. Located on East 48th Street, part of the house was built in 1747, and the main house was built about 1811. Another New York City landmark, the Joost and Elizabeth Van Nuyse House, is located at 1128 East 34th Street. The Flatlands Dutch Reformed Church was founded in 1654 at the corner of Kings Highway and East 40th Street. The current and third church built on the site was constructed in 1848 and is New York City landmark. The church also has a graveyard in which notable Dutch families are buried.
Development Potential
Local businesses operating along Flatbush, Flatlands, and Utica Avenues feature retail shopping, and outdoor malls are located on Ralph Avenue. Flatlands is a block from Kings Plaza Shopping Center and Marina, located at Flatbush Avenue and Avenue U in Mill Basin, which offers bookstores, Macy’s, Sears, Home Depot, local and chain retail stores, movies and boat slips.
Sources: The Neighborhoods of Brooklyn, Yale University Press, New Haven and London; New York Times, February 1, 2004; Brooklyn Daily Eagle, July 25, 2005.

Political and Community ContactsCommunity Board 18, 5715 Avenue H, Brooklyn, NY, 11234,
718-241-0422NYC Council 46, Lewis A. Fidler, 718-241-9330,
[email protected] Assembly 59, Frank R. Seddio, 718-968-2770,
[email protected] Senate 27, Carl Kruger, 718-743-8610,
[email protected] Congress 10, Edolphus Towns, 718-855-8018,
www.house.gov/towns/ Source: NYC Department of City Planning; NYC Districting Commission, NYPIRG CMAP
LocationThe boundaries of Flatlands are roughly Nostrand Avenue, Ralph Avenue, Avenue H to Flatlands Avenue between Nostrand and Flatbush Avenues, and Avenue T between Flatbush and Ralph Avenues.
Flatlands Demographics2000 Census Report within a .85 mile radius as noted in the map above.
Total Population 72,394

Race/Ethnicity (Total Population)White 14,872 20.5 percentBlack 47,493 65.6 percentNative American 90 0.1 percentAsian 1,845 2.5 percentOther 2,499 3.5 percentHispanic (any race) 5,595 7.7 percent
Sex (Total Population)Male 32,261 44.6 percentFemale 40,133 55.4 percent
Age (Total Population)Age 0 to 4 4,762 6.6 percent
5 to 9 5,334 7.4 percent10 to 20 12,850 17.8 percent21 to 29 9,021 12.5 percent30 to 39 10,190 14.1 percent40 to 49 11,500 15.9 percent50 to 59 8,582 11.9 percent60 to 64 2,922 4.0 percentAge 65+ 7,233 10.0 percent
Education (Population Age 25+)Total population age 25+ 45,436 100 percentLess than 9th grade 3,267 7.2 percent9-12 Grade 6,632 14.6 percentHigh School 12,874 28.3 percentSome College 8,677 19.1 percentAssociate Degree 3,984 8.8 percentBachelor Degree 6,730 14.8 percentGraduate Degree 3,272 7.2 percent
Employment Status (Population Age 16+)Total population age 16+ 54,978 100 percentNot in labor force 20,472 37.2 percentLabor force 34,506 62.8 percent
Labor Force StatusTotal Labor Force Age 16+ 34,506 100 percentArmed Forces 13 0.0 percentCivilian 31,578 91.5 percentUnemployed 2,915 8.4 percent
Employed Civilian OccupationTotal employed civilians,

Age 16+ 31,578 100 percentAgriculture 6 0.0 percentConstruction 1,151 3.6 percentEducation 2,912 9.2 percentEntertainment 1,248 4.0 percentF.I.R.E. 3,523 11.2 percentHealth 7,831 24.8 percentManufacturing 1,107 3.5 percentMining 0 0.0 percentOther services 1,743 5.5 percentProf/Tech/Science 2,901 9.2 percentPublic Administration 1,967 6.2 percentRetail 2,622 8.3 percentTrans./Warehouse 2,903 9.2 percentWholesale 610 1.9 percent
HouseholdsTotal households 23,639 100 percentFamily households 18,165 76.8 percent
Income (Total Household)Under $10,000 2,770 11.7 percent$10,000-20,000 2,272 9.6 percent$20,000-30,000 2,550 10.8 percent$30,000-40,000 2,408 10.2 percent$40,000-50,000 2,344 9.9 percent$50,000-60,000 2,327 9.8 percent$60,000-75,000 2,655 11.2 percent$75,000-100,000 2,988 12.6 percent$100,000-150,000 2,490 10.5 percent$150,000-200,000 566 2.4 percentOver $200,000 269 1.1 percent
Occupied HousingTotal Occupied Housing 23,914 100 percentOwner Occupied 13,052 54.6 percentRenter Occupied 10,862 45.4 percent
Household Size (Total Occupied)1 person 4,888 20.4 percent2 person 5,772 24.1 percent3 person 4,795 20.1 percent4 person 3,963 16.6 percent5 person 2,558 10.7 percent6 person 1,164 4.9 percentOver 7 person 774 3.2 percent

Fort Greene
The Brooklyn Academy of Music, Mark Morris Dance Group, Fort Greene Park, Long Island College University, Brooklyn Technical High School, Brooklyn Hospital Center, the Atlantic Avenue Terminal transportation hub connecting the LIRR to major subway lines, shops at Atlantic Center and Atlantic Avenue Mall, the 512-foot tall Williamsburgh Savings Bank Tower, which is being converted to condominiums, trendy restaurants, and genteel blocks of historic homes dating from the mid-19th Century can all be found within the borders of Fort Greene.
Although a small neighborhood geographically, Fort Greene is exploding with energy and ideas that are being implemented with pride by individuals associated with its numerous active neighborhood, arts, and business development groups. In recent years, the Myrtle Avenue Brooklyn Partnership responded to requests by local residents to revitalize Myrtle Avenue and recruited restaurants, coffee shops, and other new businesses residents wanted along the commercial corridor, and the BAM Local Development Corporation continues to fulfill its mission to create a vibrant, mixed-use multicultural arts district in the blocks surrounding the Brooklyn Academy of Music.
Within the district, across the street from the Brooklyn Academy of Music, the Brooklyn Public Library is building the 110,000 square foot Visual & Performing Arts Library, which will provide Brooklyn's growing arts community and the general public with free access to arts resources, and another group is building a 299-seat theater. In addition, a formerly vacant, 30,000 square foot building at Hanson Place and South Portland Avenue has been converted into 80 Arts—The James E. Davis Arts Building for nonprofit arts and arts service groups.
The 30-acre Fort Greene Park designed by Frederick Law Olmsted and Calvert Vaux and completed in the mid-19th Century is defined by the Prison Ship Martyrs’ Monument, a 148-foot Doric column designed by architects from McKim, Mead, and White and dedicated in 1908 as a tribute to patriots who died on the British prison ships in Wallabout Bay during the American Revolution. The remains of 11,000 prisoners were transferred to a crypt beneath the monument, which overlooks the bay where the Americans died. The park also features a playground and tennis courts.

The entire neighborhood of Fort Greene is listed on the National and New York State Registry of Historic Places, and is designated as a New York City Historic District. Fort Greene is rich in African-American history and culture and includes the former Hanson Place Baptist Church at 88 Hanson Place, which was an Underground Railroad station in the 1850s; the Carlton Avenue home of novelist Richard Wright, who wrote Native Son in Fort Greene Park; the home of musicians Wynton and Branford Marsalis and filmmaker Spike Lee, who’s used Fort Greene as a setting for many of the films he’s directed.
The 255-acre Brooklyn Navy Yard nearby was run by the U.S. Navy from 1801 to 1966 and at its peak during World War II employed more than 70,000 workers. Today it’s an industrial park filled with hundreds of small businesses including artist studios, a ship repair business, and on a 15-acre site a new enterprise, Steiner Studios, a 280,000 square foot Hollywood-style, full-service, state-of-the-art “production factory” equipped for start-to-finish production of major motion pictures, independent films, television, music videos and broadcast commercials.
Development Potential
Local development corporations operating in Fort Greene have rolled out a welcome mat for arts organizations seeking space and retailers and restaurants seeking new markets. In some cases representatives from these organizations have actively encouraged new organizations and businesses to move into the area, and entrepreneurs are finding an enthusiastic audience for their products and services.
The Pratt Area Community Council, which has been involved in economic development on Fulton Street since 1997, recently conducted a needs assessment for Fulton Street and found that local residents are eager for new businesses. To spur development, the Pratt Area Community Council is seeking to establish the Fulton Street Business Improvement District (BID) along the Fort Greene and Clinton Hill sections of Fulton Street.
The Downtown Brooklyn Plan was approved by the City Council in August 2004 to promote residential and retail development on the border of Fort Greene along Flatbush Avenue, which will complement the development of Class A commercial development that has already taken place on the other side of Flatbush Avenue at Metrotech and will continue as other commercial properties are built as part of the plan.

Since the zoning change, the following projects have been announced: A proposal to build a 400-foot-high, 500 unit condominium or
luxury rental development with ground floor commercial space at Flatbush and Myrtle Avenues;
A property owner announced plans to build structures on parcels on Myrtle between Flatbush and Prince;
A developer recently bought a block of properties on Myrtle Avenue between Gold and Prince Streets;
One residential building is planned for Johnson and Gold Streets, and another at Johnson and Flatbush Avenue Extension, for a total of 170 units.
The Pratt Area Community Council plans to build affordable housing on Ashland Place using federal housing tax credits;
A developer is planning a luxury condominium project on Fulton Street and Ashland Place;
A 12-story, 27-unit, luxury condominium development opened last fall at 383 Carlton Avenue.
Across the street from Fort Greene’s border at the intersection of Flatbush and Atlantic Avenues is the site of the proposed 18,000 seat arena for the Nets basketball team, which would make the Brooklyn Nets the first major league professional team to play in the borough since the Brooklyn Dodgers left in the 1950s. Forest City Ratner Companies, which has developed retail malls and shops and a commercial building on other corners of the intersection, purchased the Atlantic/Vanderbilt Railroad Yards from the Metropolitan Transit Authority in September 2005. The firm has proposed building the arena and 17 high rise buildings consisting of more than 4,000 units of market-rate and affordable housing and commercial and retail development on a 21-acre site along Atlantic Avenue from Flatbush Avenue to Vanderbilt Avenue. The project is now subject to the review and approval of a series of government entities.
Sources: www.myrtleave.org, www.bam.org, Brooklyn Chamber of Commerce, New York City Department of City Planning, The Neighborhoods of Brooklyn, Yale University Press, New Haven and London, An Architectural Guidebook to Brooklyn, Gibbs-Smith Publisher, Salt Lake City, A Journey through the City of Dream’s, Universe Publishing, New York, NY; Crain’s, December 19, 2005, January 9, 2006; Brooklyn Daily Eagle, October 5, 2005, November 9, 2005, November 21, 2005, January 11, 2006.
Business InformationMyrtle Avenue Brooklyn Partnership (comprised of the Myrtle Avenue Revitalization Project Local Development Corporation, and Myrtle Avenue Brooklyn Business Improvement District), 472 Myrtle Avenue, 2nd Fl, Brooklyn, NY 11205, 718.230.1689, www.myrtleave.org

BAM Local Development Corporation, 80 Hanson Place, Brooklyn, NY 11217718-907-4400, www.bamculturaldistrict.org
Downtown Brooklyn Council, 25 Elm Place, Suite 200, Brooklyn, NY 11201Tel. 718 875-5300, www.ibrooklyn.com
Pratt Area Community Council, 1224 Bedford Avenue, Brooklyn, NY 11216718-783-3549, www.prattarea.org
Fulton Area Business Association, 201 Dekalb Ave, Brooklyn, NY 11205
718-522-2613, www.fultonareabusiness.org Political and Community Contacts
Community Board 2, 350 Jay Street, 8th Floor, Brooklyn, NY 11201, 718-596-5410
New York City Council 35, Letitia James, 718-260-9191, [email protected] Assembly 57, Roger L. Green, 718-596-0100,
[email protected] Senate 18, Velmanette Montgomery, 718-643-6140, [email protected] Congress 10, Edolphus Towns, 718-855-8018,
www.house.gov/towns/ Source: NYC Department of City Planning; NYC Districting Commission, NYPIRG CMAP

Location Fort Greene is bordered roughly by the Brooklyn Navy Yard and Nassau Street, although some consider Myrtle Avenue its northern border, Flatbush Avenue, Atlantic Avenue, and Vanderbilt Avenue.
Fort Greene Demographics2000 Census Report within a .40 mile radius as noted in the map above.
Total Population 19,316
Race/Ethnicity (Total Population)White 4,501 23.3 percentBlack 10,261 53.1 percentNative American 37 0.2 percentAsian 658 3.4 percentOther 928 4.8 percentHispanic (any race) 2,931 15.2 percent
Sex (Total Population)Male 8,806 45.6 percentFemale 10,510 54.4 percent

Age (Total Population)Age 0 to 4 1,301 6.7 percent
5 to 9 722 3.7 percent10 to 20 2,048 10.6 percent21 to 29 3,975 20.6 percent30 to 39 3,964 20.5 percent40 to 49 2,855 14.8 percent50 to 59 2,202 11.4 percent60 to 64 586 3.0 percentAge 65+ 1,663 8.6 percent
Education (Population Age 25+)Total population age 25+ 13,886 100 percentLess than 9th grade 975 7.0 percent9-12 Grade 1,193 8.6 percentHigh School 2,511 18.1 percentSome College 2,171 15.6 percentAssociate Degree 587 4.2 percentBachelor Degree 3,710 26.7 percentGraduate Degree 2,739 19.7 percent
Employment Status (Population Age 16+)Total population age 16+ 16,332 100 percentNot in labor force 5,570 34.1 percentLabor force 10,762 65.9 percent
Labor Force StatusTotal Labor Force Age 16+ 10,762 100 percentArmed Forces 12 0.1 percent
Civilian 9,860 91.6 percentUnemployed 890 8.3 percent
Employed Civilian OccupationTotal employed civilians,Age 16+ 9,860 100 percentAgriculture 0 0.0 percentConstruction 177 1.8 percentEducation 1,013 10.3 percentEntertainment 709 7.2 percentF.I.R.E. 1,223 12.4 percentHealth 926 9.4 percentManufacturing 297 3.0 percentMining 0 0.0 percentOther services 536 5.4 percentProf/Tech/Science 1,824 18.5 percentPublic Administration 651 6.6 percent

Retail 834 8.5 percentTrans./Warehouse 492 5.0 percentWholesale 177 1.8 percent
HouseholdsTotal households 8,565 100 percentFamily households 3,487 40.7 percent
Income (Total Household)Under $10,000 1,237 14.4 percent$10,000-20,000 774 9.0 percent$20,000-30,000 973 11.4 percent$30,000-40,000 984 11.5 percent$40,000-50,000 832 9.7 percent$50,000-60,000 738 8.6 percent$60,000-75,000 849 9.9 percent$75,000-100,000 875 10.2 percent$100,000-150,000 827 9.7 percent$150,000-200,000 261 3.0 percentOver $200,000 215 2.5 percent
Occupied HousingTotal Occupied Housing 8,564 100
percentOwner Occupied 1,885 22.0 percentRenter Occupied 6,679 78.0 percent
Household Size (Total Occupied)1 person 3,824 44.7 percent2 person 2,498 29.2 percent3 person 1,158 13.5 percent4 person 567 6.6 percent5 person 279 3.3 percent6 person 144 1.7 percentOver 7 person 94 1.1 percent
Gerritsen Beach
Construction on one-story, summer bungalows in Gerritsen Beach started in the 1920s when Irish-Americans began using the community as summer resort. The homes were built on small lots―40- by 45-foot lots or smaller―and later winterized and expanded. Larger two-story houses with backyards also were constructed in the area, and by the 1930s, more than 1,500 homes had been built in the neighborhood. In

recent years co-ops have been constructed on the northern border next to the community of Marine Park.
The close knit neighborhood, which some compare to a New England fishing village, is surrounded by Shell Bank Creek, Plumb Beach Channel, and Marine Park, and motorists gain access to the isolated peninsula via Gerritsen Avenue. Traditionally, turnover of the homes in Gerritsen Beach has been low. It isn’t unusual for houses to be passed down from generation to generation, or for several generations of the same family to remain in the community.
Tamaqua Bar and Marina is a neighborhood institution that dates from the 1920s. Most of the commercial activity, however, is limited to Gerritsen Avenue, and the new Gerritsen Beach Branch of the Brooklyn Public Library is located at Gerritsen and Channel Avenues.
Local activities revolve around the water, with swimming, boating, and fishing popular with all ages. The neighborhood offers four yacht clubs to accommodate rowboats, motorboats, sailboards, and sailboats. Kiddie Beach, which was created by the Gerritsen Beach Property Owners Association in 1965, is open to residents and has a concession stand, lifeguards, a stage for summer performances, and is the site of the annual July 1 parade.
Sources: The Neighborhoods of Brooklyn, Yale University Press, New Haven and London; New York Times, March 3, 2002; www.gerritsenmemories.com.
Political and Community ContactsCommunity Board 15, Kingsboro College, 2001 Oriental Boulevard, Brooklyn, NY 11235, 718-332-3008NYC Council 46, Lewis A. Fidler, 718-241-9330,
[email protected] Assembly 41, Helene E. Weinstein, 718-648-4700, [email protected] Senate 22, Martin J. Golden, 718-238-6044, [email protected] Congress 9, Anthony Weiner, 718-520-9001,
www.house.gov/weiner/ Source: NYC Department of City Planning; NYC Districting Commission, NYPIRG CMAP

Location
The boundaries of Gerritsen Beach are Knapp Street and Shell Bank Creek, Burnett Street and Gerritsen Avenue, Avenue U, to the Plumb Beach Channel.
Gerritsen Beach Demographics
2000 Census Report within a .75 radius as noted in the map above.
Total Population 20,515 100 percent
Race/Ethnicity (Total Population)White 16,125 78.6 percentBlack 1,812 8.8 percentNative American 21 0.1 percentAsian 759 3.7 percentOther 276 1.3 percentHispanic (any race) 1,522 7.4 percent
Sex (Total Population)Male 9,247 45.1 percentFemale 11,268 54.9 percent

Age (Total Population)Age 0 to 4 908 4.4 percent
5 to 9 1,189 5.8 percent10 to 20 2,570 12.5 percent21 to 29 1,889 9.2 percent30 to 39 2,720 13.3 percent40 to 49 3,142 15.3 percent50 to 59 2,598 12.7 percent60 to 64 1,060 5.2 percentAge 65+ 4,439 21.6 percent
Education (Population Age 25+)Total population age 25+ 14,930 100 percentLess than 9th grade 995 6.7 percent9-12 Grade 2,178 14.6 percentHigh School 4,552 30.5 percentSome College 2,937 19.7 percentAssociate Degree 996 6.7 percentBachelor Degree 1,977 13.2 percentGraduate Degree 1,295 8.7 percent
Employment Status (Population Age 16+)Total population age 16+ 16,915 100 percentNot in labor force 8,290 49.0 percentLabor force 8,625 51.0 percent
Labor Force StatusTotal Labor Force Age 16+ 8,625 100 percentArmed Forces 0 0.0 percent
Civilian 7,978 92.5 percentUnemployed 647 7.5 percent
Employed Civilian OccupationTotal employed civilians,Age 16+ 7,978 100 percentAgriculture 0 0.0 percentConstruction 381 4.8 percentEducation 1,022 12.8 percentEntertainment 267 3.3 percentF.I.R.E. 912 11.4 percentHealth 1,201 15.1 percentManufacturing 391 4.9 percentMining 0 0.0 percentOther services 377 4.7 percentProf/Tech/Science 776 9.7 percent

Public Administration 624 7.8 percentRetail 747 9.4 percentTrans./Warehouse 799 10.0 percentWholesale 177 2.2 percent
HouseholdsTotal households 8,466 100 percentFamily households 5,472 64.6 percent
Income (Total Household)Under $10,000 1,264 14.9 percent$10,000-20,000 1,046 12.4 percent$20,000-30,000 1,020 12.0 percent$30,000-40,000 944 11.2 percent$40,000-50,000 870 10.3 percent$50,000-60,000 669 7.9 percent$60,000-75,000 731 8.6 percent$75,000-100,000 1,055 12.5 percent$100,000-150,000 611 7.2 percent$150,000-200,000 157 1.9 percentOver $200,000 99 1.2 percent
Occupied HousingTotal Occupied Housing 8,478 100 percentOwner Occupied 4,579 54.0 percentRenter Occupied 3,899 46.0 percent
Household Size (Total Occupied)1 person 2,740 32.3 percent2 person 2,702 31.9 percent3 person 1,350 15.9 percent4 person 1,062 12.5 percent5 person 420 5.0 percent6 person 116 1.4 percentOver 7 person 88 1.0 percent
Gravesend
Lady Deborah Moody is the founder of Gravesend, which in the 17th Century was made up of the present neighborhood of Gravesend, Coney Island, Sheepshead Bay, Bensonhurst, Brighton Beach, and Manhattan Beach. A wealthy widow and the leader of Anabaptists who settled the community in 1643, Lady Moody became the first woman to charter land in the New World in 1645.

Gravesend also held the distinction of being the only English settlement in Brooklyn, but was organized under Dutch law and allowed freedom of worship and self-government. It became a haven for Quakers in the 1650s. Lady Moody’s home is still standing at 1875 Gravesend Neck Road, and the 1.6 acre Gravesend Cemetery at McDonald Avenue and Gravesend Neck Road is the oldest cemetery owned by New York City.
Although tourists flocked to the seaside neighborhoods of south Brooklyn in the 19th Century, the neighborhood of Gravesend remained rural and undeveloped until the 1890s when the opening of additional rail lines spurred residential development. Initially a large Italian-American community settled in the area, and in recent decades Russian, Indian, and Haitian immigrants and families of Asian and Irish descent have moved into the community.
The area features single-family homes that were primarily built after the 1920s; three- and four-family houses; some apartment buildings, with larger buildings on Ocean Parkway and Coney Island Avenue; and the Marlboro Houses, a housing project.
L&B Pizza’s Spumoni Gardens, which opened in 1939, is a neighborhood institution and operates at 2725 86th Street with lots of outdoor seating to accommodate local residents and Little League players after a tough game of baseball on the fields nearby.
Sources: The Neighborhoods of Brooklyn, Yale University Press, New Haven and London.
Business Information
Bay Ridge/Bensonhurst Preservation Alliance9201 Fourth Avenue, Brooklyn, NY 11209718-491-1705
Source: NYC Department of Small Business Services, NYC Economic Development Corporation, BEDC, Brooklyn Chamber of Commerce.
Political and Community ContactsCommunity Board 11, 2214 Bath Avenue, Brooklyn, NY 11214, 718-266-8800New York City Council 47, Domenic M. Recchia, Jr., [email protected] Assembly 47, William Colton, 718-236-1598,

NYS Senate 22, Martin J. Golden, 718-238-6044, [email protected] Congress 13, Vito Fossella, 718-356-8400,
www.house.gov/fossella/ Source: NYC Department of City Planning; NYC Districting Commission, NYPIRG CMAP
Location
The boundaries of Gravesend are Bay Parkway and Belt or Shore Parkway, Ocean Parkway, and Avenue P.
Gravesend Demographics2000 Census Report within a .85 radius as noted in the map above.
Total Population 76,087
Race/Ethnicity (Total Population)White 47,517 62.5 percentBlack 2,692 3.5 percentNative American 131 0.2 percentAsian 15,433 20.3 percentOther 2,174 2.9 percent

Hispanic (any race) 8,140 10.7 percent
Sex (Total Population)Male 35,854 47.1 percentFemale 40,233 52.9 percent
Age (Total Population)Age 0 to 4 4,326 5.7 percent
5 to 9 4,398 5.8 percent10 to 20 10,008 13.2 percent21 to 29 9,669 12.7 percent30 to 39 11,458 15.1 percent40 to 49 10,936 14.4 percent50 to 59 8,755 11.5 percent60 to 64 3,555 4.7 percentAge 65+ 12,982 17.1 percent
Education (Population Age 25+)Total population age 25+ 53,124 100 percentLess than 9th grade 8,360 15.7 percent9-12 Grade 8,495 16.0 percentHigh School 16,188 30.5 percentSome College 6,304 11.9 percentAssociate Degree 3,397 6.4 percentBachelor Degree 6,876 12.9 percentGraduate Degree 3,504 6.6 percent
Employment Status (Population Age 16+)Total population age 16+ 62,024 100 percentNot in labor force 31,637 51.0 percentLabor force 30,387 49.0 percent
Labor Force StatusTotal Labor Force Age 16+ 30,387 100 percentArmed Forces 40 0.1 percent
Civilian 28,110 92.5 percentUnemployed 2,237 7.4 percent
Employed Civilian OccupationTotal employed civilians,Age 16+ 28,110 100 percentAgriculture 13 0.0 percentConstruction 1,594 5.7 percentEducation 2,455 8.7 percentEntertainment 2,346 8.3 percentF.I.R.E. 3,382 12.0 percent

Health 3,286 11.7 percentManufacturing 2,749 9.8 percentMining 9 0.0 percentOther services 1,436 5.1 percentProf/Tech/Science 2,669 9.5 percentPublic Administration 874 3.1 percentRetail 2,843 10.1 percentTrans./Warehouse 2,470 8.8 percentWholesale 1,088 3.9 percent
HouseholdsTotal households 28,069 100 percentFamily households 19,988 71.2 percent
Income (Total Household)Under $10,000 4,897 17.4 percent$10,000-20,000 4,970 17.7 percent$20,000-30,000 3,435 12.2 percent$30,000-40,000 3,035 10.8 percent$40,000-50,000 2,584 9.2 percent$50,000-60,000 2,125 7.6 percent$60,000-75,000 2,388 8.5 percent$75,000-100,000 2,203 7.8 percent$100,000-150,000 1,734 6.2 percent$150,000-200,000 459 1.6 percentOver $200,000 239 0.9 percent
Occupied HousingTotal Occupied Housing 28,096 100 percentOwner Occupied 9,269 33.0 percentRenter Occupied 18,827 67.0 percent
Household Size (Total Occupied)1 person 7,312 26.0 percent2 person 8,216 29.2 percent3 person 5,169 18.4 percent4 person 3,984 14.2 percent5 person 1,982 7.1 percent6 person 858 3.1 percentOver 7 person 575 2.0 percent
Greenpoint

The rise of Greenpoint mirrors the rise of industrialization in the United States. Beginning in the mid-19th Century firms based in Greenpoint manufactured China, porcelain pottery, and glass; built ships including the USS Monitor, the ironclad ship that served in the Civil War, the caissons for the Brooklyn Bridge, boilers and steam engines for the oil and gas industry, and engaged in metalworking, brewing, printing, and pharmaceutical production. Oil and gas properties were prominent in the community and dozens of refineries operated in the area including those of Astral Oil, which was owned by Charles Pratt, a leading Brooklyn businessman, civic leader, and founder of the Pratt Institute. Astral later merged with Standard Oil. Greenpoint was one of New York City’s most important industrial centers for nearly 100 years until the 1950s when truck transportation and the Interstate Highway System eliminated the need for manufacturers to use waterfront locations as distribution points. The Greenpoint Manufacturing and Design Center (GMDC), a nonprofit industrial developer, has sought to revive Greenpoint’s industrial base and jobs by rehabilitating five vacant North Brooklyn manufacturing buildings for small manufacturers between 1992 and 2001. The buildings have provided a half a million square feet of space for more than 100 firms, including woodworkers, furniture makers, finishers, painters, sculptors, metal workers, a glass blower, and others.
The East Williamsburg Valley Industrial Development Corporation (EWVIDCO) serves as the administrator for the State-designated North Brooklyn-Brooklyn Navy Yard Empire Zone, which offers financial and tax incentives to businesses located within the Empire Zone. The Empire Zone includes the Greenpoint Manufacturing & Design Center, East Williamsburg In-Place Industrial Park, the Brooklyn Navy Yard, the industrial areas around Pfizer, Domino Sugar, and specific commercial corridors including parts of Graham Avenue, Grand Street, Havemeyer Street, Flushing Avenue, and Broadway.
Housing in Greenpoint was originally built to accommodate the owners, managers, and employees working in neighborhood industries including Astral Apartments, a Queen Anne style development that Charles Pratt had built for his refinery workers on Franklin Street, which was designed by the same architects who created his Pratt Institute Main Building. The neighborhood features a historic district roughly from Java to Calyer Sts., Franklin to Manhattan Avenues with some homes within the district dating from the 1850s.
Greenpoint is well-known for its large Polish community, which is large enough that a helpful local Web site lists common Polish phrases and common Polish foods, and as with nearby Williamsburg, artists

and young professionals have been attracted to Greenpoint because of its abundance of affordable housing.
Development Potential
Thousands of new units of housing are expected to be built in Greenpoint due to the May 2005 New York City Council vote to rezone nearly 200 blocks along the neglected East River waterfront in the Greenpoint and Williamsburg neighborhoods from manufacturing to residential. The rezoning will allow for luxury and affordable housing in new rental and condominium developments and new commercial development. The plan allows for light industrial and residential uses to coexist in certain areas, retains manufacturing zoning for concentrations of industry, and provides a blueprint for a continuous publicly accessible esplanade and new public open spaces along the waterfront in a 27.8 acre park surrounding the Bushwick Inlet.
The following is a sampling of the development currently taking place in Greenpoint:
The 35-acre McCarren Park is the largest park in the community and features a closed WPA-era swimming pool complex that local residents are seeking to refurbish and reopen. In November 2005, two condominium developments were under construction around the area of McCarren Park: The Lotus, a five-story building at 610 Union Avenue at the corner of Bayard Street, and Manhattan Park, an eight-story development at 297 Driggs Avenue, between Manhattan Avenue and Leonard Street, and other projects were being planned near the park.
One of the first condo conversions in North Greenpoint at 137 Dupont Street will offer 32 one-bedroom and two-bedroom units from between $365,000 and $525,000.
In November 2005, the owners of waterfront property along Newtown Creek announced they were offering the property for sale as a location for possible residential development. In addition, work began in April 2005 to convert a 1913, five-story former warehouse at 231 Norman Avenue into 56 artist condominiums with ground floor retail space.
Sources: www.nyc-architecture.com, www.greenpunkt.com, www.gmdconline.com, www.ewvidco.com, New York City Department of City Planning; Brooklyn Daily Eagle, April 8, 2005; November 17, 2005; December 28, 2005.
Business InformationNorth Brooklyn Development Corporation126 Greenpoint Avenue, Brooklyn, NY 11222718-389-9044

Greenpoint Manufacturing and Design Center1155 Manhattan Avenue, Brooklyn, NY 11222718-383-3935
Boricua College Small Business Development Center9 Graham Avenue, Brooklyn, NY 11206718-963-4112, ext. 565
East Williamsburg Valley Industrial Development Corporation (EWVIDCO)
Empire Zone Information 11-29 Catherine Street, Brooklyn, NY 11211718-388-7287, ext. 160www.ewvidco.com
Source: NYC Department of Small Business Services, NYC Economic Development Corporation, BEDC, Brooklyn Chamber of Commerce
Political and Community ContactsCommunity Board 1, 435 Graham Avenue, Brooklyn, NY 11211,
718-389-0009New York City Council 33, David Yassky, 718-875-5200, [email protected] Assembly 50, Joseph R. Lentol, 718-383-7474,
[email protected] Senate 17, Martin Malave Dilan, 718-573-1726, [email protected] Congress 12, Nydia M. Velazquez, 718-599-3658,
www.house.gov/velazquez/ Source: NYC Department of City Planning; NYC Districting Commission, NYPIRG CMAP

LocationGreenpoint is located on the northern tip of Brooklyn, surrounded by water from the East River and Newtown Creek, with the other boundaries roughly 11th Street and the Brooklyn Queens Expressway. Greenpoint Demographics2000 Census Report within a .75 mile radius as noted in the map above
Total Population 36,833
Race/Ethnicity (Total Population)White 26,413 71.7 percentBlack 451 1.2 percentNative American 8 0.0 percentAsian 1,700 4.6 percentOther 1,179 3.2 percentHispanic (any race) 7,082 19.2 percent
Sex (Total Population)Male 18,505 50.2 percent

Female 18,328 49.8 percent
Age (Total Population)Age 0 to 4 1,798 4.9 percent
5 to 9 1,736 4.7 percent10 to 20 3,965 10.8 percent21 to 29 6,597 17.9 percent30 to 39 6,557 17.8 percent40 to 49 6,035 16.4 percent50 to 59 4,179 11.3 percent60 to 64 1,740 4.7 percentAge 65+ 4,226 11.5 percent
Education (Population Age 25+)Total population age 25+ 26,598 100 percentLess than 9th grade 3,232 12.2 percent9-12 Grade 4,566 17.2 percentHigh School 7,767 29.2 percentSome College 3,437 12.9 percentAssociate Degree 1,272 4.8 percentBachelor Degree 3,744 14.1 percentGraduate Degree 2,580 9.7 percent
Employment Status (Population Age 16+)Total population age 16+ 31,320 100 percentNot in labor force 11,789 37.6 percentLabor force 19,531 62.4 percent
Labor Force StatusTotal Labor Force Age 16+ 19,531 100 percentArmed Forces 19 0.1 percent
Civilian 18,122 92.8 percentUnemployed 1,390 7.1 percent
Employed Civilian OccupationTotal employed civilians,Age 16+ 18,122 100 percentAgriculture 24 0.1 percentConstruction 2,400 13.2 percentEducation 1,129 6.2 percentEntertainment 1,813 10.0 percentF.I.R.E. 1,364 7.5 percentHealth 1,160 6.4 percentManufacturing 2,055 11.3 percentMining 0 0.0 percentOther services 1,457 8.0 percent

Prof/Tech/Science 2,377 13.1 percentPublic Administration 487 2.7 percentRetail 1,305 7.2 percentTrans./Warehouse 909 5.0 percentWholesale 678 3.7 percent
HouseholdsTotal households 15,259 100 percentFamily households 8,161 53.5 percent
Income (Total Household)Under $10,000 2,171 14.2 percent$10,000-20,000 2,232 14.6 percent$20,000-30,000 2,308 15.1 percent$30,000-40,000 2,071 13.6 percent$40,000-50,000 1,512 9.9 percent$50,000-60,000 1,231 8.1 percent$60,000-75,000 1,495 9.8 percent$75,000-100,000 1,202 7.9 percent$100,000-150,000 740 4.8 percent$150,000-200,000 183 1.2 percentOver $200,000 114 0.7 percent
Occupied HousingTotal Occupied Housing 15,258 100
percentOwner Occupied 2,855 18.7 percentRenter Occupied 12,403 81.3 percent
Household Size (Total Occupied)1 person 4,984 32.7 percent2 person 4,600 30.1 percent3 person 2,458 16.1 percent4 person 1,893 12.4 percent5 person 715 4.7 percent6 person 318 2.1 percentOver 7 person 290 1.9 percent
Kensington(Includes Albemarle and Parkville)
Ocean Parkway divides Kensington into two sections and primarily large apartment buildings line either side. On the residential side streets, however, the neighborhood features rows of brick or brownstone homes, larger one- or two-family detached homes with

wraparound porches and large yards, and prewar and postwar houses that are five or six stories high. Most of the neighborhood’s housing was built in the 1920s, specifically the freestanding homes, row houses, and five- and six-story apartment buildings.
Frederick Law Olmsted and Calvert Vaux, designers of Prospect Park, Grand Army Plaza, Eastern Parkway, and Central Park, also designed Ocean Parkway in 1876. Ocean Parkway initially featured a central drive, landscaped malls bridle trail, pedestrian paths, and in later years a bicycle path, park benches, and chess tables. Originally designed as a graceful extension of Prospect Park, the northern section of Ocean Parkway was replaced by the Prospect Expressway in the 1950s. The section of Ocean Parkway between Church and Sea Breeze Avenues has been named a New York City landmark. Newcomers who have revitalized the area include professionals and immigrants from Pakistan, Asia, India, Poland, Indonesia, Turkey, Mexico, Haiti, Guyana, the Dominican Republic, Jamaica, and Russia. A Muslim community around Coney Island Avenue and Foster Avenues has flourished.
One of the attractions in the community is Kensington Stables at 51 Caton Place on the border of Windsor Terrace. The stable offers boarding, riding lessons, and trail rides in Prospect Park on a 3.5-mile bridle path through scenic and varied terrain beginning at the Park Circle entrance (the intersection of Coney Island Avenue, Parkside Avenue, and Prospect Park Southwest) and continues alongside the Lake to the Long Meadow and the Midwood.
Development PotentialIn early 2005, the 19th century building that Kensington Stables rented and used as a barn was sold to make way for a 107-unit, luxury condominium complex. The horses were forced into the remaining building, and to make room, the indoor riding ring had to be eliminated. Three residential buildings that surround it are being planned. As of December 2005, construction was taking place on two buildings, but the community was trying to stop the third, 68-unit condominium complex.
Commerce Bank recently opened a branch at 210-212 Prospect Park Southwest at Park Circle near the Parade Grounds on the former site of a gas station, and in December 2005 it was announced that a five-story, 38-unit, 58,037 square foot condominium would be developed on the site of a former McDonald Avenue truck yard.

Many residents continue drive to nearby commercial areas in neighborhoods such as Park Slope for shopping.Sources: The Neighborhoods of Brooklyn, Yale University Press, New Haven and London; New York Times, August 5, 2001; www.prospectpark.org; NY1, December 6, 2005; Brooklyn Daily Eagle, December 7, 2005, Commerce Bank, NY1, December 6, 2005.
Business InformationFlatbush Development Corporation, 1616 Newkirk Avenue, Brooklyn, NY 11226718-859-3800
Church Avenue Merchants & Business Association, 1720 Church Avenue, Brooklyn, NY 11226, 718-282-2500
Political and Community ContactsCommunity Board 7, 4201 4th Avenue, Brooklyn, NY 11232, 718-
854-0003Community Board 14, 1306 Avenue H, Brooklyn, NY, 11230,
718-859-6357NYC Council 39, Bill deBlasio, 718-854-9791,
[email protected] Council 44, Simcha Felder, 718-853-2704,
[email protected] Assembly 44, James F. Brennan, 718-788-7221,
[email protected] Senate 20, Carl Andrews, 718-284-4700,
[email protected] Senate 21, Kevin S. Parker, 718-629-6401,
[email protected] Congress 11, Major Owens, 718-773-3100,
www.house.gov/owens/ Source: NYC Department of City Planning; NYC Districting Commission, NYPIRG CMAP

LocationThe boundaries of Kensington are roughly 36th Street and McDonald Avenue on the west to Coney Island Avenue on the east, from Fort Hamilton Parkway and Caton Avenue on the north to Foster Avenue on the south. Kensington Demographics
2000 Census Report within a .75 mile radius as noted in the map above.
Total Population 91,941 100 percent
Race/Ethnicity (Total Population)White 49,339 53.7 percentBlack 8,716 9.5 percentNative American 165 0.2 percentAsian 11,883 12.9 percentOther 5,322 5.8 percentHispanic (any race) 16,516 18.0 percent
Sex (Total Population)Male 45,909 49.9 percent

Female 46,032 50.1 percent
Age (Total Population)Age 0 to 4 8,197 8.9 percent
5 to 9 7,959 8.7 percent10 to 20 16,069 17.5 percent21 to 29 12,270 13.3 percent30 to 39 12,916 14.0 percent40 to 49 13,204 14.4 percent50 to 59 8,001 8.7 percent60 to 64 3,210 3.5 percentAge 65+ 10,115 11.0 percent
Education (Population Age 25+)Total population age 25+ 54,348 100 percentLess than 9th grade 7,684 14.1 percent9-12 Grade 8,940 16.4 percentHigh School 14,217 26.2 percentSome College 7,895 14.5 percentAssociate Degree 3,020 5.6 percentBachelor Degree 7,282 13.4 percentGraduate Degree 5,310 9.8 percent
Employment Status (Population Age 16+)Total population age 16+ 66,857 100 percentNot in labor force 31,127 46.6 percentLabor force 35,730 53.4 percent
Labor Force StatusTotal Labor Force Age 16+ 35,730 100 percentArmed Forces 0 0.0 percentCivilian 32,862 92.0 percentUnemployed 2,868 8.0 percent
Employed Civilian OccupationTotal employed civilians,Age 16+ 32,862 100 percentAgriculture 14 0.0 percentConstruction 1,982 6.0 percentEducation 3,800 11.6 percentEntertainment 2,563 7.8 percentF.I.R.E. 3,448 10.5 percentHealth 4,474 13.6 percentManufacturing 2,587 7.9 percentMining 10 0.0 percentOther services 1,864 5.7 percent

Prof/Tech/Science 3,008 9.2 percentPublic Administration 941 2.9 percentRetail 3,588 10.9 percentTrans./Warehouse 2,252 6.9 percentWholesale 1,232 3.7 percent
HouseholdsTotal households 29,458 100 percentFamily households 20,569 69.8 percent
Income (Total Household)Under $10,000 5,316 18.0 percent$10,000-20,000 4,910 16.7 percent$20,000-30,000 3,719 12.6 percent$30,000-40,000 3,096 10.5 percent$40,000-50,000 3,133 10.6 percent$50,000-60,000 2,158 7.3 percent$60,000-75,000 2,341 7.9 percent$75,000-100,000 2,374 8.1 percent$100,000-150,000 1,646 5.6 percent$150,000-200,000 349 1.2 percentOver $200,000 416 1.4 percent
Occupied HousingTotal Occupied Housing 29,388 100 percentOwner Occupied 7,356 25.0 percentRenter Occupied 22,032 75.0 percent
Household Size (Total Occupied)1 person 7,311 24.9 percent2 person 7,278 24.8 percent3 person 4,654 15.8 percent4 person 4,204 14.3 percent5 person 2,520 8.6 percent6 person 1,414 4.8 percentOver 7 person 2,007 6.8 percent
Manhattan BeachWealthy New Yorker Austin Corbin founded the resort of Manhattan Beach after buying 500 acres of property and building two elegant hotels—the Manhattan Beach Hotel, which opened in 1877, and Oriental Hotel, which opened in 1880.

To make the trip to Manhattan Beach more appealing and convenient for Manhattanites, Corbin offered a ferry service from the East 23rd ferry slip in Manhattan to the 69th Street ferry slip in Brooklyn where vacationers would then board the New York and Manhattan Beach Railway, which Corbin built in 1876, and arrive at his resort within an hour. Corbin was later president of the Long Island Rail Road.
As the resort business declined, another entrepreneur, real estate developer Joseph P. Day, arrived on the scene. Day founded the Manhattan Beach Improvement Company, bought out Corbin’s son’s interest in the Manhattan Beach Hotel, and in1908 began residential development on land north of the hotels. The Manhattan Beach Hotel was razed in 1911 and the Oriental demolished in 1916.
Single family homes now define the community except on West End Avenue, and few stores operate in the neighborhood. Manhattan Beach shares its border with Brighton Beach, and the Sheepshead Bay Footbridge leads to Emmons Avenue in Sheepshead Bay. Shopping is abundant in both of these communities.
Kingsborough Community College is located on a 70-acre campus in Manhattan Beach, on the southern tip of Brooklyn. Founded in 1963, the College serves about 30,000 students a year, offering a wide range of credit and non-credit courses in the liberal arts and career education, as well as a number of specialized programs. The Leon M. Goldstein High School opened on the campus in 2003. The facility offers breathtaking views overlooking three bodies of water: Sheepshead Bay, Jamaica Bay and the Atlantic Ocean.
Sources: The Neighborhoods of Brooklyn, Yale University Press, New Haven and London; Kingsborough Community College.
Political and Community ContactsCommunity Board 15, Kingsboro College, 2001 Oriental Boulevard, Brooklyn, NY, 11235, 718-332-3008NYC Council 48, Michael C. Nelson, 718-368-9176,
[email protected] Assembly 45, Steven Cymbrowitz, 718-743-4078, [email protected] Senate 27, Carl Kruger, 718-743-8610,
[email protected] Congress 9, Anthony Weiner, 718-520-9001,
www.house.gov/weiner/ Source: NYC Department of City Planning; NYC Districting Commission, NYPIRG CMAP

LocationThe boundaries of Manhattan Beach are roughly West End Avenue to Seawall Avenue and the Atlantic Ocean, Shore Boulevard to the Esplanade and beaches
Manhattan Beach Demographics2000 Census Report within a .50 mile radius as noted in the map above.
Total Population 5,560 100 percent
Race/Ethnicity (Total Population)White 4,902 88.2 percentBlack 306 5.5 percentNative American 0 0.0 percentAsian 88 1.6 percentOther 72 1.3 percentHispanic (any race) 192 3.5 percent
Sex (Total Population)Male 2,546 45.8 percent

Female 3,014 54.2 percent
Age (Total Population)Age 0 to 4 224 4.0 percent
5 to 9 294 5.3 percent10 to 20 668 12.0 percent21 to 29 682 12.3 percent30 to 39 656 11.8 percent40 to 49 812 14.6 percent50 to 59 855 15.4 percent60 to 64 290 5.2 percentAge 65+ 1,079 19.4 percent
Education (Population Age 25+)Total population age 25+ 4,043 100 percentLess than 9th grade 192 4.7 percent9-12 Grade 283 7.0 percentHigh School 721 17.8 percentSome College 601 14.9 percentAssociate Degree 332 8.2 percentBachelor Degree 881 21.8 percentGraduate Degree 1,033 25.6 percent
Employment Status (Population Age 16+)Total population age 16+ 4,708 100 percentNot in labor force 1,963 41.7 percentLabor force 2,745 58.3 percent
Labor Force StatusTotal Labor Force Age 16+ 2,745 100 percentArmed Forces 0 0.0 percentCivilian 2,564 93.4 percentUnemployed 181 6.6 percent
Employed Civilian OccupationTotal employed civilians,Age 16+ 2,564 100 percentAgriculture 0 0.0 percentConstruction 99 3.9 percentEducation 454 17.7 percentEntertainment 60 2.3 percentF.I.R.E. 336 13.1 percentHealth 481 18.8 percentManufacturing 121 4.7 percentMining 0 0.0 percentOther services 126 4.9 percent

Prof/Tech/Science 264 10.3 percentPublic Administration 93 3.6 percentRetail 249 9.7 percentTrans./Warehouse 109 4.3 percentWholesale 96 3.7 percent
HouseholdsTotal households 1,974 100 percentFamily households 1,430 72.4 percent
Income (Total Household)Under $10,000 198 10.0 percent$10,000-20,000 161 8.2 percent$20,000-30,000 111 5.6 percent$30,000-40,000 176 8.9 percent$40,000-50,000 90 4.6 percent$50,000-60,000 118 6.0 percent$60,000-75,000 224 11.3 percent$75,000-100,000 276 14.0 percent$100,000-150,000 288 14.6 percent$150,000-200,000 180 9.1 percentOver $200,000 152 7.7 percent
Occupied HousingTotal Occupied Housing 1,956 100 percentOwner Occupied 1,356 69.3 percentRenter Occupied 600 30.7 percent
Household Size (Total Occupied)1 person 516 26.4 percent2 person 671 34.3 percent3 person 353 18.0 percent4 person 258 13.2 percent5 person 113 5.8 percent6 person 15 0.8 percentOver 7 person 30 1.5 percent
Marine ParkMarine Park is noted for the 800-acre park of the same name that features bocce, tennis, basketball and handball courts, a one-mile running track, softball, football, cricket, and soccer fields, a nature trail and environmental center, and the Marine Park Golf Course.

The Park’s Salt Marsh Nature Center, which has introduced the Marine Park marshland to the community through new after school programs and other innovative environmental activities, was selected by the New York City Parks Department as Park of the Month for January 2006.
Marine Park is connected to Gateway National Recreation Area, an area managed by the National Parks Service since 1972. Part of the recreation area had been New York City’s first municipal airport, Floyd Bennett Field, which opened on 1,500 acres of reclaimed marshland in 1930, was enlarged in 1936, and sold to the Navy in 1942. The field was used by pilots such as Amelia Earhart and Howard Hughes, and in 1938 Douglas (Wrong Way) Corrigan left it in a fog headed for California, but ended up in Dublin.
At the beginning of the 20th Century a port was planned on Jamaica Bay in Marine Park, and an extension to Avenue U was planned for the IRT line, but neither goal was realized. Development of single-family housing with driveways followed in the 1920s and 1930s. In the late 1930s, the completion of the Belt Parkway and extension of Flatbush Avenue south of Avenue U encouraged more residential development. Today, the neighborhood offers some attached and semi-attached homes and small apartment buildings.
Sources: The Neighborhoods of Brooklyn, Yale University Press, New Haven and London; Brooklyn Daily Eagle, January 10, 2006.
Political and Community ContactsCommunity Board 18, 5715 Avenue H, Brooklyn, NY, 11234,
718-241-0422NYC Council 46, Lewis A. Fidler, 718-241-9330,
[email protected] Assembly 59, Frank R. Seddio, 718-968-2770,
[email protected] Senate 27, Carl Kruger, 718-743-8610,
[email protected] Congress 10, Edolphus Towns, 718-855-8018,
www.house.gov/towns/ Source: NYC Department of City Planning; NYC Districting Commission, NYPIRG CMAP

LocationThe boundaries of Marine Park are roughly Nostrand Avenue and Gerritsen Avenue, to Flatbush Avenue, from Flatlands Avenue or sometimes Kings Highway, to Avenue U and Avenue V. Marine Park Demographics2000 Census Report within a .80 mile radius as noted in the map above.
Total Population 44,449
Race/Ethnicity (Total Population)White 31,007 69.8 percentBlack 6,603 14.9 percentNative American 33 0.1 percentAsian 2,206 5.0 percentOther 979 2.2 percentHispanic (any race) 3,621 8.1 percent
Sex (Total Population)Male 20,856 46.9 percent

Female 23,593 53.1 percent
Age (Total Population)Age 0 to 4 2,699 6.1 percent
5 to 9 2,814 6.3 percent10 to 20 6,215 14.0 percent21 to 29 5,075 11.4 percent30 to 39 6,552 14.7 percent40 to 49 6,785 15.3 percent50 to 59 5,677 12.8 percent60 to 64 1,860 4.2 percentAge 65+ 6,772 15.2 percent
Education (Population Age 25+)Total population age 25+ 30,528 100 percentLess than 9th grade 1,852 6.1 percent9-12 Grade 3,198 10.5 percentHigh School 9,881 32.4 percentSome College 5,393 17.7 percentAssociate Degree 2,393 7.8 percentBachelor Degree 4,853 15.9 percentGraduate Degree 2,958 9.7 percent
Employment Status (Population Age 16+)Total population age 16+ 35,307 100 percentNot in labor force 14,037 39.8 percentLabor force 21,270 60.2 percent
Labor Force StatusTotal Labor Force Age 16+ 21,270 100 percentArmed Forces 0 0.0 percentCivilian 20,223 95.1 percentUnemployed 1,047 4.9 percent
Employed Civilian OccupationTotal employed civilians,Age 16+ 20,223 100 percentAgriculture 14 0.1 percentConstruction 855 4.2 percentEducation 2,760 13.6 percentEntertainment 711 3.5 percentF.I.R.E. 2,568 12.7 percentHealth 3,299 16.3 percentManufacturing 916 4.5 percentMining 18 0.1 percentOther services 945 4.7 percent

Prof/Tech/Science 1,822 9.0 percentPublic Administration 1,364 6.7 percentRetail 1,977 9.8 percentTrans./Warehouse 1,633 8.1 percentWholesale 528 2.6 percent
HouseholdsTotal households 16,347 100 percentFamily households 11,925 72.9 percent
Income (Total Household)Under $10,000 1,497 9.2 percent$10,000-20,000 1,611 9.9 percent$20,000-30,000 1,577 9.6 percent$30,000-40,000 1,507 9.2 percent$40,000-50,000 1,430 8.7 percent$50,000-60,000 1,543 9.4 percent$60,000-75,000 2,117 13.0 percent$75,000-100,000 2,365 14.5 percent$100,000-150,000 1,989 12.2 percent$150,000-200,000 487 3.0 percentOver $200,000 224 1.4 percent
Occupied HousingTotal Occupied Housing 16,333 100 percentOwner Occupied 10,889 66.7 percentRenter Occupied 5,444 33.3 percent
Household Size (Total Occupied)1 person 4,022 24.6 percent2 person 4,707 28.8 percent3 person 2,948 18.0 percent4 person 2,660 16.3 percent5 person 1,320 8.1 percent6 person 408 2.5 percentOver 7 person 268 1.6
percent
Midwood
Midwood is noted for having one of the largest number of single-family, detached homes in Brooklyn as well as 18,000 shade trees. Its gracious two-story homes with deep front porches and luscious lawns were developed after the turn of the 20th Century when residents discovered the area following the expansion of the Brooklyn-

Manhattan Transit line in 1908 and the Interborough Rapid Transit line in 1920. The neighborhood also features two-family homes and multifamily walkups.
Midwood’s residents are a mixture of Orthodox and Hasidic Jews, and immigrants from China, Haiti, Guyana, Jamaica, Iran, Pakistan, and India. Synagogues have been opened along Ocean Parkway and on residential streets and at least a dozen yeshivas are in operation. Many retail stores on the commercial strips of Avenues J, which offers kosher restaurants, delis, pizzerias, butchers, and bakeries, and M, which offers more sophisticated retail shops, Kings Highway, and Flatbush, Nostrand, and Coney Island Avenues observe the Jewish Sabbath and close at sundown on Friday through sundown on Saturday. To accommodate the influx of Muslims, primarily from Pakistan, a large mosque opened on Coney Island Avenue in 1982.
The area’s hidden history includes a brush with the burgeoning motion picture business. Between 1906 and 1915, the Vitagraph film company made silent movies at its studio off Avenue M starring such greats as Rudolph Valentino and Norma Talmadge and directed by Cecil B. DeMille. Vitagraph’s second, Hollywood-based studio was acquired by Warner Brothers. Later part of the Midwood studio was purchased by NBC television and used in the 1950s to produce The Steve Allen Show, The Perry Como Show, and Mary Martin starring in Peter Pan, and for three decades the soap opera Another World was filmed there. A Jewish girls’ day school, the Shulamith School for Girls, is now located on the site. Brooklyn College, which the Princeton Review called the “most beautiful campus in the country,” opened in 1937 at the northern border of Midwood and enrolls 15,000 undergraduate and graduate students. In recent years Brooklyn College opened a new library and began construction on a new building to house a state-of-the-art physical education and athletics facility and consolidate student services in one location. Brooklyn College also is the location for the Brooklyn Center for the Performing Arts, which offers first-rate musical and dance performances throughout the year.
Area high schools include Edward R. Murrow High School, James Madison High School in nearby Sheepshead Bay, and Midwood High School, the high school from which Woody Allen graduated, is in Flatbush a block from Brooklyn College.
Development Potential

In September 2005, construction began on a new, six-story condominium building at 1296 Ocean Parkway that will have seven units each with three bedrooms. In addition, Kosher Gym, a gym for Orthodox Jewish women, received approval in April 2005 from Community Board 14 to relocate from Coney Island Avenue between Avenues M and N to a larger, four-story space on Coney Island Avenue between Avenues N and O. Also, it was reported in January 2005 that a six-story, 107,187 square foot building with 33 residential units is being planned at 431 Avenue P.
The New York City Department of City Planning has proposed zoning changes for 80 blocks of Midwood in the residential area bordered by Avenue H, Ocean Avenue, Avenue P and Kings Highway, and Coney Island Avenue that “would preserve the existing neighborhood scale and character with lower density and contextual zoning districts, while permitting new, higher density development on selected wide streets—Avenue J, Coney Island Avenue, Ocean Avenue, and Kings Highway.”
Apartment houses currently exist on Ocean Avenue, parts of Kings Highway, and both sides of Avenue K between Coney Island Avenue and East 16th Street. Commercial activity in the area is found on Coney Island Avenue, Avenue M between Coney Island and Ocean Avenues, and Avenue J between Coney Island Avenue and East 16th Street.
The Department of City Planning observed that most of the area, which is primarily made up of two- and three-story homes, was built before World War II with some construction of three- or four-family semi-detached housing taking place through the 1980s. The proposal was made because recent new construction has included out of scale apartments up to seven stories on low-rise blocks.Sources: The Neighborhoods of Brooklyn, Yale University Press, New Haven and London; New York City Department of City Planning; Brooklyn Daily Eagle, April 18, 2005, September 6, 2005, January 13, 2006; New York Times, June 29, 2003; Brooklyn College; www.431avenuep.com.
Political and Community ContactsCommunity Board 12, 5910 13th Avenue, Brooklyn, NY 11219,
718-851-0800Community Board 14, 1306 Avenue H, Brooklyn, NY, 11230,
718-859-6357NYC Council 44, Simcha Felder, 718-853-2704,
[email protected] Council 48, Michael Nelson, 718-368-9176,
[email protected] Assembly 41, Helene E. Weinstein, 718-648-4700, [email protected]

NYS Assembly 42, Rhoda S. Jacobs, 718-434-0446, [email protected]
NYS Assembly 48, Dov Hikind, 718-853-9616, [email protected]
NYS Senate 19, John Sampson, 718-649-7653, [email protected]
NYS Senate 27, Carl Kruger, 7180743-8610, [email protected]
US Congress 10, Edolphus Towns, 718-855-8018, www.house.gov/towns/
US Congress 9, Anthony Weiner, 718-520-9001, www.house.gov/weinerSource: NYC Department of City Planning; NYC Districting Commission, NYPIRG CMAP
Location

The boundaries of Midwood are roughly McDonald Avenue, Nostrand Avenue, Avenue H to Avenue P.
Midwood Demographics2000 Census Report within a .80 mile radius as noted in the map above.
Total Population 81,550
Race/Ethnicity (Total Population)White 54,366 66.7 percentBlack 12,242 15.0 percentNative American 128 0.2 percentAsian 7,320 9.0 percentOther 2,472 3.0 percentHispanic (any race) 5,022 6.2 percent
Sex (Total Population)Male 39,662 48.6 percentFemale 41,888 51.4 percent
Age (Total Population)Age 0 to 4 6,524 8.0 percent
5 to 9 6,492 8.0 percent10 to 20 14,263 17.5 percent21 to 29 9,591 11.8 percent30 to 39 10,404 12.8 percent40 to 49 11,130 13.6 percent50 to 59 8,328 10.2 percent60 to 64 3,308 4.1 percentAge 65+ 11,510 14.1 percent
Education (Population Age 25+)Total population age 25+ 50,009 100 percentLess than 9th grade 4,685 9.4 percent9-12 Grade 5,276 10.6 percentHigh School 12,058 24.1 percentSome College 8,138 16.3 percentAssociate Degree 3,079 6.2 percentBachelor Degree 9,094 18.2 percentGraduate Degree 7,679 15.4 percent
Employment Status (Population Age 16+)Total population age 16+ 60,183 100 percentNot in labor force 28,173 46.8 percentLabor force 32,010 53.2 percent

Labor Force StatusTotal Labor Force Age 16+ 32,010 100 percentArmed Forces 6 0.0 percentCivilian 29,596 92.5 percentUnemployed 2,408 7.5 percent
Employed Civilian OccupationTotal employed civilians,Age 16+ 29,596 100 percentAgriculture 9 0.0 percentConstruction 1,161 3.9 percentEducation 3,971 13.4 percentEntertainment 1,422 4.8 percentF.I.R.E. 3,578 12.1 percentHealth 5,058 17.1 percentManufacturing 1,512 5.1 percentMining 18 0.1 percentOther services 1,632 5.5 percentProf/Tech/Science 3,131 10.6 percentPublic Administration 1,091 3.7 percentRetail 2,584 8.7 percentTrans./Warehouse 1,903 6.4 percentWholesale 1,501 5.1 percent
HouseholdsTotal households 27,615 100 percentFamily households 19,578 70.9 percent
Income (Total Household)Under $10,000 4,064 14.7 percent$10,000-20,000 4,046 14.7 percent$20,000-30,000 3,044 11.0 percent$30,000-40,000 3,094 11.2 percent$40,000-50,000 2,370 8.6 percent$50,000-60,000 2,197 8.0 percent$60,000-75,000 2,340 8.5 percent$75,000-100,000 2,658 9.6 percent$100,000-150,000 2,300 8.3 percent$150,000-200,000 786 2.8 percentOver $200,000 716 2.6 percent
Occupied HousingTotal Occupied Housing 27,637 100 percentOwner Occupied 9,358 33.9 percentRenter Occupied 18,279 66.1 percent

Household Size (Total Occupied)1 person 7,120 25.8 percent2 person 7,540 27.3 percent3 person 4,309 15.6 percent4 person 3,491 12.6 percent5 person 2,258 8.2 percent6 person 1,349 4.9 percentOver 7 person 1,570 5.7
percent
Mill Basin and Bergen Beach(Includes Georgetown and Mill Island)
Bergen Beach was originally developed in the 1890s as a summer resort community. A Ferris wheel, casino, roller-skating rink, boardwalk, vaudeville shows, and in 1905, an amusement park, provided visitors with entertainment. For boating enthusiasts, the Bergen Beach Yacht Club opened around 1900, but was destroyed by fire in 1922. In1924, the club moved to its current location in Mill Basin.
In 1925, real estate developers bought the land and amusements in Bergen Beach. They had planned a residential community, but their dream never materialized. In fact, Bergen Beach remained relatively undeveloped until the 1960s, and didn’t become popular as a residential area until the 1980s and 1990s. Today, Bergen Beach offers large, custom-built, single-family houses, with the homes located on East Mill Basin featuring private docks.
Within Bergen Beach is the community of Georgetown located in the area of Ralph Avenue, Veterans Avenue, Avenue U, and Bergen Avenue. This area consists of two-, three-, and four-family attached and semi-attached houses.
The exclusive community of Mill Basin has a unique history compared to other south Brooklyn waterfront communities—it doesn’t include a period as a resort.
Mill Basin was primarily rural until Robert L. Crooke built a lead smelting plant, Crooke Smelting, in 1890. National Lead Company bought Crooke Smelting in 1900, and Crooke sold the rest of the land to a firm that built bulkheads to fill the marshland. In 1906 the Flatbush Improvement Company was responsible for dredging the area’s creeks and filling in open meadows in order to prepare 332

acres for industrial development. Atlantic, Gulf, and Pacific bought land in 1909, and built three dry docks. By 1919, at least six manufacturing and commercial firms were operating out of Mill Basin.
Local business leaders promoted Jamaica Bay as a harbor and new dock facilities were built after Flatbush Avenue was extended to the Rockaway Inlet. The area never attracted a large shipping business, however, but the docks were often rented to small industrial firms in the 1920s and 1930s. Until the 1920s, local residents living in shacks on the beach made their living selling crabs, oysters, and clams from Jamaica Bay.
Until the late 1940s, Mill Basin remained an industrial area and many of its workers lived in the semi-detached homes developed between the 1920s and 1940s on the inland side of Avenue U. After World War II the area south of Avenue U, which had been known as Mill Island, was connected by a landfill. Brick homes were built, and a two-story co-op was constructed in 1954. Today custom-made homes are replacing the original homes in the area. A Brooklyn architect who redesigned a Mill Basin home at 255 Whitman Drive was honored by the AIA Brooklyn Chapter with an AIA 2005 Certificate of Appreciation. Mill Basin’s multi-million dollar waterfront homes also feature more than 200 private docks.
The Kings Plaza Shopping Center and Marina is located in Mill Basin at Flatbush Avenue and Avenue U. The complex, which opened in 1970, features bookstores, Macy’s, Sears, Home Depot, local and chain retail stores, movies, and boat slips. The El Caribe Country Club is located at 5945 Strickland Avenue, and Gil Hodges Lanes, a bowling alley, is located at 6161 Strickland Avenue.
The Crooke-Schenck House, built in 1675, was built on Avenue U between East 63rd and East 64th Streets. In 1953 the historic structure was relocated to the Brooklyn Museum where it remains on display as an example of early Dutch Colonial housing in Brooklyn.Sources: The Neighborhoods of Brooklyn, Yale University Press, New Haven and London; WPA Guide to New York City, 1939; Brooklyn Museum.
Political and Community ContactsCommunity Board 18, 5715 Avenue H, Brooklyn, NY, 11234,
718-241-0422NYC Council 46, Lewis A. Fidler, 718-241-9330,
[email protected] Assembly 59, Frank R. Seddio, 718-968-2770,

NYS Senate 27, Carl Kruger, 718-743-8610, [email protected]
US Congress 9, Anthony Weiner, 718-520-9001, www.house.gov/weinerSource: NYC Department of City Planning; NYC Districting Commission, NYPIRG CMAP
Bergen Beach, Georgetown, Mill Basin, and Mill Island Demographics2000 Census Report within a .75 mile radius as noted in the map above
Total Population 33,269 100 percent
Race/Ethnicity (Total Population)White 25,579 76.9 percentBlack 3,914 11.8 percentNative American 19 0.1 percentAsian 1,035 3.1 percentOther 623 1.9 percentHispanic (any race) 2,099 6.3 percent
Sex (Total Population)

Male 15,787 47.5 percentFemale 17,482 52.5 percent
Age (Total Population)Age 0 to 4 1,911 5.7 percent
5 to 9 1,885 5.7 percent10 to 20 4,538 13.6 percent21 to 29 3,611 10.9 percent30 to 39 4,795 14.4 percent40 to 49 4,946 14.9 percent50 to 59 4,681 14.1 percent60 to 64 1,487 4.5 percentAge 65+ 5,415 16.3 percent
Education (Population Age 25+)Total population age 25+ 23,405 100 percentLess than 9th grade 1,499 6.4 percent9-12 Grade 2,347 10.0 percentHigh School 7,165 30.6 percentSome College 4,464 19.1 percentAssociate Degree 1,667 7.1 percentBachelor Degree 3,327 14.2 percentGraduate Degree 2,936 12.5 percent
Employment Status (Population Age 16+)Total population age 16+ 26,816 100 percentNot in labor force 10,848 40.5 percentLabor force 15,968 59.5 percent
Labor Force StatusTotal Labor Force Age 16+ 15,968 100 percentArmed Forces 0 0.0 percentCivilian 15,149 94.9 percentUnemployed 819 5.1 percent
Employed Civilian OccupationTotal employed civilians,Age 16+ 15,149 100 percentAgriculture 6 0.0 percentConstruction 678 4.5 percentEducation 2,146 14.2 percentEntertainment 449 3.0 percentF.I.R.E. 1,869 12.3 percentHealth 2,308 15.2 percentManufacturing 710 4.7 percentMining 0 0.0 percent

Other services 764 5.0 percentProf/Tech/Science 1,458 9.6 percentPublic Administration 762 5.0 percentRetail 1,723 11.4 percentTrans./Warehouse 1,281 8.5 percentWholesale 486 3.2 percent
HouseholdsTotal households 12,464 100 percentFamily households 9,243 74.2 percent
Income (Total Household)Under $10,000 1,064 8.5 percent$10,000-20,000 1,006 8.1 percent$20,000-30,000 1,100 8.8 percent$30,000-40,000 1,327 10.6 percent$40,000-50,000 1,179 9.5 percent$50,000-60,000 981 7.9 percent$60,000-75,000 1,575 12.6 percent$75,000-100,000 1,840 14.8 percent$100,000-150,000 1,532 12.3 percent$150,000-200,000 399 3.2 percentOver $200,000 461 3.7 percent
Occupied HousingTotal Occupied Housing 12,523 100 percentOwner Occupied 8,322 66.5 percentRenter Occupied 4,201 33.5 percent
Household Size (Total Occupied)1 person 2,856 22.8 percent2 person 3,980 31.8 percent3 person 2,270 18.1 percent4 person 2,070 16.5 percent5 person 912 7.3 percent6 person 300 2.4 percentOver 7 person 135 1.1 percent
Ocean Hill-BrownsvilleOriginally a village of small cottages and shops, Brownsville became a neighborhood of immigrants after 1887 when a real estate developer began building tenement houses and marketing them to garment workers from the Lower East Side. The opening of the Fulton Street elevated railway in 1889 and the Williamsburg Bridge in 1903 also

attracted new residents to the area. After World War II the area declined, particularly following the 1977 blackout, but between 1977 and 1985 the Council of East Brooklyn Churches and neighborhood organizations built or renovated thousands of new homes, including owner-occupied low-rise, row houses.
The area some know as Ocean Hill in the northwestern corner of Brownsville was a prosperous residential community when it was built in the 1890s and later featured department stores and theaters. This area also was hard hit during the 1977 blackout when homes were abandoned and arson destroyed or damaged stores.
The City took possession of the abandoned buildings and vacant lots in neighborhoods like Brownsville as well as other areas of Brooklyn, the South Bronx, and Harlem, and by the 1980s the City’s portfolio had grown to over 100,000 units of housing and over 5,000 vacant lots. In the mid-1980s, the Department of Housing Preservation and Development (HPD) began collaborating with community groups and selling vacant lots and City-owned residential buildings to nonprofits and private developers that have primarily created affordable housing.
Most recently in Brownsville in 2005, homeowners moved into 37 new affordable townhouses at Dean Street and Saratoga Avenue that they purchased from the Settlement Housing Fund, the nonprofit developer of the homes. The organization purchased the City-owned land from HPD for $1. In addition, Prospect Plaza, a New York City Housing Authority complex located on Saratoga Avenue, which has been vacant since late 1990s, will soon be renovated.
In 1983, property owners, businesses, and other interest groups formed the East Brooklyn Business Improvement District. The nonprofit operates in an area bordered by Powell Street (in Brownsville), East New York Avenue, Atlantic Avenue, Sheffield Avenue, and Sutter Avenue, includes an industrial park featuring businesses engaged in light manufacturing or distribution and a commercial strip on the southern border. The Local Development Corporation of East New York administers the State-designated Empire Zone in East New York, which offers financial incentives and tax credits, including wage tax credits for companies hiring full-time employees in newly created jobs, and utility discounts to businesses located within the zone. The organization also offers entrepreneur programs, including those targeted at women entrepreneurs, to encourage the development of small businesses.
In recent years, the Brownsville area has experienced an increase in commercial development. Clean Rite Centers opened a 10,000 square

foot, 24-hour self-service laundry with a parking lot in 2000 on what had been a blighted, vacant lot on the corner of Bergen and the Eastern Parkway Extension. Soon after, a medical clinic opened next door and new residential housing was built across Bergen Street.
Currently under construction is the new $11 million, 132,000 square foot headquarters of Park Avenue Building and Roofing Supplies, LLC, and AM&G Waterproofing, LLC, at Atlantic and Saratoga Avenues. The site will include 10,000 square feet of retail space for Park Avenue Building and Roofing Supplies. Founder Gilbert Rivera seeks to encourage commercial redevelopment along Atlantic Avenue, as he has done for 20 years at his current location in Bedford Stuyvesant. The project is being built on five formerly City-owned properties, as well as adjacent properties acquired by the Rivera family.
The Brownsville Multi-Service Family Health Center, which was founded in 1982, opened the BMS Life and Wellness Center in 2003 with 9,500 square feet of space on the upper two floors of a three-story building that the organization bought on a commercial strip at 408 Rockaway Avenue, several blocks from its main health center at 592 Rockaway Avenue. The Brownsville Multi-Service Family Health Center is operated by the Brownsville Community Development Corporation, which has been developing community programs for more than 30 years.
Development Potential
Mayor Michael Bloomberg announced in August 2005 that the City was releasing RFPs for new homes to be built on 248 of the last remaining vacant lots in HPD's portfolio, some of which are in the Ocean Hill/Brownsville area, and that the preference would be given to developers who committed to building more affordable housing than the required minimum. In addition, for the first time, HPD stated it would be giving first priority to development plans that incorporate environmentally-friendly designs in the construction of multi-family homes. HPD requested proposals from developers to build more than 3,200 units citywide. By the summer of 2005, the City owned just over 2,000 units of residential housing which were being redeveloped by HPD programs and remaining 248 developable lots.
In addition, the commercial corridor of Pitkin Avenue has been successfully attracting retail businesses including Lucille Roberts Fitness, Foot Locker, Lane Bryant, Radio Shack, Chase Bank, Banco Popular, McDonald’s, Ashley Stuart, T-Mobile, Duane Reade, and Jimmy Jazz.

Sources: Brooklyn Daily Eagle, August 4, 2005 and November 18, 2005; Clean Rite Centers; Brooklyn Economic Development Corporation; Park Avenue Building and Roofing Supplies, LLC, and AM&G Waterproofing, LCC; Mayor Michael Bloomberg; The Neighborhoods of Brooklyn, Yale University Press, New Haven and London.
Political and Community ContactsCommunity Board 16, Thomas Boyland Street, Room 103, Brooklyn, NY 11212, 718-385-0323New York City Council 41, Darlene Mealy, 212-788-7387New York City Council 37, Erik Martin Dilan, 718-642-8664, [email protected] Assembly 55, William Boyland, Jr., 718-498-8681,
http://assembly.state.ny.us/ NYS Senate 18, Velmanette Montgomery, 718-643-6140, [email protected] Congress 10, Edolphus Towns, 718-855-8018,
www.house.gov/towns/ Source: NYC Department of City Planning; NYC Districting Commission, NYPIRG CMAP
LocationThe boundaries of Brownsville are Ralph Avenue, Eastern Parkway, and Rockaway Parkway on the west to Van Sinderen Avenue on the east, from Fulton Street on the north to the railroad tracks and Avenue D on the south. The historic boundaries of Ocean Hill are from Ralph

Avenue on the west and Fulton Street on the north to Eastern Parkway Extension on the east and south.
Brownsville Demographics2000 Census Report within a .85 mile radius as noted in the map above.
Total Population 105,071
Race/Ethnicity (Total Population)White 870 0.8 percentBlack 83,681 79.6 percentNative American 295 0.3 percentAsian 939 0.9 percentOther 2,872 2.7 percentHispanic (any race) 16,414 15.6 percent
Sex (Total Population)Male 45,975 43.8 percentFemale 59,096 56.2 percent
Age (Total Population)Age 0 to 4 9,366 8.9 percent
5 to 9 10,640 10.1 percent10 to 20 21,830 20.8 percent21 to 29 13,578 12.9 percent30 to 39 15,134 14.4 percent40 to 49 13,385 12.7 percent50 to 59 9,719 9.2 percent60 to 64 3,637 3.5 percentAge 65+ 7,782 7.4 percent
Education (Population Age 25+)Total population age 25+ 56,971 100 percentLess than 9th grade 7,022 12.3 percent9-12 Grade 16,160 28.4 percentHigh School 17,961 31.5 percentSome College 8,526 15.0 percentAssociate Degree 2,719 4.8 percentBachelor Degree 3,345 5.9 percentGraduate Degree 1,238 2.2 percent
Employment Status (Population Age 16+)Total population age 16+ 72,613 100 percentNot in labor force 35,570 49.0 percentLabor force 37,043 51.0 percent
Labor Force StatusTotal Labor Force Age 16+ 37,043 100 percentArmed Forces 7 0.0 percentCivilian 29,185 78.8 percentUnemployed 7,851 21.2 percent
Employed Civilian OccupationTotal employed civilians,Age 16+ 29,185 100 percentAgriculture 12 0.0 percentConstruction 1,590 5.4 percentEducation 1,937 6.6 percentEntertainment 1,760 6.0 percentF.I.R.E. 2,521 8.6 percentHealth 7,755 26.6 percentManufacturing 1,602 5.5 percentMining 0 0.0 percentOther services 1,651 5.7 percentProf/Tech/Science 2,570 8.8 percentPublic Administration 1,632 5.6 percentRetail 2,453 8.4 percentTrans./Warehouse 2,390 8.2 percentWholesale 587 2.0 percent
HouseholdsTotal households 34,879 100 percentFamily households 25,195 72.2 percent
Income (Total Household)Under $10,000 11,427 32.8 percent$10,000-20,000 5,829 16.7 percent$20,000-30,000 5,000 14.3 percent$30,000-40,000 3,465 9.9 percent$40,000-50,000 2,504 7.2 percent$50,000-60,000 2,104 6.0 percent$60,000-75,000 1,707 4.9 percent$75,000-100,000 1,579 4.5 percent$100,000-150,000 940 2.7 percent$150,000-200,000 124 0.4 percentOver $200,000 200 0.6 percent
Occupied HousingTotal Occupied Housing 34,986 100 percentOwner Occupied 5,387 15.4 percentRenter Occupied 29,599 84.6 percent

Household Size (Total Occupied)1 person 8,584 24.5 percent2 person 8,210 23.5 percent3 person 6,950 19.9 percent4 person 5,238 15.0 percent5 person 3,239 9.3 percent6 person 1,553 4.4 percentOver 7 person 1,212 3.5
percent
Park Slope
Upper class New Yorkers discovered Park Slope following the opening of the Brooklyn Bridge in 1883 and built so many Victorian mansions on Prospect Park West, Eighth Avenue, and other streets that the area soon earned the distinction as Brooklyn’s Gold Coast. Although some mansions were torn down after World War I to make way for high rise apartment buildings, blocks and blocks of brownstones have been lovingly restored by new owners in recent decades, and many of the larger homes converted to co-ops or condos or taken over by institutions. In recognition of the unique architectural gems that Park Slope offers―principally homes in the late Italianate, French Second Empire, neo-Grec, Victorian Gothic, Queen Anne, and Romanesque Revival styles―44 blocks of the neighborhood were designated as the Park Slope Historic District in 1973.
Prospect Park borders Park Slope along Prospect Park West and it is one of the neighborhood’s greatest assets. The 585-acre jewel was designed in the 1860s by Frederick Law Olmsted and Calvert Vaux, who also designed Central Park, and in the last 25 years has been restored to its original grandeur by a dedicated group of administrators, government officials, volunteers, and donors.
Today Prospect Park is the destination for millions of people annually including weekend athletes, who walk, jog, roller blade, or bicycle along Park Drive traveling the same route that soldiers in the Continental Army under George Washington took in August 1776 as they fled the British; children, who play on the parks playgrounds and soccer, baseball, and softball fields; picnickers, who celebrate birthdays and holidays with family and friends; ice skaters at the Wollman Rink; and visitors to the Prospect Park Zoo, Carousel, Lefferts Historic House, Picnic House, and Prospect Park Audubon Center & Visitor Center at the Boathouse. The 40-acre Parade Ground

on the southeast side of Prospect Park features basketball courts, baseball, softball, and soccer fields, and tennis courts.
Grand Army Plaza, which was designed in the style of dramatic European plazas like the Parisian Etoile, which showcases the Arc de Triomphe, provides a grand, sweeping introduction to Prospect Park and is a visible landmark for Park Slope. Park Slope also is a short walk from the Brooklyn Botanic Garden and Brooklyn Museum on Eastern Parkway, and Brooklyn Public Library’s Central Library at Grand Army Plaza.
The neighborhood is home to a number of actors, writers, and journalists as well as Wall Street bankers and lawyers, and boasts several desirable schools including PS 321, MS 51, Berkeley Carroll School, St. Saviour’s, and the lower school of Poly Prep Country Day School, which is located in an 1883 limestone, Romanesque Revival mansion on Prospect Park West.
Development Potential
Although 7th Avenue had been the main commercial corridor in Park Slope for many years, the upstart 5th Avenue is now rivaling the more mature commercial strip as the site for new, hip restaurants and cutting-edge stores.
The neighborhood’s most dramatic changes, however, are appearing along 4th Avenue due to the New York City Council’s vote in April 2003 to rezone sections of 4th Avenue to allow increased commercial and residential development. The rezoning promotes the construction of apartment houses with a maximum building height of 120 feet and a maximum base height of 85 feet between Warren and 15th Streets on 4th Avenue, while at the same time protecting the historic scale of the brownstone blocks in the interior sections of the neighborhood. Developers are already taking advantage of the new zoning and new, high rise residential housing is being constructed along 4th Avenue. In addition, on the Gowanus side of 4th Avenue, a Whole Foods is reportedly being built at 3rd Street, across from the neighborhood Staples store.
Additional rezoning has been approved by the City Council for the area south of Park Slope bounded by 15th Street, Fourth Avenue, Prospect Park West, and 24th Street and Greenwood Cemetery that would protect the low-rise character of the neighborhood, reinforce several avenue corridors for mixed retail/residential, and provide

opportunities for apartment house construction and affordable housing along 4th Avenue.
Four-story residential projects are continuing to be built throughout Park Slope, replacing former auto repair shops and other commercial properties, particularly between 4th and 5th Avenues. Other developments include a 100,000 square foot industrial building at 168 7th Street that will be converted to space for artists, designers, and craftspeople; a 47-unit condominium development near completion at the former site of the Brooklyn Tabernacle church on Flatbush Avenue off 7th Avenue; and a five-story, 32-unit luxury condominium project offered at 198-210 16th Street between 5th and 6th Avenues.
Sources: www.prospectpark.org,; Brooklyn, People and Places, Past and Present, by Grace Glueck and Paul Gardner, Harry N. Abrams, Inc., New York, New York City Department of City Planning, www.nyc-architecture.com, Brooklyn Daily Eagle, July 28, 2005; August 26, 2005, November 9, 2005, November 10, 2005, November 30, 2005, Park Slope Courier, November 21, 2005.
Business InformationPark Slope Civic Council357 9th Street, Brooklyn, NY 11215. 718-832-8227
Park Slope Chamber of Commerce, www.parkslopeshops.com
Political and Community ContactsCommunity Board 6, 250 Baltic Street, Brooklyn, NY 11201, 718-
643-3027New York City Council 33, David Yassky, 718-875-5200, [email protected] York City Council 39, Bill deBlasio, 718-854-9791,
[email protected] Assembly 52, Joan L. Millman, 718-246-4889,
[email protected] Assembly 44, James F. Brennan, 718-788-7221, [email protected] Senate 18, Velmanette Montgomery, 718-643-6140, [email protected] Senate 20, Carl Andrews, 718-284-4700,
[email protected] Congress 11, Major Owens, 718-773-3100,
www.house.gov/owens/ US Congress 12, Nydia M. Velazquez, 718-599-3658,
www.house.gov/velazquez/ Source: NYC Department of City Planning; NYC Districting Commission, NYPIRG CMAP

Location Park Slope is roughly bounded by Fourth Avenue, Prospect Park West, Flatbush Avenue, and 15th Street, although some extend the southern boundaries to the Prospect Expressway.
Park Slope Demographics2000 Census Report within a .75 mile radius as noted in the map above.
Total Population 67,235
Race/Ethnicity (Total Population)White 39,739 59.1 percentBlack 7,311 10.9 percentNative American 137 0.2 percentAsian 3,413 5.1 percentOther 2,855 4.2 percentHispanic (any race) 13,780 20.5 percent
Sex (Total Population)Male 31,671 47.1 percentFemale 35,564 52.9 percent

Age (Total Population)Age 0 to 4 3,794 5.6 percent
5 to 9 3,775 5.6 percent10 to 20 5,829 8.7 percent21 to 29 12,762 19.0 percent30 to 39 15,730 23.4 percent40 to 49 11,183 16.6 percent50 to 59 7,174 0.7 percent60 to 64 1,706 2.5 percentAge 65+ 5,282 7.9 percent
Education (Population Age 25+)Total population age 25+ 49,574 100 percentLess than 9th grade 6,122 6.3 percent9-12 Grade 3,534 7.1 percentHigh School 5,852 11.8 percentSome College 5,969 12.0 percentAssociate Degree 2,020 4.1 percentBachelor Degree 14,491 29.2 percentGraduate Degree 14,586 29.4 percent
Employment Status (Population Age 16+)Total population age 16+ 56,348 100 percentNot in labor force 14,435 25.6 percentLabor force 41,913 74.4 percent
Labor Force StatusTotal Labor Force Age 16+ 41,913 100 percentArmed Forces 14 0.0 percentCivilian 39,861 95.1 percentUnemployed 2,038 4.9 percent
Employed Civilian OccupationTotal employed civilians,Age 16+ 39,861 100 percentAgriculture 7 0.0 percentConstruction 646 1.6 percentEducation 5,087 12.8 percentEntertainment 3,738 9.4 percentF.I.R.E. 4,249 10.7 percentHealth 4,262 10.7 percentManufacturing 1,613 4.0 percentMining 9 0.0 percentOther services 1,779 4.5 percentProf/Tech/Science 7,290 18.3 percent

Public Administration 1,690 4.2 percentRetail 2,473 6.2 percentTrans./Warehouse 1,234 3.1 percentWholesale 810 2.0 percent
HouseholdsTotal households 30,606 100 percentFamily households 14,330 46.8 percent
Income (Total Household)Under $10,000 2,545 8.3 percent$10,000-20,000 2,342 7.7 percent$20,000-30,000 2,465 8.1 percent$30,000-40,000 2,860 9.3 percent$40,000-50,000 2,898 9.5 percent$50,000-60,000 2,692 8.8 percent$60,000-75,000 3,697 12.1 percent$75,000-100,000 3,924 12.8 percent$100,000-150,000 4,022 13.1 percent$150,000-200,000 1,337 4.4 percentOver $200,000 1,824 6.0 percent
Occupied HousingTotal Occupied Housing 30,586 100
percentOwner Occupied 10,044 32.8 percentRenter Occupied 20,542 67.2 percent
Household Size (Total Occupied)1 person 11,277 36.9 percent2 person 10,258 33.5 percent3 person 4,592 15.0 percent4 person 2,806 9.2 percent5 person 1,033 3.4 percent6 person 363 1.2 percentOver 7 person 257 0.8 percent
Prospect Heights
Grand Army Plaza, which Frederick Law Olmsted and Calvert Vaux designed in the style of dramatic European plazas like the Parisian Etoile where the Arc de Triomphe is located, provides a grand, sweeping introduction to both Prospect Park and the neighborhood of Prospect Heights.

In addition, the neighborhood is home to a slice of Eastern Parkway, also designed by Olmsted and Vaux, a boulevard lined with luxury apartment buildings on its northern side and the Brooklyn Museum, Brooklyn Botanic Garden, and Brooklyn Public Library’s Central Library at Grand Army Plaza on its southern side. Apartment buildings surround the area around the plaza, but the streets between Flatbush and Washington Avenues are quiet and tree-lined and feature stately, restored brownstones.
Like other central Brooklyn neighborhoods, Prospect Park is one of the neighborhood’s greatest assets. Olmsted and Vaux designed this 585-acre jewel in the 1860s and in the last 25 years it has been restored to its original grandeur by a dedicated group of administrators, government officials, volunteers, and donors. Today Prospect Park is the destination for millions of people annually including weekend athletes, who walk, jog, roller blade, or bicycle along Park Drive traveling the same route that soldiers in the Continental Army under George Washington took in August 1776 as they fled the British; children, who play on the parks playgrounds and soccer, baseball, and softball fields; picnickers, who celebrate birthdays and holidays with family and friends; ice skaters at the Wollman Rink; and visitors to the Prospect Park Zoo, Carousel, Lefferts Historic House, Picnic House, and Prospect Park Audubon Center & Visitor Center at the Boathouse. The 40-acre Parade Ground on the southeast side of Prospect Park features basketball courts, baseball, softball, and soccer fields, and tennis courts.
Development Potential
The intersection of Flatbush and Atlantic Avenues in Prospect Heights is the site of the proposed 18,000 seat arena for the Nets basketball team, which would make the Brooklyn Nets the first major league professional team to play in the borough since the Brooklyn Dodgers left in the 1950s. Forest City Ratner Companies, which has developed retail malls and shops and a commercial building on other corners of the intersection, purchased the Atlantic/Vanderbilt Railroad Yards from the Metropolitan Transit Authority in September 2005. The firm has proposed building the arena and 17 high rise buildings consisting of more than 4,000 units of market-rate and affordable housing and commercial and retail development on a 21-acre site along Atlantic Avenue from Flatbush Avenue to Vanderbilt Avenue. The project is now subject to the review and approval of a series of government entities.

Sources: www.prospectpark.org,; Brooklyn, People and Places, Past and Present, by Grace Glueck and Paul Gardner, Harry N. Abrams, Inc., New York, Park Slope Courier, September 19, 2005, Office of Mayor Michael Bloomberg.
Business InformationWashington Avenue Merchants Association72 Washington Avenue, Brooklyn, NY 11238, 718-636-4685
Political and Community ContactsCommunity Board 8, 1291 St. Marks Avenue, Brooklyn, NY
11213, 718-467-5574New York City Council 35, Letitia James, 718-260-9191, [email protected] Assembly 52, Joan L. Millman, 718-246-4889,
[email protected] Senate 20, Carl Andrews, 718-284-4700, [email protected] Congress, Major Owens, 718-773-3100,
www.house.gov/owens/ Source: NYC Department of City Planning; NYC Districting Commission, NYPIRG CMAP
Location

Prospect Heights is bordered by Flatbush Avenue, Atlantic Avenue, Eastern Parkway, and Washington Avenue.
Prospect Heights Demographics2000 Census Report within a .35 mile radius as noted in the map above.
Total Population 18,031 100 percent
Race/Ethnicity (Total Population)White 7,403 41.1 percentBlack 6,619 36.7 percentNative American 48 0.3 percentAsian 913 5.1 percentOther 685 3.8 percentHispanic (any race) 2,363 13.1 percent
Sex (Total Population)Male 8,327 46.2 percentFemale 9,704 53.8 percent
Age (Total Population)Age 0 to 4 924 5.1 percent
5 to 9 714 4.0 percent10 to 20 1,884 10.4 percent21 to 29 3,700 20.5 percent30 to 39 4,285 23.8 percent40 to 49 2,767 15.3 percent50 to 59 2,003 11.1 percent60 to 64 625 3.5 percentAge 65+ 1,129 6.3 percent
Education (Population Age 25+)Total population age 25+ 13,362 100 percentLess than 9th grade 574 4.3 percent9-12 Grade 915 6.8 percentHigh School 1,534 11.5 percentSome College 1,889 14.1 percentAssociate Degree 460 3.4 percentBachelor Degree 4,071 30.5 percentGraduate Degree 3,919 29.3 percent
Employment Status (Population Age 16+)Total population age 16+ 15,465 100 percentNot in labor force 3,817 24.7 percentLabor force 11,648 75.3 percent

Labor Force StatusTotal Labor Force Age 16+ 11,648 100 percentArmed Forces 0 0.0 percent
Civilian 11,090 95.2 percentUnemployed 558 4.8 percent
Employed Civilian OccupationTotal employed civilians,Age 16+ 11,090 100 percentAgriculture 0 0.0 percentConstruction 151 1.4 percentEducation 1,382 12.5 percentEntertainment 885 8.0 percentF.I.R.E. 1,180 10.6 percentHealth 1,235 11.1 percentManufacturing 372 3.4 percentMining 0 0.0 percentOther services 583 5.3 percentProf/Tech/Science 2,053 18.5 percentPublic Administration 388 3.5 percentRetail 647 5.8 percentTrans./Warehouse 425 3.8 percentWholesale 239 2.2 percent
HouseholdsTotal households 8,470 100 percentFamily households 3,707 43.8 percent
Income (Total Household)Under $10,000 736 8.7 percent$10,000-20,000 507 6.0 percent$20,000-30,000 808 9.5 percent$30,000-40,000 777 9.2 percent$40,000-50,000 906 10.7 percent$50,000-60,000 742 8.8 percent$60,000-75,000 1,075 12.7 percent$75,000-100,000 1,162 13.7 percent$100,000-150,000 1,048 12.4 percent$150,000-200,000 278 3.3 percentOver $200,000 431 5.1 percent
Occupied HousingTotal Occupied Housing 8,608 100
percentOwner Occupied 2,736 31.8 percent

Renter Occupied 5,872 68.2 percent
Household Size (Total Occupied)1 person 3,478 40.4 percent2 person 2,879 33.4 percent3 person 1,156 13.4 percent4 person 564 6.6 percent5 person 255 3.0 percent6 person 164 1.9 percentOver 7 person 112 1.3 percent
Red Hook Stores c. 1880, Joseph Hall, photographer. Courtesy Brooklyn Historical Society.
Red Hook
Once a loud and bustling port where thousands of longshoremen crowded onto the piers to unload raw sugar, grain, cotton, coffee, spices, tobacco, and other cargo from ships anchored in New York

Harbor, and local businesses mushroomed to support the burgeoning shipping industry, Red Hook’s cobblestone streets are quiet and peaceful today.
The introduction of container shipping in the 20th Century prompted the shipping industry to move from Red Hook to ports in New Jersey and other southern locations, and the Civil War-era warehouses on the piers left behind lapsed into disrepair until about 15 years ago when a local developer began rescuing and refurbishing them for light industrial and professional office use. Now the Statue of Liberty and brilliant skyline of Manhattan are visible from the arched windows of the renovated warehouses―Pier 41 and the Beard Street Warehouse―and the soothing sound of water lapping on the shore can be heard.
Residents from other Brooklyn neighborhoods and beyond visit Red Hook because of its cultural activities such as the Waterfront Museum and Showboat Barge at Pier 44, summer concert series, art shows, and local entertainment, and recreational activities at Red Hook Park, which offers baseball, softball, soccer, and cricket fields, basketball courts, playgrounds, and a swimming pool.
Development Potential In recent decades artist studios joined the mix of industrial and residential properties that co-existed in Red Hook for generations. New developments are planned for the waterfront area including the following:
An IKEA superstore. A Fairway Market with 45 condos above it in the historic Red
Hook Stores Warehouse building. A $30 million modern cruise terminal that is currently being
developed by the public sector on Piers 11 and 12 to accommodate the Carnival Corporation, which entered into an agreement with the City to make the Brooklyn piers its home in the New York area for the Princess and Cunard lines. The first Carnival cruise ship pull into a temporary facility in September 2005, and the Queen Mary 2 will be the first ship to dock at the completed pier in April 2006. Also, the New York City Economic Development Corporation is considering new uses for the remaining piers that extend to Atlantic Avenue.
In September 2005, Thor Equities announced it had bought the old Revere Sugar refinery across from the Beard Street warehouses
In October 2005, the Fifth Avenue Committee broke ground on a new 60-unit, co-op development for middle-income New Yorkers

on City-owned lots at 71 and 79 Wolcott Street and 135 Coffey Street.
With its stunning, waterfront views, Red Hook features vacant lots ready to be developed and architecturally and historically rich 19th Century buildings waiting to be renovated and preserved.
Sources: Brooklyn Daily Eagle, September 2, 2005, September 7, 2005; September 28, 2005, October 4, 2005, December 29, 2005; Park Slope Courier, October 3, 2005, Brooklyn’s Progress, October/November 2005; Mayor Michael Bloomberg, www.SWBIDC.org.
Business Information
Southwest Brooklyn Industrial Development CorporationEmpire Zone Information718-965-3100www.swbidc.org
Source: NYC Department of Small Business Services, NYC Economic Development Corporation, BEDC
Political and Community ContactsCommunity Board 7, 4201 4th Avenue, Brooklyn, NY 11232, 718-
854-0003New York City Council 38, Sara M. Gonzalez, 718-439-9012, [email protected] Assembly 51, Felix Ortiz, 718-492-6334,
[email protected] Senate 18, Velmanette Montgomery, 718-643-6140, [email protected] Congress, Jerrold Nadler, 212-367-7350,
[email protected]: NYC Department of City Planning; NYC Districting Commission, NYPIRG CMAP

Red Hook Demographics2000 Census Report within a one-mile radius as noted in the map aboveTotal Population 27,993
Race/Ethnicity (Total Population)White 12,254 43.8 percentBlack 5,119 18.3 percentNative American 165 0.6 percentAsian 709 2.5 percentOther 1,162 4.2 percentHispanic (any race) 8,584 30.7 percent
Sex (Total Population)Male 13,012 46.5 percentFemale 14,981 53.5 percent
Age (Total Population)Age 0 to 4 1,823 6.5 percent
5 to 9 1,878 6.7 percent10 to 20 3,533 12.6 percent21 to 29 4,834 17.3 percent30 to 39 6,011 21.5 percent

40 to 49 3,724 13.3 percent50 to 59 2,743 9.8 percent60 to 64 891 3.2 percentAge 65+ 2,556 9.1 percent
Education (Population Age 25+)Total population age 25+ 19,064 100 percentLess than 9th grade 2,086 10.9 percent9-12 Grade 2,979 15.6 percentHigh School 3,771 19.8 percentSome College 2,281 12.0 percentAssociate Degree 762 4.0 percentBachelor Degree 4,316 22.6 percentGraduate Degree 2,869 15.0 percent
Employment Status (Population Age 16+)Total population age 16+ 22,227 100 percentNot in labor force 7,933 35.7 percentLabor force 14,294 64.3 percent
Labor Force StatusTotal Labor Force Age 16+ 14,294 100 percentArmed Forces 0 0.0 percent
Civilian 13,123 91.8 percentUnemployed 1,171 8.2 percent
Employed Civilian OccupationTotal employed civilians,Age 16+ 13,123 100 percentAgriculture 19 0.1 percentConstruction 542 4.1
percentEducation 1,471 11.2 percentEntertainment 1,300 9.9 percentF.I.R.E. 1,289 9.8 percentHealth 1,253 9.5 percentManufacturing 705 5.4 percentMining 0 0.0 percentOther services 605 4.6 percentProf/Tech/Science 2,068 15.8 percentPublic Administration 610 4.6 percentRetail 996 7.6 percentTrans./Warehouse 715 5.4 percentWholesale 251 1.9 percent
Households

Total households 12,263 100 percentFamily households 6,656 55.3
percent
Income (Total Household)Under $10,000 2,223 18.1 percent$10,000-20,000 1,562 12.7 percent$20,000-30,000 1,321 10.8 percent$30,000-40,000 1,109 9.0 percent$40,000-50,000 1,057 8.6 percent$50,000-60,000 954 7.8 percent$60,000-75,000 1,175 9.6 percent$75,000-100,000 1,178 9.6 percent$100,000-150,000 875 7.1
percent$150,000-200,000 400 3.3
percentOver $200,000 409 3.3
percent
Occupied HousingTotal Occupied Housing 12,215 100
percentOwner Occupied 2,344 19.2 percentRenter Occupied 9,871 80.8 percent
Household Size (Total Occupied)1 person 4,255 34.8 percent2 person 4,041 33.1 percent3 person 1,795 14.7 percent4 person 1,174 9.6 percent5 person 532 4.4 percent6 person 204 1.7 percentOver 7 person 214 1.8 percent
Sea Gate
Surrounded by the ocean on three sides and protected from outsiders by two secured entrances on the Coney Island border, Sea Gate is an exclusive community featuring private beaches, 43 blocks of 900 single family, detached homes, and no stores.
The 1899 founding of the Sea Gate Association, whose members owned land or homes in the community and included the Vanderbilt, Morgan, and Dodge families, marked the beginning of the

development of the restricted community. Gates were built at Surf, Mermaid, and Neptune Avenues and a 12-foot high fence installed to the edge of the water. Today, the neighborhood even has its own police department with the Sea Gate police responsible for enforcing laws in the community, checking residents’ photo ids, and monitoring incoming cars.
Atlantic Yacht Club, which was designed by Stanford White, was active in Sea Gate from the 1890s until 1930 when it was destroyed in a fire. Sea Gate claims New York Governor and presidential candidate Al Smith; opera singer Beverly Sills; actress Sarah Bernhardt, and writer Isaac Bashevis Singer among its famous residents. The Neighborhoods of Brooklyn, Yale University Press, New Haven and London;
Political and Community ContactsCommunity Board 13, 2900 West 8th Street, Brooklyn, NY 11224, 718-266-3001New York City Council 47, Domenic M. Recchia, Jr., [email protected] Assembly 46, Adele Cohen, 718-266-0267,
[email protected] Senate 23, Diane Savino, 718-727-9406, [email protected] Congress 8, Jerrold Nadler, 212-367-7350,
www.house.gov/nadler/ Source: NYC Department of City Planning; NYC Districting Commission, NYPIRG CMAP

Location
Sea Gate is bounded by the ocean on three sides and the border it shares with Coney Island, 37th Street.
Sea Gate Demographics2000 Census Report within a .25 mile radius as noted in the map above.
Total Population 4,441 100 percent
Race/Ethnicity (Total Population)White 2,964 66.7 percentBlack 573 12.9 percentNative American 0 0.0 percentAsian 142 3.2 percentOther 321 7.2 percentHispanic (any race) 441 9.9 percent
Sex (Total Population)Male 2,133 48.0 percentFemale 2,308 52.0 percent

Age (Total Population)Age 0 to 4 257 5.8 percent
5 to 9 343 7.7 percent10 to 20 792 17.8 percent21 to 29 583 13.1 percent30 to 39 503 11.3 percent40 to 49 675 15.2 percent50 to 59 507 11.4 percent60 to 64 199 4.5 percentAge 65+ 582 13.1 percent
Education (Population Age 25+)Total population age 25+ 2,688 100 percentLess than 9th grade 216 8.0 percent9-12 Grade 433 16.1 percentHigh School 800 29.8 percentSome College 337 12.5 percentAssociate Degree 149 5.5 percentBachelor Degree 432 16.1 percentGraduate Degree 321 11.9 percent
Employment Status (Population Age 16+)Total population age 16+ 3,402 100 percentNot in labor force 1,729 50.8 percentLabor force 1,673 49.2 percent
Labor Force StatusTotal Labor Force Age 16+ 1,673 100 percentArmed Forces 0 0.0 percent
Civilian 1,424 85.1 percentUnemployed 249 14.9 percent
Employed Civilian OccupationTotal employed civilians,Age 16+ 1,424 100 percentAgriculture 0 0.0 percentConstruction 64 4.5 percentEducation 189 13.3 percentEntertainment 98 6.9 percentF.I.R.E. 198 13.9 percentHealth 149 10.5 percentManufacturing 89 6.3 percentMining 0 0.0 percentOther services 54 3.8 percentProf/Tech/Science 116 8.1 percentPublic Administration 82 5.8 percent

Retail 173 12.1 percentTrans./Warehouse 89 6.3 percentWholesale 80 5.6 percent
HouseholdsTotal households 1,628 100 percentFamily households 962 59.1 percent
Income (Total Household)Under $10,000 466 28.6 percent$10,000-20,000 154 9.5 percent$20,000-30,000 190 11.7 percent$30,000-40,000 116 7.1 percent$40,000-50,000 219 13.5 percent$50,000-60,000 90 5.5 percent$60,000-75,000 125 7.7 percent$75,000-100,000 98 6.0 percent$100,000-150,000 101 6.2 percent$150,000-200,000 56 3.4 percentOver $200,000 13 0.8 percent
Occupied HousingTotal Occupied Housing 1,601 100 percentOwner Occupied 588 36.7 percentRenter Occupied 1,013 63.3 percent
Household Size (Total Occupied)1 person 614 38.4 percent2 person 291 18.2 percent3 person 269 16.8 percent4 person 215 13.4 percent5 person 106 6.6 percent6 person 35 2.2 percentOver 7 person 71 4.4 percent
Sheepshead Bay(Includes Plumb Beach, Homecrest, and Madison)
The cool ocean breezes and location on the Sheepshead Bay inlet made Sheepshead Bay an ideal destination for tourists. Hotels began arriving in the early 1800s, with Sam Leonard’s Hotel opening in 1833, the McMahon Bayside Hotel opening in 1873, and Tappen’s Hotel

operating from 1845 to 1948. Tourists also enjoyed the area’s fine seafood restaurants and casinos.
Beginning around 1880 the Coney Island Jockey Club opened a horse racing track, the Sheepshead Bay Race Track, in the area of Ocean Avenue, Jerome Avenue, Gravesend Neck Road, and Knapp Street. New laws passed in 1910 made horse racing unprofitable, so the track added other attractions. In 1915, it was converted to the Sheepshead Bay Speedway for auto and motorcycle racing, but that operation closed in 1919.
Sheepshead Bay’s development also was linked to improved transportation, which initially meant the extension of the railroad lines in the 1870s, and decades later the extension of the Belt Parkway around 1940.
The first farm in the area sold for development in 1877, and housing was later built on the former site of the Sheepshead Bay Race Track. At the northern end of Sheepshead Bay in an area called Homecrest, single family, Victorian homes were built at the turn of the 20th Century, and the area surrounding James Madison High School is known as Madison and features graceful homes on tree lined streets. In the 1920s and 1930s, homes were built near the Sheepshead Bay Road subway stop; six- to eight-story apartments were built on Ocean and Nostrand Avenues; summer homes were winterized for year round use; and in the 1950s, two-family, brick attached row homes were constructed in the eastern section of the neighborhood. By the 1960s, Sheepshead Bay the fastest growing area of Brooklyn. The area called Plumb Beach has been part of Gateway National Recreation Area since 1972.
The area’s history as an agrarian community is still visible, however, in the Dutch Colonial style of architecture that includes two New York City landmarks―the Wyckoff-Bennett Homestead, built in 1766 at the intersection of Kings Highway and East 22nd Street, and the Elias Hubbard Ryder House built in 1834 at 1926 East 28th Street.
Families appreciate the neighborhood schools including Madison High School, Bay Academy of Arts and Sciences, a magnet middle school for gifted students on Emmons Avenue at Shore Boulevard, and St. Edmund’s High School.
Development Potential

Today, Sheepshead Bay is experiencing a renaissance in the following ways:
Professional and recreational fishermen continue to leave daily from the Sheepshead Bay piers;
Lundy’s, which closed in 1979, reopened in 1995 at the northwest corner of Emmons and Ocean Avenue;
Loehmann’s at Seaport Plaza features stores and restaurants; The Sunrise Assisted Living facility opened in the community; Baku Palace, a French and Russian restaurant opened; The Greek restaurant, Yiasou Estiatorio, opened in March 2005
on Emmons and Ocean Avenues; Brooklyn Lobster, a movie about Emmons Avenue restaurant
Jordan’s Lobster Dock, starring Danny Aiello and Jane Curtain, premiered in November 2005;
A luxury waterfront condominium development with 19 luxury townhouses opened at 2908 Emmons Avenue in November 2005. Prices range from $725,000 to $1.6 million. The complex is one of at least 10 residential developments planned for both sides of Emmons Avenue.
Street improvements to Emmons Avenue also are planned. At the northern end of Sheepshead Bay, a 140,000 square foot,
mixed-use development is being built on the site of municipal parking lots between Avenue P and Kings Highway and East 14th and East 15th Streets.
Sheepshead Bay is developing so rapidly that the Department of City Planning has stepped in to ensure that the development is compatible with the area.
To protect the low-rise nature of the area bordered by Emmons Avenue, East 27th, Shore Parkway, and the mid-block of Ford Street from out-of-character development, the Department of City Planning proposed in September 2005 rezoning part of the eight-block area in Sheepshead Bay and amending the Special Sheepshead Bay District. The proposal would change the zoning to limit new residential development to one- and two-family homes and would protect the area from incompatible development. After reviewing the proposal, Community Board 15 wants Emmons Avenue used as a commercial street with restaurants, cafes, retail and tourist attractions.
The Department of City Planning also proposed in September 2005 zoning map changes for an area of about 70 blocks in the Homecrest area of Community District 15 to “preserve the existing neighborhood scale and character with lower density and contextual zoning districts.”

Rezoning is proposed in a predominantly residential area that is bordered by Coney Island Avenue, Kings Highway, Ocean Avenue, and Avenue S, and includes a study area on both sides of Ocean Avenue to Voorhies Avenue and the south side of Kings Highway between Ocean and Nostrand Avenues.
In this area there are two- and three-story homes, and corridors of apartment houses on Ocean Avenue, East 12th and East 13th Streets, and parts of Kings Highway. Commercial activity is concentrated on Kings Highway and parts of Ocean Avenue. The proposal would allow residential development on wide streets where apartment buildings already exist such as Ocean Avenue and Kings Highway and side streets near subway stations. Community Board 15 is seeking to maintain commercial businesses on Coney Island Avenue between Avenues P and R.
The proposal was made because recent construction has included out-of-scale apartment buildings up to seven stories high on blocks where there are mostly low-rise homes. The existing zoning allows increased floor area when community facilities are included.
Sources: The Neighborhoods of Brooklyn, Yale University Press, New Haven and London; Brooklyn Daily Eagle, June 2, 2005, September 19, 3005, October 13, 2005, November 14, 2005; Courier Life Publications, November 7, 2005; New York Times, March 30, 2003; New York City Department of City Planning; .
Business InformationBay Improvement Group, 30 Dooley Street, Brooklyn, N.Y. 11235,
718-646-9206
Political and Community ContactsCommunity Board 15, Kingsboro College, 2001 Oriental Boulevard, Brooklyn, NY, 11235, 718-332-3008NYC Council 46, Lewis A. Fidler, 718-241-9330,
[email protected] Assembly 41, Helene E. Weinstein, 718-648-4700, [email protected] Senate 27, Carl Kruger, 718-743-8610,
[email protected] Congress 9, Anthony Weiner, 718-520-9001,
www.house.gov/weiner/ Source: NYC Department of City Planning; NYC Districting Commission, NYPIRG CMAP

LocationThe boundaries of Sheepshead Bay are roughly Sheepshead Bay, Ocean Parkway, Avenue P, and Nostrand Avenue, Gerritsen Avenue, Knapp Street, and Shell Bank Avenue on the east.
Sheepshead Bay and Manhattan Beach Demographics2000 Census Report within a .90 mile radius as noted in the map above.
Total Population 75,647 100 percent
Race/Ethnicity (Total Population)White 53,394 70.6 percentBlack 4,192 5.5 percentNative American 122 0.2 percentAsian 11,341 15.0 percentOther 1,575 2.1 percentHispanic (any race) 5,023 6.6 percent
Sex (Total Population)Male 35,526 47.0 percentFemale 40,121 53.0 percent

Age (Total Population)Age 0 to 4 3,490 4.6 percent
5 to 9 4,017 5.3 percent10 to 20 9,561 12.6 percent21 to 29 8,321 11.0 percent30 to 39 10,399 13.7 percent40 to 49 11,869 15.7 percent50 to 59 9,696 12.8 percent60 to 64 4,007 5.3 percentAge 65+ 14,287 18.9 percent
Education (Population Age 25+)Total population age 25+ 54,759 100 percentLess than 9th grade 4,626 8.4 percent9-12 Grade 6,769 12.4 percentHigh School 15,321 28.0 percentSome College 8,151 14.9 percentAssociate Degree 4,055 7.4 percentBachelor Degree 9,401 17.2 percentGraduate Degree 6,436 11.8 percent
Employment Status (Population Age 16+)Total population age 16+ 62,786 100 percentNot in labor force 29,307 46.7 percentLabor force 33,479 53.3 percent
Labor Force StatusTotal Labor Force Age 16+ 33,479 100 percentArmed Forces 22 0.1 percentCivilian 31,094 92.9 percentUnemployed 2,363 7.1 percent
Employed Civilian OccupationTotal employed civilians,Age 16+ 31,094 100 percentAgriculture 13 0.0 percentConstruction 1,290 4.1 percentEducation 3,448 11.1 percentEntertainment 1,720 5.5 percentF.I.R.E. 3,879 12.5 percentHealth 4,679 15.0 percentManufacturing 2,476 8.0 percentMining 7 0.0 percentOther services 1,621 5.2 percentProf/Tech/Science 3,033 9.8 percent

Public Administration 1,459 4.7 percentRetail 2,732 8.8 percentTrans./Warehouse 2,527 8.1 percentWholesale 1,067 3.4 percent
HouseholdsTotal households 30,215 100 percentFamily households 20,022 66.3 percent
Income (Total Household)Under $10,000 4,505 14.9 percent$10,000-20,000 4,272 14.1 percent$20,000-30,000 3,657 12.1 percent$30,000-40,000 3,142 10.4 percent$40,000-50,000 2,739 9.1 percent$50,000-60,000 2,483 8.2 percent$60,000-75,000 2,731 9.0 percent$75,000-100,000 3,391 11.2 percent$100,000-150,000 2,314 7.7 percent$150,000-200,000 629 2.1 percentOver $200,000 352 1.2 percent
Occupied HousingTotal Occupied Housing 30,079 100 percentOwner Occupied 13,294 44.2 percentRenter Occupied 16,785 55.8 percent
Household Size (Total Occupied)1 person 9,141 30.4 percent2 person 9,036 30.0 percent3 person 5,361 17.8 percent4 person 3,778 12.6 percent5 person 1,761 5.9 percent6 person 540 1.8 percentOver 7 person 462 1.5
percent
Sunset Park
Sunset Park is a city within a city that features many distinct ethnic communities, including Brooklyn’s own Chinatown on 8th Avenue, historic homes, multiple commercial corridors, acres of green space, and an industrial district that employs 20,000 people.

The industrial park dates to the late 19th Century when Irving T. Bush purchased a popular oceanfront picnic area called Ambrose Park and in 1890 began building a port to rival Manhattan’s. The result was Bush Terminal, a 200-acre site consisting of 18 piers for 25 steamships lines, warehouses, display rooms, and factory lofts.
The nearby Brooklyn Army Terminal was built in 1918 and processed millions of soldiers between World War I and the Vietnam War, with more than 10,000 civilians responsible for shipping 80 percent of America’s soldiers and supplies during World War II. A young singer/solider named Elvis Presley stopped at the terminal in the late1950s on his way to serve in Europe, an occasion captured in photographs prominently displayed inside the main entrance to the building. The terminal was closed in the 1970s, but the City reopened it in 1987 and it’s now a 97-acre industrial facility used by businesses engaged in light industry or corporations seeking space for back office operations.
Bush Terminal and the Brooklyn Army Terminal are part of a concentrated area zoned for manufacturing within a 650-acre industrial park bordered by Prospect Avenue, the Gowanus Expressway, 65th Street and the waterfront. The district also is home to the South Brooklyn Marine Terminal, Industry City, and thriving businesses that include garment and food manufacturers, and furniture and steel production firms. Southwest Brooklyn Industrial Development Corporation (SWBIDC) administers the State-designated Southwest Brooklyn Empire Zone that offers wage tax credits, investment tax credits, employment incentive credits, sales tax credits, and other programs to assist businesses in the area.
From the Gowanus Expressway to 8th Avenue, Sunset Park features primarily brownstones, limestones, and brick and wood row houses built in the late 1800s and early 1900s that have attracted many families priced out of nearby Park Slope. The entire area between 4th and 7th Avenues and 38th and 64th Streets, though not a City landmark, is listed in the National Register of Historic Places.
The neighborhood gets its name from Sunset Park, a 24.5 acre park between Fifth and Seventh Avenues, 41st and 44th Streets, and a new recreation area is planned. The New York City Department of Economic Development has announced it is planning to convert five former industrial piers between 43rd Street and 50th Street into a park and wildlife habitat. The plans call for an indoor ice skating and hockey rink, a banquet hall, a moored party/restaurant boat and food vendors.

Sunset Park’s treasure, however, is Green-wood Cemetery created in 1838 on 478-acres that include a Gothic Revival gate at the 5th Avenue and 25th Street entrance, a quaint historic chapel, 20 miles of winding paths, rolling hills, abundant trees, lakes, and the graves of some of New York City’s most notable residents—Leonard Bernstein, Henry Ward Beecher, and Boss Tweed. The cemetery is so revered that the architect of a proposed condominium project at 23rd Street and 7th Avenue changed his design after residents and cemetery officials protested that the project would obstruct views of the Statue of Liberty from the historic Battle Hill in Green-Wood Cemetery.
Development Potential
In an area bounded by 15th Street, Fourth Avenue, Prospect Park West, and 24th Street and Green-wood Cemetery, the City Planning Commission is proposing zoning that would protect the low-rise character of the neighborhood, reinforce several avenue corridors for mixed retail/residential, and provide opportunities for apartment house construction and affordable housing along 4th Avenue. The commercial corridors of 4th, 5th, and 8th Avenues offer numerous opportunities for retail development, and side streets offer quality brownstone and limestone homes for residential use.
Firm’s seeking industrial space in Sunset Park’s industrial area can buy or rent property in the vast area zoned for manufacturing, which will enable them to apply for the State’s Empire Zone benefits. New projects in the industrial area include:
In November 2004, New York City Economic Development Corporation (EDC) announced an agreement with Axis Group Inc. to lease and develop a modern automobile-processing facility at the South Brooklyn Marine Terminal.
In September 2004, the department announced that Hugo Neu Schnitzer East, one of the nation’s largest scrap metal processors, planned to build a $25 million modern recycling facility at South Brooklyn Marine Terminal. The City will deliver to Hugo Neu all of the metal, glass, plastic, and a portion of the mixed paper that the Department of Sanitation currently collects through its residential curbside recycling program for the next 20 years.
In December 2005, the New York City Economic Development Corporation issued a request for proposals to identify a developer to partner with Brooklyn Economic Development Corporation and redevelop a 1.1 million square foot, eight-story building known as the Federal Building #2. The building will be renovated for use by small businesses.

In addition, local leaders are proposing that the Cross Harbor Rail Freight Tunnel be built under New York Harbor to link the nation’s rail system ending in New Jersey with existing rail lines east of the Hudson. The proposal recently received $100 million in federal transportation funding.
Sources: www.swbidc.com; The Neighborhoods of Brooklyn, Yale University Press, New Haven and London; New York City Department of Housing Preservation and Development; New York City Economic Development Corporation; Brooklyn, A Journey through the City of Dream’s, Universe Publishing, New York, NY; Brooklyn Economic Development Corporation; Brooklyn Daily Eagle, July 20, 2005, August 15, 2005; Brooklyn’s Progress, October/November 2005. Business Information
Southwest Brooklyn Industrial Development Corporation,241 41st Street, 2nd Floor, Brooklyn, NY 11232, 718-965-3100, www.swbidc.org
Sunset Park Business Improvement District, 476 51st Street, Brooklyn, NY 11220,
718-439-7767, www.sunsetparkbid.org
Brooklyn Chinese American Association718-438-9312
Neighbors Helping Neighbors718-492-3450, www.nhnhome.org
Source: NYC Department of Small Business Services, NYC Economic Development Corporation, BEDC
Political and Community ContactsCommunity Board 7, 4201 4th Avenue, Brooklyn, NY 11232, 718-
854-0003New York City Council 38, Sara M. Gonzalez, 718-439-9012, [email protected] Assembly 51, Felix Ortiz, 718-492-6334,
[email protected] Senate 18, Velmanette Montgomery, 718-643-6140, [email protected] Senate 20, Carl Andrews, 718-284-4700, [email protected] Congress 12, Nydia M. Velazquez, 718-599-3658,
www.house.gov/velazquez/ Source: NYC Department of City Planning; NYC Districting Commission, NYPIRG CMAP

LocationFrom either the Prospect Expressway or 24th Street, to 65th Street, and 8th Avenue to the waterfront, between Park Slope and Bay Ridge.
Sunset Park Demographics2000 Census Report within a one-mile radius as noted in the map above.
Total Population 123,376 100 percent
Race/Ethnicity (Total Population)White 24,469 19.8 percentBlack 2,735 2.2 percentNative American 107 0.1 percentAsian 30,868 25.0 percentOther 4,988 4.0 percentHispanic (any race) 60,209 48.8 percent
Sex (Total Population)Male 61,291 49.7 percentFemale 62,085 50.3 percent

Age (Total Population)Age 0 to 4 10,321 8.4 percent
5 to 9 10,091 8.2 percent10 to 20 20,723 16.8 percent21 to 29 19,212 15.6 percent30 to 39 20,476 16.6 percent40 to 49 16,838 13.6 percent50 to 59 10,829 8.8 percent60 to 64 3,745 3.0 percentAge 65+ 11,141 9.0 percent
Education (Population Age 25+)Total population age 25+ 73,619 100 percentLess than 9th grade 20,390 27.7 percent9-12 Grade 15,639 21.2 percentHigh School 18,311 24.9 percentSome College 7,850 10.7 percentAssociate Degree 2,826 3.8 percentBachelor Degree 5,360 7.3 percentGraduate Degree 3,243 4.4 percent
Employment Status (Population Age 16+)Total population age 16+ 92,190 100 percentNot in labor force 43,060 46.7 percentLabor force 49,130 53.3 percent
Labor Force StatusTotal Labor Force Age 16+ 49,130 100 percentArmed Forces 18 0.0 percent
Civilian 44,640 90.9 percentUnemployed 4,472 9.1 percent
Employed Civilian OccupationTotal employed civilians,Age 16+ 44,640 100 percentAgriculture 59 0.1 percentConstruction 2,620 5.9 percentEducation 2,361 5.3 percentEntertainment 5,299 11.9 percentF.I.R.E. 3,170 7.1 percentHealth 5,548 12.4 percentManufacturing 7,799 17.5 percentMining 0 0.0 percentOther services 2,830 6.3 percentProf/Tech/Science 3,333 7.5 percentPublic Administration 1,308 2.9 percent

Retail 4,598 10.3 percentTrans./Warehouse 2,430 5.4 percentWholesale 2,131 4.8 percent
HouseholdsTotal households 36,899 100 percentFamily households 27,842 75.5
percent
Income (Total Household)Under $10,000 6,532 17.7 percent$10,000-20,000 7,042 19.1 percent$20,000-30,000 5,627 15.2 percent$30,000-40,000 4,341 11.8 percent$40,000-50,000 3,756 10.2 percent$50,000-60,000 2,336 6.3 percent$60,000-75,000 2,811 7.6 percent$75,000-100,000 2,155 5.8 percent$100,000-150,000 1,601 4.3 percent$150,000-200,000 344 0.9 percentOver $200,000 354 1.0 percent
Occupied HousingTotal Occupied Housing 36,947 100
percentOwner Occupied 8,492 23.0 percentRenter Occupied 28,455 77.0 percent
Household Size (Total Occupied)1 person 7,333 19.8 percent2 person 7,662 20.7 percent3 person 6,575 17.8 percent4 person 6,524 17.7 percent5 person 4,215 11.4 percent6 person 2,410 6.5 percentOver 7 person 2,228 6.0 percent
Williamsburg(Includes North Side and South Side)
Like many neighborhoods along Brooklyn’s waterfront, Williamsburg in the mid-19th Century was a popular resort for the moneyed set who built sea side mansions or stayed in luxury hotels on the East River and spent their leisure time visiting beer gardens and private clubs.

Later the waterfront location proved ideal for the docks and warehouses serving distilleries, foundries, shipyards, sugar refineries, and internationally known corporations such as Pfizer Pharmaceutical, which still maintains a presence in Williamsburg, Havemeyer & Elder’s Sugar Refinery, which until 2004 produced Domino Sugar, Hecla Architectural Iron Works, which produced the bulk of the bronze and ironwork for Grand Central Terminal, and Schaefer Brewing Company, which operated in the community from 1916 to 1976.
As in Greenpoint, the capitalists running the manufacturing concerns generally lived in the community and Williamsburg featured many 19th Century homes. However, most of the elite moved on after the opening of the Williamsburg Bridge in 1903 when new residents, including immigrants from the Lower East Side, flooded the six-story tenements in the neighborhood. Between 1903 and 1917, the population of Williamsburg more than doubled and the area had the most densely populated blocks in Brooklyn.
Williamsburg is known as the setting of Betty Smith’s novel A Tree Grows in Brooklyn; the community in which comedian Mel Brooks and novelist Henry Miller were raised; the neighborhood where Peter Luger Steak House has been doing business since 1887; the location of the annual Feast of the Giglio; and the site of the Brooklyn Brewery, which opened in 1995, making it the first brewery in the area in 20 years.
While maintaining its diverse population of Hasidic Jews, Puerto Ricans, Dominicans, Poles, and Italians, Williamsburg has continued to evolve and change with the times and in recent years attracted thousands of writers, artists, and performers seeking affordable housing. Many artists discovered the community through the Williamsburg Art and Historical Center, founded in 1996 and housed in the Kings County Savings Bank, which is on the National Register of Historic Places and was the seventh building to be landmarked in New York City. Developers followed the artists and in recent years many have converted buildings or constructed new ones.
A new Brooklyn guidebook, eat.shop.brooklyn, promotes the hip culture in Williamsburg and highlights 20 Williamsburg shops out of 45 listed for the entire borough, and 12 Williamsburg restaurants out of 43 listed.
Some sections of the community reserved for manufacturing, including the Pfizer plant area, are part of the State-designated North Brooklyn-Brooklyn Navy Yard Empire Zone. Administered by the East Williamsburg Valley Industrial Development Corporation (EWVIDCO),

the Empire Zone offers businesses located within it financial and tax incentives. In addition, the Boricua College Small Business Development Center is located nearby and also supports small businesses by offering seminars, assisting with business plans, and helping identify funding sources.
Development Potential
After World War II, manufacturers abandoned the waterfront when highways and truck transportation replaced waterways and ships as the most desirable way to move goods. As a result, the New York City Council voted in May 2005 to reclaim two miles of neglected waterfront and rezone it from manufacturing to residential use. The rezoning will allow for thousands of units of housing, including affordable housing, in new rental and condominium developments and new commercial development. The new designation allows for light industrial and residential uses to coexist in certain areas, retains manufacturing zoning for concentrations of industry, and provides a blueprint for a continuous publicly accessible esplanade and new public open spaces along the waterfront in a 27.8 acre park surrounding the Bushwick Inlet.
Within a short time, the zoning change prompted many owners to offer buildings for sale and developers to announce new residential projects along the waterfront. The following list offers a sampling of the activity:
In January 2006, a development group made a presentation before Community Board 1 to demolish buildings formerly owned by Royal Wine Company at 420-430 Kent Avenue and replace them with two residential towers—one 18 stories high and the other 24 stories high. Together the buildings would have 450 apartments, 26,413 of retail space, and 225 parking spaces.
In the Fall of 2005, the City Council and Landmarks Preservation Commission battled over whether a Williamsburg warehouse at 184 Kent Avenue on the waterfront should be a landmark or luxury housing. The City Council voted to allow the developer to redesign the six-story former grocery warehouse for residential use and add floors of apartments to the roof.
In October 2005, Mayor Michael Bloomberg announced that the City would help finance a project with 117 units of affordable housing on the Williamsburg waterfront as part of Phase 1 of a larger development of 900 units at Palmer’s Dock on Kent Avenue.

In September 2005, a 40-unit condominium development was announced at the corner of Kent Avenue and North 8th Street, opposite the proposed new state park on the waterfront.
In September 2005, 70 percent of the condominiums in the North Tower at the Schaefer Landing waterfront development on the former site of the F&M Schaefer Brewery Company had been sold. Prices range from $650,000 to $2 million and the building will be ready for occupancy in June 2006. Some parts of Schaefer Landing will be set aside for affordable housing, however.
The 35-acre McCarren Park on the border of Greenpoint features a closed WPA-era swimming pool complex that local residents are seeking to refurbish and reopen. In November 2005, two condominium developments were under construction around the area of McCarren Park: The Lotus, a five-story building at 610 Union Avenue at the corner of Bayard Street, and Manhattan Park, an eight-story development at 297 Driggs Avenue, between Manhattan Avenue and Leonard Street, and other projects were being planned near the park.
A local newspaper reported preliminary plans to develop the former Domino Sugar Plant into a 1,000-unit, mixed use residential project.
Sources: www.nyc-architecture.com, 1939 WPA Guide to New York City on www.brooklyn.net/neighborhoods/williamsburg, http://wahcenter.net, New York City Department of City Planning; Williamsburg Reinvented, by Anna Bahney, New York Times, March 20, 2005, The Neighborhoods of Brooklyn, Yale University Press, New Haven and London, An Architectural Guidebook to Brooklyn, Gibbs Smith Publisher, Salt Lake City. Brooklyn Daily Eagle, July 27, 2005, September 8, 2005, September 15, 2005, September 20, 2005, October 14, 2005, December 19, 2005, January 11, 2006, January 13, 2006; Daily News, November 30, 2005.
Business InformationNorth Brooklyn Development Corporation126 Greenpoint Avenue, Brooklyn, NY 11222718-389-9044
Boricua College Small Business Development Center9 Graham Avenue, Brooklyn, NY 11206718-963-4112, ext. 565Source: NYC Department of Small Business Services, NYC Economic Development Corporation, BEDC, Brooklyn Chamber of Commerce.
Political and Community ContactsCommunity Board 1, 435 Graham Avenue, Brooklyn, NY 11211,
718-389-0009New York City Council 34, Diana Reyna, 718-963-3141, [email protected] Assembly 53, Vito J. Lopez, 718-963-7029,

NYS Senate 17, Martin Malave Dilan, 718-573-1726, [email protected] Congress, Nydia M. Velazquez, 718-599-3658,
www.house.gov/velazquez/ Source: NYC Department of City Planning; NYC Districting Commission, NYPIRG CMAP
LocationThe 1939 WPA Guide to New York City defined Williamsburg as an area from the Williamsburg Bridge to Flushing and Bushwick Avenues. In recent years, however, the boundaries have been moved up to include the areas previously known as South Side and North Side, on the border of Greenpoint, while part of the eastern section of what was previously known as Williamsburg is now considered East Williamsburg.
Williamsburg Demographics2000 Census Report within a .75 mile radius as noted in the map above.
Total Population 100,484

Race/Ethnicity (Total Population)White 44,968 44.8 percentBlack 4,430 4.4 percentNative American 85 0.1 percentAsian 3,514 3.5 percentOther 6,054 6.0 percentHispanic (any race) 41,433 41.2 percent
Sex (Total Population)Male 49,040 48.8 percentFemale 51,444 51.2 percent
Age (Total Population)Age 0 to 4 9,727 9.7 percent
5 to 9 9,463 9.4 percent10 to 20 18,483 18.4 percent21 to 29 16,457 16.4 percent30 to 39 14,498 14.4 percent40 to 49 12,055 12.0 percent50 to 59 7,653 7.6 percent60 to 64 2,779 2.8 percentAge 65+ 9,369 9.3 percent
Education (Population Age 25+)Total population age 25+ 55,462 100 percentLess than 9th grade 12,284 22.1 percent9-12 Grade 13,294 24.0 percentHigh School 12,762 23.0 percentSome College 6,116 11.0 percentAssociate Degree 1,823 3.3 percentBachelor Degree 6,132 11.1 percentGraduate Degree 3,051 5.5 percent
Employment Status (Population Age 16+)Total population age 16+ 71,175 100 percentNot in labor force 34,484 48.4 percentLabor force 36,691 51.6 percent
Labor Force StatusTotal Labor Force Age 16+ 36,691 100 percentArmed Forces 0 0.0 percentCivilian 32,666 89.0 percentUnemployed 4,025 11.0 percent
Employed Civilian OccupationTotal employed civilians,

Age 16+ 32,666 100 percentAgriculture 18 0.1 percentConstruction 1,767 5.4 percentEducation 3,091 9.5 percentEntertainment 3,135 9.6 percentF.I.R.E. 2,539 7.8 percentHealth 2,968 9.1 percentManufacturing 4,317 13.2 percentMining 0 0.0 percentOther services 2,054 6.3 percentProf/Tech/Science 3,541 10.8 percentPublic Administration 1,010 3.1 percentRetail 3,311 10.1 percentTrans./Warehouse 1,514 4.6 percentWholesale 1,522 4.7 percent
HouseholdsTotal households 33,362 100 percentFamily households 21,454 64.3 percent
Income (Total Household)Under $10,000 8,088 24.2 percent$10,000-20,000 6,483 19.4 percent$20,000-30,000 4,750 14.2 percent$30,000-40,000 3,938 11.8 percent$40,000-50,000 3,040 9.1 percent$50,000-60,000 2,130 6.4 percent$60,000-75,000 1,935 5.8 percent$75,000-100,000 1,694 5.1 percent$100,000-150,000 915 2.7 percent$150,000-200,000 222 0.7 percentOver $200,000 167 0.5 percent
Occupied HousingTotal Occupied Housing 33,343 100 percentOwner Occupied 3,823 11.5 percentRenter Occupied 29,520 88.5 percent
Household Size (Total Occupied)1 person 9,028 27.1 percent2 person 8,564 25.7 percent3 person 5,278 15.8 percent4 person 4,095 12.3 percent5 person 2,635 7.9 percent6 person 1,508 4.5 percentOver 7 person 2,235 6.7 percent

Windsor Terrace
Old timers in Windsor Terrace speak of the days when Irish Catholic families were so large that they filled entire pews at Holy Name Roman Catholic Church on Prospect Park West and the church had to hold multiple Masses just to accommodate the large numbers of families in its congregation.
Although Windsor Terrace families are smaller today and new ethnic groups have moved in, the same close knit feeling still exists whether it’s on Halloween when parents are comfortable letting their kids trick or treat on their block because they know all their neighbors, in the summer when kids play until twilight on a cul-de-sac in front of their houses, or in the spring when Little League games at the ball fields on the Windsor Terrace end of Prospect Park are followed by backyard barbeques.
Windsor Terrace began its development in the 19th Century, and the early 1900s brought newly constructed row houses to Prospect Park Southwest; later in the century apartment houses were developed. Two-family homes were built on Sherman Street and Terrace Place in 1925, followed by two large apartment buildings on Prospect Avenue, stores on 11th Avenue, houses on Terrace Place, and single-family houses on Seeley Street.
In the 1980s, as housing prices began to rise in Park Slope, many families turned to Windsor Terrace for more space in charming single family homes, row houses, and co-ops at affordable prices. But what was once affordable in the neighborhood seems pretty pricey today.
Windsor Terrace borders the south side of Prospect Park, which is one of the neighborhood’s greatest assets. The 585-acre jewel was designed in the 1860s by Frederick Law Olmsted and Calvert Vaux, who also designed Central Park, and in the last 25 years has been restored to its original grandeur by a dedicated group of administrators, government officials, volunteers, and donors.
Today Prospect Park is the destination for millions of people annually, including weekend athletes, who walk, jog, roller blade, or bicycle along Park Drive traveling the same route that soldiers in the Continental Army under George Washington took in August 1776 as they battled the British. Children play on the park’s playgrounds and soccer, baseball, and softball fields; picnickers celebrate birthdays and holidays with family and friends; ice skaters take in the fresh air and

exercise at the Wollman Rink; and families visit the Prospect Park Zoo, Carousel, Lefferts Historic House, Picnic House, and Prospect Park Audubon Center & Visitor Center at the Boathouse. The 40-acre Parade Ground on the southeast side of Prospect Park near Windsor Terrace features basketball courts, baseball, softball, and soccer fields, and tennis courts.
Another attraction is Kensington Stables at 51 Caton Place on the border of Windsor Terrace. The stable offers boarding, riding lessons, and trail rides in Prospect Park on a 3.5-mile bridle path through scenic and varied terrain beginning at the Park Circle entrance (the intersection of Coney Island Ave., Parkside Ave., and Prospect Park Southwest) and continues alongside the Lake to the Long Meadow and the Midwood.
Bishop Ford High School is located in Windsor Terrace at 500 19th Street, and Windsor Terrace claims authors Frank McCourt and Pete Hamill as former residents.
Development Potential
The Pavilion Movie Theater opened in the 1990s in the building that housed the old Sanders Theater, which dates back to 1926, and has enjoyed a brisk business from residents of Park Slope and Windsor Terrace who are delighted they can walk a few blocks to see first run movies.
Commerce Bank recently opened a branch at 210-212 Prospect Park Southwest at Park Circle near the Parade Grounds on the former site of a gas station, and in December 2005 it was announced that a five-story, 38-unit, 58,037 square foot condominium would be developed on the site of a former McDonald Avenue truck yard.
The commercial strip of Prospect Park West features Farrell’s Bar and Grill, which opened in 1933, and the Connecticut Muffin, a pleasant coffee shop, but the trendy restaurants and gourmet shops that have invaded Park Slope haven’t moved into Windsor Terrace yet leaving an opportunity for enterprising entrepreneurs to open businesses catering to the neighborhood’s newcomers. In early 2005, the 19th century building that Kensington Stables rented and used as a barn was sold to make way a 107-unit, luxury condominium complex. The horses were forced into the remaining building, and to make room, the indoor riding ring had to be eliminated. Three residential buildings that surround it are being

planned. As of December 2005, construction was taking place on two buildings, but the community was trying to stop the third, 68-unit condominium complex.
Sources: www.prospectpark.org,; The Neighborhoods of Brooklyn, Yale University Press, New Haven and London; Brooklyn Daily Eagle, December 7, 2005, Commerce Bank, NY1, December 6, 2005.
Political and Community ContactsCommunity Board 7, 4201 4th Avenue, Brooklyn, NY 11232, 718-
854-0003New York City Council 39, Bill deBlasio, 718-854-9791,
[email protected] Assembly 44, James F. Brennan, 718-788-7221, [email protected] Senate 20, Carl Andrews, 718-284-4700,
[email protected] Congress 11, Major Owens, 718-773-3100,
www.house.gov/owens/ Source: NYC Department of City Planning; NYC Districting Commission, NYPIRG CMAP
Location From McDonald Avenue to Prospect Park Southwest and Coney Island Avenue, from Prospect Park West to Caton Avenue.

Park Slope Demographics2000 Census Report within a .5 mile radius as noted in the map above.
Total Population 16,249 100 percent
Race/Ethnicity (Total Population)White 10,756 66.2 percentBlack 1,017 6.3 percentNative American 15 0.1 percentAsian 1,161 7.1 percentOther 614 3.8 percentHispanic (any race) 2,686 16.5 percent
Sex (Total Population)Male 7,548 46.5 percentFemale 8,701 53.5 percent
Age (Total Population)Age 0 to 4 1,022 6.3 percent
5 to 9 834 5.1 percent10 to 20 1,642 10.1 percent21 to 29 2,729 16.8 percent30 to 39 2,896 17.8 percent40 to 49 2,629 16.2 percent50 to 59 1,725 10.6 percent60 to 64 524 3.2 percentAge 65+ 2,248 13.8 percent
Education (Population Age 25+)Total population age 25+ 11,780 100 percentLess than 9th grade 948 8.0 percent9-12 Grade 986 8.4 percentHigh School 2,569 21.8 percentSome College 1,709 14.5 percentAssociate Degree 600 5.1 percentBachelor Degree 2,883 24.5 percentGraduate Degree 2,085 17.7 percent
Employment Status (Population Age 16+)Total population age 16+ 13,505 100 percentNot in labor force 4,587 34.0 percentLabor force 8,918 66.0 percent
Labor Force StatusTotal Labor Force Age 16+ 8,918 100 percentArmed Forces 0 0.0 percent

Civilian 8,514 95.5 percentUnemployed 404 4.5 percent
Employed Civilian OccupationTotal employed civilians,Age 16+ 8,514 100 percentAgriculture 14 0.2 percentConstruction 257 3.0 percentEducation 1,012 11.9 percentEntertainment 637 7.5 percentF.I.R.E. 1,095 12.9 percentHealth 1,136 13.3 percentManufacturing 357 4.2 percentMining 0 0.0 percentOther services 523 6.1 percentProf/Tech/Science 1,182 13.9 percentPublic Administration 396 4.7 percentRetail 568 6.7 percentTrans./Warehouse 534 6.3 percentWholesale 90 1.1 percent
HouseholdsTotal households 7,135 100 percentFamily households 3,740 52.4 percent
Income (Total Household)Under $10,000 621 8.7 percent$10,000-20,000 645 9.0 percent$20,000-30,000 776 10.9 percent$30,000-40,000 775 10.9 percent$40,000-50,000 691 9.7 percent$50,000-60,000 671 9.4 percent$60,000-75,000 806 11.3 percent$75,000-100,000 928 13.0 percent$100,000-150,000 844 11.8 percent$150,000-200,000 175 2.5 percentOver $200,000 203 2.8 percent
Occupied HousingTotal Occupied Housing 7,028 100
percentOwner Occupied 2,828 40.2 percentRenter Occupied 4,200 59.8 percent
Household Size (Total Occupied)1 person 2,530 36.0 percent

2 person 2,151 30.6 percent3 person 1,051 15.0 percent4 person 834 11.9 percent5 person 299 4.3 percent6 person 128 1.8 percentOver 7 person 35 0.5 percent