
For personal use only - ASX · Nine Network established 1990 WIN affiliation agreement with Nine...
124
2015 Annual Report For personal use only
Transcript of For personal use only - ASX · Nine Network established 1990 WIN affiliation agreement with Nine...
2015Annual Report
For
per
sona
l use
onl
y
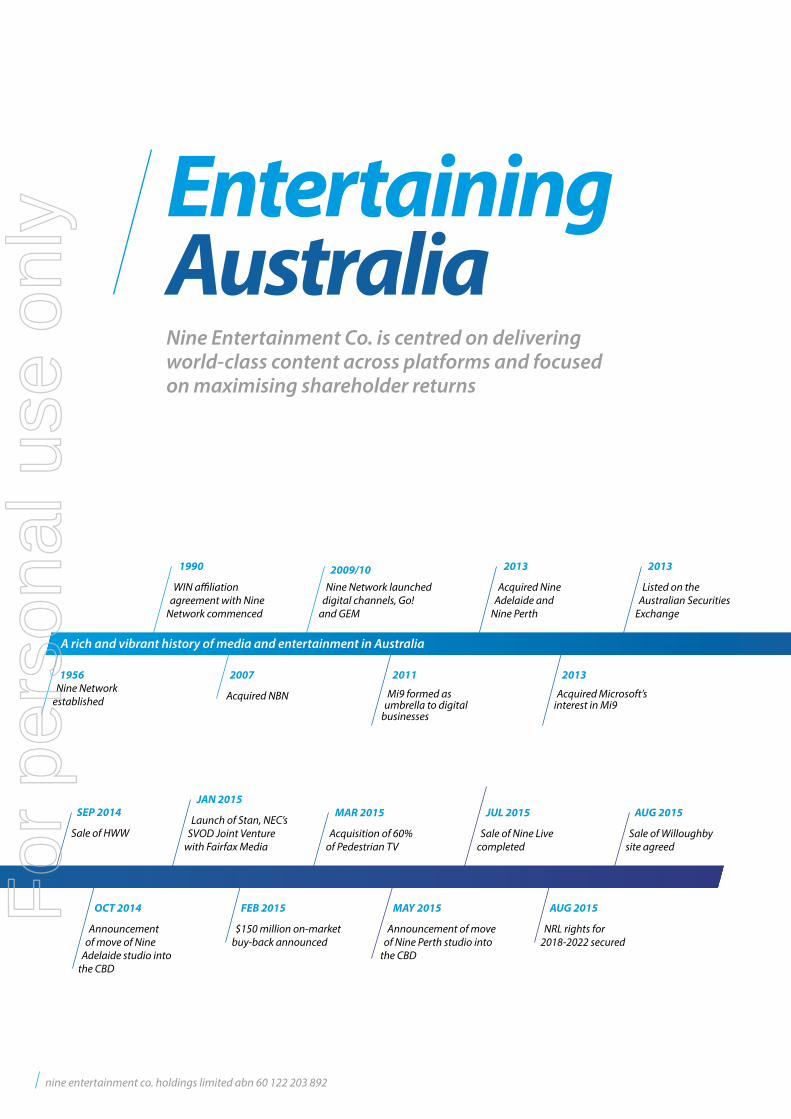
Entertaining AustraliaNine Entertainment Co. is centred on delivering world-class content across platforms and focused on maximising shareholder returns
1956 Nine Network
established
1990
WIN affiliation agreement with Nine
Network commenced
2007
Acquired NBN
2009/10Nine Network launched
digital channels, Go! and GEM
2011
Mi9 formed as umbrella to digital
businesses
2013
Acquired Microsoft’s interest in Mi9
2013
Acquired Nine Adelaide and
Nine Perth
2013
Listed on the Australian Securities
Exchange
A rich and vibrant history of media and entertainment in Australia
SEP 2014
Sale of HWW
OCT 2014
Announcement of move of Nine
Adelaide studio into the CBD
JAN 2015
Launch of Stan, NEC’s SVOD Joint Venture
with Fairfax Media
FEB 2015
$150 million on-market buy-back announced
AUG 2015
NRL rights for 2018-2022 secured
MAY 2015
Announcement of move of Nine Perth studio into
the CBD
JUL 2015
Sale of Nine Live completed
AUG 2015
Sale of Willoughby site agreed
MAR 2015
Acquisition of 60% of Pedestrian TV
nine entertainment co. holdings limited abn 60 122 203 892
For
per
sona
l use
onl
y
Operational Highlights 2Chairman’s Report 4
Chief Executive’s Report 6Summary Financial Performance 8
Nine Network 10Nine Digital 14
Stan and Nine Ventures 18Nine Cares 20
Board of Directors 22Directors’ Report 24
Remuneration Report 29Operating and Financial Review 45
Corporate Governance 49Financial Report 60
Shareholder Information 119Corporate Directory 121
Contents
Annual Report 2015 1
For
per
sona
l use
onl
y
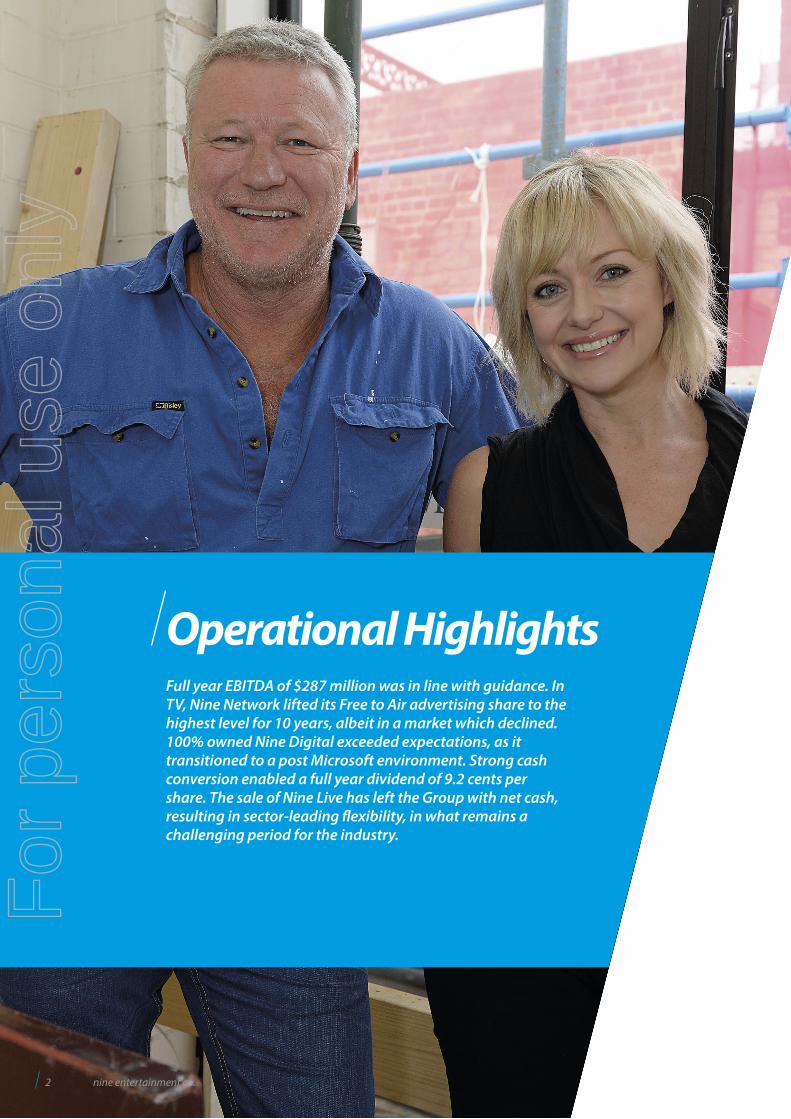
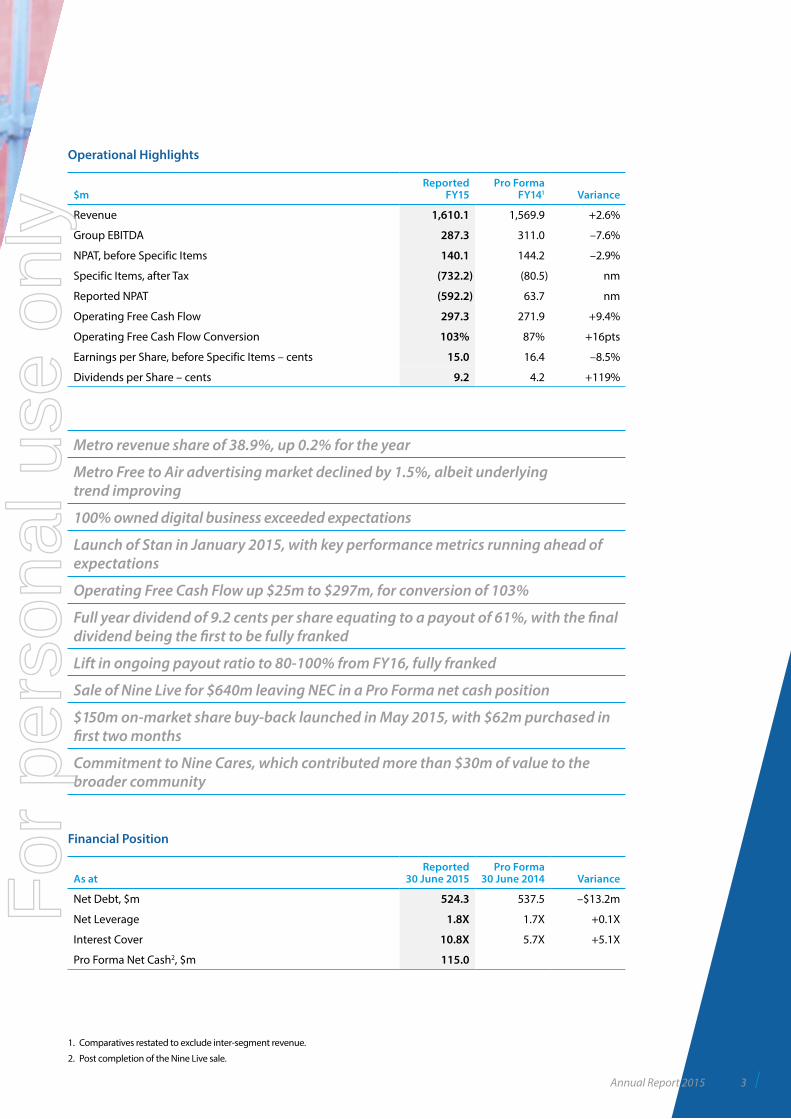
Full year EBITDA of $287 million was in line with guidance. In TV, Nine Network lifted its Free to Air advertising share to the highest level for 10 years, albeit in a market which declined. 100% owned Nine Digital exceeded expectations, as it transitioned to a post Microsoft environment. Strong cash conversion enabled a full year dividend of 9.2 cents per share. The sale of Nine Live has left the Group with net cash, resulting in sector-leading flexibility, in what remains a challenging period for the industry.
Operational Highlights
2 nine entertainment co.
For
per
sona
l use
onl
y
Operational Highlights
$mReported
FY15Pro Forma
FY141 Variance
Revenue 1,610.1 1,569.9 +2.6%
Group EBITDA 287.3 311.0 –7.6%
NPAT, before Specific Items 140.1 144.2 –2.9%
Specific Items, after Tax (732.2) (80.5) nm
Reported NPAT (592.2) 63.7 nm
Operating Free Cash Flow 297.3 271.9 +9.4%
Operating Free Cash Flow Conversion 103% 87% +16pts
Earnings per Share, before Specific Items – cents 15.0 16.4 –8.5%
Dividends per Share – cents 9.2 4.2 +119%
Metro revenue share of 38.9%, up 0.2% for the year
Metro Free to Air advertising market declined by 1.5%, albeit underlying trend improving
100% owned digital business exceeded expectations
Launch of Stan in January 2015, with key performance metrics running ahead of expectations
Operating Free Cash Flow up $25m to $297m, for conversion of 103%
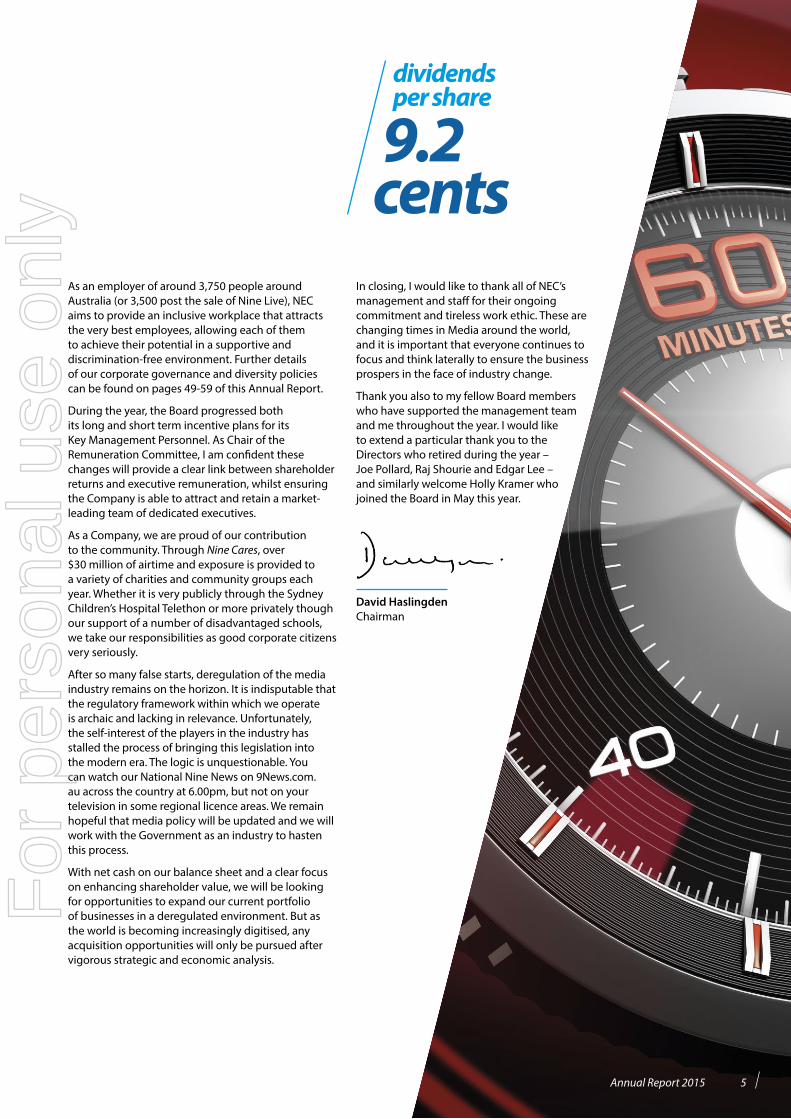
Full year dividend of 9.2 cents per share equating to a payout of 61%, with the final dividend being the first to be fully franked
Lift in ongoing payout ratio to 80-100% from FY16, fully franked
Sale of Nine Live for $640m leaving NEC in a Pro Forma net cash position
$150m on-market share buy-back launched in May 2015, with $62m purchased in first two months
Commitment to Nine Cares, which contributed more than $30m of value to the broader community
Financial Position
As atReported
30 June 2015 Pro Forma
30 June 2014 Variance
Net Debt, $m 524.3 537.5 –$13.2m
Net Leverage 1.8X 1.7X +0.1X
Interest Cover 10.8X 5.7X +5.1X
Pro Forma Net Cash2, $m 115.0
1. Comparatives restated to exclude inter-segment revenue.
2. Post completion of the Nine Live sale.
Annual Report 2015 3
For
per
sona
l use
onl
y
On behalf of the Board of Directors, I am pleased to present the Nine Entertainment Co. Annual Report for the 2015 financial year.
2015 was another active year for Nine Entertainment Co. (NEC), with the two key milestones being the start-up of Stan, Australia’s first mainstream Subscription Video On Demand service in January and the sale of Nine Live announced in April. We finished the year with the prospect of a debt-free balance sheet, and a clear focus on maximising the returns from our remaining Free to Air and Digital businesses.
In a difficult operating environment, NEC recorded an EBITDA decline of 8% for the year to $287 million, with Net Profit After Tax before Specific Items down 2.9%. This result was in line with the guidance given in June, but was below the internal targets we had set ourselves at the start of the year.
The weakness in the television advertising sector was the dominant theme over the year. While the overall advertising market was up slightly, Free to Air television remained under pressure and recorded a 1.5% decline over the year, although encouragingly the market recorded growth over the second half. Whilst detractors are quick to call the demise of Free to Air Television, the relevance of live sport and News, and the commitment of viewers to locally produced content will see the medium continue to thrive. We firmly believe that Free to Air TV remains the most effective medium for advertisers – it has unbeatable scale and reach, an unparalleled relationship with its audiences and helps marketers build emotional connections with their brands like no other media.
It is an evolving landscape however. The emergence of a number of Subscription Video On Demand services, including our own Stan, are both supplementing and changing viewing habits, and the incumbents need to be nimble and open-minded about where future opportunities may lie. NEC’s now unlevered balance sheet positions the Group strongly to capitalise on any opportunities which may arise. Nine is, after all, primarily a distributor of content and the focus is on the different ways we can exploit this content in a digital world, be it advertising-supported or subscription. The evolution of Stan and the growth in our Digital businesses are testament to the broadening focus of the Group.
The sale of Nine Live has left us debt-free and underpins a number of capital management initiatives which we have previously announced – on-market buy-backs and enhanced dividends. Under our $150 million on-market buy-back program, at 30 June 2015 we had purchased 36.3 million shares for a total outlay of almost $62 million, and following the blackout period leading into our results release, we have re-commenced purchases. We have also announced that we intend to ask our shareholders at the AGM in November for approval to lift the annual cap on our buy-back to a maximum of 20% of issued capital to give ourselves the flexibility to increase our program if appropriate circumstances present themselves.
Following the release of the full year results, the Directors declared a fully franked dividend to shareholders of 5.0 cents per share, bringing total dividends for the year to 9.2 cents per share, a 61% payout of pre Specific Item earnings. Pursuant to our capital management initiatives, future dividends, which we expect to be fully franked, will be determined based on 80–100% payout of earnings prior to Specific Items.
Our ratings performance in FY15 was a credit to our programming team as we remained the number 1 network in the key marketing demographics of 18-49s and 25-54s for the fourth year in a row. The strength and depth of our programming slate once again enabled our sales teams to grow our share of Free to Air advertising revenue to the highest result for the network in ten years. We continue to work on ways to improve the monetisation of our ratings leadership in these key demographics.
As required by Australian Accounting Standards, at the time of our full year results we reviewed the Book Value of the assets on our balance sheet, specifically the intangibles. At the FY15 result, we took a write-down of around $850 million which reflected the more difficult environment in which we are operating, and also the reduced value of some legacy international programming contracts. It should be emphasised that the bulk of these are non-cash items and will not impact on our ability in the future to pay dividends.
Chairman’s Report
4 nine entertainment co.
For
per
sona
l use
onl
y
As an employer of around 3,750 people around Australia (or 3,500 post the sale of Nine Live), NEC aims to provide an inclusive workplace that attracts the very best employees, allowing each of them to achieve their potential in a supportive and discrimination-free environment. Further details of our corporate governance and diversity policies can be found on pages 49-59 of this Annual Report.
During the year, the Board progressed both its long and short term incentive plans for its Key Management Personnel. As Chair of the Remuneration Committee, I am confident these changes will provide a clear link between shareholder returns and executive remuneration, whilst ensuring the Company is able to attract and retain a market-leading team of dedicated executives.
As a Company, we are proud of our contribution to the community. Through Nine Cares, over $30 million of airtime and exposure is provided to a variety of charities and community groups each year. Whether it is very publicly through the Sydney Children’s Hospital Telethon or more privately though our support of a number of disadvantaged schools, we take our responsibilities as good corporate citizens very seriously.
After so many false starts, deregulation of the media industry remains on the horizon. It is indisputable that the regulatory framework within which we operate is archaic and lacking in relevance. Unfortunately, the self-interest of the players in the industry has stalled the process of bringing this legislation into the modern era. The logic is unquestionable. You can watch our National Nine News on 9News.com.au across the country at 6.00pm, but not on your television in some regional licence areas. We remain hopeful that media policy will be updated and we will work with the Government as an industry to hasten this process.
With net cash on our balance sheet and a clear focus on enhancing shareholder value, we will be looking for opportunities to expand our current portfolio of businesses in a deregulated environment. But as the world is becoming increasingly digitised, any acquisition opportunities will only be pursued after vigorous strategic and economic analysis.
In closing, I would like to thank all of NEC’s management and staff for their ongoing commitment and tireless work ethic. These are changing times in Media around the world, and it is important that everyone continues to focus and think laterally to ensure the business prospers in the face of industry change.
Thank you also to my fellow Board members who have supported the management team and me throughout the year. I would like to extend a particular thank you to the Directors who retired during the year – Joe Pollard, Raj Shourie and Edgar Lee – and similarly welcome Holly Kramer who joined the Board in May this year.
David Haslingden Chairman
dividends per share
9.2 cents
Annual Report 2015 5
For
per
sona
l use
onl
y
Chief Executive’s ReportIt has been a year of change and challenges both for NEC and the broader television industry in Australia.
During FY15, we sold our Nine Live business and successfully launched Stan, our SVOD joint venture with Fairfax. Our core television business has, however, faced structural headwinds with the arrival of new distribution platforms and content, with the overall Free to Air advertising market declining modestly as a result.
Our results in FY15 were somewhat disappointing, with EBITDA falling below FY14 levels by 8%. The shortfall was confined mainly to the fourth quarter, with lower-than-expected ratings and revenue share impacting directly on our bottom line.
The market trend did improve as the year progressed. After a first half decline of 3%, the Free to Air Metro advertising sector returned to low growth in the June half. Positively, we have seen modest growth for the first couple of months of the new financial year.
The arrival of new distribution platforms has opened up a vast array of content choices to consumers, creating significant noise across the industry. With this proliferation of distribution has come an increasing urgency to attract and retain eyeballs. Audiences, who were once dictated to by the Networks and their schedules, now want to view television and film content at a time and place that is convenient to them. The Free to Air industry is fighting to ensure it remains relevant. Prime time content has evolved enormously over the past five years – the importance of content which must be watched live – News, Sport and Reality – cannot be underestimated, and NEC remains at the forefront of each of these genres.
Free to Air remains the primary, and perhaps only way to efficiently address mass audiences. So while audiences have declined somewhat as consumers have multiple alternative content choices, the value of the mass audience, as a scarce commodity, has arguably increased. It may take the industry some time to come around to this way of thinking, but, as the markets in the US and UK have shown us, they will.
As the medium is evolving, and viewing habits are changing, so too must the measurement tools. At this stage, the widely accepted people-meter system is not keeping pace with industry evolution. The overnight audience for key shows is no longer a reliable measure
of the viewing population, with time shifting, encore episodes and catch up all increasingly important. For example, of the 2 million people who watched the first episode of Nine’s drama House of Hancock, less than 65% watched it live. Unfortunately, however, it is the overnight viewership that gets the headlines and as an industry we do not yet have a measurement system that captures the viewership of our content across all distribution channels, although this is set to change shortly.
The other element to the equation is revenue share. Nine has again grown its share , albeit modestly, to 38.9%, consolidating previous gains in the face of increased competition. Defence of our market position has become increasingly challenging and we expect a slight decline in overall share in the current year. Notwithstanding, our programming and sales teams remain very focused on ensuring we have the best content and that we maximise the returns from that content.
There is no place for complacency in Free to Air television, particularly in the current climate. Our programming teams are continually pushing the envelope and searching for the inspirational next idea – focusing on our key strengths of News, Current Affairs, Sport and local production. New concepts like Married At First Sight, Hot Plate and Reno Rumble are helping to refresh an industry where format fatigue has allowed the disruptors to gain traction.
And the equation now is more complex. Not only are we searching for content that will work on Channel 9, Go! or GEM, but we want content that travels into a digital world, so that we can maximise its impact and revenue. Viewers today want to watch what they want, when they want it; and it is our job to provide that experience and maximise the associated revenue streams.
With 100% ownership of our digital business comes the opportunity to merge the boundaries even more. Our philosophy must be to produce the most compelling content, and distribute it across all video mediums, making it available to consumers whenever, wherever and however they want to receive it. Our focus and success in News is a great example of
6 nine entertainment co.
For
per
sona
l use
onl
y
this. We now have a single 9News content unit which operates under one leader, across all mediums. And it produces results. Day in, day out.
Another clear example of the way we are thinking is the recently finalised NRL deal. In August, after year end, we announced a transformational deal with the NRL – transformational not just for Nine, but for the League and its supporters. Nine will remain the Home of Rugby League for the next seven years and, under the new rights package, there will be more games on Free to Air television, double the live action available currently – a bonanza for League supporters and the future of the game. The securing of the associated free digital rights will mean that live coverage will be available across multiple devices – so fans can tune in however and wherever they want to. I am personally excited to be continuing our long standing relationship with the NRL and am confident that together, we can take the sport to new heights.
Our SVOD joint venture with Fairfax Media, Stan, launched on Australia Day 2015 and the milestones to date have been remarkable. From a standing start, Stan reported gross sign-ups of some 300,000 at the end of August, on track for 300,000-400,000 active subscribers by the end of the calendar year. Not only is Stan growing its own business but also the segment itself, which was little known or understood 12 months ago. The take-up has been a testament to the product itself, the team behind it and the broader education process of all the players in the industry.
In April, we announced the sale of the Nine Live business for $640 million. It was a difficult and emotional decision for the Board and management to part with a business that had flourished under NEC ownership but, at the end of the day, the accretion to shareholder value as a result of the price being offered could not be overlooked. I would like to publicly thank Geoff Jones and his team for their tireless commitment to the business and the NEC Group and wish them success for the future. We retain an ongoing commercial agreement with the business that will ensure all mutually beneficial arrangements between the two groups are retained.
The sale has left NEC in a net cash position which has created significant opportunities to lift returns to shareholders but also the ability to move swiftly and convincingly when new opportunities arise. We continue to support the review of media ownership regulations that has impeded the progress of the industry for years. The barriers to change are ill-conceived, as all the players seek to position
themselves optimally and similarly hinder their competitors. Change is inevitable however, as the rules can be described as nothing other than outdated with new technology.
The programming write-down announced with our FY15 result was disappointing but necessary. It marks the end of our last remaining US output deal which gives us the opportunity to redeploy funds into programming which actually works. Market conditions and changing viewer preferences drove the decision to break from our long term contract with Warner Bros. which had been a drag on company earnings for a number of years. As the contract draws to a close, we have been able to revisit the carrying values of the assets on our balance sheet and make the appropriate adjustments.
It has been a difficult year for NEC, and one that has been marked by much change, across the industry as well as within the Group. We have survived though and, we believe, emerged a stronger and more focused company with a clear strategy and with the desire and people to deliver it. I would like to thank all of our staff and employees for their continued focus and support and I look forward to what 2016 will bring.
Thank you.
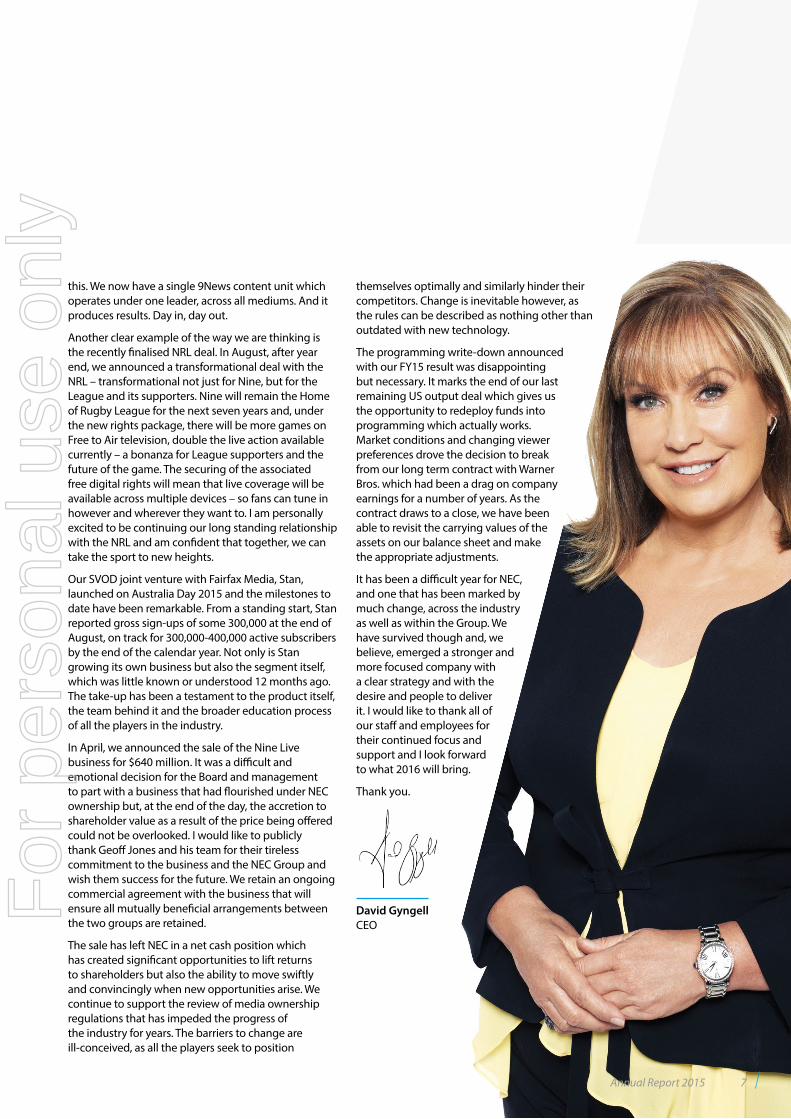
David Gyngell CEO
Annual Report 2015 7
For
per
sona
l use
onl
y
Summary Financial Performance
TV revenues were down by 1%, with a 0.2 percentage point increase in Nine’s Metro Revenue share to 38.9% offsetting the weakness in the overall Metro Free to Air market. Regional markets recorded a revenue decline overall of 3.2%, and have become progressively softer than metro markets over the past six months.
Television EBITDA declined by 14.7%, reflecting a combination of the lower revenue base, and higher costs. Pro Forma costs were up by 2.3%, but this included the costs associated with the Cricket World Cup, of around $16 million. Excluding this, and licence fees, which are a function of advertising revenues, costs were up by 0.6%.
NEC’s Digital business reported double digit revenue growth in both Search and Video, with Video in particular up by 24%. EBITDA growth was a strong 40%, when compared with the prior year Pro Forma, but this includes around $5 million of benefit due to the later-than-expected diversion of Microsoft default traffic.
Nine Live reported EBITDA growth of 3% to $70 million, on revenue of $239 million, up 6% on the prior year. Growth was primarily driven by Ticketek – slightly lower ticket volumes were offset by a higher revenue per ticket, while Ticketek’s ancillary revenues were also strong.
Corporate costs declined by 24%, reflecting lower incentive payments in the year following below target financial results.
The Associates contribution includes share of operating results from Sky News, TXA, OzTAM and Intrepica – the lower contribution from Associates reflects the impact of early stage losses from new investments.
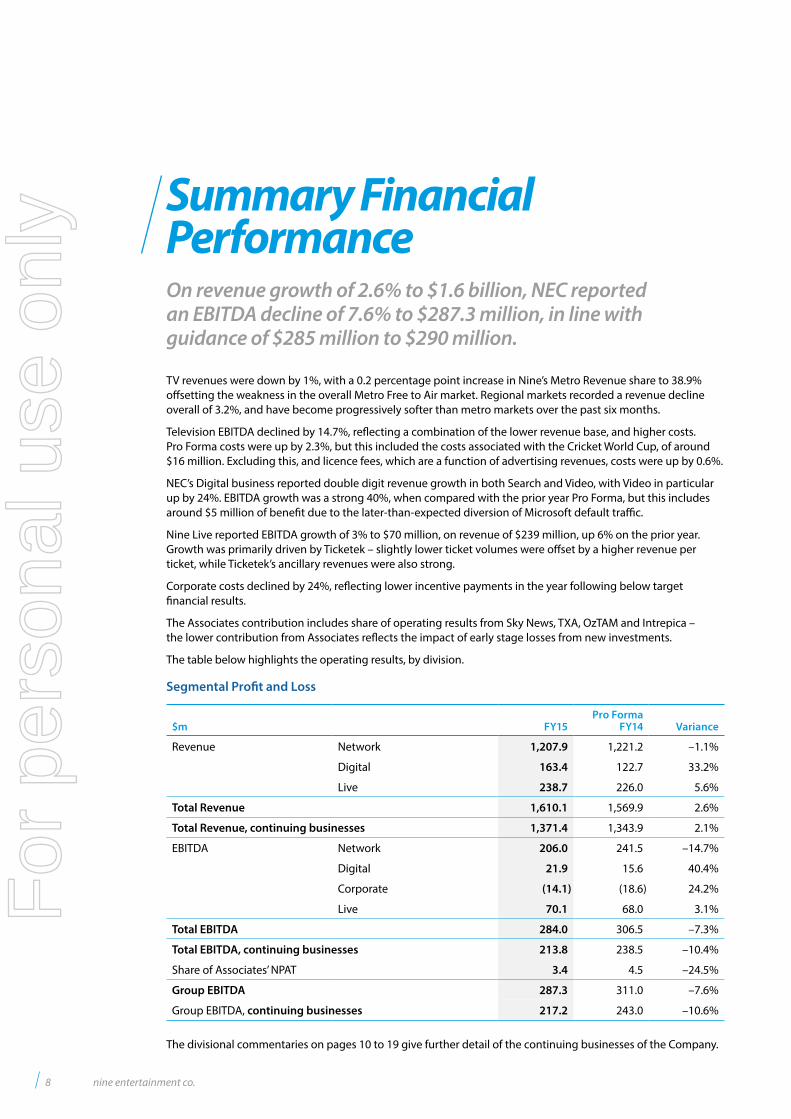
The table below highlights the operating results, by division.
Segmental Profit and Loss
$m FY15 Pro Forma
FY14 Variance
Revenue Network 1,207.9 1,221.2 –1.1%
Digital 163.4 122.7 33.2%
Live 238.7 226.0 5.6%
Total Revenue 1,610.1 1,569.9 2.6%
Total Revenue, continuing businesses 1,371.4 1,343.9 2.1%
EBITDA Network 206.0 241.5 –14.7%
Digital 21.9 15.6 40.4%
Corporate (14.1) (18.6) 24.2%
Live 70.1 68.0 3.1%
Total EBITDA 284.0 306.5 –7.3%
Total EBITDA, continuing businesses 213.8 238.5 –10.4%
Share of Associates’ NPAT 3.4 4.5 –24.5%
Group EBITDA 287.3 311.0 –7.6%
Group EBITDA, continuing businesses 217.2 243.0 –10.6%
The divisional commentaries on pages 10 to 19 give further detail of the continuing businesses of the Company.
On revenue growth of 2.6% to $1.6 billion, NEC reported an EBITDA decline of 7.6% to $287.3 million, in line with guidance of $285 million to $290 million.
8 nine entertainment co.
For
per
sona
l use
onl
y
Specific Items
$mReported
FY15
Non-cash impairment charge (791.8)
Inventory write-off/onerous contract provision (57.4)
Net other 1.9
Total Specific Items before tax (847.3)
Tax impact of Specific Items 14.1
Sale of Nine Live tax impact 101.0
Net Specific Items after tax (732.2)
In FY15, NEC recognised Specific Items totalling a cost of $732 million (after tax). The key components of this were non-cash impairments of $792 million (pre-tax), inventory provisioning of $57 million (pre-tax) and a tax credit associated with the sale of Nine Live of $101 million.
The net impairment charge of $792 million reflects a non-cash reduction in the carrying value of the Group’s Metro and Regional intangibles. The key drivers of this change are a reduction in the assumed long term market growth rate and the impact of re-basing the market size following the actual FY15 outcome.
The $57 million relates to inventory write-offs and onerous contract provisions. $13 million of this results from a one-off cost associated with settling legacy inventory contracts. The balance represents provisioning of inventory on the balance sheet at 30 June. This inventory relates to loss-making overseas content under the Group’s major output deal which expires early next year. The losses on this inventory arise either due to the content being not aired at all, or as a result of expected revenue generated being lower than the actual cost of the content. This reflects the general declining appeal and value of overseas content. Under Australian Accounting Standards, there will be an annual provision based on the 30 June balance sheet over each of the next few years, while currently contracted programs continue to be made.
The tax credit of $101 million relates principally to the booking of previously unbooked capital losses which will be utilised against the gain on sale of Nine Live.
Annual Report 2015 9
For
per
sona
l use
onl
y
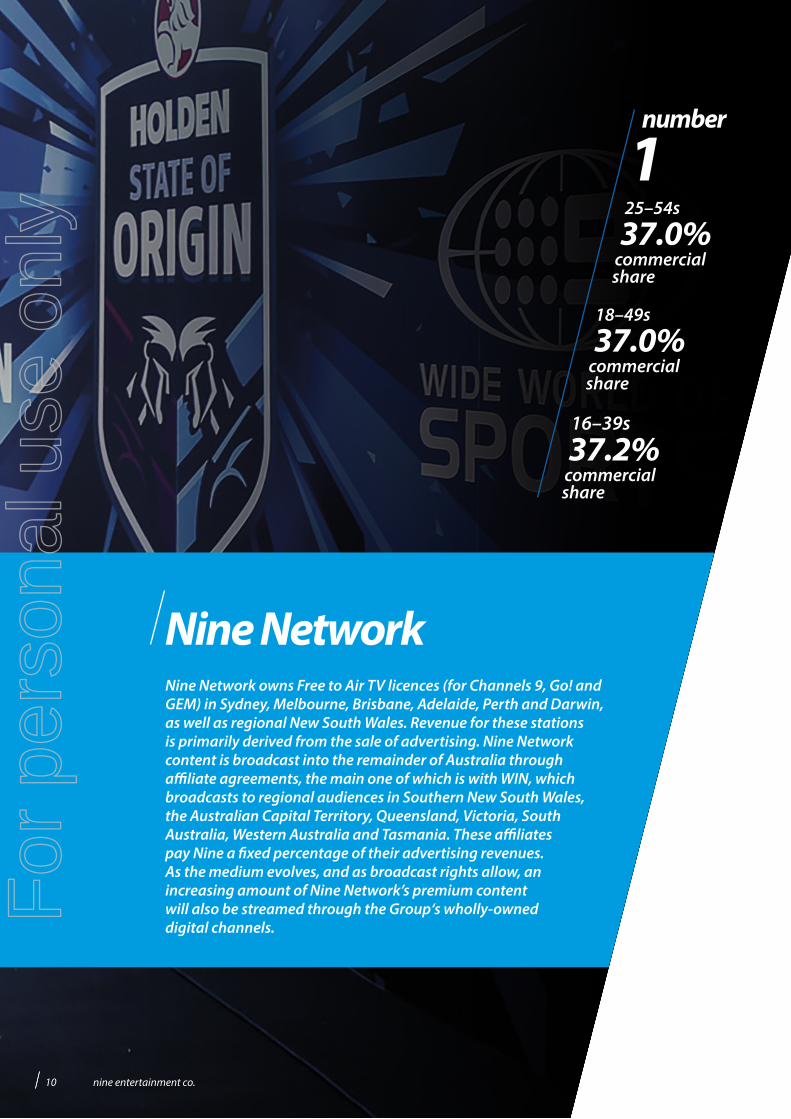
Nine NetworkNine Network owns Free to Air TV licences (for Channels 9, Go! and GEM) in Sydney, Melbourne, Brisbane, Adelaide, Perth and Darwin, as well as regional New South Wales. Revenue for these stations is primarily derived from the sale of advertising. Nine Network content is broadcast into the remainder of Australia through affiliate agreements, the main one of which is with WIN, which broadcasts to regional audiences in Southern New South Wales, the Australian Capital Territory, Queensland, Victoria, South Australia, Western Australia and Tasmania. These affiliates pay Nine a fixed percentage of their advertising revenues. As the medium evolves, and as broadcast rights allow, an increasing amount of Nine Network’s premium content will also be streamed through the Group‘s wholly-owned digital channels.
25–54s
37.0% commercial share
18–49s
37.0% commercial share
16–39s
37.2% commercial share
1number
10 nine entertainment co.
For
per
sona
l use
onl
y
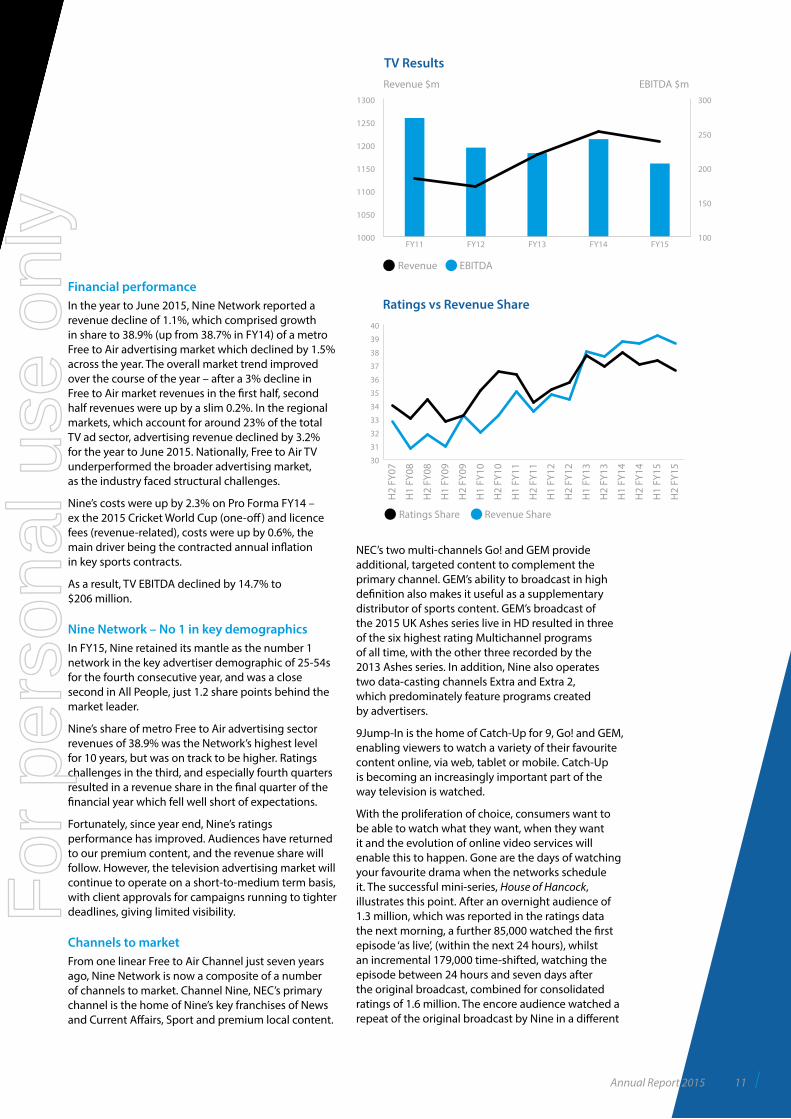
Financial performanceIn the year to June 2015, Nine Network reported a revenue decline of 1.1%, which comprised growth in share to 38.9% (up from 38.7% in FY14) of a metro Free to Air advertising market which declined by 1.5% across the year. The overall market trend improved over the course of the year – after a 3% decline in Free to Air market revenues in the first half, second half revenues were up by a slim 0.2%. In the regional markets, which account for around 23% of the total TV ad sector, advertising revenue declined by 3.2% for the year to June 2015. Nationally, Free to Air TV underperformed the broader advertising market, as the industry faced structural challenges.
Nine’s costs were up by 2.3% on Pro Forma FY14 – ex the 2015 Cricket World Cup (one-off) and licence fees (revenue-related), costs were up by 0.6%, the main driver being the contracted annual inflation in key sports contracts.
As a result, TV EBITDA declined by 14.7% to $206 million.
Nine Network – No 1 in key demographicsIn FY15, Nine retained its mantle as the number 1 network in the key advertiser demographic of 25-54s for the fourth consecutive year, and was a close second in All People, just 1.2 share points behind the market leader.
Nine’s share of metro Free to Air advertising sector revenues of 38.9% was the Network’s highest level for 10 years, but was on track to be higher. Ratings challenges in the third, and especially fourth quarters resulted in a revenue share in the final quarter of the financial year which fell well short of expectations.
Fortunately, since year end, Nine’s ratings performance has improved. Audiences have returned to our premium content, and the revenue share will follow. However, the television advertising market will continue to operate on a short-to-medium term basis, with client approvals for campaigns running to tighter deadlines, giving limited visibility.
Channels to marketFrom one linear Free to Air Channel just seven years ago, Nine Network is now a composite of a number of channels to market. Channel Nine, NEC’s primary channel is the home of Nine’s key franchises of News and Current Affairs, Sport and premium local content.
NEC’s two multi-channels Go! and GEM provide additional, targeted content to complement the primary channel. GEM’s ability to broadcast in high definition also makes it useful as a supplementary distributor of sports content. GEM’s broadcast of the 2015 UK Ashes series live in HD resulted in three of the six highest rating Multichannel programs of all time, with the other three recorded by the 2013 Ashes series. In addition, Nine also operates two data-casting channels Extra and Extra 2, which predominately feature programs created by advertisers.
9Jump-In is the home of Catch-Up for 9, Go! and GEM, enabling viewers to watch a variety of their favourite content online, via web, tablet or mobile. Catch-Up is becoming an increasingly important part of the way television is watched.
With the proliferation of choice, consumers want to be able to watch what they want, when they want it and the evolution of online video services will enable this to happen. Gone are the days of watching your favourite drama when the networks schedule it. The successful mini-series, House of Hancock, illustrates this point. After an overnight audience of 1.3 million, which was reported in the ratings data the next morning, a further 85,000 watched the first episode ‘as live’, (within the next 24 hours), whilst an incremental 179,000 time-shifted, watching the episode between 24 hours and seven days after the original broadcast, combined for consolidated ratings of 1.6 million. The encore audience watched a repeat of the original broadcast by Nine in a different
100
150
200
250
300
FY15FY14FY13FY12FY111000
1050
1100
1150
1200
1250
1300
Revenue $m EBITDA $m
TV Results
Revenue EBITDA
30
31
32
33
34
35
36
37
38
39
40
H2
FY15
H1
FY15
H2
FY14
H1
FY14
H2
FY13
H1
FY13
H2
FY12
H1
FY12
H2
FY11
H1
FY11
H2
FY10
H1
FY10
H2
FY09
H1
FY09
H2
FY08
H1
FY08
H2
FY07
Ratings vs Revenue Share
Ratings Share Revenue Share
Annual Report 2015 11
For
per
sona
l use
onl
y
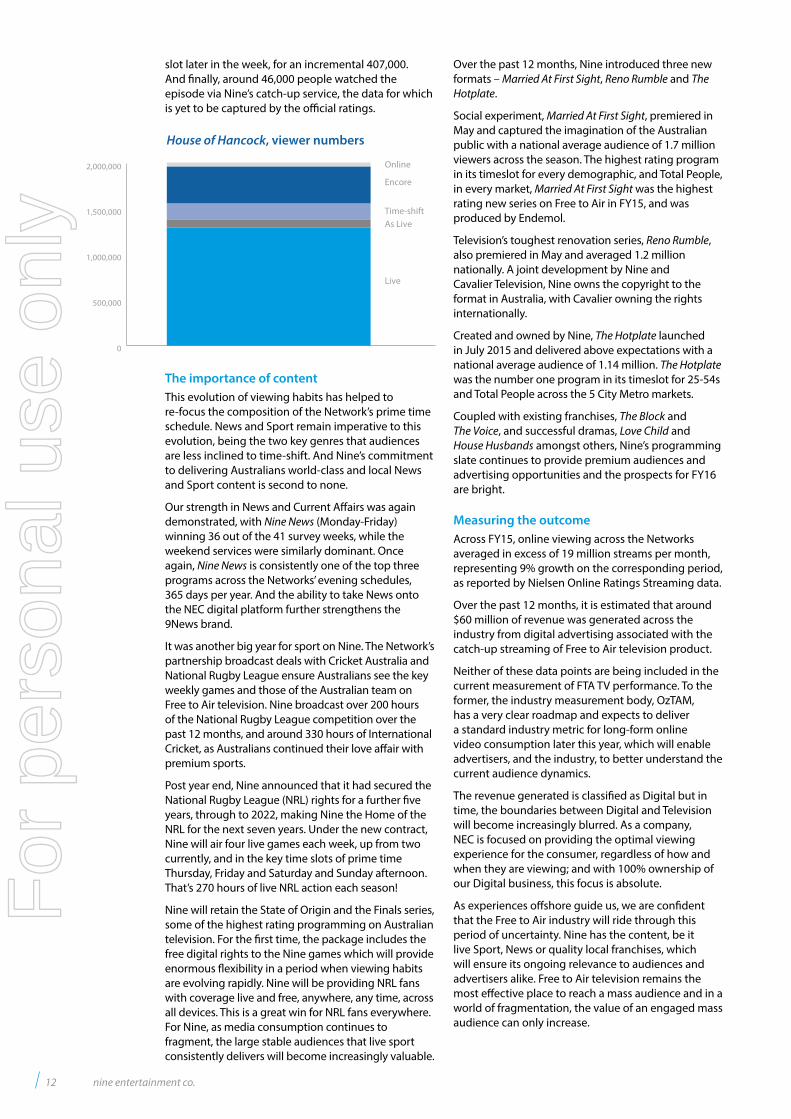
slot later in the week, for an incremental 407,000. And finally, around 46,000 people watched the episode via Nine’s catch-up service, the data for which is yet to be captured by the official ratings.
The importance of contentThis evolution of viewing habits has helped to re-focus the composition of the Network’s prime time schedule. News and Sport remain imperative to this evolution, being the two key genres that audiences are less inclined to time-shift. And Nine’s commitment to delivering Australians world-class and local News and Sport content is second to none.
Our strength in News and Current Affairs was again demonstrated, with Nine News (Monday-Friday) winning 36 out of the 41 survey weeks, while the weekend services were similarly dominant. Once again, Nine News is consistently one of the top three programs across the Networks’ evening schedules, 365 days per year. And the ability to take News onto the NEC digital platform further strengthens the 9News brand.
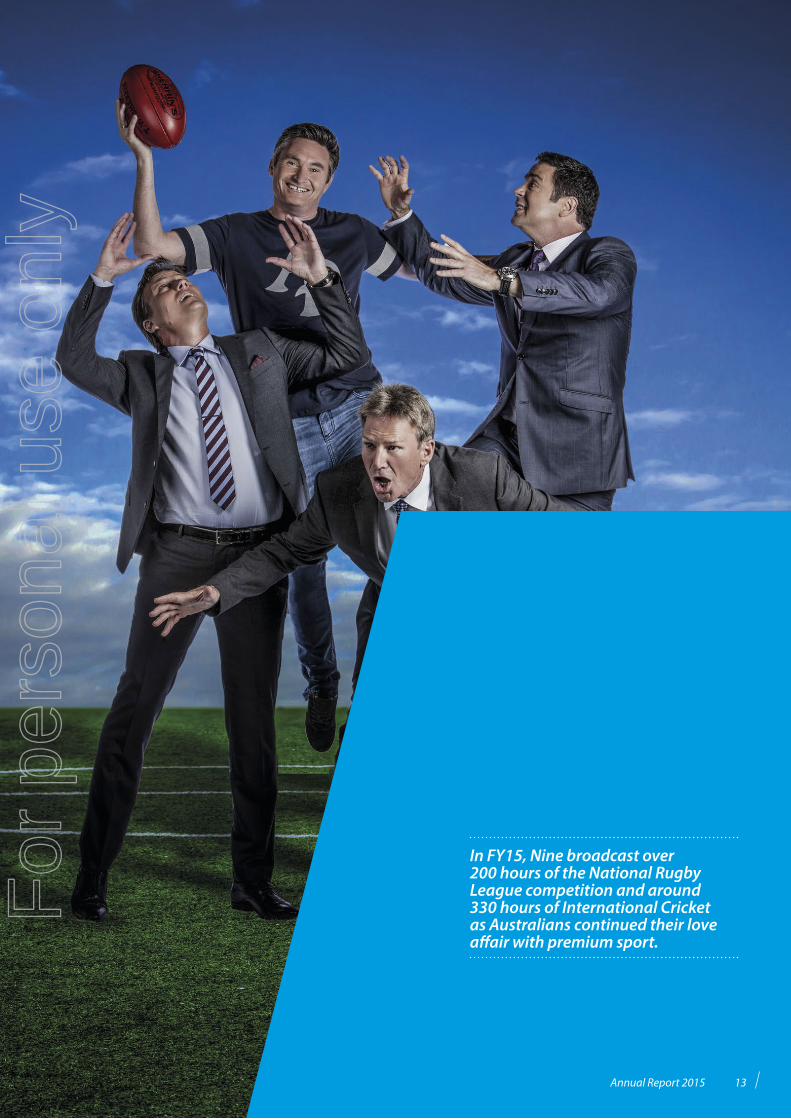
It was another big year for sport on Nine. The Network’s partnership broadcast deals with Cricket Australia and National Rugby League ensure Australians see the key weekly games and those of the Australian team on Free to Air television. Nine broadcast over 200 hours of the National Rugby League competition over the past 12 months, and around 330 hours of International Cricket, as Australians continued their love affair with premium sports.
Post year end, Nine announced that it had secured the National Rugby League (NRL) rights for a further five years, through to 2022, making Nine the Home of the NRL for the next seven years. Under the new contract, Nine will air four live games each week, up from two currently, and in the key time slots of prime time Thursday, Friday and Saturday and Sunday afternoon. That’s 270 hours of live NRL action each season!
Nine will retain the State of Origin and the Finals series, some of the highest rating programming on Australian television. For the first time, the package includes the free digital rights to the Nine games which will provide enormous flexibility in a period when viewing habits are evolving rapidly. Nine will be providing NRL fans with coverage live and free, anywhere, any time, across all devices. This is a great win for NRL fans everywhere. For Nine, as media consumption continues to fragment, the large stable audiences that live sport consistently delivers will become increasingly valuable.
Over the past 12 months, Nine introduced three new formats – Married At First Sight, Reno Rumble and The Hotplate.
Social experiment, Married At First Sight, premiered in May and captured the imagination of the Australian public with a national average audience of 1.7 million viewers across the season. The highest rating program in its timeslot for every demographic, and Total People, in every market, Married At First Sight was the highest rating new series on Free to Air in FY15, and was produced by Endemol.
Television’s toughest renovation series, Reno Rumble, also premiered in May and averaged 1.2 million nationally. A joint development by Nine and Cavalier Television, Nine owns the copyright to the format in Australia, with Cavalier owning the rights internationally.
Created and owned by Nine, The Hotplate launched in July 2015 and delivered above expectations with a national average audience of 1.14 million. The Hotplate was the number one program in its timeslot for 25-54s and Total People across the 5 City Metro markets.
Coupled with existing franchises, The Block and The Voice, and successful dramas, Love Child and House Husbands amongst others, Nine’s programming slate continues to provide premium audiences and advertising opportunities and the prospects for FY16 are bright.
Measuring the outcomeAcross FY15, online viewing across the Networks averaged in excess of 19 million streams per month, representing 9% growth on the corresponding period, as reported by Nielsen Online Ratings Streaming data.
Over the past 12 months, it is estimated that around $60 million of revenue was generated across the industry from digital advertising associated with the catch-up streaming of Free to Air television product.
Neither of these data points are being included in the current measurement of FTA TV performance. To the former, the industry measurement body, OzTAM, has a very clear roadmap and expects to deliver a standard industry metric for long-form online video consumption later this year, which will enable advertisers, and the industry, to better understand the current audience dynamics.
The revenue generated is classified as Digital but in time, the boundaries between Digital and Television will become increasingly blurred. As a company, NEC is focused on providing the optimal viewing experience for the consumer, regardless of how and when they are viewing; and with 100% ownership of our Digital business, this focus is absolute.
As experiences offshore guide us, we are confident that the Free to Air industry will ride through this period of uncertainty. Nine has the content, be it live Sport, News or quality local franchises, which will ensure its ongoing relevance to audiences and advertisers alike. Free to Air television remains the most effective place to reach a mass audience and in a world of fragmentation, the value of an engaged mass audience can only increase.
0
500,000
1,000,000
1,500,000
2,000,000 Online
Encore
Time-shiftAs Live
Live
House of Hancock, viewer numbers
12 nine entertainment co.
For
per
sona
l use
onl
y
In FY15, Nine broadcast over 200 hours of the National Rugby League competition and around 330 hours of International Cricket as Australians continued their love affair with premium sport.
Annual Report 2015 13
For
per
sona
l use
onl
y
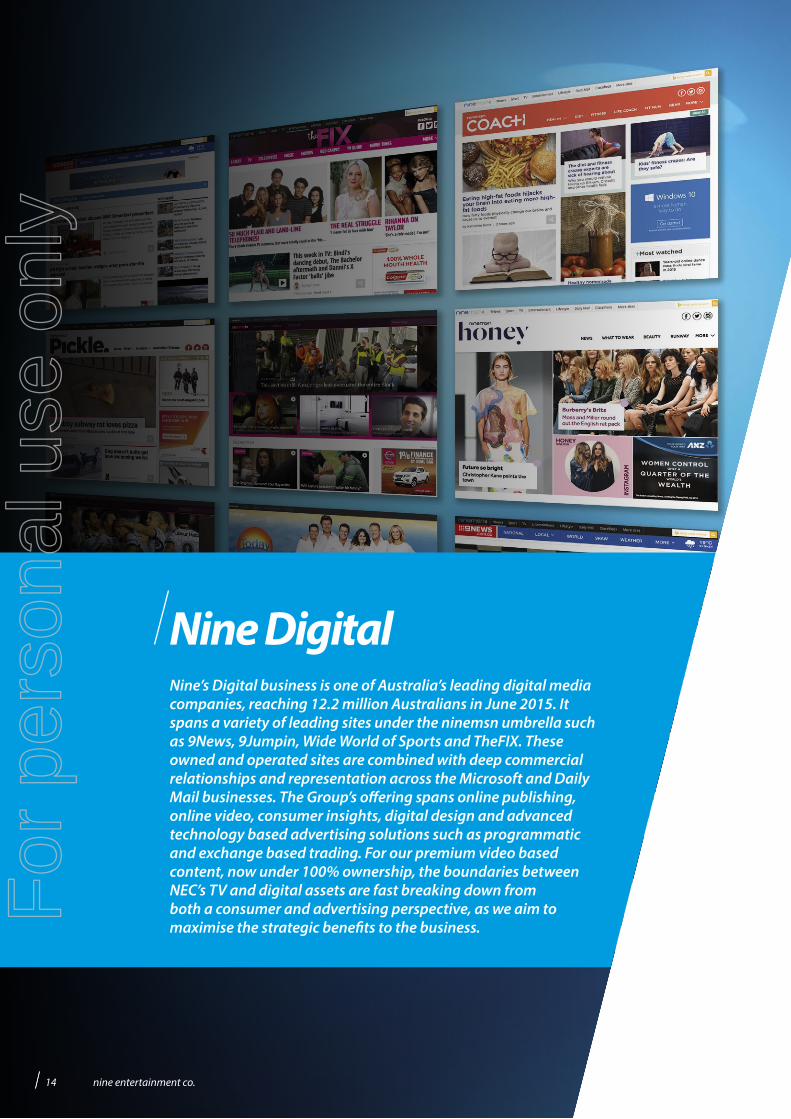
Nine DigitalNine’s Digital business is one of Australia’s leading digital media companies, reaching 12.2 million Australians in June 2015. It spans a variety of leading sites under the ninemsn umbrella such as 9News, 9Jumpin, Wide World of Sports and TheFIX. These owned and operated sites are combined with deep commercial relationships and representation across the Microsoft and Daily Mail businesses. The Group’s offering spans online publishing, online video, consumer insights, digital design and advanced technology based advertising solutions such as programmatic and exchange based trading. For our premium video based content, now under 100% ownership, the boundaries between NEC’s TV and digital assets are fast breaking down from both a consumer and advertising perspective, as we aim to maximise the strategic benefits to the business.
14 nine entertainment co.
For
per
sona
l use
onl
y
Financial resultsNine Digital reported a 33% growth in revenue in FY15 with strong performances in both search advertising and video advertising. EBITDA growth was a strong 40%, when compared to the prior year Pro Forma. This includes some benefit due to the later than expected diversion of Microsoft default traffic but also firm focus on both top line growth and cost management. Overall, the results from Nine Digital were ahead of expectations and reflect the early benefits of the integration of our Digital and Free to Air businesses.
Publishing9news.com.au is the digital home of Australia’s Nine News product. 9news.com.au continues to outpace the market as Australia’s leading multi-media news brand. Served by our extensive network of TV News reporters, and with content that refreshes continually, 9News augments NEC’s ability to be the pre-eminent News source for all Australians.
During FY15, Nine Digital also launched three new digital brands into the Australian market with a focus on the content Australians want, how they want it and when they want it. Already, the results have been promising.
Honey is already the Number 1 digital fashion and beauty brand in Australia. Honey’s natural mix of high-end fashion and blog-style advice has proven irresistible to Australian women (and some men!) and really puts the consumer at the heart of this content experience.
For Coach, Nine Digital teamed up with Instagram inspiration Kayla Itsines. Kayla comes on board as fitness educator and columnist, bolstering Coach’s positive approach to life in general: fit, happy, strong. An innovative approach to this important content category.
And finally, Pickle. The site so unique there is no category for it, but it has been a massive hit with the audience, with close to 1 million Australians consuming the content each month. Pickle finds the world’s most viral stories and videos day after day.
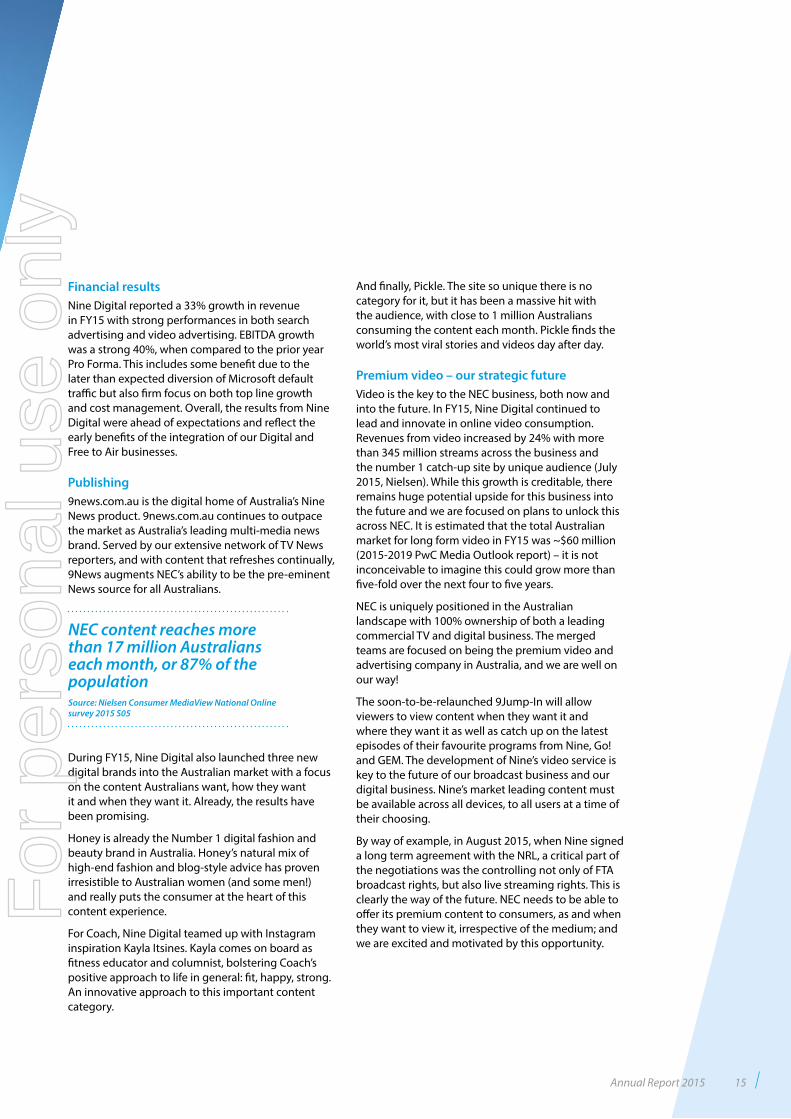
Premium video – our strategic futureVideo is the key to the NEC business, both now and into the future. In FY15, Nine Digital continued to lead and innovate in online video consumption. Revenues from video increased by 24% with more than 345 million streams across the business and the number 1 catch-up site by unique audience (July 2015, Nielsen). While this growth is creditable, there remains huge potential upside for this business into the future and we are focused on plans to unlock this across NEC. It is estimated that the total Australian market for long form video in FY15 was ~$60 million (2015-2019 PwC Media Outlook report) – it is not inconceivable to imagine this could grow more than five-fold over the next four to five years.
NEC is uniquely positioned in the Australian landscape with 100% ownership of both a leading commercial TV and digital business. The merged teams are focused on being the premium video and advertising company in Australia, and we are well on our way!
The soon-to-be-relaunched 9Jump-In will allow viewers to view content when they want it and where they want it as well as catch up on the latest episodes of their favourite programs from Nine, Go! and GEM. The development of Nine’s video service is key to the future of our broadcast business and our digital business. Nine’s market leading content must be available across all devices, to all users at a time of their choosing.
By way of example, in August 2015, when Nine signed a long term agreement with the NRL, a critical part of the negotiations was the controlling not only of FTA broadcast rights, but also live streaming rights. This is clearly the way of the future. NEC needs to be able to offer its premium content to consumers, as and when they want to view it, irrespective of the medium; and we are excited and motivated by this opportunity.
NEC content reaches more than 17 million Australians each month, or 87% of the population Source: Nielsen Consumer MediaView National Online survey 2015 S05
Annual Report 2015 15
For
per
sona
l use
onl
y
Other Growth OpportunitiesIn March 2015, we made an investment in Pedestrian.tv, Australia’s leading youth publisher website. Nine’s traditional businesses have found the youth market difficult to attract and the opportunity to grow this business, together with the founders, is significant.
In late 2014, APEX was launched, a joint venture with Fairfax Media which is Australia’s first premium publishers’ advertising exchange, enabling advertisers to connect with their audiences across a range of premium, brand safe environments. Overseas experience suggests that the ability for brands to connect programmatically in premium, brand-safe environments leads to dramatically improved results for both the brands and the publishers.
Nine Digital also has a number of important strategic partners, with Daily Mail and Microsoft. Over the past year, the focus has narrowed to those partners offering more strategically important relationships, whilst allowing Nine to maximise the returns of its owned and operated sites. This model will continue to be refined in the future to ensure it delivers both top and bottom line benefits to the core business.
Through FY16, NEC will continue to innovate and deliver across these key themes of video content across all channels, amazing consumer experiences and partnerships/acquisitions where they make sense – all leading to delivery of continued top and bottom line growth. Our market position and strategy, namely owning all our digital assets and therefore owning our future, coupled with our content acquisition strategy focusing on delivery of all our content to all consumers across all devices, places us in a unique market position and one which we are excited and inspired to deliver against.
NEC will continue to innovate and deliver across the key theme of premium video content across all channels
16 nine entertainment co.
For
per
sona
l use
onl
y
NEC is uniquely positioned in the Australian landscape with 100% ownership of both a leading commercial TV and digital business.
Annual Report 2015 17
For
per
sona
l use
onl
y
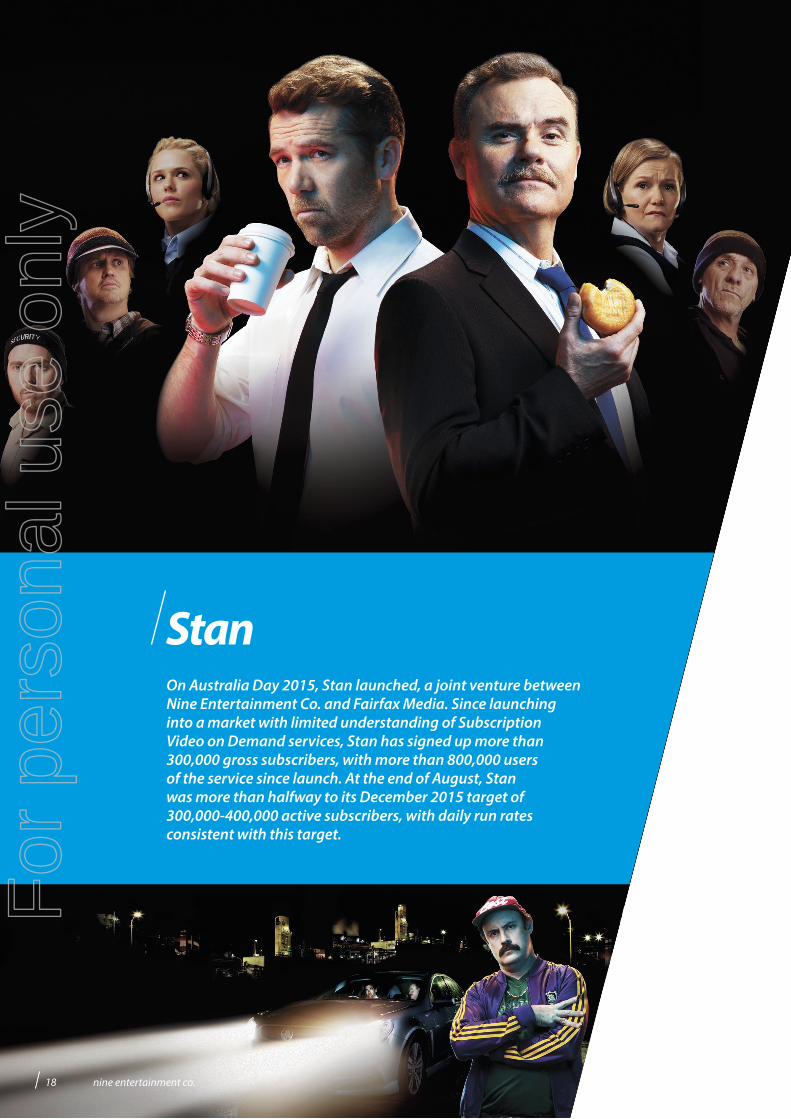
On Australia Day 2015, Stan launched, a joint venture between Nine Entertainment Co. and Fairfax Media. Since launching into a market with limited understanding of Subscription Video on Demand services, Stan has signed up more than 300,000 gross subscribers, with more than 800,000 users of the service since launch. At the end of August, Stan was more than halfway to its December 2015 target of 300,000-400,000 active subscribers, with daily run rates consistent with this target.
Stan
18 nine entertainment co.
For
per
sona
l use
onl
y
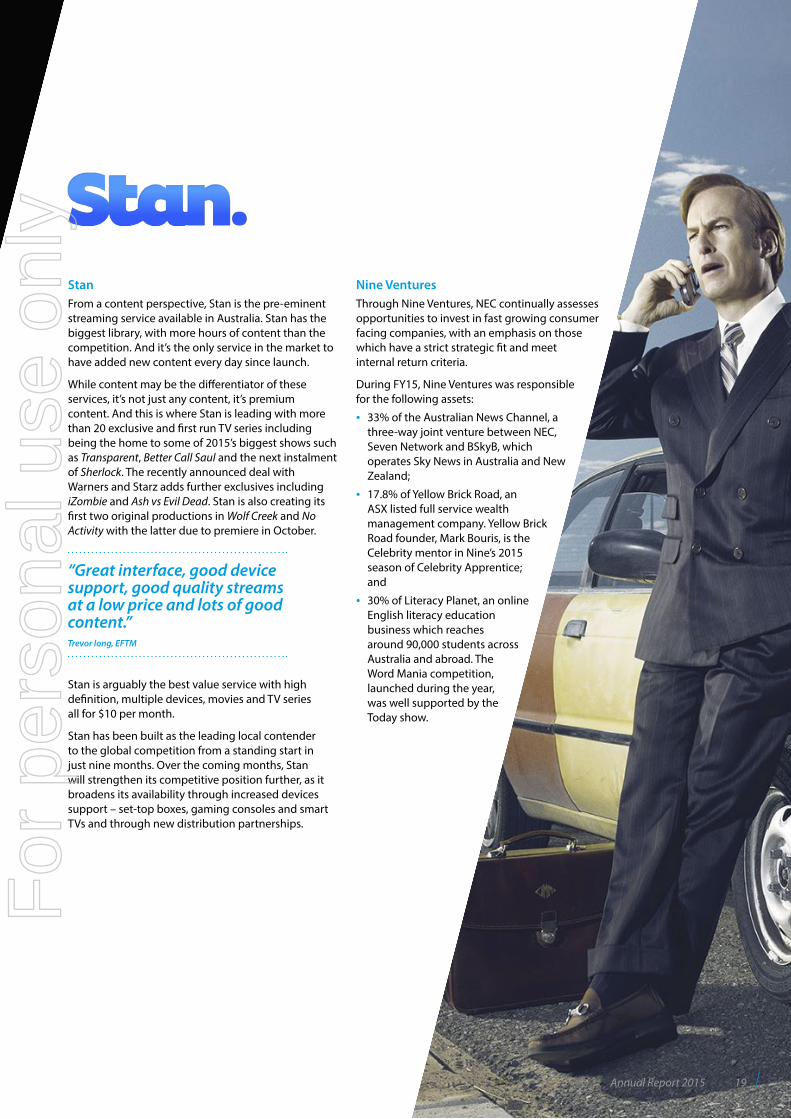
StanFrom a content perspective, Stan is the pre-eminent streaming service available in Australia. Stan has the biggest library, with more hours of content than the competition. And it’s the only service in the market to have added new content every day since launch.
While content may be the differentiator of these services, it’s not just any content, it’s premium content. And this is where Stan is leading with more than 20 exclusive and first run TV series including being the home to some of 2015’s biggest shows such as Transparent, Better Call Saul and the next instalment of Sherlock. The recently announced deal with Warners and Starz adds further exclusives including iZombie and Ash vs Evil Dead. Stan is also creating its first two original productions in Wolf Creek and No Activity with the latter due to premiere in October.
Stan is arguably the best value service with high definition, multiple devices, movies and TV series all for $10 per month.
Stan has been built as the leading local contender to the global competition from a standing start in just nine months. Over the coming months, Stan will strengthen its competitive position further, as it broadens its availability through increased devices support – set-top boxes, gaming consoles and smart TVs and through new distribution partnerships.
Nine VenturesThrough Nine Ventures, NEC continually assesses opportunities to invest in fast growing consumer facing companies, with an emphasis on those which have a strict strategic fit and meet internal return criteria.
During FY15, Nine Ventures was responsible for the following assets:
• 33% of the Australian News Channel, a three-way joint venture between NEC, Seven Network and BSkyB, which operates Sky News in Australia and New Zealand;
• 17.8% of Yellow Brick Road, an ASX listed full service wealth management company. Yellow Brick Road founder, Mark Bouris, is the Celebrity mentor in Nine’s 2015 season of Celebrity Apprentice; and
• 30% of Literacy Planet, an online English literacy education business which reaches around 90,000 students across Australia and abroad. The Word Mania competition, launched during the year, was well supported by the Today show.
“Great interface, good device support, good quality streams at a low price and lots of good content.” Trevor long, EFTM
Annual Report 2015 19
For
per
sona
l use
onl
y
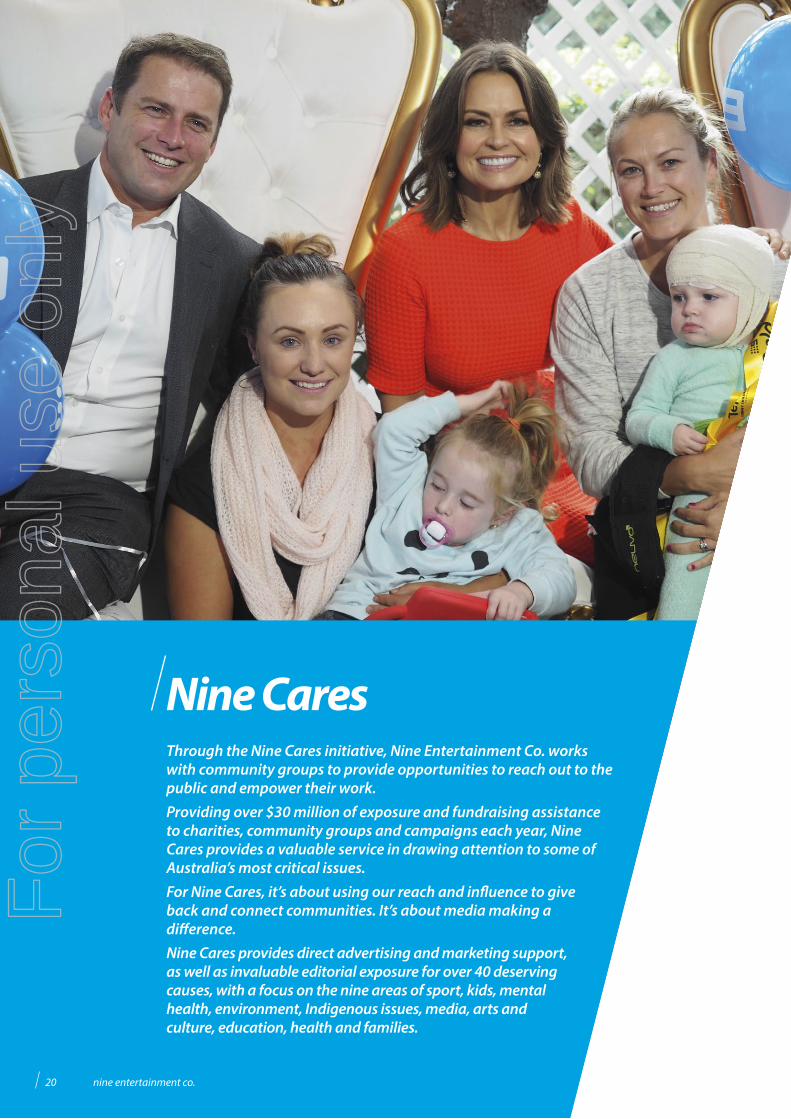
Nine CaresThrough the Nine Cares initiative, Nine Entertainment Co. works with community groups to provide opportunities to reach out to the public and empower their work. Providing over $30 million of exposure and fundraising assistance to charities, community groups and campaigns each year, Nine Cares provides a valuable service in drawing attention to some of Australia’s most critical issues.For Nine Cares, it’s about using our reach and influence to give back and connect communities. It’s about media making a difference.Nine Cares provides direct advertising and marketing support, as well as invaluable editorial exposure for over 40 deserving causes, with a focus on the nine areas of sport, kids, mental health, environment, Indigenous issues, media, arts and culture, education, health and families.
20 nine entertainment co.
For
per
sona
l use
onl
y
TelethonsOne of the highlights of the Nine Cares calendar, and now in its fifth year, is the Sydney Children’s Hospital Gold Telethon. In 2015, the Telethon raised a record $5.2 million to support essential equipment, service and research at the Sydney Children’s Hospital, Randwick. Televised on the Nine Network and featuring some of Australia’s top artists performing live, Nine’s key talent manned the phones and took donations.
Nine also televised telethons in Brisbane and Adelaide.
Across all three telethons, in excess of $16.6 million was raised.
The Footy Show’s ‘Big Change for Little Champions’ telethon raised an additional $546,000 for The Starlight Foundation.
EditorialIn-program exposure and editorial coverage included the Starlight Children’s Foundation, the McGrath Foundation, Lifeline Support Line, Red Kite and the Relay For Life.
A Current Affair remains one of the primary editorial platforms for Nine Cares to engage with Australians. In 2014/15, ACA’s support resulted in:
• Over $1.2 million raised to help support the Lawrence brothers, who lost both parents in the space of six years and faced some enormous challenges to stay together.
• $861,000 raised for the Children’s Cancer Institute via the Build for a Cure event in September.
• Over $1.15 million in support of Sharon Chan and her sons, a story that broke the collective hearts of our nation.
• A makeover valued at over $250,000 provided to the Sydney Children’s Hospital OT, with NEC donating time and materials.
Community Engagement and SupportAs Nine Entertainment Co. continues to challenge the status quo in the comparatively newly acquired markets of Adelaide and Perth, Nine Cares is actively engaging in supporting these local communities.
Nine Cares spent more than $1 million promoting council events around the country, supporting local councils within their heartland including the opportunity to highlight community events within
those districts, whether through local news stories, live weather crosses, or packages on TODAY or Weekend TODAY.
The Nine Network is the exclusive TV partner of the annual Adelaide Fringe Festival. Nine’s commitment to Australia’s largest arts festival includes a financial and airtime campaign but also extends to the support of the Opening Night Parade, Schools at Fringe, Hospital Hilarity and the creation of a Fringe venue in the historic NWS9 studio.
Also in Adelaide, Nine sponsors the WOMAdelaide and the Adelaide Film Festival. 9News is the National Media Sponsor for the Mothers Day Classic Fun Run and Walk which raises funds for breast cancer research.
In Perth, Nine sponsors 14 metro surf lifesaving clubs, as well as the West Perth Football Club.
In Canberra, Nine is a sponsor of the National Gallery of Australia. In Sydney, Nine sponsors the Maritime Museum, the Royal Easter Show and nine surf lifesaving clubs.
For KidsNine Cares actively supports a number of disadvantaged schools, assisting in literacy programs and student development.
NEC’s digital arm, Mi9, provided more than $100,000 of targeted media campaign support across the ninemsn network. Mi9’s partnership with KidsXpress, an expressive therapy program for children who are facing emotional trauma, saw the launch of a new website and helped secure a venture capital grant to fund an innovative social enterprise, providing an ongoing revenue stream for the vital work of KidsXpress.
Community Service Announcements (CSAs)In FY15, Nine Cares managed and provided $23 million of airtime for CSAs for not-for-profit or community announcements in support of causes including Dry July, When to Declare , Mother’s Day Classic, Starlight Xmas Campaign, National Adoption Awareness Week and Wall of Hands.
Looking AheadIn FY16, Nine Cares will increase its community work and launch a dedicated Nine Cares website to celebrate the work that is done, and moreover, to provide further opportunities for community groups to connect with the public and maximise the reach of their messages.
Annual Report 2015 21
For
per
sona
l use
onl
y
Board of Directors
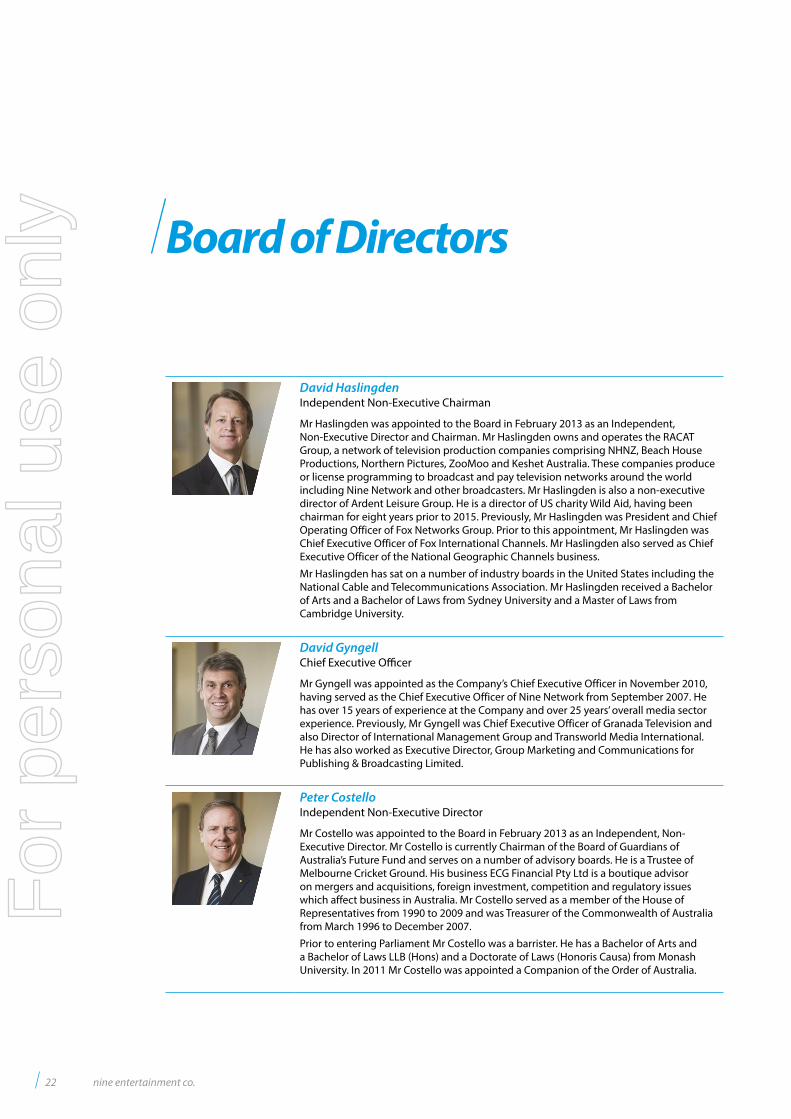
David HaslingdenIndependent Non-Executive Chairman
Mr Haslingden was appointed to the Board in February 2013 as an Independent, Non-Executive Director and Chairman. Mr Haslingden owns and operates the RACAT Group, a network of television production companies comprising NHNZ, Beach House Productions, Northern Pictures, ZooMoo and Keshet Australia. These companies produce or license programming to broadcast and pay television networks around the world including Nine Network and other broadcasters. Mr Haslingden is also a non-executive director of Ardent Leisure Group. He is a director of US charity Wild Aid, having been chairman for eight years prior to 2015. Previously, Mr Haslingden was President and Chief Operating Officer of Fox Networks Group. Prior to this appointment, Mr Haslingden was Chief Executive Officer of Fox International Channels. Mr Haslingden also served as Chief Executive Officer of the National Geographic Channels business.
Mr Haslingden has sat on a number of industry boards in the United States including the National Cable and Telecommunications Association. Mr Haslingden received a Bachelor of Arts and a Bachelor of Laws from Sydney University and a Master of Laws from Cambridge University.
David GyngellChief Executive Officer
Mr Gyngell was appointed as the Company’s Chief Executive Officer in November 2010, having served as the Chief Executive Officer of Nine Network from September 2007. He has over 15 years of experience at the Company and over 25 years’ overall media sector experience. Previously, Mr Gyngell was Chief Executive Officer of Granada Television and also Director of International Management Group and Transworld Media International. He has also worked as Executive Director, Group Marketing and Communications for Publishing & Broadcasting Limited.
Peter CostelloIndependent Non-Executive Director
Mr Costello was appointed to the Board in February 2013 as an Independent, Non-Executive Director. Mr Costello is currently Chairman of the Board of Guardians of Australia’s Future Fund and serves on a number of advisory boards. He is a Trustee of Melbourne Cricket Ground. His business ECG Financial Pty Ltd is a boutique advisor on mergers and acquisitions, foreign investment, competition and regulatory issues which affect business in Australia. Mr Costello served as a member of the House of Representatives from 1990 to 2009 and was Treasurer of the Commonwealth of Australia from March 1996 to December 2007.
Prior to entering Parliament Mr Costello was a barrister. He has a Bachelor of Arts and a Bachelor of Laws LLB (Hons) and a Doctorate of Laws (Honoris Causa) from Monash University. In 2011 Mr Costello was appointed a Companion of the Order of Australia.
22 nine entertainment co.
For
per
sona
l use
onl
y

Kevin CroweNon-Executive Director
Mr Crowe was appointed to the Board in February 2013 as a nominee of Apollo Management (Apollo). Mr Crowe is currently a principal at Apollo. He also serves on the Board of Directors of Norwegian Cruise Lines and Ventia and previously served on the Board of Directors of Quality Distribution and Prestige Cruise Holdings. Prior to joining Apollo, Mr Crowe was a member of the Financial Sponsors Group in the Global Banking department of Deutsche Bank Securities.
Mr Crowe graduated from Princeton University with a Bachelor of Arts major in Economics and a certificate in Finance.
Holly KramerIndependent Non-Executive Director
Ms Kramer was appointed to the Board in May 2015 as an Independent, Non-Executive Director. Ms Kramer has more than 20 years’ experience in general management, marketing and sales including roles at the Ford Motor Company (in the US and Australia), Pacific Brands and Telstra. Whilst at Telstra, her roles included Group Managing Director, Telstra Product Management and Chief of Marketing. Her most recent position was Chief Executive Officer of Best & Less, a subsidiary of South African retail group Pepkor. Ms Kramer also serves as a Non-Executive Director for regional community-owned telco, Southern Phones and the Alannah and Madeleine Foundation. She is an Advisory Board Member to the Macquarie University Faculty of Business and a member of Chief Executive Women.
Ms Kramer has a BA with Honours in Economics and Political Science from Yale University and an MBA from Georgetown University.
Hugh MarksIndependent Non-Executive Director
Mr Marks was appointed to the Board in February 2013 as an Independent, Non-Executive Director. Mr Marks is currently the Chief Executive Officer of Media Venture Partners, a media strategy and investment business. He has 18 years of experience as a senior executive in content production and broadcasting in Australia and internationally. Mr Marks owns talent management agency RGM Artists and has material ownership interests in and is actively involved in the management of Wildbear Pty Limited, The Media Tribe Pty Limited and Marquee Studios. Those companies operate in the independent production sector and either produce or license content, or manage the provision of on-screen talent, to broadcast and pay television networks around the world including Nine Network and other broadcasters.
Before joining the Board, Mr Marks was an authority member for the Australian Communications and Media Authority for over two years. Previously, Mr Marks was Chief Executive Officer of the Southern Star Group. Mr Marks has also worked with the Nine Network as legal counsel and then as a director of Nine Films & Television for seven years.
Mr Marks received a Bachelor of Commerce and Bachelor of Laws from the University of New South Wales.
Steve MartinezNon-Executive Director
Mr Martinez was appointed to the Board in February 2013 as a nominee of Apollo. Mr Martinez is a Senior Partner and Head of Asia Pacific for Apollo, having joined in 2000. He is a member of Apollo’s Senior Management Committee. Mr Martinez has led investments for Apollo in a variety of sectors including shipping, leisure, media and general industrial. Prior to joining Apollo, Mr Martinez was a member of the Mergers and Acquisitions Group of Goldman, Sachs & Co. Before that he worked in Asia at Bain & Company.
Mr Martinez received an MBA from the Harvard Business School and a BA and BS from the University of Pennsylvania and the Wharton School, respectively.
Annual Report 2015 23
For
per
sona
l use
onl
y
Directors’ Report
The Directors present the financial report for the year ended 30 June 2015. The financial report includes the results of Nine Entertainment Co. Holdings Limited (the “Company”) and the entities that it controlled during the year (the “Group”).
Directors
The Directors of the Company at any time during the financial year or up to the date of this report were as follows.
Directors held office for the entire period unless otherwise stated.
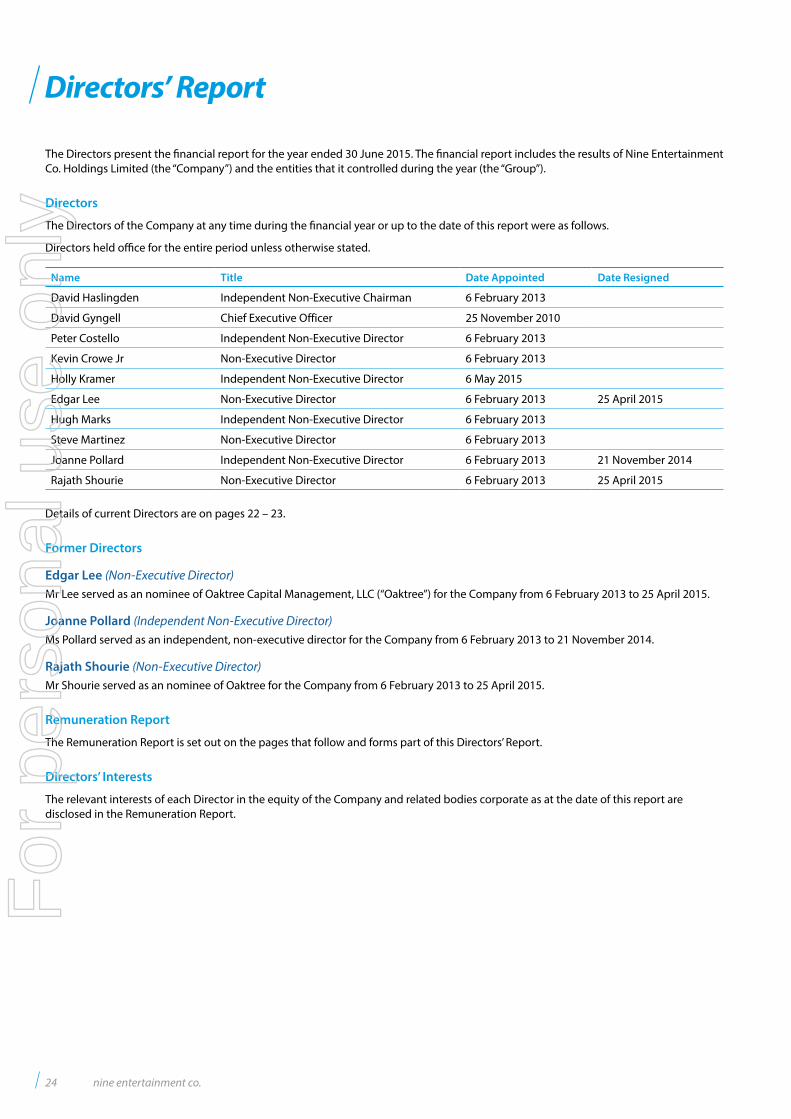
Name Title Date Appointed Date Resigned
David Haslingden Independent Non-Executive Chairman 6 February 2013
David Gyngell Chief Executive Officer 25 November 2010
Peter Costello Independent Non-Executive Director 6 February 2013
Kevin Crowe Jr Non-Executive Director 6 February 2013
Holly Kramer Independent Non-Executive Director 6 May 2015
Edgar Lee Non-Executive Director 6 February 2013 25 April 2015
Hugh Marks Independent Non-Executive Director 6 February 2013
Steve Martinez Non-Executive Director 6 February 2013
Joanne Pollard Independent Non-Executive Director 6 February 2013 21 November 2014
Rajath Shourie Non-Executive Director 6 February 2013 25 April 2015
Details of current Directors are on pages 22 – 23.
Former Directors
Edgar Lee (Non-Executive Director)Mr Lee served as an nominee of Oaktree Capital Management, LLC (“Oaktree”) for the Company from 6 February 2013 to 25 April 2015.
Joanne Pollard (Independent Non-Executive Director)Ms Pollard served as an independent, non-executive director for the Company from 6 February 2013 to 21 November 2014.
Rajath Shourie (Non-Executive Director)Mr Shourie served as an nominee of Oaktree for the Company from 6 February 2013 to 25 April 2015.
Remuneration Report
The Remuneration Report is set out on the pages that follow and forms part of this Directors’ Report.
Directors’ Interests
The relevant interests of each Director in the equity of the Company and related bodies corporate as at the date of this report are disclosed in the Remuneration Report.
24 nine entertainment co.
For
per
sona
l use
onl
y
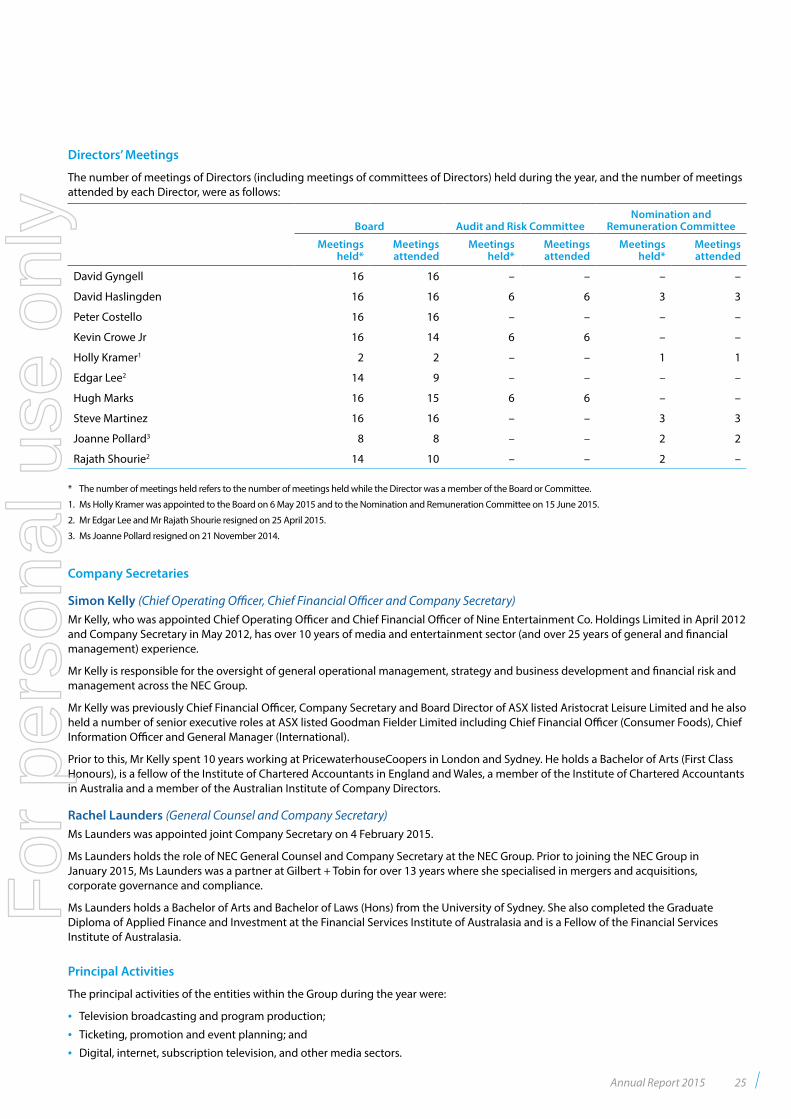
Directors’ Meetings
The number of meetings of Directors (including meetings of committees of Directors) held during the year, and the number of meetings attended by each Director, were as follows:
Board Audit and Risk CommitteeNomination and
Remuneration Committee
Meetings held*
Meetings attended
Meetings held*
Meetings attended
Meetings held*
Meetings attended
David Gyngell 16 16 – – – –
David Haslingden 16 16 6 6 3 3
Peter Costello 16 16 – – – –
Kevin Crowe Jr 16 14 6 6 – –
Holly Kramer1 2 2 – – 1 1
Edgar Lee2 14 9 – – – –
Hugh Marks 16 15 6 6 – –
Steve Martinez 16 16 – – 3 3
Joanne Pollard3 8 8 – – 2 2
Rajath Shourie2 14 10 – – 2 –
* The number of meetings held refers to the number of meetings held while the Director was a member of the Board or Committee.
1. Ms Holly Kramer was appointed to the Board on 6 May 2015 and to the Nomination and Remuneration Committee on 15 June 2015.
2. Mr Edgar Lee and Mr Rajath Shourie resigned on 25 April 2015.
3. Ms Joanne Pollard resigned on 21 November 2014.
Company Secretaries
Simon Kelly (Chief Operating Officer, Chief Financial Officer and Company Secretary)Mr Kelly, who was appointed Chief Operating Officer and Chief Financial Officer of Nine Entertainment Co. Holdings Limited in April 2012 and Company Secretary in May 2012, has over 10 years of media and entertainment sector (and over 25 years of general and financial management) experience.
Mr Kelly is responsible for the oversight of general operational management, strategy and business development and financial risk and management across the NEC Group.
Mr Kelly was previously Chief Financial Officer, Company Secretary and Board Director of ASX listed Aristocrat Leisure Limited and he also held a number of senior executive roles at ASX listed Goodman Fielder Limited including Chief Financial Officer (Consumer Foods), Chief Information Officer and General Manager (International).
Prior to this, Mr Kelly spent 10 years working at PricewaterhouseCoopers in London and Sydney. He holds a Bachelor of Arts (First Class Honours), is a fellow of the Institute of Chartered Accountants in England and Wales, a member of the Institute of Chartered Accountants in Australia and a member of the Australian Institute of Company Directors.
Rachel Launders (General Counsel and Company Secretary)Ms Launders was appointed joint Company Secretary on 4 February 2015.
Ms Launders holds the role of NEC General Counsel and Company Secretary at the NEC Group. Prior to joining the NEC Group in January 2015, Ms Launders was a partner at Gilbert + Tobin for over 13 years where she specialised in mergers and acquisitions, corporate governance and compliance.
Ms Launders holds a Bachelor of Arts and Bachelor of Laws (Hons) from the University of Sydney. She also completed the Graduate Diploma of Applied Finance and Investment at the Financial Services Institute of Australasia and is a Fellow of the Financial Services Institute of Australasia.
Principal Activities
The principal activities of the entities within the Group during the year were:
• Television broadcasting and program production;
• Ticketing, promotion and event planning; and
• Digital, internet, subscription television, and other media sectors.
Annual Report 2015 25
For
per
sona
l use
onl
y
Directors’ Report continued
Dividends
Nine Entertainment Co. Holdings Limited paid an interim dividend of 4.2 cents per share in respect of the year ending 30 June 2015 amounting to $39,332,052 during the year (2014: $nil). The Company has not declared any dividend subsequent to 30 June 2015.
The Company paid a final dividend of 4.2 cents per share in respect of the year ending 30 June 2014 amounting to $39,492,384 during the year.
Corporate Information
Nine Entertainment Co. Holdings Limited is a company limited by shares that is incorporated and domiciled in Australia. It is the parent entity of the Group.
The registered office of Nine Entertainment Co. Holdings Limited is 24 Artarmon Road, Willoughby NSW 2068.
Review of Operations
For the year to 30 June 2015, the Group reported a consolidated net loss after income tax of $592,151,000 (2014: profit $57,872,000).
The Group’s revenues from continuing operations for the year to 30 June 2015 increased by $65,506,000 (5%) to $1,383,898,000 (2014: $1,318,392,000).
The Group’s earnings before interest, tax, depreciation and amortisation (EBITDA) and before specific items (Note 3(iv)) for continuing operations for the year ended 30 June 2015 was a profit of $217,178,000 (2014: profit of $241,688,000).
The Group’s cash flows generated in operations for the year to 30 June 2015 were $246,204,000 (2014: $189,026,000).
Further information is provided in the Operating and Financial Review on pages 45 to 48.
Significant Changes in the State of Affairs
On 16 April 2015, the Group signed an agreement to sell 100% of its Live business for an enterprise value of $640 million. The sale completed on 31 July 2015.
There were no other significant changes in the nature of the Group’s principal activities or in the state of affairs during the financial year.
Acquisition
During the current period, the Group acquired a 60% interest in Pedestrian Group Pty Ltd (refer to Note 6(b)(i) for further detail).
Disposal
During the current period, the Group completed the sale of the wholly owned subsidiary HWW Pty Ltd (refer to Note 6(b)(ii) for further detail).
Significant Events after the Balance Sheet Date
On 31 July 2015 the Group disposed of the controlled entity A.C.N 604 938 534 Pty Ltd and its subsidiaries (collectively “Live”) for an enterprise value of $640 million subject to normal completion adjustments. As part of the transaction, the Group has entered into certain contractual arrangements for a prescribed period which preserve the respective commercial relationships and benefits that have prevailed during the Group’s ownership of the Live business including the provision by the Group of advertising air time to the Live business.
On 5 August 2015 the Group repaid the $580 million which was drawn at 30 June 2015 under the Syndicated loan facility. On 11 August 2015 the Group cancelled $325 million of the Tranche A Syndicated loan facility.
On 10 August 2015 the Group entered into an agreement for premium National Rugby League (NRL) rights for the 2018 to 2022 seasons. Under this agreement, the Group has acquired the exclusive Free to Air rights to broadcast four premium live games a week on each of Thursday, Friday and Saturday evenings and Sunday afternoons, as well as the Finals series, State-of-Origin, and other special event matches. The Group has also acquired all free streaming rights for these games. The National Rugby League may elect to grant the pay simulcast rights for certain games, but otherwise the live distribution of these games across any free visual media is exclusive to the Group. The Group’s average cost over the new rights period amounts to $185 million per annum, inclusive of contra, which will be reduced if the NRL elects to grant pay simulcast rights for certain games.
On 18 August 2015 the Group signed a put and call option to sell its Willoughby, Sydney site for $147.5 million, subject to Foreign Investment Review Board approval and other standard completion requirements. The sale will complete in two years after which the Group will be able to remain on the site, under a lease, for up to a further three years, following which it will re-locate to new premises. Net cash proceeds after tax are expected to be around $135 million, with pre-tax annual lease costs of approximately $10 million from completion.
26 nine entertainment co.
For
per
sona
l use
onl
y
Other than noted above, there has not arisen in the interval between the end of the financial period and the date of this report any item, transaction or event of a material and unusual nature, to affect significantly the operations of the consolidated entity, the results of those operations, or the state of affairs of the consolidated entity, in future years.
Likely Developments and Expected Results
Other than the developments described in this report, the Directors are of the opinion that no other matters or circumstance will significantly affect the operations and expected results of the Group.
Unissued Shares and Options
As at the date of this report, there were no unissued ordinary shares or options. There have not been any share options issued during the year.
Indemnification and Insurance of Directors and Officers
During or since the financial year, Nine Entertainment Co. Holdings Limited has paid premiums in respect of a contract insuring all the directors and officers of the parent entity and its controlled entities against costs incurred by them in defending any legal proceedings arising out of their conduct while acting in their capacity as director or officer of Nine Entertainment Co. Holdings Limited or its controlled entities. The insurance contract specifically prohibits disclosure of the nature of the insurance cover, the limit of the aggregate liability and the premiums paid.
Auditor’s Independence Declaration
The Directors have received the Auditor’s Independence Declaration, a copy of which is included on page 28.
Indemnification of Auditors
To the extent permitted by law, the Company has agreed to indemnify its auditors, Ernst & Young, as part of the terms of its audit engagement agreement against claims by third parties arising from the audit (for an unspecified amount). No payment has been made to indemnify Ernst & Young during or since the financial year.
Non-audit Services
Details of amounts paid or payable to the auditor for non-audit services provided by the auditor during the year are set out in Note 25 of the financial statements.
The Directors are satisfied that the provision of non-audit services is compatible with the general standard of independence for auditors imposed by the Corporations Act 2001. The nature and scope of each type of non-audit service provided means that auditor independence was not compromised.
Rounding
The amounts contained in the financial statements have been rounded off to the nearest thousand dollars (where rounding is applicable) under the option available to the Group under ASIC Class Order 98/0100. Nine Entertainment Co. Holdings Limited is an entity to which the Class Order applies.
Signed on behalf of the Directors in accordance with a resolution of the Directors.
David Haslingden David GyngellChairman Chief Executive Officer and Director
Sydney, 27 August 2015
Annual Report 2015 27
For
per
sona
l use
onl
y
Auditor’s Independent Declaration to the Directors of Nine Entertainment Co. Holdings Limited
A member firm of Ernst & Young Global LimitedLiability limited by a scheme approved under Professional Standards Legislation
Ernst & Young680 George StreetSydney NSW 2000 AustraliaGPO Box 2646 Sydney NSW 2001
Tel: +61 2 9248 5555Fax: +61 2 9248 5959ey.com/au
8
Auditor’s Independence Declaration to the Directors of NineEntertainment Co. Holdings Limited
In relation to our audit of the financial report of Nine Entertainment Co. Holdings Limited for the financialyear ended 30 June 2015, to the best of my knowledge and belief, there have been no contraventions ofthe auditor independence requirements of the Corporations Act 2001 or any applicable code ofprofessional conduct.
Ernst & Young
John RobinsonPartner27 August 2015
28 nine entertainment co.
For
per
sona
l use
onl
y
Remuneration Report – Audited
Dear Shareholders
On behalf of the Board of Directors, I have pleasure in presenting the Company’s 2015 Remuneration Report. Given the Company’s move from private to public ownership in the 2014 financial year, we have continued to refine the Company’s remuneration approach to better align with its public company status. The primary objective of this report is to detail the remuneration framework and arrangements that have been in place during the year. The Remuneration Report also details the underlying philosophy, principles and governance that underpin the structure and design of remuneration arrangements for Key Management Personnel (“KMP”). In developing executive remuneration arrangements, the Board has sought, and will continue to seek, input from external parties including remuneration advisors, legal counsel, proxy advisors, shareholders and shareholder representative groups.
The Company’s remuneration philosophy is to provide a clear link between shareholder returns and executive remuneration. The Company’s remuneration structure and policies are designed to help build and retain a talented and motivated leadership team to deliver growing and sustainable total returns to shareholders.
Fixed remuneration and the overall total remuneration opportunity for each KMP have been set at a competitive level relative to the Company’s peer group and considering the individual experience of executives, the size and complexity of the Company’s business and the particularly competitive and limited size of the media talent pool in Australia. This process has been undertaken in conjunction with assistance from an independent remuneration advisor.
Key changes made to remuneration arrangements for KMP in the year include:
• Short term incentives – the introduction of dual financial measures (Group EBITDA and Earnings Per Share) to enhance the link between executive remuneration outcomes and the key drivers of shareholder value and reflect the short-term performance of the business; reductions in the maximum potential payments in the event of outstanding or exceptional performance; and the introduction of a deferred share element to short term incentives payable; and
• Long term incentives – the establishment of a long term incentive plan (although no offers were made under this plan during the year). In addition, the Board has implemented arrangements to acquire shares on market to satisfy its obligations on the vesting of share based awards. These arrangements offset the otherwise dilutionary impact of share based payment awards.
Details of these changes are set out in more detail in the Remuneration Report.
The Company faced difficult market conditions through the year and financial results fell short of expectations. Accordingly, incentive payments for the 2015 financial year have been sharply reduced, demonstrating the clear link between our remuneration framework and outcomes, Company results and shareholder returns. Actual executive remuneration outcomes also reflect the first full year of the remuneration framework established at around the time of the Company’s IPO in December 2013. In particular, the current year outcomes reflect a full year of the new, lower fixed remuneration package of the CEO following the renegotiation of his employment terms before the IPO.
The Nomination and Remuneration Committee and the Board are satisfied that the Company’s remuneration arrangements remain appropriate and demonstrate a responsible approach to aligning remuneration outcomes with shareholder interests. We will however continue to seek feedback from stakeholders and evaluate and implement improvements to the framework.
David HaslingdenChair of the Nomination and Remuneration Committee
Annual Report 2015 29
For
per
sona
l use
onl
y
Remuneration Report – Audited continued
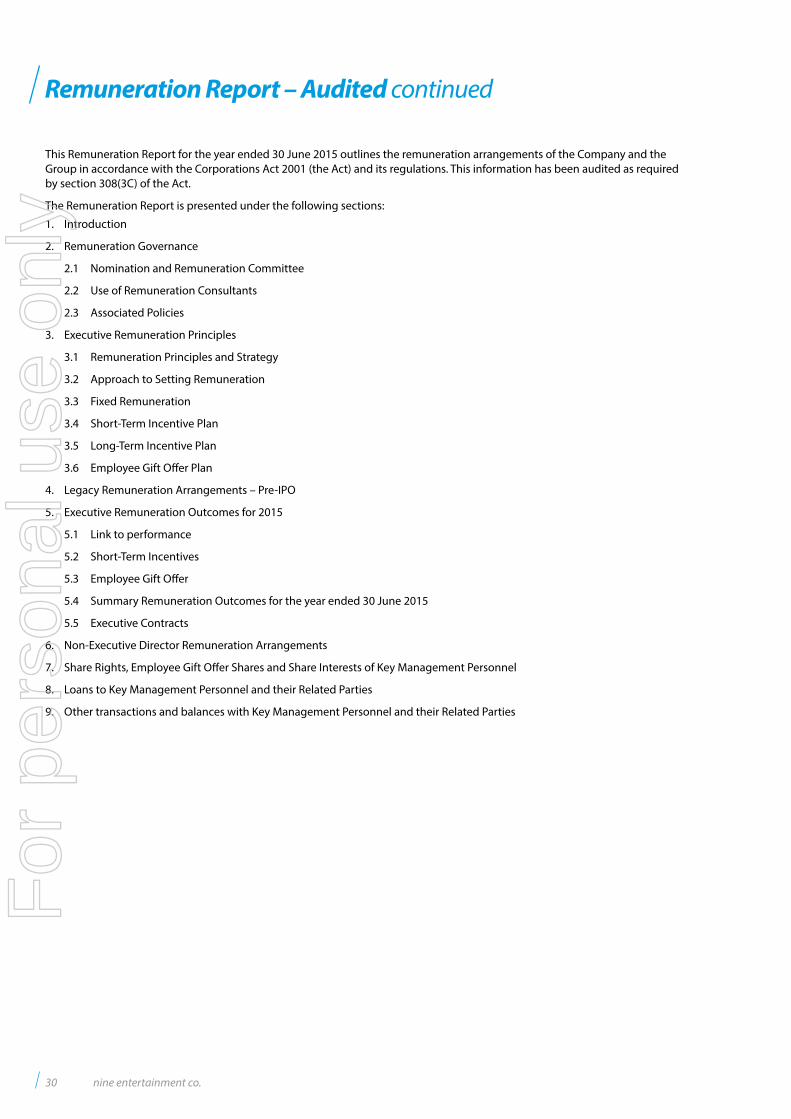
This Remuneration Report for the year ended 30 June 2015 outlines the remuneration arrangements of the Company and the Group in accordance with the Corporations Act 2001 (the Act) and its regulations. This information has been audited as required by section 308(3C) of the Act.
The Remuneration Report is presented under the following sections:
1. Introduction
2. Remuneration Governance
2.1 Nomination and Remuneration Committee
2.2 Use of Remuneration Consultants
2.3 Associated Policies
3. Executive Remuneration Principles
3.1 Remuneration Principles and Strategy
3.2 Approach to Setting Remuneration
3.3 Fixed Remuneration
3.4 Short-Term Incentive Plan
3.5 Long-Term Incentive Plan
3.6 Employee Gift Offer Plan
4. Legacy Remuneration Arrangements – Pre-IPO
5. Executive Remuneration Outcomes for 2015
5.1 Link to performance
5.2 Short-Term Incentives
5.3 Employee Gift Offer
5.4 Summary Remuneration Outcomes for the year ended 30 June 2015
5.5 Executive Contracts
6. Non-Executive Director Remuneration Arrangements
7. Share Rights, Employee Gift Offer Shares and Share Interests of Key Management Personnel
8. Loans to Key Management Personnel and their Related Parties
9. Other transactions and balances with Key Management Personnel and their Related Parties
30 nine entertainment co.
For
per
sona
l use
onl
y
1. Introduction
The Remuneration Report details the remuneration framework and arrangements for Key Management Personnel (KMP), as set out below. KMP are those persons having authority and responsibility for planning, directing and controlling the major activities of the Company and the Group, directly or indirectly, including any Director (whether executive or otherwise) of the Parent.
In this report, “Executive Key Management Personnel” or “Executive KMP” refers to the KMP other than the Non-Executive Directors.
Non-Executive Directors (NEDs) David Haslingden Chairman (independent, non-executive)
Peter Costello Director (independent, non-executive)
Kevin Crowe Director (non-executive)
Holly Kramer Director (independent, non-executive)1
Edgar Lee Director (non-executive)2
Hugh Marks Director (independent, non-executive)
Steve Martinez Director (non-executive)
Joanne Pollard Director (independent, non-executive)3
Rajath Shourie Director (non-executive)2
Executive Director David Gyngell Chief Executive Officer
Other Executive KMP Simon Kelly Chief Operating Officer, Chief Financial Officer and Company Secretary
Amanda Laing Commercial Director and Group General Counsel
Peter Wiltshire Group Director Sales and Marketing
1. Appointed on 6 May 2015.
2. Resigned on 25 April 2015.
3. Resigned on 21 November 2014.
There were no changes to KMP after the reporting date and before the date the financial report was authorised for issue.
2. Remuneration Governance
2.1 Nomination and Remuneration Committee (“NRC”)In accordance with its charter the NRC should, to the extent practicable given the size and composition of the Board from time to time, comprise:
i. At least three members each of whom must be non-executive directors; and
ii. A majority of directors who are independent.
Following the resignation of its former Chair and prior to 15 June 2015 when Holly Kramer was appointed to the committee, the NRC comprised only two members and did not consist of a majority of directors who were independent. Although the NRC charter and ASX Recommendation 8.1 suggest that the committee consist of a majority of independent directors, NEC believes that during the period that the committee did not comply with this recommendation, the then members of the committee were the most appropriate to achieve its objectives given their skill set and experience. The Board believes that the composition of the NRC during the year did not hinder it in acting in the best interests of the Company and its shareholders generally and expects to be in compliance with ASX Recommendation 8.1 in future.
The NRC assists the Board in fulfilling its responsibilities for corporate governance and oversight of NEC’s nomination and remuneration policies and practices with the goal of enabling NEC to attract and retain directors and senior management and appropriately align their interests with those of key stakeholders.
Specifically, the Board approves the remuneration arrangements of the CEO and other key executives and awards made under short-term incentive (STI) and long-term incentive (LTI) plans, following recommendations from the NRC. The Board also sets the remuneration levels of Non-Executive Directors (NEDs), subject to the aggregate pool limit approved by shareholders.
The NRC assists the Board in discharging its responsibilities in relation to NEC’s Board composition and performance and succession of the CEO and other key executives.
The NRC meets as required through the year. The CEO and other senior executives attend certain NRC meetings by invitation, where management input is required. Management are not present during any discussions relating to their own remuneration arrangements.
Details of the membership, number and attendance at meetings held by the NRC are set out on page 25 of the Directors’ Report.
Further information on the NRC’s role, responsibilities and membership is included in the committee charter which is available at http://www.nineentertainment.com.au.
Annual Report 2015 31
For
per
sona
l use
onl
y
Remuneration Report – Audited continued
2.2 Use of Remuneration ConsultantsFrom time to time, the NRC seeks external independent remuneration advice. Remuneration consultants are engaged by, and report directly to, the committee. In selecting a remuneration consultant, the committee considers potential conflicts of interest and requires the consultant’s independence from management as part of their terms of engagement.
Where the consultant’s engagement requires a remuneration recommendation, the recommendation is provided to the Chair of the NRC to ensure management cannot unduly influence the outcome.
The Company has continued to engage the services of Egan Associates as the Company’s remuneration advisor. In the current financial year the NRC did not receive any remuneration recommendations, though it was provided with information on market trends to assist the committee with policy development, having particular regard to incentive programs, and other strategic advice.
Communications in relation to the above were forwarded directly to the Chair of the Committee.
2.3 Associated Policies The Company has established a number of policies to support reward and governance including the Code of Conduct, Disclosure Policy and Securities Trading Policy. These policies have been implemented to promote ethical behaviour and responsible decision making.
3. Executive Remuneration Principles
3.1 Remuneration Principles and StrategyFollowing the Company’s listing a new remuneration framework (Remuneration Framework) was implemented, reflecting the company’s remuneration positioning following consideration of industry and market practices and advice from independent external advisers. This framework was designed to attract and retain high performing individuals, align executive reward to NEC’s business objectives and to create shareholder value.
The remuneration framework aligns actual remuneration to guidelines set out in this document.
The NRC monitors and reshapes the remuneration framework to support changes in the Company’s short- and long-term objectives and to respond to legislation and regulatory initiatives, changes in the business cycle, competitive environment and market practice.
The Board’s objective is to ensure remuneration packages appropriately reflect employees’ duties, responsibilities and levels of performance, as well as ensuring that remuneration attracts and motivates people of the highest calibre, having particular regard to the specialist nature and limited availability of key management talent in the Australian media marketplace.
Specifically, the Company’s executive reward structure is designed to:
• Align rewards to the creation of shareholder value, implementation of business strategy and delivery of results;
• Implement targeted goals that encourage high performance and establish a clear link between executive remuneration and performance, both at Company and individual business unit levels;
• Attract, retain and motivate high calibre executives for key business roles;
• Provide a balance between fixed remuneration and at-risk elements and short- and long-term outcomes that encourages appropriate behaviour to provide reward for short-term delivery and long-term sustainability; and
• Implement an industry competitive remuneration structure.
3.2 Approach to Setting Remuneration The Group aims to reward Executive KMP with a level and mix (comprising fixed remuneration, short- and long-term incentives) of remuneration appropriate to their position, responsibilities and performance within the Group and aligned with industry and market practice.
The Group’s policy is to position Total Potential Remuneration for Executive KMP principally within a competitive range of direct industry peers in light of the small pool of executive talent with appropriate industry experience and skills and the particularly competitive nature of the media and entertainment industry, but also having regard to other Australian listed companies of a similar size, complexity and prominence. Total remuneration at target is positioned at the median of this comparator group, while providing the opportunity to earn top quartile rewards for outstanding performance against the stretch targets set.
Remuneration levels are considered periodically and on a case-by-case basis through a remuneration review that considers industry insights, the performance of the Company and individual, and the broader economic environment, and (as required) advice from independent external advisors.
The Company’s executive remuneration framework was revised to reflect its move from private to public ownership during the 2014 financial year. Disclosed remuneration for the 2014 and 2015 financial years includes certain legacy elements of the pre-IPO Remuneration Framework which was in place prior to the Company’s IPO. These are discussed later in this report.
32 nine entertainment co.
For
per
sona
l use
onl
y
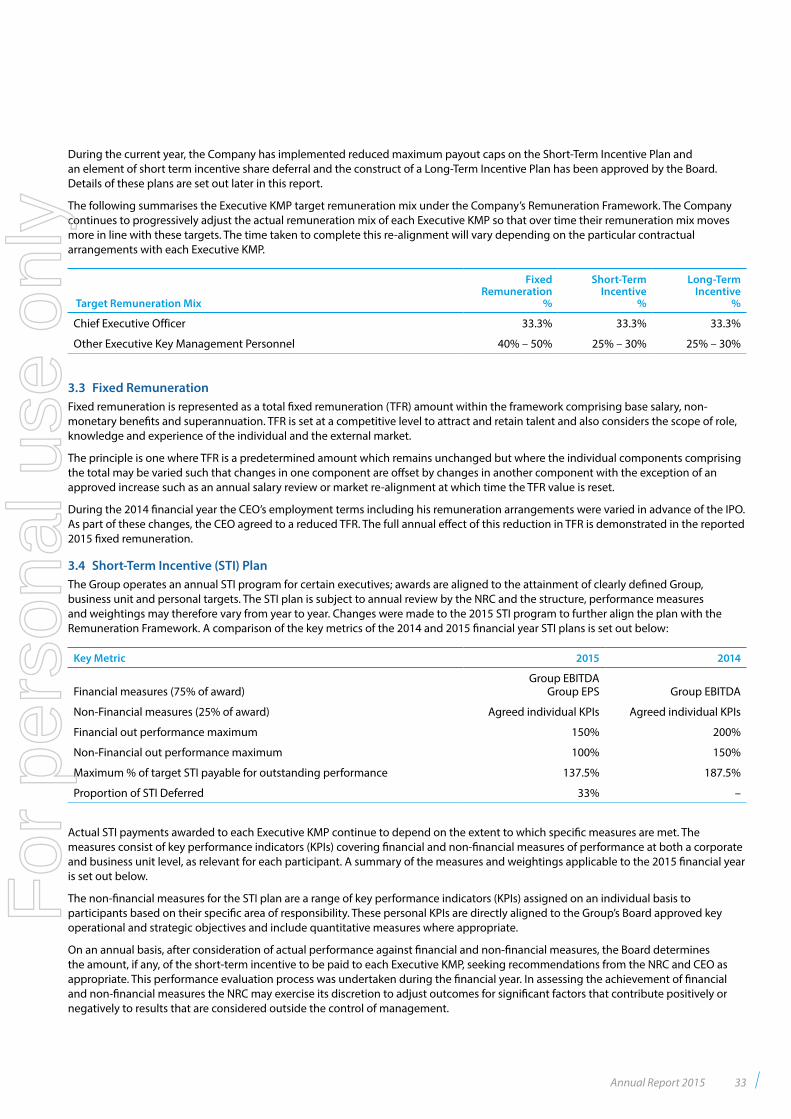
During the current year, the Company has implemented reduced maximum payout caps on the Short-Term Incentive Plan and an element of short term incentive share deferral and the construct of a Long-Term Incentive Plan has been approved by the Board. Details of these plans are set out later in this report.
The following summarises the Executive KMP target remuneration mix under the Company’s Remuneration Framework. The Company continues to progressively adjust the actual remuneration mix of each Executive KMP so that over time their remuneration mix moves more in line with these targets. The time taken to complete this re-alignment will vary depending on the particular contractual arrangements with each Executive KMP.
Target Remuneration Mix
FixedRemuneration
%
Short-Term Incentive
%
Long-Term Incentive
%
Chief Executive Officer 33.3% 33.3% 33.3%
Other Executive Key Management Personnel 40% – 50% 25% – 30% 25% – 30%
3.3 Fixed RemunerationFixed remuneration is represented as a total fixed remuneration (TFR) amount within the framework comprising base salary, non-monetary benefits and superannuation. TFR is set at a competitive level to attract and retain talent and also considers the scope of role, knowledge and experience of the individual and the external market.
The principle is one where TFR is a predetermined amount which remains unchanged but where the individual components comprising the total may be varied such that changes in one component are offset by changes in another component with the exception of an approved increase such as an annual salary review or market re-alignment at which time the TFR value is reset.
During the 2014 financial year the CEO’s employment terms including his remuneration arrangements were varied in advance of the IPO. As part of these changes, the CEO agreed to a reduced TFR. The full annual effect of this reduction in TFR is demonstrated in the reported 2015 fixed remuneration.
3.4 Short-Term Incentive (STI) PlanThe Group operates an annual STI program for certain executives; awards are aligned to the attainment of clearly defined Group, business unit and personal targets. The STI plan is subject to annual review by the NRC and the structure, performance measures and weightings may therefore vary from year to year. Changes were made to the 2015 STI program to further align the plan with the Remuneration Framework. A comparison of the key metrics of the 2014 and 2015 financial year STI plans is set out below:
Key Metric 2015 2014
Financial measures (75% of award)Group EBITDA
Group EPS Group EBITDA
Non-Financial measures (25% of award) Agreed individual KPIs Agreed individual KPIs
Financial out performance maximum 150% 200%
Non-Financial out performance maximum 100% 150%
Maximum % of target STI payable for outstanding performance 137.5% 187.5%
Proportion of STI Deferred 33% –
Actual STI payments awarded to each Executive KMP continue to depend on the extent to which specific measures are met. The measures consist of key performance indicators (KPIs) covering financial and non-financial measures of performance at both a corporate and business unit level, as relevant for each participant. A summary of the measures and weightings applicable to the 2015 financial year is set out below.
The non-financial measures for the STI plan are a range of key performance indicators (KPIs) assigned on an individual basis to participants based on their specific area of responsibility. These personal KPIs are directly aligned to the Group’s Board approved key operational and strategic objectives and include quantitative measures where appropriate.
On an annual basis, after consideration of actual performance against financial and non-financial measures, the Board determines the amount, if any, of the short-term incentive to be paid to each Executive KMP, seeking recommendations from the NRC and CEO as appropriate. This performance evaluation process was undertaken during the financial year. In assessing the achievement of financial and non-financial measures the NRC may exercise its discretion to adjust outcomes for significant factors that contribute positively or negatively to results that are considered outside the control of management.
Annual Report 2015 33
For
per
sona
l use
onl
y
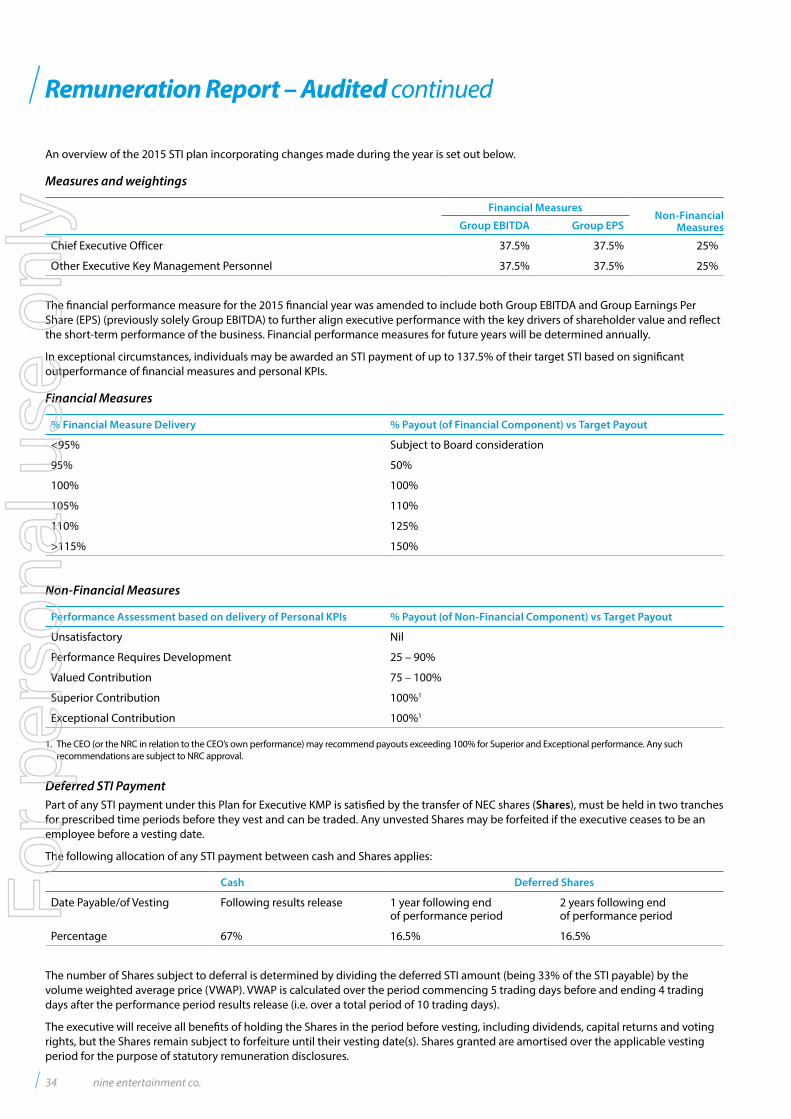
Remuneration Report – Audited continued
An overview of the 2015 STI plan incorporating changes made during the year is set out below.
Measures and weightings
Financial MeasuresNon-Financial
MeasuresGroup EBITDA Group EPS
Chief Executive Officer 37.5% 37.5% 25%
Other Executive Key Management Personnel 37.5% 37.5% 25%
The financial performance measure for the 2015 financial year was amended to include both Group EBITDA and Group Earnings Per Share (EPS) (previously solely Group EBITDA) to further align executive performance with the key drivers of shareholder value and reflect the short-term performance of the business. Financial performance measures for future years will be determined annually.
In exceptional circumstances, individuals may be awarded an STI payment of up to 137.5% of their target STI based on significant outperformance of financial measures and personal KPIs.
Financial Measures
% Financial Measure Delivery % Payout (of Financial Component) vs Target Payout
<95% Subject to Board consideration
95% 50%
100% 100%
105% 110%
110% 125%
>115% 150%
Non-Financial Measures
Performance Assessment based on delivery of Personal KPIs % Payout (of Non-Financial Component) vs Target Payout
Unsatisfactory Nil
Performance Requires Development 25 – 90%
Valued Contribution 75 – 100%
Superior Contribution 100%1
Exceptional Contribution 100%1
1. The CEO (or the NRC in relation to the CEO’s own performance) may recommend payouts exceeding 100% for Superior and Exceptional performance. Any such recommendations are subject to NRC approval.
Deferred STI PaymentPart of any STI payment under this Plan for Executive KMP is satisfied by the transfer of NEC shares (Shares), must be held in two tranches for prescribed time periods before they vest and can be traded. Any unvested Shares may be forfeited if the executive ceases to be an employee before a vesting date.
The following allocation of any STI payment between cash and Shares applies:
Cash Deferred Shares
Date Payable/of Vesting Following results release 1 year following end of performance period
2 years following end of performance period
Percentage 67% 16.5% 16.5%
The number of Shares subject to deferral is determined by dividing the deferred STI amount (being 33% of the STI payable) by the volume weighted average price (VWAP). VWAP is calculated over the period commencing 5 trading days before and ending 4 trading days after the performance period results release (i.e. over a total period of 10 trading days).
The executive will receive all benefits of holding the Shares in the period before vesting, including dividends, capital returns and voting rights, but the Shares remain subject to forfeiture until their vesting date(s). Shares granted are amortised over the applicable vesting period for the purpose of statutory remuneration disclosures.
34 nine entertainment co.
For
per
sona
l use
onl
y
Shares which have vested can only be traded following the release of the Company’s first annual results after the vesting date. After that time, the executive may still be restricted from selling by NEC’s Securities Trading Policy or any applicable laws (such as the insider trading provisions).
The Board has determined that Shares will be acquired on-market to satisfy awards under this component of the STI Plan.
3.5 Long-Term Incentive (LTI) PlanThe construct of an equity-based LTI component of the Remuneration Framework has been approved by the NRC however no awards were made during the 2015 financial year.
The plan which seeks to align long-term remuneration outcomes with stakeholder interests benchmarked against the market and the delivery of the Company’s strategic and operating goals will be implemented over time as part of this Remuneration Framework. The Company does not expect that the grant of awards under the long-term incentive plan will have any significant effect on the Company’s ability to issue shares in future and accordingly the Company does not consider it necessary to seek shareholder approval for the issue of shares under the plan (other than any issue to a director which requires shareholder approval under ASX Listing Rule 10.11).
3.6 Employee Gift Offer PlanAll eligible employees, including KMP (excluding directors) were entitled to participate in an Employee Gift Offer made at the time of the IPO. Under this offer, successful applicants received an allocation of $1,000 worth of shares (487 shares at the offer price of $2.05 per share) for nil consideration on the listing of the Company.
Shares issued under the Employee Gift Offer may not be sold, assigned, transferred or otherwise dealt with (including being assigned as security) before the earlier of the end of a three year period after issue or the time when a participant is no longer employed by NEC or any of its group members, subject to a minimum holding period of 18 months after issue. Other than these restrictions, shares allocated under the Employee Gift Offer carry the same rights and entitlements, including dividend and voting rights, as other shares on issue.
The Company did not make an Employee Gift Offer in the 2015 financial year and it has not been determined at this stage whether there will be any future Employee Gift Offers.
Annual Report 2015 35
For
per
sona
l use
onl
y
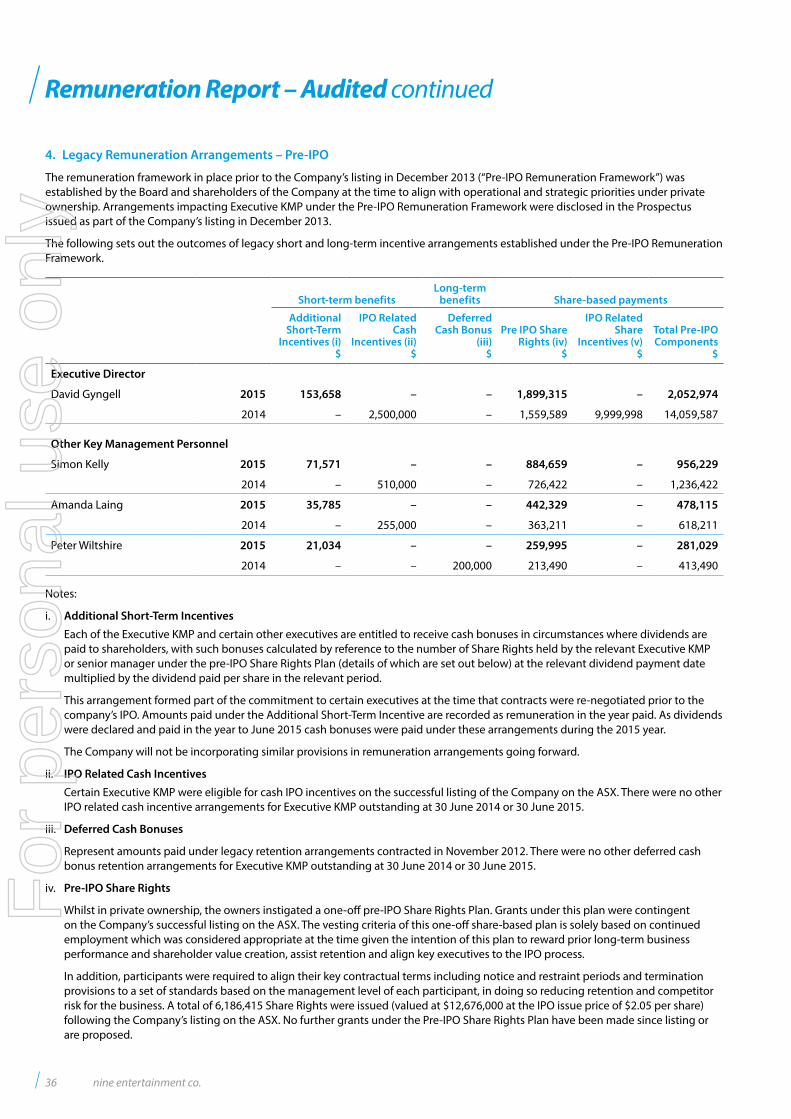
Remuneration Report – Audited continued
4. Legacy Remuneration Arrangements – Pre-IPO
The remuneration framework in place prior to the Company’s listing in December 2013 (“Pre-IPO Remuneration Framework”) was established by the Board and shareholders of the Company at the time to align with operational and strategic priorities under private ownership. Arrangements impacting Executive KMP under the Pre-IPO Remuneration Framework were disclosed in the Prospectus issued as part of the Company’s listing in December 2013.
The following sets out the outcomes of legacy short and long-term incentive arrangements established under the Pre-IPO Remuneration Framework.
Short-term benefitsLong-term
benefits Share-based payments
Additional Short-Term
Incentives (i)$
IPO Related Cash
Incentives (ii)$
Deferred Cash Bonus
(iii)$
Pre IPO Share Rights (iv)
$
IPO Related Share
Incentives (v)$
Total Pre-IPO Components
$
Executive Director
David Gyngell 2015 153,658 – – 1,899,315 – 2,052,974
2014 – 2,500,000 – 1,559,589 9,999,998 14,059,587
Other Key Management Personnel
Simon Kelly 2015 71,571 – – 884,659 – 956,229
2014 – 510,000 – 726,422 – 1,236,422
Amanda Laing 2015 35,785 – – 442,329 – 478,115
2014 – 255,000 – 363,211 – 618,211
Peter Wiltshire 2015 21,034 – – 259,995 – 281,029
2014 – – 200,000 213,490 – 413,490
Notes:
i. Additional Short-Term Incentives
Each of the Executive KMP and certain other executives are entitled to receive cash bonuses in circumstances where dividends are paid to shareholders, with such bonuses calculated by reference to the number of Share Rights held by the relevant Executive KMP or senior manager under the pre-IPO Share Rights Plan (details of which are set out below) at the relevant dividend payment date multiplied by the dividend paid per share in the relevant period.
This arrangement formed part of the commitment to certain executives at the time that contracts were re-negotiated prior to the company’s IPO. Amounts paid under the Additional Short-Term Incentive are recorded as remuneration in the year paid. As dividends were declared and paid in the year to June 2015 cash bonuses were paid under these arrangements during the 2015 year.
The Company will not be incorporating similar provisions in remuneration arrangements going forward.
ii. IPO Related Cash Incentives
Certain Executive KMP were eligible for cash IPO incentives on the successful listing of the Company on the ASX. There were no other IPO related cash incentive arrangements for Executive KMP outstanding at 30 June 2014 or 30 June 2015.
iii. Deferred Cash Bonuses
Represent amounts paid under legacy retention arrangements contracted in November 2012. There were no other deferred cash bonus retention arrangements for Executive KMP outstanding at 30 June 2014 or 30 June 2015.
iv. Pre-IPO Share Rights
Whilst in private ownership, the owners instigated a one-off pre-IPO Share Rights Plan. Grants under this plan were contingent on the Company’s successful listing on the ASX. The vesting criteria of this one-off share-based plan is solely based on continued employment which was considered appropriate at the time given the intention of this plan to reward prior long-term business performance and shareholder value creation, assist retention and align key executives to the IPO process.
In addition, participants were required to align their key contractual terms including notice and restraint periods and termination provisions to a set of standards based on the management level of each participant, in doing so reducing retention and competitor risk for the business. A total of 6,186,415 Share Rights were issued (valued at $12,676,000 at the IPO issue price of $2.05 per share) following the Company’s listing on the ASX. No further grants under the Pre-IPO Share Rights Plan have been made since listing or are proposed.
36 nine entertainment co.
For
per
sona
l use
onl
y
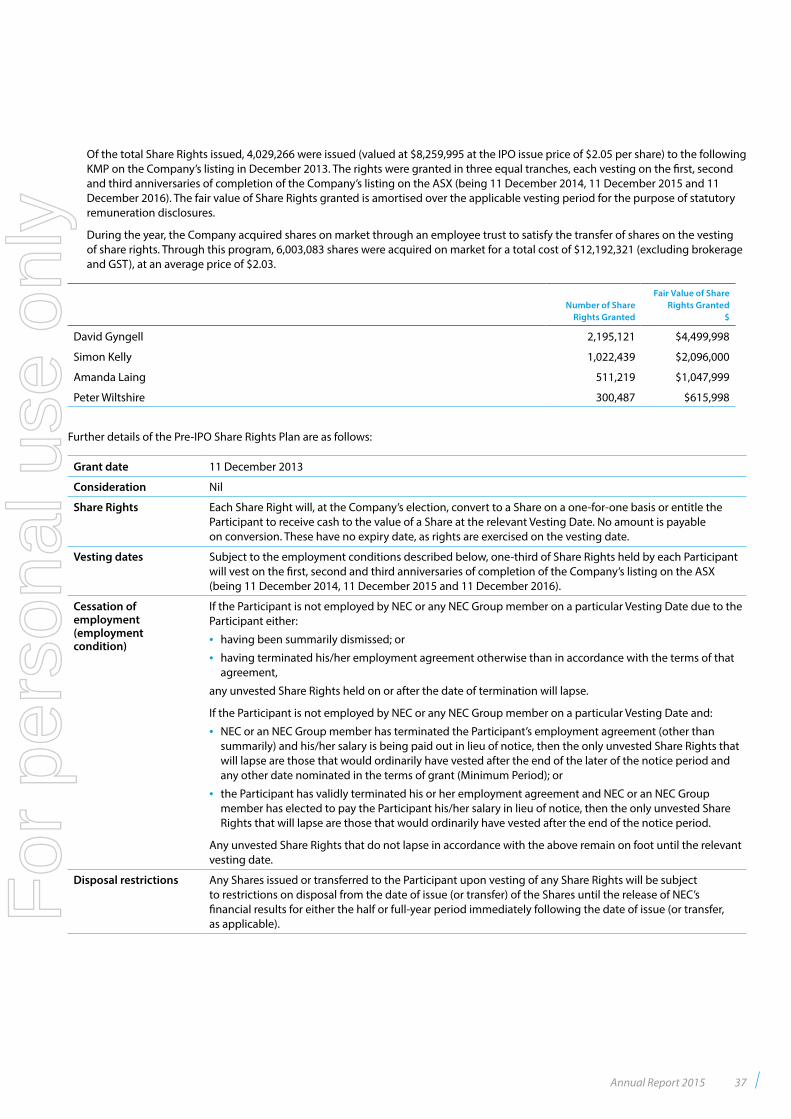
Of the total Share Rights issued, 4,029,266 were issued (valued at $8,259,995 at the IPO issue price of $2.05 per share) to the following KMP on the Company’s listing in December 2013. The rights were granted in three equal tranches, each vesting on the first, second and third anniversaries of completion of the Company’s listing on the ASX (being 11 December 2014, 11 December 2015 and 11 December 2016). The fair value of Share Rights granted is amortised over the applicable vesting period for the purpose of statutory remuneration disclosures.
During the year, the Company acquired shares on market through an employee trust to satisfy the transfer of shares on the vesting of share rights. Through this program, 6,003,083 shares were acquired on market for a total cost of $12,192,321 (excluding brokerage and GST), at an average price of $2.03.
Number of Share Rights Granted
Fair Value of Share Rights Granted
$
David Gyngell 2,195,121 $4,499,998
Simon Kelly 1,022,439 $2,096,000
Amanda Laing 511,219 $1,047,999
Peter Wiltshire 300,487 $615,998
Further details of the Pre-IPO Share Rights Plan are as follows:
Grant date 11 December 2013
Consideration Nil
Share Rights Each Share Right will, at the Company’s election, convert to a Share on a one-for-one basis or entitle the Participant to receive cash to the value of a Share at the relevant Vesting Date. No amount is payable on conversion. These have no expiry date, as rights are exercised on the vesting date.
Vesting dates Subject to the employment conditions described below, one-third of Share Rights held by each Participant will vest on the first, second and third anniversaries of completion of the Company’s listing on the ASX (being 11 December 2014, 11 December 2015 and 11 December 2016).
Cessation of employment (employment condition)
If the Participant is not employed by NEC or any NEC Group member on a particular Vesting Date due to the Participant either:
• having been summarily dismissed; or
• having terminated his/her employment agreement otherwise than in accordance with the terms of that agreement,
any unvested Share Rights held on or after the date of termination will lapse.
If the Participant is not employed by NEC or any NEC Group member on a particular Vesting Date and:
• NEC or an NEC Group member has terminated the Participant’s employment agreement (other than summarily) and his/her salary is being paid out in lieu of notice, then the only unvested Share Rights that will lapse are those that would ordinarily have vested after the end of the later of the notice period and any other date nominated in the terms of grant (Minimum Period); or
• the Participant has validly terminated his or her employment agreement and NEC or an NEC Group member has elected to pay the Participant his/her salary in lieu of notice, then the only unvested Share Rights that will lapse are those that would ordinarily have vested after the end of the notice period.
Any unvested Share Rights that do not lapse in accordance with the above remain on foot until the relevant vesting date.
Disposal restrictions Any Shares issued or transferred to the Participant upon vesting of any Share Rights will be subject to restrictions on disposal from the date of issue (or transfer) of the Shares until the release of NEC’s financial results for either the half or full-year period immediately following the date of issue (or transfer, as applicable).
Annual Report 2015 37
For
per
sona
l use
onl
y
Remuneration Report – Audited continued
Change of control The Board has the discretion to accelerate vesting of some or all of a Participant’s Share Rights in the event of certain transactions which may result in a change of control of Nine Entertainment Co. Holdings. The discretion will be exercised having regard to all relevant circumstances at the time, including the extent to which any applicable vesting conditions have been met. Unvested Share Rights will remain in place unless the Board determines to exercise that discretion.
Where a change of control occurs, Nine Entertainment Co. Holdings can agree with a Participant and the new controller that the Participant will receive shares in the new controller, rather than shares in Nine Entertainment Co. Holdings, on vesting of Share Rights, with appropriate adjustments to the number and type of shares to be issued on vesting of the Share Rights.
Unless the Board decides otherwise, any restrictions on disposal of shares which have been issued on vesting of Share Rights will be lifted, if a change of control event occurs.
Restrictions Without the prior approval of the Board, or unless required by law, Share Rights may not be sold, transferred, encumbered or otherwise dealt with.
A Participant may not enter into any arrangement for the purpose of hedging, or otherwise affecting their economic exposure to their Share Rights.
Amendments To the extent permitted by the ASX Listing Rules, the Board retains the discretion to vary the terms and conditions of the Share Rights Plan.This includes varying the number of Share Rights or the number of Shares to which a Participant is entitled upon a reorganisation of capital of NEC.
Other terms The Share Rights Plan also contains customary and usual terms having regard to Australian law for dealing with administration, variation, suspension and termination of the Share Rights Plan.
v. IPO Related Share Incentives
In accordance with his employment contract dated 1 November 2010, the CEO was entitled to receive an issue of shares to the value of $9,999,998 (calculated at the IPO issue price) subject to disposal restrictions for a period of three years on the successful listing of the Company. No consideration was payable in respect of this share issue. The full value of this incentive was shown as remuneration in the 2014 financial year.
5. Executive remuneration outcomes for 2015
5.1 Link to performanceIn the 2014 financial year, the Company’s first financial year of public ownership, Executive KMPs received STI at or above target to reflect the successful listing of the company and over-achievement of its Prospectus forecasts.
The Company faced difficult market conditions through the 2015 financial year and financial results fell short of expectations. Accordingly, incentive payments for the 2015 financial year have been sharply reduced, demonstrating the clear link between the remuneration framework and outcomes, Company results and shareholder returns. Actual Executive KMP remuneration outcomes also reflect the first full year of the remuneration framework established at around the time of the Company’s IPO in December 2013.
The link between Executive KMP remuneration and Group financial performance is set out below. Given the change from private to public ownership, changes in the composition of the Company’s businesses and its capital structure and its executive remuneration framework, an analysis of the link between Company performance and remuneration for the period before the IPO is not meaningful or reflective of the link that has existed since that time.
38 nine entertainment co.
For
per
sona
l use
onl
y
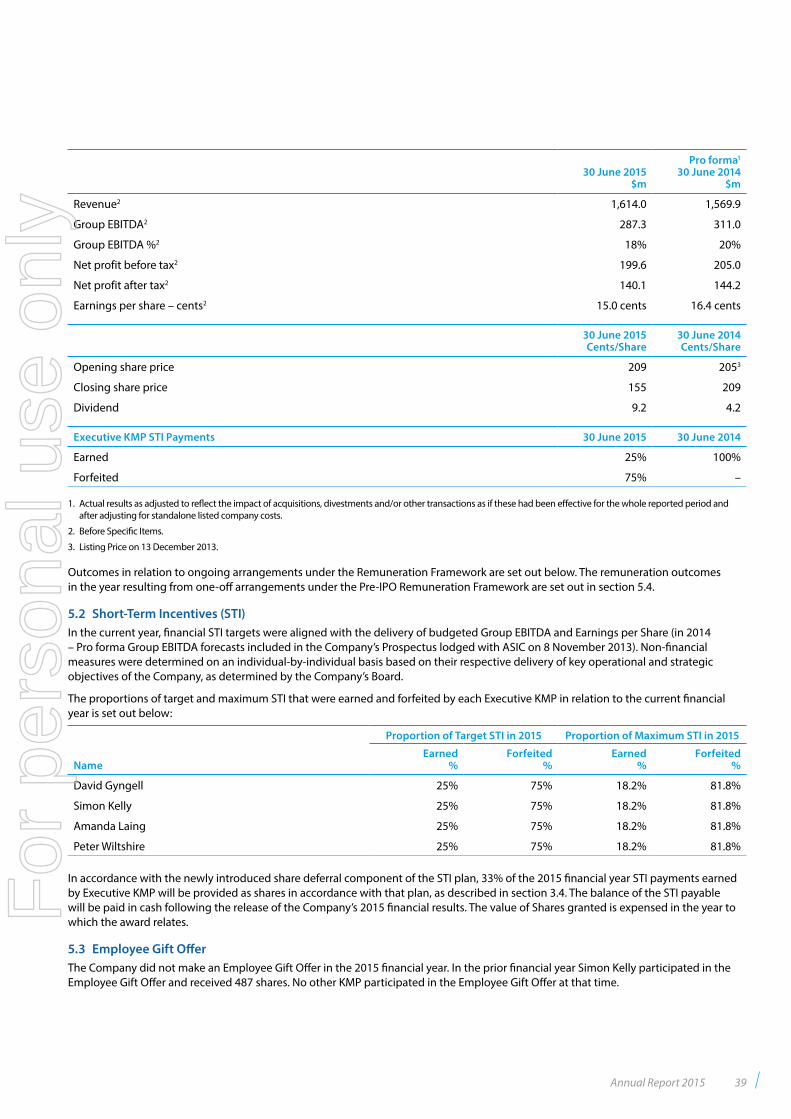
30 June 2015$m
Pro forma1
30 June 2014$m
Revenue2 1,614.0 1,569.9
Group EBITDA2 287.3 311.0
Group EBITDA %2 18% 20%
Net profit before tax2 199.6 205.0
Net profit after tax2 140.1 144.2
Earnings per share – cents2 15.0 cents 16.4 cents
30 June 2015Cents/Share
30 June 2014Cents/Share
Opening share price 209 2053
Closing share price 155 209
Dividend 9.2 4.2
Executive KMP STI Payments 30 June 2015 30 June 2014
Earned 25% 100%
Forfeited 75% –
1. Actual results as adjusted to reflect the impact of acquisitions, divestments and/or other transactions as if these had been effective for the whole reported period and after adjusting for standalone listed company costs.
2. Before Specific Items.
3. Listing Price on 13 December 2013.
Outcomes in relation to ongoing arrangements under the Remuneration Framework are set out below. The remuneration outcomes in the year resulting from one-off arrangements under the Pre-IPO Remuneration Framework are set out in section 5.4.
5.2 Short-Term Incentives (STI)In the current year, financial STI targets were aligned with the delivery of budgeted Group EBITDA and Earnings per Share (in 2014 – Pro forma Group EBITDA forecasts included in the Company’s Prospectus lodged with ASIC on 8 November 2013). Non-financial measures were determined on an individual-by-individual basis based on their respective delivery of key operational and strategic objectives of the Company, as determined by the Company’s Board.
The proportions of target and maximum STI that were earned and forfeited by each Executive KMP in relation to the current financial year is set out below:
Name
Proportion of Target STI in 2015 Proportion of Maximum STI in 2015
Earned %
Forfeited %
Earned %
Forfeited %
David Gyngell 25% 75% 18.2% 81.8%
Simon Kelly 25% 75% 18.2% 81.8%
Amanda Laing 25% 75% 18.2% 81.8%
Peter Wiltshire 25% 75% 18.2% 81.8%
In accordance with the newly introduced share deferral component of the STI plan, 33% of the 2015 financial year STI payments earned by Executive KMP will be provided as shares in accordance with that plan, as described in section 3.4. The balance of the STI payable will be paid in cash following the release of the Company’s 2015 financial results. The value of Shares granted is expensed in the year to which the award relates.
5.3 Employee Gift OfferThe Company did not make an Employee Gift Offer in the 2015 financial year. In the prior financial year Simon Kelly participated in the Employee Gift Offer and received 487 shares. No other KMP participated in the Employee Gift Offer at that time.
Annual Report 2015 39
For
per
sona
l use
onl
y
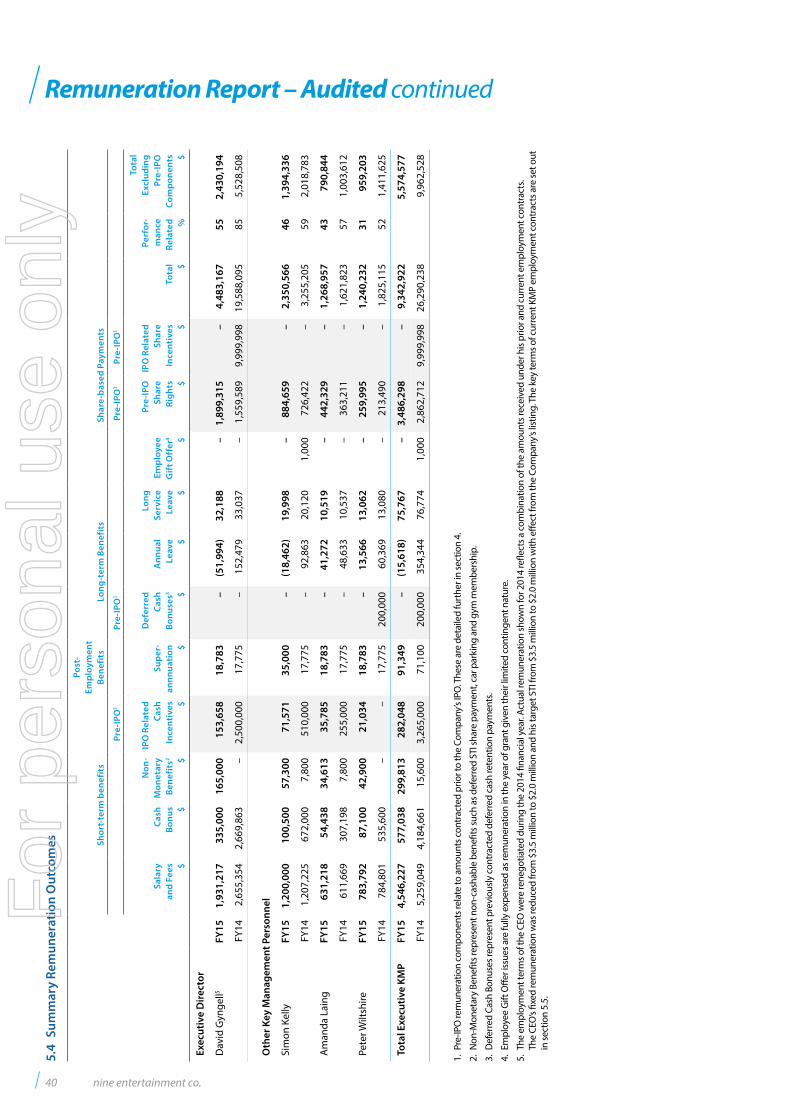
Remuneration Report – Audited continued
5.4
Sum
mar
y Re
mun
erat
ion
Out
com
es Shor
t-te
rm b
enef
its
Post
- Em
ploy
men
t Be
nefi
tsLo
ng-t
erm
Ben
efit
sSh
are-
base
d Pa
ymen
ts
Pre-
IPO
1Pr
e-IP
O1
Pre-
IPO
1Pr
e-IP
O1
Sala
ryan
d Fe
es $
Cash
Bo
nus $
Non
- M
onet
ary
Bene
fits
2 $
IPO
Rel
ated
Ca
sh
Ince
ntiv
es $
Supe
r-an
nnua
tion
$
Def
erre
d Ca
sh
Bonu
ses3 $
Ann
ual
Leav
e $
Long
Se
rvic
e Le
ave $
Empl
oyee
G
ift O
ffer
4 $
Pre-
IPO
Sh
are
Righ
ts $
IPO
Rel
ated
Sh
are
Ince
ntiv
es $
Tota
l $
Perf
or-
man
ce
Rela
ted %
Tota
l Ex
clud
ing
Pre-
IPO
Co
mpo
nent
s $
Exec
utiv
e D
irect
or
Dav
id G
ynge
ll5FY
151,
931,
217
335,
000
165,
000
153,
658
18,7
83–
(51,
994)
32,1
88–
1,89
9,31
5–
4,48
3,16
755
2,43
0,19
4
FY14
2,65
5,35
42,
669,
863
–2,
500,
000
17,7
75–
152,
479
33,0
37–
1,55
9,58
99,
999,
998
19,5
88,0
9585
5,52
8,50
8
Oth
er K
ey M
anag
emen
t Per
sonn
el
Sim
on K
elly
FY15
1,20
0,00
010
0,50
057
,300
71,5
7135
,000
–(1
8,46
2)19
,998
–88
4,65
9–
2,35
0,56
646
1,39
4,33
6
FY14
1,20
7,22
567
2,00
07,
800
510,
000
17,7
75–
92,8
6320
,120
1,00
072
6,42
2–
3,25
5,20
559
2,01
8,78
3
Am
anda
Lai
ngFY
1563
1,21
854
,438
34,6
1335
,785
18,7
83–
41,2
7210
,519
–44
2,32
9–
1,26
8,95
743
790,
844
FY14
611,
669
307,
198
7,80
025
5,00
017
,775
–48
,633
10,5
37–
363,
211
–1,
621,
823
571,
003,
612
Pete
r Wilt
shire
FY15
783,
792
87,1
0042
,900
21,0
3418
,783
–13
,566
13,0
62–
259,
995
–1,
240,
232
3195
9,20
3
FY
1478
4,80
153
5,60
0–
–17
,775
200,
000
60,3
6913
,080
–21
3,49
0–
1,82
5,11
552
1,41
1,62
5
Tota
l Exe
cutiv
e KM
PFY
154,
546,
227
577,
038
299,
813
282,
048
91,3
49–
(15,
618)
75,7
67–
3,48
6,29
8–
9,34
2,92
25,
574,
577
FY
145,
259,
049
4,18
4,66
115
,600
3,26
5,00
071
,100
200,
000
354,
344
76,7
741,
000
2,86
2,71
29,
999,
998
26,2
90,2
38
9,96
2,52
8
1. P
re-IP
O re
mun
erat
ion
com
pone
nts r
elat
e to
am
ount
s con
trac
ted
prio
r to
the
Com
pany
’s IP
O. T
hese
are
det
aile
d fu
rthe
r in
sect
ion
4.
2. N
on-M
onet
ary
Bene
fits r
epre
sent
non
-cas
habl
e be
nefit
s suc
h as
def
erre
d ST
I sha
re p
aym
ent,
car p
arki
ng a
nd g
ym m
embe
rshi
p.
3. D
efer
red
Cash
Bon
uses
repr
esen
t pre
viou
sly c
ontr
acte
d de
ferr
ed c
ash
rete
ntio
n pa
ymen
ts.
4. E
mpl
oyee
Gift
Offe
r iss
ues a
re fu
lly e
xpen
sed
as re
mun
erat
ion
in th
e ye
ar o
f gra
nt g
iven
thei
r lim
ited
cont
inge
nt n
atur
e.
5. T
he e
mpl
oym
ent t
erm
s of t
he C
EO w
ere
rene
gotia
ted
durin
g th
e 20
14 fi
nanc
ial y
ear.
Actu
al re
mun
erat
ion
show
n fo
r 201
4 re
flect
s a c
ombi
natio
n of
the
amou
nts r
ecei
ved
unde
r his
prio
r and
cur
rent
em
ploy
men
t con
trac
ts.
The
CEO
’s fix
ed re
mun
erat
ion
was
redu
ced
from
$3.
5 m
illio
n to
$2.
0 m
illio
n an
d hi
s tar
get S
TI fr
om $
3.5
mill
ion
to $
2.0
mill
ion
with
effe
ct fr
om th
e Co
mpa
ny’s
listin
g. T
he k
ey te
rms o
f cur
rent
KM
P em
ploy
men
t con
trac
ts a
re se
t out
in
sect
ion
5.5.
40 nine entertainment co.
For
per
sona
l use
onl
y
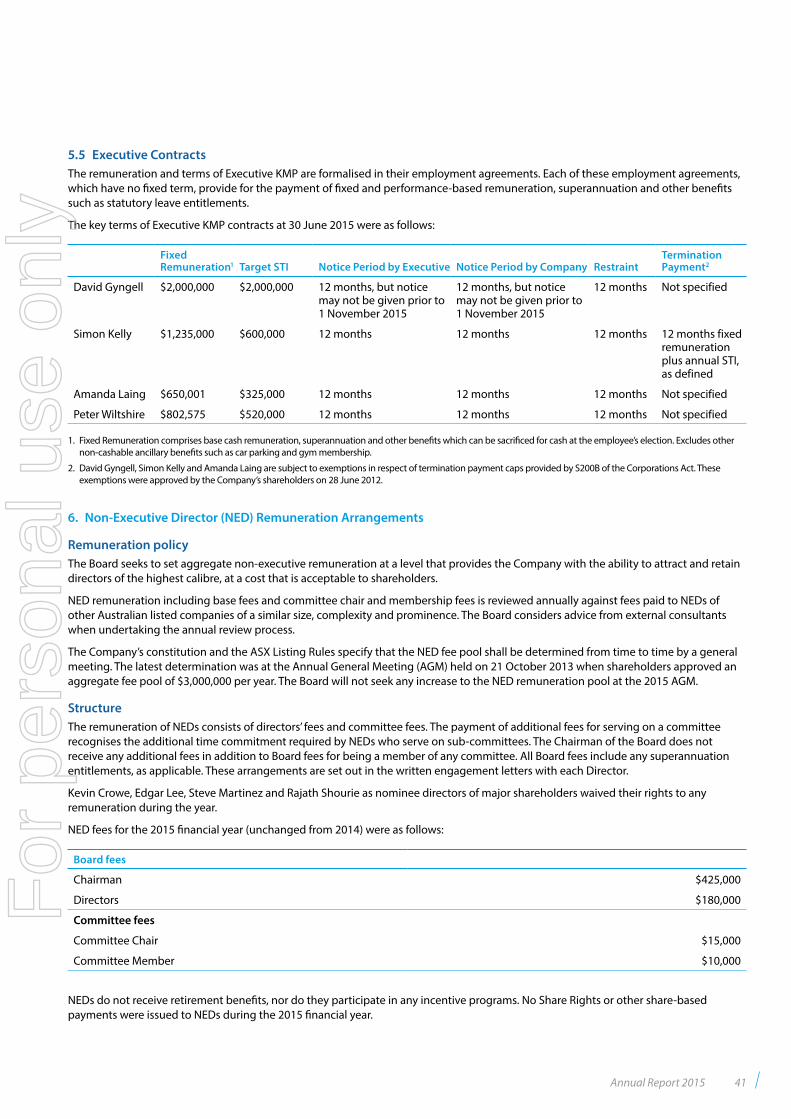
5.5 Executive ContractsThe remuneration and terms of Executive KMP are formalised in their employment agreements. Each of these employment agreements, which have no fixed term, provide for the payment of fixed and performance-based remuneration, superannuation and other benefits such as statutory leave entitlements.
The key terms of Executive KMP contracts at 30 June 2015 were as follows:
Fixed Remuneration1 Target STI Notice Period by Executive Notice Period by Company Restraint
Termination Payment2
David Gyngell $2,000,000 $2,000,000 12 months, but notice may not be given prior to 1 November 2015
12 months, but notice may not be given prior to 1 November 2015
12 months Not specified
Simon Kelly $1,235,000 $600,000 12 months 12 months 12 months 12 months fixed remuneration plus annual STI, as defined
Amanda Laing $650,001 $325,000 12 months 12 months 12 months Not specified
Peter Wiltshire $802,575 $520,000 12 months 12 months 12 months Not specified
1. Fixed Remuneration comprises base cash remuneration, superannuation and other benefits which can be sacrificed for cash at the employee’s election. Excludes other non-cashable ancillary benefits such as car parking and gym membership.
2. David Gyngell, Simon Kelly and Amanda Laing are subject to exemptions in respect of termination payment caps provided by S200B of the Corporations Act. These exemptions were approved by the Company’s shareholders on 28 June 2012.
6. Non-Executive Director (NED) Remuneration Arrangements
Remuneration policyThe Board seeks to set aggregate non-executive remuneration at a level that provides the Company with the ability to attract and retain directors of the highest calibre, at a cost that is acceptable to shareholders.
NED remuneration including base fees and committee chair and membership fees is reviewed annually against fees paid to NEDs of other Australian listed companies of a similar size, complexity and prominence. The Board considers advice from external consultants when undertaking the annual review process.
The Company’s constitution and the ASX Listing Rules specify that the NED fee pool shall be determined from time to time by a general meeting. The latest determination was at the Annual General Meeting (AGM) held on 21 October 2013 when shareholders approved an aggregate fee pool of $3,000,000 per year. The Board will not seek any increase to the NED remuneration pool at the 2015 AGM.
StructureThe remuneration of NEDs consists of directors’ fees and committee fees. The payment of additional fees for serving on a committee recognises the additional time commitment required by NEDs who serve on sub-committees. The Chairman of the Board does not receive any additional fees in addition to Board fees for being a member of any committee. All Board fees include any superannuation entitlements, as applicable. These arrangements are set out in the written engagement letters with each Director.
Kevin Crowe, Edgar Lee, Steve Martinez and Rajath Shourie as nominee directors of major shareholders waived their rights to any remuneration during the year.
NED fees for the 2015 financial year (unchanged from 2014) were as follows:
Board fees
Chairman $425,000
Directors $180,000
Committee fees
Committee Chair $15,000
Committee Member $10,000
NEDs do not receive retirement benefits, nor do they participate in any incentive programs. No Share Rights or other share-based payments were issued to NEDs during the 2015 financial year.
Annual Report 2015 41
For
per
sona
l use
onl
y
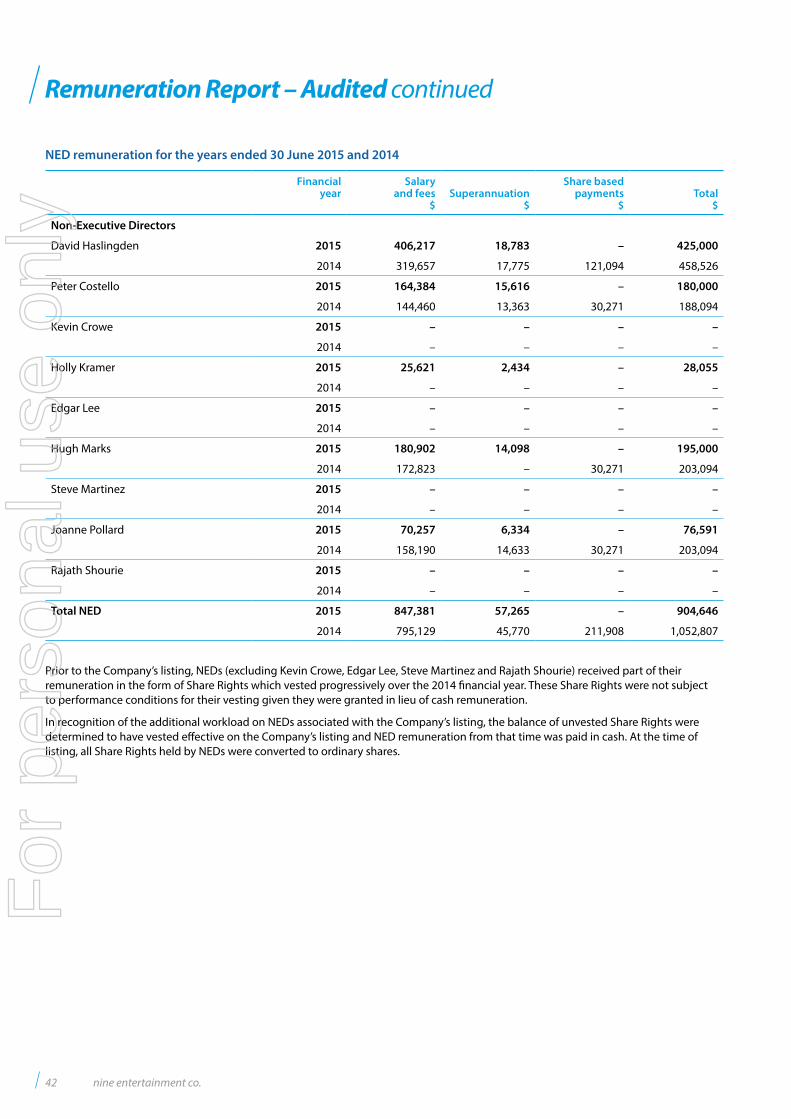
Remuneration Report – Audited continued
NED remuneration for the years ended 30 June 2015 and 2014
Financial year
Salary and fees
$Superannuation
$
Share based payments
$Total
$
Non-Executive Directors
David Haslingden 2015 406,217 18,783 – 425,000
2014 319,657 17,775 121,094 458,526
Peter Costello 2015 164,384 15,616 – 180,000
2014 144,460 13,363 30,271 188,094
Kevin Crowe 2015 – – – –
2014 – – – –
Holly Kramer 2015 25,621 2,434 – 28,055
2014 – – – –
Edgar Lee 2015 – – – –
2014 – – – –
Hugh Marks 2015 180,902 14,098 – 195,000
2014 172,823 – 30,271 203,094
Steve Martinez 2015 – – – –
2014 – – – –
Joanne Pollard 2015 70,257 6,334 – 76,591
2014 158,190 14,633 30,271 203,094
Rajath Shourie 2015 – – – –
2014 – – – –
Total NED 2015 847,381 57,265 – 904,646
2014 795,129 45,770 211,908 1,052,807
Prior to the Company’s listing, NEDs (excluding Kevin Crowe, Edgar Lee, Steve Martinez and Rajath Shourie) received part of their remuneration in the form of Share Rights which vested progressively over the 2014 financial year. These Share Rights were not subject to performance conditions for their vesting given they were granted in lieu of cash remuneration.
In recognition of the additional workload on NEDs associated with the Company’s listing, the balance of unvested Share Rights were determined to have vested effective on the Company’s listing and NED remuneration from that time was paid in cash. At the time of listing, all Share Rights held by NEDs were converted to ordinary shares.
42 nine entertainment co.
For
per
sona
l use
onl
y
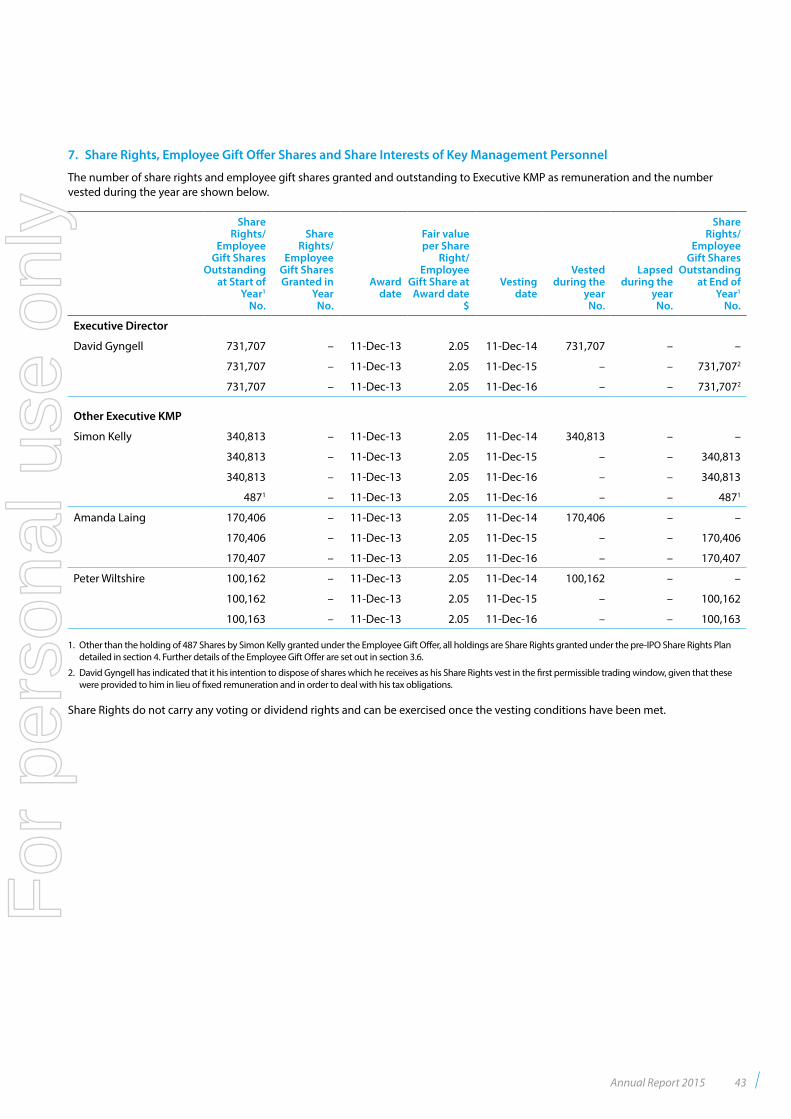
7. Share Rights, Employee Gift Offer Shares and Share Interests of Key Management Personnel
The number of share rights and employee gift shares granted and outstanding to Executive KMP as remuneration and the number vested during the year are shown below.
Share Rights/
Employee Gift Shares
Outstanding at Start of
Year1
No.
Share Rights/
Employee Gift Shares Granted in
YearNo.
Awarddate
Fair value per Share
Right/ Employee
Gift Share at Award date
$
Vesting date
Vested during the
year No.
Lapsed during the
year No.
Share Rights/
Employee Gift Shares
Outstanding at End of
Year1
No.
Executive Director
David Gyngell 731,707 – 11-Dec-13 2.05 11-Dec-14 731,707 – –
731,707 – 11-Dec-13 2.05 11-Dec-15 – – 731,7072
731,707 – 11-Dec-13 2.05 11-Dec-16 – – 731,7072
Other Executive KMP
Simon Kelly 340,813 – 11-Dec-13 2.05 11-Dec-14 340,813 – –
340,813 – 11-Dec-13 2.05 11-Dec-15 – – 340,813
340,813 – 11-Dec-13 2.05 11-Dec-16 – – 340,813
4871 – 11-Dec-13 2.05 11-Dec-16 – – 4871
Amanda Laing 170,406 – 11-Dec-13 2.05 11-Dec-14 170,406 – –
170,406 – 11-Dec-13 2.05 11-Dec-15 – – 170,406
170,407 – 11-Dec-13 2.05 11-Dec-16 – – 170,407
Peter Wiltshire 100,162 – 11-Dec-13 2.05 11-Dec-14 100,162 – –
100,162 – 11-Dec-13 2.05 11-Dec-15 – – 100,162
100,163 – 11-Dec-13 2.05 11-Dec-16 – – 100,163
1. Other than the holding of 487 Shares by Simon Kelly granted under the Employee Gift Offer, all holdings are Share Rights granted under the pre-IPO Share Rights Plan detailed in section 4. Further details of the Employee Gift Offer are set out in section 3.6.
2. David Gyngell has indicated that it his intention to dispose of shares which he receives as his Share Rights vest in the first permissible trading window, given that these were provided to him in lieu of fixed remuneration and in order to deal with his tax obligations.
Share Rights do not carry any voting or dividend rights and can be exercised once the vesting conditions have been met.
Annual Report 2015 43
For
per
sona
l use
onl
y
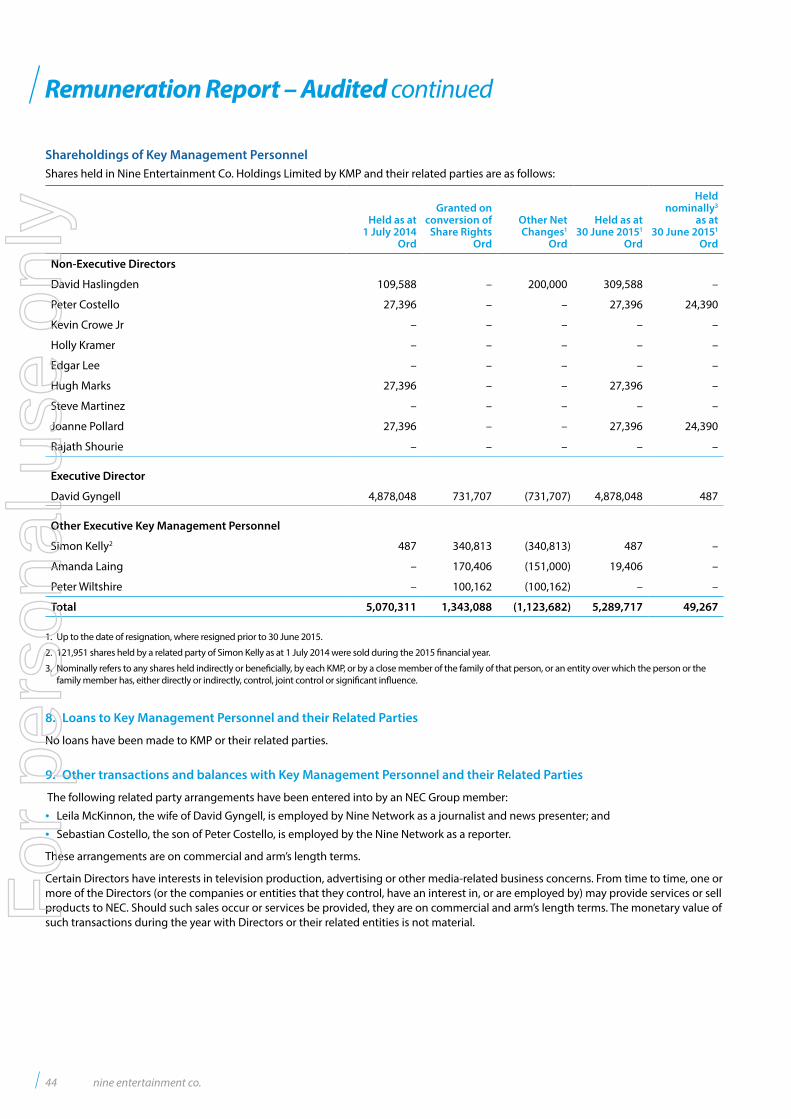
Remuneration Report – Audited continued
Shareholdings of Key Management PersonnelShares held in Nine Entertainment Co. Holdings Limited by KMP and their related parties are as follows:
Held as at 1 July 2014
Ord
Granted on conversion of
Share RightsOrd
Other Net Changes1
Ord
Held as at 30 June 20151
Ord
Held nominally3
as at 30 June 20151
Ord
Non-Executive Directors
David Haslingden 109,588 – 200,000 309,588 –
Peter Costello 27,396 – – 27,396 24,390
Kevin Crowe Jr – – – – –
Holly Kramer – – – – –
Edgar Lee – – – – –
Hugh Marks 27,396 – – 27,396 –
Steve Martinez – – – – –
Joanne Pollard 27,396 – – 27,396 24,390
Rajath Shourie – – – – –
Executive Director
David Gyngell 4,878,048 731,707 (731,707) 4,878,048 487
Other Executive Key Management Personnel
Simon Kelly2 487 340,813 (340,813) 487 –
Amanda Laing – 170,406 (151,000) 19,406 –
Peter Wiltshire – 100,162 (100,162) – –
Total 5,070,311 1,343,088 (1,123,682) 5,289,717 49,267
1. Up to the date of resignation, where resigned prior to 30 June 2015.
2. 121,951 shares held by a related party of Simon Kelly as at 1 July 2014 were sold during the 2015 financial year.
3. Nominally refers to any shares held indirectly or beneficially, by each KMP, or by a close member of the family of that person, or an entity over which the person or the family member has, either directly or indirectly, control, joint control or significant influence.
8. Loans to Key Management Personnel and their Related Parties
No loans have been made to KMP or their related parties.
9. Other transactions and balances with Key Management Personnel and their Related Parties
The following related party arrangements have been entered into by an NEC Group member:
• Leila McKinnon, the wife of David Gyngell, is employed by Nine Network as a journalist and news presenter; and
• Sebastian Costello, the son of Peter Costello, is employed by the Nine Network as a reporter.
These arrangements are on commercial and arm’s length terms.
Certain Directors have interests in television production, advertising or other media-related business concerns. From time to time, one or more of the Directors (or the companies or entities that they control, have an interest in, or are employed by) may provide services or sell products to NEC. Should such sales occur or services be provided, they are on commercial and arm’s length terms. The monetary value of such transactions during the year with Directors or their related entities is not material.
44 nine entertainment co.
For
per
sona
l use
onl
y
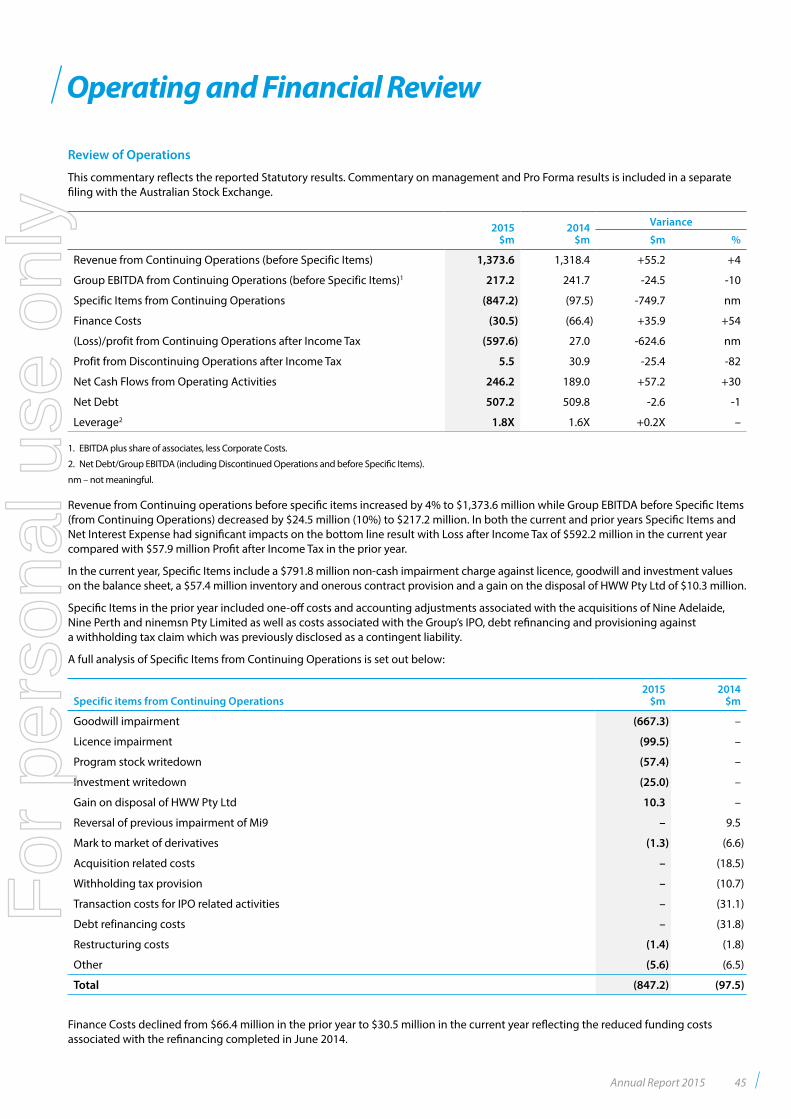
Operating and Financial Review
Review of Operations
This commentary reflects the reported Statutory results. Commentary on management and Pro Forma results is included in a separate filing with the Australian Stock Exchange.
2015 $m
2014 $m
Variance
$m %
Revenue from Continuing Operations (before Specific Items) 1,373.6 1,318.4 +55.2 +4
Group EBITDA from Continuing Operations (before Specific Items)1 217.2 241.7 -24.5 -10
Specific Items from Continuing Operations (847.2) (97.5) -749.7 nm
Finance Costs (30.5) (66.4) +35.9 +54
(Loss)/profit from Continuing Operations after Income Tax (597.6) 27.0 -624.6 nm
Profit from Discontinuing Operations after Income Tax 5.5 30.9 -25.4 -82
Net Cash Flows from Operating Activities 246.2 189.0 +57.2 +30
Net Debt 507.2 509.8 -2.6 -1
Leverage2 1.8X 1.6X +0.2X –
1. EBITDA plus share of associates, less Corporate Costs.
2. Net Debt/Group EBITDA (including Discontinued Operations and before Specific Items).
nm – not meaningful.
Revenue from Continuing operations before specific items increased by 4% to $1,373.6 million while Group EBITDA before Specific Items (from Continuing Operations) decreased by $24.5 million (10%) to $217.2 million. In both the current and prior years Specific Items and Net Interest Expense had significant impacts on the bottom line result with Loss after Income Tax of $592.2 million in the current year compared with $57.9 million Profit after Income Tax in the prior year.
In the current year, Specific Items include a $791.8 million non-cash impairment charge against licence, goodwill and investment values on the balance sheet, a $57.4 million inventory and onerous contract provision and a gain on the disposal of HWW Pty Ltd of $10.3 million.
Specific Items in the prior year included one-off costs and accounting adjustments associated with the acquisitions of Nine Adelaide, Nine Perth and ninemsn Pty Limited as well as costs associated with the Group’s IPO, debt refinancing and provisioning against a withholding tax claim which was previously disclosed as a contingent liability.
A full analysis of Specific Items from Continuing Operations is set out below:
Specific items from Continuing Operations2015
$m2014
$m
Goodwill impairment (667.3) –
Licence impairment (99.5) –
Program stock writedown (57.4) –
Investment writedown (25.0) –
Gain on disposal of HWW Pty Ltd 10.3 –
Reversal of previous impairment of Mi9 – 9.5
Mark to market of derivatives (1.3) (6.6)
Acquisition related costs – (18.5)
Withholding tax provision – (10.7)
Transaction costs for IPO related activities – (31.1)
Debt refinancing costs – (31.8)
Restructuring costs (1.4) (1.8)
Other (5.6) (6.5)
Total (847.2) (97.5)
Finance Costs declined from $66.4 million in the prior year to $30.5 million in the current year reflecting the reduced funding costs associated with the refinancing completed in June 2014.
Annual Report 2015 45
For
per
sona
l use
onl
y
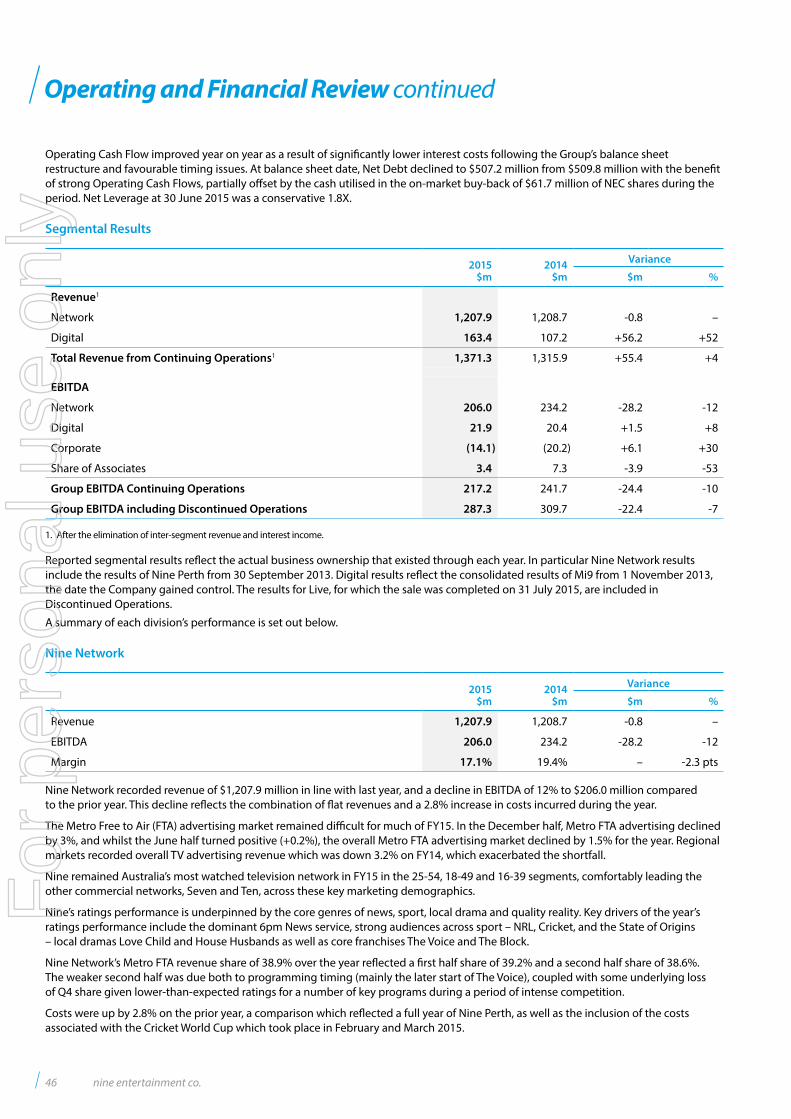
Operating and Financial Review continued
Operating Cash Flow improved year on year as a result of significantly lower interest costs following the Group’s balance sheet restructure and favourable timing issues. At balance sheet date, Net Debt declined to $507.2 million from $509.8 million with the benefit of strong Operating Cash Flows, partially offset by the cash utilised in the on-market buy-back of $61.7 million of NEC shares during the period. Net Leverage at 30 June 2015 was a conservative 1.8X.
Segmental Results
2015 $m
2014 $m
Variance
$m %
Revenue1
Network 1,207.9 1,208.7 -0.8 –
Digital 163.4 107.2 +56.2 +52
Total Revenue from Continuing Operations1 1,371.3 1,315.9 +55.4 +4
EBITDA
Network 206.0 234.2 -28.2 -12
Digital 21.9 20.4 +1.5 +8
Corporate (14.1) (20.2) +6.1 +30
Share of Associates 3.4 7.3 -3.9 -53
Group EBITDA Continuing Operations 217.2 241.7 -24.4 -10
Group EBITDA including Discontinued Operations 287.3 309.7 -22.4 -7
1. After the elimination of inter-segment revenue and interest income.
Reported segmental results reflect the actual business ownership that existed through each year. In particular Nine Network results include the results of Nine Perth from 30 September 2013. Digital results reflect the consolidated results of Mi9 from 1 November 2013, the date the Company gained control. The results for Live, for which the sale was completed on 31 July 2015, are included in Discontinued Operations.
A summary of each division’s performance is set out below.
Nine Network
2015
$m2014
$m
Variance
$m %
Revenue 1,207.9 1,208.7 -0.8 –
EBITDA 206.0 234.2 -28.2 -12
Margin 17.1% 19.4% – -2.3 pts
Nine Network recorded revenue of $1,207.9 million in line with last year, and a decline in EBITDA of 12% to $206.0 million compared to the prior year. This decline reflects the combination of flat revenues and a 2.8% increase in costs incurred during the year.
The Metro Free to Air (FTA) advertising market remained difficult for much of FY15. In the December half, Metro FTA advertising declined by 3%, and whilst the June half turned positive (+0.2%), the overall Metro FTA advertising market declined by 1.5% for the year. Regional markets recorded overall TV advertising revenue which was down 3.2% on FY14, which exacerbated the shortfall.
Nine remained Australia’s most watched television network in FY15 in the 25-54, 18-49 and 16-39 segments, comfortably leading the other commercial networks, Seven and Ten, across these key marketing demographics.
Nine’s ratings performance is underpinned by the core genres of news, sport, local drama and quality reality. Key drivers of the year’s ratings performance include the dominant 6pm News service, strong audiences across sport – NRL, Cricket, and the State of Origins – local dramas Love Child and House Husbands as well as core franchises The Voice and The Block.
Nine Network’s Metro FTA revenue share of 38.9% over the year reflected a first half share of 39.2% and a second half share of 38.6%. The weaker second half was due both to programming timing (mainly the later start of The Voice), coupled with some underlying loss of Q4 share given lower-than-expected ratings for a number of key programs during a period of intense competition.
Costs were up by 2.8% on the prior year, a comparison which reflected a full year of Nine Perth, as well as the inclusion of the costs associated with the Cricket World Cup which took place in February and March 2015.
46 nine entertainment co.
For
per
sona
l use
onl
y
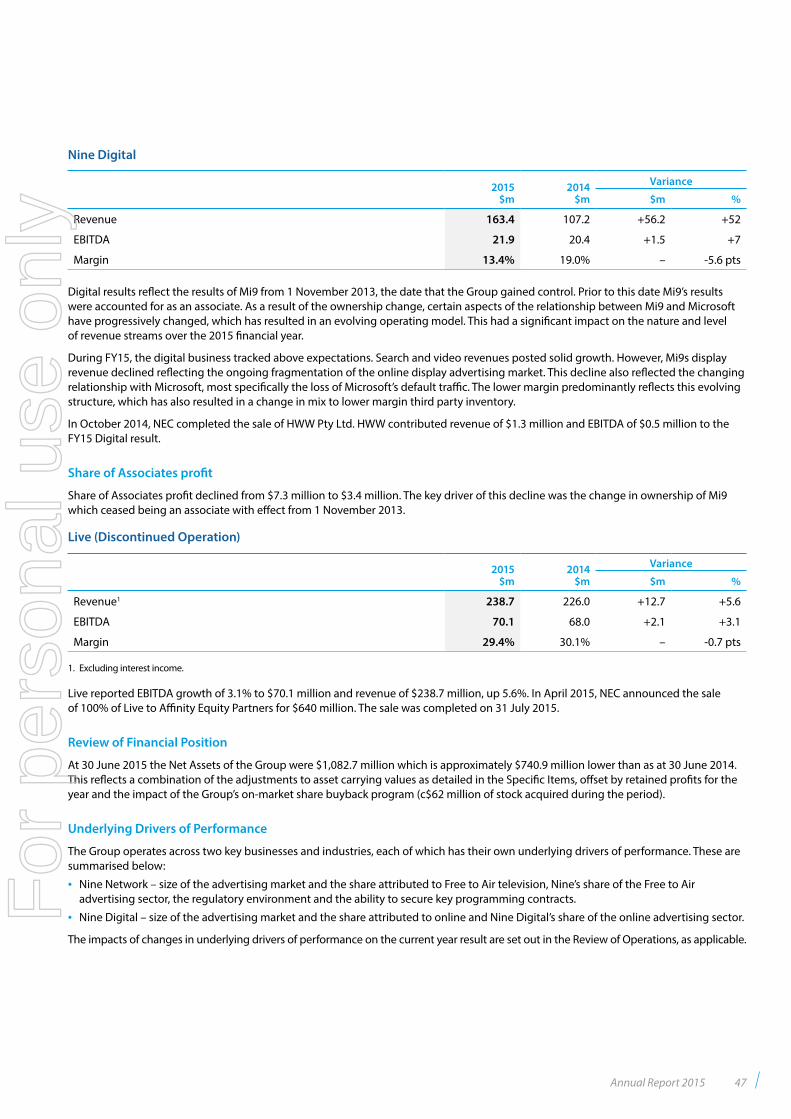
Nine Digital
2015 $m
2014 $m
Variance
$m %
Revenue 163.4 107.2 +56.2 +52
EBITDA 21.9 20.4 +1.5 +7
Margin 13.4% 19.0% – -5.6 pts
Digital results reflect the results of Mi9 from 1 November 2013, the date that the Group gained control. Prior to this date Mi9’s results were accounted for as an associate. As a result of the ownership change, certain aspects of the relationship between Mi9 and Microsoft have progressively changed, which has resulted in an evolving operating model. This had a significant impact on the nature and level of revenue streams over the 2015 financial year.
During FY15, the digital business tracked above expectations. Search and video revenues posted solid growth. However, Mi9s display revenue declined reflecting the ongoing fragmentation of the online display advertising market. This decline also reflected the changing relationship with Microsoft, most specifically the loss of Microsoft’s default traffic. The lower margin predominantly reflects this evolving structure, which has also resulted in a change in mix to lower margin third party inventory.
In October 2014, NEC completed the sale of HWW Pty Ltd. HWW contributed revenue of $1.3 million and EBITDA of $0.5 million to the FY15 Digital result.
Share of Associates profit
Share of Associates profit declined from $7.3 million to $3.4 million. The key driver of this decline was the change in ownership of Mi9 which ceased being an associate with effect from 1 November 2013.
Live (Discontinued Operation)
2015 $m
2014 $m
Variance
$m %
Revenue1 238.7 226.0 +12.7 +5.6
EBITDA 70.1 68.0 +2.1 +3.1
Margin 29.4% 30.1% – -0.7 pts
1. Excluding interest income.
Live reported EBITDA growth of 3.1% to $70.1 million and revenue of $238.7 million, up 5.6%. In April 2015, NEC announced the sale of 100% of Live to Affinity Equity Partners for $640 million. The sale was completed on 31 July 2015.
Review of Financial Position
At 30 June 2015 the Net Assets of the Group were $1,082.7 million which is approximately $740.9 million lower than as at 30 June 2014. This reflects a combination of the adjustments to asset carrying values as detailed in the Specific Items, offset by retained profits for the year and the impact of the Group’s on-market share buyback program (c$62 million of stock acquired during the period).
Underlying Drivers of Performance
The Group operates across two key businesses and industries, each of which has their own underlying drivers of performance. These are summarised below:
• Nine Network – size of the advertising market and the share attributed to Free to Air television, Nine’s share of the Free to Air advertising sector, the regulatory environment and the ability to secure key programming contracts.
• Nine Digital – size of the advertising market and the share attributed to online and Nine Digital’s share of the online advertising sector.
The impacts of changes in underlying drivers of performance on the current year result are set out in the Review of Operations, as applicable.
Annual Report 2015 47
For
per
sona
l use
onl
y
Operating and Financial Review continued
Business Strategies and Future Prospects
The Group is focusing on the following business growth strategies.
• Continue strong momentum and consolidate position as a leading FTA TV network.
The Group intends to achieve consistent performance across Sydney, Melbourne and Brisbane and to increase its audience and revenue share in Adelaide and Perth, with an overall aim of developing a leading position in FTA audience and advertising revenue share across the five capital cities. Overall Network performance is driven by the combination of the primary Channel Nine, as well as GO! and GEM. The Group is also focused on optimising returns through improved broadcast rights deals and affiliate arrangements, and maintaining disciplined cost management.
In programming, the Group recognises the importance of leading news and current affairs, sports content and local content, and is focused on continuing to make targeted investments in content to reflect audience preferences.
• Continue to grow digital media assets
The Group intends to build on Mi9’s position as a leading online network in Australia to grow audience and advertising revenue. The Group plans to expand its audience by increasing its content and the ways customers find and access this content, including via tablets and mobile devices, particularly in online video. Mi9’s goal is to increase its advertising revenue through growth in audience, inventory, as well as making use of its data assets to improve yields and effectiveness of advertising.
• Optimise the returns and opportunities associated with the Group’s premium free content and audience reach
Across its traditional segments of FTA and digital media, NEC’s strengths lie in the production and distribution of premium content. The Group will continue to identify and pursue opportunities where it can increase its content and broaden the utilisation of this content to generate returns and cross-selling opportunities across its integrated platform. This includes investments through Nine Ventures, as well as commercial relationships with businesses.
The Group intends to improve financial returns by improving alignment and integration across its businesses, including its sales and marketing functions.
The Group is confident that the successful execution of these business strategies will enable the Group to grow in the future.
The key risks which could prevent the Group from optimising its growth in the future are set out below:
• Nine Network – significant changes to advertising market conditions, Nine’s share of the advertising market, viewer preferences, the regulatory environment and/or a loss of key programming contracts.
• Nine Digital – significant changes to advertising market conditions, Nine Digital’s share of the advertising market, internet user preferences and/or the regulatory environment. Following on from separation from Microsoft, there are a number of specific risks which include Mi9’s entitlement to use the ninemsn and msn brands, which will result in the need to develop and launch new branding for the ninemsn websites, which may or may not prove successful.
• Technological changes – which may offer new entertainment options which may or may not dilute the impact of NEC’s content; and may or may not offer NEC future opportunities.
Share Price Performance
NEC was listed on the Australian Stock Exchange on 6 December 2013, with an IPO price of $2.05. Over the course of FY15, the Group has traded in the range of $1.49 to $2.36 and closed on 30 June 2015 at $1.55.
48 nine entertainment co.
For
per
sona
l use
onl
y
Corporate Governance Statement
The Board of Directors of Nine Entertainment Co. Holdings Limited (NEC) is responsible for establishing the corporate governance framework of the Group having regard to the ASX Corporate Governance Council (CGC) published guidelines as well as its corporate governance principles and recommendations. The Board guides and monitors the business and affairs of NEC on behalf of its shareholders by whom they are elected and to whom they are accountable.
The Company’s key corporate governance practices are discussed within this statement. Those practices comply with the ASX CGC’s Corporate Governance Principles and Recommendations (3rd edition).
Board of Directors
Role of the BoardThe Board of Directors of NEC is responsible for, and oversees the governance of, the Company. The Board strives to build sustainable value for shareholders whilst protecting the assets and reputation of NEC. The Board has adopted a Board Charter which sets out the responsibilities of the Board and its structure and governance requirements. Under the Board Charter, the functions of the Board are to:
i. approve NEC’s strategies, budgets and business plans;
ii. approve NEC’s annual report including the financial statements, directors’ report, remuneration report and corporate governance statement, with advice from the Nomination and Remuneration Committee and the Audit and Risk Management Committee, as appropriate;
iii. approve major borrowing and debt arrangements, the acquisition, establishment, disposal or cessation of any significant business of the Company, any significant capital expenditure and the issue of any shares, options, equity instruments or other securities in NEC;
iv. assess performance against strategies to monitor both the performance of the Chief Executive Officer and other individuals as determined from time to time by the Nomination and Remuneration Committee (collectively “Senior Management”) of the NEC Group;
v. ensure that the Company acts legally and responsibly on all matters and that the highest ethical standards are maintained;
vi. maintain a constructive and ongoing relationship with the Australian Securities Exchange and regulators, and approve policies regarding disclosure and communications with the market and NEC’s shareholders; and
vii. monitor and approve changes to internal governance including delegated authorities, and monitor resources available to Senior Management.
To ensure that the Board is well equipped to discharge its responsibilities it has established guidelines for the nomination and selection of Directors and for the operation of the Board.
The responsibility for the operation and administration of the Group is delegated, by the Board, to Senior Management. The Board ensures that this team is appropriately qualified and experienced to discharge its responsibilities and has in place procedures to assess the performance of the Senior Management team.
Whilst at all times the Board retains full responsibility for guiding and monitoring the Group, in discharging its stewardship it makes use of specialist sub-committees which are able to focus on a particular responsibility and provide informed feedback to the Board.
With the guidance of the Board’s Nomination and Remuneration Committee, the Board is responsible for:
i. evaluating and approving the remuneration packages of the Chief Executive Officer, Directors and other members of Senior Management;
ii. monitoring compliance with the Non-Executive Director remuneration pool as established by the Constitution, or as subsequently amended by shareholders, and recommending any changes to the pool;
iii. administering short- and long-term incentive plans (including any equity plans) and engaging external remuneration consultants, as appropriate;
iv. appointing, evaluating or removing the Chief Executive Officer, and approving appointments or removal of all other members of Senior Management and Directors;
v. regularly assessing the independence of all Directors;
vi. reviewing succession planning for Directors and Senior Management; and
vii. monitoring the mix of skills, experience, expertise and diversity on the Board and, when necessary, appointing new Directors, for approval by shareholders.
Annual Report 2015 49
For
per
sona
l use
onl
y
Corporate Governance Statement continued
With the guidance of the Audit and Risk Management Committee, the Board is responsible for:
i. preparing and presenting NEC’s financial statements and reports;
ii. overseeing NEC’s financial reporting, which, without limitation, includes:
a. reviewing the suitability of NEC’s accounting policies and principles, how they are applied, and ensuring they are used in accordance with the statutory financial reporting framework;
b. assessing significant estimates and judgements in financial reports; and
c. assessing information from external auditors to ensure the quality of financial reports;
iii. overseeing NEC’s financial controls and systems;
iv. reviewing, monitoring and approving NEC’s risk management policies, procedures and systems; and
v. managing audit arrangements and auditor independence.
Delegation to the CEOThe Board has delegated to the Chief Executive Officer the authority and power to manage NEC and its businesses within levels of authority specified by the Board from time to time. The Chief Executive Officer may delegate aspects of his or her authority and power but remains accountable to the Board for NEC’s performance and is required to report regularly to the Board on the progress being made by NEC’s business units.
The Chief Executive Officer’s role includes:
i. responsibility for the effective leadership of the management team;
ii. the development of strategic objectives for the business; and
iii. the day-to-day management of NEC’s operations.
Board composition, structure and appointmentsThe composition, structure and proceedings of the Board are primarily governed by NEC’s constitution (a copy of which can be found on the Company’s website) and the laws governing corporations in jurisdictions where the Company operates. The Board, with the assistance of the Nomination and Remuneration Committee, regularly reviews the composition and structure of the Board.
The qualifications and experience of each member of the Board are set out in the Directors’ Report. Between them, the Directors bring to the Board relevant experience and skills, which satisfies the Company’s skills matrix for the Board. The skills matrix identifies the following as relevant skills for the Board:
• General business expertise;
• Accounting and finance;
• Legal;
• Industry strategic expertise;
• Risk management;
• Management of people and change;
• Financial markets;
• Media industry;
• Consumer facing business expertise; and
• Political/regulatory.
The criteria to assess nominations of new Directors is reviewed periodically and the Nomination and Remuneration Committee at least annually compares the skill base of existing Directors with that required for the future strategy of NEC to enable identification of attributes required in new Directors.
50 nine entertainment co.
For
per
sona
l use
onl
y
The Nomination and Remuneration Committee assesses nominations of new Directors against a range of criteria including the candidate’s background, experience, professional skills, personal qualities and whether their skills and experience will complement the existing Board, having regard to the skills matrix. Further enquiries about a proposed candidate are made, to the extent considered necessary, to confirm whether the individual is an appropriate candidate to put forward for appointment.
All Directors are issued with a letter of appointment that sets out the key terms of their appointment and the Company’s expectations regarding involvement with the Company. The Chairman and Senior Management are available to provide detailed briefings to new Directors on the Company’s business and strategy and their roles and responsibilities, as part of their induction.
All Directors are expected and encouraged to engage in professional development activities to develop and maintain the skills and knowledge needed to perform their roles as Directors. In addition, ongoing engagement with senior management across the business provides the Directors with development of knowledge of industry issues.
Directors may obtain independent professional advice at NEC’s expense on matters arising in the course of their Board and committee duties, after obtaining the Chairman’s approval. The other Directors must be advised if the Chairman’s approval is withheld.
All proceedings of the Board, including Board papers, presentations and other information provided to the Board, are maintained under strict confidentiality except as required by law or as agreed by the Board.
Non-Executive Directors are required to meet periodically with no management present, to review management performance.
All Directors (other than the Chief Executive Officer) are subject to re-election by rotation at least every three years. Newly appointed Directors must seek re-election at the first general meeting of shareholders following their appointment. The Company ensures that the Notice of Meeting for any Director appointment contains all material information which shareholders require to decide how to vote on the resolution to appoint or re-appoint the individual.
The Nomination and Remuneration Committee carries out a review of the performance of the Board, its committees, and each Non-Executive Director at least once each year. This review considers and assesses:
i. the effectiveness of the Board and each committee in meeting the requirements of its charter;
ii. whether the Board and each committee has members with the appropriate mix of skills and experience to properly perform their functions; and
iii. the independence of each Non-Executive Director, taking into account the Director’s other interests, relationships and directorships.
The Board conducted a review of performance of the Board, its committees and individual Directors in the year ending 30 June 2015. The Nomination and Remuneration Committee periodically reviews the performance of the Chief Executive Officer and other senior executives.
ChairmanThe Chairman is elected by the Board but must be an independent Director. The Chairman must not hold, and must not have held within the previous three years, the office of Chief Executive Officer of NEC. The Chairman’s role includes:
i. providing effective leadership to the Board in relation to all Board matters;
ii. representing the views of the Board to the public; and
iii. presiding over meetings of the Board and general meetings of shareholders.
Company SecretariesThe Board appoints and removes the Company Secretaries. All Directors have direct access to the Company Secretaries who support the effectiveness of the Board by monitoring that Board policy and procedures are followed, and co-ordinate the completion and despatch of Board agendas and papers. The Company Secretaries are accountable to the Chief Executive Officer, and to the Board through the Chair, on all corporate governance matters.
Annual Report 2015 51
For
per
sona
l use
onl
y
Corporate Governance Statement continued
Independent Directors
The Board considers an independent Director to be a Non-Executive Director who is not a member of NEC’s management team and who is free of any business or other relationship that could materially interfere with or reasonably be perceived to interfere with the independent exercise of their judgement. The Board will consider the materiality of any given relationship on a case-by-case basis. The Board reviews the independence of each Director in light of interests disclosed to the Board from time to time.
Individuals would, in the absence of evidence or convincing argument to the contrary, be judged to be not independent if they were:
i. employed, or had previously been employed, in an executive capacity by NEC or any of its subsidiaries in the three years prior to becoming a Director; or
ii. directly involved in the audit of NEC or any of its subsidiaries; or
iii. a substantial shareholder of NEC, or an officer of, or otherwise associated directly with, a substantial shareholder of NEC; or
iv. a principal of a professional adviser or consultant to NEC where the amount paid to that adviser or consultant in the three years prior to becoming a Director was material or the relationship with the adviser or consultant was otherwise material to NEC, or an employee materially associated with the service provided; or
v. a supplier, or an officer of or otherwise associated directly or indirectly with a supplier, to NEC where the amount paid during the year by NEC to that supplier was material (to either NEC or the supplier) or the relationship between NEC and the supplier was otherwise material to NEC or the supplier; or
vi. a customer, or an officer of or otherwise associated directly or indirectly with a customer, of NEC where the amount paid during the year by that customer to NEC was material (to either NEC or the customer) or the relationship between NEC and the customer was otherwise material to NEC or the customer; or
vii. in a material contractual relationship with NEC or another Group member other than as a Director of NEC.
Any potential change in the nature of the independence status of a Non-Executive Director must be promptly notified to the Chair and Company Secretary and the Board will review that Director’s independence status.
The Board considers qualitative principles of materiality for the purpose of determining “independence” on a case-by-case basis. The Board will consider whether there are any factors or considerations which may mean that the Director’s ability to act in the best interests of NEC is impaired.
The Board considers that each of David Haslingden, Peter Costello, Hugh Marks and Holly Kramer is free from any business or any other relationship that could materially interfere with, or reasonably be perceived to interfere with, the independent exercise of their Director’s judgement and is able to fulfil the role of independent Director. David Gyngell, Kevin Crowe Jr and Steve Martinez are currently considered by the Board not to be independent. David Gyngell is the Chief Executive Officer of NEC. Messrs Crowe and Martinez are nominees of Apollo, which is a substantial shareholder of NEC. Before 6 May 2015, the Company did not have a majority of independent directors. However, the Board considers that the directors each brought independent judgement and valuable skills and expertise to the Board’s decision making.
52 nine entertainment co.
For
per
sona
l use
onl
y
Committees
The Board operates two committees:
i. the Audit and Risk Management Committee; and
ii. the Nomination and Remuneration Committee.
Membership of Board committees during the year and as at the date of this report is set out below.
DirectorAudit and Risk Management Committee
Nomination and Remuneration Committee
David Haslingden Independent Non-Executive Chair Member Member, Chair from 21 November 2014
David Gyngell Chief Executive Officer – –
Peter Costello Independent Non-Executive Director – –
Kevin Crowe Jr Non-Executive Director Member –
Holly Kramer (appointed 6 May 2015)
Independent Non-Executive Director – Member (since 15 June 2015)
Edgar Lee (resigned 25 April 2015)
Non-Executive Director – –
Hugh Marks Independent Non-Executive Director Chair –
Steve Martinez Non-Executive Director – Member
Joanne Pollard (resigned 21 November 2014)
Independent Non-Executive Director – Chair (resigned 21 November 2014)
Rajath Shourie (resigned 25 April 2015)
Non-Executive Director – Member (resigned 25 April 2015)
When appointing members of each committee, the Board takes into account the skills and experience appropriate for that committee as well as any statutory or regulatory requirements. The Chair of the Audit and Risk Management Committee may not be the Chair of the Board and should be an independent Director.
Each committee is governed by a Charter, which sets out the matters for which it is responsible. A copy of the Charter of each committee is published on NEC’s website. The Board may establish other committees as and when required.
Audit and Risk Management Committee
The Audit and Risk Management Committee meets at least two times a year or as frequently as is required to undertake its role effectively. The Committee’s role is to assist the Board in fulfilling its responsibilities for corporate governance and oversight of NEC’s financial reporting, internal control structure, risk management systems and external audit functions.
The Committee’s key responsibilities and functions are to assist the Board in discharging its responsibilities:
i. to prepare and present NEC’s financial statements and reports;
ii. in relation to NEC’s financial reporting, which includes:
a. reviewing the suitability of NEC’s accounting policies and principles, how they are applied and ensuring they are used in accordance with the statutory financial reporting framework;
b. assessing significant estimates and judgements in financial reports;
c. assessing information from internal and external auditors to ensure the quality of financial reports; and
d. recommending to the Board whether the financial and associated non-financial statements should be signed based on the Committee’s assessment of them.
iii. in relation to the entry into, approval, or disclosure, of related party transactions (if any);
iv. in overseeing NEC’s financial controls and systems;
v. to review, monitor and approve NEC’s risk management policies, procedures and systems; and
vi. to manage audit arrangements and auditor independence.
Annual Report 2015 53
For
per
sona
l use
onl
y
Corporate Governance Statement continued
Under its Charter, the Committee comprises:
i. at least three members each of whom must be Non-Executive Directors; and
ii. a majority of Directors who are independent (and it must satisfy this description if required by statute or regulation).
The Chair of the Committee should be an independent Non-Executive Director who does not chair the Board. All Committee members should be financially literate and have a reasonable understanding of NEC’s businesses and the industry in which they participate. Members are appointed for a fixed period of no more than three years, with Committee members generally being eligible for re-appointment for so long as they meet the relevant criteria. The appointment and removal of Committee members is the responsibility of the Board. Members may resign as a Committee member upon reasonable notice in writing to the Committee Chair. If a Committee member ceases to be a Director of the Company their appointment as a member of the Committee is automatically terminated with immediate effect. The Company Secretary is secretary to the Committee.
Nomination and Remuneration Committee
The Nomination and Remuneration Committee meets at least annually or as frequently as is required to undertake its role effectively. The Committee’s role is to assist the Board in fulfilling its responsibilities for corporate governance and oversight of NEC’s nomination and remuneration policies and practices which enable it to attract and retain senior management of the NEC Group and appropriately align their interests with those of key stakeholders. The Committee also ensures that the Board continues to operate within established guidelines, including (when necessary) selecting candidates to fill Director positions.
The Committee’s key responsibilities and functions are to assist the Board in discharging its responsibilities:
i. Remuneration policies, including:
a. evaluating and approving the remuneration packages (including fixed remuneration, short-term and long-term incentives and any other benefits or arrangements) of the Chief Executive Officer, executive Directors and other members of Senior Management;
b. evaluating and approving the remuneration arrangements for Non-Executive Directors;
c. monitoring compliance with the Non-Executive Director remuneration pool as established by the Constitution, or as subsequently amended by shareholders, and recommending any changes to the pool; and
d. engagement of external remuneration consultants.
ii. Short- and long-term incentive plans, including:
a. plan terms and conditions;
b. performance hurdles, if any;
c. invitations to participate in offers and the terms of participation; and
d. achievement of performance criteria (if any) and the final level of any payments, grants or allocations.
iii. Equity plans, including:
a. amendments to the terms of existing plans within the parameters of those plans; and
b. administration and operation of plans, including but not limited to determining disputes and resolving questions of fact or interpretation concerning the various plans.
iv. Board composition and performance, considering:
a. the appropriate size, composition and diversity of the Board;
b. the appropriate criteria (necessary and desirable skills and experience) for appointment of Directors;
c. recommendations for the appointment, composition, re-election and removal of Directors;
d. the terms and conditions of appointment to and retirement from the Board;
e. the evaluation of the performance of the Board, its committees and Directors;
f. the time Non-Executive Directors are expected to devote to NEC’s affairs and whether Directors are meeting that requirement; and
g. review of Board succession plans.
54 nine entertainment co.
For
per
sona
l use
onl
y
v. Succession of the Chief Executive Officer and his or her direct reports, considering:
a. guidelines for management development; and
b. review of the Chief Executive Officer and other members of Senior Management succession and development plans.
vi. The Committee also oversees remuneration related disclosures required in annual statutory reporting, if any, and provides advice to the Board on approval of those disclosures.
Under its Charter, the Committee should, to the extent practicable given the size and composition of the Board from time to time, comprise:
i. at least three members each of whom must be Non-Executive Directors; and
ii. a majority of Directors who are independent.
Prior to 15 June 2015, the Committee did not consist of a majority of directors who were independent and for a period the Committee comprised only two members following the resignation of its former Chair and one of its members during the course of the year. Although the Committee charter and ASX Recommendation 8.1 suggest that the Committee consist of a majority of independent directors, NEC believes the members of the Committee during that period were the most appropriate to achieve its objectives given their skill set and experience and that the composition of the Committee during the year did not hinder it in acting in the best interests of the Company and its shareholders generally. The Company is now in compliance with ASX Recommendation 8.1 and expects to continue to be in compliance with ASX Recommendation 8.1 in future.
Members are appointed for a fixed period of no more than three years, with Committee members generally being eligible for re-appointment for so long as they meet the relevant criteria. The appointment and removal of Committee members is the responsibility of the Board. Members may resign as a Committee member upon reasonable notice in writing to the Committee Chair. If a Committee member ceases to be a Director of the Company their appointment as a member of the Committee is automatically terminated with immediate effect. The Company Secretary is secretary to the Committee.
Risk
The Audit and Risk Management Committee oversees the effectiveness of NEC’s financial controls and systems, and the risk management function; and evaluates the structure and adequacy of the Group’s insurance coverage periodically.
The key risks faced by NEC include competition risks, regulatory and compliance risk, economic risks, legal risk, financial risk, reputational risk, operational risk and execution risk. NEC does not have any material environmental or social sustainability risks.
Responsibility for risk management is shared across the organisation. Key responsibilities include:
i. The Board is responsible for overseeing the establishment of, and approving, the risk management strategy and policies of the Company.
ii. The Board has delegated to the Audit and Risk Management Committee responsibility for:
a. identifying major risk areas;
b. reviewing, monitoring and approving NEC’s risk management policies, procedures and systems (at least annually) to provide assurance that major business risks are identified, consistently assessed and appropriately addressed;
c. ensuring that risk considerations are incorporated into strategic and business planning;
d. providing risk management updates to the Board and any supplementary information required to provide the Board with confidence that key risks are being appropriately managed;
e. reviewing reports from management concerning compliance with key laws, regulations, licences and standards which NEC is required to satisfy in order to operate;
f. overseeing tax compliance and tax risk management; and
g. reviewing any significant findings of any examinations by regulatory agencies.
Annual Report 2015 55
For
per
sona
l use
onl
y
Corporate Governance Statement continued
The Audit and Risk Committee has reviewed NEC’s risk management framework during the last financial year, to satisfy itself that the framework continues to be sound.
NEC management is responsible for establishing NEC’s risk management framework, including identifying major risk areas and developing NEC’s policies and procedures, which are designed effectively to identify, treat, monitor, report and manage key business risks.
Each employee and contractor is expected to understand and manage the risks within their responsibility and boundaries of authority when making decisions and undertaking day-to-day activities.
Reporting is an important part of the risk management function. It is the responsibility of the Audit and Risk Management Committee to report to the Board about NEC’s adherence to policies and guidelines approved by the Board for the management of risks.
The Chief Executive Officer and Chief Financial Officer are each responsible for reporting to the Audit and Risk Management Committee any proposed changes to the risk management framework. Any exposures or breaches of key policies or incidence of risks, where significant, must be reported to the Audit and Risk Management Committee and the Board.
The Board has in place the following to ensure that management’s objectives and activities are aligned with the risks identified:
i. Board approval of an annual strategic plan, which encompasses the Company’s vision, mission and strategy, designed to meet stakeholders’ needs and manage business risk; and
ii. implementation of Board approved operating plans and budgets, periodic re-forecasting and monitoring of progress against these budgets and forecasts, including the establishment and monitoring of KPIs of both a financial and non-financial nature.
The Chief Executive Officer and Chief Financial Officer are required to provide to the Board declarations in accordance with section 295A of the Corporations Act which confirm:
• their view that the Company’s financial reporting is founded on a sound system of risk management and internal compliance and control which implements the financial policies adopted by the Board; and
• the Company’s risk management and internal compliance and control system is operating effectively in all material respects.
The Board notes that due to its nature, internal control assurance from the Chief Executive Officer and Chief Financial Officer can only be reasonable rather than absolute. This is due to such factors as the need for judgement, the use of testing on a sample basis, the inherent limitations in internal control and because much of the evidence available is persuasive rather than conclusive and therefore is not (and cannot be) designed to detect all weaknesses in control procedures.
In response to this, internal control questions are required to be completed by the key management personnel of all significant business units, including finance managers, in support of these written statements.
The Company does not have an internal audit function. The Company employs the processes outlined above, to evaluate and improve the effectiveness of its risk management and internal control processes.
Code of Conduct
All Directors, managers and employees are required to act honestly and with integrity.
The Company has developed and communicated to all employees and Directors the NEC Code of Conduct. This Code assists in upholding ethical standards and conducting business in accordance with applicable laws. The Code also sets out the responsibility of individuals for reporting Code breaches.
The NEC Code of Conduct aims to:
i. provide clear guidance on the Company’s values and expectations while acting as a representative of NEC;
ii. promote minimum ethical behavioural standards and expectations across the Group, all business units and locations;
iii. offer guidance for shareholders, customers, suppliers and the wider community on our values, standards and expectations, and what it means to work for NEC; and
iv. raise employee awareness of acceptable and unacceptable behaviour and provide a means to assist in avoiding any real or perceived misconduct.
56 nine entertainment co.
For
per
sona
l use
onl
y
The Code of Conduct is a set of general principles relating to employment with NEC, covering the following areas:
i. business integrity – conducting business with honesty, integrity and fairness; reporting concerns without fear of punishment; making public comments about the Company; and disclosing real or potential conflicts of interest;
ii. professional practice – dealings in NEC shares; disclosing financial interests; protecting Company assets and property; maintaining privacy and confidentiality; undertaking employment outside NEC; personal advantage, gifts and inducements, recruitment and selection; and Company reporting;
iii. health, safety and environment;
iv. Equal Employment Opportunity and anti-harassment;
v. compliance with Company policies; and
vi. implementation of, and compliance with, the Code of Conduct.
Supporting the Code of Conduct is the Company’s range of guidelines and policies. These policies are posted on the Company website, are communicated to employees at the time of employment and are reinforced by training programs.
Securities Trading Policy
Under the Company’s Securities Trading Policy, Directors and senior management must not trade in any securities of the Company at any time when they are in possession of unpublished, price-sensitive information in relation to those securities. The policy establishes blackout periods during which shares cannot be traded, except as outlined in the policy, and requires Directors, senior management and certain other staff members to obtain consent before trading in the Company’s shares or any derivatives relating to the Company’s shares. The policy specifies that employees may not enter derivatives or other transactions which limit economic risk in respect of any NEC securities which are unvested or subject to a holding lock.
In addition to the policy, individual Directors are required to sign a disclosure of interests upon their appointment to the Board. This document specifically requires Directors to advise the Company Secretary of all transactions in the Company’s shares.
As required by the ASX Listing Rules, the Company notifies the ASX of any transactions conducted by Directors in the securities of the Company.
Market Disclosure and Shareholder Communications
The Company has a Disclosure Policy and a Shareholder Communication Policy. The Disclosure Policy sets out requirements aimed to ensure full and timely disclosure to the market of material issues relating to the Group to ensure that all stakeholders have an equal opportunity to access information.
The Disclosure Policy reflects the ASX Listing Rules and Corporations Act continuous disclosure requirements.
The Disclosure Policy requires that the Company notify the market, via the ASX, of any price-sensitive information (subject to the exceptions to disclosure under the Listing Rules). Information is price sensitive if a reasonable person would expect the information to have a material effect on the price or value of the Company’s securities or if the information would, or would be likely to, influence investors in deciding whether to buy, hold or sell NEC securities.
The Board has established a disclosure committee which is responsible for reviewing potential disclosures and deciding what information should be disclosed. The Committee comprises the following executives:
i. Chief Executive Officer;
ii. Chief Financial Officer;
iii. Company Secretary (who, for administrative convenience only, is primarily responsible for overseeing and coordinating all communication with the ASX, investors, analysts, brokers, the media and the public); and
iv. Commercial Director and Group General Counsel.
The Company recognises the right of shareholders to be informed of matters which affect their investment in the Company and has adopted a Shareholder Communication Policy.
Annual Report 2015 57
For
per
sona
l use
onl
y
Corporate Governance Statement continued
The only NEC Persons authorised to speak on behalf of NEC to investors, analysts or the media are:
i. the Chair;
ii. the Chief Executive Officer;
iii. the Chief Financial Officer; and
iv. such other NEC Persons approved by the Chair, the Chief Executive Officer or the Chief Financial Officer.
This safeguards the premature disclosure of confidential information and aims to ensure proper disclosure is made in accordance with the law. ASX and press releases of a material nature must be approved by the Disclosure Committee.
The Disclosure Committee is authorised to determine whether a trading halt will be requested from the ASX to prevent trading in an uninformed market.
The onus is on all staff to inform a Disclosure Committee member of any price sensitive information as soon as becoming aware of it. Under the Code of Conduct, staff are required to understand and comply with the Disclosure Policy.
As well as complying with the Listing Rules and its statutory reporting obligations, the Company actively encourages timely and ongoing shareholder communications. The Company’s Shareholder Communication Policy promotes effective communication with Shareholders and other stakeholders and encourages effective participation at NEC’s General Meetings. The Shareholder Communication Policy ensures ready access for shareholders to information about the Company via the ASX, the NEC website www.nineentertainmentco.com.au, NEC’s annual and half-yearly reports and the Annual General Meeting. Company announcements, annual reports, analyst and investor briefings, financial results and other information useful to investors (such as press releases) are placed on the Company’s website as soon as practical after their release to the ASX.
The Company encourages shareholders to register to receive any communications from the Company or its share registry electronically. The Company’s website and the website of its share registry also provide contact points for shareholders to communicate with the Company and its share register electronically.
At the Annual General Meeting, shareholders are encouraged to ask questions and are given a reasonable opportunity to comment on matters relevant to the Company. The external auditor attends the Annual General Meeting and is available to answer shareholder questions about the conduct of the audit and the audit report.
Diversity
The Company recognises the importance and value of creating a workplace that is inclusive and respectful of diversity. The Company’s diversity policy acknowledges the positive outcomes that can be achieved through a diverse workforce, and recognises and utilises the contribution of diverse skills and talent from its Directors, officers and employees, including contractors and consultants. The Company believes its diverse workforce is the key to its continued growth, improved productivity and performance.
In the context of this policy, diversity includes (but is not limited to) gender, age, ethnicity, cultural background, religion, sexual orientation, disability and mental impairment. The policy is approved by the Board and overseen by the Nomination and Remuneration Committee.
Key principlesNEC will endeavour to ensure:
• that NEC’s corporate culture at all levels supports diversity in the workplace whilst maintaining a commitment to a high performance culture;
• that consideration is given to programs and processes for the development of skills of its employees and support for an individual’s domestic responsibilities;
• the policy for selection and appointment of new Directors is transparent; and
• the Board establishes objectives on an annual basis to identify ways in which the achievement of gender diversity at NEC is measured, and in relation to other aspects of this diversity policy.
The Board is responsible for setting, regularly reviewing and monitoring the policy’s effectiveness.
58 nine entertainment co.
For
per
sona
l use
onl
y
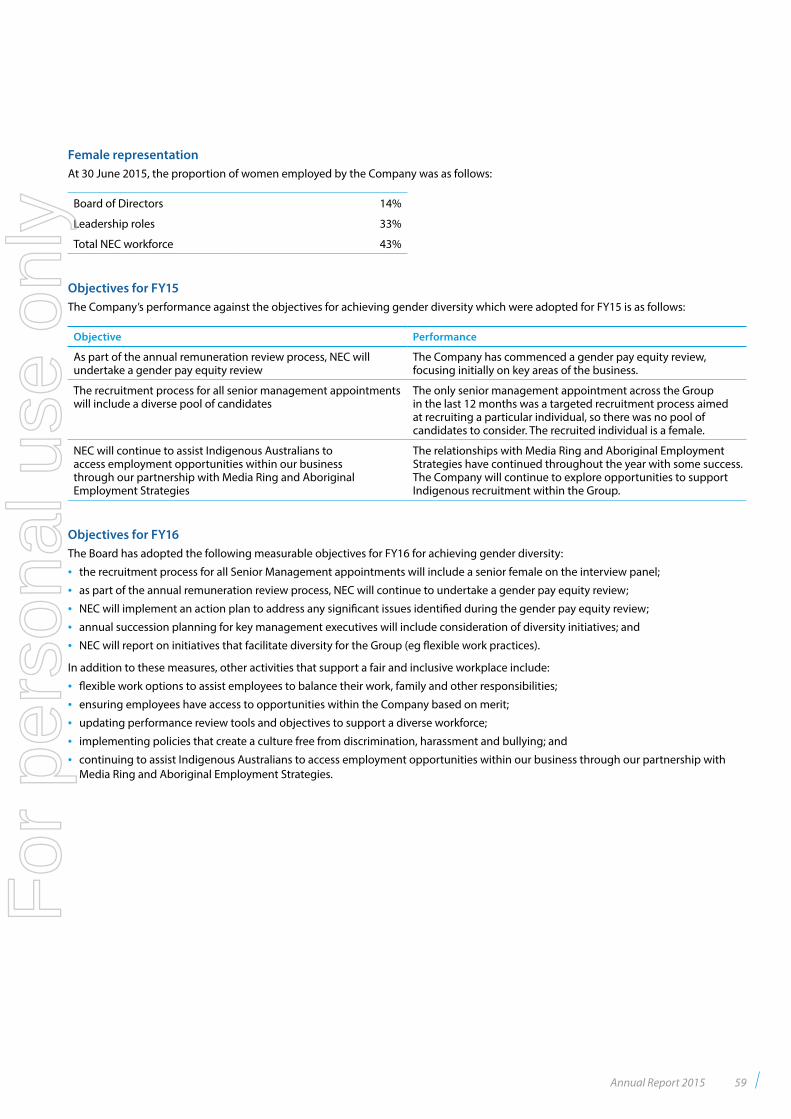
Female representationAt 30 June 2015, the proportion of women employed by the Company was as follows:
Board of Directors 14%
Leadership roles 33%
Total NEC workforce 43%
Objectives for FY15The Company’s performance against the objectives for achieving gender diversity which were adopted for FY15 is as follows:
Objective Performance
As part of the annual remuneration review process, NEC will undertake a gender pay equity review
The Company has commenced a gender pay equity review, focusing initially on key areas of the business.
The recruitment process for all senior management appointments will include a diverse pool of candidates
The only senior management appointment across the Group in the last 12 months was a targeted recruitment process aimed at recruiting a particular individual, so there was no pool of candidates to consider. The recruited individual is a female.
NEC will continue to assist Indigenous Australians to access employment opportunities within our business through our partnership with Media Ring and Aboriginal Employment Strategies
The relationships with Media Ring and Aboriginal Employment Strategies have continued throughout the year with some success. The Company will continue to explore opportunities to support Indigenous recruitment within the Group.
Objectives for FY16The Board has adopted the following measurable objectives for FY16 for achieving gender diversity:
• the recruitment process for all Senior Management appointments will include a senior female on the interview panel;
• as part of the annual remuneration review process, NEC will continue to undertake a gender pay equity review;
• NEC will implement an action plan to address any significant issues identified during the gender pay equity review;
• annual succession planning for key management executives will include consideration of diversity initiatives; and
• NEC will report on initiatives that facilitate diversity for the Group (eg flexible work practices).
In addition to these measures, other activities that support a fair and inclusive workplace include:
• flexible work options to assist employees to balance their work, family and other responsibilities;
• ensuring employees have access to opportunities within the Company based on merit;
• updating performance review tools and objectives to support a diverse workforce;
• implementing policies that create a culture free from discrimination, harassment and bullying; and
• continuing to assist Indigenous Australians to access employment opportunities within our business through our partnership with Media Ring and Aboriginal Employment Strategies.
Annual Report 2015 59
For
per
sona
l use
onl
y
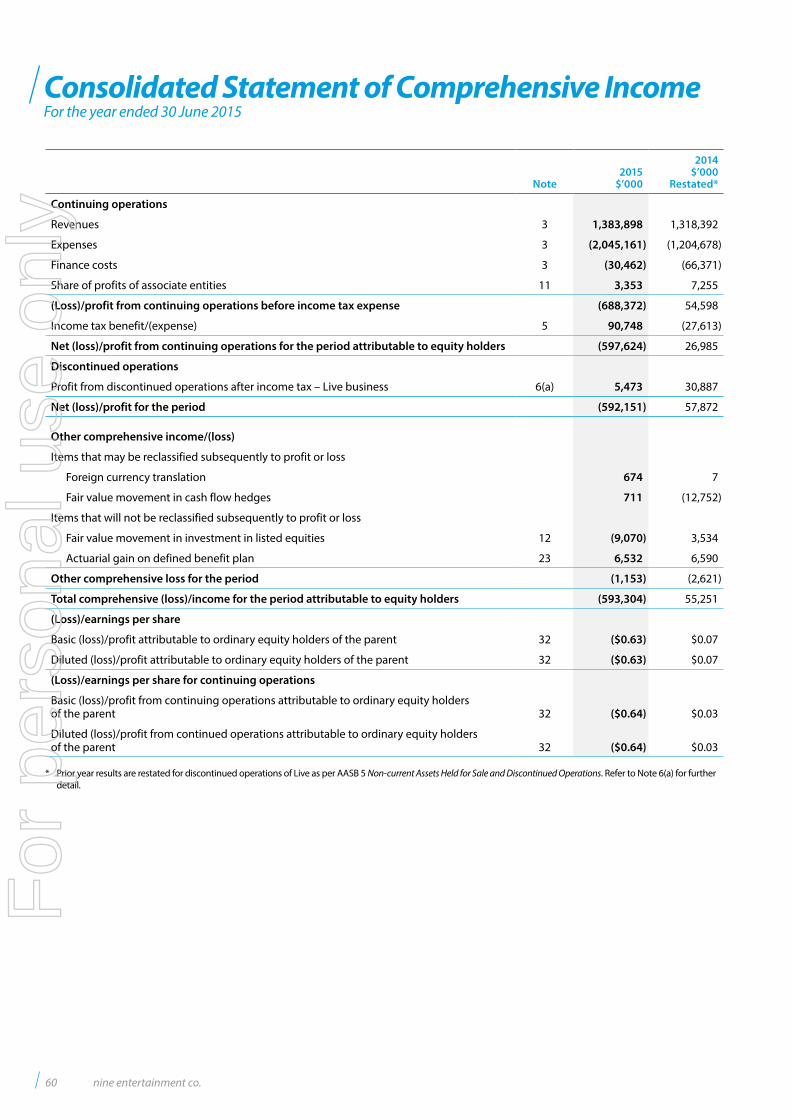
Consolidated Statement of Comprehensive IncomeFor the year ended 30 June 2015
Note2015
$’000
2014$’000
Restated*
Continuing operations
Revenues 3 1,383,898 1,318,392
Expenses 3 (2,045,161) (1,204,678)
Finance costs 3 (30,462) (66,371)
Share of profits of associate entities 11 3,353 7,255
(Loss)/profit from continuing operations before income tax expense (688,372) 54,598
Income tax benefit/(expense) 5 90,748 (27,613)
Net (loss)/profit from continuing operations for the period attributable to equity holders (597,624) 26,985
Discontinued operations
Profit from discontinued operations after income tax – Live business 6(a) 5,473 30,887
Net (loss)/profit for the period (592,151) 57,872
Other comprehensive income/(loss)
Items that may be reclassified subsequently to profit or loss
Foreign currency translation 674 7
Fair value movement in cash flow hedges 711 (12,752)
Items that will not be reclassified subsequently to profit or loss
Fair value movement in investment in listed equities 12 (9,070) 3,534
Actuarial gain on defined benefit plan 23 6,532 6,590
Other comprehensive loss for the period (1,153) (2,621)
Total comprehensive (loss)/income for the period attributable to equity holders (593,304) 55,251
(Loss)/earnings per share
Basic (loss)/profit attributable to ordinary equity holders of the parent 32 ($0.63) $0.07
Diluted (loss)/profit attributable to ordinary equity holders of the parent 32 ($0.63) $0.07
(Loss)/earnings per share for continuing operations
Basic (loss)/profit from continuing operations attributable to ordinary equity holders of the parent 32 ($0.64) $0.03
Diluted (loss)/profit from continued operations attributable to ordinary equity holders of the parent 32 ($0.64) $0.03
* Prior year results are restated for discontinued operations of Live as per AASB 5 Non-current Assets Held for Sale and Discontinued Operations. Refer to Note 6(a) for further detail.
60 nine entertainment co.
For
per
sona
l use
onl
y
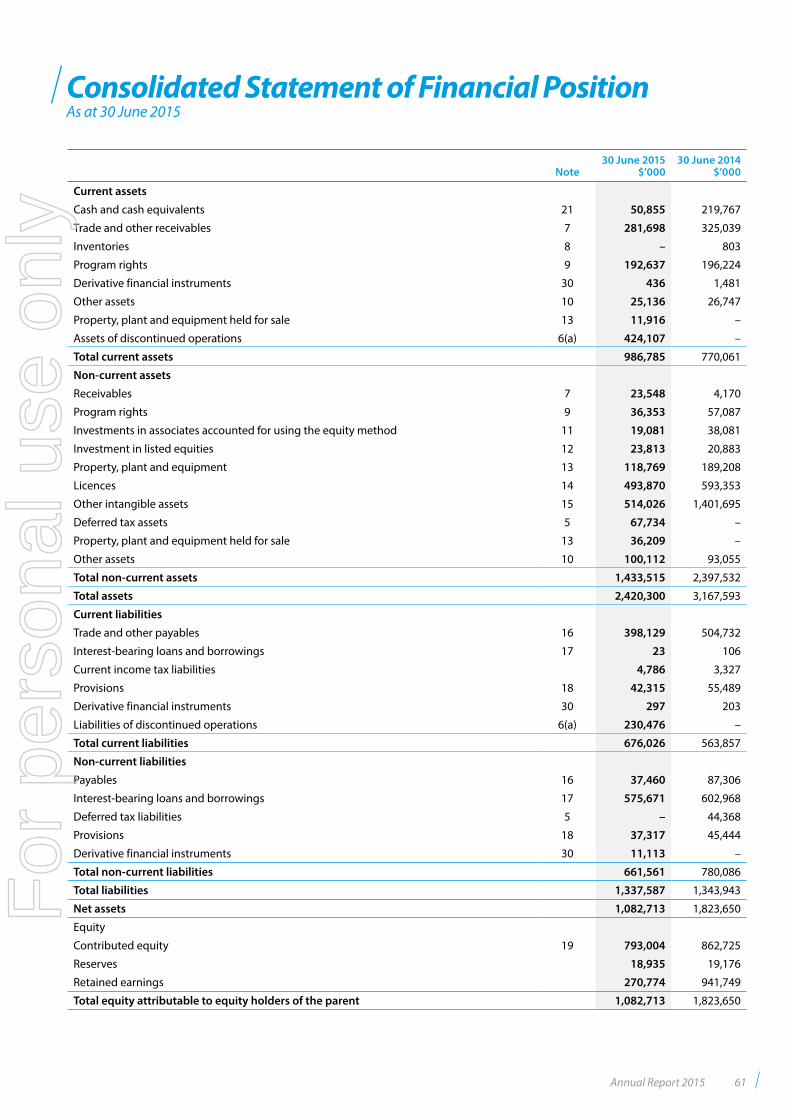
Consolidated Statement of Financial PositionAs at 30 June 2015
Note30 June 2015
$’00030 June 2014
$’000
Current assets
Cash and cash equivalents 21 50,855 219,767
Trade and other receivables 7 281,698 325,039
Inventories 8 – 803
Program rights 9 192,637 196,224
Derivative financial instruments 30 436 1,481
Other assets 10 25,136 26,747
Property, plant and equipment held for sale 13 11,916 –
Assets of discontinued operations 6(a) 424,107 –
Total current assets 986,785 770,061
Non-current assets
Receivables 7 23,548 4,170
Program rights 9 36,353 57,087
Investments in associates accounted for using the equity method 11 19,081 38,081
Investment in listed equities 12 23,813 20,883
Property, plant and equipment 13 118,769 189,208
Licences 14 493,870 593,353
Other intangible assets 15 514,026 1,401,695
Deferred tax assets 5 67,734 –
Property, plant and equipment held for sale 13 36,209 –
Other assets 10 100,112 93,055
Total non-current assets 1,433,515 2,397,532
Total assets 2,420,300 3,167,593
Current liabilities
Trade and other payables 16 398,129 504,732
Interest-bearing loans and borrowings 17 23 106
Current income tax liabilities 4,786 3,327
Provisions 18 42,315 55,489
Derivative financial instruments 30 297 203
Liabilities of discontinued operations 6(a) 230,476 –
Total current liabilities 676,026 563,857
Non-current liabilities
Payables 16 37,460 87,306
Interest-bearing loans and borrowings 17 575,671 602,968
Deferred tax liabilities 5 – 44,368
Provisions 18 37,317 45,444
Derivative financial instruments 30 11,113 –
Total non-current liabilities 661,561 780,086
Total liabilities 1,337,587 1,343,943
Net assets 1,082,713 1,823,650
Equity
Contributed equity 19 793,004 862,725
Reserves 18,935 19,176
Retained earnings 270,774 941,749
Total equity attributable to equity holders of the parent 1,082,713 1,823,650
Annual Report 2015 61
For
per
sona
l use
onl
y
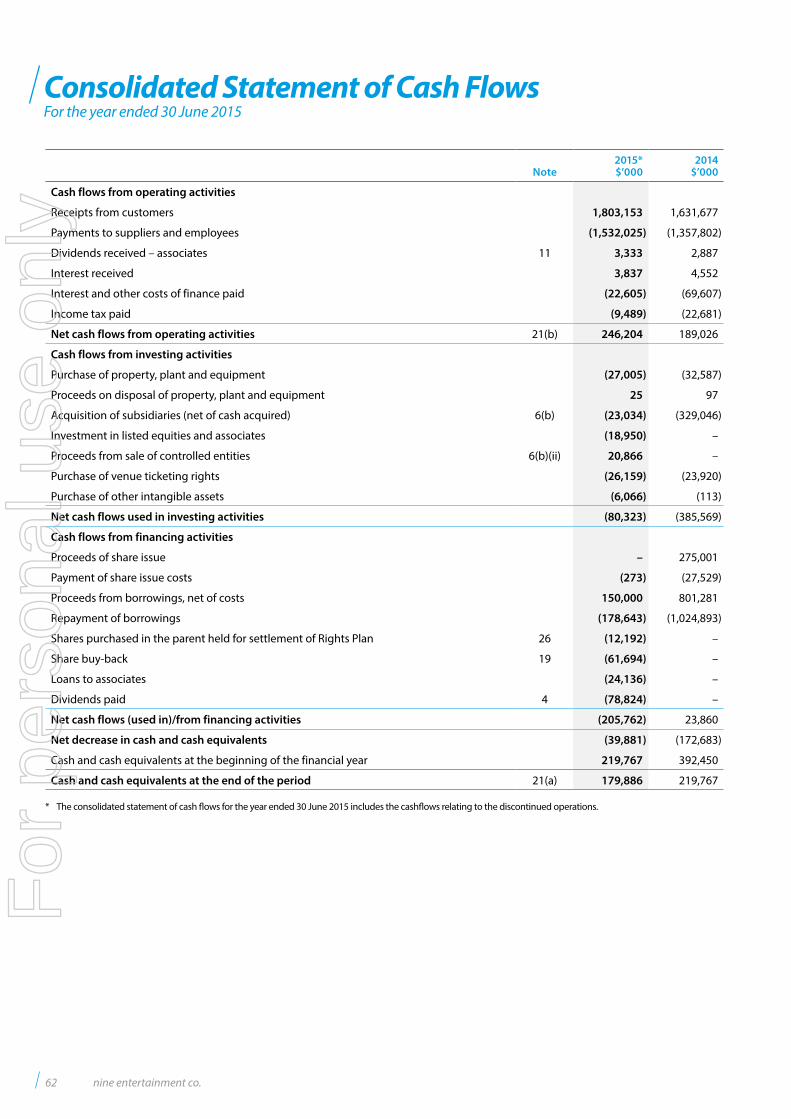
Consolidated Statement of Cash FlowsFor the year ended 30 June 2015
Note2015*$’000
2014$’000
Cash flows from operating activities
Receipts from customers 1,803,153 1,631,677
Payments to suppliers and employees (1,532,025) (1,357,802)
Dividends received – associates 11 3,333 2,887
Interest received 3,837 4,552
Interest and other costs of finance paid (22,605) (69,607)
Income tax paid (9,489) (22,681)
Net cash flows from operating activities 21(b) 246,204 189,026
Cash flows from investing activities
Purchase of property, plant and equipment (27,005) (32,587)
Proceeds on disposal of property, plant and equipment 25 97
Acquisition of subsidiaries (net of cash acquired) 6(b) (23,034) (329,046)
Investment in listed equities and associates (18,950) –
Proceeds from sale of controlled entities 6(b)(ii) 20,866 –
Purchase of venue ticketing rights (26,159) (23,920)
Purchase of other intangible assets (6,066) (113)
Net cash flows used in investing activities (80,323) (385,569)
Cash flows from financing activities
Proceeds of share issue – 275,001
Payment of share issue costs (273) (27,529)
Proceeds from borrowings, net of costs 150,000 801,281
Repayment of borrowings (178,643) (1,024,893)
Shares purchased in the parent held for settlement of Rights Plan 26 (12,192) –
Share buy-back 19 (61,694) –
Loans to associates (24,136) –
Dividends paid 4 (78,824) –
Net cash flows (used in)/from financing activities (205,762) 23,860
Net decrease in cash and cash equivalents (39,881) (172,683)
Cash and cash equivalents at the beginning of the financial year 219,767 392,450
Cash and cash equivalents at the end of the period 21(a) 179,886 219,767
* The consolidated statement of cash flows for the year ended 30 June 2015 includes the cashflows relating to the discontinued operations.
62 nine entertainment co.
For
per
sona
l use
onl
y
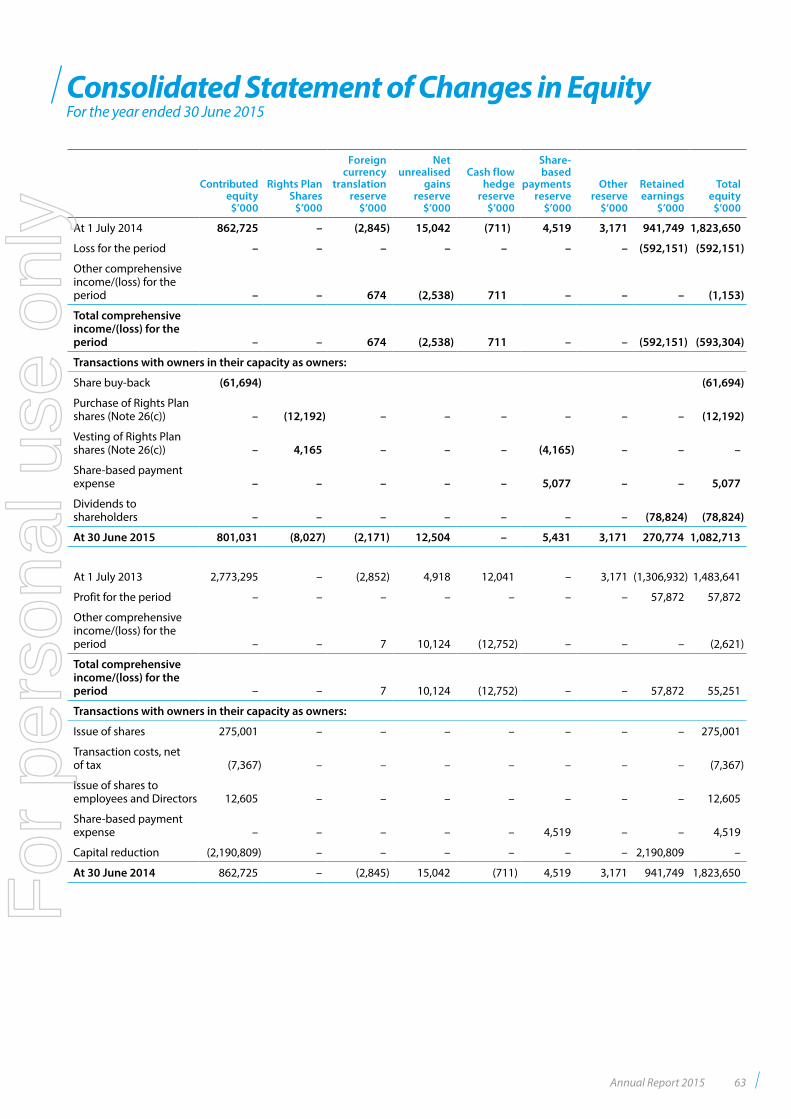
Consolidated Statement of Changes in EquityFor the year ended 30 June 2015
Contributed equity
$’000
Rights Plan Shares
$’000
Foreign currency
translation reserve
$’000
Net unrealised
gains reserve
$’000
Cash flow hedge
reserve$’000
Share-based
payments reserve
$’000
Otherreserve
$’000
Retained earnings
$’000
Total equity
$’000
At 1 July 2014 862,725 – (2,845) 15,042 (711) 4,519 3,171 941,749 1,823,650
Loss for the period – – – – – – – (592,151) (592,151)
Other comprehensive income/(loss) for the period – – 674 (2,538) 711 – – – (1,153)
Total comprehensive income/(loss) for the period – – 674 (2,538) 711 – – (592,151) (593,304)
Transactions with owners in their capacity as owners:
Share buy-back (61,694) (61,694)
Purchase of Rights Plan shares (Note 26(c)) – (12,192) – – – – – – (12,192)
Vesting of Rights Plan shares (Note 26(c)) – 4,165 – – – (4,165) – – –
Share-based payment expense – – – – – 5,077 – – 5,077
Dividends to shareholders – – – – – – – (78,824) (78,824)
At 30 June 2015 801,031 (8,027) (2,171) 12,504 – 5,431 3,171 270,774 1,082,713
At 1 July 2013 2,773,295 – (2,852) 4,918 12,041 – 3,171 (1,306,932) 1,483,641
Profit for the period – – – – – – – 57,872 57,872
Other comprehensive income/(loss) for the period – – 7 10,124 (12,752) – – – (2,621)
Total comprehensive income/(loss) for the period – – 7 10,124 (12,752) – – 57,872 55,251
Transactions with owners in their capacity as owners:
Issue of shares 275,001 – – – – – – – 275,001
Transaction costs, net of tax (7,367) – – – – – – – (7,367)
Issue of shares to employees and Directors 12,605 – – – – – – – 12,605
Share-based payment expense – – – – – 4,519 – – 4,519
Capital reduction (2,190,809) – – – – – – 2,190,809 –
At 30 June 2014 862,725 – (2,845) 15,042 (711) 4,519 3,171 941,749 1,823,650
Annual Report 2015 63
For
per
sona
l use
onl
y
Notes to the Consolidated Financial Statementsfor the year ended 30 June 2015
1. Summary of Significant Accounting Policies
The financial report includes the consolidated entity consisting of Nine Entertainment Co. Holdings Limited and its controlled entities (collectively, the Group) for the year ended 30 June 2015 and was authorised for issue in accordance with a resolution of the Directors on 27 August 2015.
Nine Entertainment Co. Holdings Limited is a for-profit company limited by shares incorporated in Australia whose shares are publicly traded on the Australian Stock Exchange.
The nature of the operations and principal activities of the Group is described in the Directors’ Report. Information on the Group’s structure is provided in Note 28. Information on other related party relationships is provided in Note 27.
a. Basis of preparationThis financial report is a general-purpose financial report, which has been prepared in accordance with the requirements of the Corporations Act 2001 and Australian Accounting Standards and other authoritative pronouncements of the Australian Accounting Standards Board. The financial report has been prepared on a historical cost basis, except for derivative financial instruments which have been measured at fair value and investments in associates which have been accounted for using the equity method.
The financial report is presented in Australian dollars and all values are rounded to the nearest thousand dollars ($’000) unless otherwise stated under the option available to the Company under ASIC Class Order 98/100. The Company is an entity to which the class order applies.
The consolidated financial statements provide comparative information in respect of the previous period.
b. Statement of complianceThe financial report complies with Australian Accounting Standards. The financial report also complies with International Financial Reporting Standards (IFRS) as issued by the International Accounting Standards Board.
c. Changes in accounting policies
Accounting standards adoptedThe following accounting standards are effective for the year ended 30 June 2015 and have been adopted by the Group for the year. Adoption of these standards did not have a material impact on the Group’s financial position or financial performance:
• AASB 2012-3 Amendments to Australian Accounting Standards – Offsetting Financial Assets and Financial Liabilities (Amendments to AASB 132) – addresses inconsistencies in current practice when applying the offsetting criteria in AASB 132 ‘Financial Instruments: Presentation’. The amendment clarifies the meaning of “currently has a legally enforceable right of setoff” and “simultaneous realisation and settlement”. The application of this standard does not materially impact the Group’s consolidated financial statements.
• AASB 2014-1 Amendments to Australian Accounting Standards – addresses a range of improvements comprising five distinct parts – Part A: Annual Improvements 2010–2012 and 2011–2013 Cycles; Part B: Defined Benefit Plans: Employee Contributions (Amendments to AASB 119); Part C: Materiality; Part D: Consequential Amendments arising from AASB 14 and Part E: Financial Instruments. The application of this standard does not materially impact the Group’s consolidated financial statements.
The Group has not included disclosures of new and amended standards and interpretations that do not have any impact on the financial statements.
All other Australian Accounting Standards and Interpretations that have recently been issued or amended but are not yet effective have not been adopted by the Group for the annual reporting period ending 30 June 2015. These include AASB 15 Revenue and AASB 9. The Group’s assessment of the impact of these new standards and interpretations is set out below.
• AASB 15 Revenue from Contracts with Customers – The AASB has issued a new standard for the recognition of revenue due to be effective 1 January 2018. This will replace AASB 118 which covers contracts for goods and services and AASB 111 which covers construction contracts. The new standard is based on the principle that revenue is recognised when control of a good or service transfers to a customer – so the notion of control replaces the existing notion of risks and rewards.
Management is in the process of assessing the impact of the standard. At this stage, the Group is not able to estimate the impact of the new rules on the Group’s financial statements. The Group will make more detailed assessments of the impact over the next 12 months.
• AASB 9 Financial Instruments (effective date 1 January 2018) – The AASB released the final version of AASB 9 in January 2015. The final version of AASB 9 introduces a new expected-loss impairment model that will require more timely recognition of expected credit losses. Specifically, the new Standard requires entities to account for expected credit losses from when financial instruments are first recognised and to recognise full lifetime expected losses on a more timely basis. The Group has not yet assessed the impact of this standard.
64 nine entertainment co.
For
per
sona
l use
onl
y
Accounting policiesDuring the year the Group adopted an accounting policy for the purchase of Rights Plan Shares recognised in contributed equity (refer to Note 1 (ab)) and an accounting policy for Assets Held for sale and Discontinued Operations (refer to Note 1(ag)). Apart from the adoption of these accounting policies, the accounting policies adopted in the preparation of the financial report are consistent with those applied and disclosed in the 2014 annual financial report.
d. Basis of consolidation The consolidated financial statements are those of the consolidated entity, comprising Nine Entertainment Co. Holdings Limited (the parent entity) and all entities that Nine Entertainment Co. Holdings Limited controlled from time to time during the year and at reporting date.
Information from the financial statements of subsidiaries is included from the date the parent entity obtains control until such time as control ceases. Where there is loss of control of a subsidiary, the consolidated financial statements include the results for the part of the reporting year during which the parent entity has control.
Subsidiary acquisitions are accounted for using the purchase method of accounting. The financial statements of subsidiaries are prepared for the same reporting year as the parent entity, using consistent accounting policies. Adjustments are made to bring into line any dissimilar accounting policies that may exist.
All intercompany balances and transactions, including unrealised profits arising from intra-group transactions, have been eliminated in full. Unrealised losses are eliminated unless costs cannot be recovered.
e. Significant accounting estimates, judgements and assumptionsThe carrying amounts of certain assets and liabilities are often determined based on estimates, judgements and assumptions of future events. The key estimates and assumptions that have a significant risk of causing a material adjustment to the carrying amounts of certain assets and liabilities within the next annual reporting year are:
Impairment of goodwill and television licences with indefinite useful livesThe Group determines whether goodwill and television licences with indefinite useful lives are impaired at least on an annual basis. This requires an estimation of the recoverable amount of the cash-generating units to which the goodwill and television licences with indefinite useful lives are allocated. The assumptions used in this estimation of recoverable amount and the carrying amount of goodwill and television licences with indefinite useful lives are discussed in Note 15.
Onerous contract provisionsThe Group has recognised an onerous contract provision in relation to its television program purchase commitments. Refer to Note 18 for disclosure of the assumptions included in the calculation of the provision.
Recognition of income tax lossesDeferred tax assets are recognised for unused tax losses to the extent that it is probable that taxable profit will be available against which the losses can be utilised. Significant management judgement is required to determine the amount of deferred tax assets that can be recognised, based upon the likely timing and the level of future taxable profits together with future tax planning strategies. Further details on taxes are disclosed in Note 5.
Valuation and hedging assessment of derivativesFair values of hedging instruments are determined using valuation techniques which require a degree of judgement to establish inputs for utilisation in the models. See Note 30(a) for further discussion.
f. Income taxCurrent tax liabilities are measured at the amount expected to be paid to the taxation authorities based on the current year’s taxable income. The tax rules and tax laws used to complete the amount are those that are enacted at the balance date.
Deferred income tax is provided on all temporary differences at the reporting date between the tax bases of assets and liabilities and their carrying amounts for financial reporting purposes.
Deferred income tax liabilities are recognised for all taxable temporary differences:
• except where the deferred income tax liability arises from the initial recognition of an asset or liability in a transaction that is not a business combination and, at the time of the transaction, affects neither the accounting profit nor taxable profit or loss; or
• in respect of taxable temporary differences associated with investments in subsidiaries, associates and interests in joint ventures, except where the timing of the reversal of the temporary differences can be controlled and it is probable that the temporary differences will not reverse in the foreseeable future.
Annual Report 2015 65
For
per
sona
l use
onl
y
Notes to the Consolidated Financial Statements continuedfor the year ended 30 June 2015
Deferred income tax assets are recognised for all deductible temporary differences, carry-forward of unused tax assets and unused tax losses, to the extent that it is probable that taxable profit will be available against which the deductible temporary differences, and the carry-forward of unused tax assets and unused tax losses, can be utilised except:
• where the deferred income tax asset relating to the deductible temporary difference arises from the initial recognition of an asset or liability in a transaction that is not a business combination and, at the time of the transaction, affects neither the accounting profit not taxable profit or loss; or
• in respect of deductible temporary differences associated with investments in subsidiaries, associates and interests in joint ventures, deferred tax assets are only recognised to the extent that it is probable that the temporary differences will reverse in the foreseeable future and taxable profit will be available against which the temporary differences can be utilised.
The carrying amount of deferred income tax assets is reviewed at each reporting date and reduced to the extent that it is no longer probable that sufficient taxable profit will be available to allow all or part of the deferred income tax asset to be utilised.
Deferred income tax assets and liabilities are measured at the tax rates that are expected to apply to the year when the asset is realised or the liability is settled, based on tax rates (and tax laws) that have been enacted or substantively enacted at the reporting date.
Income taxes relating to items recognised directly in equity are recognised in other comprehensive income and not in the profit or loss for the year.
g. Other taxesRevenues, expenses and assets are recognised net of the amount of GST except:
• where the GST incurred on a purchase of goods and services is not recoverable from the taxation authority, in which case the GST is recognised as part of the cost of acquisition of the asset or as part of the expense item as applicable; and
• receivables and payables are stated with the amount of GST included.
The net amount of GST recoverable from, or payable to, the taxation authority is included as part of receivables or payables in the statement of financial position.
Cash flows are included in the Statement of Cash Flows on a gross basis and the GST components of cash flows arising from investing and financing activities, which are recoverable from, or payable to, the taxation authority, are classified as operating cash flows. Commitments and contingencies are disclosed net of the amount of GST recoverable from, or payable to, the taxation authority.
h. Foreign currency translationBoth the functional and presentation currency of Nine Entertainment Co. Holdings Limited and its Australian subsidiaries is Australian dollars (A$). Each foreign entity in the Group determines its own functional currency and items included in the financial statements of each foreign entity are measured using that functional currency.
Transactions in foreign currencies are initially recorded in the functional currency at the exchange rates ruling at the date of the transaction. Monetary assets and liabilities denominated in foreign currencies are re-translated at the rate of exchange ruling at the reporting date.
All exchange differences in the consolidated financial report are taken to the statement of comprehensive income, with the exception of those items that are designated as hedges which are recognised in other comprehensive income.
Non-monetary items that are measured in terms of historical cost in a foreign currency are translated using the exchange rate as at the date of the initial transaction. Non-monetary items measured at fair value in a foreign currency are translated using the exchange rates at the date when the fair value was determined.
As at the reporting date the assets and liabilities of overseas subsidiaries are translated into the presentation currency of Nine Entertainment Co. Holdings Limited at the rate of exchange ruling at the reporting date and the statements of comprehensive income are translated at the weighted average exchange rates for the year. The exchange differences arising on translation are taken directly to a separate component of equity.
On disposal of a foreign entity, the deferred cumulative amount recognised in equity relating to that particular foreign operation is recognised in the Statement of Comprehensive Income.
i. Cash and cash equivalentsCash and cash equivalents in the statement of financial position comprise cash at bank and in hand, and short-term deposits.
For the purposes of the Statement of Cash Flows, cash and cash equivalents consist of cash and cash equivalents as defined above, net of outstanding bank overdrafts.
1. Summary of Significant Accounting Policies (continued)
f. Income tax (continued)
66 nine entertainment co.
For
per
sona
l use
onl
y
j. Trade and other receivablesTrade receivables are recognised and carried at original invoice amount less an allowance for any uncollectible amounts.
Collectability of trade receivables is reviewed on an ongoing basis at each division. Individual debts that are known to be uncollectible are written off when identified. An impairment provision is recognised when there is objective evidence that the Group will not be able to collect all amounts due according to the original trade terms. Factors considered as objective evidence of impairment include ageing and timing of expected receipts and the creditworthiness of counterparties. The amount of the impairment loss is the receivable carrying amount compared to the present value of estimated future cash flows.
k. Inventories Inventories are valued at the lower of cost and net realisable value.
Net realisable value is the estimated selling price in the ordinary course of business, less estimated costs of completion and the estimated costs necessary to make the sale.
l. Program rightsTelevision programs which are available for use, including those acquired overseas, are recorded at cost less amounts charged to the Statement of Comprehensive Income based on the useful life of the content and management’s assessment of the future year of benefit, which is regularly reviewed with additional write-downs made as considered necessary.
m. Investments and Other Financial AssetsCertain of the Group’s investments are categorised as investments in listed equities under AASB9 – Financial Instruments.
When financial assets are recognised initially, they are measured at fair value plus, in the case of assets not recorded at fair value through profit or loss, directly attributable transaction costs.
Recognition and derecognitionAll regular way purchases and sales of financial assets are recognised on the trade date i.e., the date that the Group commits to purchase or sell the asset. Regular way purchases or sales are purchases or sales of financial assets under contracts that require delivery of the assets within the period established generally by regulation or convention in the market place. Financial assets are derecognised when the right to receive cash flows from the financial assets has expired or when the entity transfers substantially all the risks and rewards of the financial assets. If the entity neither retains nor transfers substantially all of the risks and rewards, it derecognises the asset if it has transferred control of the assets.
Subsequent measurementInvestments in listed equities are non-derivative financial assets, principally equity securities, which meet the definition of equity instruments. Upon initial recognition under AASB 9, the Group made an irrevocable election, on an instrument by instrument basis, to present subsequent changes in the fair value of its investments in listed equities in a separate component of equity. Dividends from investments in listed equities are recognised in profit or loss unless the dividend clearly represents a recovery of part of the cost of the investment.
The fair values of investments that are actively traded in organised financial markets are determined by reference to quoted market bid prices at the close of business on the reporting date. For investments with no active market, fair values are determined using valuation techniques. Such techniques include: using recent arm’s length market transactions; reference to the current market value of another instrument that is substantially the same; discounted cash flow analysis; and option pricing models, making as much use of available and supportable market data as possible and keeping judgemental inputs to a minimum.
n. Investments in associates and joint arrangementsThe Group’s investments in its associates are accounted for under the equity method of accounting in the consolidated financial statements. These are entities in which the Group has significant influence and which are neither subsidiaries nor joint ventures.
A joint venture is a type of joint arrangement whereby the parties that have joint control of the arrangement have rights to the net assets of the joint venture. Joint control is the contractually agreed sharing of control of an arrangement, which exists only when decisions about the relevant activities require unanimous consent of the parties sharing control.
The financial statements of the associates and joint ventures are used by the Group to apply the equity method.
The investment in the associates or joint venture is carried in the consolidated Statement of Financial Position at cost plus post-acquisition changes in the Group’s share of net assets of the associates, less any impairment. Goodwill relating to the associate or joint venture is included in the carrying amount of the investment and is neither amortised nor individually tested for impairment. The consolidated Statement of Comprehensive Income reflects the Group’s share of the results of operations of the associates.
Where there has been a change recognised directly in the associates’ or joint ventures’ equity, the Group recognises its share of any movements directly in equity. The financial statements of the associate or joint venture are prepared for the same reporting period as the Group. When necessary, adjustments are made to bring the accounting policies in line with those of the Group.
Annual Report 2015 67
For
per
sona
l use
onl
y
Notes to the Consolidated Financial Statements continuedfor the year ended 30 June 2015
After application of the equity method, the Group determines whether it is necessary to recognise an impairment loss on its investment in its associate or joint venture. At each reporting date, the Group determines whether there is objective evidence that the investment in the associate or joint venture is impaired. If there is such evidence, the Group calculates the amount of impairment as the difference between the recoverable amount of the associate or joint venture and its carrying value, then recognises the loss as “Share of profit of an associate” in the statement of profit or loss.
o. Property, plant and equipmentProperty, plant and equipment are stated at cost less accumulated depreciation and any accumulated impairment losses.
Depreciation and amortisation is calculated on a straight-line basis over the estimated useful life of the asset as follows:
• freehold buildings – 20 to 40 years;
• leasehold improvements – lease term; and
• plant and equipment – 2 to 15 years.
The assets’ residual values, useful lives and amortisation methods are reviewed and adjusted as appropriate each year end.
ImpairmentThe carrying values of property, plant and equipment are reviewed for impairment when events or changes in circumstances indicate the carrying value may not be recoverable. For an asset that does not generate largely independent cash inflows, the recoverable amount is determined for the cash-generating unit to which the asset belongs. If any such indication exists and where the carrying values exceed the estimated recoverable amount, the assets or cash-generating units are written down to their recoverable amount.
The recoverable amount of property, plant and equipment is the greater of fair value less costs to sell and value in use. In assessing value in use, the estimated future cash flows are discounted to their present value using a pre-tax discount rate that reflects current market assessments of the time value of money and the risks specific to the asset.
DisposalAn item of property, plant and equipment is derecognised upon disposal or when no further future economic benefits are expected to arise from the continued use or disposal of the asset.
Any gain or loss arising on derecognition of the asset (calculated as the difference between the net disposal proceeds and the carrying amount of the item) is included in the Statement of Comprehensive Income in the year the item is derecognised.
p. Borrowing costsInterest is recognised as an expense when it is incurred. Debt establishment costs are capitalised and expensed over the term of the loan.
q. Intangible assets
Licences Licences are carried at cost less any accumulated impairment losses.
Television licences are renewable every five years under the provisions of the Broadcasting Services Act 1992. Whilst certain of the television licences continue to be subject to Government legislation and regulation by the Australian Communications and Media Authority, the Directors have no reason to believe the licences will not be renewed.
The Directors regularly assess the carrying value of licences so as to ensure they are not carried at a value greater than their recoverable amount.
No amortisation is provided against these assets as the Directors consider that the licences are indefinite life intangible assets.
GoodwillGoodwill on acquisition is initially measured at cost being the excess of the cost of the business combination over the Group’s interest in the net fair value of the identifiable assets, liabilities and contingent liabilities. Following initial recognition, goodwill is measured at cost less any accumulated impairment losses. Goodwill is not amortised.
As at the acquisition date, any goodwill acquired is allocated to each of the cash-generating units expected to benefit from the combination’s synergies.
Goodwill is reviewed for impairment, annually or more frequently if events or changes in circumstances indicate that the carrying value may be impaired. Impairment is determined by assessing the recoverable amount of the cash-generating unit to which the goodwill relates. Where the recoverable amount of the cash-generating unit is less than the carrying amount, an impairment loss is recognised.
1. Summary of Significant Accounting Policies (continued)
n. Investments in associates and joint arrangements (continued)
68 nine entertainment co.
For
per
sona
l use
onl
y
Where goodwill forms part of a cash-generating unit and part of the operation within that unit is disposed of, the goodwill associated with the operation disposed of is included in the carrying amount of the operation when determining the gain or loss on disposal of the operation. Goodwill disposed of in this circumstance is measured on the basis of the relative values of the operation disposed of and the portion of the cash-generating unit retained.
Other intangible assetsAcquired both separately and from a business combination
Intangible assets acquired separately are capitalised at cost, and from a business combination are capitalised at fair value as at the date of acquisition. Following initial recognition, the cost model is applied to the class of intangible assets.
The useful lives of these intangible assets are assessed to be either finite or indefinite.
Venue ticketing rights are amortised over their contractual period. Where amortisation is charged on assets with finite lives, this expense is taken to the Statement of Comprehensive Income.
Intangible assets, excluding development costs, created within the business are not capitalised and expenditure is charged against profits in the year in which the expenditure is incurred.
Intangible assets are tested for impairment where an indicator of impairment exists, and in the case of indefinite life intangibles annually, either individually or at the cash generating unit level. Useful lives are also examined on an annual basis and adjustments, where applicable, are made on a prospective basis.
Gains or losses arising from de-recognition of an intangible asset are measured as the difference between the net disposal proceeds and the carrying amount of the asset and are recognised in the Statement of Comprehensive Income when the net asset is derecognised.
r. Recoverable amount of assetsAt each reporting date, the Group assesses whether there is any indication that an asset may be impaired. Where an indicator of impairment exists, the Group makes a formal estimate of recoverable amount. Where the carrying amount of an asset exceeds its recoverable amount the asset is considered impaired and is written down to its recoverable amount.
Recoverable amount is the greater of fair value less costs to sell and value in use. It is determined for an individual asset, unless the asset’s value in use cannot be estimated to be close to its fair value less costs to sell and it does not generate cash inflows that are largely independent of those from other assets or groups of assets, in which case, the recoverable amount is determined for the cash-generating unit to which the asset belongs. In assessing value in use, the estimated future cash flows are discounted to their present value using a pre-tax discount rate that reflects current market assessments of the time value of money and the risks specific to the asset.
s. Trade and other payablesTrade and other payables are carried at amortised cost.
Liabilities are brought to account for amounts payable in relation to goods received and services rendered, whether or not billed to the Group at reporting date. The Group operates in a number of diverse markets, and accordingly the terms of trade vary by business.
t. Interest-bearing loans and borrowingsAll loans and borrowings are initially recognised at cost, being the fair value of the consideration received net of issue costs associated with the borrowing. After initial recognition, interest bearing loans and borrowings are subsequently measured at amortised costs using the effective interest method.
u. ProvisionsProvisions are recognised when the Group has a legal or constructive obligation to make a future sacrifice of economic benefits to other entities as a result of past transactions or other events, it is probable that a future sacrifice of economic benefit will be required and a reliable estimate can be made of the amount of the obligation.
If the effect of the time value of money is material, provisions are discounted using a current pre-tax rate that reflects the risks specific to the liability. When discounting is used, the increase in the provision due to the passage of time is recognised as a borrowing cost.
A provision for dividends is not recognised as a liability unless the dividends are declared, determined or publicly recommended on or before the reporting date.
v. Pensions and other post-employment benefitsThe Group contributes to a defined benefit superannuation fund which requires contributions to be made to a separately administered fund.
The cost of providing benefits under the defined benefit plan is determined separately for each plan using the projected unit credit actuarial valuation method.
Annual Report 2015 69
For
per
sona
l use
onl
y
Notes to the Consolidated Financial Statements continuedfor the year ended 30 June 2015
Re-measurements, comprising actuarial gains and losses, the effect of the asset ceiling, excluding net interest (not applicable to the Group) and the return on plan assets (excluding net interest), are recognised immediately in the statement of financial position with a corresponding debit or credit to a separate component of equity in the period in which they occur. Re-measurements are not reclassified to profit or loss in subsequent periods.
Past service costs are recognised in the Statement of Comprehensive Income on the earlier of the date of the plan amendment or curtailment, and the date that the Group recognises restructuring-related costs.
Net interest is calculated by applying the discount rate to the net defined benefit liability or asset. The Group recognises the following changes in the net defined benefit obligation under “expenses” in the Statement of Comprehensive Income (by function):
• service costs comprising current service costs, past-service costs, gains and losses on curtailments and non-routine settlements; and
• net interest expense or income.
w. Employee benefits Provision is made for employee benefits accumulated as a result of employees rendering services up to balance date including related on-costs. The benefits include wages and salaries, incentives, compensated absences and other benefits, which are charged against profits in their respective expense categories when services are provided or benefits vest with the employee.
The provision for employee benefits is measured at the remuneration rates expected to be paid when the liability is settled. Benefits expected to be settled after 12 months from the reporting date are measured at the present value of the estimated future cash outflows to be made in respect of services provided by employees up to the reporting date.
The liability for long service leave is recognised in the provision for employee benefits and measured as the present value of expected future payments to be made in respect of services provided by employees up to the reporting date using the projected unit credit method. Consideration is given to expected future wage and salary levels, experience of employee departures, and years of service. Expected future payments are discounted using market yields at the reporting date on national government bonds with terms to maturity and currencies that match, as closely as possible, the estimated future cash outflows.
x. LeasesThe determination of whether an arrangement is or contains a lease is based on the substance of the arrangement and requires an assessment of whether the fulfilment of the arrangement is dependent on the use of a specific asset or assets and the arrangement conveys a right to use the asset.
Finance leases, which transfer to the Group substantially all the risks and benefits incidental to ownership of the leased item, are capitalised at the inception of the lease at the fair value of the leased property or equipment or, if lower, at the present value of the minimum lease payments.
Lease payments are apportioned between the finance charges and reduction of the leased liability so as to achieve a constant rate of interest on the remaining balance of the liability.
Operating lease payments are recognised as an expense in the Statement of Comprehensive Income on a straight-line basis over the lease term.
y. Derecognition of financial instrumentsThe derecognition of a financial instrument takes place when the Group no longer controls the contractual rights that comprise the financial instrument, which is normally the case when the instrument is sold, or all the cash flows attributable to the instrument are passed through to an independent third party.
z. Derivative financial instrumentsThe Group uses derivative financial instruments such as foreign currency contracts and interest rate swaps to hedge its risks associated with interest rate and foreign currency fluctuations. Such derivative financial instruments are stated at fair value.
The fair value of forward exchange contracts is calculated by reference to current forward exchange rates for contracts with similar maturity profiles. The fair value of interest rate swap contracts is determined by reference to market values for similar instruments.
For the purposes of hedge accounting, hedges are classified as either fair value hedges when they hedge the exposure to changes in the fair value of a recognised asset or liability; or cash flow hedges where they hedge exposure to variability in cash flows that is either attributable to a particular risk associated with a recognised asset or liability or a forecasted transaction.
1. Summary of Significant Accounting Policies (continued)
v. Pensions and other post-employment benefits (continued)
70 nine entertainment co.
For
per
sona
l use
onl
y
In relation to fair value hedges (interest rate swaps) which meet the conditions for special hedge accounting, any gain or loss from remeasuring the hedging instrument at fair value is recognised immediately in profit or loss for the year. Any gain or loss attributable to the hedged risk on re-measurement of the hedged item is adjusted against the carrying amount of the hedged item and recognised in profit or loss for the year. Where the adjustment is to the carrying amount of a hedged interest-bearing financial instrument, the adjustment is amortised through the profit or loss for the year such that it is fully amortised by maturity.
In relation to cash flow hedges (forward foreign currency contracts and cross currency principal and interest rate swaps and options) to hedge firm commitments which meet the conditions for special hedge accounting, the portion of the gain or loss on the hedging instrument that is determined to be an effective hedge is recognised directly in equity and the ineffective portion is recognised in the profit or loss for the year. When the hedged firm commitment results in the recognition of an asset or a liability, then, at the time the asset or liability is recognised, the associated gains or losses that had previously been recognised in equity are included in the initial measurement of the acquisition cost or other carrying amount of the asset or liability.
For all other cash flow hedges, the gains or losses that are recognised in equity are transferred to profit or loss in the same year in which the hedged firm commitment affects net profit or loss, for example when the future sale actually occurs.
At the inception of a hedge relationship, the Group formally designates and documents the hedge relationship to which the Group wishes to apply hedge accounting. The documentation includes identification of the hedging instrument, the hedged item or transaction, the nature of the risk being hedged and how the entity will assess the hedging instrument’s effectiveness in offsetting the exposure to changes in the hedged item’s fair values or cash flows attributable to the hedged risk. Such hedges are expected to be highly effective in achieving offsetting changes in fair values or cash flows.
For derivatives that do not qualify for hedge accounting, any gains or losses arising from changes in fair value are taken directly to profit or loss for the year.
Hedge accounting is discontinued when the hedging instrument expires or is sold, terminated or exercised, or no longer qualifies for hedge accounting. At that point in time, any cumulative gain or loss on the hedging instrument recognised in equity is kept in equity until the forecasted transaction occurs. If a hedged transaction is no longer expected to occur, the net cumulative gain or loss recognised in equity is transferred to profit or loss for the year.
aa. Impairment of financial assetsThe Group assesses at each reporting date whether a financial asset or group of financial assets is impaired.
Financial assets carried at amortised costIf there is objective evidence that an impairment loss on loans and receivables carried at amortised cost has been incurred, the amount of the loss is measured as the difference between the asset’s carrying amount and the present value of estimated future cash flows (excluding future credit losses that have not been incurred) discounted at the financial asset’s original effective interest rate (i.e. the effective interest rate computed at initial recognition). The carrying amount of the asset is reduced either directly or through use of an allowance account. The amount of the loss is recognised in profit or loss for the year.
The Group first assesses whether objective evidence of impairment exists individually for financial assets that are individually significant, and individually or collectively for financial assets that are not individually significant. If it is determined that no objective evidence of impairment exists for an individually assessed financial asset, whether significant or not, the asset is included in a group of financial assets with similar credit risk characteristics and that group of financial assets is collectively assessed for impairment. Assets that are individually assessed for impairment, and for which an impairment loss is (or continues to be) recognised, are not included in a collective assessment of impairment.
If, in a subsequent year, the amount of the impairment loss decreases and the decrease can be related objectively to an event occurring after the impairment was recognised, the previously recognised impairment loss is reversed. Any subsequent reversal of an impairment loss is recognised in profit or loss for the year, to the extent that the carrying value of the asset does not exceed its amortised cost at the reversal date.
ab. Contributed equityOrdinary shares are classified as equity. Issued capital is recognised at the fair value of the consideration received by the Group, less transaction costs. The Group provided remuneration to senior management in the form of share-based payments, whereby employees render services as consideration for equity instruments. In the Group’s financial statements the transactions of these share-based payments are settled through a plan trust and are treated as being executed by the Group (an external third party acts as the Group’s agent). Where shares to satisfy the Rights Plan are purchased by the third party, the consideration paid is deducted from total shareholders’ equity and the shares are treated as treasury shares until they are subsequently vested, sold, reissued or cancelled. Where such shares are vested, sold or reissued, any consideration received is included in shareholders’ equity.
Annual Report 2015 71
For
per
sona
l use
onl
y
Notes to the Consolidated Financial Statements continuedfor the year ended 30 June 2015
ac. Revenue Revenue is recognised to the extent that it is probable that the economic benefits will flow to the Group and the revenue can be reliably measured. The following specific recognition criteria must also be met before revenue is recognised:
TelevisionRevenue for advertising and media activities is recognised when the advertisement has been broadcast/displayed or the media service has been performed.
LiveRevenue from ticketing operations primarily consists of booking and service/delivery fees charged at the time a ticket for an event is sold and is recorded on a net basis (net of the face value of the ticket). This revenue is recognised at the time of the sale.
Revenue from the promotion and production of an event is recognised in the month the performance occurs (event maturity).
InterestRevenue is recognised as the interest accrues (using the effective interest method, which is the rate that exactly discounts estimated future cash receipts through the expected life of the financial instrument) to the net carrying amount of the financial asset.
ad. Non-Controlling InterestsNon-Controlling Interests not held by the Group are allocated their share of net profit after tax in the Statement of Comprehensive Income and are presented within equity in the Statement of Financial Position.
ae. Business combinationsThe purchase method of accounting is used to account for all business combinations regardless of whether equity instruments or other assets are acquired. Cost is measured as the fair value of the assets given, shares issued or liabilities incurred or assumed at the date of exchange. Where equity instruments are issued in a business combination, the fair value of the instruments is their published price at the date of exchange unless, in rare circumstances, it can be demonstrated that the published price at the date of exchange is an unreliable indicator of fair value and that other evidence and valuations methods provide a more reliable measure of fair value. Transaction costs arising on the issue of equity instruments are recognised directly in equity.
Except for non-current assets or disposal groups classified as held for sale (which are measured at fair value less costs to sell), all identifiable assets acquired and liabilities and contingent liabilities assumed in a business combination are measured initially at their fair values at the acquisition date, irrespective of the extent of any Non-Controlling interest. The excess of the cost of the business combination over the net fair value of the Group’s share of the identifiable net assets acquired is recognised as goodwill. If the cost of acquisition is less than the Group’s share of the net fair value of the identifiable net assets of the subsidiary, the difference is recognised as a gain in the Statement of Comprehensive Income, but only after a reassessment of the identification and measurement of the net assets required.
Where settlement of any part of the consideration is deferred, the amounts payable in the future are discounted to their present value as at the date of exchange. The discount rate used is the Group’s incremental borrowing rate, being the rate at which similar borrowing could be obtained from an independent financier under comparable terms and conditions.
af. Share-based paymentsThe Group provided benefits to certain members of the Board of Directors in the form of Share Rights.
The cost of the Share Rights is measured by reference to the fair value of the equity instruments at the date which they are granted. The cost of the transactions is recognised, together with a corresponding increase in equity, over the period in which the timing conditions are fulfilled, ending on the date on which the relevant Directors become fully entitled to the award (the vesting period).
The Group provides remuneration to senior management in the form of share-based payments, whereby employees render services as consideration for equity instruments (equity-settled transactions).
The cost for equity-settled transactions is determined by the fair value at the date when the grant is made using an appropriate valuation model. That cost is recognised, together with a corresponding increase in share-based payment reserves, over the period in which the performance and/or service conditions are fulfilled in employee benefit expense. Refer to Note 26(c). The cumulative expense recognised at each reporting date, until vesting dates, reflects the extent to which the vesting period has expired. The share-based payments can be settled with either cash or equity at the election of the Group.
1. Summary of Significant Accounting Policies (continued)
72 nine entertainment co.
For
per
sona
l use
onl
y
ag. Assets held for sale and discontinued operationsThe Group classifies non-current assets and disposal groups as held for sale or for distribution to equity holders of the parent if their carrying amounts will be recovered principally through sale or a distribution rather than through continuing use. Such non-current assets and disposal groups classified as held for sale or for distribution are measured at the lower of their carrying amount and fair value less costs to sell or to distribute. Costs to sell or distribute are the incremental costs directly attributable to the sale or distribution, excluding the finance costs and income tax expense.
The criteria for held for sale or for distribution classification is regarded as met only when the sale or distribution is highly probable and the asset or disposal group is available for immediate sale or distribution in its present condition. Actions required to complete the sale or distribution should indicate that it is unlikely that significant changes to the sale or distribution will be made or that the decision to sell or distribute will be withdrawn. Management must be committed to the sale or distribution expected within one year from the date of the classification.
Property, plant and equipment and intangible assets are not depreciated or amortised once classified as held for sale or distribution.
Assets and liabilities classified as held for sale or distribution are presented separately as current items in the statement of financial position.
A disposal group qualifies as a discontinued operation if it is a component of an entity that either has been disposed of, or is classified as held for sale or distribution, and:
• represents a separate major line of business or geographical area of operations;
• is part of a single co-ordinated plan to dispose of a separate major line of business or geographical area of operations; or
• is a subsidiary acquired exclusively with a view to resale.
Discontinued operations are excluded from the results of continuing operations and are presented as a single amount as profit or loss after tax from discontinued operations in the statement or profit or loss.
Additional disclosures are provided in Note 6(a). All other notes to the financial statements include amounts for continuing operations, unless otherwise stated.
Annual Report 2015 73
For
per
sona
l use
onl
y
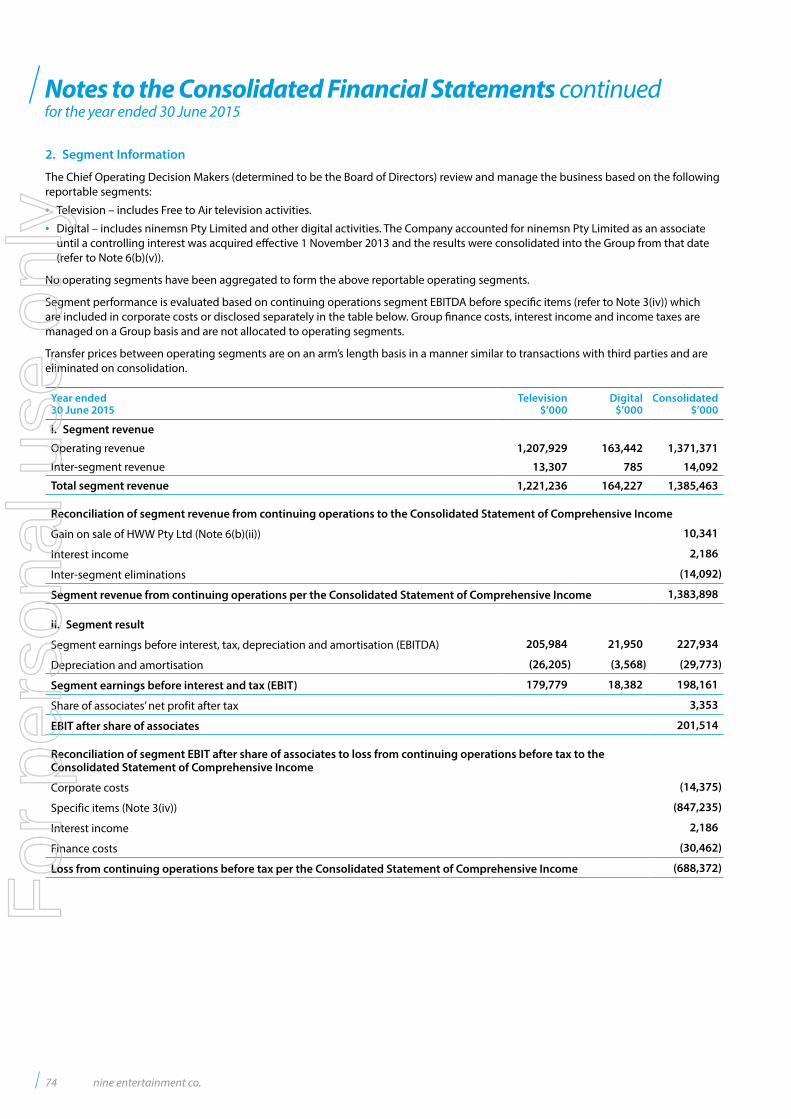
Notes to the Consolidated Financial Statements continuedfor the year ended 30 June 2015
2. Segment Information
The Chief Operating Decision Makers (determined to be the Board of Directors) review and manage the business based on the following reportable segments:
• Television – includes Free to Air television activities.
• Digital – includes ninemsn Pty Limited and other digital activities. The Company accounted for ninemsn Pty Limited as an associate until a controlling interest was acquired effective 1 November 2013 and the results were consolidated into the Group from that date (refer to Note 6(b)(v)).
No operating segments have been aggregated to form the above reportable operating segments.
Segment performance is evaluated based on continuing operations segment EBITDA before specific items (refer to Note 3(iv)) which are included in corporate costs or disclosed separately in the table below. Group finance costs, interest income and income taxes are managed on a Group basis and are not allocated to operating segments.
Transfer prices between operating segments are on an arm’s length basis in a manner similar to transactions with third parties and are eliminated on consolidation.
Year ended30 June 2015
Television$’000
Digital$’000
Consolidated$’000
i. Segment revenue
Operating revenue 1,207,929 163,442 1,371,371
Inter-segment revenue 13,307 785 14,092
Total segment revenue 1,221,236 164,227 1,385,463
Reconciliation of segment revenue from continuing operations to the Consolidated Statement of Comprehensive Income
Gain on sale of HWW Pty Ltd (Note 6(b)(ii)) 10,341
Interest income 2,186
Inter-segment eliminations (14,092)
Segment revenue from continuing operations per the Consolidated Statement of Comprehensive Income 1,383,898
ii. Segment result
Segment earnings before interest, tax, depreciation and amortisation (EBITDA) 205,984 21,950 227,934
Depreciation and amortisation (26,205) (3,568) (29,773)
Segment earnings before interest and tax (EBIT) 179,779 18,382 198,161
Share of associates’ net profit after tax 3,353
EBIT after share of associates 201,514
Reconciliation of segment EBIT after share of associates to loss from continuing operations before tax to the Consolidated Statement of Comprehensive Income
Corporate costs (14,375)
Specific items (Note 3(iv)) (847,235)
Interest income 2,186
Finance costs (30,462)
Loss from continuing operations before tax per the Consolidated Statement of Comprehensive Income (688,372)
74 nine entertainment co.
For
per
sona
l use
onl
y
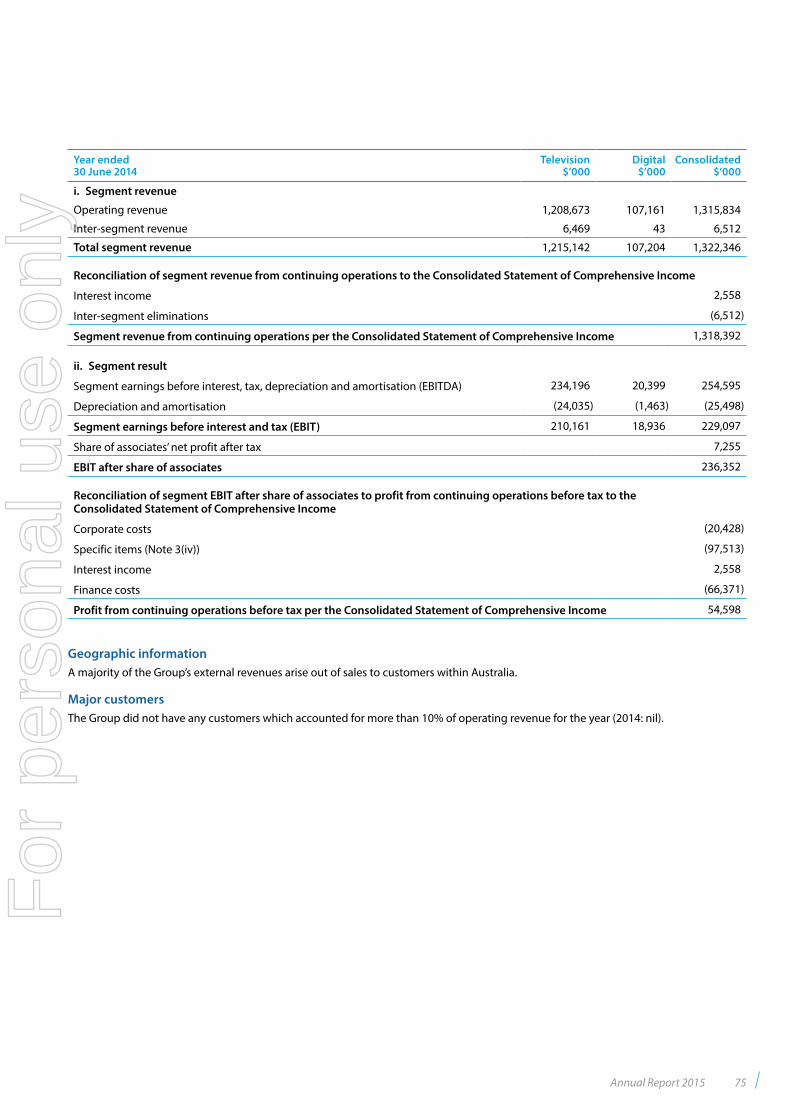
Year ended30 June 2014
Television$’000
Digital$’000
Consolidated$’000
i. Segment revenue
Operating revenue 1,208,673 107,161 1,315,834
Inter-segment revenue 6,469 43 6,512
Total segment revenue 1,215,142 107,204 1,322,346
Reconciliation of segment revenue from continuing operations to the Consolidated Statement of Comprehensive Income
Interest income 2,558
Inter-segment eliminations (6,512)
Segment revenue from continuing operations per the Consolidated Statement of Comprehensive Income 1,318,392
ii. Segment result
Segment earnings before interest, tax, depreciation and amortisation (EBITDA) 234,196 20,399 254,595
Depreciation and amortisation (24,035) (1,463) (25,498)
Segment earnings before interest and tax (EBIT) 210,161 18,936 229,097
Share of associates’ net profit after tax 7,255
EBIT after share of associates 236,352
Reconciliation of segment EBIT after share of associates to profit from continuing operations before tax to the Consolidated Statement of Comprehensive Income
Corporate costs (20,428)
Specific items (Note 3(iv)) (97,513)
Interest income 2,558
Finance costs (66,371)
Profit from continuing operations before tax per the Consolidated Statement of Comprehensive Income 54,598
Geographic informationA majority of the Group’s external revenues arise out of sales to customers within Australia.
Major customersThe Group did not have any customers which accounted for more than 10% of operating revenue for the year (2014: nil).
Annual Report 2015 75
For
per
sona
l use
onl
y
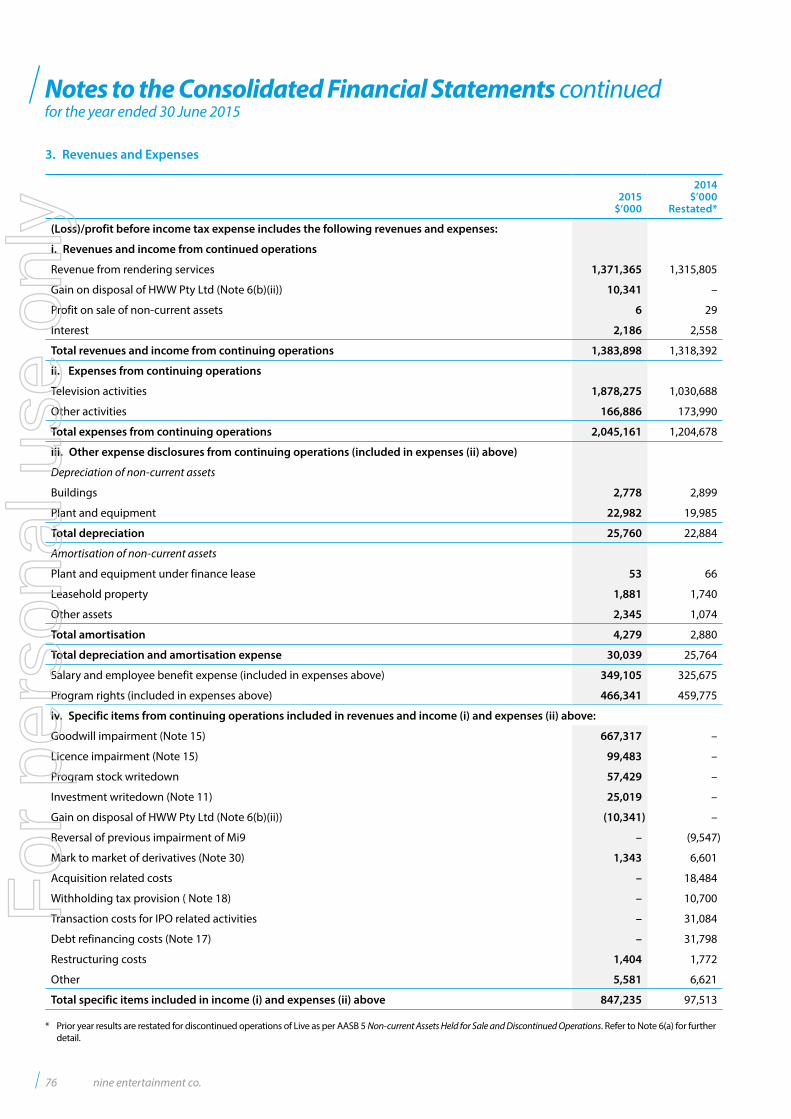
Notes to the Consolidated Financial Statements continuedfor the year ended 30 June 2015
3. Revenues and Expenses
2015$’000
2014$’000
Restated*
(Loss)/profit before income tax expense includes the following revenues and expenses:
i. Revenues and income from continued operations
Revenue from rendering services 1,371,365 1,315,805
Gain on disposal of HWW Pty Ltd (Note 6(b)(ii)) 10,341 –
Profit on sale of non-current assets 6 29
Interest 2,186 2,558
Total revenues and income from continuing operations 1,383,898 1,318,392
ii. Expenses from continuing operations
Television activities 1,878,275 1,030,688
Other activities 166,886 173,990
Total expenses from continuing operations 2,045,161 1,204,678
iii. Other expense disclosures from continuing operations (included in expenses (ii) above)
Depreciation of non-current assets
Buildings 2,778 2,899
Plant and equipment 22,982 19,985
Total depreciation 25,760 22,884
Amortisation of non-current assets
Plant and equipment under finance lease 53 66
Leasehold property 1,881 1,740
Other assets 2,345 1,074
Total amortisation 4,279 2,880
Total depreciation and amortisation expense 30,039 25,764
Salary and employee benefit expense (included in expenses above) 349,105 325,675
Program rights (included in expenses above) 466,341 459,775
iv. Specific items from continuing operations included in revenues and income (i) and expenses (ii) above:
Goodwill impairment (Note 15) 667,317 –
Licence impairment (Note 15) 99,483 –
Program stock writedown 57,429 –
Investment writedown (Note 11) 25,019 –
Gain on disposal of HWW Pty Ltd (Note 6(b)(ii)) (10,341) –
Reversal of previous impairment of Mi9 – (9,547)
Mark to market of derivatives (Note 30) 1,343 6,601
Acquisition related costs – 18,484
Withholding tax provision ( Note 18) – 10,700
Transaction costs for IPO related activities – 31,084
Debt refinancing costs (Note 17) – 31,798
Restructuring costs 1,404 1,772
Other 5,581 6,621
Total specific items included in income (i) and expenses (ii) above 847,235 97,513
* Prior year results are restated for discontinued operations of Live as per AASB 5 Non-current Assets Held for Sale and Discontinued Operations. Refer to Note 6(a) for further detail.
76 nine entertainment co.
For
per
sona
l use
onl
y
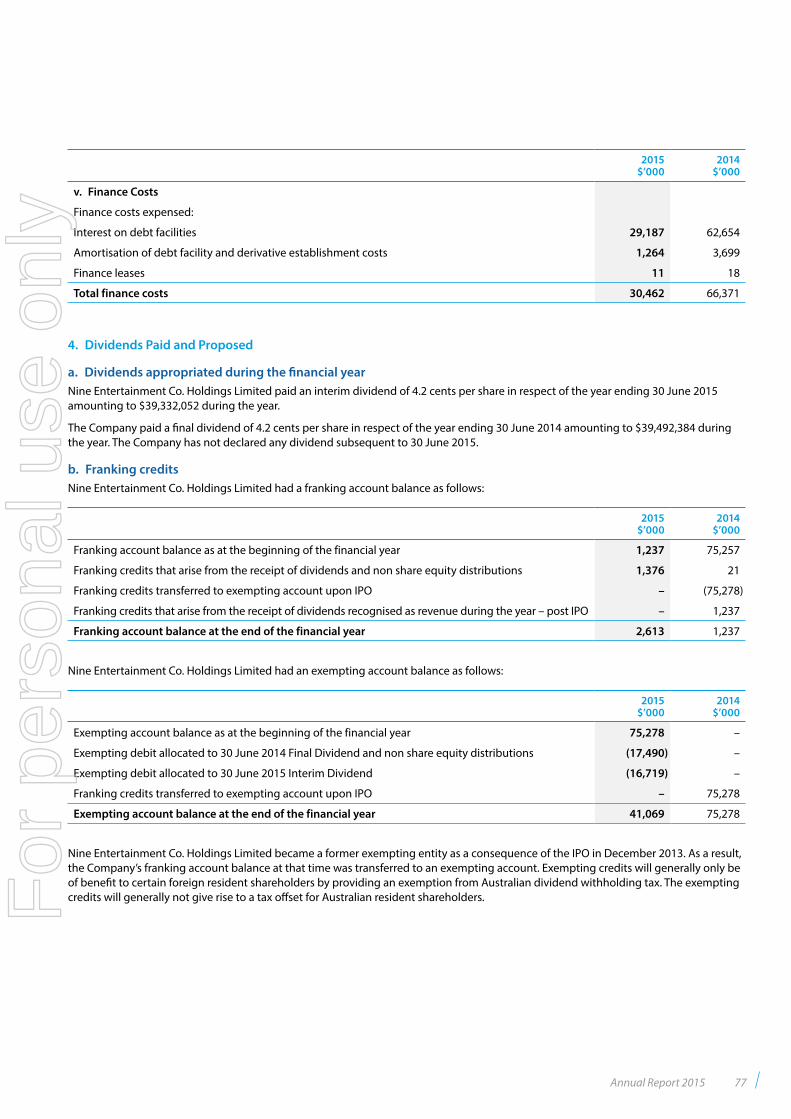
2015$’000
2014$’000
v. Finance Costs
Finance costs expensed:
Interest on debt facilities 29,187 62,654
Amortisation of debt facility and derivative establishment costs 1,264 3,699
Finance leases 11 18
Total finance costs 30,462 66,371
4. Dividends Paid and Proposed
a. Dividends appropriated during the financial yearNine Entertainment Co. Holdings Limited paid an interim dividend of 4.2 cents per share in respect of the year ending 30 June 2015 amounting to $39,332,052 during the year.
The Company paid a final dividend of 4.2 cents per share in respect of the year ending 30 June 2014 amounting to $39,492,384 during the year. The Company has not declared any dividend subsequent to 30 June 2015.
b. Franking creditsNine Entertainment Co. Holdings Limited had a franking account balance as follows:
2015$’000
2014$’000
Franking account balance as at the beginning of the financial year 1,237 75,257
Franking credits that arise from the receipt of dividends and non share equity distributions 1,376 21
Franking credits transferred to exempting account upon IPO – (75,278)
Franking credits that arise from the receipt of dividends recognised as revenue during the year – post IPO – 1,237
Franking account balance at the end of the financial year 2,613 1,237
Nine Entertainment Co. Holdings Limited had an exempting account balance as follows:
2015$’000
2014$’000
Exempting account balance as at the beginning of the financial year 75,278 –
Exempting debit allocated to 30 June 2014 Final Dividend and non share equity distributions (17,490) –
Exempting debit allocated to 30 June 2015 Interim Dividend (16,719) –
Franking credits transferred to exempting account upon IPO – 75,278
Exempting account balance at the end of the financial year 41,069 75,278
Nine Entertainment Co. Holdings Limited became a former exempting entity as a consequence of the IPO in December 2013. As a result, the Company’s franking account balance at that time was transferred to an exempting account. Exempting credits will generally only be of benefit to certain foreign resident shareholders by providing an exemption from Australian dividend withholding tax. The exempting credits will generally not give rise to a tax offset for Australian resident shareholders.
Annual Report 2015 77
For
per
sona
l use
onl
y
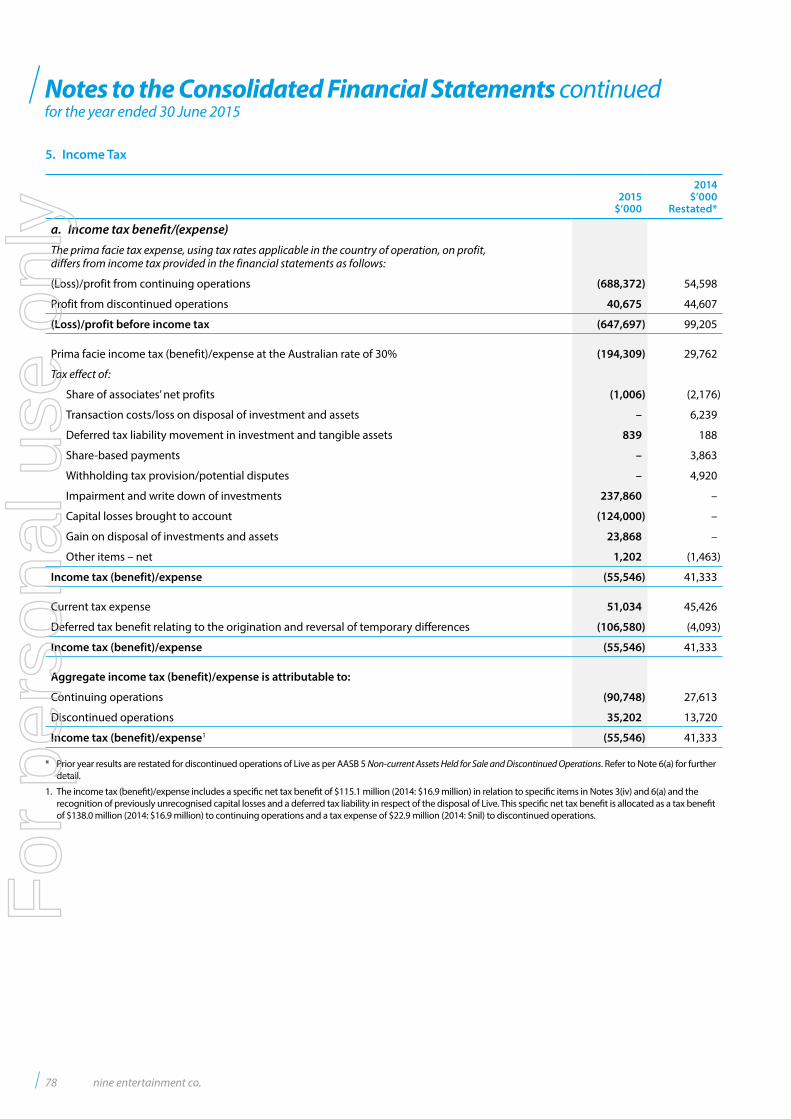
Notes to the Consolidated Financial Statements continuedfor the year ended 30 June 2015
5. Income Tax
2015$’000
2014$’000
Restated*
a. Income tax benefit/(expense)The prima facie tax expense, using tax rates applicable in the country of operation, on profit, differs from income tax provided in the financial statements as follows:
(Loss)/profit from continuing operations (688,372) 54,598
Profit from discontinued operations 40,675 44,607
(Loss)/profit before income tax (647,697) 99,205
Prima facie income tax (benefit)/expense at the Australian rate of 30% (194,309) 29,762
Tax effect of:
Share of associates’ net profits (1,006) (2,176)
Transaction costs/loss on disposal of investment and assets – 6,239
Deferred tax liability movement in investment and tangible assets 839 188
Share-based payments – 3,863
Withholding tax provision/potential disputes – 4,920
Impairment and write down of investments 237,860 –
Capital losses brought to account (124,000) –
Gain on disposal of investments and assets 23,868 –
Other items – net 1,202 (1,463)
Income tax (benefit)/expense (55,546) 41,333
Current tax expense 51,034 45,426
Deferred tax benefit relating to the origination and reversal of temporary differences (106,580) (4,093)
Income tax (benefit)/expense (55,546) 41,333
Aggregate income tax (benefit)/expense is attributable to:
Continuing operations (90,748) 27,613
Discontinued operations 35,202 13,720
Income tax (benefit)/expense1 (55,546) 41,333
* Prior year results are restated for discontinued operations of Live as per AASB 5 Non-current Assets Held for Sale and Discontinued Operations. Refer to Note 6(a) for further detail.
1. The income tax (benefit)/expense includes a specific net tax benefit of $115.1 million (2014: $16.9 million) in relation to specific items in Notes 3(iv) and 6(a) and the recognition of previously unrecognised capital losses and a deferred tax liability in respect of the disposal of Live. This specific net tax benefit is allocated as a tax benefit of $138.0 million (2014: $16.9 million) to continuing operations and a tax expense of $22.9 million (2014: $nil) to discontinued operations.
78 nine entertainment co.
For
per
sona
l use
onl
y
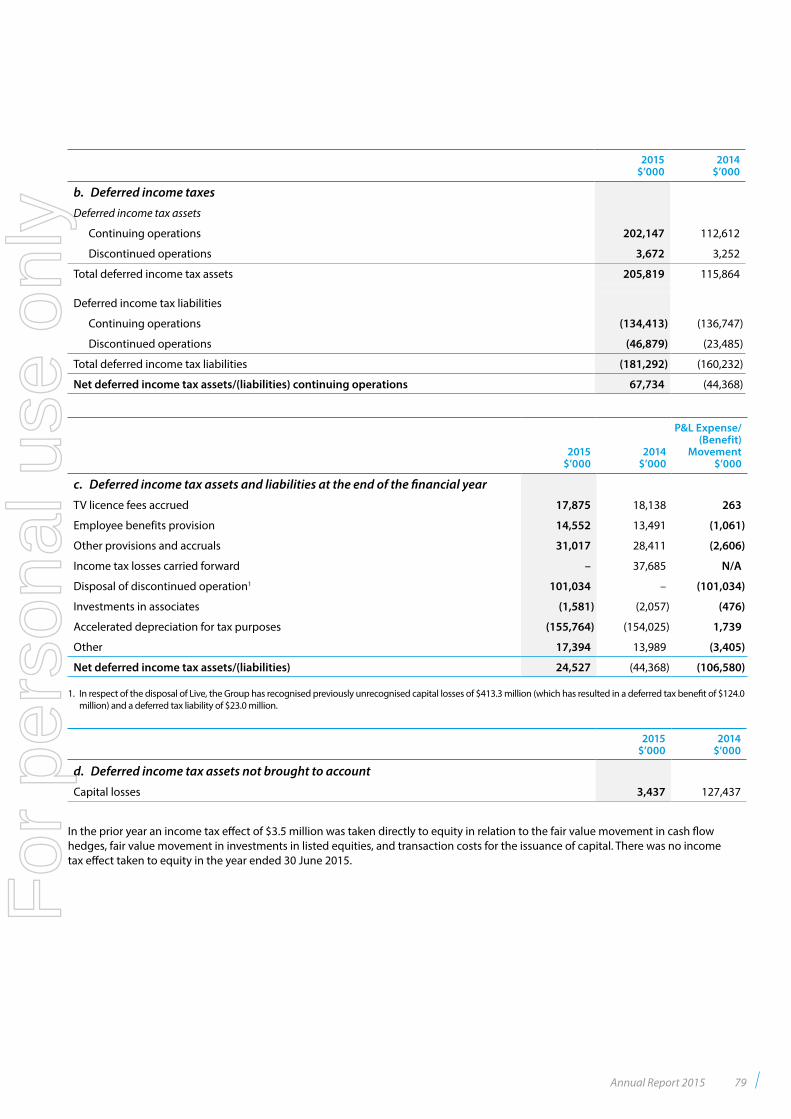
2015$’000
2014$’000
b. Deferred income taxesDeferred income tax assets
Continuing operations 202,147 112,612
Discontinued operations 3,672 3,252
Total deferred income tax assets 205,819 115,864
Deferred income tax liabilities
Continuing operations (134,413) (136,747)
Discontinued operations (46,879) (23,485)
Total deferred income tax liabilities (181,292) (160,232)
Net deferred income tax assets/(liabilities) continuing operations 67,734 (44,368)
2015$’000
2014$’000
P&L Expense/(Benefit)
Movement$’000
c. Deferred income tax assets and liabilities at the end of the financial year TV licence fees accrued 17,875 18,138 263
Employee benefits provision 14,552 13,491 (1,061)
Other provisions and accruals 31,017 28,411 (2,606)
Income tax losses carried forward – 37,685 N/A
Disposal of discontinued operation1 101,034 – (101,034)
Investments in associates (1,581) (2,057) (476)
Accelerated depreciation for tax purposes (155,764) (154,025) 1,739
Other 17,394 13,989 (3,405)
Net deferred income tax assets/(liabilities) 24,527 (44,368) (106,580)
1. In respect of the disposal of Live, the Group has recognised previously unrecognised capital losses of $413.3 million (which has resulted in a deferred tax benefit of $124.0 million) and a deferred tax liability of $23.0 million.
2015$’000
2014$’000
d. Deferred income tax assets not brought to accountCapital losses 3,437 127,437
In the prior year an income tax effect of $3.5 million was taken directly to equity in relation to the fair value movement in cash flow hedges, fair value movement in investments in listed equities, and transaction costs for the issuance of capital. There was no income tax effect taken to equity in the year ended 30 June 2015.
Annual Report 2015 79
For
per
sona
l use
onl
y
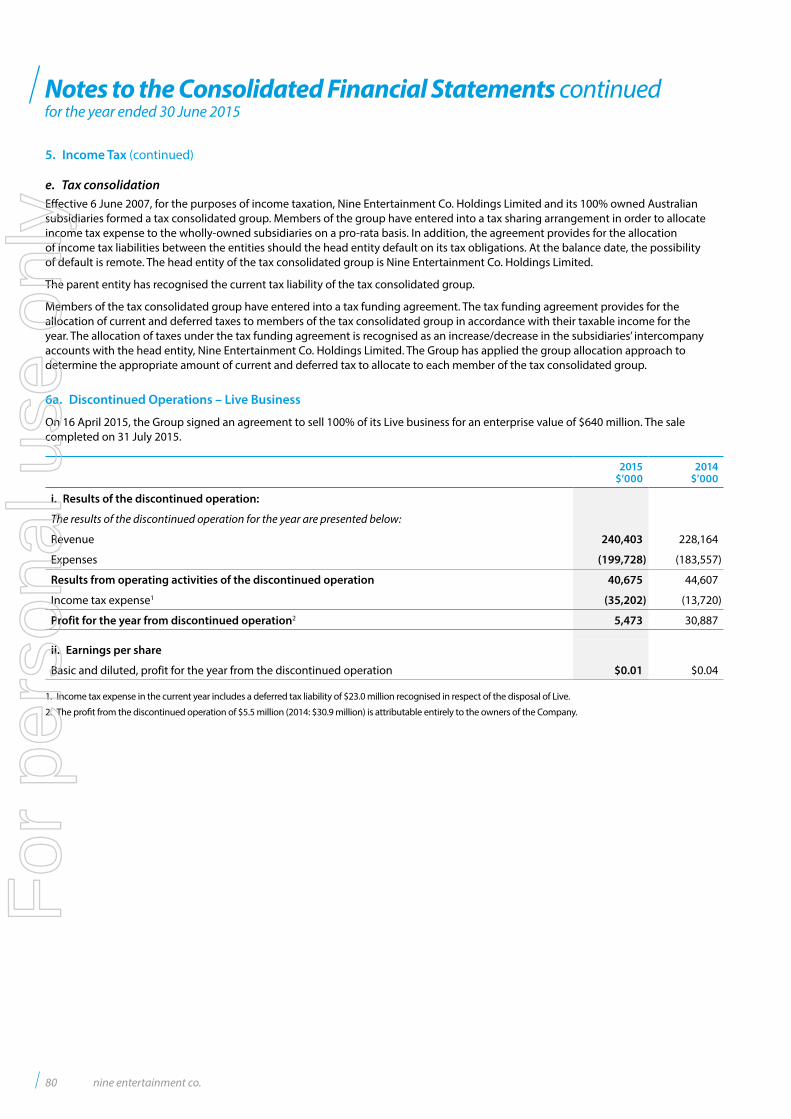
Notes to the Consolidated Financial Statements continuedfor the year ended 30 June 2015
e. Tax consolidationEffective 6 June 2007, for the purposes of income taxation, Nine Entertainment Co. Holdings Limited and its 100% owned Australian subsidiaries formed a tax consolidated group. Members of the group have entered into a tax sharing arrangement in order to allocate income tax expense to the wholly-owned subsidiaries on a pro-rata basis. In addition, the agreement provides for the allocation of income tax liabilities between the entities should the head entity default on its tax obligations. At the balance date, the possibility of default is remote. The head entity of the tax consolidated group is Nine Entertainment Co. Holdings Limited.
The parent entity has recognised the current tax liability of the tax consolidated group.
Members of the tax consolidated group have entered into a tax funding agreement. The tax funding agreement provides for the allocation of current and deferred taxes to members of the tax consolidated group in accordance with their taxable income for the year. The allocation of taxes under the tax funding agreement is recognised as an increase/decrease in the subsidiaries’ intercompany accounts with the head entity, Nine Entertainment Co. Holdings Limited. The Group has applied the group allocation approach to determine the appropriate amount of current and deferred tax to allocate to each member of the tax consolidated group.
6a. Discontinued Operations – Live Business
On 16 April 2015, the Group signed an agreement to sell 100% of its Live business for an enterprise value of $640 million. The sale completed on 31 July 2015.
2015$’000
2014$’000
i. Results of the discontinued operation:
The results of the discontinued operation for the year are presented below:
Revenue 240,403 228,164
Expenses (199,728) (183,557)
Results from operating activities of the discontinued operation 40,675 44,607
Income tax expense1 (35,202) (13,720)
Profit for the year from discontinued operation2 5,473 30,887
ii. Earnings per share
Basic and diluted, profit for the year from the discontinued operation $0.01 $0.04
1. Income tax expense in the current year includes a deferred tax liability of $23.0 million recognised in respect of the disposal of Live.
2. The profit from the discontinued operation of $5.5 million (2014: $30.9 million) is attributable entirely to the owners of the Company.
5. Income Tax (continued)
80 nine entertainment co.
For
per
sona
l use
onl
y
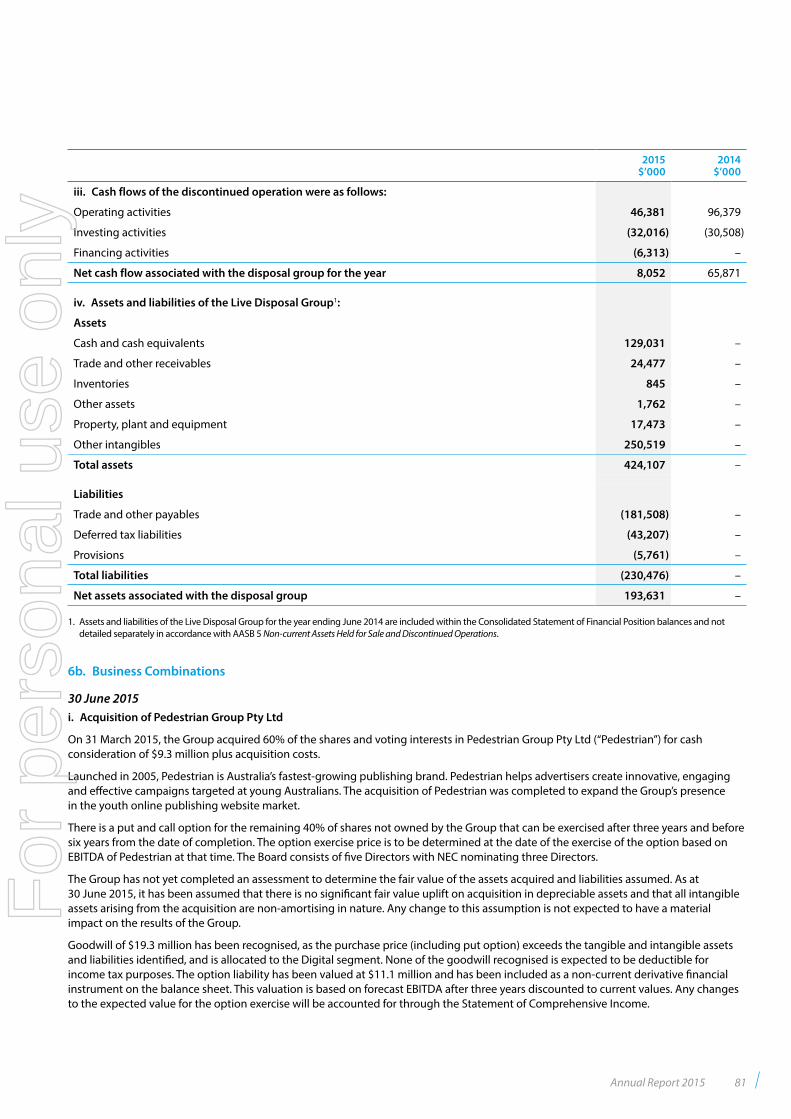
2015$’000
2014$’000
iii. Cash flows of the discontinued operation were as follows:
Operating activities 46,381 96,379
Investing activities (32,016) (30,508)
Financing activities (6,313) –
Net cash flow associated with the disposal group for the year 8,052 65,871
iv. Assets and liabilities of the Live Disposal Group1:
Assets
Cash and cash equivalents 129,031 –
Trade and other receivables 24,477 –
Inventories 845 –
Other assets 1,762 –
Property, plant and equipment 17,473 –
Other intangibles 250,519 –
Total assets 424,107 –
Liabilities
Trade and other payables (181,508) –
Deferred tax liabilities (43,207) –
Provisions (5,761) –
Total liabilities (230,476) –
Net assets associated with the disposal group 193,631 –
1. Assets and liabilities of the Live Disposal Group for the year ending June 2014 are included within the Consolidated Statement of Financial Position balances and not detailed separately in accordance with AASB 5 Non-current Assets Held for Sale and Discontinued Operations.
6b. Business Combinations
30 June 2015i. Acquisition of Pedestrian Group Pty Ltd
On 31 March 2015, the Group acquired 60% of the shares and voting interests in Pedestrian Group Pty Ltd (“Pedestrian”) for cash consideration of $9.3 million plus acquisition costs.
Launched in 2005, Pedestrian is Australia’s fastest-growing publishing brand. Pedestrian helps advertisers create innovative, engaging and effective campaigns targeted at young Australians. The acquisition of Pedestrian was completed to expand the Group’s presence in the youth online publishing website market.
There is a put and call option for the remaining 40% of shares not owned by the Group that can be exercised after three years and before six years from the date of completion. The option exercise price is to be determined at the date of the exercise of the option based on EBITDA of Pedestrian at that time. The Board consists of five Directors with NEC nominating three Directors.
The Group has not yet completed an assessment to determine the fair value of the assets acquired and liabilities assumed. As at 30 June 2015, it has been assumed that there is no significant fair value uplift on acquisition in depreciable assets and that all intangible assets arising from the acquisition are non-amortising in nature. Any change to this assumption is not expected to have a material impact on the results of the Group.
Goodwill of $19.3 million has been recognised, as the purchase price (including put option) exceeds the tangible and intangible assets and liabilities identified, and is allocated to the Digital segment. None of the goodwill recognised is expected to be deductible for income tax purposes. The option liability has been valued at $11.1 million and has been included as a non-current derivative financial instrument on the balance sheet. This valuation is based on forecast EBITDA after three years discounted to current values. Any changes to the expected value for the option exercise will be accounted for through the Statement of Comprehensive Income.
Annual Report 2015 81
For
per
sona
l use
onl
y
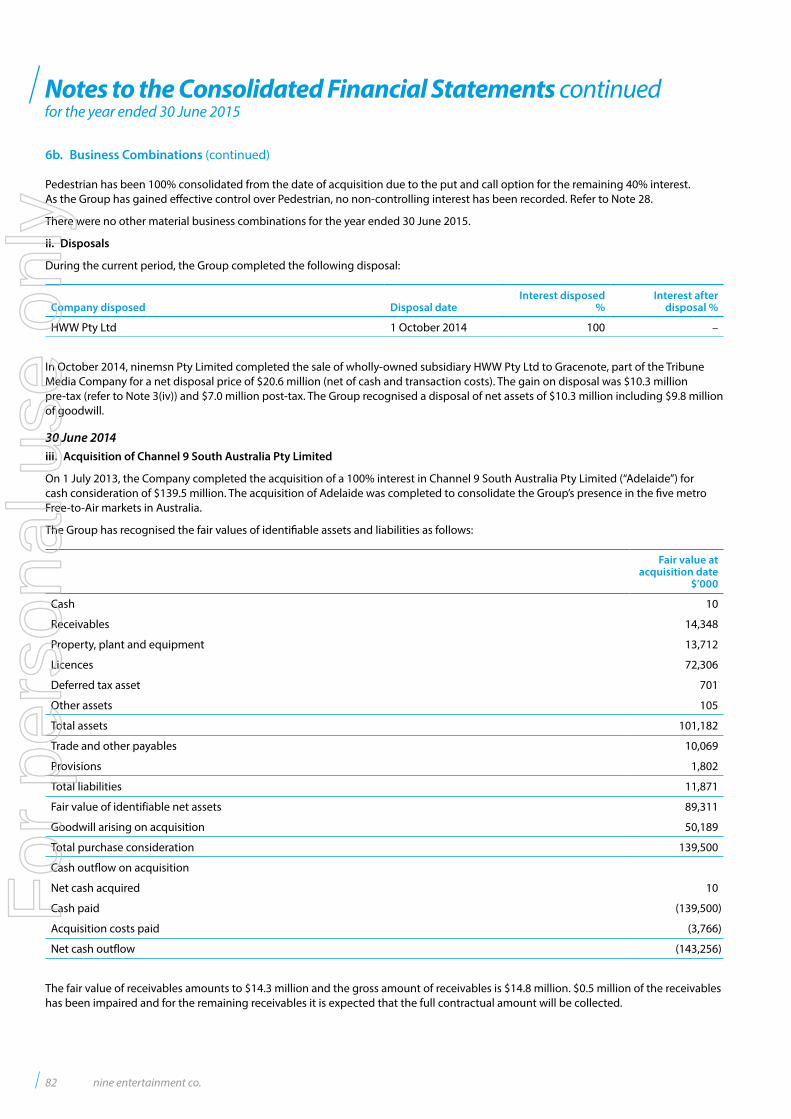
Notes to the Consolidated Financial Statements continuedfor the year ended 30 June 2015
Pedestrian has been 100% consolidated from the date of acquisition due to the put and call option for the remaining 40% interest. As the Group has gained effective control over Pedestrian, no non-controlling interest has been recorded. Refer to Note 28.
There were no other material business combinations for the year ended 30 June 2015.
ii. Disposals
During the current period, the Group completed the following disposal:
Company disposed Disposal date Interest disposed
%Interest after
disposal %
HWW Pty Ltd 1 October 2014 100 –
In October 2014, ninemsn Pty Limited completed the sale of wholly-owned subsidiary HWW Pty Ltd to Gracenote, part of the Tribune Media Company for a net disposal price of $20.6 million (net of cash and transaction costs). The gain on disposal was $10.3 million pre-tax (refer to Note 3(iv)) and $7.0 million post-tax. The Group recognised a disposal of net assets of $10.3 million including $9.8 million of goodwill.
30 June 2014iii. Acquisition of Channel 9 South Australia Pty Limited
On 1 July 2013, the Company completed the acquisition of a 100% interest in Channel 9 South Australia Pty Limited (“Adelaide”) for cash consideration of $139.5 million. The acquisition of Adelaide was completed to consolidate the Group’s presence in the five metro Free-to-Air markets in Australia.
The Group has recognised the fair values of identifiable assets and liabilities as follows:
Fair value at acquisition date
$’000
Cash 10
Receivables 14,348
Property, plant and equipment 13,712
Licences 72,306
Deferred tax asset 701
Other assets 105
Total assets 101,182
Trade and other payables 10,069
Provisions 1,802
Total liabilities 11,871
Fair value of identifiable net assets 89,311
Goodwill arising on acquisition 50,189
Total purchase consideration 139,500
Cash outflow on acquisition
Net cash acquired 10
Cash paid (139,500)
Acquisition costs paid (3,766)
Net cash outflow (143,256)
The fair value of receivables amounts to $14.3 million and the gross amount of receivables is $14.8 million. $0.5 million of the receivables has been impaired and for the remaining receivables it is expected that the full contractual amount will be collected.
6b. Business Combinations (continued)
82 nine entertainment co.
For
per
sona
l use
onl
y
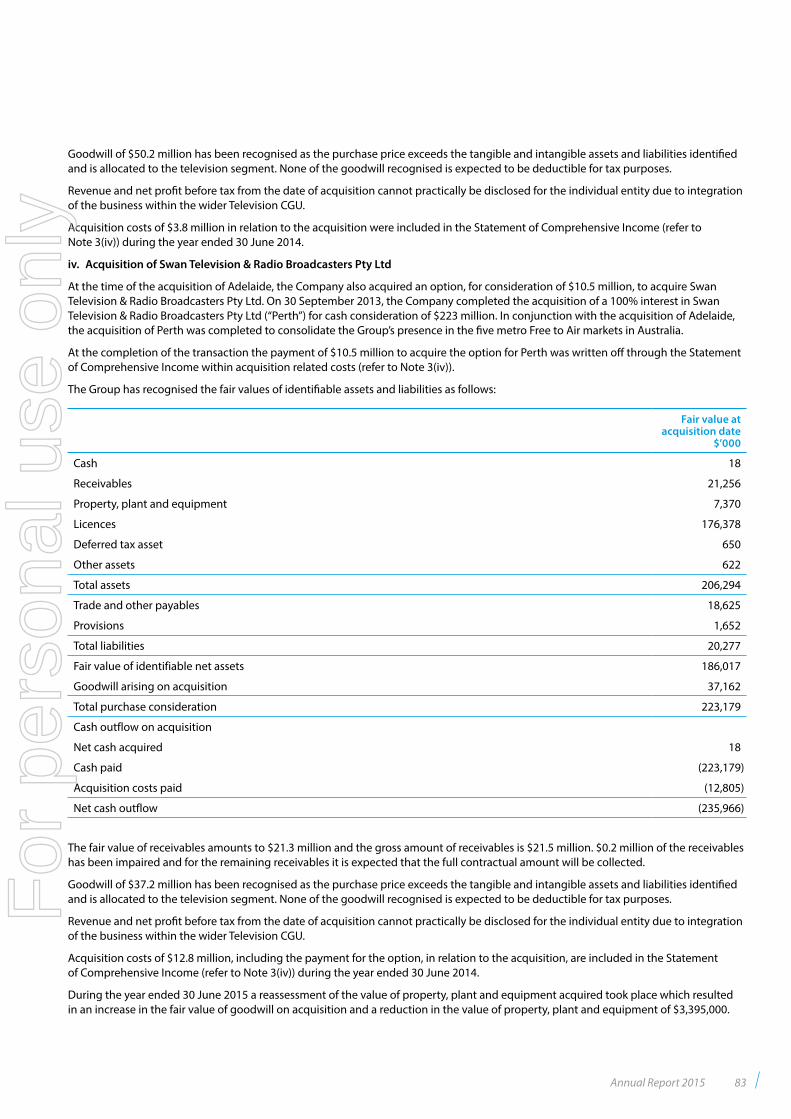
Goodwill of $50.2 million has been recognised as the purchase price exceeds the tangible and intangible assets and liabilities identified and is allocated to the television segment. None of the goodwill recognised is expected to be deductible for tax purposes.
Revenue and net profit before tax from the date of acquisition cannot practically be disclosed for the individual entity due to integration of the business within the wider Television CGU.
Acquisition costs of $3.8 million in relation to the acquisition were included in the Statement of Comprehensive Income (refer to Note 3(iv)) during the year ended 30 June 2014.
iv. Acquisition of Swan Television & Radio Broadcasters Pty Ltd
At the time of the acquisition of Adelaide, the Company also acquired an option, for consideration of $10.5 million, to acquire Swan Television & Radio Broadcasters Pty Ltd. On 30 September 2013, the Company completed the acquisition of a 100% interest in Swan Television & Radio Broadcasters Pty Ltd (“Perth”) for cash consideration of $223 million. In conjunction with the acquisition of Adelaide, the acquisition of Perth was completed to consolidate the Group’s presence in the five metro Free to Air markets in Australia.
At the completion of the transaction the payment of $10.5 million to acquire the option for Perth was written off through the Statement of Comprehensive Income within acquisition related costs (refer to Note 3(iv)).
The Group has recognised the fair values of identifiable assets and liabilities as follows:
Fair value at acquisition date
$’000
Cash 18
Receivables 21,256
Property, plant and equipment 7,370
Licences 176,378
Deferred tax asset 650
Other assets 622
Total assets 206,294
Trade and other payables 18,625
Provisions 1,652
Total liabilities 20,277
Fair value of identifiable net assets 186,017
Goodwill arising on acquisition 37,162
Total purchase consideration 223,179
Cash outflow on acquisition
Net cash acquired 18
Cash paid (223,179)
Acquisition costs paid (12,805)
Net cash outflow (235,966)
The fair value of receivables amounts to $21.3 million and the gross amount of receivables is $21.5 million. $0.2 million of the receivables has been impaired and for the remaining receivables it is expected that the full contractual amount will be collected.
Goodwill of $37.2 million has been recognised as the purchase price exceeds the tangible and intangible assets and liabilities identified and is allocated to the television segment. None of the goodwill recognised is expected to be deductible for tax purposes.
Revenue and net profit before tax from the date of acquisition cannot practically be disclosed for the individual entity due to integration of the business within the wider Television CGU.
Acquisition costs of $12.8 million, including the payment for the option, in relation to the acquisition, are included in the Statement of Comprehensive Income (refer to Note 3(iv)) during the year ended 30 June 2014.
During the year ended 30 June 2015 a reassessment of the value of property, plant and equipment acquired took place which resulted in an increase in the fair value of goodwill on acquisition and a reduction in the value of property, plant and equipment of $3,395,000.
Annual Report 2015 83
For
per
sona
l use
onl
y
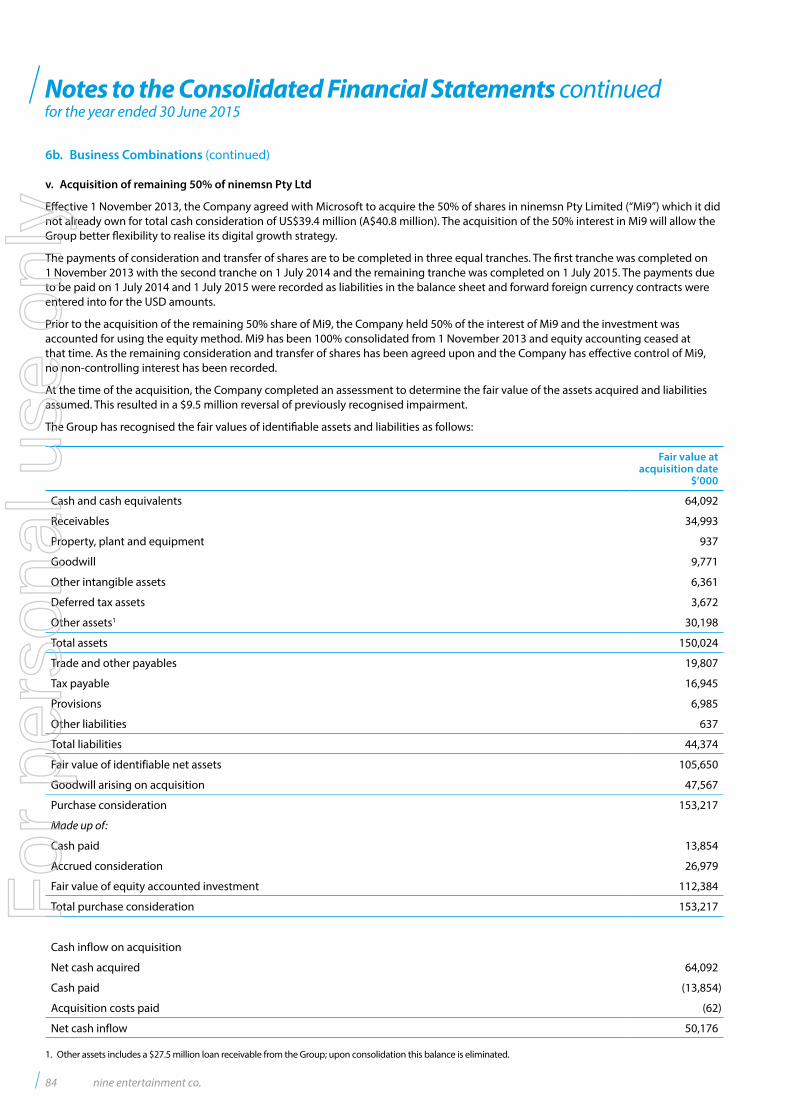
Notes to the Consolidated Financial Statements continuedfor the year ended 30 June 2015
v. Acquisition of remaining 50% of ninemsn Pty Ltd
Effective 1 November 2013, the Company agreed with Microsoft to acquire the 50% of shares in ninemsn Pty Limited (“Mi9”) which it did not already own for total cash consideration of US$39.4 million (A$40.8 million). The acquisition of the 50% interest in Mi9 will allow the Group better flexibility to realise its digital growth strategy.
The payments of consideration and transfer of shares are to be completed in three equal tranches. The first tranche was completed on 1 November 2013 with the second tranche on 1 July 2014 and the remaining tranche was completed on 1 July 2015. The payments due to be paid on 1 July 2014 and 1 July 2015 were recorded as liabilities in the balance sheet and forward foreign currency contracts were entered into for the USD amounts.
Prior to the acquisition of the remaining 50% share of Mi9, the Company held 50% of the interest of Mi9 and the investment was accounted for using the equity method. Mi9 has been 100% consolidated from 1 November 2013 and equity accounting ceased at that time. As the remaining consideration and transfer of shares has been agreed upon and the Company has effective control of Mi9, no non-controlling interest has been recorded.
At the time of the acquisition, the Company completed an assessment to determine the fair value of the assets acquired and liabilities assumed. This resulted in a $9.5 million reversal of previously recognised impairment.
The Group has recognised the fair values of identifiable assets and liabilities as follows:
Fair value at acquisition date
$’000
Cash and cash equivalents 64,092
Receivables 34,993
Property, plant and equipment 937
Goodwill 9,771
Other intangible assets 6,361
Deferred tax assets 3,672
Other assets1 30,198
Total assets 150,024
Trade and other payables 19,807
Tax payable 16,945
Provisions 6,985
Other liabilities 637
Total liabilities 44,374
Fair value of identifiable net assets 105,650
Goodwill arising on acquisition 47,567
Purchase consideration 153,217
Made up of:
Cash paid 13,854
Accrued consideration 26,979
Fair value of equity accounted investment 112,384
Total purchase consideration 153,217
Cash inflow on acquisition
Net cash acquired 64,092
Cash paid (13,854)
Acquisition costs paid (62)
Net cash inflow 50,176
1. Other assets includes a $27.5 million loan receivable from the Group; upon consolidation this balance is eliminated.
6b. Business Combinations (continued)
84 nine entertainment co.
For
per
sona
l use
onl
y
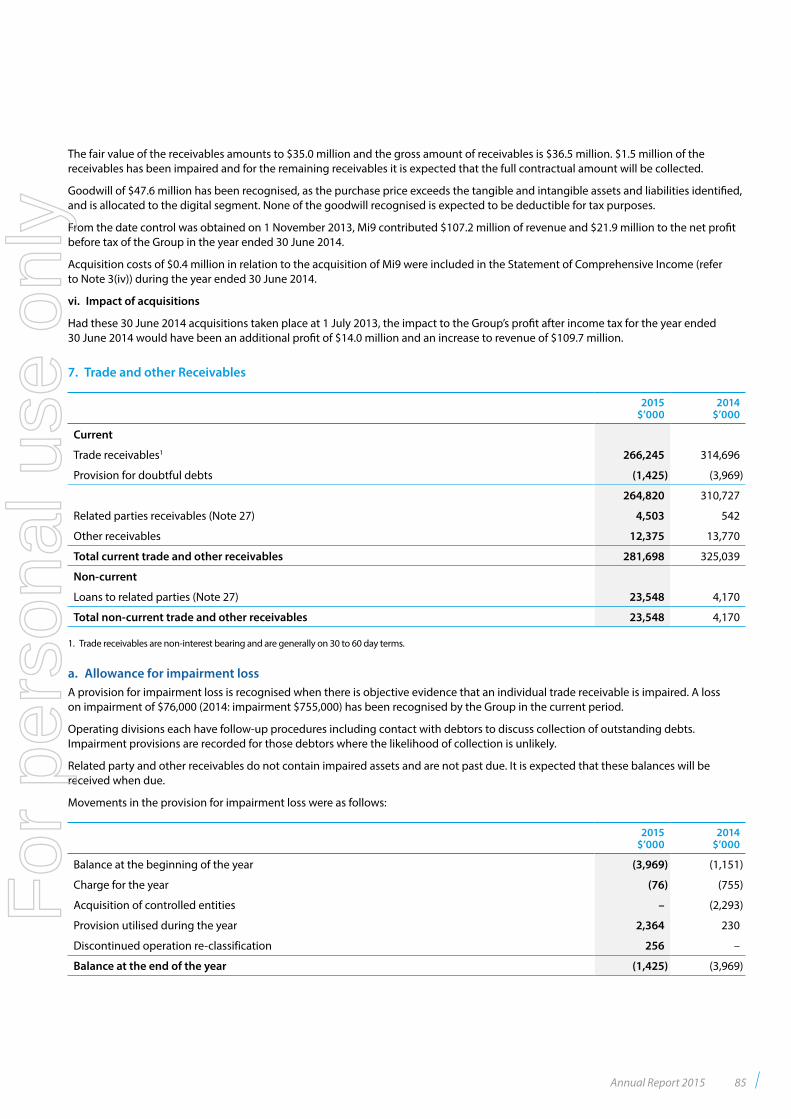
The fair value of the receivables amounts to $35.0 million and the gross amount of receivables is $36.5 million. $1.5 million of the receivables has been impaired and for the remaining receivables it is expected that the full contractual amount will be collected.
Goodwill of $47.6 million has been recognised, as the purchase price exceeds the tangible and intangible assets and liabilities identified, and is allocated to the digital segment. None of the goodwill recognised is expected to be deductible for tax purposes.
From the date control was obtained on 1 November 2013, Mi9 contributed $107.2 million of revenue and $21.9 million to the net profit before tax of the Group in the year ended 30 June 2014.
Acquisition costs of $0.4 million in relation to the acquisition of Mi9 were included in the Statement of Comprehensive Income (refer to Note 3(iv)) during the year ended 30 June 2014.
vi. Impact of acquisitions
Had these 30 June 2014 acquisitions taken place at 1 July 2013, the impact to the Group’s profit after income tax for the year ended 30 June 2014 would have been an additional profit of $14.0 million and an increase to revenue of $109.7 million.
7. Trade and other Receivables
2015$’000
2014$’000
Current
Trade receivables1 266,245 314,696
Provision for doubtful debts (1,425) (3,969)
264,820 310,727
Related parties receivables (Note 27) 4,503 542
Other receivables 12,375 13,770
Total current trade and other receivables 281,698 325,039
Non-current
Loans to related parties (Note 27) 23,548 4,170
Total non-current trade and other receivables 23,548 4,170
1. Trade receivables are non-interest bearing and are generally on 30 to 60 day terms.
a. Allowance for impairment loss A provision for impairment loss is recognised when there is objective evidence that an individual trade receivable is impaired. A loss on impairment of $76,000 (2014: impairment $755,000) has been recognised by the Group in the current period.
Operating divisions each have follow-up procedures including contact with debtors to discuss collection of outstanding debts. Impairment provisions are recorded for those debtors where the likelihood of collection is unlikely.
Related party and other receivables do not contain impaired assets and are not past due. It is expected that these balances will be received when due.
Movements in the provision for impairment loss were as follows:
2015$’000
2014$’000
Balance at the beginning of the year (3,969) (1,151)
Charge for the year (76) (755)
Acquisition of controlled entities – (2,293)
Provision utilised during the year 2,364 230
Discontinued operation re-classification 256 –
Balance at the end of the year (1,425) (3,969)
Annual Report 2015 85
For
per
sona
l use
onl
y
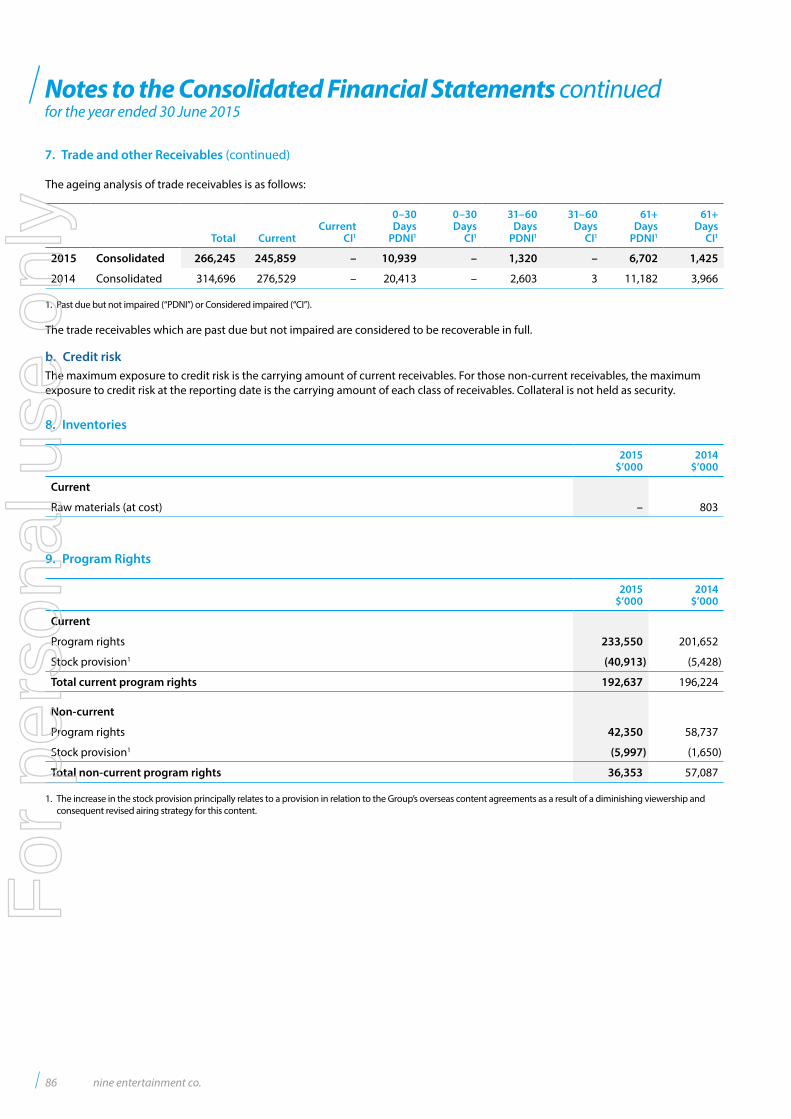
Notes to the Consolidated Financial Statements continuedfor the year ended 30 June 2015
The ageing analysis of trade receivables is as follows:
Total CurrentCurrent
CI1
0–30Days
PDNI1
0–30Days
CI1
31–60Days
PDNI1
31–60Days
CI1
61+Days
PDNI1
61+Days
CI1
2015 Consolidated 266,245 245,859 – 10,939 – 1,320 – 6,702 1,425
2014 Consolidated 314,696 276,529 – 20,413 – 2,603 3 11,182 3,966
1. Past due but not impaired (“PDNI”) or Considered impaired (“CI”).
The trade receivables which are past due but not impaired are considered to be recoverable in full.
b. Credit riskThe maximum exposure to credit risk is the carrying amount of current receivables. For those non-current receivables, the maximum exposure to credit risk at the reporting date is the carrying amount of each class of receivables. Collateral is not held as security.
8. Inventories
2015$’000
2014$’000
Current
Raw materials (at cost) – 803
9. Program Rights
2015$’000
2014$’000
Current
Program rights 233,550 201,652
Stock provision1 (40,913) (5,428)
Total current program rights 192,637 196,224
Non-current
Program rights 42,350 58,737
Stock provision1 (5,997) (1,650)
Total non-current program rights 36,353 57,087
1. The increase in the stock provision principally relates to a provision in relation to the Group’s overseas content agreements as a result of a diminishing viewership and consequent revised airing strategy for this content.
7. Trade and other Receivables (continued)
86 nine entertainment co.
For
per
sona
l use
onl
y
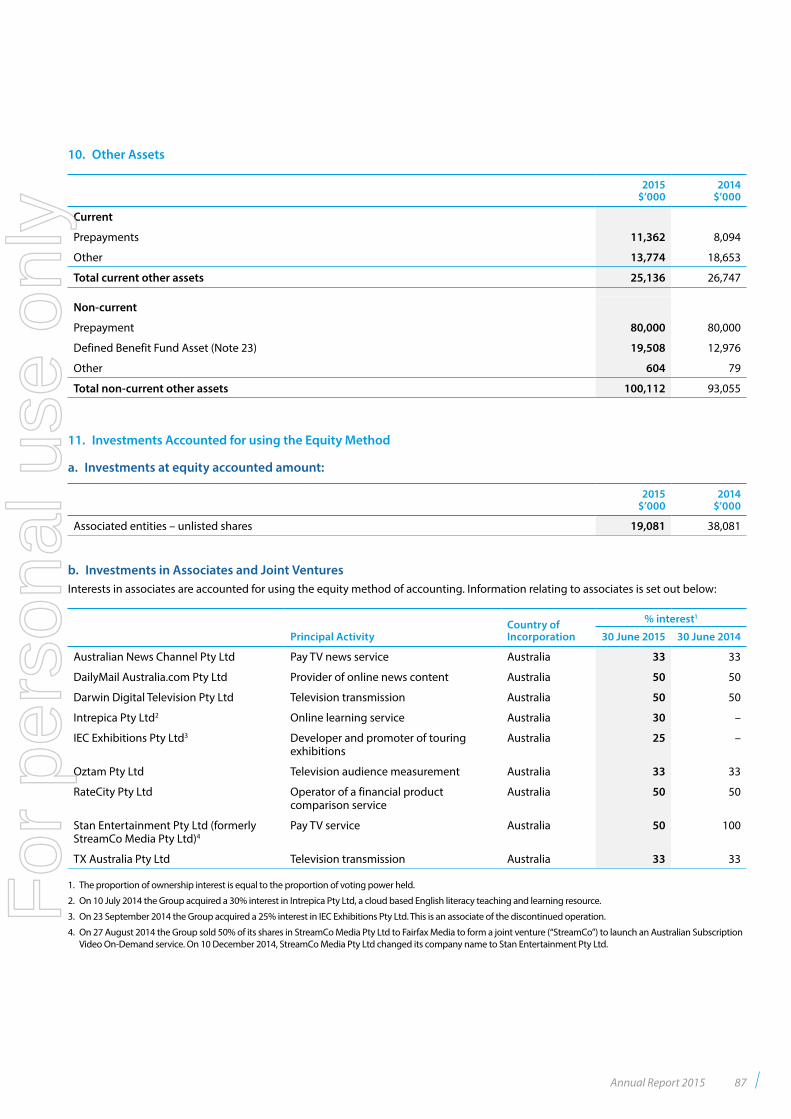
10. Other Assets
2015$’000
2014$’000
Current
Prepayments 11,362 8,094
Other 13,774 18,653
Total current other assets 25,136 26,747
Non-current
Prepayment 80,000 80,000
Defined Benefit Fund Asset (Note 23) 19,508 12,976
Other 604 79
Total non-current other assets 100,112 93,055
11. Investments Accounted for using the Equity Method
a. Investments at equity accounted amount:
2015$’000
2014$’000
Associated entities – unlisted shares 19,081 38,081
b. Investments in Associates and Joint VenturesInterests in associates are accounted for using the equity method of accounting. Information relating to associates is set out below:
Principal ActivityCountry of Incorporation
% interest1
30 June 2015 30 June 2014
Australian News Channel Pty Ltd Pay TV news service Australia 33 33
DailyMail Australia.com Pty Ltd Provider of online news content Australia 50 50
Darwin Digital Television Pty Ltd Television transmission Australia 50 50
Intrepica Pty Ltd2 Online learning service Australia 30 –
IEC Exhibitions Pty Ltd3 Developer and promoter of touring exhibitions
Australia 25 –
Oztam Pty Ltd Television audience measurement Australia 33 33
RateCity Pty Ltd Operator of a financial product comparison service
Australia 50 50
Stan Entertainment Pty Ltd (formerly StreamCo Media Pty Ltd)4
Pay TV service Australia 50 100
TX Australia Pty Ltd Television transmission Australia 33 33
1. The proportion of ownership interest is equal to the proportion of voting power held.
2. On 10 July 2014 the Group acquired a 30% interest in Intrepica Pty Ltd, a cloud based English literacy teaching and learning resource.
3. On 23 September 2014 the Group acquired a 25% interest in IEC Exhibitions Pty Ltd. This is an associate of the discontinued operation.
4. On 27 August 2014 the Group sold 50% of its shares in StreamCo Media Pty Ltd to Fairfax Media to form a joint venture (“StreamCo”) to launch an Australian Subscription Video On-Demand service. On 10 December 2014, StreamCo Media Pty Ltd changed its company name to Stan Entertainment Pty Ltd.
Annual Report 2015 87
For
per
sona
l use
onl
y
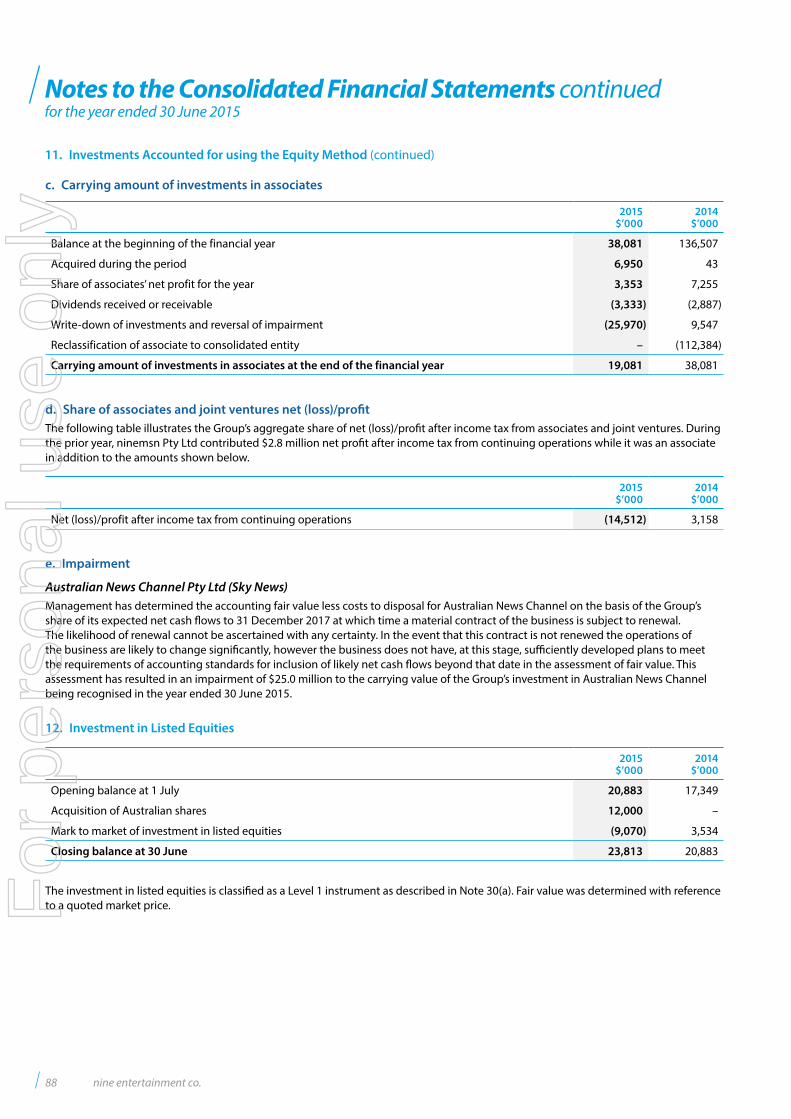
Notes to the Consolidated Financial Statements continuedfor the year ended 30 June 2015
c. Carrying amount of investments in associates
2015$’000
2014$’000
Balance at the beginning of the financial year 38,081 136,507
Acquired during the period 6,950 43
Share of associates’ net profit for the year 3,353 7,255
Dividends received or receivable (3,333) (2,887)
Write-down of investments and reversal of impairment (25,970) 9,547
Reclassification of associate to consolidated entity – (112,384)
Carrying amount of investments in associates at the end of the financial year 19,081 38,081
d. Share of associates and joint ventures net (loss)/profitThe following table illustrates the Group’s aggregate share of net (loss)/profit after income tax from associates and joint ventures. During the prior year, ninemsn Pty Ltd contributed $2.8 million net profit after income tax from continuing operations while it was an associate in addition to the amounts shown below.
2015$’000
2014$’000
Net (loss)/profit after income tax from continuing operations (14,512) 3,158
e. Impairment
Australian News Channel Pty Ltd (Sky News) Management has determined the accounting fair value less costs to disposal for Australian News Channel on the basis of the Group’s share of its expected net cash flows to 31 December 2017 at which time a material contract of the business is subject to renewal. The likelihood of renewal cannot be ascertained with any certainty. In the event that this contract is not renewed the operations of the business are likely to change significantly, however the business does not have, at this stage, sufficiently developed plans to meet the requirements of accounting standards for inclusion of likely net cash flows beyond that date in the assessment of fair value. This assessment has resulted in an impairment of $25.0 million to the carrying value of the Group’s investment in Australian News Channel being recognised in the year ended 30 June 2015.
12. Investment in Listed Equities
2015$’000
2014$’000
Opening balance at 1 July 20,883 17,349
Acquisition of Australian shares 12,000 –
Mark to market of investment in listed equities (9,070) 3,534
Closing balance at 30 June 23,813 20,883
The investment in listed equities is classified as a Level 1 instrument as described in Note 30(a). Fair value was determined with reference to a quoted market price.
11. Investments Accounted for using the Equity Method (continued)
88 nine entertainment co.
For
per
sona
l use
onl
y
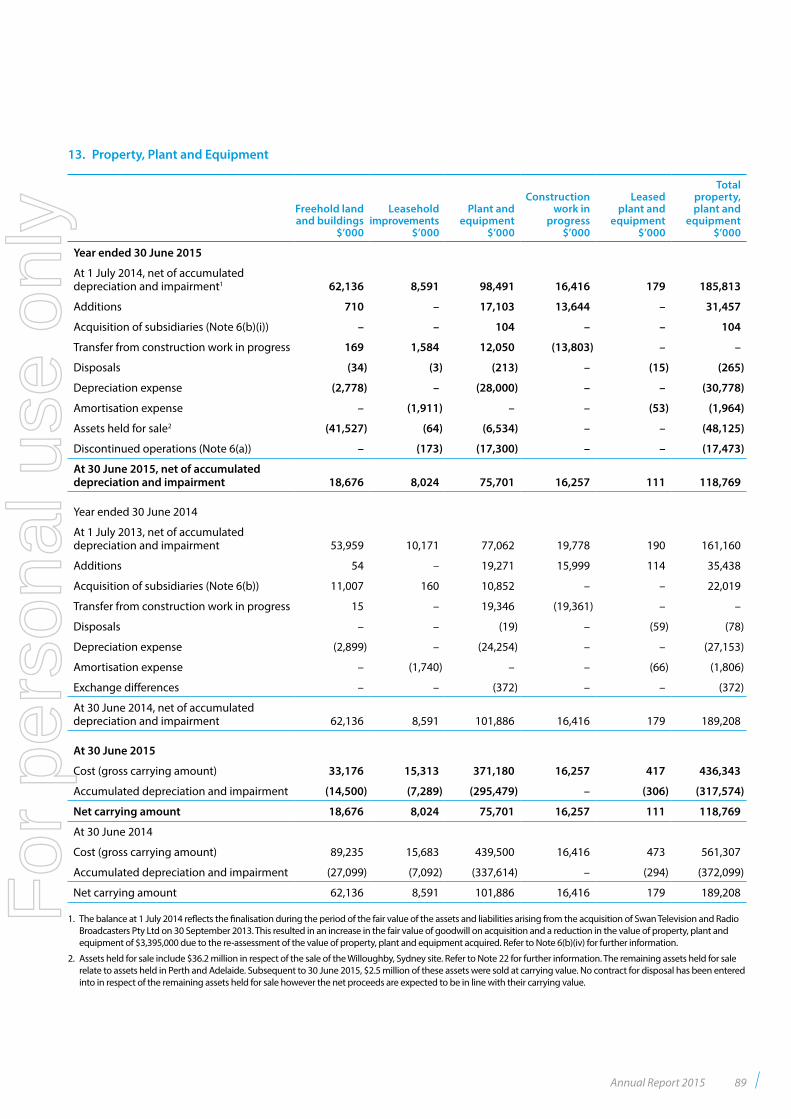
13. Property, Plant and Equipment
Freehold land and buildings
$’000
Leasehold improvements
$’000
Plant and equipment
$’000
Construction work in
progress $’000
Leased plant and
equipment $’000
Total property, plant and
equipment $’000
Year ended 30 June 2015
At 1 July 2014, net of accumulated depreciation and impairment1 62,136 8,591 98,491 16,416 179 185,813
Additions 710 – 17,103 13,644 – 31,457
Acquisition of subsidiaries (Note 6(b)(i)) – – 104 – – 104
Transfer from construction work in progress 169 1,584 12,050 (13,803) – –
Disposals (34) (3) (213) – (15) (265)
Depreciation expense (2,778) – (28,000) – – (30,778)
Amortisation expense – (1,911) – – (53) (1,964)
Assets held for sale2 (41,527) (64) (6,534) – – (48,125)
Discontinued operations (Note 6(a)) – (173) (17,300) – – (17,473)
At 30 June 2015, net of accumulated depreciation and impairment 18,676 8,024 75,701 16,257 111 118,769
Year ended 30 June 2014
At 1 July 2013, net of accumulated depreciation and impairment 53,959 10,171 77,062 19,778 190 161,160
Additions 54 – 19,271 15,999 114 35,438
Acquisition of subsidiaries (Note 6(b)) 11,007 160 10,852 – – 22,019
Transfer from construction work in progress 15 – 19,346 (19,361) – –
Disposals – – (19) – (59) (78)
Depreciation expense (2,899) – (24,254) – – (27,153)
Amortisation expense – (1,740) – – (66) (1,806)
Exchange differences – – (372) – – (372)
At 30 June 2014, net of accumulated depreciation and impairment 62,136 8,591 101,886 16,416 179 189,208
At 30 June 2015
Cost (gross carrying amount) 33,176 15,313 371,180 16,257 417 436,343
Accumulated depreciation and impairment (14,500) (7,289) (295,479) – (306) (317,574)
Net carrying amount 18,676 8,024 75,701 16,257 111 118,769
At 30 June 2014
Cost (gross carrying amount) 89,235 15,683 439,500 16,416 473 561,307
Accumulated depreciation and impairment (27,099) (7,092) (337,614) – (294) (372,099)
Net carrying amount 62,136 8,591 101,886 16,416 179 189,208
1. The balance at 1 July 2014 reflects the finalisation during the period of the fair value of the assets and liabilities arising from the acquisition of Swan Television and Radio Broadcasters Pty Ltd on 30 September 2013. This resulted in an increase in the fair value of goodwill on acquisition and a reduction in the value of property, plant and equipment of $3,395,000 due to the re-assessment of the value of property, plant and equipment acquired. Refer to Note 6(b)(iv) for further information.
2. Assets held for sale include $36.2 million in respect of the sale of the Willoughby, Sydney site. Refer to Note 22 for further information. The remaining assets held for sale relate to assets held in Perth and Adelaide. Subsequent to 30 June 2015, $2.5 million of these assets were sold at carrying value. No contract for disposal has been entered into in respect of the remaining assets held for sale however the net proceeds are expected to be in line with their carrying value.
Annual Report 2015 89
For
per
sona
l use
onl
y
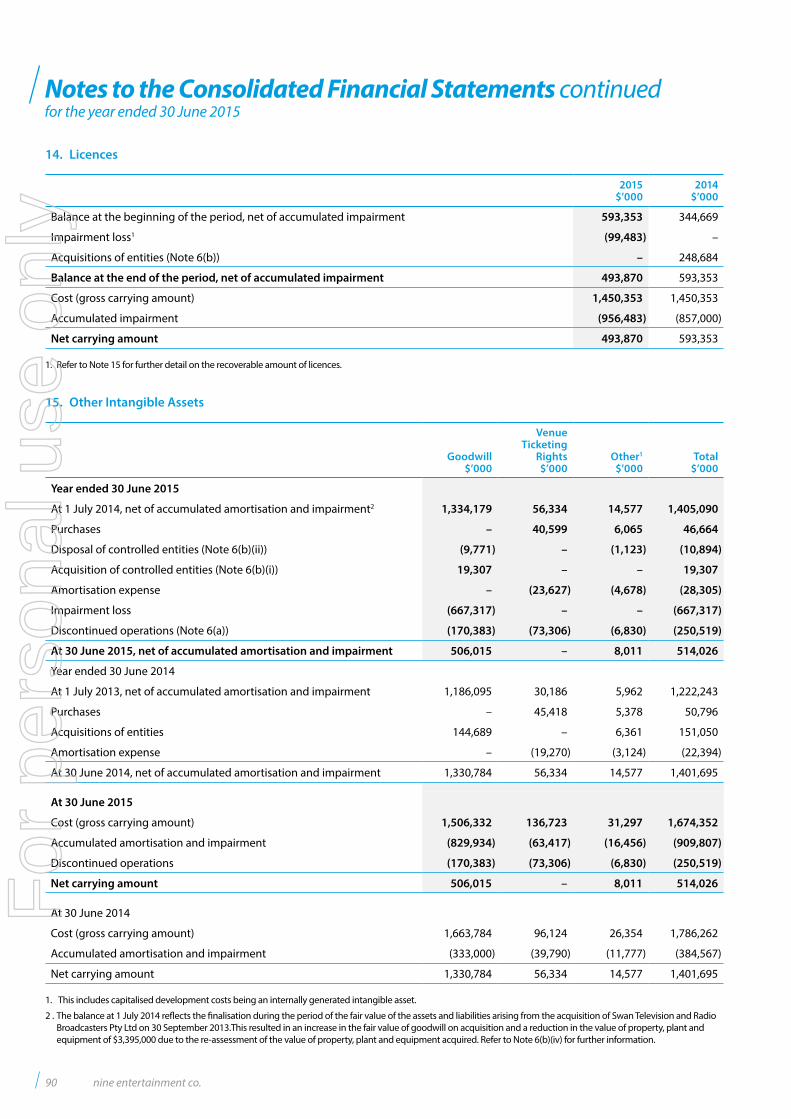
Notes to the Consolidated Financial Statements continuedfor the year ended 30 June 2015
14. Licences
2015$’000
2014$’000
Balance at the beginning of the period, net of accumulated impairment 593,353 344,669
Impairment loss1 (99,483) –
Acquisitions of entities (Note 6(b)) – 248,684
Balance at the end of the period, net of accumulated impairment 493,870 593,353
Cost (gross carrying amount) 1,450,353 1,450,353
Accumulated impairment (956,483) (857,000)
Net carrying amount 493,870 593,353
1. Refer to Note 15 for further detail on the recoverable amount of licences.
15. Other Intangible Assets
Goodwill$’000
Venue Ticketing
Rights$’000
Other1
$’000Total
$’000
Year ended 30 June 2015
At 1 July 2014, net of accumulated amortisation and impairment2 1,334,179 56,334 14,577 1,405,090
Purchases – 40,599 6,065 46,664
Disposal of controlled entities (Note 6(b)(ii)) (9,771) – (1,123) (10,894)
Acquisition of controlled entities (Note 6(b)(i)) 19,307 – – 19,307
Amortisation expense – (23,627) (4,678) (28,305)
Impairment loss (667,317) – – (667,317)
Discontinued operations (Note 6(a)) (170,383) (73,306) (6,830) (250,519)
At 30 June 2015, net of accumulated amortisation and impairment 506,015 – 8,011 514,026
Year ended 30 June 2014
At 1 July 2013, net of accumulated amortisation and impairment 1,186,095 30,186 5,962 1,222,243
Purchases – 45,418 5,378 50,796
Acquisitions of entities 144,689 – 6,361 151,050
Amortisation expense – (19,270) (3,124) (22,394)
At 30 June 2014, net of accumulated amortisation and impairment 1,330,784 56,334 14,577 1,401,695
At 30 June 2015
Cost (gross carrying amount) 1,506,332 136,723 31,297 1,674,352
Accumulated amortisation and impairment (829,934) (63,417) (16,456) (909,807)
Discontinued operations (170,383) (73,306) (6,830) (250,519)
Net carrying amount 506,015 – 8,011 514,026
At 30 June 2014
Cost (gross carrying amount) 1,663,784 96,124 26,354 1,786,262
Accumulated amortisation and impairment (333,000) (39,790) (11,777) (384,567)
Net carrying amount 1,330,784 56,334 14,577 1,401,695
1. This includes capitalised development costs being an internally generated intangible asset.
2 . The balance at 1 July 2014 reflects the finalisation during the period of the fair value of the assets and liabilities arising from the acquisition of Swan Television and Radio Broadcasters Pty Ltd on 30 September 2013.This resulted in an increase in the fair value of goodwill on acquisition and a reduction in the value of property, plant and equipment of $3,395,000 due to the re-assessment of the value of property, plant and equipment acquired. Refer to Note 6(b)(iv) for further information.
90 nine entertainment co.
For
per
sona
l use
onl
y
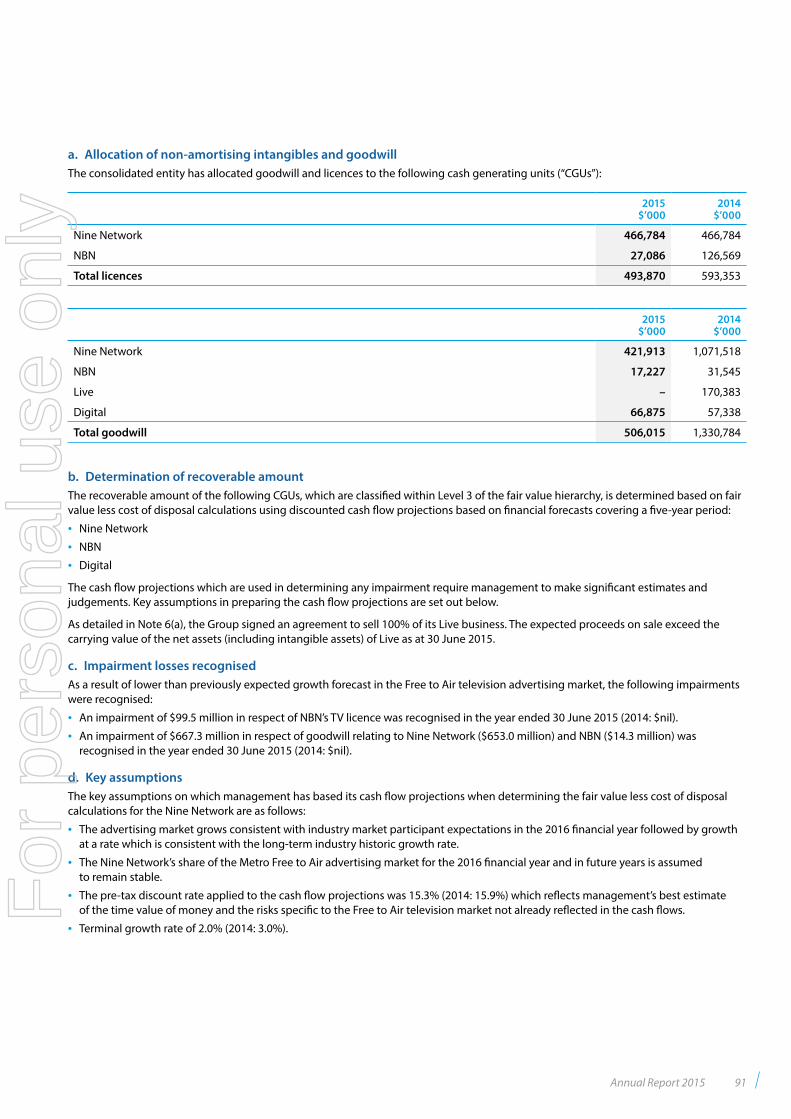
a. Allocation of non-amortising intangibles and goodwillThe consolidated entity has allocated goodwill and licences to the following cash generating units (“CGUs”):
2015$’000
2014$’000
Nine Network 466,784 466,784
NBN 27,086 126,569
Total licences 493,870 593,353
2015$’000
2014$’000
Nine Network 421,913 1,071,518
NBN 17,227 31,545
Live – 170,383
Digital 66,875 57,338
Total goodwill 506,015 1,330,784
b. Determination of recoverable amountThe recoverable amount of the following CGUs, which are classified within Level 3 of the fair value hierarchy, is determined based on fair value less cost of disposal calculations using discounted cash flow projections based on financial forecasts covering a five-year period:
• Nine Network
• NBN
• Digital
The cash flow projections which are used in determining any impairment require management to make significant estimates and judgements. Key assumptions in preparing the cash flow projections are set out below.
As detailed in Note 6(a), the Group signed an agreement to sell 100% of its Live business. The expected proceeds on sale exceed the carrying value of the net assets (including intangible assets) of Live as at 30 June 2015.
c. Impairment losses recognisedAs a result of lower than previously expected growth forecast in the Free to Air television advertising market, the following impairments were recognised:
• An impairment of $99.5 million in respect of NBN’s TV licence was recognised in the year ended 30 June 2015 (2014: $nil).
• An impairment of $667.3 million in respect of goodwill relating to Nine Network ($653.0 million) and NBN ($14.3 million) was recognised in the year ended 30 June 2015 (2014: $nil).
d. Key assumptions The key assumptions on which management has based its cash flow projections when determining the fair value less cost of disposal calculations for the Nine Network are as follows:
• The advertising market grows consistent with industry market participant expectations in the 2016 financial year followed by growth at a rate which is consistent with the long-term industry historic growth rate.
• The Nine Network’s share of the Metro Free to Air advertising market for the 2016 financial year and in future years is assumed to remain stable.
• The pre-tax discount rate applied to the cash flow projections was 15.3% (2014: 15.9%) which reflects management’s best estimate of the time value of money and the risks specific to the Free to Air television market not already reflected in the cash flows.
• Terminal growth rate of 2.0% (2014: 3.0%).
Annual Report 2015 91
For
per
sona
l use
onl
y
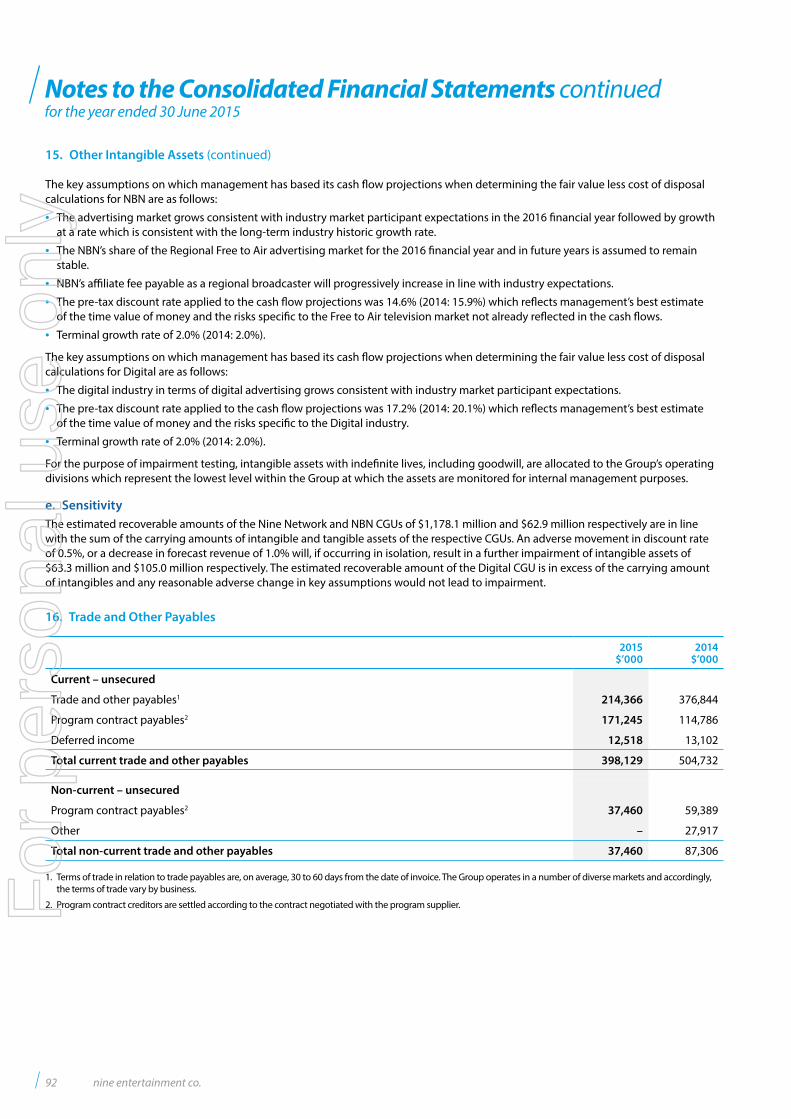
Notes to the Consolidated Financial Statements continuedfor the year ended 30 June 2015
The key assumptions on which management has based its cash flow projections when determining the fair value less cost of disposal calculations for NBN are as follows:
• The advertising market grows consistent with industry market participant expectations in the 2016 financial year followed by growth at a rate which is consistent with the long-term industry historic growth rate.
• The NBN’s share of the Regional Free to Air advertising market for the 2016 financial year and in future years is assumed to remain stable.
• NBN’s affiliate fee payable as a regional broadcaster will progressively increase in line with industry expectations.
• The pre-tax discount rate applied to the cash flow projections was 14.6% (2014: 15.9%) which reflects management’s best estimate of the time value of money and the risks specific to the Free to Air television market not already reflected in the cash flows.
• Terminal growth rate of 2.0% (2014: 2.0%).
The key assumptions on which management has based its cash flow projections when determining the fair value less cost of disposal calculations for Digital are as follows:
• The digital industry in terms of digital advertising grows consistent with industry market participant expectations.
• The pre-tax discount rate applied to the cash flow projections was 17.2% (2014: 20.1%) which reflects management’s best estimate of the time value of money and the risks specific to the Digital industry.
• Terminal growth rate of 2.0% (2014: 2.0%).
For the purpose of impairment testing, intangible assets with indefinite lives, including goodwill, are allocated to the Group’s operating divisions which represent the lowest level within the Group at which the assets are monitored for internal management purposes.
e. SensitivityThe estimated recoverable amounts of the Nine Network and NBN CGUs of $1,178.1 million and $62.9 million respectively are in line with the sum of the carrying amounts of intangible and tangible assets of the respective CGUs. An adverse movement in discount rate of 0.5%, or a decrease in forecast revenue of 1.0% will, if occurring in isolation, result in a further impairment of intangible assets of $63.3 million and $105.0 million respectively. The estimated recoverable amount of the Digital CGU is in excess of the carrying amount of intangibles and any reasonable adverse change in key assumptions would not lead to impairment.
16. Trade and Other Payables
2015$’000
2014$’000
Current – unsecured
Trade and other payables1 214,366 376,844
Program contract payables2 171,245 114,786
Deferred income 12,518 13,102
Total current trade and other payables 398,129 504,732
Non-current – unsecured
Program contract payables2 37,460 59,389
Other – 27,917
Total non-current trade and other payables 37,460 87,306
1. Terms of trade in relation to trade payables are, on average, 30 to 60 days from the date of invoice. The Group operates in a number of diverse markets and accordingly, the terms of trade vary by business.
2. Program contract creditors are settled according to the contract negotiated with the program supplier.
15. Other Intangible Assets (continued)
92 nine entertainment co.
For
per
sona
l use
onl
y
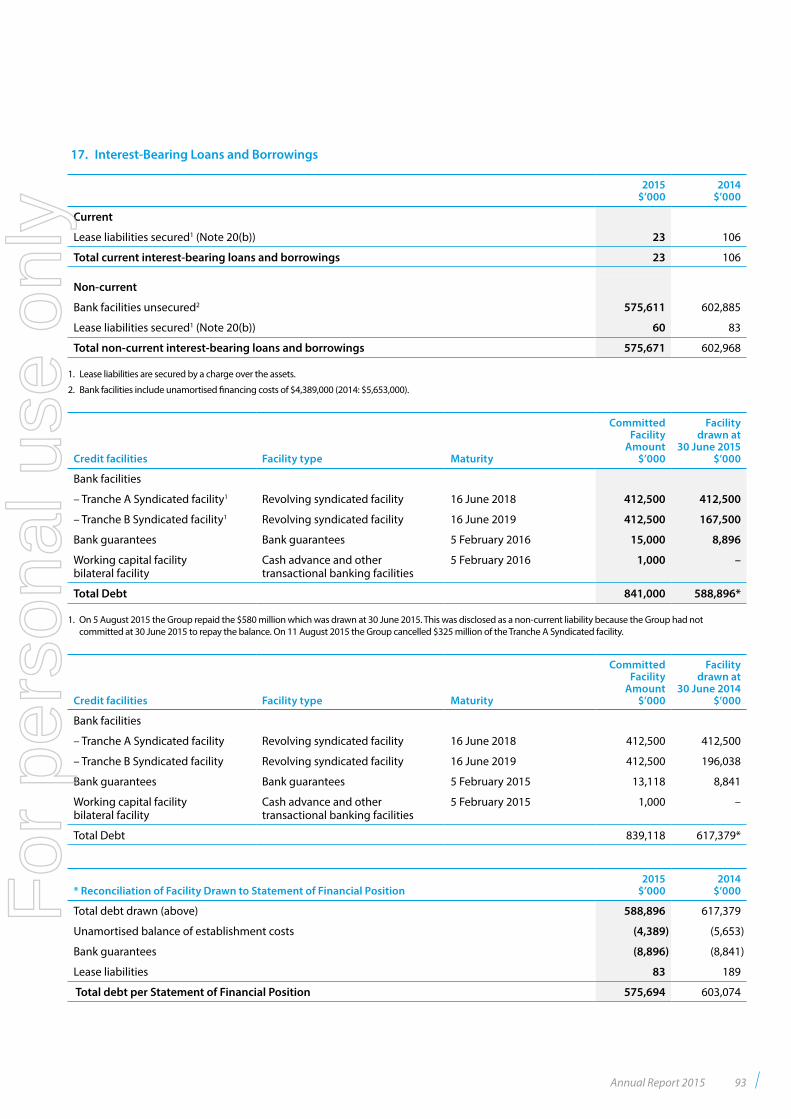
17. Interest-Bearing Loans and Borrowings
2015$’000
2014$’000
Current
Lease liabilities secured1 (Note 20(b)) 23 106
Total current interest-bearing loans and borrowings 23 106
Non-current
Bank facilities unsecured2 575,611 602,885
Lease liabilities secured1 (Note 20(b)) 60 83
Total non-current interest-bearing loans and borrowings 575,671 602,968
1. Lease liabilities are secured by a charge over the assets.
2. Bank facilities include unamortised financing costs of $4,389,000 (2014: $5,653,000).
Credit facilities Facility type Maturity
Committed Facility
Amount$’000
Facility drawn at
30 June 2015$’000
Bank facilities
– Tranche A Syndicated facility1 Revolving syndicated facility 16 June 2018 412,500 412,500
– Tranche B Syndicated facility1 Revolving syndicated facility 16 June 2019 412,500 167,500
Bank guarantees Bank guarantees 5 February 2016 15,000 8,896
Working capital facility bilateral facility
Cash advance and other transactional banking facilities
5 February 2016 1,000 –
Total Debt 841,000 588,896*
1. On 5 August 2015 the Group repaid the $580 million which was drawn at 30 June 2015. This was disclosed as a non-current liability because the Group had not committed at 30 June 2015 to repay the balance. On 11 August 2015 the Group cancelled $325 million of the Tranche A Syndicated facility.
Credit facilities Facility type Maturity
Committed Facility
Amount$’000
Facility drawn at
30 June 2014$’000
Bank facilities
– Tranche A Syndicated facility Revolving syndicated facility 16 June 2018 412,500 412,500
– Tranche B Syndicated facility Revolving syndicated facility 16 June 2019 412,500 196,038
Bank guarantees Bank guarantees 5 February 2015 13,118 8,841
Working capital facility bilateral facility
Cash advance and other transactional banking facilities
5 February 2015 1,000 –
Total Debt 839,118 617,379*
* Reconciliation of Facility Drawn to Statement of Financial Position2015
$’0002014
$’000
Total debt drawn (above) 588,896 617,379
Unamortised balance of establishment costs (4,389) (5,653)
Bank guarantees (8,896) (8,841)
Lease liabilities 83 189
Total debt per Statement of Financial Position 575,694 603,074
Annual Report 2015 93
For
per
sona
l use
onl
y
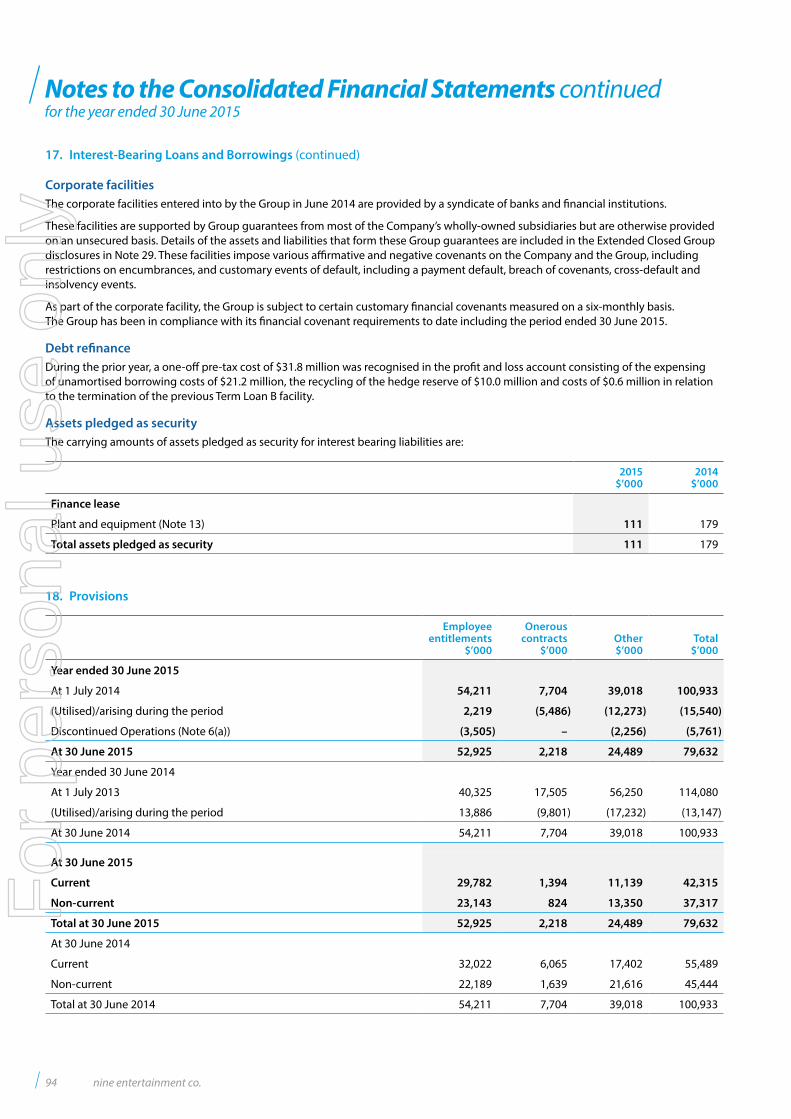
Notes to the Consolidated Financial Statements continuedfor the year ended 30 June 2015
Corporate facilitiesThe corporate facilities entered into by the Group in June 2014 are provided by a syndicate of banks and financial institutions.
These facilities are supported by Group guarantees from most of the Company’s wholly-owned subsidiaries but are otherwise provided on an unsecured basis. Details of the assets and liabilities that form these Group guarantees are included in the Extended Closed Group disclosures in Note 29. These facilities impose various affirmative and negative covenants on the Company and the Group, including restrictions on encumbrances, and customary events of default, including a payment default, breach of covenants, cross-default and insolvency events.
As part of the corporate facility, the Group is subject to certain customary financial covenants measured on a six-monthly basis. The Group has been in compliance with its financial covenant requirements to date including the period ended 30 June 2015.
Debt refinanceDuring the prior year, a one-off pre-tax cost of $31.8 million was recognised in the profit and loss account consisting of the expensing of unamortised borrowing costs of $21.2 million, the recycling of the hedge reserve of $10.0 million and costs of $0.6 million in relation to the termination of the previous Term Loan B facility.
Assets pledged as securityThe carrying amounts of assets pledged as security for interest bearing liabilities are:
2015$’000
2014$’000
Finance lease
Plant and equipment (Note 13) 111 179
Total assets pledged as security 111 179
18. Provisions
Employee entitlements
$’000
Onerous contracts
$’000Other$’000
Total$’000
Year ended 30 June 2015
At 1 July 2014 54,211 7,704 39,018 100,933
(Utilised)/arising during the period 2,219 (5,486) (12,273) (15,540)
Discontinued Operations (Note 6(a)) (3,505) – (2,256) (5,761)
At 30 June 2015 52,925 2,218 24,489 79,632
Year ended 30 June 2014
At 1 July 2013 40,325 17,505 56,250 114,080
(Utilised)/arising during the period 13,886 (9,801) (17,232) (13,147)
At 30 June 2014 54,211 7,704 39,018 100,933
At 30 June 2015
Current 29,782 1,394 11,139 42,315
Non-current 23,143 824 13,350 37,317
Total at 30 June 2015 52,925 2,218 24,489 79,632
At 30 June 2014
Current 32,022 6,065 17,402 55,489
Non-current 22,189 1,639 21,616 45,444
Total at 30 June 2014 54,211 7,704 39,018 100,933
17. Interest-Bearing Loans and Borrowings (continued)
94 nine entertainment co.
For
per
sona
l use
onl
y
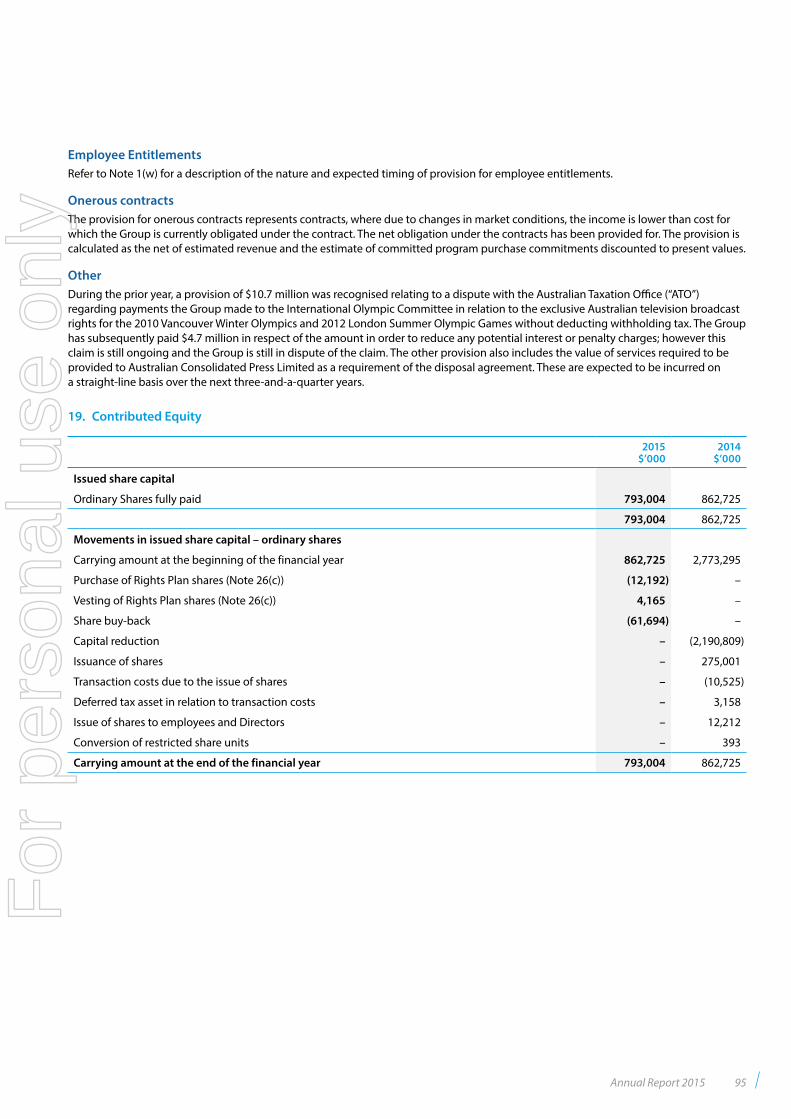
Employee EntitlementsRefer to Note 1(w) for a description of the nature and expected timing of provision for employee entitlements.
Onerous contractsThe provision for onerous contracts represents contracts, where due to changes in market conditions, the income is lower than cost for which the Group is currently obligated under the contract. The net obligation under the contracts has been provided for. The provision is calculated as the net of estimated revenue and the estimate of committed program purchase commitments discounted to present values.
Other During the prior year, a provision of $10.7 million was recognised relating to a dispute with the Australian Taxation Office (“ATO”) regarding payments the Group made to the International Olympic Committee in relation to the exclusive Australian television broadcast rights for the 2010 Vancouver Winter Olympics and 2012 London Summer Olympic Games without deducting withholding tax. The Group has subsequently paid $4.7 million in respect of the amount in order to reduce any potential interest or penalty charges; however this claim is still ongoing and the Group is still in dispute of the claim. The other provision also includes the value of services required to be provided to Australian Consolidated Press Limited as a requirement of the disposal agreement. These are expected to be incurred on a straight-line basis over the next three-and-a-quarter years.
19. Contributed Equity
2015$’000
2014$’000
Issued share capital
Ordinary Shares fully paid 793,004 862,725
793,004 862,725
Movements in issued share capital – ordinary shares
Carrying amount at the beginning of the financial year 862,725 2,773,295
Purchase of Rights Plan shares (Note 26(c)) (12,192) –
Vesting of Rights Plan shares (Note 26(c)) 4,165 –
Share buy-back (61,694) –
Capital reduction – (2,190,809)
Issuance of shares – 275,001
Transaction costs due to the issue of shares – (10,525)
Deferred tax asset in relation to transaction costs – 3,158
Issue of shares to employees and Directors – 12,212
Conversion of restricted share units – 393
Carrying amount at the end of the financial year 793,004 862,725
Annual Report 2015 95
For
per
sona
l use
onl
y
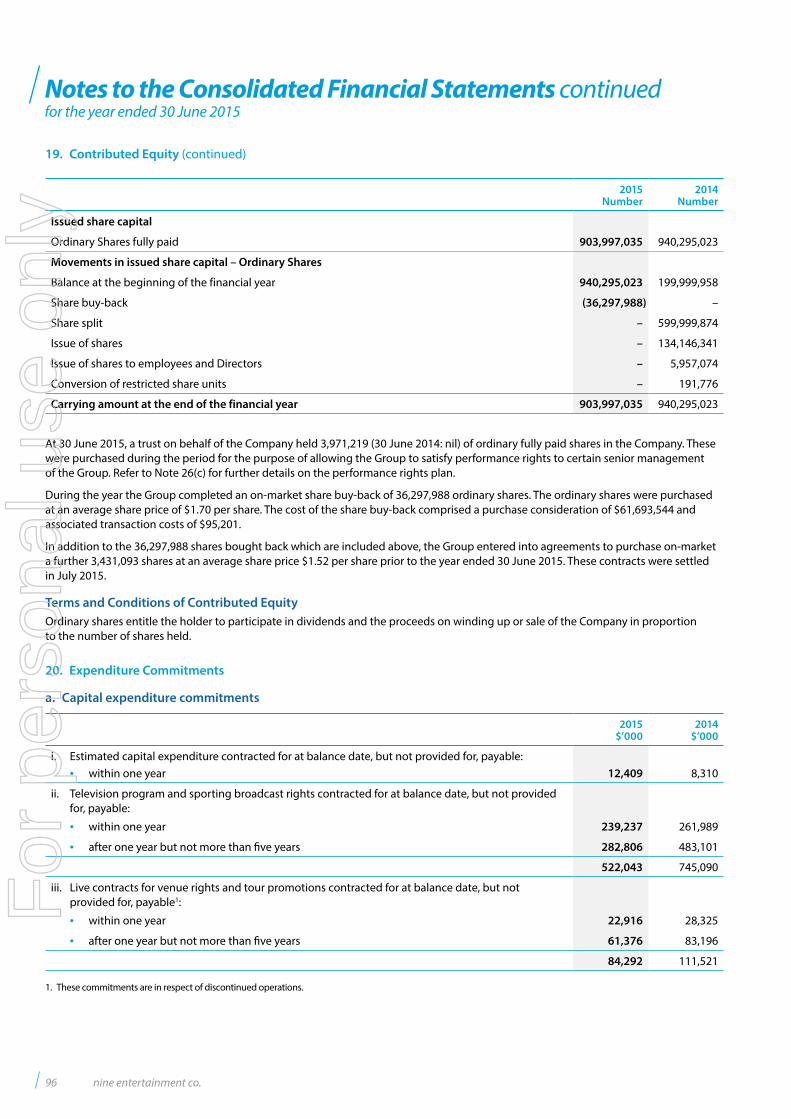
Notes to the Consolidated Financial Statements continuedfor the year ended 30 June 2015
2015Number
2014Number
Issued share capital
Ordinary Shares fully paid 903,997,035 940,295,023
Movements in issued share capital – Ordinary Shares
Balance at the beginning of the financial year 940,295,023 199,999,958
Share buy-back (36,297,988) –
Share split – 599,999,874
Issue of shares – 134,146,341
Issue of shares to employees and Directors – 5,957,074
Conversion of restricted share units – 191,776
Carrying amount at the end of the financial year 903,997,035 940,295,023
At 30 June 2015, a trust on behalf of the Company held 3,971,219 (30 June 2014: nil) of ordinary fully paid shares in the Company. These were purchased during the period for the purpose of allowing the Group to satisfy performance rights to certain senior management of the Group. Refer to Note 26(c) for further details on the performance rights plan.
During the year the Group completed an on-market share buy-back of 36,297,988 ordinary shares. The ordinary shares were purchased at an average share price of $1.70 per share. The cost of the share buy-back comprised a purchase consideration of $61,693,544 and associated transaction costs of $95,201.
In addition to the 36,297,988 shares bought back which are included above, the Group entered into agreements to purchase on-market a further 3,431,093 shares at an average share price $1.52 per share prior to the year ended 30 June 2015. These contracts were settled in July 2015.
Terms and Conditions of Contributed EquityOrdinary shares entitle the holder to participate in dividends and the proceeds on winding up or sale of the Company in proportion to the number of shares held.
20. Expenditure Commitments
a. Capital expenditure commitments
2015$’000
2014$’000
i. Estimated capital expenditure contracted for at balance date, but not provided for, payable: • within one year 12,409 8,310
ii. Television program and sporting broadcast rights contracted for at balance date, but not provided for, payable:
• within one year 239,237 261,989
• after one year but not more than five years 282,806 483,101
522,043 745,090
iii. Live contracts for venue rights and tour promotions contracted for at balance date, but not provided for, payable1:
• within one year 22,916 28,325
• after one year but not more than five years 61,376 83,196
84,292 111,521
1. These commitments are in respect of discontinued operations.
19. Contributed Equity (continued)
96 nine entertainment co.
For
per
sona
l use
onl
y
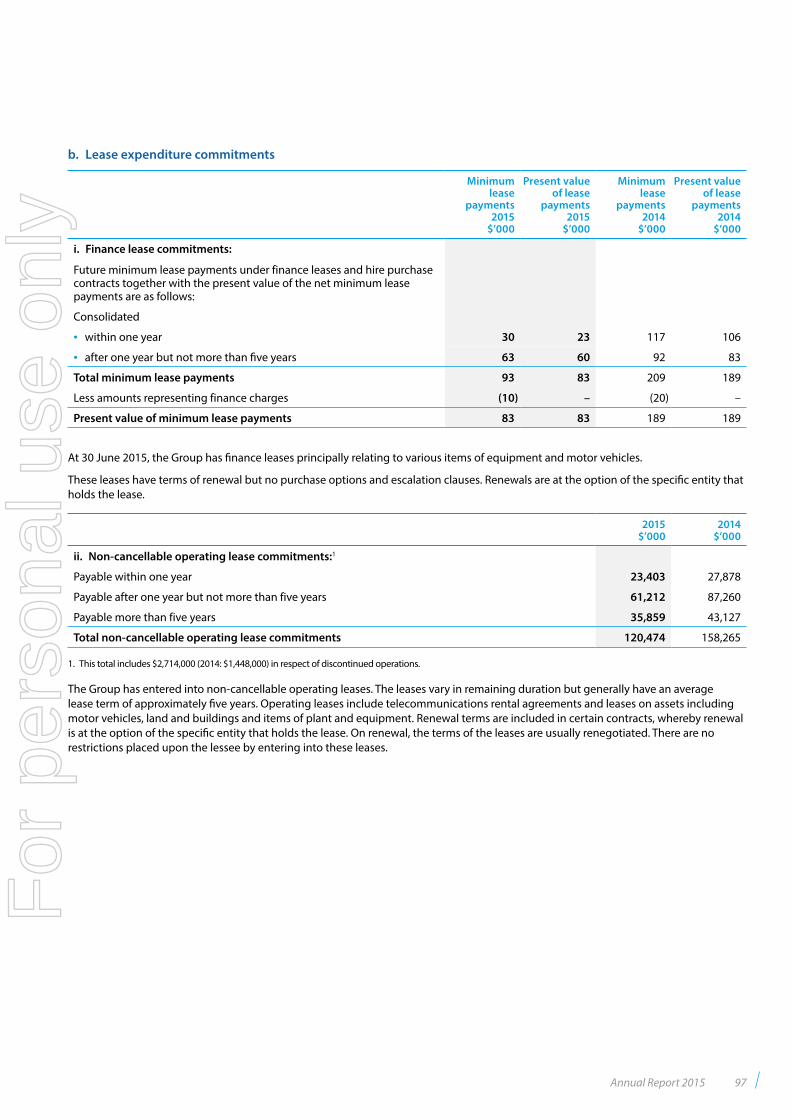
b. Lease expenditure commitments
Minimum lease
payments 2015
$’000
Present value of lease
payments2015
$’000
Minimum lease
payments 2014
$’000
Present value of lease
payments2014
$’000
i. Finance lease commitments:
Future minimum lease payments under finance leases and hire purchase contracts together with the present value of the net minimum lease payments are as follows:
Consolidated
• within one year 30 23 117 106
• after one year but not more than five years 63 60 92 83
Total minimum lease payments 93 83 209 189
Less amounts representing finance charges (10) – (20) –
Present value of minimum lease payments 83 83 189 189
At 30 June 2015, the Group has finance leases principally relating to various items of equipment and motor vehicles.
These leases have terms of renewal but no purchase options and escalation clauses. Renewals are at the option of the specific entity that holds the lease.
2015$’000
2014$’000
ii. Non-cancellable operating lease commitments:1
Payable within one year 23,403 27,878
Payable after one year but not more than five years 61,212 87,260
Payable more than five years 35,859 43,127
Total non-cancellable operating lease commitments 120,474 158,265
1. This total includes $2,714,000 (2014: $1,448,000) in respect of discontinued operations.
The Group has entered into non-cancellable operating leases. The leases vary in remaining duration but generally have an average lease term of approximately five years. Operating leases include telecommunications rental agreements and leases on assets including motor vehicles, land and buildings and items of plant and equipment. Renewal terms are included in certain contracts, whereby renewal is at the option of the specific entity that holds the lease. On renewal, the terms of the leases are usually renegotiated. There are no restrictions placed upon the lessee by entering into these leases.
Annual Report 2015 97
For
per
sona
l use
onl
y
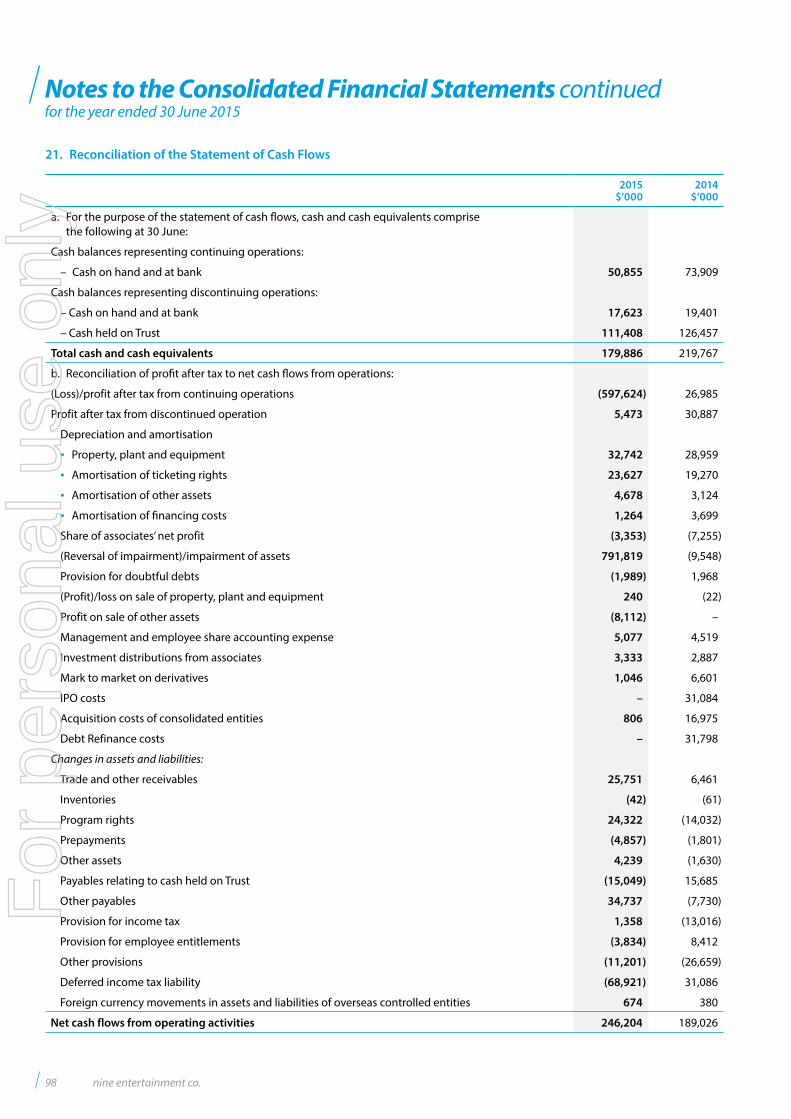
Notes to the Consolidated Financial Statements continuedfor the year ended 30 June 2015
21. Reconciliation of the Statement of Cash Flows
2015$’000
2014$’000
a. For the purpose of the statement of cash flows, cash and cash equivalents comprise the following at 30 June:
Cash balances representing continuing operations:
– Cash on hand and at bank 50,855 73,909
Cash balances representing discontinuing operations:
– Cash on hand and at bank 17,623 19,401
– Cash held on Trust 111,408 126,457
Total cash and cash equivalents 179,886 219,767
b. Reconciliation of profit after tax to net cash flows from operations:
(Loss)/profit after tax from continuing operations (597,624) 26,985
Profit after tax from discontinued operation 5,473 30,887
Depreciation and amortisation
• Property, plant and equipment 32,742 28,959
• Amortisation of ticketing rights 23,627 19,270
• Amortisation of other assets 4,678 3,124
• Amortisation of financing costs 1,264 3,699
Share of associates’ net profit (3,353) (7,255)
(Reversal of impairment)/impairment of assets 791,819 (9,548)
Provision for doubtful debts (1,989) 1,968
(Profit)/loss on sale of property, plant and equipment 240 (22)
Profit on sale of other assets (8,112) –
Management and employee share accounting expense 5,077 4,519
Investment distributions from associates 3,333 2,887
Mark to market on derivatives 1,046 6,601
IPO costs – 31,084
Acquisition costs of consolidated entities 806 16,975
Debt Refinance costs – 31,798
Changes in assets and liabilities:
Trade and other receivables 25,751 6,461
Inventories (42) (61)
Program rights 24,322 (14,032)
Prepayments (4,857) (1,801)
Other assets 4,239 (1,630)
Payables relating to cash held on Trust (15,049) 15,685
Other payables 34,737 (7,730)
Provision for income tax 1,358 (13,016)
Provision for employee entitlements (3,834) 8,412
Other provisions (11,201) (26,659)
Deferred income tax liability (68,921) 31,086
Foreign currency movements in assets and liabilities of overseas controlled entities 674 380
Net cash flows from operating activities 246,204 189,026
98 nine entertainment co.
For
per
sona
l use
onl
y
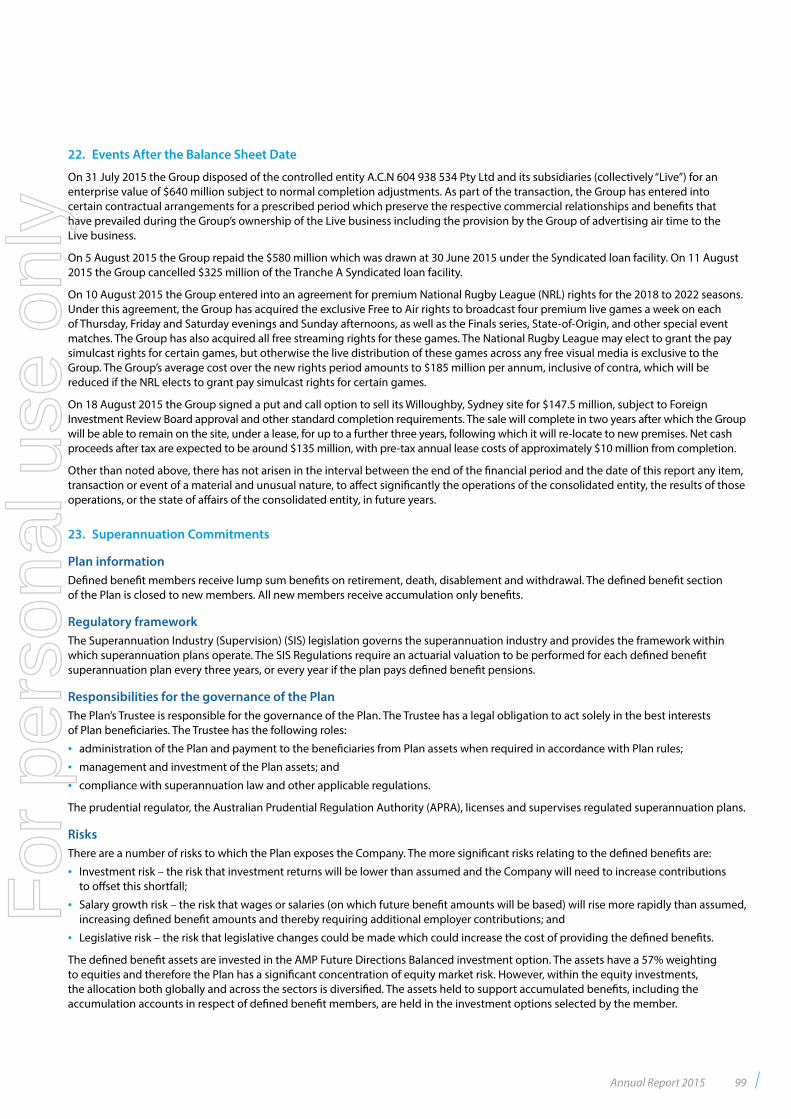
22. Events After the Balance Sheet Date
On 31 July 2015 the Group disposed of the controlled entity A.C.N 604 938 534 Pty Ltd and its subsidiaries (collectively “Live”) for an enterprise value of $640 million subject to normal completion adjustments. As part of the transaction, the Group has entered into certain contractual arrangements for a prescribed period which preserve the respective commercial relationships and benefits that have prevailed during the Group’s ownership of the Live business including the provision by the Group of advertising air time to the Live business.
On 5 August 2015 the Group repaid the $580 million which was drawn at 30 June 2015 under the Syndicated loan facility. On 11 August 2015 the Group cancelled $325 million of the Tranche A Syndicated loan facility.
On 10 August 2015 the Group entered into an agreement for premium National Rugby League (NRL) rights for the 2018 to 2022 seasons. Under this agreement, the Group has acquired the exclusive Free to Air rights to broadcast four premium live games a week on each of Thursday, Friday and Saturday evenings and Sunday afternoons, as well as the Finals series, State-of-Origin, and other special event matches. The Group has also acquired all free streaming rights for these games. The National Rugby League may elect to grant the pay simulcast rights for certain games, but otherwise the live distribution of these games across any free visual media is exclusive to the Group. The Group’s average cost over the new rights period amounts to $185 million per annum, inclusive of contra, which will be reduced if the NRL elects to grant pay simulcast rights for certain games.
On 18 August 2015 the Group signed a put and call option to sell its Willoughby, Sydney site for $147.5 million, subject to Foreign Investment Review Board approval and other standard completion requirements. The sale will complete in two years after which the Group will be able to remain on the site, under a lease, for up to a further three years, following which it will re-locate to new premises. Net cash proceeds after tax are expected to be around $135 million, with pre-tax annual lease costs of approximately $10 million from completion.
Other than noted above, there has not arisen in the interval between the end of the financial period and the date of this report any item, transaction or event of a material and unusual nature, to affect significantly the operations of the consolidated entity, the results of those operations, or the state of affairs of the consolidated entity, in future years.
23. Superannuation Commitments
Plan informationDefined benefit members receive lump sum benefits on retirement, death, disablement and withdrawal. The defined benefit section of the Plan is closed to new members. All new members receive accumulation only benefits.
Regulatory frameworkThe Superannuation Industry (Supervision) (SIS) legislation governs the superannuation industry and provides the framework within which superannuation plans operate. The SIS Regulations require an actuarial valuation to be performed for each defined benefit superannuation plan every three years, or every year if the plan pays defined benefit pensions.
Responsibilities for the governance of the PlanThe Plan’s Trustee is responsible for the governance of the Plan. The Trustee has a legal obligation to act solely in the best interests of Plan beneficiaries. The Trustee has the following roles:
• administration of the Plan and payment to the beneficiaries from Plan assets when required in accordance with Plan rules;
• management and investment of the Plan assets; and
• compliance with superannuation law and other applicable regulations.
The prudential regulator, the Australian Prudential Regulation Authority (APRA), licenses and supervises regulated superannuation plans.
RisksThere are a number of risks to which the Plan exposes the Company. The more significant risks relating to the defined benefits are:
• Investment risk – the risk that investment returns will be lower than assumed and the Company will need to increase contributions to offset this shortfall;
• Salary growth risk – the risk that wages or salaries (on which future benefit amounts will be based) will rise more rapidly than assumed, increasing defined benefit amounts and thereby requiring additional employer contributions; and
• Legislative risk – the risk that legislative changes could be made which could increase the cost of providing the defined benefits.
The defined benefit assets are invested in the AMP Future Directions Balanced investment option. The assets have a 57% weighting to equities and therefore the Plan has a significant concentration of equity market risk. However, within the equity investments, the allocation both globally and across the sectors is diversified. The assets held to support accumulated benefits, including the accumulation accounts in respect of defined benefit members, are held in the investment options selected by the member.
Annual Report 2015 99
For
per
sona
l use
onl
y
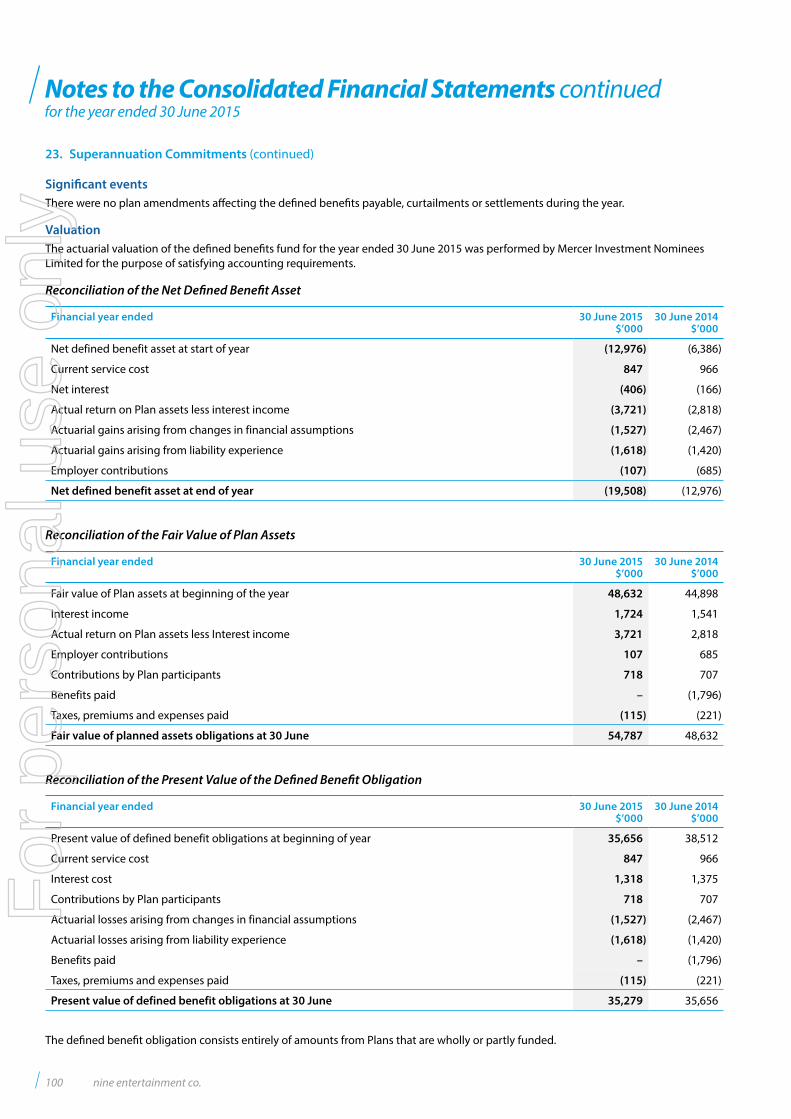
Notes to the Consolidated Financial Statements continuedfor the year ended 30 June 2015
Significant eventsThere were no plan amendments affecting the defined benefits payable, curtailments or settlements during the year.
ValuationThe actuarial valuation of the defined benefits fund for the year ended 30 June 2015 was performed by Mercer Investment Nominees Limited for the purpose of satisfying accounting requirements.
Reconciliation of the Net Defined Benefit Asset
Financial year ended 30 June 2015$’000
30 June 2014$’000
Net defined benefit asset at start of year (12,976) (6,386)
Current service cost 847 966
Net interest (406) (166)
Actual return on Plan assets less interest income (3,721) (2,818)
Actuarial gains arising from changes in financial assumptions (1,527) (2,467)
Actuarial gains arising from liability experience (1,618) (1,420)
Employer contributions (107) (685)
Net defined benefit asset at end of year (19,508) (12,976)
Reconciliation of the Fair Value of Plan Assets
Financial year ended 30 June 2015$’000
30 June 2014$’000
Fair value of Plan assets at beginning of the year 48,632 44,898
Interest income 1,724 1,541
Actual return on Plan assets less Interest income 3,721 2,818
Employer contributions 107 685
Contributions by Plan participants 718 707
Benefits paid – (1,796)
Taxes, premiums and expenses paid (115) (221)
Fair value of planned assets obligations at 30 June 54,787 48,632
Reconciliation of the Present Value of the Defined Benefit Obligation
Financial year ended 30 June 2015$’000
30 June 2014$’000
Present value of defined benefit obligations at beginning of year 35,656 38,512
Current service cost 847 966
Interest cost 1,318 1,375
Contributions by Plan participants 718 707
Actuarial losses arising from changes in financial assumptions (1,527) (2,467)
Actuarial losses arising from liability experience (1,618) (1,420)
Benefits paid – (1,796)
Taxes, premiums and expenses paid (115) (221)
Present value of defined benefit obligations at 30 June 35,279 35,656
The defined benefit obligation consists entirely of amounts from Plans that are wholly or partly funded.
23. Superannuation Commitments (continued)
100 nine entertainment co.
For
per
sona
l use
onl
y
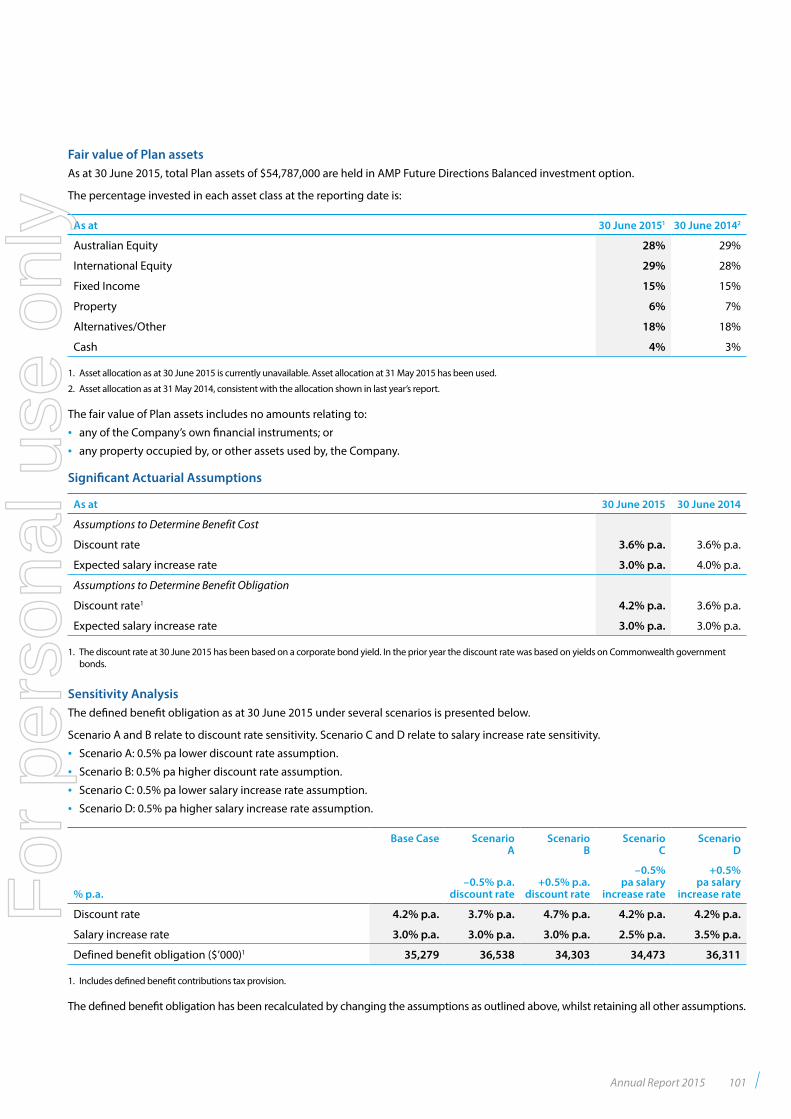
Fair value of Plan assetsAs at 30 June 2015, total Plan assets of $54,787,000 are held in AMP Future Directions Balanced investment option.
The percentage invested in each asset class at the reporting date is:
As at 30 June 20151 30 June 20142
Australian Equity 28% 29%
International Equity 29% 28%
Fixed Income 15% 15%
Property 6% 7%
Alternatives/Other 18% 18%
Cash 4% 3%
1. Asset allocation as at 30 June 2015 is currently unavailable. Asset allocation at 31 May 2015 has been used.
2. Asset allocation as at 31 May 2014, consistent with the allocation shown in last year’s report.
The fair value of Plan assets includes no amounts relating to:
• any of the Company’s own financial instruments; or
• any property occupied by, or other assets used by, the Company.
Significant Actuarial Assumptions
As at 30 June 2015 30 June 2014
Assumptions to Determine Benefit Cost
Discount rate 3.6% p.a. 3.6% p.a.
Expected salary increase rate 3.0% p.a. 4.0% p.a.
Assumptions to Determine Benefit Obligation
Discount rate1 4.2% p.a. 3.6% p.a.
Expected salary increase rate 3.0% p.a. 3.0% p.a.
1. The discount rate at 30 June 2015 has been based on a corporate bond yield. In the prior year the discount rate was based on yields on Commonwealth government bonds.
Sensitivity AnalysisThe defined benefit obligation as at 30 June 2015 under several scenarios is presented below.
Scenario A and B relate to discount rate sensitivity. Scenario C and D relate to salary increase rate sensitivity.
• Scenario A: 0.5% pa lower discount rate assumption.
• Scenario B: 0.5% pa higher discount rate assumption.
• Scenario C: 0.5% pa lower salary increase rate assumption.
• Scenario D: 0.5% pa higher salary increase rate assumption.
Base Case ScenarioA
ScenarioB
ScenarioC
ScenarioD
% p.a.–0.5% p.a.
discount rate+0.5% p.a.
discount rate
–0.5% pa salary
increase rate
+0.5% pa salary
increase rate
Discount rate 4.2% p.a. 3.7% p.a. 4.7% p.a. 4.2% p.a. 4.2% p.a.
Salary increase rate 3.0% p.a. 3.0% p.a. 3.0% p.a. 2.5% p.a. 3.5% p.a.
Defined benefit obligation ($’000)1 35,279 36,538 34,303 34,473 36,311
1. Includes defined benefit contributions tax provision.
The defined benefit obligation has been recalculated by changing the assumptions as outlined above, whilst retaining all other assumptions.
Annual Report 2015 101
For
per
sona
l use
onl
y
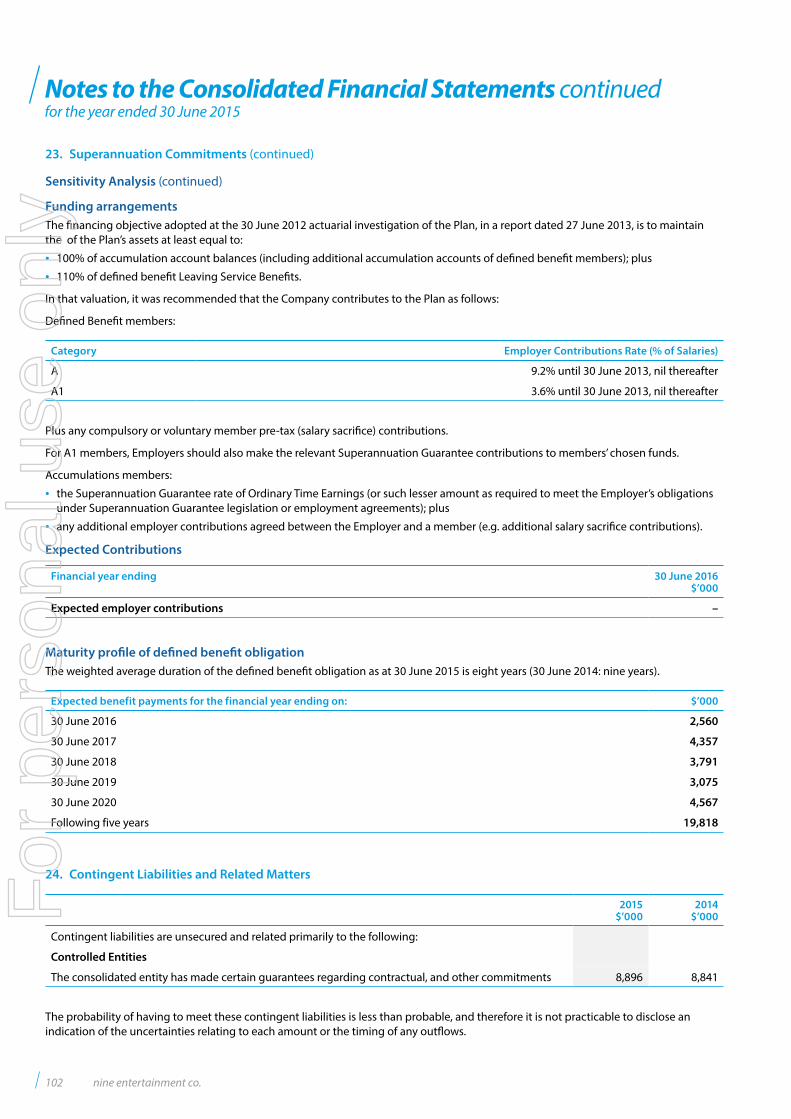
Notes to the Consolidated Financial Statements continuedfor the year ended 30 June 2015
Funding arrangementsThe financing objective adopted at the 30 June 2012 actuarial investigation of the Plan, in a report dated 27 June 2013, is to maintain the of the Plan’s assets at least equal to:
• 100% of accumulation account balances (including additional accumulation accounts of defined benefit members); plus
• 110% of defined benefit Leaving Service Benefits.
In that valuation, it was recommended that the Company contributes to the Plan as follows:
Defined Benefit members:
Category Employer Contributions Rate (% of Salaries)
A 9.2% until 30 June 2013, nil thereafter
A1 3.6% until 30 June 2013, nil thereafter
Plus any compulsory or voluntary member pre-tax (salary sacrifice) contributions.
For A1 members, Employers should also make the relevant Superannuation Guarantee contributions to members’ chosen funds.
Accumulations members:
• the Superannuation Guarantee rate of Ordinary Time Earnings (or such lesser amount as required to meet the Employer’s obligations under Superannuation Guarantee legislation or employment agreements); plus
• any additional employer contributions agreed between the Employer and a member (e.g. additional salary sacrifice contributions).
Expected Contributions
Financial year ending 30 June 2016$’000
Expected employer contributions –
Maturity profile of defined benefit obligationThe weighted average duration of the defined benefit obligation as at 30 June 2015 is eight years (30 June 2014: nine years).
Expected benefit payments for the financial year ending on: $’000
30 June 2016 2,560
30 June 2017 4,357
30 June 2018 3,791
30 June 2019 3,075
30 June 2020 4,567
Following five years 19,818
24. Contingent Liabilities and Related Matters
2015$’000
2014$’000
Contingent liabilities are unsecured and related primarily to the following:
Controlled Entities
The consolidated entity has made certain guarantees regarding contractual, and other commitments 8,896 8,841
The probability of having to meet these contingent liabilities is less than probable, and therefore it is not practicable to disclose an indication of the uncertainties relating to each amount or the timing of any outflows.
23. Superannuation Commitments (continued)
Sensitivity Analysis (continued)
102 nine entertainment co.
For
per
sona
l use
onl
y
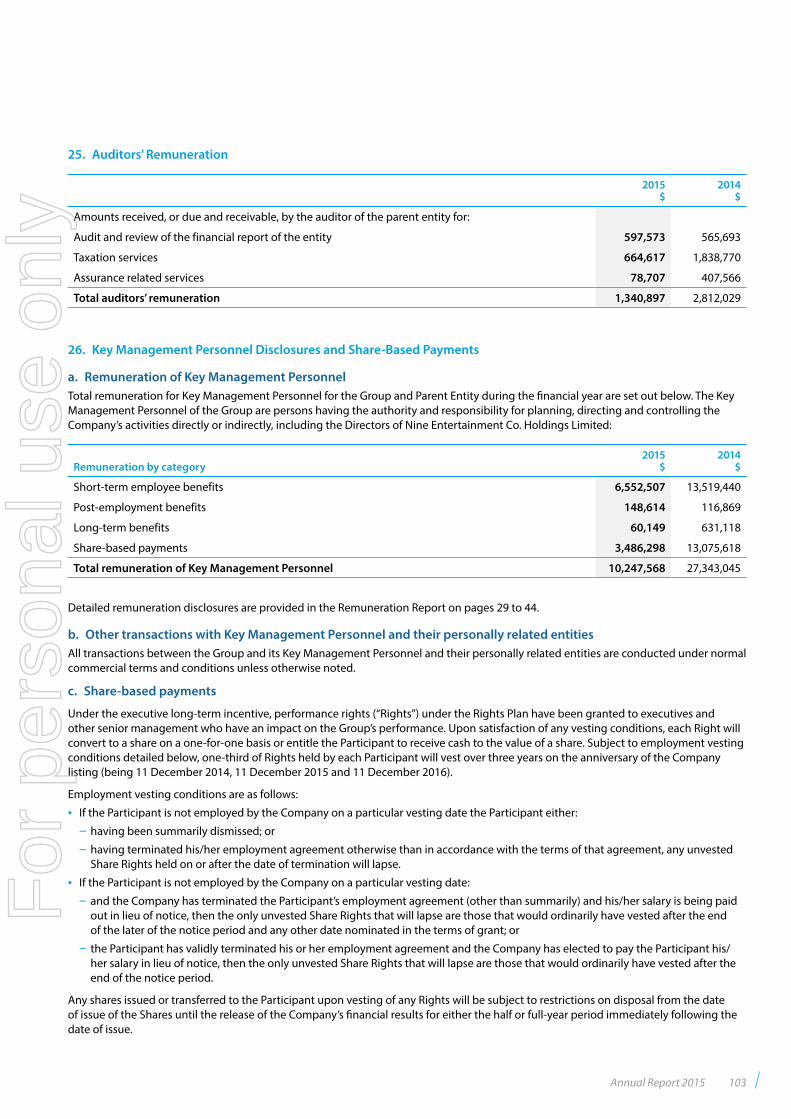
25. Auditors’ Remuneration
2015$
2014$
Amounts received, or due and receivable, by the auditor of the parent entity for:
Audit and review of the financial report of the entity 597,573 565,693
Taxation services 664,617 1,838,770
Assurance related services 78,707 407,566
Total auditors’ remuneration 1,340,897 2,812,029
26. Key Management Personnel Disclosures and Share-Based Payments
a. Remuneration of Key Management PersonnelTotal remuneration for Key Management Personnel for the Group and Parent Entity during the financial year are set out below. The Key Management Personnel of the Group are persons having the authority and responsibility for planning, directing and controlling the Company’s activities directly or indirectly, including the Directors of Nine Entertainment Co. Holdings Limited:
Remuneration by category2015
$2014
$
Short-term employee benefits 6,552,507 13,519,440
Post-employment benefits 148,614 116,869
Long-term benefits 60,149 631,118
Share-based payments 3,486,298 13,075,618
Total remuneration of Key Management Personnel 10,247,568 27,343,045
Detailed remuneration disclosures are provided in the Remuneration Report on pages 29 to 44.
b. Other transactions with Key Management Personnel and their personally related entitiesAll transactions between the Group and its Key Management Personnel and their personally related entities are conducted under normal commercial terms and conditions unless otherwise noted.
c. Share-based payments
Under the executive long-term incentive, performance rights (“Rights”) under the Rights Plan have been granted to executives and other senior management who have an impact on the Group’s performance. Upon satisfaction of any vesting conditions, each Right will convert to a share on a one-for-one basis or entitle the Participant to receive cash to the value of a share. Subject to employment vesting conditions detailed below, one-third of Rights held by each Participant will vest over three years on the anniversary of the Company listing (being 11 December 2014, 11 December 2015 and 11 December 2016).
Employment vesting conditions are as follows:
• If the Participant is not employed by the Company on a particular vesting date the Participant either:
– having been summarily dismissed; or
– having terminated his/her employment agreement otherwise than in accordance with the terms of that agreement, any unvested Share Rights held on or after the date of termination will lapse.
• If the Participant is not employed by the Company on a particular vesting date:
– and the Company has terminated the Participant’s employment agreement (other than summarily) and his/her salary is being paid out in lieu of notice, then the only unvested Share Rights that will lapse are those that would ordinarily have vested after the end of the later of the notice period and any other date nominated in the terms of grant; or
– the Participant has validly terminated his or her employment agreement and the Company has elected to pay the Participant his/her salary in lieu of notice, then the only unvested Share Rights that will lapse are those that would ordinarily have vested after the end of the notice period.
Any shares issued or transferred to the Participant upon vesting of any Rights will be subject to restrictions on disposal from the date of issue of the Shares until the release of the Company’s financial results for either the half or full-year period immediately following the date of issue.
Annual Report 2015 103
For
per
sona
l use
onl
y
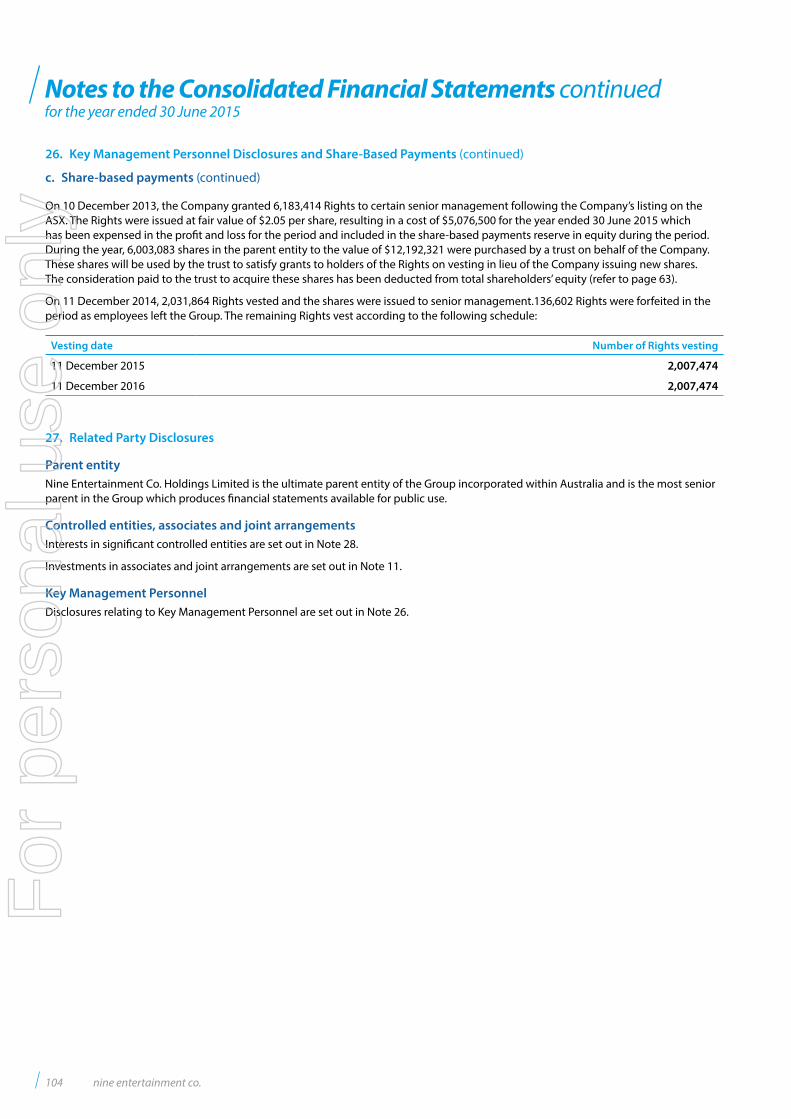
Notes to the Consolidated Financial Statements continuedfor the year ended 30 June 2015
On 10 December 2013, the Company granted 6,183,414 Rights to certain senior management following the Company’s listing on the ASX. The Rights were issued at fair value of $2.05 per share, resulting in a cost of $5,076,500 for the year ended 30 June 2015 which has been expensed in the profit and loss for the period and included in the share-based payments reserve in equity during the period. During the year, 6,003,083 shares in the parent entity to the value of $12,192,321 were purchased by a trust on behalf of the Company. These shares will be used by the trust to satisfy grants to holders of the Rights on vesting in lieu of the Company issuing new shares. The consideration paid to the trust to acquire these shares has been deducted from total shareholders’ equity (refer to page 63).
On 11 December 2014, 2,031,864 Rights vested and the shares were issued to senior management.136,602 Rights were forfeited in the period as employees left the Group. The remaining Rights vest according to the following schedule:
Vesting date Number of Rights vesting
11 December 2015 2,007,474
11 December 2016 2,007,474
27. Related Party Disclosures
Parent entityNine Entertainment Co. Holdings Limited is the ultimate parent entity of the Group incorporated within Australia and is the most senior parent in the Group which produces financial statements available for public use.
Controlled entities, associates and joint arrangementsInterests in significant controlled entities are set out in Note 28.
Investments in associates and joint arrangements are set out in Note 11.
Key Management PersonnelDisclosures relating to Key Management Personnel are set out in Note 26.
26. Key Management Personnel Disclosures and Share-Based Payments (continued)
c. Share-based payments (continued)
104 nine entertainment co.
For
per
sona
l use
onl
y
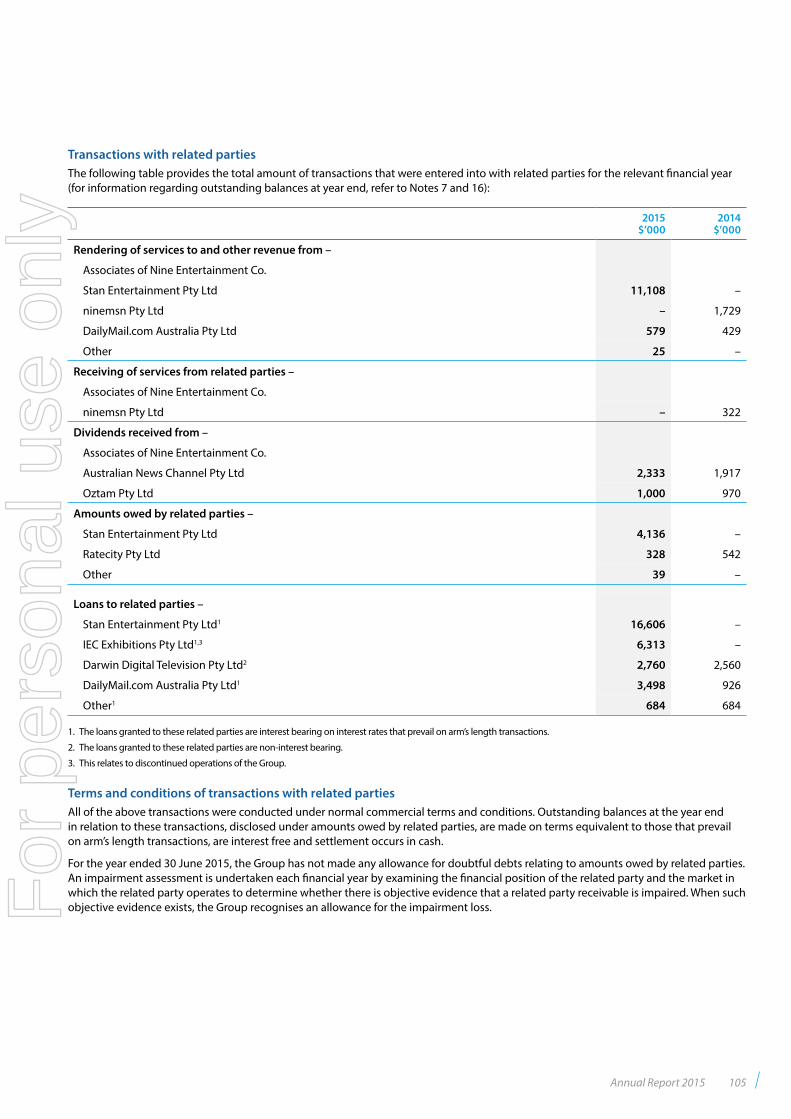
Transactions with related parties The following table provides the total amount of transactions that were entered into with related parties for the relevant financial year (for information regarding outstanding balances at year end, refer to Notes 7 and 16):
2015$’000
2014$’000
Rendering of services to and other revenue from –
Associates of Nine Entertainment Co.
Stan Entertainment Pty Ltd 11,108 –
ninemsn Pty Ltd – 1,729
DailyMail.com Australia Pty Ltd 579 429
Other 25 –
Receiving of services from related parties –
Associates of Nine Entertainment Co.
ninemsn Pty Ltd – 322
Dividends received from –
Associates of Nine Entertainment Co.
Australian News Channel Pty Ltd 2,333 1,917
Oztam Pty Ltd 1,000 970
Amounts owed by related parties –
Stan Entertainment Pty Ltd 4,136 –
Ratecity Pty Ltd 328 542
Other 39 –
Loans to related parties –
Stan Entertainment Pty Ltd1 16,606 –
IEC Exhibitions Pty Ltd1,3 6,313 –
Darwin Digital Television Pty Ltd2 2,760 2,560
DailyMail.com Australia Pty Ltd1 3,498 926
Other1 684 684
1. The loans granted to these related parties are interest bearing on interest rates that prevail on arm’s length transactions.
2. The loans granted to these related parties are non-interest bearing.
3. This relates to discontinued operations of the Group.
Terms and conditions of transactions with related partiesAll of the above transactions were conducted under normal commercial terms and conditions. Outstanding balances at the year end in relation to these transactions, disclosed under amounts owed by related parties, are made on terms equivalent to those that prevail on arm’s length transactions, are interest free and settlement occurs in cash.
For the year ended 30 June 2015, the Group has not made any allowance for doubtful debts relating to amounts owed by related parties. An impairment assessment is undertaken each financial year by examining the financial position of the related party and the market in which the related party operates to determine whether there is objective evidence that a related party receivable is impaired. When such objective evidence exists, the Group recognises an allowance for the impairment loss.
Annual Report 2015 105
For
per
sona
l use
onl
y
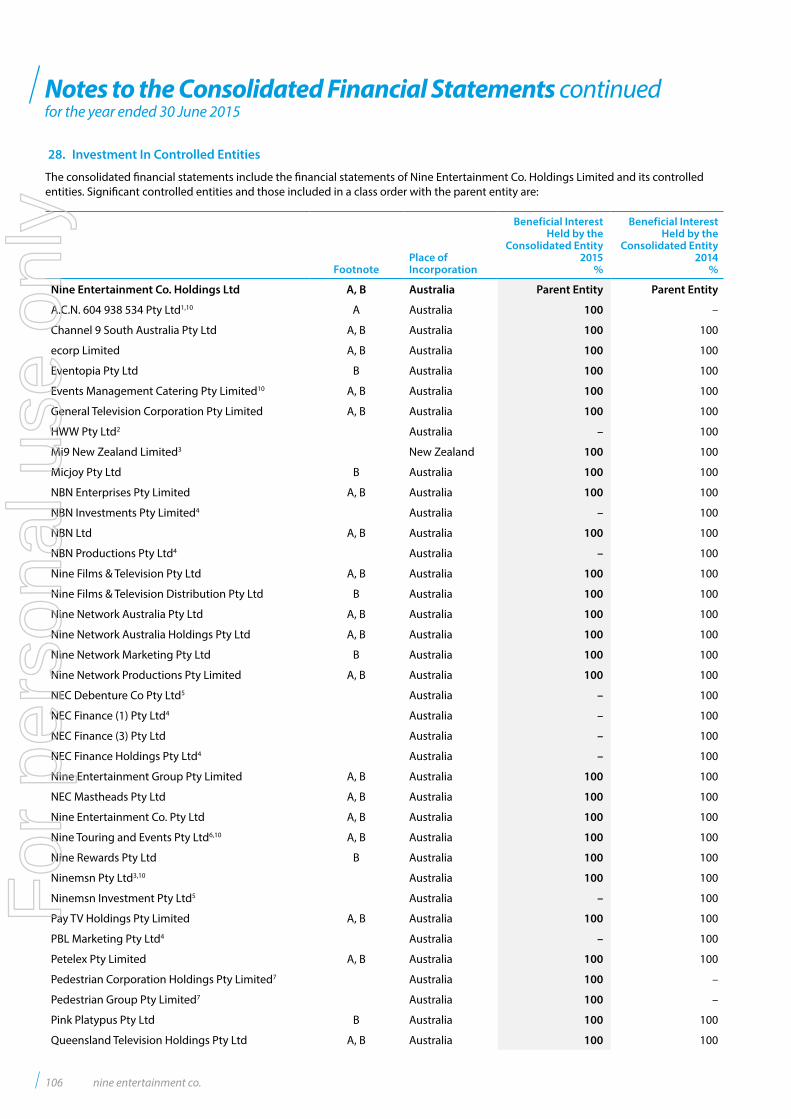
Notes to the Consolidated Financial Statements continuedfor the year ended 30 June 2015
28. Investment In Controlled Entities
The consolidated financial statements include the financial statements of Nine Entertainment Co. Holdings Limited and its controlled entities. Significant controlled entities and those included in a class order with the parent entity are:
FootnotePlace ofIncorporation
Beneficial Interest Held by the
Consolidated Entity2015
%
Beneficial Interest Held by the
Consolidated Entity2014
%
Nine Entertainment Co. Holdings Ltd A, B Australia Parent Entity Parent Entity
A.C.N. 604 938 534 Pty Ltd1,10 A Australia 100 –
Channel 9 South Australia Pty Ltd A, B Australia 100 100
ecorp Limited A, B Australia 100 100
Eventopia Pty Ltd B Australia 100 100
Events Management Catering Pty Limited10 A, B Australia 100 100
General Television Corporation Pty Limited A, B Australia 100 100
HWW Pty Ltd2 Australia – 100
Mi9 New Zealand Limited3 New Zealand 100 100
Micjoy Pty Ltd B Australia 100 100
NBN Enterprises Pty Limited A, B Australia 100 100
NBN Investments Pty Limited4 Australia – 100
NBN Ltd A, B Australia 100 100
NBN Productions Pty Ltd4 Australia – 100
Nine Films & Television Pty Ltd A, B Australia 100 100
Nine Films & Television Distribution Pty Ltd B Australia 100 100
Nine Network Australia Pty Ltd A, B Australia 100 100
Nine Network Australia Holdings Pty Ltd A, B Australia 100 100
Nine Network Marketing Pty Ltd B Australia 100 100
Nine Network Productions Pty Limited A, B Australia 100 100
NEC Debenture Co Pty Ltd5 Australia – 100
NEC Finance (1) Pty Ltd4 Australia – 100
NEC Finance (3) Pty Ltd Australia – 100
NEC Finance Holdings Pty Ltd4 Australia – 100
Nine Entertainment Group Pty Limited A, B Australia 100 100
NEC Mastheads Pty Ltd A, B Australia 100 100
Nine Entertainment Co. Pty Ltd A, B Australia 100 100
Nine Touring and Events Pty Ltd6,10 A, B Australia 100 100
Nine Rewards Pty Ltd B Australia 100 100
Ninemsn Pty Ltd3,10 Australia 100 100
Ninemsn Investment Pty Ltd5 Australia – 100
Pay TV Holdings Pty Limited A, B Australia 100 100
PBL Marketing Pty Ltd4 Australia – 100
Petelex Pty Limited A, B Australia 100 100
Pedestrian Corporation Holdings Pty Limited7 Australia 100 –
Pedestrian Group Pty Limited7 Australia 100 –
Pink Platypus Pty Ltd B Australia 100 100
Queensland Television Holdings Pty Ltd A, B Australia 100 100
106 nine entertainment co.
For
per
sona
l use
onl
y
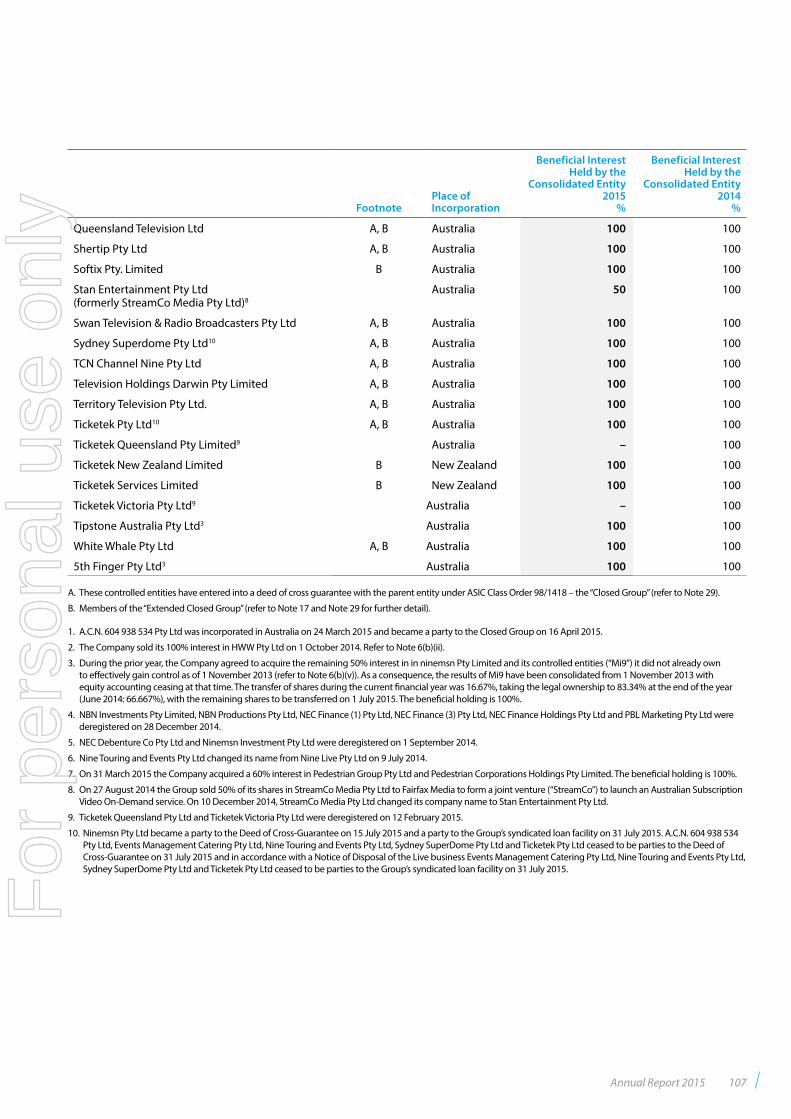
FootnotePlace ofIncorporation
Beneficial Interest Held by the
Consolidated Entity2015
%
Beneficial Interest Held by the
Consolidated Entity2014
%
Queensland Television Ltd A, B Australia 100 100
Shertip Pty Ltd A, B Australia 100 100
Softix Pty. Limited B Australia 100 100
Stan Entertainment Pty Ltd(formerly StreamCo Media Pty Ltd)8
Australia 50 100
Swan Television & Radio Broadcasters Pty Ltd A, B Australia 100 100
Sydney Superdome Pty Ltd10 A, B Australia 100 100
TCN Channel Nine Pty Ltd A, B Australia 100 100
Television Holdings Darwin Pty Limited A, B Australia 100 100
Territory Television Pty Ltd. A, B Australia 100 100
Ticketek Pty Ltd10 A, B Australia 100 100
Ticketek Queensland Pty Limited9 Australia – 100
Ticketek New Zealand Limited B New Zealand 100 100
Ticketek Services Limited B New Zealand 100 100
Ticketek Victoria Pty Ltd9 Australia – 100
Tipstone Australia Pty Ltd3 Australia 100 100
White Whale Pty Ltd A, B Australia 100 100
5th Finger Pty Ltd3 Australia 100 100
A. These controlled entities have entered into a deed of cross guarantee with the parent entity under ASIC Class Order 98/1418 – the “Closed Group” (refer to Note 29).
B. Members of the “Extended Closed Group” (refer to Note 17 and Note 29 for further detail).
1. A.C.N. 604 938 534 Pty Ltd was incorporated in Australia on 24 March 2015 and became a party to the Closed Group on 16 April 2015.
2. The Company sold its 100% interest in HWW Pty Ltd on 1 October 2014. Refer to Note 6(b)(ii).
3. During the prior year, the Company agreed to acquire the remaining 50% interest in in ninemsn Pty Limited and its controlled entities (“Mi9”) it did not already own to effectively gain control as of 1 November 2013 (refer to Note 6(b)(v)). As a consequence, the results of Mi9 have been consolidated from 1 November 2013 with equity accounting ceasing at that time. The transfer of shares during the current financial year was 16.67%, taking the legal ownership to 83.34% at the end of the year (June 2014: 66.667%), with the remaining shares to be transferred on 1 July 2015. The beneficial holding is 100%.
4. NBN Investments Pty Limited, NBN Productions Pty Ltd, NEC Finance (1) Pty Ltd, NEC Finance (3) Pty Ltd, NEC Finance Holdings Pty Ltd and PBL Marketing Pty Ltd were deregistered on 28 December 2014.
5. NEC Debenture Co Pty Ltd and Ninemsn Investment Pty Ltd were deregistered on 1 September 2014.
6. Nine Touring and Events Pty Ltd changed its name from Nine Live Pty Ltd on 9 July 2014.
7. On 31 March 2015 the Company acquired a 60% interest in Pedestrian Group Pty Ltd and Pedestrian Corporations Holdings Pty Limited. The beneficial holding is 100%.
8. On 27 August 2014 the Group sold 50% of its shares in StreamCo Media Pty Ltd to Fairfax Media to form a joint venture (“StreamCo”) to launch an Australian Subscription Video On-Demand service. On 10 December 2014, StreamCo Media Pty Ltd changed its company name to Stan Entertainment Pty Ltd.
9. Ticketek Queensland Pty Ltd and Ticketek Victoria Pty Ltd were deregistered on 12 February 2015.
10. Ninemsn Pty Ltd became a party to the Deed of Cross-Guarantee on 15 July 2015 and a party to the Group’s syndicated loan facility on 31 July 2015. A.C.N. 604 938 534 Pty Ltd, Events Management Catering Pty Ltd, Nine Touring and Events Pty Ltd, Sydney SuperDome Pty Ltd and Ticketek Pty Ltd ceased to be parties to the Deed of Cross-Guarantee on 31 July 2015 and in accordance with a Notice of Disposal of the Live business Events Management Catering Pty Ltd, Nine Touring and Events Pty Ltd, Sydney SuperDome Pty Ltd and Ticketek Pty Ltd ceased to be parties to the Group’s syndicated loan facility on 31 July 2015.
Annual Report 2015 107
For
per
sona
l use
onl
y
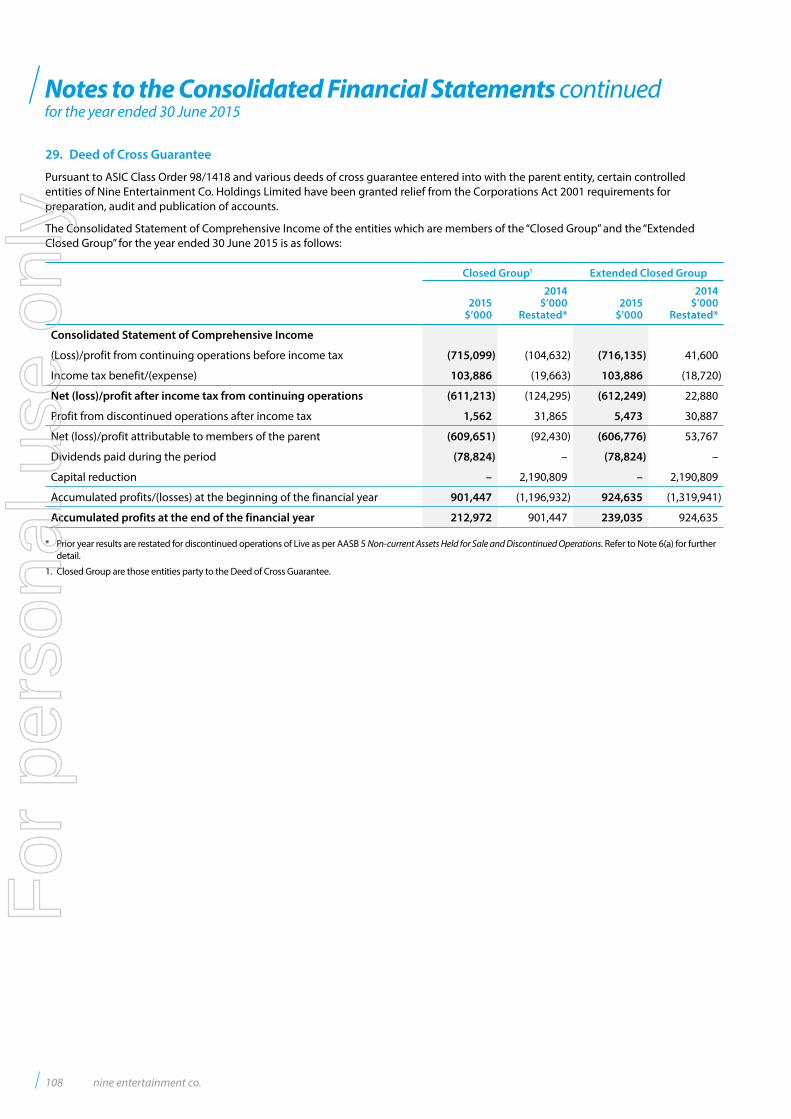
Notes to the Consolidated Financial Statements continuedfor the year ended 30 June 2015
29. Deed of Cross Guarantee
Pursuant to ASIC Class Order 98/1418 and various deeds of cross guarantee entered into with the parent entity, certain controlled entities of Nine Entertainment Co. Holdings Limited have been granted relief from the Corporations Act 2001 requirements for preparation, audit and publication of accounts.
The Consolidated Statement of Comprehensive Income of the entities which are members of the “Closed Group” and the “Extended Closed Group” for the year ended 30 June 2015 is as follows:
Closed Group1 Extended Closed Group
2015$’000
2014$’000
Restated*2015
$’000
2014$’000
Restated*
Consolidated Statement of Comprehensive Income
(Loss)/profit from continuing operations before income tax (715,099) (104,632) (716,135) 41,600
Income tax benefit/(expense) 103,886 (19,663) 103,886 (18,720)
Net (loss)/profit after income tax from continuing operations (611,213) (124,295) (612,249) 22,880
Profit from discontinued operations after income tax 1,562 31,865 5,473 30,887
Net (loss)/profit attributable to members of the parent (609,651) (92,430) (606,776) 53,767
Dividends paid during the period (78,824) – (78,824) –
Capital reduction – 2,190,809 – 2,190,809
Accumulated profits/(losses) at the beginning of the financial year 901,447 (1,196,932) 924,635 (1,319,941)
Accumulated profits at the end of the financial year 212,972 901,447 239,035 924,635
* Prior year results are restated for discontinued operations of Live as per AASB 5 Non-current Assets Held for Sale and Discontinued Operations. Refer to Note 6(a) for further detail.
1. Closed Group are those entities party to the Deed of Cross Guarantee.
108 nine entertainment co.
For
per
sona
l use
onl
y
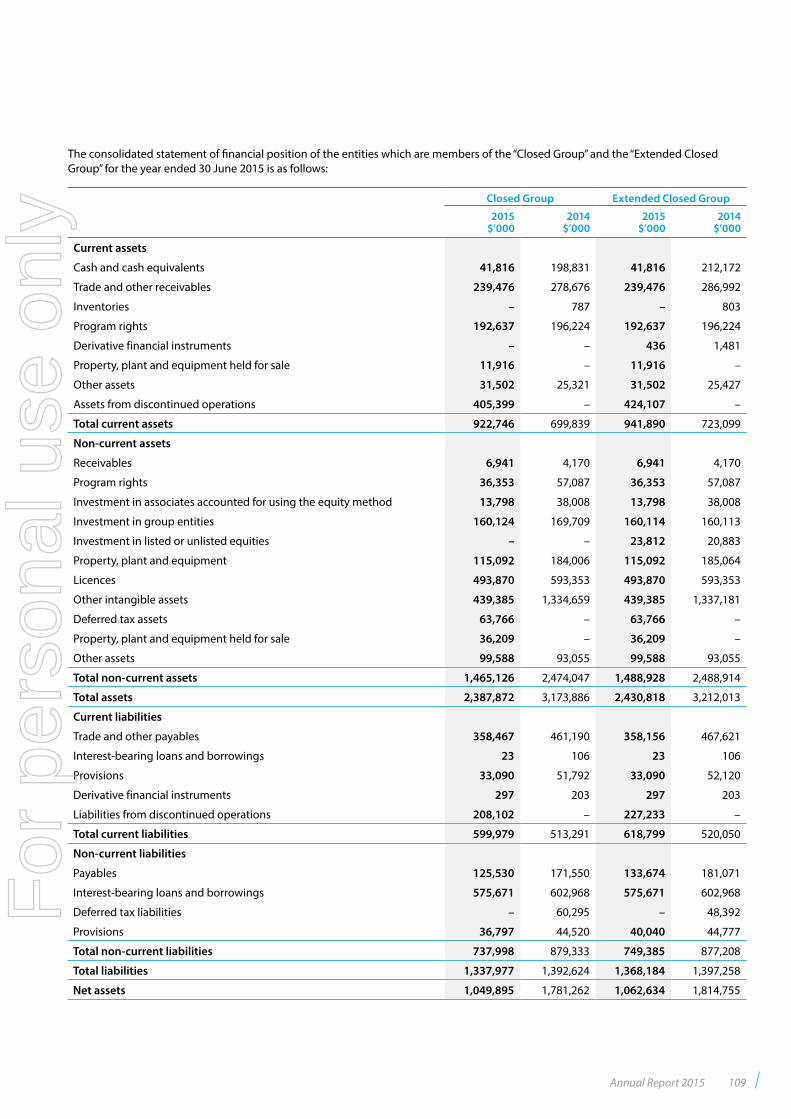
The consolidated statement of financial position of the entities which are members of the “Closed Group” and the “Extended Closed Group” for the year ended 30 June 2015 is as follows:
Closed Group Extended Closed Group
2015$’000
2014$’000
2015$’000
2014$’000
Current assets
Cash and cash equivalents 41,816 198,831 41,816 212,172
Trade and other receivables 239,476 278,676 239,476 286,992
Inventories – 787 – 803
Program rights 192,637 196,224 192,637 196,224
Derivative financial instruments – – 436 1,481
Property, plant and equipment held for sale 11,916 – 11,916 –
Other assets 31,502 25,321 31,502 25,427
Assets from discontinued operations 405,399 – 424,107 –
Total current assets 922,746 699,839 941,890 723,099
Non-current assets
Receivables 6,941 4,170 6,941 4,170
Program rights 36,353 57,087 36,353 57,087
Investment in associates accounted for using the equity method 13,798 38,008 13,798 38,008
Investment in group entities 160,124 169,709 160,114 160,113
Investment in listed or unlisted equities – – 23,812 20,883
Property, plant and equipment 115,092 184,006 115,092 185,064
Licences 493,870 593,353 493,870 593,353
Other intangible assets 439,385 1,334,659 439,385 1,337,181
Deferred tax assets 63,766 – 63,766 –
Property, plant and equipment held for sale 36,209 – 36,209 –
Other assets 99,588 93,055 99,588 93,055
Total non-current assets 1,465,126 2,474,047 1,488,928 2,488,914
Total assets 2,387,872 3,173,886 2,430,818 3,212,013
Current liabilities
Trade and other payables 358,467 461,190 358,156 467,621
Interest-bearing loans and borrowings 23 106 23 106
Provisions 33,090 51,792 33,090 52,120
Derivative financial instruments 297 203 297 203
Liabilities from discontinued operations 208,102 – 227,233 –
Total current liabilities 599,979 513,291 618,799 520,050
Non-current liabilities
Payables 125,530 171,550 133,674 181,071
Interest-bearing loans and borrowings 575,671 602,968 575,671 602,968
Deferred tax liabilities – 60,295 – 48,392
Provisions 36,797 44,520 40,040 44,777
Total non-current liabilities 737,998 879,333 749,385 877,208
Total liabilities 1,337,977 1,392,624 1,368,184 1,397,258
Net assets 1,049,895 1,781,262 1,062,634 1,814,755
Annual Report 2015 109
For
per
sona
l use
onl
y
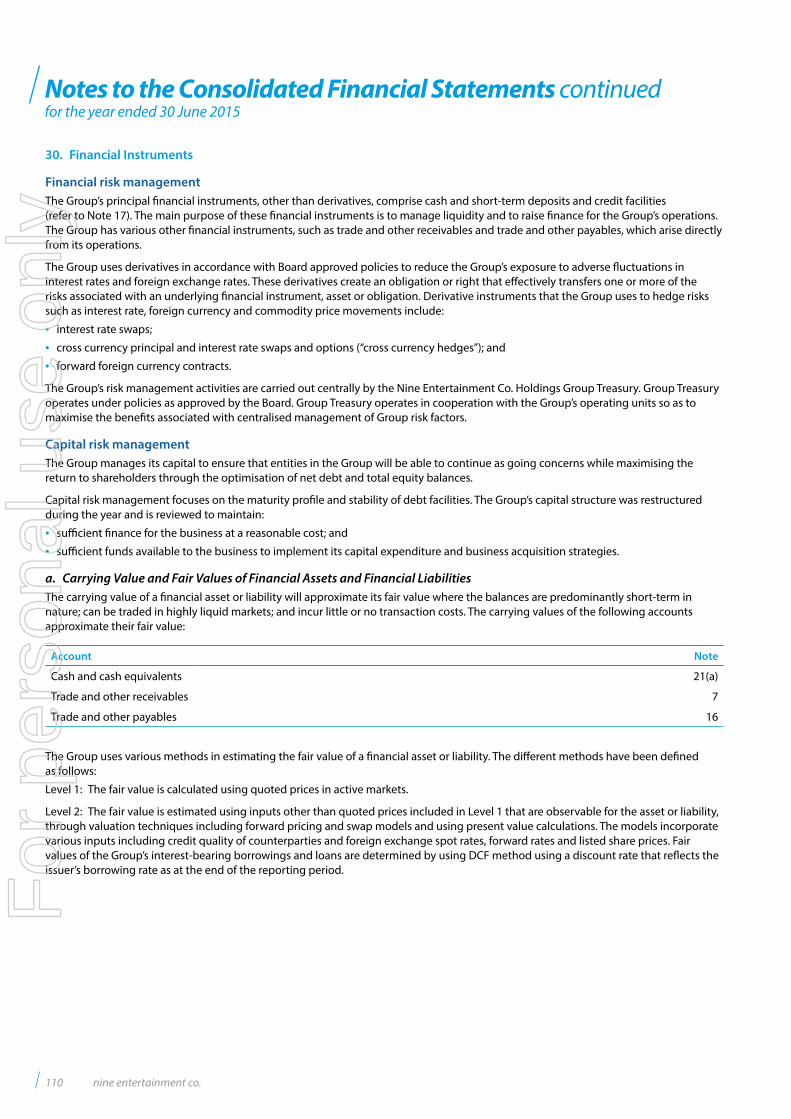
Notes to the Consolidated Financial Statements continuedfor the year ended 30 June 2015
30. Financial Instruments
Financial risk managementThe Group’s principal financial instruments, other than derivatives, comprise cash and short-term deposits and credit facilities (refer to Note 17). The main purpose of these financial instruments is to manage liquidity and to raise finance for the Group’s operations. The Group has various other financial instruments, such as trade and other receivables and trade and other payables, which arise directly from its operations.
The Group uses derivatives in accordance with Board approved policies to reduce the Group’s exposure to adverse fluctuations in interest rates and foreign exchange rates. These derivatives create an obligation or right that effectively transfers one or more of the risks associated with an underlying financial instrument, asset or obligation. Derivative instruments that the Group uses to hedge risks such as interest rate, foreign currency and commodity price movements include:
• interest rate swaps;
• cross currency principal and interest rate swaps and options (“cross currency hedges”); and
• forward foreign currency contracts.
The Group’s risk management activities are carried out centrally by the Nine Entertainment Co. Holdings Group Treasury. Group Treasury operates under policies as approved by the Board. Group Treasury operates in cooperation with the Group’s operating units so as to maximise the benefits associated with centralised management of Group risk factors.
Capital risk managementThe Group manages its capital to ensure that entities in the Group will be able to continue as going concerns while maximising the return to shareholders through the optimisation of net debt and total equity balances.
Capital risk management focuses on the maturity profile and stability of debt facilities. The Group’s capital structure was restructured during the year and is reviewed to maintain:
• sufficient finance for the business at a reasonable cost; and
• sufficient funds available to the business to implement its capital expenditure and business acquisition strategies.
a. Carrying Value and Fair Values of Financial Assets and Financial Liabilities The carrying value of a financial asset or liability will approximate its fair value where the balances are predominantly short-term in nature; can be traded in highly liquid markets; and incur little or no transaction costs. The carrying values of the following accounts approximate their fair value:
Account Note
Cash and cash equivalents 21(a)
Trade and other receivables 7
Trade and other payables 16
The Group uses various methods in estimating the fair value of a financial asset or liability. The different methods have been defined as follows:
Level 1: The fair value is calculated using quoted prices in active markets.
Level 2: The fair value is estimated using inputs other than quoted prices included in Level 1 that are observable for the asset or liability, through valuation techniques including forward pricing and swap models and using present value calculations. The models incorporate various inputs including credit quality of counterparties and foreign exchange spot rates, forward rates and listed share prices. Fair values of the Group’s interest-bearing borrowings and loans are determined by using DCF method using a discount rate that reflects the issuer’s borrowing rate as at the end of the reporting period.
110 nine entertainment co.
For
per
sona
l use
onl
y
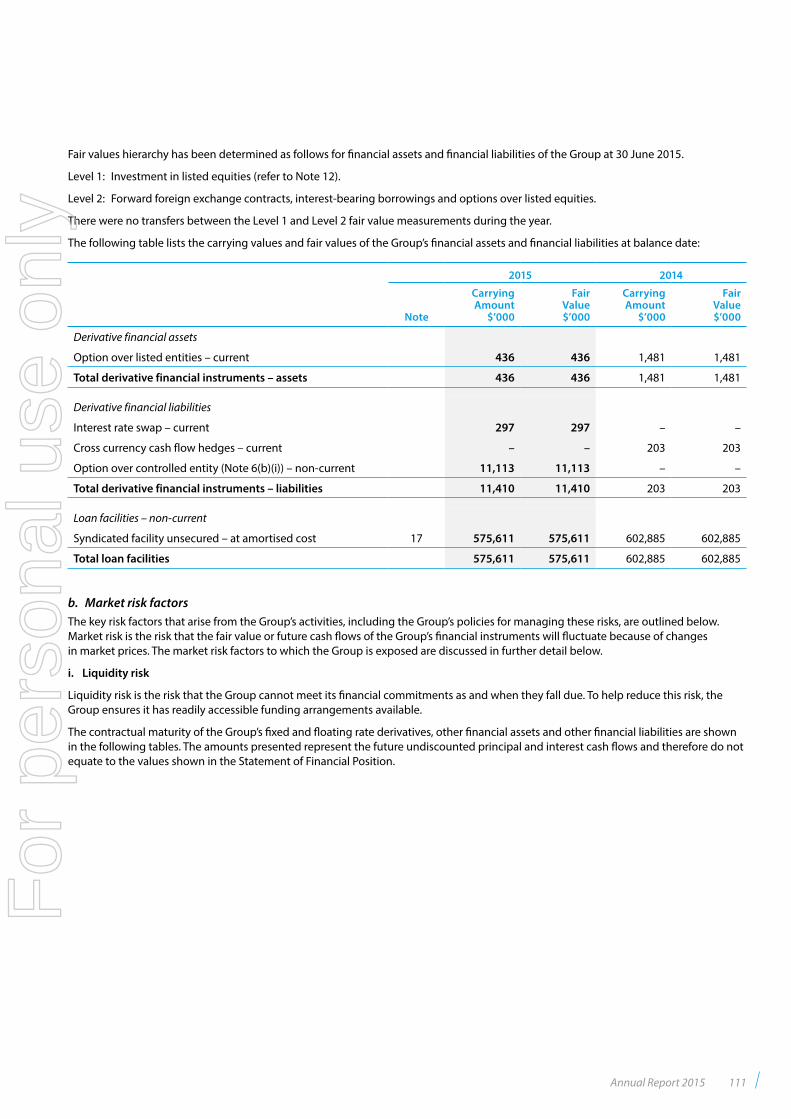
Fair values hierarchy has been determined as follows for financial assets and financial liabilities of the Group at 30 June 2015.
Level 1: Investment in listed equities (refer to Note 12).
Level 2: Forward foreign exchange contracts, interest-bearing borrowings and options over listed equities.
There were no transfers between the Level 1 and Level 2 fair value measurements during the year.
The following table lists the carrying values and fair values of the Group’s financial assets and financial liabilities at balance date:
2015 2014
Note
Carrying Amount
$’000
FairValue$’000
Carrying Amount
$’000
FairValue$’000
Derivative financial assets
Option over listed entities – current 436 436 1,481 1,481
Total derivative financial instruments – assets 436 436 1,481 1,481
Derivative financial liabilities
Interest rate swap – current 297 297 – –
Cross currency cash flow hedges – current – – 203 203
Option over controlled entity (Note 6(b)(i)) – non-current 11,113 11,113 – –
Total derivative financial instruments – liabilities 11,410 11,410 203 203
Loan facilities – non-current
Syndicated facility unsecured – at amortised cost 17 575,611 575,611 602,885 602,885
Total loan facilities 575,611 575,611 602,885 602,885
b. Market risk factorsThe key risk factors that arise from the Group’s activities, including the Group’s policies for managing these risks, are outlined below. Market risk is the risk that the fair value or future cash flows of the Group’s financial instruments will fluctuate because of changes in market prices. The market risk factors to which the Group is exposed are discussed in further detail below.
i. Liquidity risk
Liquidity risk is the risk that the Group cannot meet its financial commitments as and when they fall due. To help reduce this risk, the Group ensures it has readily accessible funding arrangements available.
The contractual maturity of the Group’s fixed and floating rate derivatives, other financial assets and other financial liabilities are shown in the following tables. The amounts presented represent the future undiscounted principal and interest cash flows and therefore do not equate to the values shown in the Statement of Financial Position.
Annual Report 2015 111
For
per
sona
l use
onl
y
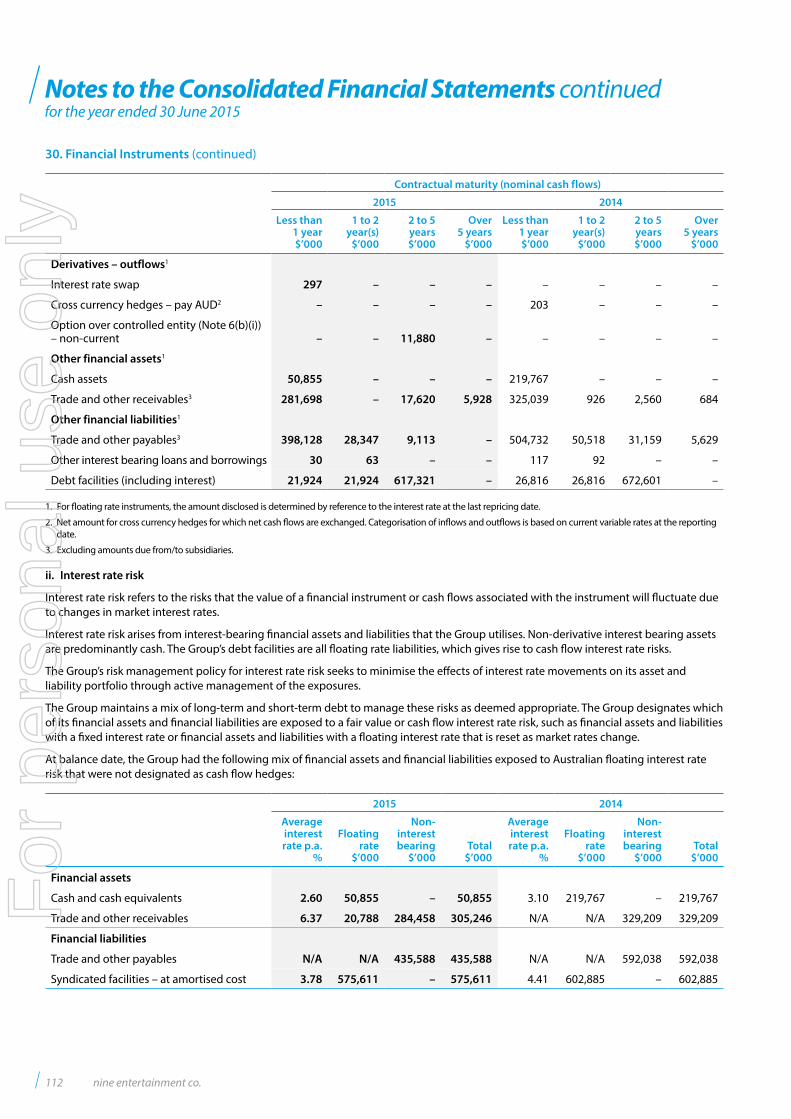
Notes to the Consolidated Financial Statements continuedfor the year ended 30 June 2015
Contractual maturity (nominal cash flows)
2015 2014
Less than1 year$’000
1 to 2year(s)
$’000
2 to 5 years$’000
Over5 years
$’000
Less than1 year$’000
1 to 2year(s)
$’000
2 to 5 years$’000
Over5 years
$’000
Derivatives – outflows1
Interest rate swap 297 – – – – – – –
Cross currency hedges – pay AUD2 – – – – 203 – – –
Option over controlled entity (Note 6(b)(i))– non-current – – 11,880 – – – – –
Other financial assets1
Cash assets 50,855 – – – 219,767 – – –
Trade and other receivables3 281,698 – 17,620 5,928 325,039 926 2,560 684
Other financial liabilities1
Trade and other payables3 398,128 28,347 9,113 – 504,732 50,518 31,159 5,629
Other interest bearing loans and borrowings 30 63 – – 117 92 – –
Debt facilities (including interest) 21,924 21,924 617,321 – 26,816 26,816 672,601 –
1. For floating rate instruments, the amount disclosed is determined by reference to the interest rate at the last repricing date.
2. Net amount for cross currency hedges for which net cash flows are exchanged. Categorisation of inflows and outflows is based on current variable rates at the reporting date.
3. Excluding amounts due from/to subsidiaries.
ii. Interest rate risk
Interest rate risk refers to the risks that the value of a financial instrument or cash flows associated with the instrument will fluctuate due to changes in market interest rates.
Interest rate risk arises from interest-bearing financial assets and liabilities that the Group utilises. Non-derivative interest bearing assets are predominantly cash. The Group’s debt facilities are all floating rate liabilities, which gives rise to cash flow interest rate risks.
The Group’s risk management policy for interest rate risk seeks to minimise the effects of interest rate movements on its asset and liability portfolio through active management of the exposures.
The Group maintains a mix of long-term and short-term debt to manage these risks as deemed appropriate. The Group designates which of its financial assets and financial liabilities are exposed to a fair value or cash flow interest rate risk, such as financial assets and liabilities with a fixed interest rate or financial assets and liabilities with a floating interest rate that is reset as market rates change.
At balance date, the Group had the following mix of financial assets and financial liabilities exposed to Australian floating interest rate risk that were not designated as cash flow hedges:
2015 2014
Average interest rate p.a.
%
Floating rate
$’000
Non-interest bearing
$’000Total
$’000
Average interest rate p.a.
%
Floating rate
$’000
Non-interest bearing
$’000Total
$’000
Financial assets
Cash and cash equivalents 2.60 50,855 – 50,855 3.10 219,767 – 219,767
Trade and other receivables 6.37 20,788 284,458 305,246 N/A N/A 329,209 329,209
Financial liabilities
Trade and other payables N/A N/A 435,588 435,588 N/A N/A 592,038 592,038
Syndicated facilities – at amortised cost 3.78 575,611 – 575,611 4.41 602,885 – 602,885
30. Financial Instruments (continued)
112 nine entertainment co.
For
per
sona
l use
onl
y
Interest rate sensitivity analysis The table below shows the effect on net profit after income tax if interest rates at balance date had been higher or lower with all other variables held constant, taking into account all underlying exposures and related hedges. Concurrent movement in interest rates and parallel shifts in the yield curves are assumed.
The following sensitivities have been assumed in this analysis:
2015 2014
AUD interest rates +/– 1% (100 basis points) +/– 1% (100 basis points)
The sensitivities above have been selected as they are considered reasonable given the current level of both short-term and long-term Australian market. Sensitivities are based on financial instruments held at the balance date assumed to have been in place since the beginning of the period.
Based on the sensitivity analysis, if interest rates changed as described above, net profit and equity would have been impacted as follows:
Net ProfitAfter Tax
Post-tax Equity(Cash flow hedge reserve)
As at 30 June
2015$’000
2014$’000
2015$’000
2014$’000
If interest rates were higher with all other variables held constant– decrease (2,269) (4,260) – –
If interest rates were lower with all other variables held constant– increase 2,269 4,260 – –
iii. Credit risk exposures
Credit risk is the risk that a contracting entity will not complete its obligations under a financial instrument and cause the Group to make a financial loss. The Group has exposure to credit risk on all financial assets included in the Group’s statement of financial position. To help manage this risk, the Group:
• has a policy for establishing credit limits; and
• manages exposures to individual entities it either transacts with or with which it enters into derivative contracts (through a system of credit limits).
The Group’s credit risk is mainly concentrated across a number of customers and financial institutions. The Group does not have any significant credit risk exposure to a single customer or group of customers, or individual institutions.
Financial assets are considered impaired where there is objective evidence that the Group will not be able to collect all amounts due according to the original trade and other receivable terms. Factors considered when determining if impairment exists include ageing and timing of expected receipts and the creditworthiness of counterparties. An allowance for doubtful debts is created for the difference between the assets’ carrying value and the present value of estimated future cash flows. The Group’s trading terms do not generally include the requirement for customers to provide collateral as security for financial assets.
Refer to Note 7 for an ageing analysis of trade receivables and the movement in the allowance for doubtful debts. All other financial assets are not impaired and are not past due. Based on the credit history of these classes, it is expected that these amounts will be received when due.
Trade receivables include the following credit concentration:
2015$’000
2014$’000
Advertising 193,886 225,270
Television stations 10,360 12,632
Other 61,999 76,794
266,245 314,696
Annual Report 2015 113
For
per
sona
l use
onl
y
Notes to the Consolidated Financial Statements continuedfor the year ended 30 June 2015
30. Financial Instruments (continued)
iv. Foreign currency risk
Foreign currency risk is the risk that the fair value or future cash flows of a financial instrument will fluctuate because of changes in foreign exchange rates. The Group’s exposure to the risk of changes in foreign exchange rates related primarily to trade payables and receivables from contractual payments. In the prior year, the Group’s exposure to the risk of changes in foreign exchange rates related primarily to the Group’s interest-bearing debt facilities that were refinanced during that year.
The Group manages this foreign currency risk by entering into cross-currency hedges.
Cash flow hedgesDuring the year an amount of $780,000 (2014: $7,135,000) was recognised through profit or loss in relation to hedge ineffectiveness.
During the year, $711,000 was reclassified from other comprehensive income to profit or loss in relation to foreign currency hedges which were closed out. During the prior year $12,752,000 was reclassified from other comprehensive income to profit or loss in respect of cross currency hedges as a result of the Group’s restructure in that year.
31. Parent Entity Disclosures
Parent Entity
2015$’000
2014$’000
a. Financial PositionCurrent assets 8,288 58
Non-current assets 927,150 885,288
Total assets 935,438 885,346
Current liabilities 6,911 1,393
Non-current liabilities 4,721 36,676
Total liabilities 11,632 38,069
Net assets 923,806 847,277
Contributed equity 801,031 862,725
Reserves 8,600 7,689
Retained earnings/(losses) 114,175 (23,137)
Total equity 923,806 847,277
b. Comprehensive IncomeNet profit for the year 216,136 2,167,672
Total comprehensive income for the year 216,136 2,167,672
c. Commitments and ContingenciesThe parent entity was a party to the Deed of Cross Guarantee entered into with various Group companies. Refer to Note 29 for further details.
Refer to Note 24 for disclosure of the Group’s commitments and contingencies. The operation of the Deed of Cross Guarantee has the effect of joining the parent entity as a guarantor to the Group’s commitments and contingencies.
114 nine entertainment co.
For
per
sona
l use
onl
y
32. Earnings Per Share
Basic earnings per share amounts are calculated by dividing the net (loss)/profit for the year attributable to ordinary equity holders of the parent by the weighted average number of ordinary shares outstanding during the year.
Diluted earnings per share amounts are calculated by dividing the net (loss)/profit attributable to ordinary equity holders of the parent by the weighted average number of ordinary shares outstanding during the year plus the weighted average number of ordinary shares that would be issued on conversion of all the dilutive potential ordinary shares into ordinary shares.
The following reflects the income and share data used in the basic and diluted earnings per share computations:
2015$’000
2014$’000
(Loss)/profit attributable to ordinary equity holders for basic and diluted earnings
Continuing operations (597,624) 26,985
Discontinued operations 5,473 30,887
2015No. ‘000
2014No. ‘000
Weighted average number of ordinary shares for basic earnings per share 935,437 876,988
Effect of dilution:
Restricted share units – 3,499
Rights Plan shares1 3,063 –
Weighted average number of ordinary shares adjusted for the effect of dilution 938,500 880,487
1. Rights Plan shares have been calculated as a weighted average from the date of purchase less the weighted average of shares vested during the period under the performance rights plan (refer to Note 26(c) for further detail).
Annual Report 2015 115
For
per
sona
l use
onl
y
Directors’ Declaration
The Directors of Nine Entertainment Co. Holdings Limited have declared that:
1. the Directors have received the declarations required by section 295A of the Corporations Act 2001 from the Managing Director and CEO and the Chief Financial Officer for the year ended 30 June 2015.
2. in the opinion of the Directors, the consolidated financial statements and notes that are set out on pages 60 to 115 and the Remuneration Report in pages 29 to 44 in the Director’s Report, are in accordance with the Corporations Act 2001, including:
i. giving a true and fair view of the consolidated entity’s financial position as at 30 June 2015 and of its performance for the financial year ended on that date; and
ii. complying with Australian Accounting Standards and the Corporations Regulations 2001;
3. in the opinion of the Directors, there are reasonable grounds to believe that the Group will be able to pay its debts as and when they become due and payable.
4. a statement of compliance with International Financial Reporting Standards has been included in Note 1(b) to the financial statements; and
5. in the opinion of the Directors, at the date of this declaration, there are reasonable grounds to believe that the members of the Closed Group identified in Note 29 will be able to meet any obligations or liabilities to which they are or may become subject to, by virtue of the Deed of Cross Guarantee.
The Directors’ Declaration is made in accordance with a resolution of the Board of Nine Entertainment Co. Holdings Limited.
David Haslingden David GyngellChairman Chief Executive Officer and Director
Sydney, 27 August 2015
116 nine entertainment co.
For
per
sona
l use
onl
y
Independent Auditor’s Report to the Members of Nine Entertainment Co. Holdings Limited
A member firm of Ernst & Young Global LimitedLiability limited by a scheme approved under Professional Standards Legislation
Ernst & Young680 George StreetSydney NSW 2000 AustraliaGPO Box 2646 Sydney NSW 2001
Tel: +61 2 9248 5555Fax: +61 2 9248 5959ey.com/au
109
Independent auditor's report to the members of Nine Entertainment Co.Holdings Limited
Report on the financial report
We have audited the accompanying financial report of Nine Entertainment Co. Holdings Limited (“theCompany”), which comprises the consolidated statement of financial position as at 30 June 2015, theconsolidated statement of comprehensive income, the consolidated statement of changes in equity andthe consolidated statement of cash flows for the year then ended, notes comprising a summary ofsignificant accounting policies and other explanatory information, and the directors' declaration of theconsolidated entity comprising the Company and the entities it controlled at the year's end or from timeto time during the financial year.
Directors' responsibility for the financial report
The directors of the Company are responsible for the preparation of the financial report that gives a trueand fair view in accordance with Australian Accounting Standards and the Corporations Act 2001 and forsuch internal controls as the directors determine are necessary to enable the preparation of the financialreport that is free from material misstatement, whether due to fraud or error. In Note 1(b), the directorsalso state, in accordance with Accounting Standard AASB 101 Presentation of Financial Statements, thatthe financial statements comply with International Financial Reporting Standards.
Auditor's responsibility
Our responsibility is to express an opinion on the financial report based on our audit. We conducted ouraudit in accordance with Australian Auditing Standards. Those standards require that we comply withrelevant ethical requirements relating to audit engagements and plan and perform the audit to obtainreasonable assurance about whether the financial report is free from material misstatement.
An audit involves performing procedures to obtain audit evidence about the amounts and disclosures inthe financial report. The procedures selected depend on the auditor's judgment, including the assessmentof the risks of material misstatement of the financial report, whether due to fraud or error. In makingthose risk assessments, the auditor considers internal controls relevant to the entity's preparation andfair presentation of the financial report in order to design audit procedures that are appropriate in thecircumstances, but not for the purpose of expressing an opinion on the effectiveness of the entity'sinternal controls. An audit also includes evaluating the appropriateness of accounting policies used andthe reasonableness of accounting estimates made by the directors, as well as evaluating the overallpresentation of the financial report.
We believe that the audit evidence we have obtained is sufficient and appropriate to provide a basis forour audit opinion.
Independence
In conducting our audit we have complied with the independence requirements of the Corporations Act2001. We have given to the directors of the Company a written Auditor’s Independence Declaration, acopy of which is included in the directors’ report.
Annual Report 2015 117
For
per
sona
l use
onl
y
Independent Auditor’s Report to the Members of Nine Entertainment Co. Holdings Limited
A member firm of Ernst & Young Global LimitedLiability limited by a scheme approved under Professional Standards Legislation
110
OpinionIn our opinion:
a. the financial report of Nine Entertainment Co. Holdings Limited is in accordance with theCorporations Act 2001, including:
i giving a true and fair view of the consolidated entity's financial position as at 30 June 2015and of its performance for the year ended on that date; and
ii complying with Australian Accounting Standards and the Corporations Regulations 2001;and
b. the financial report also complies with International Financial Reporting Standards as disclosed inNote 1(b).
Report on the remuneration report
We have audited the Remuneration Report included in the directors' report for the year ended 30 June2015. The directors of the Company are responsible for the preparation and presentation of theRemuneration Report in accordance with section 300A of the Corporations Act 2001. Our responsibility isto express an opinion on the Remuneration Report, based on our audit conducted in accordance withAustralian Auditing Standards.
OpinionIn our opinion, the Remuneration Report of Nine Entertainment Co. Holdings Limited for the year ended30 June 2015, complies with section 300A of the Corporations Act 2001.
Ernst & Young
John RobinsonPartnerSydney27 August 2015
118 nine entertainment co.
For
per
sona
l use
onl
y
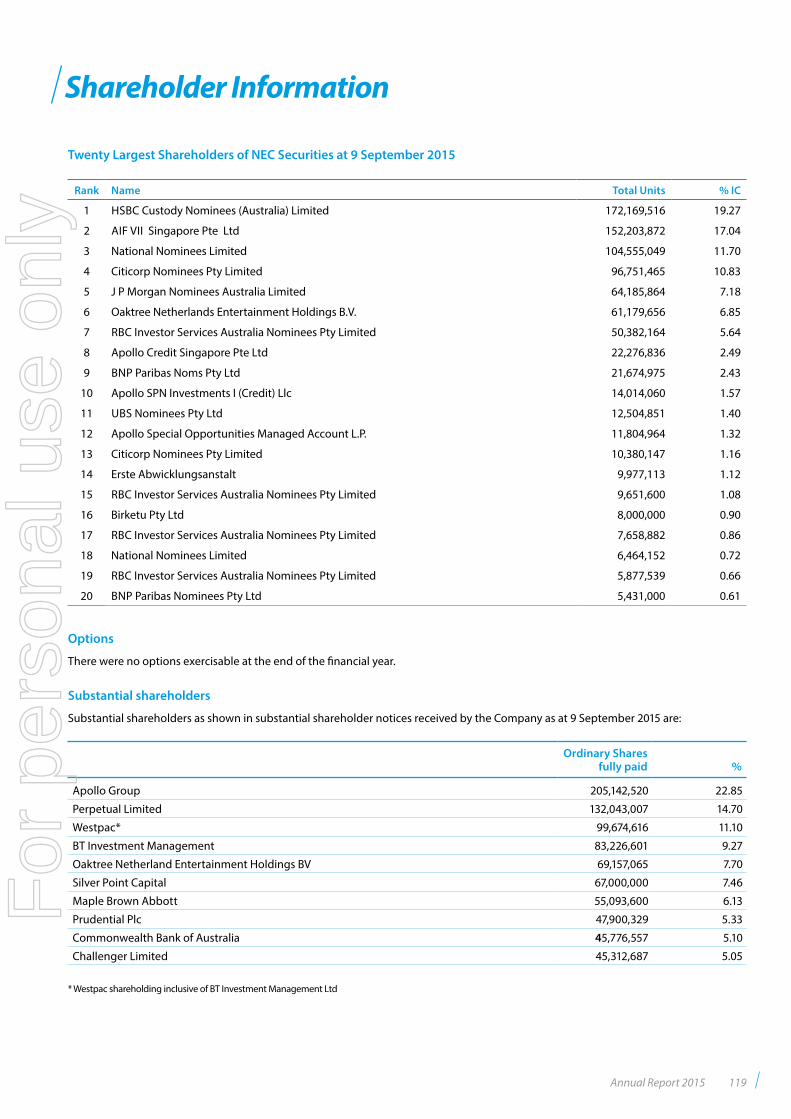
Shareholder Information
Twenty Largest Shareholders of NEC Securities at 9 September 2015
Rank Name Total Units % IC
1 HSBC Custody Nominees (Australia) Limited 172,169,516 19.27
2 AIF VII Singapore Pte Ltd 152,203,872 17.04
3 National Nominees Limited 104,555,049 11.70
4 Citicorp Nominees Pty Limited 96,751,465 10.83
5 J P Morgan Nominees Australia Limited 64,185,864 7.18
6 Oaktree Netherlands Entertainment Holdings B.V. 61,179,656 6.85
7 RBC Investor Services Australia Nominees Pty Limited 50,382,164 5.64
8 Apollo Credit Singapore Pte Ltd 22,276,836 2.49
9 BNP Paribas Noms Pty Ltd 21,674,975 2.43
10 Apollo SPN Investments I (Credit) Llc 14,014,060 1.57
11 UBS Nominees Pty Ltd 12,504,851 1.40
12 Apollo Special Opportunities Managed Account L.P. 11,804,964 1.32
13 Citicorp Nominees Pty Limited 10,380,147 1.16
14 Erste Abwicklungsanstalt 9,977,113 1.12
15 RBC Investor Services Australia Nominees Pty Limited 9,651,600 1.08
16 Birketu Pty Ltd 8,000,000 0.90
17 RBC Investor Services Australia Nominees Pty Limited 7,658,882 0.86
18 National Nominees Limited 6,464,152 0.72
19 RBC Investor Services Australia Nominees Pty Limited 5,877,539 0.66
20 BNP Paribas Nominees Pty Ltd 5,431,000 0.61
Options
There were no options exercisable at the end of the financial year.
Substantial shareholders
Substantial shareholders as shown in substantial shareholder notices received by the Company as at 9 September 2015 are:
Ordinary Shares fully paid %
Apollo Group 205,142,520 22.85
Perpetual Limited 132,043,007 14.70
Westpac* 99,674,616 11.10
BT Investment Management 83,226,601 9.27
Oaktree Netherland Entertainment Holdings BV 69,157,065 7.70
Silver Point Capital 67,000,000 7.46
Maple Brown Abbott 55,093,600 6.13
Prudential Plc 47,900,329 5.33
Commonwealth Bank of Australia 45,776,557 5.10
Challenger Limited 45,312,687 5.05
* Westpac shareholding inclusive of BT Investment Management Ltd
Annual Report 2015 119
For
per
sona
l use
onl
y
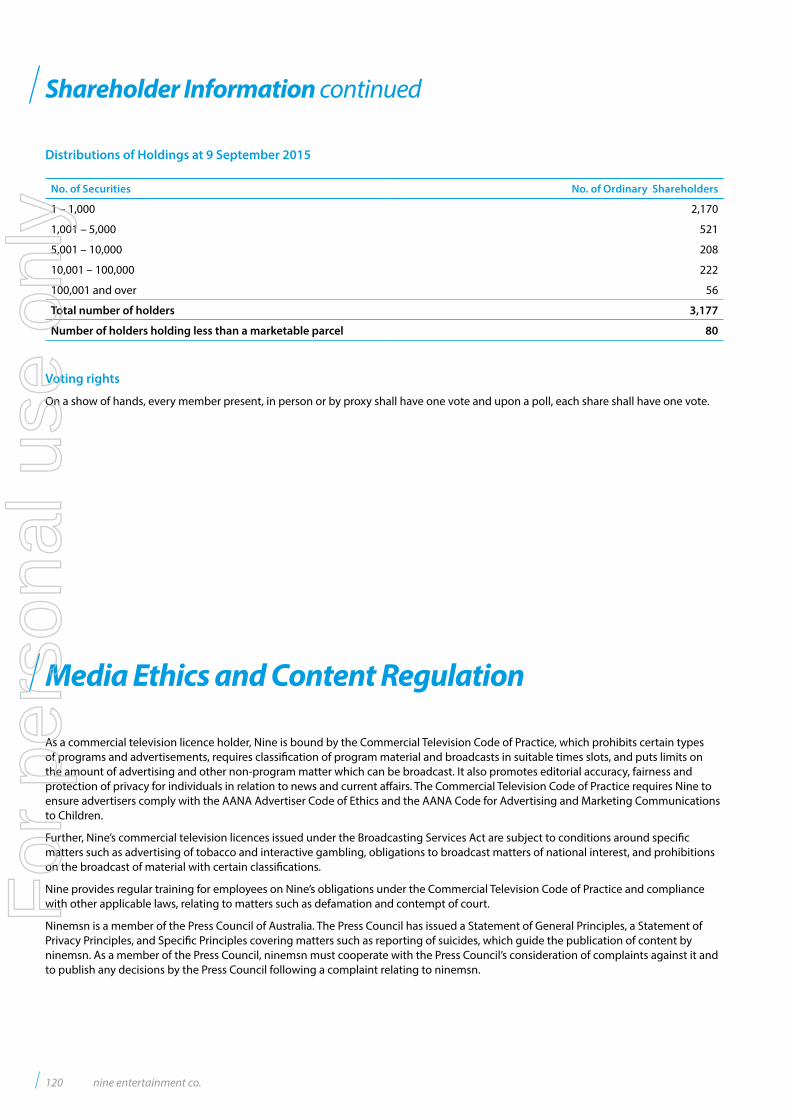
Shareholder Information continued
Distributions of Holdings at 9 September 2015
No. of Securities No. of Ordinary Shareholders
1 – 1,000 2,170
1,001 – 5,000 521
5,001 – 10,000 208
10,001 – 100,000 222
100,001 and over 56
Total number of holders 3,177
Number of holders holding less than a marketable parcel 80
Voting rights
On a show of hands, every member present, in person or by proxy shall have one vote and upon a poll, each share shall have one vote.
As a commercial television licence holder, Nine is bound by the Commercial Television Code of Practice, which prohibits certain types of programs and advertisements, requires classification of program material and broadcasts in suitable times slots, and puts limits on the amount of advertising and other non-program matter which can be broadcast. It also promotes editorial accuracy, fairness and protection of privacy for individuals in relation to news and current affairs. The Commercial Television Code of Practice requires Nine to ensure advertisers comply with the AANA Advertiser Code of Ethics and the AANA Code for Advertising and Marketing Communications to Children.
Further, Nine’s commercial television licences issued under the Broadcasting Services Act are subject to conditions around specific matters such as advertising of tobacco and interactive gambling, obligations to broadcast matters of national interest, and prohibitions on the broadcast of material with certain classifications.
Nine provides regular training for employees on Nine’s obligations under the Commercial Television Code of Practice and compliance with other applicable laws, relating to matters such as defamation and contempt of court.
Ninemsn is a member of the Press Council of Australia. The Press Council has issued a Statement of General Principles, a Statement of Privacy Principles, and Specific Principles covering matters such as reporting of suicides, which guide the publication of content by ninemsn. As a member of the Press Council, ninemsn must cooperate with the Press Council’s consideration of complaints against it and to publish any decisions by the Press Council following a complaint relating to ninemsn.
Media Ethics and Content Regulation
120 nine entertainment co.
For
per
sona
l use
onl
y
Corporate Directory
ABN 60 122 203 892
Annual General MeetingThe Annual General Meeting will be held at 10.00am on Tuesday, 17 November 2015 at Level 7, Australia Square, 264 George Street, Sydney NSW 2000.
Financial Calendar 2016Interim result February 2016Preliminary final result August 2016Annual General Meeting November 2016
Company SecretariesSimon Kelly and Rachel Launders
Registered OfficeNine Entertainment Co. Holdings Limited24 Artarmon RoadWilloughby NSW 2068
Share RegistryLink Market Services LimitedLevel 12, 680 George StreetSydney NSW 2000
Ph: 1300 888 062 (toll free within Australia)
Ph: +61 2 8280 7670
Fax: +61 2 9287 0303
Email: [email protected]
Website: www.linkmarketservices.com.au
Securities Exchange ListingThe Company’s ordinary shares are listed on the Australian Securities Exchange as NEC.
AuditorsErnst & Young680 George StreetSydney NSW 2000
Annual Report 2015 121RM-15054
For
per
sona
l use
onl
y

For
per
sona
l use
onl
y


