
NBN Co Limited - National Broadband Network · 1 ... The Transit Network includes the main...
60
NBN Co Half-Year Report as at 31 December 2013 1 NBN Co Limited Half-Year Report For the six months ended 31 December 2013 ABN 86 136 533 741
Transcript of NBN Co Limited - National Broadband Network · 1 ... The Transit Network includes the main...

NBN Co Half-Year Report as at 31 December 2013 1
NBN Co Limited Half-Year ReportFor the six months ended 31 December 2013ABN 86 136 533 741


Contents
Legal NoticeCopyright
Copyright © NBN Co Limited 2014.
Copyright subsists in this Half-Year Report. NBN Co owns that copyright. Other than as permitted under the Copyright Act 1968 (Cth), the Half-Year Report (in part or as a whole) cannot be reproduced, published, communicated or adapted without the prior written consent of NBN Co. Any request or inquiry to so use the Half-Year Report should be addressed to:
The Chief Financial OfficerNBN Co Limited,Level 11, 100 Arthur StreetNorth Sydney NSW 2060Australia
DateThis Half-Year Report is dated 31 December 2013
Page
About NBN Co 4
NBN Co Objectives 7
Executive Chairman’s Message 8
Directors’ Report 11
Auditor Independence 26
Statement of Comprehensive Income 28
Balance Sheet 29
Statement of Changes in Equity 30
Statement of Cash Flows 31
Schedule of Commitments 32
Notes to the Financial Statements 33
Directors’ Declaration 53
Independent Auditor’s Review Report to the Members of NBN Co Limited 54
Glossary of Terms 56
The half-year financial statements were authorised for issue by the directors on 18 February 2014. The directors have the power to amend and reissue the half-year financial statements.
Interior of a Transit Aggregation
Node and Depot in Sydney’s
North (January 2014)

NBN Co Half-Year Report as at 31 December 20134
NBN Co Limited (“the Company”, or “NBN Co”) was established on 9 April 2009 to design, build and operate the NBN. NBN Co is a Government Business Enterprise (GBE) operating under the Commonwealth Authorities and Companies Act 1997 (Cth) (CAC Act), the Commonwealth Government Business Enterprise Governance and Oversight Guidelines October 2011 (GBE Guidelines) and the Corporations Act 2001 (Cth) (Corporations Act).
In accordance with the GBE Guidelines, NBN Co operates as a commercial entity with the long term objective of earning a commercial return for its shareholder, the Commonwealth of Australia.
NBN Co has two Shareholder Ministers: the Minister for Communications, the Hon Malcolm Turnbull MP and the Minister for Finance, Senator the Hon Mathias Cormann (together, the current Shareholder Ministers).
About NBN CoThe National Broadband Network (NBN)
is developing as a national wholesale-
only, open access communications
network that is delivering very fast
broadband and telephony services
in a growing number of areas
across Australia.
NBN Co Half-Year Report as at 31 December 20134

Technician working at
Transit Aggregation
Node in Sydney’s North
(January 2014)

NBN Co Half-Year Report as at 31 December 20136
Satellite ground station under
construction in Bourke, New
South Wales (January 2014)

NBN Co Objectives
Specifically, these policy objectives include that NBN Co will:
• upgrade the network in the most cost-effective way using the best-matched technology
• use the discretion and flexibility provided by Government policy to make network design decisions within the constraint of limited available public capital
• supply services to Retail Service Providers (RSPs) on a wholesale-only, open access basis via Layer 2 services
• deploy the fixed wireless network, but in doing so take into account the very likely availability of fixed line broadband technology via VDSL in smaller communities not currently in the fibre footprint
• continue the work associated with the build and launch of the long-term satellites
• continue the development of special services, enterprise services and other related services
• provide connection to all New Developments meeting certain size criteria from 1 January 2011
• implement a semi-distributed Points of Interconnect (PoIs) architecture based on advice from the Australian Competition and Consumer Commission (ACCC), which resulted in an initial list of 121 PoIs
• achieve a rate of return that is, at a minimum, in excess of public sector debt rates
The Commonwealth Government’s policy objectives for the NBN are detailed in the Statement of Expectations (SoE) issued in December 20101. The SoE has been supplemented by a series of subsequent policy directives to NBN Co provided in writing by the former Shareholder Ministers, and was further amended on 24 September 2013 through an Interim Statement of Expectations (Interim SoE) from the current Shareholder Ministers, to take effect during the period of transition to new Government policy.
Under the Interim SoE, NBN Co should avoid disruption to customers and minimise the impact on the construction industry as the Company undertakes the necessary steps to achieve a speedier and less costly rollout as quickly as possible.
NBN Co will continue to be guided by the Interim SoE until given further direction in the form of a new SoE, following the Government’s consideration of the outcome of the Strategic Review as presented to the Government on 12 December 2013 and other reviews currently in progress.
The Commonwealth Government’s central policy objective is for NBN Co to complete the construction of the National Broadband Network and in doing so ensure that all Australians have access to very fast broadband as soon, as cost-effectively and as affordably as possible.
1 http://www.communications.gov.au/__data/assets/pdf_file/0004/186115/130924_NBN_Co.pdf
7NBN Co Half-Year Report as at 31 December 2013

NBN Co Half-Year Report as at 31 December 20138
Executive Chairman’s Message
This is NBN Co’s first general purpose half-year report and part of the increased transparency the company is applying. The Board and the Executive recognise that there is great public interest in the large taxpayer investment in the NBN and we take seriously the obligation to use taxpayer money wisely and to be as open as commercially possible about that expenditure.
It has been a brief but eventful time since I was appointed to this role on 3 October 2013. The management and staff of NBN Co have done a tremendous job, working with our expert advisers, to complete the Strategic Review last December. This robust analysis has allowed us to make critical, fact-based decisions about the future direction of the company and the rollout.
The review found that the fastest and most affordable way to deliver the NBN is to maximise the use of existing infrastructure. In the event that the SoE requests that NBN Co proceed with this approach, this would give NBN Co the flexibility to apply a mix of technologies based on their optimum fit with infrastructure already in place.
This approach is called the optimised Multi-Technology Mix (MTM). It aims to minimise costs by making the right investment at the right time. Each of the technologies used in the fixed-line network also has an upgrade path so that appropriate investment can be made to meet user demand for higher speeds over time.
NBN Co is now transitioning to a faster, more cost-effective deployment model. A Transformation Management Office has been established under the leadership of J.B. Rousselot in preparation to convert the findings of the Strategic Review into a portfolio of work-streams to manage and drive the transition.
Throughout this process, NBN Co has continued working to deliver the objectives set by its Shareholder Ministers to ensure all Australians have access to very fast broadband as soon and as affordably as possible.
The Fibre-to-the-Premise (FTTP) rollout continues, and NBN Co’s new Chief Operating Officer, Greg Adcock, is working with our delivery partners to address planning and construction issues that led to delays and frustration in the past. Our current aim is to stabilise the FTTP rollout and to give contractors, suppliers and customers more visibility of forward plans, and greater certainty regarding their own investments in the project.
While this level of stability is being established, NBN Co is working as quickly as possible on the required commercial negotiations, product development, policy arrangements and technology trials that will enable the Fibre-to-the-Node deployment and Hybrid Fibre Coaxial (HFC) integration. This will allow us to speed up the rollout using a more flexible mix of technologies best suited to the needs of any given location. The successful renegotiation of our agreements with Telstra and Optus will be essential elements in putting this strategy in place.
The company has marked a number of significant achievements over the past six months which are highlighted in this report. I would particularly like to single out the acceptance of NBN Co’s Special Access Undertaking (SAU) by the ACCC on 13 December 2013, progress in rolling out the Transit Network, and the fixed wireless and satellite programs.
The Transit Network includes the main transmission links between towns and cities and the aggregation nodes, or points at the ends of the network where traffic is handed to our customers. Together, these make up the core network that will be used by all access technologies.

NBN Co Half-Year Report as at 31 December 2013 9
As at 31 December, NBN Co has brought into service 94 Points of Interconnect (PoIs) out of a planned 121, including nine of the 10 purpose -built PoIs that are also service depots. Over 38,680km of transit fibre has been deployed – or more than 60% of the total – with the rollout running under budget.
In regard to the Fixed Wireless rollout, NBN Co acquired 286 sites and integrated 152 base stations during the six months to the end of December, bringing the cumulative total to 768 and 273 respectively. Fixed wireless activations have accelerated from just 91 in June 2012 to 6512 at 31 December 2013.
Work is also progressing on the 10 ground stations required as part of the Long Term Satellite network, with the first due for completion early this year. Our contractor, Space Systems/Loral, is also working to schedule on the two new Ka Band satellites due to launch mid-next year.
Finally, I would like to thank continuing Board Members Dr Kerry Schott and Alison Lansley for their commitment during this challenging transition, and I welcome the contributions of new members Patrick Flannigan, Simon Hackett and Justin Milne, who bring with them a wealth of industry experience. I also want to acknowledge the significant contributions of outgoing board members Mike Quigley, Siobhan McKenna, Diane Smith-Gander, Terry Francis, Rick Turchini and Brad Orgill. I thank the management and staff of NBN Co for their commitment to the project, and look forward to their continued efforts as we transform the organisation.
Dr Ziggy Switkowski Executive Chairman

10 NBN Co Half-Year Report as at 31 December 2013

Directors’ Report
The directors of NBN Co Limited
(the Company or NBN Co) present their
Half-Year Report on NBN Co and its
subsidiaries (the NBN Group), together
with the half-year financial statements of
the NBN Group for the half-year ended
31 December 2013 and the Auditor’s
review report thereon.

NBN Co Half-Year Report as at 31 December 201312
Directors’ Report
New Government policy
The Australian Government is committed to completing the construction of the National Broadband Network (NBN) and, in doing so, ensure that all Australians have access to very fast broadband as soon, as cost-effectively and as affordably as possible.
The policy recognises the benefits that fast broadband provides to households and businesses and its value in fostering productivity and innovation alongside other information and communication technologies.
This policy envisions the completion of the NBN as quickly and as cost-effectively as possible, by embracing a broader mix of advanced broadband technologies that can provide high speeds at a reasonable cost.
Strategy update
Following the Federal election on 7 September 2013, NBN Co was issued an Interim SoE. NBN Co was advised to avoid service disruption for consumers and minimise impact on the construction industry and employment by a smooth transition to the new approach, and deliver a less costly and faster rollout as seamlessly as possible.
The Interim SoE also provided the flexibility and discretion for NBN Co to make technology and network design decisions and thereby constrain costs.
NBN Co was also advised that the existing rollout of Fibre-to-the-Premises (FTTP), Satellite and Fixed Wireless technologies should continue until directed otherwise.
During October and November 2013, NBN Co undertook a Strategic Review to assess the progress and cost of the existing rollout, NBN Co’s operational status and the economic viability of NBN Co under alternative strategies.
The Strategic Review was presented to the Government on 12 December 2013 outlining a
number of findings and recommended next steps as part of the transformation of the rollout.
The Strategic Review will provide the Government with information to develop a new Statement of Expectations for NBN Co, which will influence the completion of an updated Corporate Plan, due in the middle of 2014. Government policy will also be informed by a number of other initiatives including a cost benefit analysis and review of regulation.
Stabilising the rollout
While a new Corporate Plan is being formulated NBN Co will continue to deploy FTTP, working to stabilise and improve the efficiency of the rollout, and to maintain its momentum to minimise the impact of the deployment model transition on the construction industry and employment. This will include providing delivery partners with more predictable work flows concentrated in areas of high demand. NBN Co also aims to improve the delivery model by simplifying the schedule of rates and negotiating longer-term contracts with its delivery partners, so as to complete the network in line with the Government’s objectives.
Transition to the Multi-Technology Mix
Based on the Interim SoE, work has started on the transition of the NBN to a new rollout model employing a broader mix of advanced broadband technologies.
During October 2013, NBN Co initiated a pilot program to test the delivery of Fibre-to-the-Building (FTTB), to be followed by Fibre-to-the-Node (FTTN) pilots once the necessary network access has been negotiated. The FTTB pilot has begun to connect NBN services in up to ten apartment blocks, comprising approximately 1,000 individual homes or businesses.
The Strategic Review considered different technical solutions to achieve a faster and more affordable rollout of high-speed broadband. An optimised Multi-
Strategy Update

NBN Co Half-Year Report as at 31 December 2013 13
Technology Mix (MTM) solution was identified as the preferred option because it is expected to contain peak funding and optimise long-term economics while delivering continuously upgradeable services.
The MTM would be a network of networks interconnecting FTTP, FTTN, Fixed Wireless, Satellite, HFC and any other platform that might emerge in the future.
The MTM approach aims to not only reduce costs, but bring forward revenues. It allows greater flexibility, for different network technologies to be used in different areas – allowing Australian homes and businesses to access the NBN sooner, with a less intrusive process while outlining an upgrade path as demand for speeds and data usage increases.
Transformation Program
The release of the Strategic Review also marked the first steps toward transformation of the NBN.
NBN Co faces some significant challenges to move to the multi-technology mix model (should the SoE request that NBN Co proceed with this model) – including network planning and design, product development, IT systems and processes, procurement of new equipment, negotiating new commercial arrangements and regulation.
Transformation by aligning leadership and governance with the strategic direction of the Company is critical to its success. This will be complemented by the development of capabilities in key areas including; dealing with delivery partners, project management and defining an operating model with clear accountabilities and performance metrics.
NBN Co has commenced the process of transformation, establishing the Transformation Management Office (TMO) to further consider the findings of the Strategic Review, build upon the strategic framework and plan the transformation roadmap.
The TMO is engaging widely with staff, delivery partners, customers, suppliers and the community to ensure the findings of the Strategic Review, once agreed by the current Shareholder Ministers, are understood and that the next steps are successfully implemented. A review is underway of all in-flight projects to assess their alignment with the new strategic direction, and to map the existing set of business unit inter-relationships and governance structures. The aim is to build a whole-of-business strategy with which all business units are aligned.
New Team
A first step in the transformation program has been to put in place the right team to lead NBN Co as it enters this new phase, commencing with the appointment on 3 October 2013 of Dr Ziggy Switkowski as Executive Chairman, pending the appointment of a new Chief Executive, at which time Dr Switkowski will continue as Non-Executive Chairman.
On 11 November 2013, following the resignation of a number of Board members, three new non-executive directors were appointed with extensive relevant industry experience. They are Mr Patrick Flannigan, Mr Simon Hackett and Mr Justin Milne. Dr Kerry Schott and Ms Alison Lansley continue to serve on the Board.
These appointments were complemented with additional capability within the executive management team that will oversee the transition of the Company to the new rollout architecture. Experienced telecommunications executives Mr Jean-Baptiste Rousselot and Mr Greg Adcock were appointed to the positions of Head of Strategy and Transformation and Chief Operating Officer (COO) respectively.
On 12 December 2013 it was announced that Mr Bill Morrow, had been appointed CEO of NBN Co. Mr Morrow’s appointment takes effect on 2 April 2014.

NBN Co Half-Year Report as at 31 December 201314
Next Steps
The Strategic Review report lists a number of next steps, some of which can be implemented immediately following the receipt of the SoE and other more far-reaching reforms that require input from Government or other stakeholders. These include:
• EngagingwithGovernmentandother stakeholders • Mobilisingthetransformationagenda,including implementation of a revised governance approach• ImplementingchangestotheFTTPconstruction delivery model • Preparingforthemulti-technologymixapproach• Preparingforcommercialnegotiations• UndertakingareviewoftheSatelliteandFixed Wireless networks
review of operationS NBN Co’s rollout and operational milestones are reported on a weekly basis to the Shareholder Ministers and are now made publicly available on NBN Co’s website. These are the key performance indicators by which progress on the rollout is being assessed. There are also a number of commercial, regulatory and policy milestones noted in the summaries below.
• AssessingITcapabilitytosupportthemulti- technology model• Focusingonpeopleandorganisationalchange
There are also a number of initiatives that may take longer to implement. These include negotiations to vary the Telstra Definitive Agreements and the Optus HFC Agreement. Throughout these negotiations NBN Co will appropriately engage with the ACCC, the Department of Communications, the Department of Finance and other key stakeholders.
Further work is also necessary to move to a new delivery model and technology mix, which will continue over coming months, including the pilot FTTB/N projects. The transition requires the development of a new planning approach and a review and matching of the skills and structure of the organisation to support this approach.
Key Operational Data - as at 31 Dec 2013 cumulative
30 June 2013 cumulative
30 June 2012 cumulative
Premises Passed/Covered • fibre access network 273,174 163,515 28,860• fibre in greenfields 77,872 44,028 4,163• fixed wireless 65,860 27,256 8,885Premises Serviceable • fibre access network 188,082 107,791 n/r• fibre in greenfields 77,872 44,028 4,163• fixed wireless 65,860 27,256 8,885• interim Satellite1 48,000 48,000 48,000Premises Activated • fibre access network 52,531 20,441 3,364• fibre in greenfields 27,546 13,145 503• fixed wireless 6,512 1,874 91• interim Satellite 44,170 34,640 9,578Premises Activated as Percentage of Serviceable• fibre access network 28% 19% n/r• fibre in greenfields 35% 30% 12%• fixed wireless 10% 7% 1%• InterimSatellite 92% 72% 20%Number of Points of Interconnect (PoI) 94 64 9Transit Network Fibre Rings Integrated 55 34 1
Directors’ ReportStrategy Update
1 premises Serviceable (interim Satellite) is the estimated number of premises for which there is available satellite capacity on the interim Satellite Service. a premises owner will also have to satisfy the interim Satellite Service eligibility criteria as defined and managed by the department of Communications. an estimated 250,000 premises are covered by this eligibility criteria.

NBN Co Half-Year Report as at 31 December 2013 15
Operational Highlights
During the six months ended 31 December 2013 NBN Co continued to accelerate the rollout of the network, with increases in the absolute metrics and daily run-rates delivered for premises passed/covered, premises serviceable and premises activated for the Fibre Access Network, Fibre in Greenfields and the Fixed Wireless network. The Interim Satellite Service has now reached its full planned capacity, and as at 31 December 2013 NBN Co had ceased to accept new orders to this service.
In addition, NBN Co made significant progress in rolling out the Transit network, and as at 31 December 2013 had brought into service 94 of the expected total of 121 Points of Interconnect (PoIs), including 3 of the 10 new facilities that are being constructed by NBN Co.
During the six months ended 31 December 2013 a total of 98 areas were declared “Ready for Service” and as at the end of the period there were 209,301 premises subject to the 18 month disconnection period, after which time services will cease to be provided over Telstra’s copper and HFC networks (subject to certain exceptions).
Of the total number of premises passed, there remain a significant number of premises which are not currently serviceable within standard timeframes. The primary driver of this shortfall is the backlog of Multi-Dwelling Units (MDUs) which remain to be completed. During the six month period to
31 December 2013 NBN Co started to make progress addressing this issue, with 2,818 MDUs cabled in the period at an average rate of 22.5 MDUs per week, compared to an average run rate in the previous 12 month period to 30 June 2013 of 1.2 MDUs per week.
Premises activated continues to increase as a percentage of the serviceable footprint, reaching 28% at 31 December 2013 (19% at 30 June 2013), recognising that much of the footprint is relatively recent and migrations are spread over an 18 month period.
Other key milestones achieved in the 6 month period included:
• On28August2013NBNCoconcludeditslaunch and orbit Insurance (L+1) with a panel of specialist space underwriters effective from 1 November 2013
• On13December2013,theACCCapprovedNBN Co’s Special Access Undertaking (SAU). The SAU establishes an oversight role for the ACCC in a framework for the long term recovery of NBN Co’s prudently incurred cost.

NBN Co Half-Year Report as at 31 December 201316
Key Non-Financial Metrics 6 Months to 31 December
2013
Year to 30 June 2013
Year to 30 June 2013
Health and Safety
Lost time injury (Lti) – nBn Co (per million work hours) 1.1 0.8 0.4
Lost time injury (Lti) – Contractors (per million work hours) 2.5 0.5 0.0
Gender Diversity
women in management roles1 21% 21% 20%
Staff Engagement
employee survey score2 n/a 68% n/a
End User Satisfaction
installations only 72% 80% n/a
Staff Retention
proportion of staff retained (over 12 months) 88% 88% 88%
Health and safety remains a priority for NBN Co. The increase in lost time injury statistics reflects an increase in the volume of construction activity, and NBN Co is focused on ensuring that key safety measures remain better than industry benchmarks as the rollout accelerates.
NBN Co remains committed to gender diversity in the workplace, with a similar level of women in management roles compared with June 2013.
NBN Co has not undertaken a staff engagement survey during the period but plans to do so early in 2014.
1 A management role is defined as “any individual with a direct report underneath them”.
2 Based on pilot, December 2012.
End-user satisfaction scores for the installation phase have declined during the period, in part reflecting difficulties experienced by NBN Co and its delivery partners in increasing capacity in line with demand. Improved work practices and augmentation of delivery partners’ workforces are expected to drive improvements in the installation process.
NBN Co plans to implement an end-user experience measurement framework which will track performance through the entire migration process, focussing on awareness, consideration, activation, installation and service experience.
Staff retention at NBN Co has remained steady at 88%.
Directors’ Reportnon-finanCiaL HigHLigHtS

NBN Co Half-Year Report as at 31 December 2013 17
The NBN Co Group generated an operating loss after tax for the six months to 31 December 2013 of $715.8 million and telecommunication revenues of $21.8 million.
As at 31 December 2013 NBN Co had total assets of $7.6 billion, an increase of $2.1 billion driven by $1.2 billion in capital expenditure on property, plant and equipment and intangibles, and $1.4 billion in assets acquired under finance lease (associated
with the handover of network infrastructure from Telstra), offset by a decrease in cash and held to maturity investments of $336.7 million.
During the period the Company received Commonwealth Government equity injections of $1,250.0 million, which were offset by payments for property, plant and equipment (including network assets) and intangible assets of $1,145.6 million and $436.1 million to support operational requirements.
Revenue – six months to 31 December
Total revenue increased by 64% to $47.8m compared to the corresponding prior period, with the increase in Telecommunications revenue being the main driver.
Key Financial Data ($m) - for the six months to 31 Dec 2013 31 Dec 2012 31 Dec 2011
telecommunications revenue 21.8 5.3 0.3
Loss before interest and tax (645.1) (402.4) (250.0)
net loss after tax (715.8) (408.3) (220.6)
Capital expenditure on property, plant and equipment and intangibles
1,187.4 792.0 346.0
Key Financial Data ($m) - as at 31 Dec 2013 30 Jun 2013 30 Jun 2012
total assets 7,674.4 5,518.7 2,467.4
Shareholders equity 6,478.4 5,228.4 2,832.0
Total Revenue ($m) - for the six months to 31 Dec 2013 31 Dec 2012 31 Dec 2011
fibre 10.1 1.3 0.0
fixed wireless 0.5 0.1 0.0
Satellite 5.8 2.5 0.0
Connectivity revenue 5.4 1.4 0.3
Telecommunications Revenue 21.8 5.3 0.3
other revenue 0.3 0.1 0.0
interest income 25.7 24.0 29.3
Total Revenue 47.8 29.4 29.6
Fibre – Fibre revenue comprises revenues generated from NBN Co’s access products (AVC) over the Fibre Access and Fibre in Greenfields Networks and is dependent on the number of
finanCiaL review

NBN Co Half-Year Report as at 31 December 201318
end-users on the network and the mix of speed tiers purchased by those end-users. Fibre revenue increased by $9m or seven fold compared to the corresponding prior period, in line with a seven fold increase in the average number of end-users on the fibre network (from 9,732 to 76,320).
As at 31 December 2013, 23% of end-users were on the 100/40 Mbps wholesale service (30 June 2013: 25%), 29% were on the 25/5 Mbps2 wholesale service (30 June 2013: 23%); and 42% were on the 12/1 Mbps2 wholesale service (30 June 2013: 46%). The average speed ordered and provisioned across all Fibre End-Users was 38 Mbps2, a slight decrease of 1 Mbps2 since 30 June 2013.
Fixed Wireless – Wireless revenue comprises revenue generated from NBN Co’s Fixed Wireless products, which are offered over two wholesale speed tiers, 12/1 and 25/5 Mbps2. Fixed Wireless revenue increased by $0.4m or seven fold compared to the corresponding prior period driven by a fivefold increase in the average number of end-users on the Fixed Wireless Network (from 986 to 5,826) and the launch of the 25/5 Mbps2 wholesale service.
Expenses ($m) - for the six months to 31 Dec 2013 31 Dec 2012 31 Dec 2011
employee related expenses 188.7 152.9 100.5
direct telecommunications expenses 150.6 66.0 24.7
outsourced technical and legal advice expense 59.0 38.1 41.8
it and communications expenses 50.8 41.2 27.7
occupancy expenses 17.6 15.3 12.2
other expenses 33.7 19.9 14.9
Operating Expenditure 500.4 333.4 221.8
depreciation and amortisation expense 169.1 74.3 28.4
finance costs 94.6 20.5 0.0
Total Expenses 764.1 428.2 250.2
Expenditure – six months to 31 December
2 NBN Co is designing the NBN to provide these speeds to NBN Co’s wholesale customers, telephone and internet service providers via fibre, fixed wireless and satellite. Speeds actually achieved by retail end users will depend on a number of factors including the quality of their equipment and in–premises connection, the broadband plans offered by their service provider and how their service provider designs its network to cater for multiple end users.
Satellite – Satellite revenue comprises revenues generated from NBN Co’s Interim Satellite Service. Satellite revenue increased by $3 million, driven by a 96% increase in average number of end-users compared to the prior period (from 22,213 to 43,629). NBN Co issued cease sale notices for the service during December 2013 as it approached the 48,000 capacity limit.
Connectivity revenue – Other telecommunications revenue increased by $4 million driven principally by higher Connectivity Virtual Circuit (CVC) revenues due to greater demand for capacity as RSPs dimensioned their networks for expected future demand. An increase in Network to Network Interface (NNI) revenues was driven by an increased number of PoIs which were brought into service. As at 31 December 2013 there was an average of 5.7 RSPs per PoI, in line with the prior period.
ARPU – Across the network telecommunications revenue was generated from 130,759 active premises at a weighted Average Revenue Per User (ARPU) of $36.50 for the six months to 31 December 2013 (30 June 2013: $37.33).
finanCiaL review
Directors’ Report

NBN Co Half-Year Report as at 31 December 2013 19
Other Revenue – Other revenue relates primarily to revenue derived from facilities access, network extension and insurance proceeds.
Interest Income – Interest income increased during the period, driven by higher average cash and held to maturity balances which were partially offset by lower interest rates.
Total expenses increased by $335.9 million (78.4%) on the corresponding prior period.
Employee related expenses – Employee related expenses includes costs relating to NBN Co employees, labour hire and contractor costs (net of amounts that have been capitalised and included in the cost of non-current assets, predominantly relating to network assets and software).
Employee related expenses increased by 23% to $189 million, driven by a 32% increase in headcount to 2,949 from 2,235 compared to the corresponding prior period. As the Company reaches maturity NBN Co remains focused on ensuring headcount is commensurate with the level of activity achieved by the Company.
Direct telecommunication expenses – Direct Telecommunication costs increased by $84.6 million to $150.6 million compared to the corresponding prior period. The increase is primarily attributable to the management of services for the Interim Satellite Service (ISS), Fixed Wireless, end-user migration costs, network infrastructure costs and leasing of interim backhaul links.
Outsourced technical and legal expenses – External Services costs increased by $20.9 million to $59.0 million compared to the corresponding prior period, for support services enabling construction and operation of the NBN. While Legal
expenses decreased by $1.6 million these were offset by increases in consultancies associated with the Strategic Review and costs incurred in relation to the delivery model.
IT expenses – IT expenses have increased by $9.6 million (23%) to $50.8 million compared to the corresponding prior period, driven by increases in both Application Licences and Application Support and Maintenance costs of $9.8 million which been partially offset by a $1.0 million reduction in data and telephony costs.
Occupancy expenses – increased by $2.4 million (15%) to $17.6 million compared to the corresponding prior period. This was primarily driven by an increase in rent costs of $0.9 million and associated outgoings and repairs and maintenance cost increases of $1.1 million due to additional property leases acquired during the year.
Other expenses - Other expenses increased by 69% or $13.8 million to $33.7 million compared to the corresponding prior period. The increase was spread across a number of areas including security costs, local area marketing and board of directors’ related costs.
Depreciation and amortisation expense – Depreciation and amortisation increased by $94.8 million to $169.1 million compared to corresponding previous period and reflects the increase in network assets being placed into service.
Finance costs – Finance costs have increased by $74.1 million to $94.6 million compared to the corresponding previous period, primarily driven by increased volumes of infrastructure handed over by Telstra which are accounted for by NBN Co as a Finance lease.
NBN Co Half-Year Report as at 31 December 201320
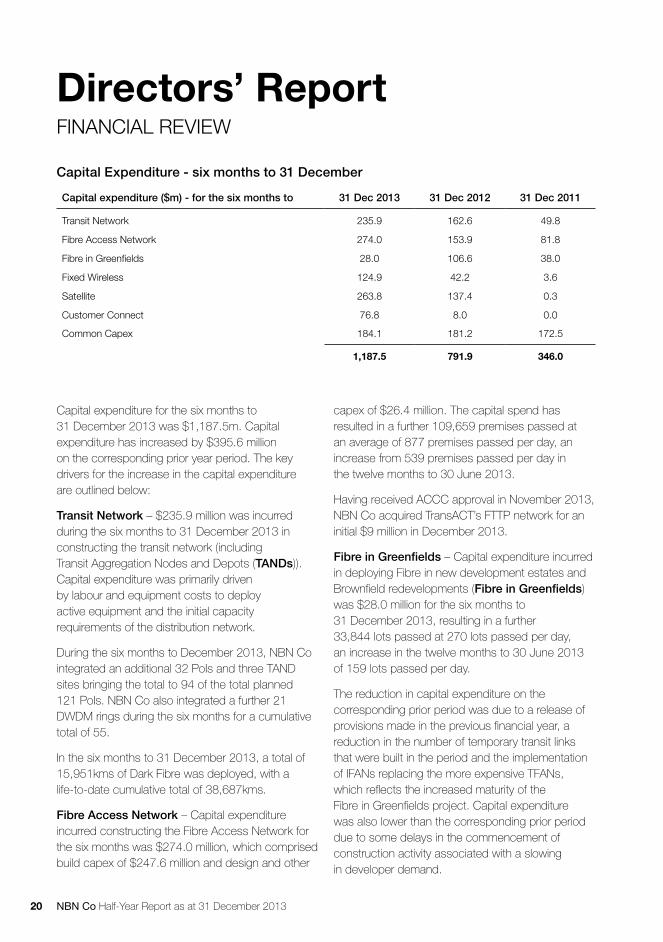
Capital Expenditure - six months to 31 December
Capital expenditure for the six months to 31 December 2013 was $1,187.5m. Capital expenditure has increased by $395.6 million on the corresponding prior year period. The key drivers for the increase in the capital expenditure are outlined below:
Transit Network – $235.9 million was incurred during the six months to 31 December 2013 in constructing the transit network (including Transit Aggregation Nodes and Depots (TANDs)). Capital expenditure was primarily driven by labour and equipment costs to deploy active equipment and the initial capacity requirements of the distribution network.
During the six months to December 2013, NBN Co integrated an additional 32 PoIs and three TAND sites bringing the total to 94 of the total planned 121 PoIs. NBN Co also integrated a further 21 DWDM rings during the six months for a cumulative total of 55.
In the six months to 31 December 2013, a total of 15,951kms of Dark Fibre was deployed, with a life-to-date cumulative total of 38,687kms.
Fibre Access Network – Capital expenditure incurred constructing the Fibre Access Network for the six months was $274.0 million, which comprised build capex of $247.6 million and design and other
capex of $26.4 million. The capital spend has resulted in a further 109,659 premises passed at an average of 877 premises passed per day, an increase from 539 premises passed per day in the twelve months to 30 June 2013.
Having received ACCC approval in November 2013, NBN Co acquired TransACT’s FTTP network for an initial $9 million in December 2013.
Fibre in Greenfields – Capital expenditure incurred in deploying Fibre in new development estates and Brownfield redevelopments (Fibre in Greenfields) was $28.0 million for the six months to 31 December 2013, resulting in a further 33,844 lots passed at 270 lots passed per day, an increase in the twelve months to 30 June 2013 of 159 lots passed per day.
The reduction in capital expenditure on the corresponding prior period was due to a release of provisions made in the previous financial year, a reduction in the number of temporary transit links that were built in the period and the implementation of IFANs replacing the more expensive TFANs, which reflects the increased maturity of the Fibre in Greenfields project. Capital expenditure was also lower than the corresponding prior period due to some delays in the commencement of construction activity associated with a slowing in developer demand.
Capital expenditure ($m) - for the six months to 31 Dec 2013 31 Dec 2012 31 Dec 2011
transit network 235.9 162.6 49.8
fibre access network 274.0 153.9 81.8
fibre in greenfields 28.0 106.6 38.0
fixed wireless 124.9 42.2 3.6
Satellite 263.8 137.4 0.3
Customer Connect 76.8 8.0 0.0
Common Capex 184.1 181.2 172.5
1,187.5 791.9 346.0
Directors’ Report finanCiaL review

NBN Co Half-Year Report as at 31 December 2013 21
Fixed Wireless – During the six months to 31 December 2013, capital expenditure incurred for Fixed Wireless was $124.9 million.
Fixed Wireless capital expenditure is driven by contracted milestone payments by NBN Co’s construction partners for the completion, integration and acceptance of Fixed Wireless base stations.
During the six months to December 2013, NBN Co acquired 286 wireless sites and integrated 152 base stations, bringing the cumulative total to 768 and 273 respectively.
The capital expenditure has resulted in a further 38,604 premises covered during the six months bringing the total to 65,860, along with 4,638 new activations bringing the cumulative total of 6,512 end-user premises with an active connection.
Satellite – Capital expenditure for the Long Term Satellite project for the six months to 31 December 2013 was $263.8 million. The capital expenditure related to progress on the construction of the two satellites due for launch in calendar year 2015 and progress with the acquisition and development of the ground stations.
Customer Connect – Capital expenditure incurred in connecting/migrating Fibre end-users to the NBN was $76.8 million for the six months to 31 December 2013 comprising connection and activation costs of $43.8 million and MDU cabling activity costs of $26.3 million.
Customer Connect capital expenditure is correlated to the volume of activations achieved. For the six months to 31 December 2013 a total of 32,090 Fibre Access Network premises were connected and 14,401 Fibre in Greenfields premises were connected bringing the cumulative totals to 52,531 and 27,546 respectively.
Common Capex – $184.1 million was incurred for Common capital expenditure including intangible asset additions, largely related to the development of the systems and software to support the functionality of the NBN (active network release (ANR)), the Operational Support Systems (OSS) and Business Support System (BSS). Common capex also includes costs related to Facilities, the data centres and National Test Facility and connection costs associated with the ISS.
Finance Leases – NBN Co acquired assets under finance lease arrangements with a discounted net present value of $1,390 million, which include network infrastructure assets acquired from Telstra.
NBN Co Half-Year Report as at 31 December 201322
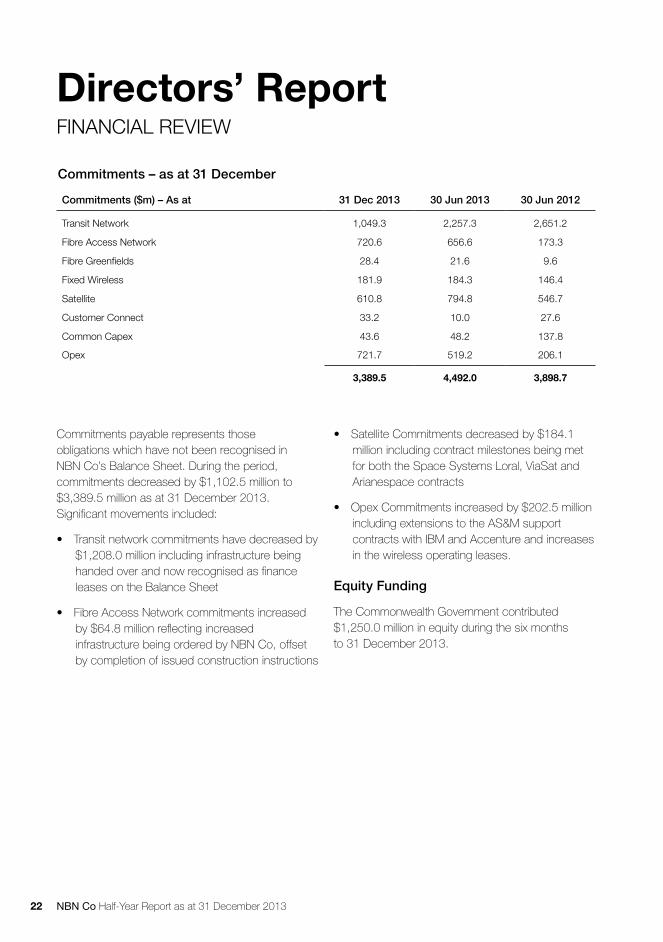
Commitments – as at 31 December
Commitments payable represents those obligations which have not been recognised in NBN Co’s Balance Sheet. During the period, commitments decreased by $1,102.5 million to $3,389.5 million as at 31 December 2013. Significant movements included:
• Transitnetworkcommitmentshavedecreasedby$1,208.0 million including infrastructure being handed over and now recognised as finance leases on the Balance Sheet
• FibreAccessNetworkcommitmentsincreasedby $64.8 million reflecting increased infrastructure being ordered by NBN Co, offset by completion of issued construction instructions
• SatelliteCommitmentsdecreasedby$184.1million including contract milestones being met for both the Space Systems Loral, ViaSat and Arianespace contracts
• OpexCommitmentsincreasedby$202.5millionincluding extensions to the AS&M support contracts with IBM and Accenture and increases in the wireless operating leases.
Equity Funding
The Commonwealth Government contributed $1,250.0 million in equity during the six months to 31 December 2013.
Commitments ($m) – As at 31 Dec 2013 30 Jun 2013 30 Jun 2012
transit network 1,049.3 2,257.3 2,651.2
fibre access network 720.6 656.6 173.3
fibre greenfields 28.4 21.6 9.6
fixed wireless 181.9 184.3 146.4
Satellite 610.8 794.8 546.7
Customer Connect 33.2 10.0 27.6
Common Capex 43.6 48.2 137.8
opex 721.7 519.2 206.1
3,389.5 4,492.0 3,898.7
Directors’ Report finanCiaL review
NBN Co Half-Year Report as at 31 December 2013 23
During the six months to 31 December 2013, a number of product trials and testing of future product enhancements were undertaken at the National Test Facility. Progressive delivery of additional OSS functions supported greater automation in a range of activities including location-based service qualification, ordering and provisioning. Improved functionality was deployed throughout the period in a series of releases for the ERP and BSS. Capability to support wholesale broadband speeds up to 1,000/400 Mbps (download/upload) was deployed during December 2013.
During the six months to 31 December 2013, the Contact Centre received a total of 84,930 contacts (inbound calls and email/web) from the public. This included 37,577 queries, 4,525 complex queries requiring additional information and 6,711 complaints, some of which required further investigation and resolution.
operating tHe nBn
All queries were responded to on the same day, complex queries took 7.6 days on average to resolve and complaints on average took 14.5 days to resolve.
The Contact Centre also handled 25,775 outbound communications (23,011 installation surveys, 2,362 new development resident updates, 412 communications survey calls) and 9,417 outbound follow-ups.
The Contact Centre also supported other business areas by handling 49,342 service activations technician calls, 27,784 service class zero records, 989 MDU online registration forms and 786 pre-installation backlog records.
nBn Co’S organiSation
NBN Co People
NBN Co’s head count at 31 December 2013 was 2,949 comprising 2,900 employees, 12 contractors and 37 labour hires. As at 31 December 2013, the average tenure of the workforce was 20.5 months and the average age was 40.4 years. NBN Co has 1% of the workforce employed on a part-time basis, with 29% of the workforce being women.
On 23 October 2013, Mr Jean-Baptiste Rousselot was appointed Head of Strategy and Transformation. Mr Rousselot draws on more than 15 years’ experience in the telecommunications and media sector in Australia and other roles in civil engineering and finance. Following this appointment, the position of Head of Quality became redundant, which saw Mr Mike Kaiser leave the Company.
On 7 November 2013, Mr Ralph Steffens stepped down as Chief Operating Officer (COO) and left the Company. Mr Greg Adcock was appointed COO. Mr Adcock has spent the past 20 years at Telstra.
On 12 December 2013, Mr Bill Morrow was appointed CEO effective from 2 April 2014. Mr Morrow has extensive global telecommunication experience, most recently as the CEO of Vodafone Hutchinson Australia (VHA).
Human Resources and Industrial Relations
During the period, there was no lost time due to industrial relations disputes.
As at 31 December 2013, there were an estimated 3,450 external workers actively working on the construction of the NBN.

NBN Co Half-Year Report as at 31 December 201324
Health and Safety
NBN Co’s lost time injury record over the past six months of 1.1 lost time injuries per million work hours for employees and 2.5 lost time injuries per million work hours for contractors, the increase in lost time injury statistics reflects an increase in the amount of construction activity, however they remain better than industry benchmarks.
Business Risks
NBN Co has identified a number of factors critical to building and operating the NBN.
NBN Co has implemented mitigation strategies to gain assurance that critical risks are monitored and managed appropriately. Details of critical risks can be found in NBN Co’s 2012-2013 Annual Report.
Critical risks are also reviewed as part of the preparation of NBN Co’s Corporate Plan each year. Following the finalisation of the Strategic Review, NBN Co is undertaking a comprehensive review of critical risks as part of the transformation program, details of which will be provided in the next Corporate Plan.
Board of Directors
The names and details of the directors in office at any time during the half-year and the period until the date of this report are as follows.
Current Directors The names of current directors who held office at the end of period are as follows:
Dr Ziggy Switkowski – Executive Chairman (Executive Director) was appointed as Executive Chairman on 3 October 2013.
Mr Patrick Flannigan – (Non-Executive Director) was appointed as a director on 11 November 2013.
Mr Simon Hackett – (Non-Executive Director) was appointed as a director on 11 November 2013.
Ms Alison Lansley – (Non-Executive Director)
Mr Justin Milne – (Non-Executive Director) was appointed as a director on 11 November 2013
Dr Kerry Schott – (Non-Executive Director)
Former Directors
The names of former directors who held office during the period are as follows:
Ms Siobhan McKenna – Chairman (Non-Executive Director, Chair of the Nominations Committee) resigned from the Board effective 3 October 2013.
Ms Diane Smith-Gander – Deputy Chair (Non-Executive Director and Chair of the People and Performance Committee) resigned from the Board effective 2 September 2013.
Mr Michael (Mike) Quigley – Chief Executive Officer (Executive Director) retired from the Board and as Chief Executive Officer effective 3 October 2013.
Mr Terrence (Terry) Francis – (Non-Executive Director, Chair of the Audit Committee effective from 5 August 2012) resigned from the Board effective 3 October 2013.
Mr Richard (Rick) Turchini – (Non-Executive Director and Chair of the Contracts (formerly Implementation) Committee effective from 5 August 2012) resigned from the Board effective 23 September 2013.
Directors’ ReportnBn Co’S organiSation

NBN Co Half-Year Report as at 31 December 2013 25
Mr Brad Orgill – (Non-Executive Director) was removed from the Board under Section 5.4.4 of NBN Co’s Constitution effective 3 October 2013.
Significant events subsequent to reporting date
On 3 February 2014, NBN Co announced that Optus had been awarded a five year contract to provide tracking, telemetry and control services for NBN Co’s two purpose-built satellites.
On 4 February 2014, NBN Co received $270 million of Commonwealth equity funding.
Except for items noted above, no other matter or circumstance has arisen since 31 December 2013 to the date of signing of this report that has significantly affected, or may affect:
• TheNBNGroup’soperationsinfuture financial years
• Theresultsofthoseoperationsinfuture financial years
• TheNBNGroup’sstateofaffairsinfuturefinancial years
Rounding of amounts
The Company is of a kind referred to in Class Order 98/100, issued by the Australian Securities and Investments Commission, relating to the “rounding off” of amounts in the Directors’ Report. Amounts in the Directors’ Report have been rounded in accordance with that Class Order to the nearest thousand dollars, or in certain cases, to the nearest dollar.
Auditor Independence
The directors received an Independence Declaration from the Auditor-General. A copy of this report has been included with the half-year financial report.
Dr Ziggy Switkowski Executive Chairman 18 February 2014

NBN Co Half-Year Report as at 31 December 201326
GPO Box 707 CANBERRA ACT 2601 19 National Circuit BARTON ACT Phone (02) 6203 7300 Fax (02) 6203 7777
18
Dr Ziggy Switkowski Executive Chairman NBN Co Limited Level 11, 100 Arthur Street North Sydney NSW 2060 Australia
NBN CO LIMITED HALF-YEAR FINANCIAL REPORT FOR THE PERIOD ENDED 31 DECEMBER 2013
AUDITOR’S INDEPENDENCE DECLARATION
In relation to my review of the half-year financial report of the NBN Group (comprising NBN Co Limited and the entities it controlled at the period’s end or from time to time during the financial period) for the half-year ended 31 December 2013, to the best of my knowledge and belief, there have been:
i) no contraventions of the auditor independence requirements of the Corporations Act 2001; and
ii) no contravention of any applicable code of professional conduct.
Australian National Audit Office
Michael J Watson Group Executive Director
Delegate of the Auditor-General
Canberra 18 February 2014

NBN Co Half-Year Report as at 31 December 2013 27
Financial Statements

NBN Co Half-Year Report as at 31 December 201328
Financial Statements
19
Statement of Comprehensive Income
31 December 2013 31 December 2012Notes $’000 $’000
Revenue
Telecommunication revenue 21,799 5,262
Other revenue 301 70
Interest income 25,695 23,983
Total Revenue 47,795 29,315
Other income 3 2,251 -
Expenses
Direct telecommunications costs (150,645) (66,025)
Employee benefits expenses 4 (188,661) (152,883)
External services costs – systems and organisation costs (52,502) (30,012)
Legal and negotiation support costs (6,469) (8,082)
IT and communications expenses (50,777) (41,202)
Occupancy expenses (17,622) (15,258)
Travel and entertainment costs (9,929) (8,284)
Communication and public information (5,174) (3,964)
Depreciation and amortisation expense 4 (169,131) (74,343)
Other expenses 4 (18,569) (7,639)
Finance costs 4 (94,576) (20,499)
Total Expenses (764,055) (428,191)
(Loss) before income tax (714,009) (398,876)
Income tax benefit (1,745) (9,391)
(Loss) for the period (715,754) (408,267)
(Loss) attributable to the shareholders (715,754) (408,267)
Other comprehensive (loss)/income
Items that may be reclassified to profit or lossChanges in the fair value of cash flow hedges (5,817) (31,305)
Income tax relating to components of other comprehensive income
1,745 9,390
Total other comprehensive income for the period, net of tax (4,072) (21,914)
Total comprehensive (loss) for the period (719,826) (430,182)
Total comprehensive (loss) attributable to the shareholders (719,826) (430,182)
The above statement should be read in conjunction with the accompanying notes.
For the six months endingNBN Group

NBN Co Half-Year Report as at 31 December 2013 29
20
Balance Sheet
31 December 2013 30 June 2013Notes $’000 $’000
Current assets
Cash and cash equivalents 5 232,505 103,472
Trade and other receivables 6 67,430 56,907
Inventories 10,990 6,118
Derivative financial assets 36,167 42,528
Held to maturity investment 7 446,407 915,097
Other current assets 8 26,740 30,055
Total current assets 820,239 1,154,177
Non-current assets
Trade and other receivables 6 9 393
Derivative financial assets 21,738 20,946
Property, plant & equipment 9 6,124,580 3,717,115
Intangible assets 10 700,895 619,658
Other non-current assets 8 6,952 6,435
Total non-current assets 6,854,174 4,364,547
Total assets 7,674,413 5,518,724
Current liabilities
Trade and other payables 12 814,850 597,496
Other liabilities 13 5,056 4,299
Other financial liabilities 14 16,190 37,770
Provisions 16 28,577 19,818
Total current liabilities 864,673 659,383
Non-current liabilities
Trade and other payables 12 2,033 455
Other liabilities 13 151,904 118,155
Other financial liabilities 14 2,681,168 1,299,493
Provisions 16 26,803 23,581
Total non-current liabilities 2,861,908 1,441,684
Total liabilities 3,726,581 2,101,067
Net assets 3,947,832 3,417,657
Equity
Contributed equity 17 6,478,445 5,228,445
Other reserves 40,206 44,277
(Accumulated losses) (2,570,819) (1,855,065)
Total equity 3,947,832 3,417,657
The above statement should be read in conjunction with the accompanying notes.
As atNBN Group

NBN Co Half-Year Report as at 31 December 201330
Financial Statements
21
Statement of Changes in Equity
For the six months endingAccumulated
lossesContributed
equityOther
reservesTotal equity
$’000 $’000 $’000 $’000Balance at 30 June 2012 (923,400) 2,832,000 15,726 1,924,326
Loss for the period (408,267) - - (408,267)
Other comprehensive income - - (21,913) (21,913)
Contributions of equity, net of transaction costs
- 946,445 - 946,445
Balance at 31 December 2012 (1,331,667) 3,778,445 (6,187) 2,440,591
Balance at 30 June 2013 (1,855,065) 5,228,445 44,278 3,417,658
Loss for the period (715,754) - - (715,754)
Other comprehensive income - - (4,072) (4,072)
Contributions of equity, net of transaction costs
- 1,250,000 - 1,250,000
Balance at 31 December 2013 (2,570,819) 6,478,445 40,206 3,947,832
The above statement should be read in conjunction with the accompanying notes.
NBN Group
NBN Co Half-Year Report as at 31 December 2013 31
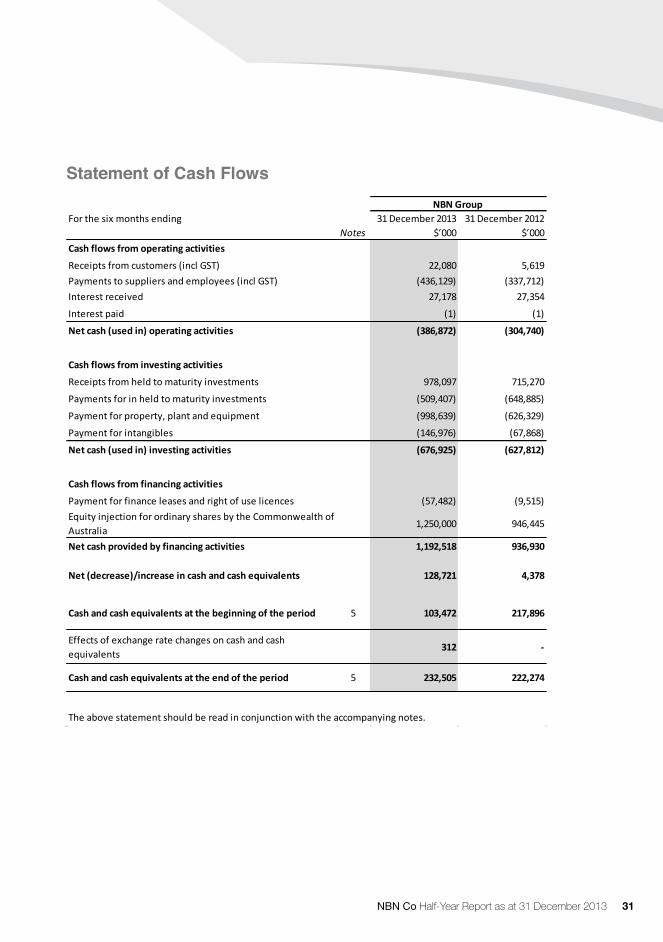
Statement of Cash Flows
31 December 2013 31 December 2012Notes $’000 $’000
Cash flows from operating activities
Receipts from customers (incl GST) 22,080 5,619 Payments to suppliers and employees (incl GST) (436,129) (337,712)Interest received 27,178 27,354
Interest paid (1) (1)
Net cash (used in) operating activities (386,872) (304,740)
Cash flows from investing activities
Receipts from held to maturity investments 978,097 715,270
Payments for in held to maturity investments (509,407) (648,885)
Payment for property, plant and equipment (998,639) (626,329)
Payment for intangibles (146,976) (67,868)
Net cash (used in) investing activities (676,925) (627,812)
Cash flows from financing activities
Payment for finance leases and right of use licences (57,482) (9,515)Equity injection for ordinary shares by the Commonwealth of Australia
1,250,000 946,445
Net cash provided by financing activities 1,192,518 936,930
Net (decrease)/increase in cash and cash equivalents 128,721 4,378
Cash and cash equivalents at the beginning of the period 5 103,472 217,896
Effects of exchange rate changes on cash and cash equivalents
312 -
Cash and cash equivalents at the end of the period 5 232,505 222,274
The above statement should be read in conjunction with the accompanying notes.
For the six months endingNBN Group

NBN Co Half-Year Report as at 31 December 201332
Financial Statements
23
Schedule of Commitments
As at 31 December 2013 30 June 2013By type Notes $’000 $’000Commitments receivableEquity receivable 23,921,555 25,171,555 Total commitments receivable 23,921,555 25,171,555 Commitments payableAssets ordered under finance lease and right of use licence arrangements 14 3,704,175 7,735,119 Property, plant and equipment 1,214,466 1,479,444 Intangible software assets 30,530 33,009 Operating leases 15 325,855 235,327 Other operating commitments 395,817 272,666 Aggregate commitments payable, gross of future interest charges 5,670,843 9,755,565 Future interest charges on finance lease and right of use licences (2,281,373) (5,263,595) Aggregate commitments payable, net of future interest charges 3,389,470 4,491,970
By maturityCommitments receivableWithin one year 4,720,000 5,400,555 From one to five years 19,201,555 19,771,000 Over five years - - Total commitments receivable 23,921,555 25,171,555 Commitments payableWithin one year 1,484,220 1,373,926 From one to five years 793,405 1,536,163 More than five years 3,393,218 6,845,476 Aggregate commitments payable, gross of future interest charges 5,670,843 9,755,565 Future interest charges on finance lease and right of use licences (2,281,373) (5,263,595) Aggregate commitments payable, net of future interest charges 3,389,470 4,491,970
NBN Group
The above statement should be read in conjunction with the accompanying notes, with specific reference to Note 14.

NBN Co Half-Year Report as at 31 December 2013 33
Notes to the Financial Statements
NBN Co Limited Notes to the Financial Statements
31 December 2013
24
Notes to the Financial Statements
1. Summary of significant accounting policies
NBN Co is an unlisted public Company incorporated and domiciled in Australia. It is a Company limited by shares and is wholly owned by the Commonwealth of Australia. The half-year financial report, comprising of the financial statements and notes to the financial statements, for the half-year ended 31 December 2013 comprise the Company and its subsidiaries (together referred to as the NBN Group).
(a) Basis of preparation
This non-statutory half-year financial report has been prepared in accordance with 1) AASB 134 ‘Interim Financial Reporting’; 2) the Corporations Act and 3) the CAC Act. NBN Co Limited is a for-profit entity for the purpose of preparing the half-year financial report. The half-year financial report does not include notes of the type normally included in an annual financial report and should be read in conjunction with the most recent annual financial report.
This half-year financial report has been prepared on a going concern basis and in accordance with the historical cost convention and does not take into account changing money values or fair values of assets unless otherwise stated. Cost is the fair value of the consideration given in exchange for net assets acquired.
The half-year financial report is presented in Australian dollars and values are rounded to the nearest thousand dollars unless otherwise stated.
NBN Co's current liabilities exceed its current assets by $44,434,000 as at 31 December 2013. The financial report has been prepared on a going concern basis, which contemplates the continuity of normal operations and the available equity funding of $23.9 billion at 31 December 2013 (note 17).
The half-year financial statements and the notes thereto have been prepared on the basis that NBN Co will continue to operate in accordance with the policy directions provided by the Commonwealth Government as set out in the Interim Statement of Expectations issued on 24 September 2013 and subsequent written instructions from NBN Co’s Shareholder Ministers. The Strategic Review of the NBN which was completed in December 2013, together with a number of ongoing reviews (including an Independent Cost-benefit Analysis and Review of Regulation) will assist the Government formulate policy and inform decisions on a revised Statement of Expectations for NBN Co. In addition, NBN Co will commence renegotiation of a number of key third party contracts, the outcome of which will further inform the Government's revised Statement of Expectations.
At the time of issuing this non-statutory half-year financial report, to the extent that the ongoing reviews impact on outcomes of the Strategic Review, it is not possible to determine how such a change may impact the intended operations of NBN Co or the likely impact of any such change on the carrying value of NBN Co’s assets, the value of actual and contingent liabilities, future funding arrangements, renegotiation of key third contracts or the extent of NBN Co’s commitments.
NBN Co Half-Year Report as at 31 December 201334
Notes to the Financial Statements
25
Notwithstanding, based on the findings of the Strategic Review and pending the finalisation of the ongoing reviews and renegotiations there is nothing to indicate that NBN Co will not continue to operate as a going concern.
(b) Accounting policies
NBN Co is incorporated under the Corporations Act and is subject to (inter alia) the National Broadband Network Companies Act 2011 (Cth). Consolidated annual financial statements are also required by section 36 of the CAC Act.
The accounting policies have been consistently applied to all periods presented and consistent with the 2012-2013 Annual Report, unless otherwise stated.
New standards that have become applicable for the first time for the December 2013 half-year report are AASB 119 Employee Benefits, AASB 13 Fair Value Measurement, AASB 12 Disclosure of Interest in Other Entities, AASB 2012-2 Amendments to Australian Accounting Standards – Disclosures – Offsetting Financial Assets and Financial Liabilities and AASB 2012-5 Amendments to Australian Accounting Standards arising from Annual Improvements 2009-2011 Cycle. These standards have introduced new disclosures for the interim report but did not affect the entity’s accounting policies or any of the amounts recognised in the financial statements.
Future Australian Accounting Standard Requirements
Certain new accounting standards and interpretations have been published that are not mandatory for 31 December 2013 reporting period. The NBN Group’s assessment of the impact of these new standards and interpretations is set out below.
(i) AASB 9 Financial Instruments (effective from 1 January 2015)
AASB 9 Financial Instruments addresses the classification and measurement of financial assets and financial liabilities. The standard will impact the annual reporting period commencing 1 July 2015.
There will be no impact on the NBN Group’s accounting for financial liabilities, as the new requirements only affect the accounting for financial liabilities that are designated at fair value through profit or loss and the NBN Group does not have any such liabilities. The NBN Group has not yet decided when to adopt AASB 9.
(c) Comparative Figures
Comparative figures have been adjusted to conform to the presentation of the financial statements and notes for the current financial period, where required.

NBN Co Half-Year Report as at 31 December 2013 35
26
2. Significant accounting judgements, estimates and assumptions
Accounting estimates In the process of applying the accounting policies listed in this note, the NBN Group has made certain judgements on the amounts recorded in the financial report. Estimates made in relation to the NBN Group financial report are to non-financial assets, employee provisions and disclosures of off balance sheet arrangements, including lease liabilities, contingent assets and contingent liabilities.
The principal accounting estimates adopted in the preparation of this financial report are consistent with those of the most recent annual financial report and include:
a) Make good provisions b) Employee benefits c) Capitalisation of labour d) Estimate of the present value of minimum lease payments e) Estimate of assets under construction f) Determination of fair value less costs to sell when considering impairment g) Estimated Useful lives of Property, Plant and Equipment h) Deferred tax i) Commitments
These estimates have been consistently applied to all the periods presented, unless otherwise stated.
3. Other Income
Gifted assets comprise Developer contributions for no consideration and Government Grants (refer to Note 13).
For the six months ending 31 December 2013 31 December 2012
$’000 $’000
Other Income - Gifted Assets 2,251 -
Total 2,251 -
NBN Group

NBN Co Half-Year Report as at 31 December 201336
Notes to the Financial Statements
27
4. Expenses
For the six months ending 31 December 2013 31 December 2012$’000 $’000
Employee benefits
Defined contribution superannuation expense (16,491) (11,145)
Other employee benefits (172,170) (141,738)
Total employee benefits (188,661) (152,883)
Other expenses
Accounting and audit fees (1,167) (839)
Directors fees and board expenses (2,334) (759)
Insurance expense (3,097) (2,542)
Occupational, health and safety (1,208) (758)
Printing, postage and courier (703) (828)
Product development and certification fees (471) (275)
Security costs (3,897) (803)
Other expenses (5,692) (835)
Total other expenses (18,569) (7,639)
Depreciation
Buildings (2,805) (202)
Buildings under finance leases (658) (659)
Leasehold improvements (3,742) (4,655)
Furniture, fittings & equipment (488) (462)
Machinery and equipment (31) (31)
IT equipment (5,104) (1,932)
Network equipment (50,093) (15,834)
Network equipment under finance leases (41,873) (7,869)
Total depreciation (104,794) (31,644)
Amortisation
Computer software (50,577) (29,168)
Telecommunication licence (13,679) (13,531)
Other intangible assets (81) -
Total amortisation (64,337) (42,699)
Total depreciation and amortisation (169,131) (74,343)
Finance Costs
Interest and finance charges paid/payable for financial liabilities
(94,107) (19,948)
Provisions: unwinding of discount (469) (551)
Finance costs expensed (94,576) (20,499)
Rental expense relating to operating leases (19,769) (12,684)
Hedge ineffectiveness on cashflow hedges 247 -
NBN Group

NBN Co Half-Year Report as at 31 December 2013 37
28
5. Current Assets – Cash and Cash Equivalents
6. Trade and Other Receivables
7. Held to Maturity Investments
8. Other Assets
As at 31 December 2013 30 June 2013$’000 $’000
Cash at bank 56,583 62,967
Term deposits 175,922 40,505
Total 232,505 103,472
NBN Group
As at 31 December 2013 30 June 2013$’000 $’000
CurrentTrade receivables 5,119 2,199 Interest receivable 7,942 9,496 Other receivables 31,169 1,002 GST receivable 23,200 44,210 Total 67,430 56,907
Non-CurrentOther receivable 9 393
NBN Group
As at 31 December 2013 30 June 2013$’000 $’000
CurrentTerm deposit 446,407 915,097
NBN Group
As at 31 December 2013 30 June 2013$’000 $’000
CurrentPrepayments 26,738 30,048 Other deposits 2 7 Total 26,740 30,055
Non-CurrentPrepayments 6,952 6,435
NBN Group

NBN Co Half-Year Report as at 31 December 201338
Notes to the Financial Statements
29
9. Non-current Assets - Property, Plant and Equipment
a) Property, plant and equipment
Depreciation of $104,794,000 (31 Dec 2012: $31,644,000) is included in depreciation and amortisation expense in the Statement of Comprehensive Income. b) Assets in the course of construction The carrying amounts of property, plant and equipment includes expenditure recognised as assets which are in the course of construction. As these assets were not installed and ready for use there is no depreciation charged on these amounts.
c) Leased assets Buildings and network assets include the following amounts where the substance of the underlying contractual arrangement is considered to be a finance lease.
Freehold Land
BuildingsLeasehold
improvementsFurniture and
fittings
Machinery and
equipmentIT equipment
Network assets
Total
$’000 $’000 $’000 $’000 $’000 $’000 $’000 $’000
At 30 June 2013Cost 13,019 158,681 68,894 5,812 926 45,888 3,557,337 3,850,557 Accumulated depreciation - (3,516) (18,378) (1,743) (103) (14,716) (94,986) (133,442)Net book value 13,019 155,165 50,516 4,069 823 31,172 3,462,351 3,717,115
Period ended 31 December 2013
Opening net book value 13,019 155,165 50,516 4,069 823 31,172 3,462,351 3,717,115 Additions - 85,856 5,549 340 217 2,786 2,417,511 2,512,259 Depreciation charge - (3,463) (3,742) (488) (31) (5,104) (91,966) (104,794)Net book value 13,019 237,558 52,323 3,921 1,009 28,854 5,787,896 6,124,580
At 31 December 2013Cost 13,019 244,537 74,443 6,152 1,143 48,674 5,974,848 6,362,816 Accumulated depreciation - (6,979) (22,120) (2,231) (134) (19,820) (186,952) (238,236)Net book value 13,019 237,558 52,323 3,921 1,009 28,854 5,787,896 6,124,580
NBN Group
As at 31 December 2013 30 June 2013$’000 $’000
Network assets 1,615,806 1,214,030 Leasehold improvements 13,033 6,991 Machinery and equipment 217 - Furniture and fittings 221 - Total assets in the course of construction 1,629,277 1,221,021
NBN Group

NBN Co Half-Year Report as at 31 December 2013 39
30
9. Non-current Assets - Property, Plant and Equipment (continued)
d) Non-current assets pledged as security None of the non-current assets have been pledged as security by the NBN Group.
10. Non-current Assets – Intangible Assets
a) Intangible assets
Amortisation of $64,337,000 (31 Dec 2012: $42,699,000) is included in depreciation and amortisation expense in the Statement of Comprehensive Income.
Period ended Year ended As at 31 December 2013 30 June 2013
$’000 $’000
BuildingsCost 26,348 26,348 Accumulated depreciation (2,878) (2,220)Net book value 23,470 24,128
Network assets Cost 2,680,734 1,280,830 Accumulated depreciation (69,134) (27,261)Net book value 2,611,600 1,253,569
NBN Group
Software Licences Other Total$’000 $’000 $’000 $’000
At 30 June 2013Cost 655,903 120,816 67 776,786 Accumulated amortisation (92,100) (65,026) (2) (157,128)Net book value 563,803 55,790 65 619,658
Period ended 31 December 2013 Opening net book amount 563,803 55,790 65 619,658 Additions 144,475 - 1,099 145,574 Amortisation (50,577) (13,679) (81) (64,337)Net book value 657,701 42,111 1,083 700,895
At 31 December 2013 Cost 800,378 120,816 1,166 922,360 Accumulated amortisation (142,677) (78,705) (83) (221,465)Net book value 657,701 42,111 1,083 700,895
NBN Group

NBN Co Half-Year Report as at 31 December 201340
Notes to the Financial Statements
31
10. Non-current Assets – Intangible Assets (continued)
b) Assets in the course of construction The carrying amount of the intangible assets includes expenditure recognised on assets which are in the course of construction. As these assets were not installed and ready for use there is no amortisation being charged on these amounts.
11. Impairment
As set out in Note 1(l)(i) of the 2012-2013 Annual Report, the assets which form part of the national broadband network currently work together to generate net cash flows. As a result, NBN Co has determined that it has one single cash generating unit (NBN Co Entity CGU).
At 31 December 2013, the Company has considered whether there are any impairment indicators including whether there are any impairment implications arising from the findings of the Strategic Review of the NBN which was completed in December 2013. The Strategic Review considered the operational and financial position of NBN Co based on the continuation of the previous rollout plans, and compared alternative scenarios and technology approaches. Under each of the alternative scenarios considered NBN Co would continue the roll out of Fibre Access Network to those premises where it has already entered into contracts to do so. The Strategic Review recommends that NBN Co develop an optimised multi-technology mix (MTM) approach to rolling out the NBN where NBN Co selects which technologies will be rolled out on an area-by-area basis, in a way that minimises peak funding and maximises long term economics.
The Strategic Review, together with a number of other ongoing reviews (including an Independent Cost-benefit Analysis and Review of Regulation) will assist the Government formulate policy and inform decisions on a revised Statement of Expectations for NBN Co. In addition, NBN Co will commence renegotiation of a number of key third party contracts, the outcome of which will further inform the Government's revised Statement of Expectations and the development of a revised Corporate Plan for the Company. Pending the finalisation of these ongoing reviews and renegotiations NBN Co has determined that the Strategic Review provides the best available indication of the likely long term prospects for the Company. Accordingly, NBN Co has determined that:
The assets which form part of the national broadband network will work together to generate net cash flows, and that therefore NBN Co has one single cash generating unit
The construction of the assets on NBN Co's balance sheet as at 31 December 2013 will be completed
These assets will not become redundant or obsolete as a result of a revised Statement of Expectations
As at 31 December 2013 30 June 2013$’000 $’000
Software 113,028 111,944 Total assets in the course of construction 113,028 111,944
NBN Group

NBN Co Half-Year Report as at 31 December 2013 41
32
11. Impairment (continued)
These assets will continue to form part of a going concern which generates an economic return under the multi-technology mix approach recommended in the Strategic Review
Despite the matters set out above, NBN Co has performed an impairment test, determining that fair value less costs to sell continues to be the appropriate basis for determining the recoverable amount. The fair value less cost to sell of the NBN Co assets is determined by reference to the depreciated replacement cost of the assets. This is considered to be the most appropriate methodology to apply given the early stage of build and that there is no active market for the entity’s assets. The approach is based on the assumption that the construction of the assets will be completed. Depreciated replacement cost is an estimate of what it would cost to acquire or construct a substitute national broadband network to the stage of current completion, adjusted for any obsolescence of the existing assets. In determining depreciated replacement cost, NBN Co considers the cost of recently constructed assets, current purchase prices and the current estimates of cost at completion (EAC) of assets under construction.
As a result of this assessment, it has been determined that the recoverable amount is not less than the carrying amount of the NBN Co Entity CGU as at 31 December 2013 and that there is therefore no impairment.
12. Trade and Other Payables
As at 31 December 2013 30 June 2013$’000 $’000
CurrentTrade payables 255,894 190,896 Other payables 376 129 Accruals 558,580 406,471 Total 814,850 597,496
As at 31 December 2013 30 June 2013$’000 $’000
Non CurrentOther payables 2,033 455
NBN Group
NBN Group
NBN Co Half-Year Report as at 31 December 201342
Notes to the Financial Statements
33
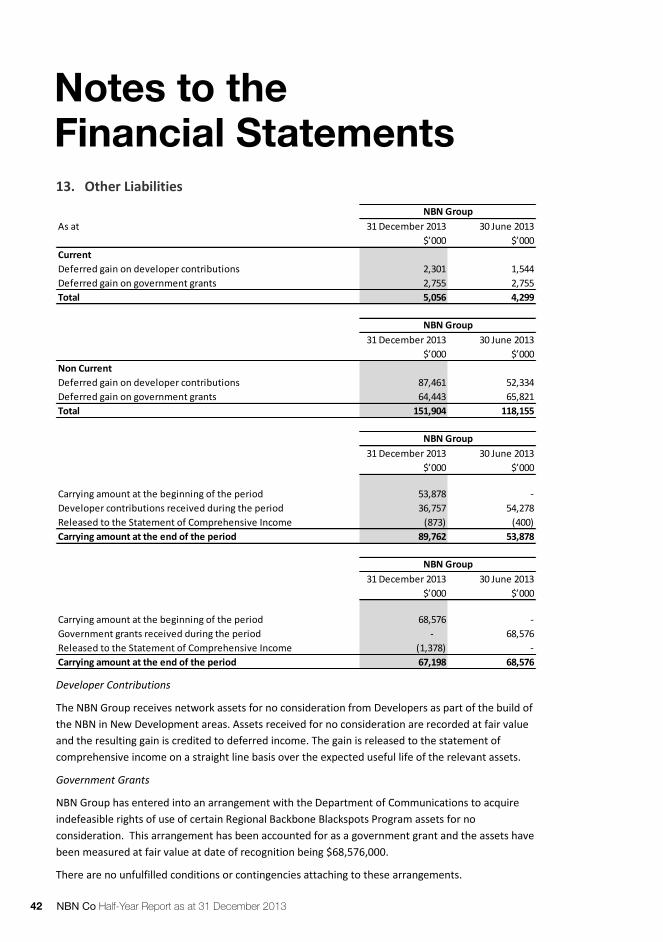
13. Other Liabilities
Developer Contributions
The NBN Group receives network assets for no consideration from Developers as part of the build of the NBN in New Development areas. Assets received for no consideration are recorded at fair value and the resulting gain is credited to deferred income. The gain is released to the statement of comprehensive income on a straight line basis over the expected useful life of the relevant assets.
Government Grants
NBN Group has entered into an arrangement with the Department of Communications to acquire indefeasible rights of use of certain Regional Backbone Blackspots Program assets for no consideration. This arrangement has been accounted for as a government grant and the assets have been measured at fair value at date of recognition being $68,576,000.
There are no unfulfilled conditions or contingencies attaching to these arrangements.
As at 31 December 2013 30 June 2013$’000 $’000
Current 2,301 1,544
Deferred gain on government grants 2,755 2,755 Total 5,056 4,299
31 December 2013 30 June 2013$’000 $’000
Non Current 87,461 52,334
Deferred gain on government grants 64,443 65,821 Total 151,904 118,155
31 December 2013 30 June 2013$’000 $’000
Carrying amount at the beginning of the period 53,878 - Developer contributions received during the period 36,757 54,278 Released to the Statement of Comprehensive Income (873) (400)Carrying amount at the end of the period 89,762 53,878
31 December 2013 30 June 2013$’000 $’000
Carrying amount at the beginning of the period 68,576 - Government grants received during the period - 68,576 Released to the Statement of Comprehensive Income (1,378) - Carrying amount at the end of the period 67,198 68,576
NBN Group
Deferred gain on developer contributions
Deferred gain on developer contributions
NBN Group
NBN Group
NBN Group

NBN Co Half-Year Report as at 31 December 2013 43
34
14. Other Financial Liabilities
The NBN Group accounts for various infrastructure assets and premises as finance leases and right of use licences. The finance leases and right of use licences have terms expiring within twenty to thirty five years.
Included within the carrying amount of property, plant and equipment in Note 9 is an amount for infrastructure assets of $2,611,600,000 (June 2013: $1,253,569,000) and premises of $23,470,000 (30 June 2013: $24,128,000) acquired under a finance lease or right of use licence arrangement.
Property and network infrastructure finance leases and right of use licences provide for the payment of incremental contingent rentals based on movements in a relevant variable price index (for example - CPI). Contingent rentals are not included in lease liabilities or right of use licence liabilities. Contingent rentals paid during the period are included as an expense in the Statement of Comprehensive Income.
The finance lease and right of use licence liabilities are recognised at the net present value (NPV) of the minimum lease payments (MLP). The difference between the NPV and the MLP is the future interest charge.
As at 31 December 2013 30 June 2013$’000 $’000
CurrentLease liabilities and right of use licences 16,190 37,770
Non CurrentLease liabilities and right of use licences 2,681,168 1,299,493
NBN Group
As at 31 December 2013 30 June 2013$’000 $’000
Finance lease and right of use licences are payable as follows:
Within one year 236,698 144,589 Later than one year but not later than five years 947,573 457,996 Later than five years 6,665,633 3,259,011 Minimum lease payments 7,849,904 3,861,596
Future finance charges (5,152,546) (2,524,333)Recognised as a liability 2,697,358 1,337,263
Representing lease liabilities:
Current 16,190 37,770 Non-current 2,681,168 1,299,493 Total finance lease and right of use licence liabilities 2,697,358 1,337,263
NBN Group

NBN Co Half-Year Report as at 31 December 201344
Notes to the Financial Statements
35
14. Other Financial Liabilities (continued)
(i) Commitments for assets ordered under finance lease and right of use license arrangements
At 31 December 2013 NBN Co had placed orders for assets under finance lease and right of use license arrangements which had not been handed over as at that date. The total commitments relating to these assets are outlined below:
These assets will be recognised as finance leases or right of use licenses under other financial liabilities when the infrastructure is handed over to NBN Co.
(ii) Network Infrastructure
The Telstra Definitive Agreements provides access to various infrastructure including dark fibre links, rack spaces in exchanges, ducts and associated duct infrastructure (pits and manholes) which have been recognised as finance leases when the infrastructure is handed over to NBN Co.
The rights of access have an initial term of 35 years, with two options each exercisable at NBN Co’s discretion, of 10 further years each. Key elements of the lease arrangement including interest rate, lease term and valuation methodology were assessed at the inception of the lease. Inception date for the finance lease arrangements has been determined as 7 March 2012 when the Telstra Definitive Agreements became unconditional.
(iii) Property Leases
The NBN Group leases a total of 6 (June 2013: 6) industrial properties under finance leases with various occupancy terms that are due to expire within 20 years.
As at 31 December 2013 30 June 2013$’000 $’000
Commitments in relation to assets ordered under finance lease and right of use licence arrangements is as follows:
Within one year 79,746 77,607 Later than one year but not later than five years 419,430 923,977 Later than five years 3,205,000 6,733,535 Minimum lease payments 3,704,176 7,735,119
Future finance charges (2,281,373) (5,263,595)Recognised as a commitment 1,422,803 2,471,524
Representing commitments payable, net of future interest charges:
Current 28,411 163,958 Non-current 1,394,392 2,307,566 Commitments payable, net of future interest charges 1,422,803 2,471,524
NBN Group

NBN Co Half-Year Report as at 31 December 2013 45
36
15. Operating Leases
Operating Leases
The NBN Group leases 40 properties and 255 commercial vehicles (June 2013: 33 properties and 156 commercial vehicles) under operating leases with various occupancy terms that are due to expire within one to ten years.
Leases generally provide the NBN Group with a right of renewal, at which time the commercial terms are renegotiated with reference to market benchmarks. Lease payments for properties generally comprise a base amount plus an incremental contingent rental based on movements in the consumer price index (CPI) and reviews to market-based levels.
Not included in the above commitments are contingent rental payments which may arise. Full details of the NBN Group’s operating leases are also contained in the Schedule of Commitments.
16. Provisions
a) Amounts not expected to be settled within the next 12 months
The non-current provision for employee benefits includes long service leave and deferred incentives not expected to be wholly settled in the next 12 months.
As at 31 December 2013 30 June 2013$’000 $’000
Commitments for minimum lease payments in relation to non-cancellable operating leases are payable as follows:
Within one year 34,771 29,878 Later than one year but not later than five years 107,103 94,601 Later than five years 183,981 110,848 Total 325,855 235,327
NBN Group
As at 31 December 2013 30 June 2013$’000 $’000
CurrentEmployee benefits 27,499 18,072 Make good provision 1,078 1,746 Total 28,577 19,818
Non-CurrentEmployee benefits 4,837 4,373 Make good provision 21,966 19,208 Total 26,803 23,581
NBN Group
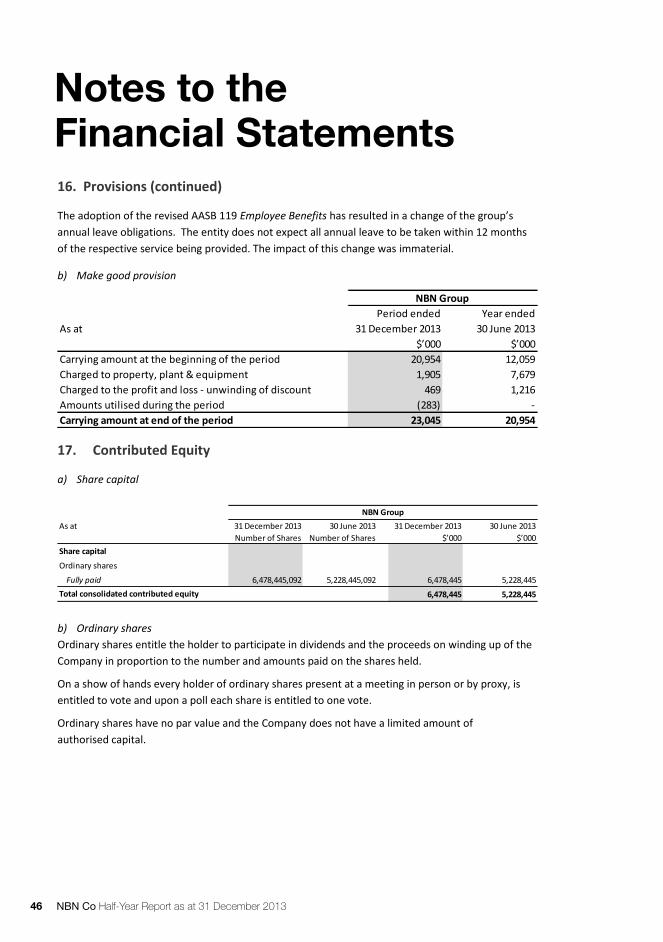
NBN Co Half-Year Report as at 31 December 201346
Notes to the Financial Statements
37
16. Provisions (continued)
The adoption of the revised AASB 119 Employee Benefits has resulted in a change of the group’s annual leave obligations. The entity does not expect all annual leave to be taken within 12 months of the respective service being provided. The impact of this change was immaterial.
b) Make good provision
17. Contributed Equity
a) Share capital
b) Ordinary shares Ordinary shares entitle the holder to participate in dividends and the proceeds on winding up of the Company in proportion to the number and amounts paid on the shares held.
On a show of hands every holder of ordinary shares present at a meeting in person or by proxy, is entitled to vote and upon a poll each share is entitled to one vote.
Ordinary shares have no par value and the Company does not have a limited amount of authorised capital.
Period ended Year ended As at 31 December 2013 30 June 2013
$’000 $’000Carrying amount at the beginning of the period 20,954 12,059 Charged to property, plant & equipment 1,905 7,679 Charged to the profit and loss - unwinding of discount 469 1,216 Amounts utilised during the period (283) - Carrying amount at end of the period 23,045 20,954
NBN Group
As at 31 December 2013 30 June 2013 31 December 2013 30 June 2013Number of Shares Number of Shares $’000 $’000
Share capital
Ordinary shares
Fully paid 6,478,445,092 5,228,445,092 6,478,445 5,228,445
6,478,445 5,228,445 Total consolidated contributed equity
NBN Group

NBN Co Half-Year Report as at 31 December 2013 47
38
17. Contributed Equity (continued)
c) Movements in ordinary share capital
d) Capital risk management The Company’s objectives when managing capital is to safeguard its ability to continue as a going concern, so that it can continue to provide benefits for other stakeholders and to maintain an optimal capital structure.
e) Equity Funding On 22 June 2011 the Commonwealth and NBN Co entered into an Equity Funding Agreement, whereby the Commonwealth provided assurances to the Company in relation to the provision of equity funding until 30 June 2021 unless terminated earlier. The Commonwealth has committed to provide funding sufficient to meet the forecast expenditure of the Company in the Corporate Plan. The total funding pursuant to the agreement was capped at $27.5 billion, excluding any amounts payable in the event of termination of the Telstra and Optus agreements. This cap was subsequently increased to $30.4 billion under an amendment entered into on 8 August 2012.
Date Details Issue $
1 July 2011 Opening Balance 1,362,000,010 1.00 1,362,000,010
5 July 2011 Equity injection 350,000,000 1.00 350,000,000
31 August 2011 Equity injection 450,000,000 1.00 450,000,000
18 November 2011 Equity injection 320,000,000 1.00 320,000,000
15 February 2012 Equity injection 350,000,000 1.00 350,000,000
30 June 2012 Closing Balance 2,832,000,010 1.00 2,832,000,010
26 July 2012 Equity injection 290,000,000 1.00 290,000,000
16 August 2012 Equity injection 290,000,000 1.00 290,000,000
19 November 2012 Equity injection 366,445,081 1.00 366,445,081 14 January 2013 Equity injection 800,000,001 1.00 800,000,001 9 May 2013 Equity injection 650,000,000 1.00 650,000,000
30 June 2013 Closing Balance 5,228,445,092 1.00 5,228,445,092
16 July 2013 Equity injection 1,250,000,000 1.00 1,250,000,000
6,478,445,092 1.00 6,478,445,092 Total consolidated contributed equity at 31 December 2013
NBN Group NBN GroupNumber of
SharesValue of Shares $
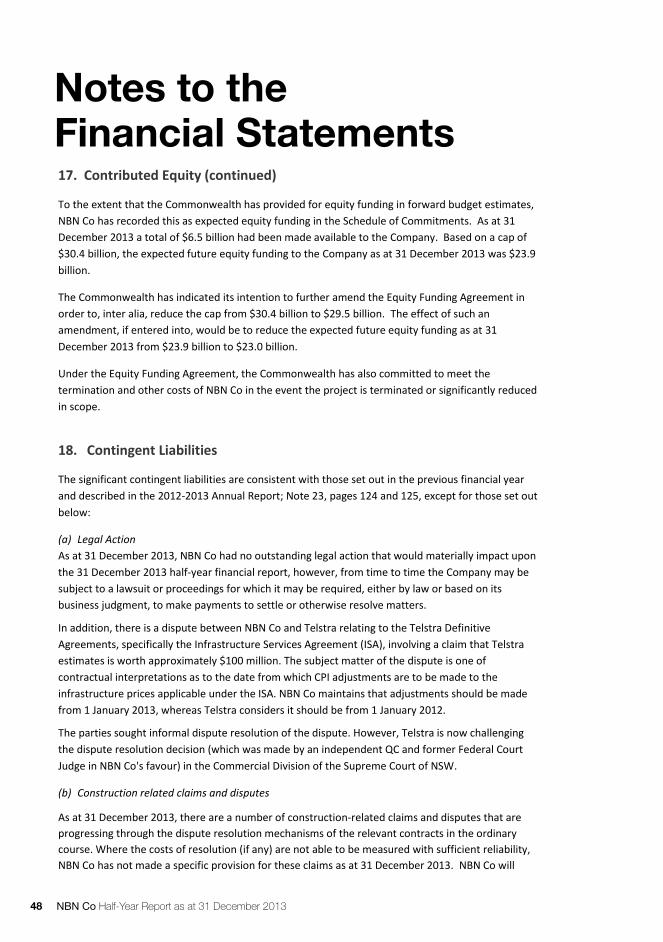
NBN Co Half-Year Report as at 31 December 201348
Notes to the Financial Statements
39
17. Contributed Equity (continued)
To the extent that the Commonwealth has provided for equity funding in forward budget estimates, NBN Co has recorded this as expected equity funding in the Schedule of Commitments. As at 31 December 2013 a total of $6.5 billion had been made available to the Company. Based on a cap of $30.4 billion, the expected future equity funding to the Company as at 31 December 2013 was $23.9 billion.
The Commonwealth has indicated its intention to further amend the Equity Funding Agreement in order to, inter alia, reduce the cap from $30.4 billion to $29.5 billion. The effect of such an amendment, if entered into, would be to reduce the expected future equity funding as at 31 December 2013 from $23.9 billion to $23.0 billion.
Under the Equity Funding Agreement, the Commonwealth has also committed to meet the termination and other costs of NBN Co in the event the project is terminated or significantly reduced in scope.
18. Contingent Liabilities
The significant contingent liabilities are consistent with those set out in the previous financial year and described in the 2012-2013 Annual Report; Note 23, pages 124 and 125, except for those set out below:
(a) Legal Action As at 31 December 2013, NBN Co had no outstanding legal action that would materially impact upon the 31 December 2013 half-year financial report, however, from time to time the Company may be subject to a lawsuit or proceedings for which it may be required, either by law or based on its business judgment, to make payments to settle or otherwise resolve matters.
In addition, there is a dispute between NBN Co and Telstra relating to the Telstra Definitive Agreements, specifically the Infrastructure Services Agreement (ISA), involving a claim that Telstra estimates is worth approximately $100 million. The subject matter of the dispute is one of contractual interpretations as to the date from which CPI adjustments are to be made to the infrastructure prices applicable under the ISA. NBN Co maintains that adjustments should be made from 1 January 2013, whereas Telstra considers it should be from 1 January 2012.
The parties sought informal dispute resolution of the dispute. However, Telstra is now challenging the dispute resolution decision (which was made by an independent QC and former Federal Court Judge in NBN Co's favour) in the Commercial Division of the Supreme Court of NSW.
(b) Construction related claims and disputes
As at 31 December 2013, there are a number of construction-related claims and disputes that are progressing through the dispute resolution mechanisms of the relevant contracts in the ordinary course. Where the costs of resolution (if any) are not able to be measured with sufficient reliability, NBN Co has not made a specific provision for these claims as at 31 December 2013. NBN Co will

NBN Co Half-Year Report as at 31 December 2013 49
40
18. Contingent Liabilities (continued)
continue to assess these claims, and where appropriate or applicable settle or make payments to resolve such claims on a case by case basis.
NBN Co is of the opinion that adequate allowance has been made for construction related claims and disputes to the extent that they can be reliably measured. The disclosure of any further information about these contingent claims and disputes would be prejudicial to the interests of the Company.
19. Significant Contractual Arrangements
The NBN Group has entered into a large number of contracts that will underpin the delivery of the network infrastructure. NBN Co’s contracts with its Delivery Partners are subject to periodic renewal. The ability of NBN Co to renegotiate these contracts enables NBN Co to ensure contract arrangements support the long term rollout of the NBN in accordance with the Interim Statement of Expectations. The NBN Group will progressively incur further commitments through the life of these contractual arrangements as they are executed and delivered during the build of the network. NBN Co’s Schedule of Commitments on page 32 is prepared on the basis that the Company is a going concern (refer to Note 1(a)) and will deliver the network infrastructure.
Should future circumstances or conditions arise that change this view, the value of commitments incurred at that point in time will be reassessed with reference to relevant contractual termination obligations. These obligations would be typically lower than those disclosed in the schedule of commitments.
Details of the significant contractual arrangements are included in the 2012‐2013 Annual Report Note 24.

NBN Co Half-Year Report as at 31 December 201350
Notes to the Financial Statements
41
20. Related Party Transactions
a) Parent entity The parent entity within the NBN Group is NBN Co Limited. The ultimate parent entity and ultimate controlling entity is the Commonwealth of Australia.
b) Acquisitions There were no acquisitions in the period.
c) Transactions with related parties The following transactions occurred with related parties:
21. Fair Value Measurement of Financial Instruments
The NBN Group uses the following fair value hierarchy for determining and disclosing the fair value of financial instruments by valuation technique as required by AASB 7 Financial Instruments:
Level 1: quoted (unadjusted) prices in active markets for identical assets or liabilities. Level 2: inputs other than quoted prices included within level 1 that are observable for the asset or liability, either directly (as prices) or indirectly (derived from prices). Level 3: inputs for the asset or liability that are not based on observable market data (unobservable inputs).
The NBN Group’s derivative financial assets and liabilities are the only assets and liabilities carried at fair value in the balance sheet. The fair value of these instruments is determined using valuation techniques using observable market data, categorised as “Level 2”.
The following table presents the group’s financial assets and financial liabilities measured and recognised at fair value at 31 December and 30 June 2013 on a recurring basis:
For the six months ending 31 December 2013 31 December 2012$ $
Equity injectionsEquity injected by the Commonwealth of Australia into NBN Co Limited (Refer to Note 17)
1,250,000,000 946,445,081
For the six months ending 31 December 2013 31 December 2012
$ $
Other transactionsService qualification fee from the Department of Communications
825,077 825,075
NBN Group
NBN Group

NBN Co Half-Year Report as at 31 December 2013 51
42
21. Fair Value Measurement of Financial Instruments (continued)
a) Valuation techniques used to derive level 2 and level 3 fair values The fair value of financial instruments that are not traded in an active market (for example, over-the-counter derivatives) is determined using valuation techniques. These valuation techniques maximise the use of observable market data where it is available and rely as little as possible on entity specific estimates. If all significant inputs required to fair value an instrument are observable, the instrument is included in level 2.
If one or more of the significant inputs is not based on observable market data, the instrument is included in level 3.
Specific valuation techniques used to value financial instruments include:
i) The use of quoted market prices or dealer quotes for similar instruments. ii) The fair value of interest rate swaps is calculated as the present value of the estimated future
cash flows based on observable yield curves. iii) The fair value of forward foreign exchange contracts is determined using forward exchange rates
at the balance sheet date. iv) Other techniques, such as discounted cash flow analysis, are used to determine fair value for the
remaining financial instruments.
All of the resulting fair value estimates are included in level 2.
At 31 December 2013 Level 1 Level 2 Level 3 Total$’000 $’000 $’000 $’000
AssetsDerivatives used for hedging - 57,905 - 57,905 Total Assets - 57,905 - 57,905
Level 1 Level 2 Level 3 TotalAt 30 June 2013 $’000 $’000 $’000 $’000
AssetsDerivatives used for hedging - 63,474 - 63,474 Total Assets - 63,474 - 63,474

NBN Co Half-Year Report as at 31 December 201352
Notes to the Financial Statements
43
21. Fair Value Measurement of Financial Instruments (continued)
b) Fair values of other financial instruments The group also has a number of financial instruments which are not measured at fair value in the balance sheet. These had the following fair values as at 31 December 2013:
A 1% decrease/increase in discount rates would result in a $297,390,000 increase/$251,730,000 decrease in the value of lease liabilities and right of use licences.
Due to their short-term nature, the carrying amount of current receivables, current payables and current financial liabilities not presented above is assumed to approximate their fair value.
22. Events Occurring After the Reporting Period
On 3 February 2014, NBN Co announced that Optus had been awarded a 5 year contract to provide tracking, telemetry and control services for NBN Co’s two purpose-built satellites.
On 4 February 2014, NBN Co received $270 million of Commonwealth equity funding.
Except for items noted above, no other matter or circumstance has arisen since 31 December 2013 to the date of signing of this report that has significantly affected, or may affect:
a) The NBN Group’s operations in future financial years b) The results of those operations in future financial years c) The NBN Group’s state of affairs in future financial years
At 31 December 2013 Carrying Amount Fair Value$’000 $’000
Non-current receivablesOther receivables 9 9
Non-current payablesOther payables 2,033 2,033
Other financial liabilitiesLease liabilities and right of use licences 2,681,168 2,681,168

NBN Co Half-Year Report as at 31 December 2013 53
Directors’ DeclarationNBN Co Limited
Directors’ Declaration 31 December 2013
44
Directors’ Declaration(1) these non-statutory financial statements and notes set out on pages 27 to 52 are in
accordance with AASB 134 ‘Interim Financial Reporting’, the Corporations Act and the CAC Act, giving a true and fair view of the NBN Group’s financial position and of its performance for the financial period ended on that date and
(2) there are reasonable grounds to believe that the NBN Group will be able to pay its debts as and when they become due and payable
This declaration is made in accordance with a resolution of the directors.
Signed in accordance with a resolution of the directors.
Dr Ziggy Switkowski Executive Chairman
18 February 2014

NBN Co Half-Year Report as at 31 December 201354
GPO Box 707 CANBERRA ACT 2601 19 National Circuit BARTON ACT Phone (02) 6203 7300 Fax (02) 6203 7777
45
INDEPENDENT AUDITOR’S REVIEW REPORT
To the members of NBN Co Limited
Report on the half-year financial report I have reviewed the accompanying half-year financial report of NBN Co Limited (the Company), which comprises the Balance Sheet as at 31 December 2013, the Statement of Comprehensive Income, Statement of Changes in Equity and the Statement of Cash Flows for the half-year ended on that date, the Schedule of Commitments as at 31 December 2013, Summary of significant accounting policies and other explanatory notes and the Directors’Declaration for the NBN Group. The NBN Group comprises the Company and the entities it controlled at 31 December 2013 or from time to time during that half-year.
Directors’ responsibility for the half-year financial report The directors of the Company are responsible for the preparation of the half-year financial report that gives a true and fair view in accordance with Australian Accounting Standard AASB 134 Interim Financial Reporting and for such internal control as the directors determine is necessary to enable the preparation of the half-year financial report that gives a true and fair view and is free from material misstatement whether due to fraud or error.
Auditor’s responsibility My responsibility is to express a conclusion on the half-year financial report based on my review. I conducted my review in accordance with Australian Auditing Standard on Review Engagements ASRE 2410 Review of a Financial Report Performed by the Independent Auditor of the Entity, in order to state whether, on the basis of the procedures described, anything has come to my attention that causes me to believe that the financial report does not give a true and fair view of NBN Group’s financial position as at 31 December 2013 and its performance for the half-year ended on that date in accordance with Accounting Standard AASB 134: Interim Financial Reporting. As the auditor of the Company, ASRE 2410 requires that I comply with the ethical requirements relevant to the audit of the annual financial report.
A review of a half-year financial report consists of making enquiries, primarily of persons responsible for financial and accounting matters, and applying analytical and other review procedures. A review is substantially less in scope than an audit conducted in accordance with Australian Auditing Standards and consequently does not enable me to obtain assurance that I would become aware of all significant matters that might be identified in an audit. Accordingly, I do not express an audit opinion.
Independence
In conducting my review, I have complied with the independence requirements of the Corporations Act 2001.

NBN Co Half-Year Report as at 31 December 2013 55
46
Conclusion Based on my review, which is not an audit, I have not become aware of any matter that makes me believe that the half-year financial report of NBN Co Limited does not give a true and fair view of the financial position of the NBN Group as at 31 December 2013 and of the Group’s financial performance for the half year ended on that date, in accordance with Accounting Standard AASB 134: Interim Financial Reporting.
Australian National Audit Office
Michael J. Watson Group Executive Director
Delegate of the Auditor-General
Canberra 18 February 2014

NBN Co Half-Year Report as at 31 December 201356
Glossary of Terms
16
Glossary Term Definition
Access Seeker A customer acquiring NBN Co wholesale services with the intention to supply broadband services to Retail Service Providers (Service Providers) or End-Users.
Access Virtual Circuit (AVC)
The bandwidth allocated to the End-User premises.
Active Network Release (ANR)
Active network release. Relates to the roll out of active network design. Number reflects the release e.g. ANR1 is the first release.
Aggregation Node (AN)
A facility that provides a Point of Interconnect (PoI) to Service Providers/WSPs for an Access Aggregation Region (AAR), comprising a number of regional FAN sites. Note that an AN will also have a co-located FAN site for its local area.
Australian National Audit Office (ANAO)
Is the financial statements auditor of NBN Co
Average Revenue Per User (ARPU)
The total revenue divided by the average number of subscribers.
Board Board of Directors
Business Support System (BSS)
The set of systems that will provide NBN Co with the capabilities to manage Access Seekers, take orders, process bills and collect payments.
Cash Generating Unit (CGU)
the lowest level of aggregation for which the cash inflows are independent of cash inflows from other assets
Capital Expenditure (Capex)
The cost of purchasing tangible and intangible assets.
Commitments The value of commitments as disclosed in the Schedule of Commitments has been compiled on the basis that the NBN Group is a going concern (refer to Note 1 (a)) and includes estimates of:
i) amounts which represent an open purchase order in accordance with a supply contract ii) the value of the purchase order to the extent that NBN Co would be required to pay for goods or services to be delivered, subject to any termination rights iii) amounts payable under non-cancellable operating leases for premises iv) amounts payable for assets ordered under finance lease and right of use licence arrangements
which have not yet been handed over. These amounts are disclosed at the net present value of the minimum lease payments.
v) any contracted amounts subject to a minimum order quantity vi) any non-cancellable fixed price contracts
Common Network Infrastructure (CNI)
Is rack shelving for Optical Distribution Frames (ODFs), Optical Line Terminal (OLT), Fibre Termination Panels (FTPs) and patch cables, DWDM equipment. CNI equipment is assembled by NBN Co at a central site in Rowville, Victoria and then shipped to the FAN site where it is to be installed
Connectivity Virtual Circuit (CVC)
Determines the capacity required to serve each CSA. The CVC is an aggregation of the AVCs from the End-User premises back to the PoI.
Cost Per Premises The Cost Per Premises is calculated by the connection costs (including Drop, Activation and NTD) and LNDN costs divided by the Premises Passed.
Customers A customer to NBN Co, also defined as an Access Seeker or a Retail Service Provider.
Dark Fibre Links Length of optical fibre between certain points.
Dense Wavelength-Division Multiplexing (DWDM)
A form of technology which multiplexes a number of optical carrier signals onto a single optical fibre by using different wavelengths (i.e. colours) of laser light. This technique enables bidirectional communications over one strand of fibre, as well as multiplication of capacity.
Developers Developers are responsible for meeting the cost and deployment of pit and pipe infrastructure within New Development Estates. Ownership of the pit and pipe must be transferred to NBN Co pursuant to an agreement with NBN Co to provide fibre in the new estate.
Disconnection Date (DCD)
Except in limited circumstances, the date falling 18 months after a Rollout Region is declared Ready for Service.
Distribution Fibre Connection between the Fibre Distribution Hub (FDH) and the FAN, for both Regional FANs and the Metropolitan FANs, as well as the connectivity between the non-adjacent Fibre Serving Area Modules in the Capital Cities and the Metropolitan FANs.
Distribution Network The part of the network that connects the FAN to the FDH.
End-Users Final downstream customers to NBN Co’s Access Seekers.
17
Term Definition
Equity Funding The Commonwealth and NBN Co entered into an equity funding agreement, whereby the Commonwealth provided assurances to the Company in relation to the provision of equity funding until 30 June 2021 unless terminated earlier. The Commonwealth has committed to provide funding sufficient to meet the forecast expenditure of the Company in the Corporate Plan (which is defined to mean the most recent corporate plan of NBN Co endorsed by the Shareholder Ministers).
Estimate at Completion (EAC)
The Estimate at Completion (EAC) for the access fibre network is NBN Co’s best estimate, based on latest available information, of the final cost to design and construct those FSAMs where build has commenced.
The EAC is calculated each month for all FSAMs where NBN Co has commenced build - i.e. where NBN Co has issued a contract instruction for construction activity (CICA). Typically the EAC is based on a Fixed Price Lump Sum (FPLS) which calculates the cost to construct an FSAM based on an agreed design with an agreed bill of quantities and materials at agreed rates. NBN Co then adds an allowance for provisional items such as aerial make-ready work, traffic management costs and additional costs related to digging. These amounts are included as an estimate only, and the final actual cost of these items are only known at the completion of the construction phase.
During the course of the build NBN Co may receive claims from Delivery Partners for variations to the agreed design. The cost of all approved variations plus an assessment of the unapproved variations are added to the EAC. This may include a revisions to amounts originally included in the EAC as provisional items.
In addition, NBN Co maintains a register of known commercial and legal risks. On a monthly basis assessment of these risks is made and, where the financial impact of the risk can be reliably estimated, an appropriate amount is included in the EAC. The EAC does not include unsubstantiated commercial or legal claims where the amount cannot be reliably estimated.
In addition to the EAC process, NBN Co also undertakes a review of construction contracts when preparing its financial statements.
EACs are prepared in gross dollars and converted to a Cost Per Premises (EAC CPP) using the latest count of addressable GNAF (Geocode National Address File) premises for each FSAM.
For comparison to the Corporate Plan the EAC CPP for access fibre specifically excludes NBN Co internal labour, the costs associated with connecting premises, costs of the transit network and the financial lease costs of the Telstra infrastructure. These costs are captured and reported separately.
Fibre Access Node (FAN)
A facility that houses the active equipment providing services to a Fibre Serving Area (FSA). Note that Urban FANs will also provide a (POI) to access seekers.
Fibre Access Network (Brownfields)
Pre-existing premises that will be covered by FTTP.
Fibre Distribution Hub (FDH)
The equipment located in a Fibre Distribution Area (FDA) where Distribution Fibre is split to provide Local Fibre that runs down each street.
Fibre Footprint The premises that will be serviceable by NBN Co’s FTTP Network by the end of the rollout period.
Fibre Serving Area Module (FSAM)
A series of up to 16 FDAs linked in a double loop configuration. Typically, a single fibre sheath will connect the FSAM and its (up to 16) FDHs back to a nominated Fibre Access Node (FAN). An FSAM may be a small town or a part suburb in the case of large cities. The number of premises contained in an FSAM is typically between 2,000 – 3,000, depending on location and network planning/topology.
Fibre to the Basement (FTTB)
Network design in which the Fibre network is deployed to the building.
Fibre to the Node (FTTN)
Network design in which the Fibre network is deployed to the node.
Fibre to the Premises (FTTP)
Network design in which the Fibre network is deployed to each premises.
Fixed Wireless Network
Network design which network connections are provided through radio signals.
Geocoded National Address File (GNAF)
GNAF information is provided by PSMA Australia Limited (PSMA). GNAF lists all valid physical addresses in Australia. It contains approximately 12.6 million physical addresses, each linked to its unique geocode (that is, the specific latitude and longitude of the address). Data used to build GNAF comes from contributors that include the Australian Electoral Commission, Australia Post, state, territory and Australian Government mapping agencies and land registries. GNAF is provided by PSMA.
Government Business Enterprise (GBE)
A Government Business Enterprise (GBE) is a Commonwealth authority or Commonwealth Company as defined by the Commonwealth Authorities and Companies Act 1997 (CAC Act) and prescribed as a GBE under the Commonwealth Authorities and Companies Regulations 1997 (CAC Act Regulations).

NBN Co Half-Year Report as at 31 December 2013 57
17
Term Definition
Equity Funding The Commonwealth and NBN Co entered into an equity funding agreement, whereby the Commonwealth provided assurances to the Company in relation to the provision of equity funding until 30 June 2021 unless terminated earlier. The Commonwealth has committed to provide funding sufficient to meet the forecast expenditure of the Company in the Corporate Plan (which is defined to mean the most recent corporate plan of NBN Co endorsed by the Shareholder Ministers).
Estimate at Completion (EAC)
The Estimate at Completion (EAC) for the access fibre network is NBN Co’s best estimate, based on latest available information, of the final cost to design and construct those FSAMs where build has commenced.
The EAC is calculated each month for all FSAMs where NBN Co has commenced build - i.e. where NBN Co has issued a contract instruction for construction activity (CICA). Typically the EAC is based on a Fixed Price Lump Sum (FPLS) which calculates the cost to construct an FSAM based on an agreed design with an agreed bill of quantities and materials at agreed rates. NBN Co then adds an allowance for provisional items such as aerial make-ready work, traffic management costs and additional costs related to digging. These amounts are included as an estimate only, and the final actual cost of these items are only known at the completion of the construction phase.
During the course of the build NBN Co may receive claims from Delivery Partners for variations to the agreed design. The cost of all approved variations plus an assessment of the unapproved variations are added to the EAC. This may include a revisions to amounts originally included in the EAC as provisional items.
In addition, NBN Co maintains a register of known commercial and legal risks. On a monthly basis assessment of these risks is made and, where the financial impact of the risk can be reliably estimated, an appropriate amount is included in the EAC. The EAC does not include unsubstantiated commercial or legal claims where the amount cannot be reliably estimated.
In addition to the EAC process, NBN Co also undertakes a review of construction contracts when preparing its financial statements.
EACs are prepared in gross dollars and converted to a Cost Per Premises (EAC CPP) using the latest count of addressable GNAF (Geocode National Address File) premises for each FSAM.
For comparison to the Corporate Plan the EAC CPP for access fibre specifically excludes NBN Co internal labour, the costs associated with connecting premises, costs of the transit network and the financial lease costs of the Telstra infrastructure. These costs are captured and reported separately.
Fibre Access Node (FAN)
A facility that houses the active equipment providing services to a Fibre Serving Area (FSA). Note that Urban FANs will also provide a (POI) to access seekers.
Fibre Access Network (Brownfields)
Pre-existing premises that will be covered by FTTP.
Fibre Distribution Hub (FDH)
The equipment located in a Fibre Distribution Area (FDA) where Distribution Fibre is split to provide Local Fibre that runs down each street.
Fibre Footprint The premises that will be serviceable by NBN Co’s FTTP Network by the end of the rollout period.
Fibre Serving Area Module (FSAM)
A series of up to 16 FDAs linked in a double loop configuration. Typically, a single fibre sheath will connect the FSAM and its (up to 16) FDHs back to a nominated Fibre Access Node (FAN). An FSAM may be a small town or a part suburb in the case of large cities. The number of premises contained in an FSAM is typically between 2,000 – 3,000, depending on location and network planning/topology.
Fibre to the Basement (FTTB)
Network design in which the Fibre network is deployed to the building.
Fibre to the Node (FTTN)
Network design in which the Fibre network is deployed to the node.
Fibre to the Premises (FTTP)
Network design in which the Fibre network is deployed to each premises.
Fixed Wireless Network
Network design which network connections are provided through radio signals.
Geocoded National Address File (GNAF)
GNAF information is provided by PSMA Australia Limited (PSMA). GNAF lists all valid physical addresses in Australia. It contains approximately 12.6 million physical addresses, each linked to its unique geocode (that is, the specific latitude and longitude of the address). Data used to build GNAF comes from contributors that include the Australian Electoral Commission, Australia Post, state, territory and Australian Government mapping agencies and land registries. GNAF is provided by PSMA.
Government Business Enterprise (GBE)
A Government Business Enterprise (GBE) is a Commonwealth authority or Commonwealth Company as defined by the Commonwealth Authorities and Companies Act 1997 (CAC Act) and prescribed as a GBE under the Commonwealth Authorities and Companies Regulations 1997 (CAC Act Regulations).

NBN Co Half-Year Report as at 31 December 201358
Glossary of Terms
18
Term Definition
GBE Guidelines The Commonwealth Government Business Enterprise Governance and Oversight Guidelines (the GBE Guidelines) apply to GBEs that are Commonwealth authorities (authority GBEs) and GBEs that are wholly-owned Commonwealth companies (wholly-owned Company GBEs). The GBE guidelines define Commonwealth’s relationship with its GBEs and Commonwealth’s ownership interest
Greenfields A new development that can be either Broadacre or Infill Premises. Greenfield developments represent the growth of the premises market.
Health, Safety & Environment (HSE)
A supporting division of NBN Co that will not be directly involved in the operation of the NBN but will be responsible for establishing and maintaining NBN Co’s policies regarding employee health, safety and environment issues.
Hybrid Fibre Coaxial (HFC) Network
A network utilising both optical fibre and coaxial cable for the delivery of Pay TV, internet and voice services.
IFAN An intermediate Fibre Access Node (FAN) to serve New Developments (Greenfields Estates).
Infills A type of Greenfields development where new premises or a redevelopment (i.e. demolition and rebuild) are planned to be built on currently developed land that is surrounded by established areas, where Telstra copper services are currently available.
Interim Satellite Service (ISS)
The Interim Satellite Service (ISS) – that replaces the previous Australian Broadband Guarantee scheme. The ISS is provided as a managed service through satellites operated by Optus and IPStar and is operated on behalf of NBN Co by Optus.
Layer 2 Services Layer 2 Services are the services provided through the active equipment layer of an Optical Fibre Network, designed to provide Retail Service Providers with the greatest scope for product innovation and differentiation.
Local Network Distribution Network (LNDN)
The section of the NBN Co fibre network from the NBN Co FAN site to the last multiport or network access point closest to the customer premises.
Long Term Satellite Solution (LTSS)
NBN Co’s LTSS will deliver the NBN Co Satellite Access Service (NSAS) as an ‘emulated Layer 2’ service based wholesale Ethernet access utilising Third Generation broadband satellite technology.
The LTSS will cover 100% of the Australian landmass (and nominated territories). However, within this coverage area each spot beam will be configured to ensure that the satellites utilise their finite capacity whilst delivering the best possible service to each specific geographic region. Therefore, irrespective of premises location, the LTSS will have the capacity to provide services anywhere in Australia where FTTP or Fixed Wireless services are not available.
Lots Passed All passive infrastructure has been installed and commissioned including the fibre link to the permanent FAN site such that the only outstanding step is to initiate the managed backhaul and install active equipment necessary to achieve the first premises ready for service date.
Lots/Premises Ready For Service (RFS)
Lots/premises are ‘ready for service’ when the Shared network and service elements are installed, accepted, commissioned and ready for service, which then enables an End-User to order and purchase a broadband service from their choice of Retail Service Provider (Service Provider).
Megabits Per Second (Mbps)
A unit measurement of data transfer speeds. One Megabit Per Second is equal to 1,024 kbps.
Multiple Dwelling Unit (MDU)
Premises that contains more than one dwelling unit, which can range from duplexes to 200+ unit apartment blocks. Each dwelling unit is assumed as equivalent to one GNAF (e.g. a 50 unit apartment block will have 50 GNAFs).
National Broadband Network (NBN)
The nation-wide broadband network that will be deployed by NBN Co and third parties engaged on behalf of NBN Co.
NBN Co NBN Co Limited ACN 136 533 741.
Network Test Facility (NTF)
National Test Facility - NBN Co's Test Facility, located at Docklands
New Developments (Greenfields Estates)
A New Development is defined as an estate that complies with the New Development Policy statements released by the Government (for developments over 100 lots over 3 years)
Occupational Health & Safety (OHS)
A discipline concerned with protecting the safety, health and welfare of people engaged in work or employment.
Operating Expenditure (Opex)
The ongoing cost of running a business, system or product.
Operational Support Systems (OSS)
The set of systems that will provide NBN Co with the capabilities to provision, configure, manage, and operate the NBN.
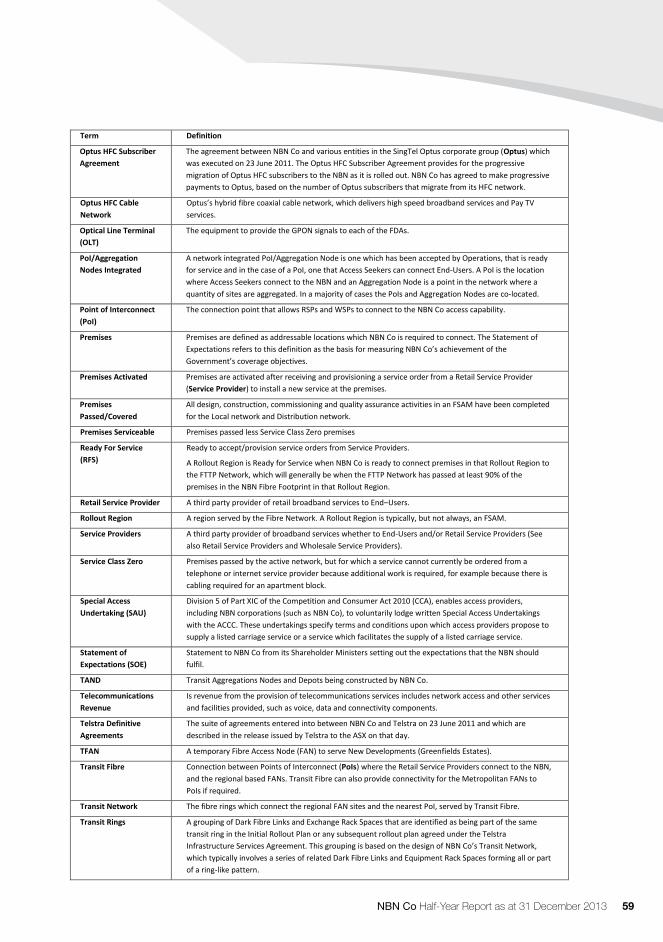
NBN Co Half-Year Report as at 31 December 2013 59
19
Term Definition
Optus HFC Subscriber Agreement
The agreement between NBN Co and various entities in the SingTel Optus corporate group (Optus) which was executed on 23 June 2011. The Optus HFC Subscriber Agreement provides for the progressive migration of Optus HFC subscribers to the NBN as it is rolled out. NBN Co has agreed to make progressive payments to Optus, based on the number of Optus subscribers that migrate from its HFC network.
Optus HFC Cable Network
Optus’s hybrid fibre coaxial cable network, which delivers high speed broadband services and Pay TV services.
Optical Line Terminal (OLT)
The equipment to provide the GPON signals to each of the FDAs.
PoI/Aggregation Nodes Integrated
A network integrated PoI/Aggregation Node is one which has been accepted by Operations, that is ready for service and in the case of a PoI, one that Access Seekers can connect End-Users. A PoI is the location where Access Seekers connect to the NBN and an Aggregation Node is a point in the network where a quantity of sites are aggregated. In a majority of cases the PoIs and Aggregation Nodes are co-located.
Point of Interconnect (PoI)
The connection point that allows RSPs and WSPs to connect to the NBN Co access capability.
Premises Premises are defined as addressable locations which NBN Co is required to connect. The Statement of Expectations refers to this definition as the basis for measuring NBN Co’s achievement of the Government’s coverage objectives.
Premises Activated Premises are activated after receiving and provisioning a service order from a Retail Service Provider (Service Provider) to install a new service at the premises.
Premises Passed/Covered
All design, construction, commissioning and quality assurance activities in an FSAM have been completed for the Local network and Distribution network.
Premises Serviceable Premises passed less Service Class Zero premises
Ready For Service (RFS)
Ready to accept/provision service orders from Service Providers.
A Rollout Region is Ready for Service when NBN Co is ready to connect premises in that Rollout Region to the FTTP Network, which will generally be when the FTTP Network has passed at least 90% of the premises in the NBN Fibre Footprint in that Rollout Region.
Retail Service Provider A third party provider of retail broadband services to End–Users.
Rollout Region A region served by the Fibre Network. A Rollout Region is typically, but not always, an FSAM.
Service Providers A third party provider of broadband services whether to End-Users and/or Retail Service Providers (See also Retail Service Providers and Wholesale Service Providers).
Service Class Zero Premises passed by the active network, but for which a service cannot currently be ordered from a telephone or internet service provider because additional work is required, for example because there is cabling required for an apartment block.
Special Access Undertaking (SAU)
Division 5 of Part XIC of the Competition and Consumer Act 2010 (CCA), enables access providers, including NBN corporations (such as NBN Co), to voluntarily lodge written Special Access Undertakings with the ACCC. These undertakings specify terms and conditions upon which access providers propose to supply a listed carriage service or a service which facilitates the supply of a listed carriage service.
Statement of Expectations (SOE)
Statement to NBN Co from its Shareholder Ministers setting out the expectations that the NBN should fulfil.
TAND Transit Aggregations Nodes and Depots being constructed by NBN Co.
Telecommunications Revenue
Is revenue from the provision of telecommunications services includes network access and other services and facilities provided, such as voice, data and connectivity components.
Telstra Definitive Agreements
The suite of agreements entered into between NBN Co and Telstra on 23 June 2011 and which are described in the release issued by Telstra to the ASX on that day.
TFAN A temporary Fibre Access Node (FAN) to serve New Developments (Greenfields Estates).
Transit Fibre Connection between Points of Interconnect (PoIs) where the Retail Service Providers connect to the NBN, and the regional based FANs. Transit Fibre can also provide connectivity for the Metropolitan FANs to PoIs if required.
Transit Network The fibre rings which connect the regional FAN sites and the nearest PoI, served by Transit Fibre.
Transit Rings A grouping of Dark Fibre Links and Exchange Rack Spaces that are identified as being part of the same transit ring in the Initial Rollout Plan or any subsequent rollout plan agreed under the Telstra Infrastructure Services Agreement. This grouping is based on the design of NBN Co’s Transit Network, which typically involves a series of related Dark Fibre Links and Equipment Rack Spaces forming all or part of a ring-like pattern.

NBN Co Limited
ABN 86 136 533 741
Sydney
Level 11, 100 Arthur StreetNORTH SYDNEY NSW 2060AUSTRALIA
Freecall: 1800 OUR NBN (1800 687 626)Telephone: 61 2 9926 1900
Melbourne
Level 40–41, 360 Elizabeth StreetMELBOURNE VIC 3000AUSTRALIA
Freecall: 1800 OUR NBN (1800 687 626)Telephone: 61 3 8662 8000
Hobart
GPO Box 373HOBART TAS 7001AUSTRALIA
Freecall: 1800 OUR NBN (1800 687 626)Telephone: 61 3 6236 4726
Canberra
Unit 2, 16 National CircuitBARTON ACT 2600AUSTRALIA
Freecall: 1800 OUR NBN (1800 687 626)Telephone: 61 2 9926 1900
Perth
7 Tanunda DriveRIVERVALE WA 6103AUSTRALIA
Freecall: 1800 OUR NBN (1800 687 626)Telephone: 61 8 6274 6000
AdelaideLevel 2, 31 - 33 Richmond RoadKESWICK SA 5035AUSTRALIA
Freecall: 1800 OUR NBN (1800 687 626)Telephone: 61 3 8662 8000
Brisbane44 Southgate AvenueCANNON HILL QLD 4170AUSTRALIA
Freecall: 1800 OUR NBN (1800 687 626)Telephone: 61 2 9926 1900
DarwinUnit 6, 396 Stuart HighwayWINNELLIE NT 0820AUSTRALIA
Freecall: 1800 OUR NBN (1800 687 626)Telephone: 61 3 8662 8000