for an individual’s performance - Medex
1
High altitude illness, poor exercise capacity, and fatigue present major risk factors for injury and fatality at altitude (Firth et al., 2008; Oliver et al., 2012). Greater sea level fitness may increase altitude exercise capacity but also increase acute mountain sickness (AMS). The influence of hypoxic sensitivity (cardiac, ventilatory, and arterial oxygen saturation responses to acute hypoxia) on altitude exercise capacity and AMS is also unclear. Determining these relationships is necessary before fitness assessment can be recommended to appraise individuals’ readiness for altitude. 1) To determine the effect of sea level fitness (V̇O 2max ) on altitude exercise capacity and AMS during chronic altitude exposure. 2) To investigate the role of physiological responses to acute and chronic hypoxia in exercise capacity and AMS during chronic altitude exposure. Forty-four trekkers, 26 men and 18 women (mean ± SD: age 39 ± 14 yr, body mass 69.0 ± 14.5 kg, height 172 ± 10 cm, V ̇ O 2max , 45 ± 8 mL·min- 1·kg-1) from the MEDEX Manaslu trek volunteered for this cohort observational study that received ethical approval from the North West Wales Research Ethics Committee. All volunteers provided written informed consent. Participants completed a loaded walking test to determine fitness (V ̇ O 2max ). A hypoxic exercise test (FiO 2 = 0.112) was then used to determine hypoxic sensitivity. One month later participants completed a three-week trek to 5085m, with AMS recorded daily. Exercise capacity was determined by three tests: rating of perceived exertion (RPE) on ascent to 5085m (RPE ascent ), RPE on a fixed workload step test at 5085m (RPE fixed ), and self-selected stepping rate at 5085m. This study provides the first empirical evidence that greater sea level fitness is related to superior exercise capacity at altitude without exacerbating AMS. Individuals with high sea level fitness maintained SpO 2 equal to less fit individuals despite a higher absolute workload. This was accompanied by an elevated heart rate response and a lower ventilatory response to acute hypoxia and chronic altitude exposure. Given that poor exercise capacity and fatigue are major risk factors for injury and fatality at altitude, sea level fitness assessment should be considered as part of the screening process to appraise an individual’s readiness to perform at altitude. Firth PG, Zheng H, Windsor JS, Sutherland AI, Imray CH, Moore GWK, Semple JL, Roach RC & Salisbury R a (2008). Mortality on Mount Everest, 1921-2006: descriptive study. Br Med J 337, a2654. Oliver SJ, Sanders SJ, Williams CJ, Smith ZA, Lloyd-Davies E, Roberts R, Arthur C, Hardy L & Macdonald JH (2012). Physiological and psychological illness symptoms at high altitude and their relationship with acute mountain sickness: a prospective cohort study. J Travel Med 19, 210–219. Aims Introduction Methods Results Conclusions Figure 2. Relationship between sea level fitness (V ̇ O 2max ) and exercise capacity at altitude. Greater sea level fitness was associated with reduced (A) RPE at a fixed workload (RPE fixed ; r=-0.69; p<0.001) and (B) Session RPE from ascent to base camp (RPE ascent ; r=-0.43; p=0.005), and greater (C) Self-selected stepping rate (r=0.62; p<0.001). Figure 3. Sea level fitness (V ̇ O 2max ) was not related to (A) Percent of trekking days with clinically defined AMS (r=0.13; p=0.41), (B) Peak AMS score (r=-0.05; p=0.74), or (C) Oxygen saturation during fixed workload step test (SpO 2 e; r=0.07; p=0.67). Variable (M x ) a x (V ̇ O 2max → M x ) b x (M x → RPE fixed ) Indirect effect (ab x ) Acute normobaric hypoxia Hypoxic ventilatory response -0.27 (-0.58; 0.04) 0.21 (-0.07; 0.49) -0.06 (-0.25; 0.01) Hypoxic cardiac response 0.37 (0.06; 0.69)* -0.05 (-0.34; 0.23) -0.02 (-0.18; 0.08) Chronic high altitude exposure Ventilatory reserve 0.85 (0.60; 1.10)** -0.29 (-0.72; 0.13) -0.25 (-0.55; 0.33) Ventilatory efficiency 0.59 (0.25; 0.93)** -0.14 (-0.46; 0.18) -0.08 (-0.28; 0.11) Chronic change in heart rate 0.42 (0.12; 0.72)* -0.23 (-0.51; 0.05) -0.10 (-0.32; 0.00) Table 1. Mediation analysis summary for acute normobaric hypoxia and chronic high altitude cardiac and ventilatory parameters. V ̇ O 2max M x RPE fixed a x b x Values are standardized regression coefficients and 95% confidence intervals (lower limit; upper limit) for direct effects of V ̇ O 2max on mediators (a x ), direct effects of mediators on RPE fixed (b x ), and indirect effects of V ̇ O 2max on RPE fixed through mediators (ab x ). *p < 0.05; **p < 0.01. Figure 1. Schematic representation of study protocol. Coloured boxes indicate procedures undertaken in normoxia, white boxes indicate procedures undertaken in hypoxia. SSSR Fam , Self-selected stepping rate test familiarization; LLS, Lake Louise Score; Load, External load for the trekking session (kg); RPE ascent , Rating of perceived exertion on ascent to base camp. References Correspondence: [email protected] (Gabriella Rossetti) Gabriella Rossetti 1,2 , Jamie Macdonald 1,2 , and Samuel Oliver 1,2 1 Extremes Research Group, Bangor University, LL57 2PZ 2 Medical Expeditions, Pinfold, Hyssington, Powys, UK MEDEX 2015: Is fitness important for an individual’s performance and health at altitude? Acknowledgements The authors would like to acknowledge Matthew Smith, Anna Jackson, Nigel Callender, Hannah Newcombe, Heather Storey, Sebastian Willis, Jojanneke van den Beukel, Jonathan Woodward, James Pollard, Benjamin Wood, Victoria Newton, Jana Virian, Owen Haswell, Lewis Bertrand- Shelton for their contributions to data collection and analysis.
Transcript of for an individual’s performance - Medex
High altitude illness, poor exercise capacity, and fatigue present major risk
factors for injury and fatality at altitude (Firth et al., 2008; Oliver et al., 2012).
Greater sea level fitness may increase altitude exercise capacity but also
increase acute mountain sickness (AMS).
The influence of hypoxic sensitivity (cardiac, ventilatory, and arterial oxygen
saturation responses to acute hypoxia) on altitude exercise capacity and AMS
is also unclear.
Determining these relationships is necessary before fitness assessment can
be recommended to appraise individuals’ readiness for altitude.
1) To determine the effect of sea level fitness (V̇O2max) on altitude exercise
capacity and AMS during chronic altitude exposure.
2) To investigate the role of physiological responses to acute and chronic
hypoxia in exercise capacity and AMS during chronic altitude exposure.
Forty-four trekkers, 26 men and 18 women (mean ± SD: age 39 ± 14 yr,
body mass 69.0 ± 14.5 kg, height 172 ± 10 cm, V̇O2max, 45 ± 8 mL·min-
1·kg-1) from the MEDEX Manaslu trek volunteered for this cohort
observational study that received ethical approval from the North West Wales
Research Ethics Committee. All volunteers provided written informed consent.
Participants completed a loaded walking test to determine fitness (V̇O2max). A
hypoxic exercise test (FiO2 = 0.112) was then used to determine hypoxic
sensitivity.
One month later participants completed a three-week trek to 5085m, with AMS
recorded daily.
Exercise capacity was determined by three tests: rating of perceived exertion
(RPE) on ascent to 5085m (RPEascent), RPE on a fixed workload step test at
5085m (RPEfixed), and self-selected stepping rate at 5085m.
This study provides the first empirical evidence that greater sea level fitness is related to superior
exercise capacity at altitude without exacerbating AMS.
Individuals with high sea level fitness maintained SpO2 equal to less fit individuals despite a higher
absolute workload. This was accompanied by an elevated heart rate response and a lower
ventilatory response to acute hypoxia and chronic altitude exposure.
Given that poor exercise capacity and fatigue are major risk factors for injury and fatality at altitude,
sea level fitness assessment should be considered as part of the screening process to appraise an
individual’s readiness to perform at altitude.
Firth PG, Zheng H, Windsor JS, Sutherland AI, Imray CH, Moore GWK, Semple JL, Roach RC &
Salisbury R a (2008). Mortality on Mount Everest, 1921-2006: descriptive study. Br Med J 337, a2654.
Oliver SJ, Sanders SJ, Williams CJ, Smith ZA, Lloyd-Davies E, Roberts R, Arthur C, Hardy L &
Macdonald JH (2012). Physiological and psychological illness symptoms at high altitude and their
relationship with acute mountain sickness: a prospective cohort study. J Travel Med 19, 210–219.
Aims
Introduction
Methods
Results
Conclusions
Figure 2. Relationship between sea level fitness (V̇O2max) and exercise capacity at altitude. Greater
sea level fitness was associated with reduced (A) RPE at a fixed workload (RPEfixed; r=-0.69;
p<0.001) and (B) Session RPE from ascent to base camp (RPEascent; r=-0.43; p=0.005), and greater
(C) Self-selected stepping rate (r=0.62; p<0.001).
Figure 3. Sea level fitness (V̇O2max) was not related to (A) Percent of trekking days with clinically
defined AMS (r=0.13; p=0.41), (B) Peak AMS score (r=-0.05; p=0.74), or (C) Oxygen saturation
during fixed workload step test (SpO2e; r=0.07; p=0.67).
Variable (Mx) ax (V̇O2max → Mx) bx (Mx → RPEfixed) Indirect effect (abx)
Acute normobaric hypoxia
Hypoxic ventilatory response -0.27 (-0.58; 0.04) 0.21 (-0.07; 0.49) -0.06 (-0.25; 0.01)
Hypoxic cardiac response 0.37 (0.06; 0.69)* -0.05 (-0.34; 0.23) -0.02 (-0.18; 0.08)
Chronic high altitude exposure
Ventilatory reserve 0.85 (0.60; 1.10)** -0.29 (-0.72; 0.13) -0.25 (-0.55; 0.33)
Ventilatory efficiency 0.59 (0.25; 0.93)** -0.14 (-0.46; 0.18) -0.08 (-0.28; 0.11)
Chronic change in heart rate 0.42 (0.12; 0.72)* -0.23 (-0.51; 0.05) -0.10 (-0.32; 0.00)
Table 1. Mediation analysis summary for acute normobaric hypoxia and chronic high altitude
cardiac and ventilatory parameters.
V̇O2max
Mx
RPEfixed
ax bx
Values are standardized regression
coefficients and 95% confidence intervals
(lower limit; upper limit) for direct effects of
V̇O2max on mediators (ax), direct effects of
mediators on RPEfixed (bx), and indirect
effects of V̇O2max on RPEfixed through
mediators (abx). *p < 0.05; **p < 0.01.
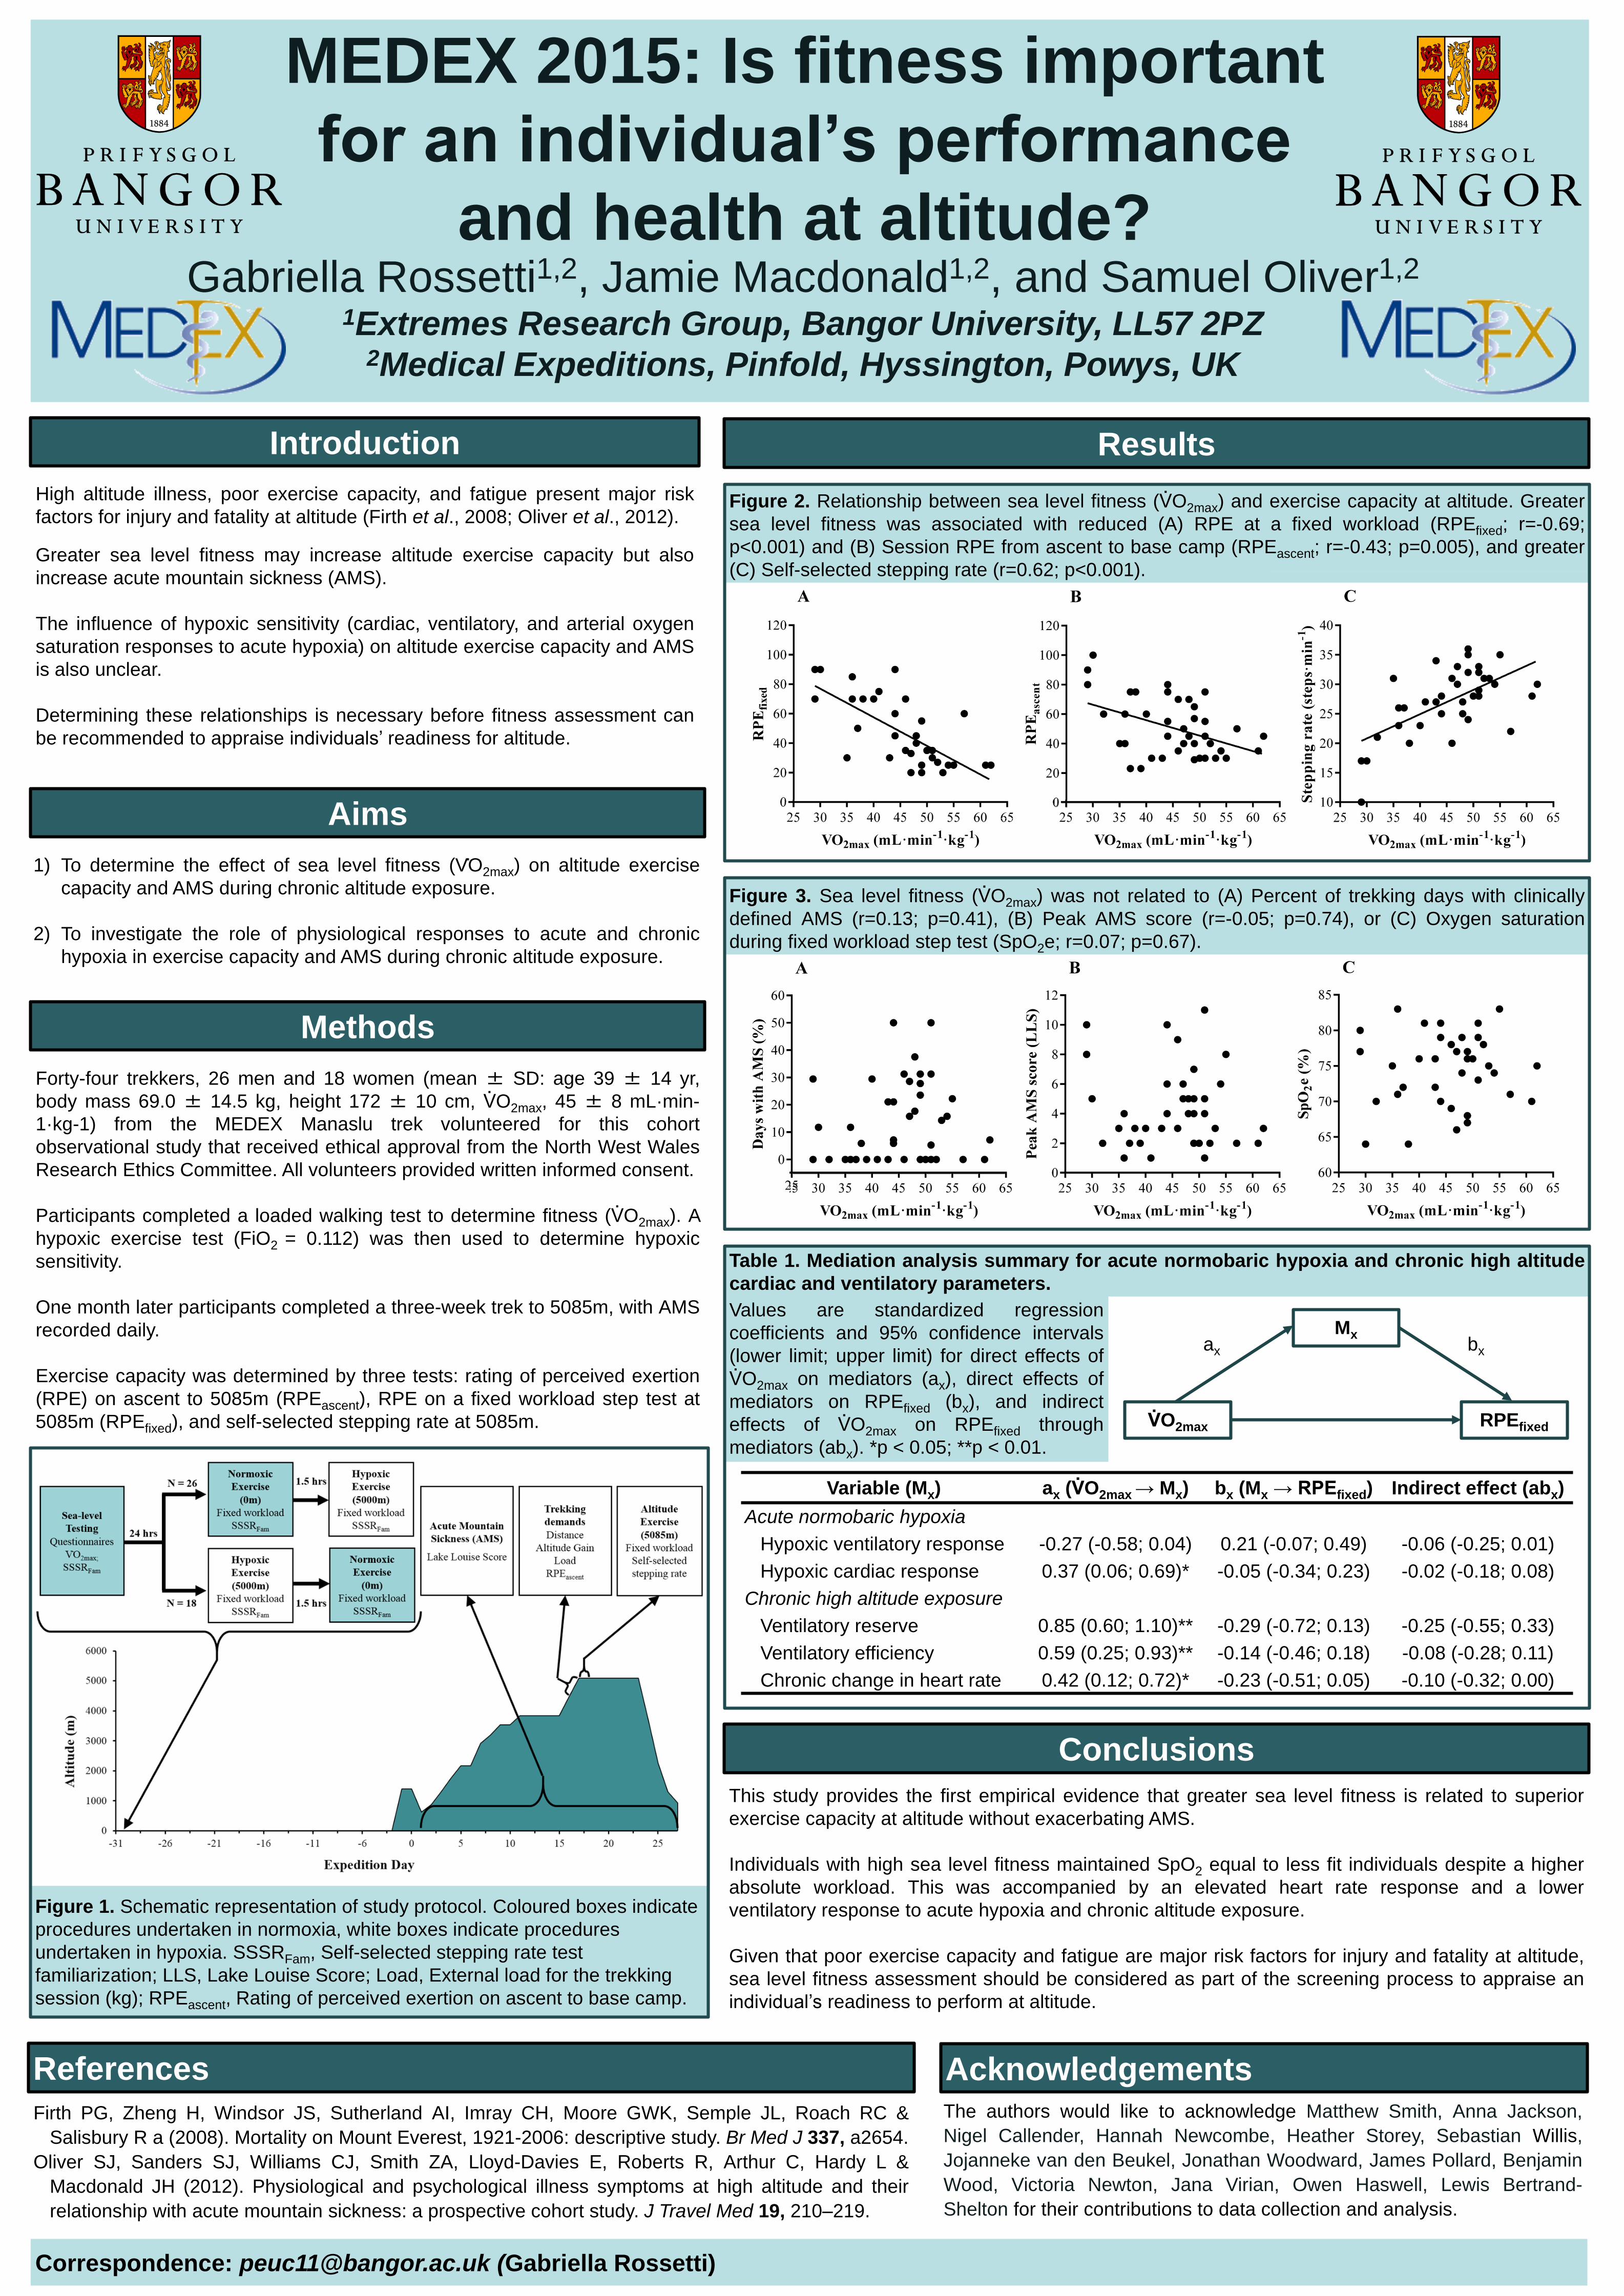
Figure 1. Schematic representation of study protocol. Coloured boxes indicate
procedures undertaken in normoxia, white boxes indicate procedures
undertaken in hypoxia. SSSRFam, Self-selected stepping rate test
familiarization; LLS, Lake Louise Score; Load, External load for the trekking
session (kg); RPEascent, Rating of perceived exertion on ascent to base camp.
References
Correspondence: [email protected] (Gabriella Rossetti)
Gabriella Rossetti1,2, Jamie Macdonald1,2, and Samuel Oliver1,2
1Extremes Research Group, Bangor University, LL57 2PZ2Medical Expeditions, Pinfold, Hyssington, Powys, UK
MEDEX 2015: Is fitness important
for an individual’s performance
and health at altitude?
AcknowledgementsThe authors would like to acknowledge Matthew Smith, Anna Jackson,
Nigel Callender, Hannah Newcombe, Heather Storey, Sebastian Willis,
Jojanneke van den Beukel, Jonathan Woodward, James Pollard, Benjamin
Wood, Victoria Newton, Jana Virian, Owen Haswell, Lewis Bertrand-
Shelton for their contributions to data collection and analysis.