Food O utlook - FAO
152
November 2017 Food Outlook BIANNUAL REPORT ON GLOBAL FOOD MARKETS
Transcript of Food O utlook - FAO

November 2017
Food Outlook B IANNUAL REPORT ON GLOBAL FOOD MARKETS
ACKNOWLEDGEMENTS
The Food Outlook report is a product of the FAO Trade and Markets Division. This report is prepared under the overall guidance of Boubaker Ben-Belhassen, Director, and Abdolreza Abbassian, Senior Economist. It is written by a team of economists, whose names and email contacts appear under their respective market summary contributions. The report benefited from research support by many staff, namely, David Bedford, Julie Claro, Anna Maria Giusti, Grace Karumathy, Lavinia Lucarelli, David Mancini, Emanuele Marocco, Marco Milo, Di Yang and the fisheries statistical team.
Special thanks go to Stanislaw Czaplicki and David Bedford for preparing the charts and statistical tables and to Valentina Banti for her administrative support. Additionally, the team is grateful to Rita Ashton for the desktop publishing and to Nancy Hart for her valuable editorial assistance.
The designations employed and the presentation of material in this information product do not imply the expression of any opinion whatsoever on the part of the Food and Agriculture Organization of the United Nations (FAO) concerning the legal or development status of any country, territory, city or area or of its authorities, or concerning the delimitation of its frontiers or boundaries. The mention of specific companies or products of manufacturers, whether or not these have been patented, does not imply that these have been endorsed or recommended by FAO in preference to others of a similar nature that are not mentioned.
ISSN 0251-1959 (print)ISSN 1560-8182 (Online)
ISBN 978-92-5-130012-1© FAO, 2017
FAO encourages the use, reproduction and dissemination of material in this information product. Except where otherwise indicated, material may be copied, downloaded and printed for private study, research and teaching purposes, or for use in non-commercial products or services, provided that appropriate acknowledgement of FAO as the source and copyright holder is given and that FAO’s endorsement of users’ views, products or services is not implied in any way.
All requests for translation and adaptation rights, and for resale and other commercial use rights should be made via www.fao.org/contact-us/licence-request or addressed to [email protected].
FAO information products are available on the FAO website (www.fao.org/publications) and can be purchased through [email protected].
This publication has been printed using selected products and processes so as to ensure minimal environmental impact and to promote sustainable forest management.
Photo credits:©FAO/Pius Ekpei©Morguefile
Although weather disruptions are set to
stall production growth this season, global
rice supplies are still forecast to exceed
utilization, enabling a small expansion of
world rice inventories. After staging an 8
percent recovery in 2017, global trade is
expected to rise only modestly in 2018.
Price gains since June have been limited
by stiff export competition.
RICE
With global production projected at a
new record while total utilization grows
at a slower pace than in the previous
season, world stocks are heading for
a further increase, reaching an all-
time high. Trade is also expanding,
underpinned by brisker purchases as
buyers try to take advantage of large
export availabilities and weak prices.
COARSE GRAINS
Although global oilseed production is
forecast to remain flat in 2017/18, world
supplies of both meals/cakes and oils/fats
are expected to expand further, aided by
large carry-in stocks. In both markets,
output could essentially match demand,
allowing closing stocks to remain steady
at comfortable levels.
OILCROPSWorld cassava production could dip in
2017, on account of lower plantings in
the major producing countries induced
by a combination of policy changes,
drought conditions and depressed root
prices. Cassava trade flows are expected
to remain firm, owing to poor prospects
for China’s maize supply with which
cassava competes.
CASSAVA
A modest growth in global wheat
production is forecast for 2017,
supported by expansions in bovine,
pig and poultry meats and some gain
in ovine meat. Trade is anticipated to
grow too, albeit at a slower rate than
in 2016 due to falling import demand
by China.
MEAT
GLOBAL PROSPECTS FOR MAJOR TROPICAL FRUITS
Even though world wheat production in
2017 is forecast to fall below last year’s
record level, wheat supplies in 2017/18
remain relatively large. Stocks are set
to increase for the fifth consecutive
season, reaching an all-time high.
Trade is expected to contract, with
international prices still mostly above
last year levels.
WHEAT
Global production of fish and fishery
products is expected to expand in 2017,
but prices have risen across all seafood
commodity categories as increased supply
is being more than offset by the demand
stimulus resulting from an improving
global economy.
FISHERIESWorld milk production in 2017 is
forecast to exceed last year’s level on
favourable weather conditions and more
attractive prices. A moderate expansion
is expected in world trade in 2017 with
increases in cheese and skimmed milk
powder more than offsetting declining
trade in butter and whole milk powder.
DAIRY
Food commodity markets remain well
supplied but the cost of importing
food is set to rise by 6 percent from
last year’s level to reach USD 1.413 trillion
in 2017. Sharp increases in freight rates,
stronger import demand and firmer prices
of most food commodities are expected
to elevate the global food import bill to its
second highest level on record.
HIGHLIGHTS
Growth in tropical fruit trade has outpaced that of most other food commodities. Innovations in distribution, trade agreement measures, population growth, and shifting consumer preferences driven by rising incomes, will continue to support further expansion ahead.However, with tropical regions particularly susceptible to extreme climate-related events, uninterrupted supplies to international markets
will be a significant challenge.


CONTENTS1-09
100-133
134-150
82-99
68-81
10-67
Wheat 11Coarse grains 20Rice 28Cassava 34Oilcrops, oils and meals 40Meat and meat products 48Milk and milk products 54Fish and fishery products 60
Grains 83Rice 87Oilcrops 91Meat 97Dairy 99
Futures markets 135Ocean freight rates 138Food import bills 140The FAO price indices 142
Global prospects for major tropical fruits 69
p69
GLOBAL PROSPECTS FOR MAJOR TROPICAL FRUITS
MARKET SUMMARIES
MARKET ASSESSMENTS
SPECIAL FEATURE
MAJOR POLICY DEVELOPMENTS
STATISTICAL TABLES
MARKET INDICATORS
FAO Food Commodity Price Indices
(Oct 2016 - Oct 2017)
©D
epo
sitp
ho
tos
p142

Ma
rke
t su
mm
ari
es
4 FOOD OUTLOOKNOVEMBER 2017
MAR
KET
SUM
MAR
IES

Ma
rke
t sum
ma
ries
1FOOD OUTLOOKNOVEMBER 2017
World cereal markets are likely to be comfortably balanced
in 2017/18, with total supplies exceeding projected demand
and inventories on the rise. Global cereal production in
2017 is forecast to surpass the 2016 peak by a small
margin. Total production of coarse grains is set to reach
a new record, with most of the expansion taking place
in South America and Southern Africa. However, wheat
production is forecast to decline slightly from last year in
spite of an upward adjustment since October driven by
a larger-than-earlier anticipated harvest in the Russian
Federation. The decline in wheat production from 2016
mostly reflects a lower harvest in the United States, as well
as a projected fall in Australia’s wheat crop after a record
output in 2016. Global rice production in 2017 is expected
to remain broadly stable.
World cereal utilization in 2017/18 is set to expand by 1
percent from the previous year. Overall, food consumption
of cereals is forecast to grow by 1.3 percent and feed use
by 0.4 percent, while industrial utilization is projected to
rise by 1.2 percent. Based on the latest forecasts for cereal
production and utilization, world cereal stocks by the close
of seasons in 2018 are set to reach a new record level.
This would result in the global cereal stock-to-use ratio
remaining stable at a 15-year high of 27 percent, with the
ratio for wheat up slightly and those for coarse grains and
rice down marginally. World wheat inventories are currently
pegged at an all-time high despite a downward revision
since October. Global stocks of rice and coarse grains are
also set to reach record levels. The increase in wheat and
rice stocks largely reflects an anticipated accumulation
of inventories in China, whereas for coarse grains, the
expansion reflects higher end-of-season maize stocks in
South America and the United States.
World trade in cereals in 2017/18 is forecast to remain
close to the 2016/17 estimated volume, with an expected
decline in wheat trade largely offset by larger shipments
of maize, sorghum and rice. Overall, given the ample size
of export supplies, competition among major exporters in
2017/18 is expected to remain stiff.
CEREALS
Contact:[email protected]
CEREAL PRODUCTION, UTILIZATION AND STOCKS
WORLD CEREAL MARKET AT A GLANCE 1
2015/16 2016/17 estim.
2017/18 f’cast
Change: 2017/18
over 2016/17
million tonnes %
WORLD BALANCE
Production 2 533.1 2 607.5 2 613.5 0.2
Trade2 391.3 403.4 404.3 0.2
Total utilization 2 512.9 2 568.5 2 593.2 1.0
Food 1 088.3 1 103.1 1 117.2 1.3
Feed 887.2 904.6 908.6 0.4
Other uses 537.4 560.8 567.5 1.2
Ending stocks3 664.8 702.9 718.7 2.2
SUPPLY AND DEMAND INDICATORS
Per caput food consumption:
World (kg/yr) 147.4 147.7 148.0 0.2
LIFDC4 (kg/yr) 145.8 146.4 146.5 0.1
World stock-to-use ratio (%) 25.9 27.1 27.0
Major exporters stock-to-disappearance ratio (%)
15.7 17.0 16.4
FAO CEREAL PRICE INDEX (2002-2004=100)
2015 2016 2017 Jan-Oct
Change: Jan-Oct 2017
over Jan-Oct 2016
%
162 147 151 2.3
1 Rice in milled equivalent.2 Trade refers to exports based on a July/June marketing season for wheat and
coarse grains and on a January/December marketing season for rice.3 May not equal the difference between supply and utilization due to
differences in individual country marketing years.4 Low-Income Food-Deficit countries.
200
400
600
800
1800
2100
2400
2700
17/1815/1613/1411/1209/1007/08
million tonnes million tonnes
f’cast
Stocks (right axis)
Production (left axis) Utilization (left axis)
Ma
rke
t su
mm
ari
es
2 FOOD OUTLOOKNOVEMBER 2017
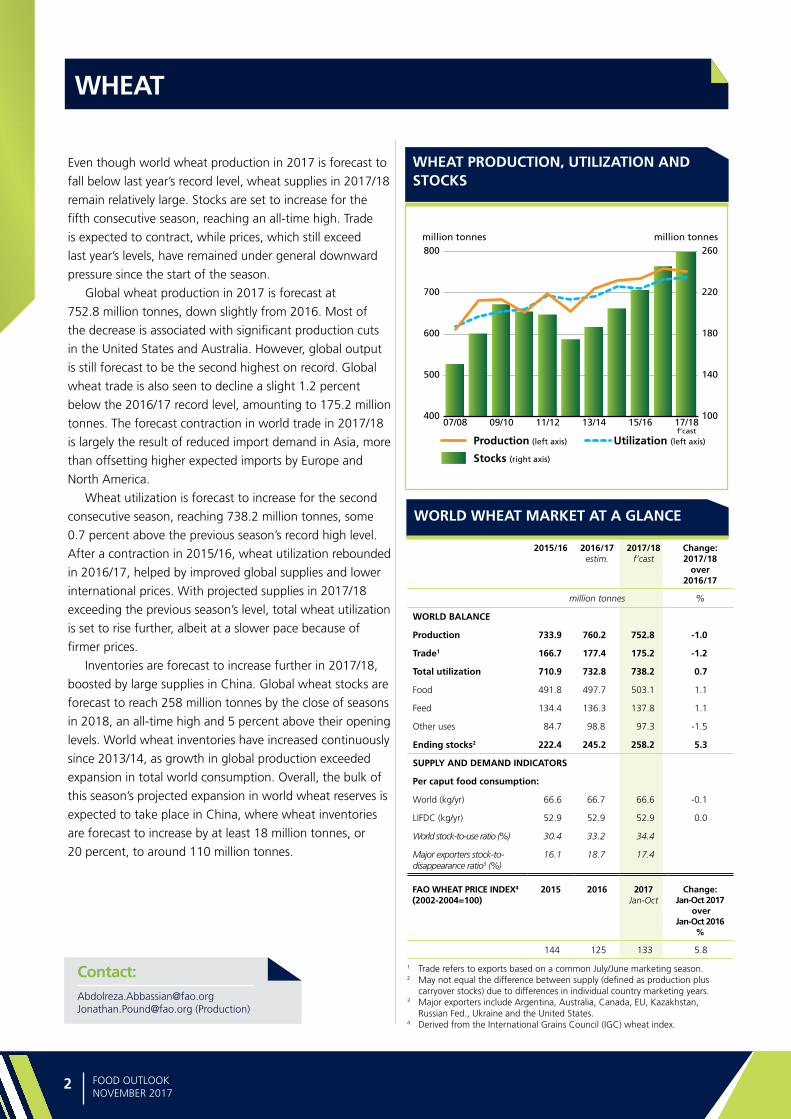
Even though world wheat production in 2017 is forecast to
fall below last year’s record level, wheat supplies in 2017/18
remain relatively large. Stocks are set to increase for the
fifth consecutive season, reaching an all-time high. Trade
is expected to contract, while prices, which still exceed
last year’s levels, have remained under general downward
pressure since the start of the season.
Global wheat production in 2017 is forecast at
752.8 million tonnes, down slightly from 2016. Most of
the decrease is associated with significant production cuts
in the United States and Australia. However, global output
is still forecast to be the second highest on record. Global
wheat trade is also seen to decline a slight 1.2 percent
below the 2016/17 record level, amounting to 175.2 million
tonnes. The forecast contraction in world trade in 2017/18
is largely the result of reduced import demand in Asia, more
than offsetting higher expected imports by Europe and
North America.
Wheat utilization is forecast to increase for the second
consecutive season, reaching 738.2 million tonnes, some
0.7 percent above the previous season’s record high level.
After a contraction in 2015/16, wheat utilization rebounded
in 2016/17, helped by improved global supplies and lower
international prices. With projected supplies in 2017/18
exceeding the previous season’s level, total wheat utilization
is set to rise further, albeit at a slower pace because of
firmer prices.
Inventories are forecast to increase further in 2017/18,
boosted by large supplies in China. Global wheat stocks are
forecast to reach 258 million tonnes by the close of seasons
in 2018, an all-time high and 5 percent above their opening
levels. World wheat inventories have increased continuously
since 2013/14, as growth in global production exceeded
expansion in total world consumption. Overall, the bulk of
this season’s projected expansion in world wheat reserves is
expected to take place in China, where wheat inventories
are forecast to increase by at least 18 million tonnes, or
20 percent, to around 110 million tonnes.
WHEAT
Contact:[email protected]@fao.org (Production)
WHEAT PRODUCTION, UTILIZATION AND STOCKS
WORLD WHEAT MARKET AT A GLANCE
1 Trade refers to exports based on a common July/June marketing season.2 May not equal the difference between supply (defined as production plus
carryover stocks) due to differences in individual country marketing years.3 Major exporters include Argentina, Australia, Canada, EU, Kazakhstan,
Russian Fed., Ukraine and the United States.4 Derived from the International Grains Council (IGC) wheat index.
2015/16 2016/17 estim.
2017/18 f’cast
Change: 2017/18
over 2016/17
million tonnes %
WORLD BALANCE
Production 733.9 760.2 752.8 -1.0
Trade1 166.7 177.4 175.2 -1.2
Total utilization 710.9 732.8 738.2 0.7
Food 491.8 497.7 503.1 1.1
Feed 134.4 136.3 137.8 1.1
Other uses 84.7 98.8 97.3 -1.5
Ending stocks2 222.4 245.2 258.2 5.3
SUPPLY AND DEMAND INDICATORS
Per caput food consumption:
World (kg/yr) 66.6 66.7 66.6 -0.1
LIFDC (kg/yr) 52.9 52.9 52.9 0.0
World stock-to-use ratio (%) 30.4 33.2 34.4
Major exporters stock-to-disappearance ratio3 (%)
16.1 18.7 17.4
FAO WHEAT PRICE INDEX4 (2002-2004=100)
2015 2016 2017 Jan-Oct
Change: Jan-Oct 2017
over Jan-Oct 2016
%
144 125 133 5.8
100
140
180
220
260
400
500
600
700
800
17/1815/1613/1411/1209/1007/08
million tonnes million tonnes
f’cast
Stocks (right axis)
Production (left axis) Utilization (left axis)
Ma
rke
t sum
ma
ries
3FOOD OUTLOOKNOVEMBER 2017
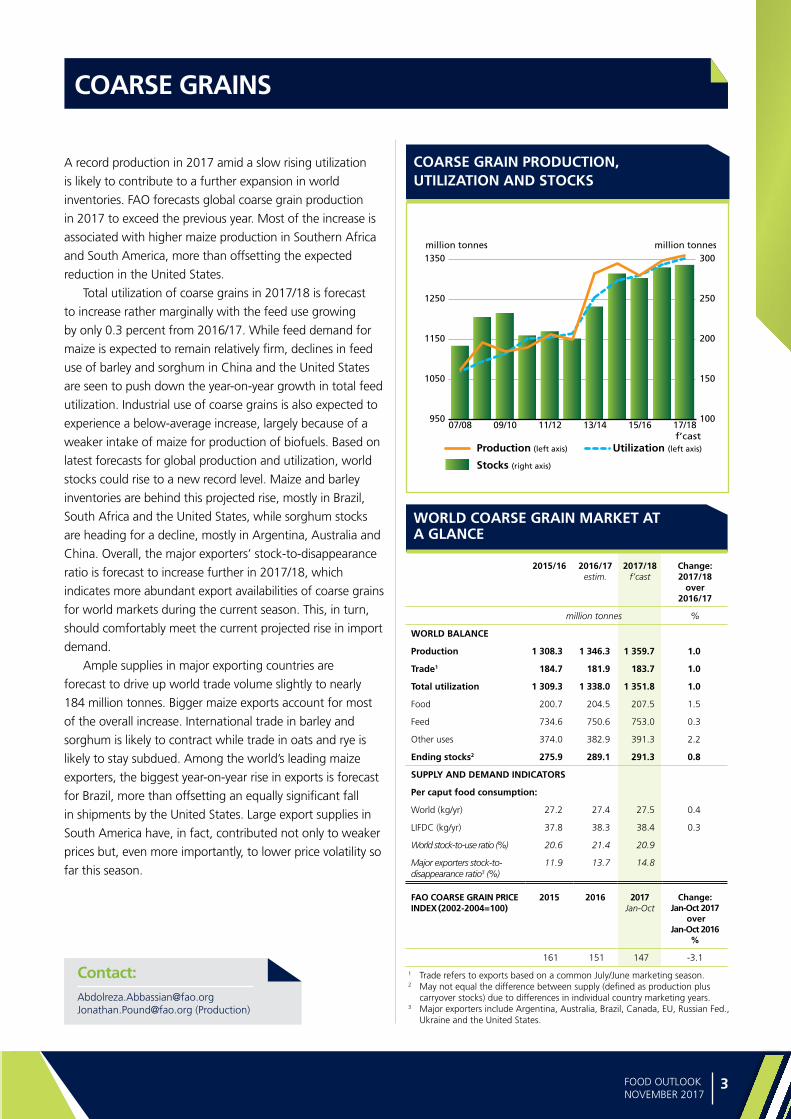
A record production in 2017 amid a slow rising utilization
is likely to contribute to a further expansion in world
inventories. FAO forecasts global coarse grain production
in 2017 to exceed the previous year. Most of the increase is
associated with higher maize production in Southern Africa
and South America, more than offsetting the expected
reduction in the United States.
Total utilization of coarse grains in 2017/18 is forecast
to increase rather marginally with the feed use growing
by only 0.3 percent from 2016/17. While feed demand for
maize is expected to remain relatively firm, declines in feed
use of barley and sorghum in China and the United States
are seen to push down the year-on-year growth in total feed
utilization. Industrial use of coarse grains is also expected to
experience a below-average increase, largely because of a
weaker intake of maize for production of biofuels. Based on
latest forecasts for global production and utilization, world
stocks could rise to a new record level. Maize and barley
inventories are behind this projected rise, mostly in Brazil,
South Africa and the United States, while sorghum stocks
are heading for a decline, mostly in Argentina, Australia and
China. Overall, the major exporters’ stock-to-disappearance
ratio is forecast to increase further in 2017/18, which
indicates more abundant export availabilities of coarse grains
for world markets during the current season. This, in turn,
should comfortably meet the current projected rise in import
demand.
Ample supplies in major exporting countries are
forecast to drive up world trade volume slightly to nearly
184 million tonnes. Bigger maize exports account for most
of the overall increase. International trade in barley and
sorghum is likely to contract while trade in oats and rye is
likely to stay subdued. Among the world’s leading maize
exporters, the biggest year-on-year rise in exports is forecast
for Brazil, more than offsetting an equally significant fall
in shipments by the United States. Large export supplies in
South America have, in fact, contributed not only to weaker
prices but, even more importantly, to lower price volatility so
far this season.
COARSE GRAINS
Contact:[email protected] [email protected] (Production)
COARSE GRAIN PRODUCTION, UTILIZATION AND STOCKS
1 Trade refers to exports based on a common July/June marketing season.2 May not equal the difference between supply (defined as production plus
carryover stocks) due to differences in individual country marketing years.3 Major exporters include Argentina, Australia, Brazil, Canada, EU, Russian Fed.,
Ukraine and the United States.
WORLD COARSE GRAIN MARKET AT A GLANCE
2015/16 2016/17 estim.
2017/18 f’cast
Change: 2017/18
over 2016/17
million tonnes %
WORLD BALANCE
Production 1 308.3 1 346.3 1 359.7 1.0
Trade1 184.7 181.9 183.7 1.0
Total utilization 1 309.3 1 338.0 1 351.8 1.0
Food 200.7 204.5 207.5 1.5
Feed 734.6 750.6 753.0 0.3
Other uses 374.0 382.9 391.3 2.2
Ending stocks2 275.9 289.1 291.3 0.8
SUPPLY AND DEMAND INDICATORS
Per caput food consumption:
World (kg/yr) 27.2 27.4 27.5 0.4
LIFDC (kg/yr) 37.8 38.3 38.4 0.3
World stock-to-use ratio (%) 20.6 21.4 20.9
Major exporters stock-to-disappearance ratio3 (%)
11.9 13.7 14.8
FAO COARSE GRAIN PRICE INDEX (2002-2004=100)
2015 2016 2017 Jan-Oct
Change: Jan-Oct 2017
over Jan-Oct 2016
%
161 151 147 -3.1
100
150
200
250
300
950
1050
1150
1250
1350
17/1815/1613/1411/1209/1007/08
million tonnes million tonnes
f’cast
Stocks (right axis)
Production (left axis) Utilization (left axis)
Ma
rke
t su
mm
ari
es
4 FOOD OUTLOOKNOVEMBER 2017
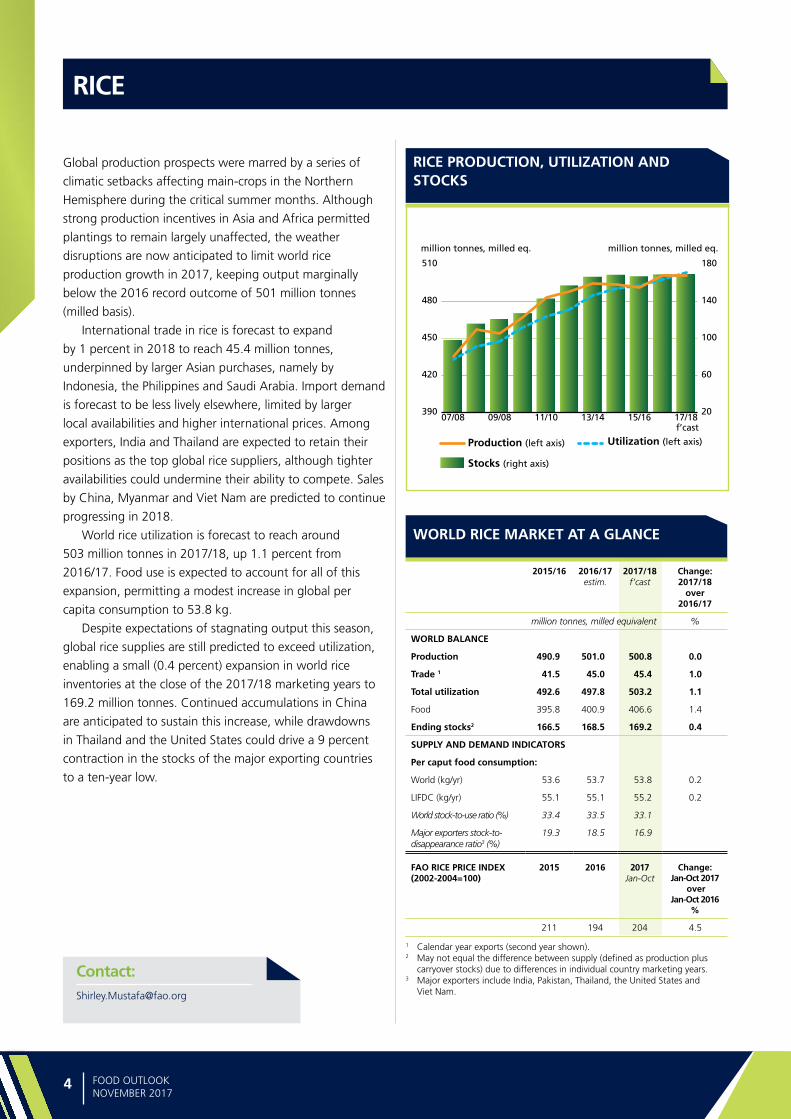
Global production prospects were marred by a series of
climatic setbacks affecting main-crops in the Northern
Hemisphere during the critical summer months. Although
strong production incentives in Asia and Africa permitted
plantings to remain largely unaffected, the weather
disruptions are now anticipated to limit world rice
production growth in 2017, keeping output marginally
below the 2016 record outcome of 501 million tonnes
(milled basis).
International trade in rice is forecast to expand
by 1 percent in 2018 to reach 45.4 million tonnes,
underpinned by larger Asian purchases, namely by
Indonesia, the Philippines and Saudi Arabia. Import demand
is forecast to be less lively elsewhere, limited by larger
local availabilities and higher international prices. Among
exporters, India and Thailand are expected to retain their
positions as the top global rice suppliers, although tighter
availabilities could undermine their ability to compete. Sales
by China, Myanmar and Viet Nam are predicted to continue
progressing in 2018.
World rice utilization is forecast to reach around
503 million tonnes in 2017/18, up 1.1 percent from
2016/17. Food use is expected to account for all of this
expansion, permitting a modest increase in global per
capita consumption to 53.8 kg.
Despite expectations of stagnating output this season,
global rice supplies are still predicted to exceed utilization,
enabling a small (0.4 percent) expansion in world rice
inventories at the close of the 2017/18 marketing years to
169.2 million tonnes. Continued accumulations in China
are anticipated to sustain this increase, while drawdowns
in Thailand and the United States could drive a 9 percent
contraction in the stocks of the major exporting countries
to a ten-year low.
RICE
Contact:[email protected]
RICE PRODUCTION, UTILIZATION AND STOCKS
WORLD RICE MARKET AT A GLANCE
2015/16 2016/17 estim.
2017/18 f’cast
Change: 2017/18
over 2016/17
million tonnes, milled equivalent %
WORLD BALANCE
Production 490.9 501.0 500.8 0.0
Trade 1 41.5 45.0 45.4 1.0
Total utilization 492.6 497.8 503.2 1.1
Food 395.8 400.9 406.6 1.4
Ending stocks2 166.5 168.5 169.2 0.4
SUPPLY AND DEMAND INDICATORS
Per caput food consumption:
World (kg/yr) 53.6 53.7 53.8 0.2
LIFDC (kg/yr) 55.1 55.1 55.2 0.2
World stock-to-use ratio (%) 33.4 33.5 33.1
Major exporters stock-to-disappearance ratio3 (%)
19.3 18.5 16.9
FAO RICE PRICE INDEX (2002-2004=100)
2015 2016 2017 Jan-Oct
Change: Jan-Oct 2017
over Jan-Oct 2016
%
211 194 204 4.5
1 Calendar year exports (second year shown).2 May not equal the difference between supply (defined as production plus
carryover stocks) due to differences in individual country marketing years.3 Major exporters include India, Pakistan, Thailand, the United States and
Viet Nam.
20
60
100
140
180
390
420
450
480
510
17/1815/1613/1411/1009/0807/08
million tonnes, milled eq. million tonnes, milled eq.
f’cast
Stocks (right axis)
Production (left axis) Utilization (left axis)
Ma
rke
t sum
ma
ries
5FOOD OUTLOOKNOVEMBER 2017
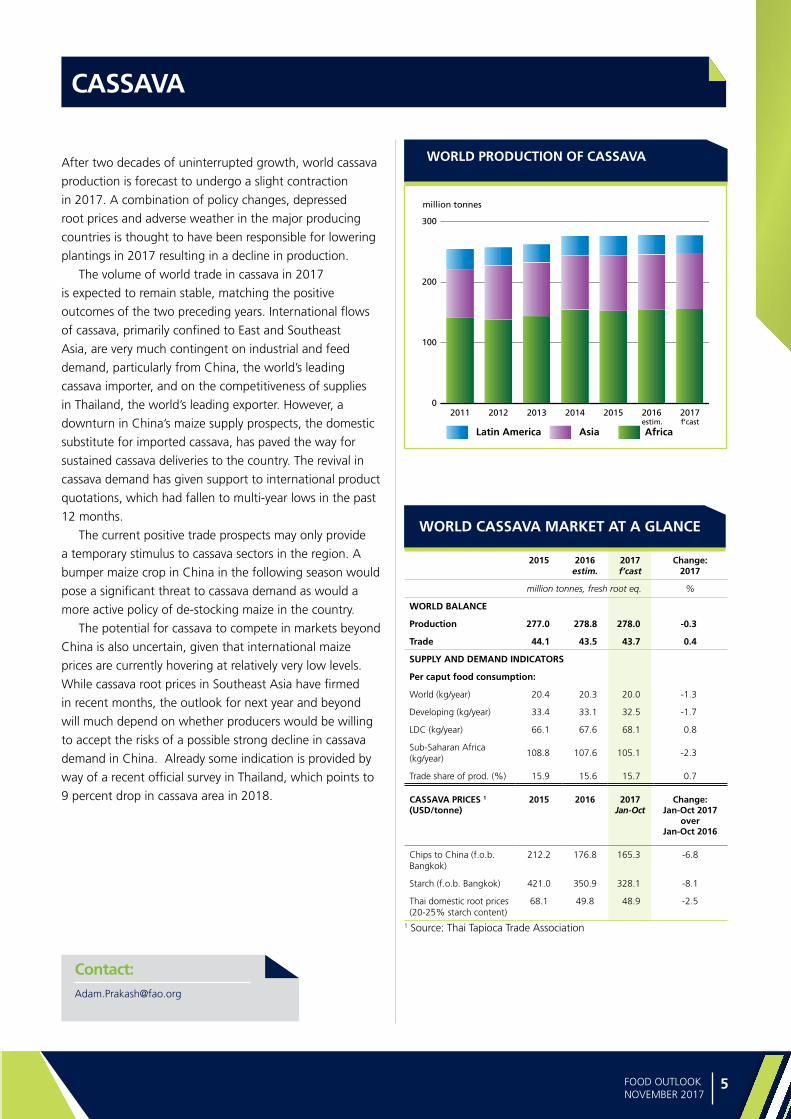
After two decades of uninterrupted growth, world cassava
production is forecast to undergo a slight contraction
in 2017. A combination of policy changes, depressed
root prices and adverse weather in the major producing
countries is thought to have been responsible for lowering
plantings in 2017 resulting in a decline in production.
The volume of world trade in cassava in 2017
is expected to remain stable, matching the positive
outcomes of the two preceding years. International flows
of cassava, primarily confined to East and Southeast
Asia, are very much contingent on industrial and feed
demand, particularly from China, the world’s leading
cassava importer, and on the competitiveness of supplies
in Thailand, the world’s leading exporter. However, a
downturn in China’s maize supply prospects, the domestic
substitute for imported cassava, has paved the way for
sustained cassava deliveries to the country. The revival in
cassava demand has given support to international product
quotations, which had fallen to multi-year lows in the past
12 months.
The current positive trade prospects may only provide
a temporary stimulus to cassava sectors in the region. A
bumper maize crop in China in the following season would
pose a significant threat to cassava demand as would a
more active policy of de-stocking maize in the country.
The potential for cassava to compete in markets beyond
China is also uncertain, given that international maize
prices are currently hovering at relatively very low levels.
While cassava root prices in Southeast Asia have firmed
in recent months, the outlook for next year and beyond
will much depend on whether producers would be willing
to accept the risks of a possible strong decline in cassava
demand in China. Already some indication is provided by
way of a recent official survey in Thailand, which points to
9 percent drop in cassava area in 2018.
CASSAVA
Contact:[email protected]
WORLD PRODUCTION OF CASSAVA
WORLD CASSAVA MARKET AT A GLANCE
1 Source: Thai Tapioca Trade Association
0
100
200
300
2017201620152014201320122011
AfricaAsiaLatin Americaestim. f’cast
million tonnes
2015 2016 estim.
2017 f’cast
Change: 2017
million tonnes, fresh root eq. %
WORLD BALANCE
Production 277.0 278.8 278.0 -0.3
Trade 44.1 43.5 43.7 0.4
SUPPLY AND DEMAND INDICATORS
Per caput food consumption:
World (kg/year) 20.4 20.3 20.0 -1.3
Developing (kg/year) 33.4 33.1 32.5 -1.7
LDC (kg/year) 66.1 67.6 68.1 0.8
Sub-Saharan Africa (kg/year)
108.8 107.6 105.1 -2.3
Trade share of prod. (%) 15.9 15.6 15.7 0.7
CASSAVA PRICES 1 (USD/tonne)
2015 2016 2017 Jan-Oct
Change:Jan-Oct 2017
overJan-Oct 2016
Chips to China (f.o.b. Bangkok)
212.2 176.8 165.3 -6.8
Starch (f.o.b. Bangkok) 421.0 350.9 328.1 -8.1
Thai domestic root prices (20-25% starch content)
68.1 49.8 48.9 -2.5

Ma
rke
t su
mm
ari
es
6 FOOD OUTLOOKNOVEMBER 2017
The 2016/17 season saw an easing in the global oilseeds
and oilmeal supply and demand situation, while vegetable
oil fundamentals remained relatively tight. Accordingly,
during the recently ended October/September marketing
year, international prices for oilseeds and oilmeals remained
subdued, while those of oils/fats maintained their strength.
Preliminary forecasts for 2017/18 point to a broadly
balanced global supply and demand situation, in both the
oilseed and meal markets as well as in the oils/fats segment.
Global oilseed production is forecast to match last season’s
record level, with small year-on-year contractions in soybean
and sunflowerseed compensated by improvements in other
oilcrops. While the global area of the seven major oilseeds
is anticipated to expand further, average yields are expected
to retreat to trend levels, following last season’s unparalleled
highs. For soybeans, individual countries’ prospects are
mixed, with year-on-year gains concentrated in the Northern
Hemisphere, notably the United States, China and Canada,
while, in South America, possible drops are looming in Brazil
and Argentina.
World oils/fats production is forecast to expand moderately
in 2017/18. Growth would be led by palm oil, with production
in Southeast Asia reverting to average growth, after the last
two seasons’ El Niño-related swings. Global oils/fats utilization
could grow less than last season, assuming moderate income
growth in a number of countries and only limited expansion
in demand from the biodiesel sector. International meal
output, on the other hand, is forecast to remain flat, given
the anticipated drop in soybean production. Based on current
forecasts, global supplies of both meals and oils/fats would
be adequate to meet global demand, thus allowing end-of-
season stocks to remain at comfortable levels. World trade in
oils/fats and meals/cakes is anticipated to keep expanding in
2017/18, albeit at a somewhat reduced pace compared with
the previous season.
In the coming months, international prices of oilseeds, oils
and meals will be influenced by changes in the production
forecasts for soybeans in South America and palm oil in
Southeast Asia. Uncertainties remain regarding the actual
course of global oil and meal demand, including, in the case
of oils/fats, the impact of recent policy changes concerning the
biodiesel market.
OILCROPS
Contact:[email protected]
FAO MONTHLY INTERNATIONAL PRICE INDICES FOR OILSEEDS, VEGETABLE OILS AND MEALS/CAKES (2002-2004=100)
WORLD OILCROP AND PRODUCT MARKET AT A GLANCE
2015/16 2016/17 estim.
2017/18 f’cast
Change: 2017/18
over 2016/17
million tonnes %
TOTAL OILCROPS
Production 534.8 582.6 585.7 0.5
OILS AND FATS
Production 206.1 223.3 226.5 1.4
Supply 244.9 257.7 263.5 2.2
Utilization 212.1 219.8 226.0 2.8
Trade 115.1 122.8 125.3 2.1
Global stock-to-use ratio (%) 16.2 16.8 16.6
Major exporters stock-to-disappearance ratio (%)
10.0 10.5 10.8
MEALS AND CAKES
Production 137.8 151.5 150.8 -0.4
Supply 163.9 176.6 179.2 1.5
Utilization 139.2 145.6 150.4 3.3
Trade 90.3 96.2 99.0 2.9
Global stock-to-use ratio (%) 25.1 28.3 28.6
Major exporters stock-to-disappearance ratio (%)
11.1 13.0 12.1
FAO PRICE INDICES (Jan-Dec) (2002-2004=100)
2015 2016 2017 Jan-Sep
Change: Jan-Sep 2017
overJan-Sep 2016
%
Oilseeds 149 154 153 -0.2
Meals/cakes 179 169 159 -6.9
Vegetable oils 147 164 169 5.7
NOTE: Refer to footnote 1 on page 40 and to table 2 on page 42 for explanations regarding definitions and coverage.
100
150
200
250
300
20172016201520142013201220112010
Meals/cakesVegetable oils
Oilseeds
Ma
rke
t sum
ma
ries
7FOOD OUTLOOKNOVEMBER 2017
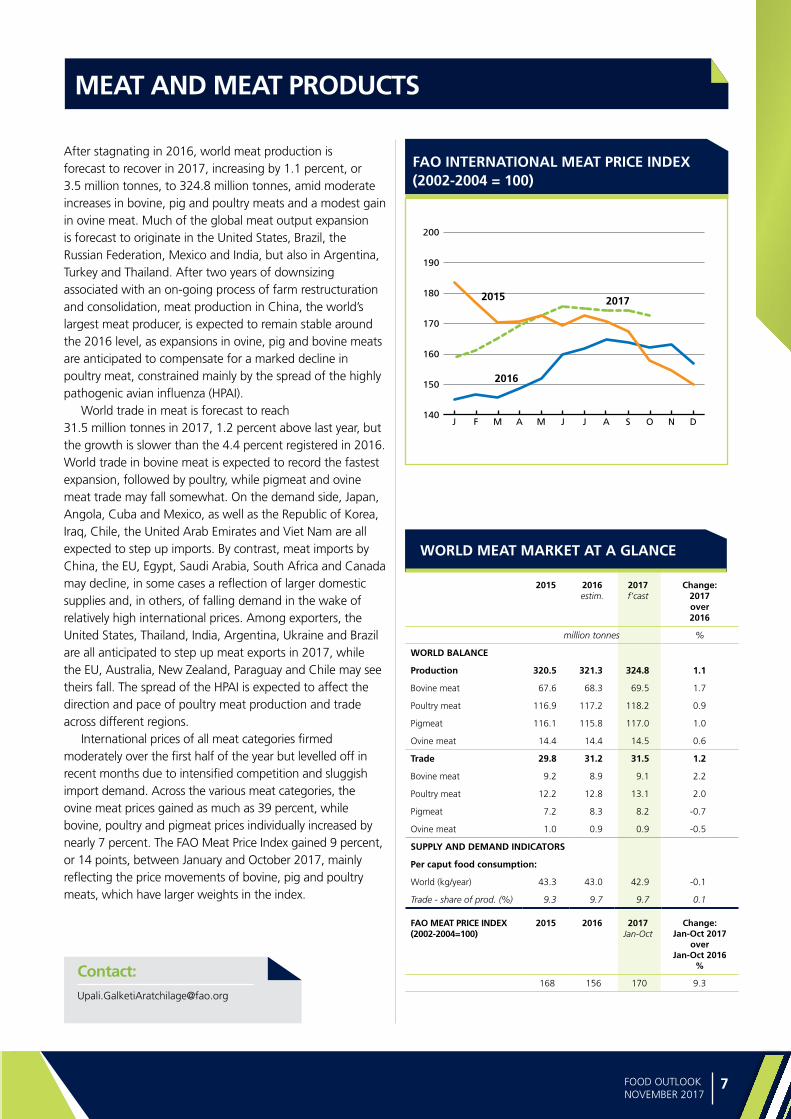
After stagnating in 2016, world meat production is forecast to recover in 2017, increasing by 1.1 percent, or 3.5 million tonnes, to 324.8 million tonnes, amid moderate increases in bovine, pig and poultry meats and a modest gain in ovine meat. Much of the global meat output expansion is forecast to originate in the United States, Brazil, the Russian Federation, Mexico and India, but also in Argentina, Turkey and Thailand. After two years of downsizing associated with an on-going process of farm restructuration and consolidation, meat production in China, the world’s largest meat producer, is expected to remain stable around the 2016 level, as expansions in ovine, pig and bovine meats are anticipated to compensate for a marked decline in poultry meat, constrained mainly by the spread of the highly pathogenic avian influenza (HPAI).
World trade in meat is forecast to reach 31.5 million tonnes in 2017, 1.2 percent above last year, but the growth is slower than the 4.4 percent registered in 2016. World trade in bovine meat is expected to record the fastest expansion, followed by poultry, while pigmeat and ovine meat trade may fall somewhat. On the demand side, Japan, Angola, Cuba and Mexico, as well as the Republic of Korea, Iraq, Chile, the United Arab Emirates and Viet Nam are all expected to step up imports. By contrast, meat imports by China, the EU, Egypt, Saudi Arabia, South Africa and Canada may decline, in some cases a reflection of larger domestic supplies and, in others, of falling demand in the wake of relatively high international prices. Among exporters, the United States, Thailand, India, Argentina, Ukraine and Brazil are all anticipated to step up meat exports in 2017, while the EU, Australia, New Zealand, Paraguay and Chile may see theirs fall. The spread of the HPAI is expected to affect the direction and pace of poultry meat production and trade across different regions.
International prices of all meat categories firmed moderately over the first half of the year but levelled off in recent months due to intensified competition and sluggish import demand. Across the various meat categories, the ovine meat prices gained as much as 39 percent, while bovine, poultry and pigmeat prices individually increased by nearly 7 percent. The FAO Meat Price Index gained 9 percent, or 14 points, between January and October 2017, mainly reflecting the price movements of bovine, pig and poultry meats, which have larger weights in the index.
MEAT AND MEAT PRODUCTS
Contact:[email protected]
FAO INTERNATIONAL MEAT PRICE INDEX (2002-2004 = 100)
WORLD MEAT MARKET AT A GLANCE
2015 2016estim.
2017f’cast
Change: 2017 over 2016
million tonnes %
WORLD BALANCE
Production 320.5 321.3 324.8 1.1
Bovine meat 67.6 68.3 69.5 1.7
Poultry meat 116.9 117.2 118.2 0.9
Pigmeat 116.1 115.8 117.0 1.0
Ovine meat 14.4 14.4 14.5 0.6
Trade 29.8 31.2 31.5 1.2
Bovine meat 9.2 8.9 9.1 2.2
Poultry meat 12.2 12.8 13.1 2.0
Pigmeat 7.2 8.3 8.2 -0.7
Ovine meat 1.0 0.9 0.9 -0.5
SUPPLY AND DEMAND INDICATORS
Per caput food consumption:
World (kg/year) 43.3 43.0 42.9 -0.1
Trade - share of prod. (%) 9.3 9.7 9.7 0.1
FAO MEAT PRICE INDEX(2002-2004=100)
2015 2016 2017 Jan-Oct
Change: Jan-Oct 2017
over Jan-Oct 2016
%
168 156 170 9.3
140
150
160
170
180
190
200
DNOSAJJMAMFJ
2015 2017
2016

Ma
rke
t su
mm
ari
es
8 FOOD OUTLOOKNOVEMBER 2017
World milk production is set to reach 833.5 million tonnes
in 2017, 1.4 percent more than in 2016. Much of the
anticipated rise is expected in Asia and the Americas, while
the sector might stagnate in Europe and Africa and possibly
face a decline in Oceania.
World trade in dairy products is forecast to increase
by 1.3 percent in 2017 to 71.6 million tonnes (in milk
equivalent) marking a second year of modest growth.
Most of the export growth is expected to come from
North America and Europe. Despite a slow growth in milk
production, the EU is anticipated to account for the largest
export expansion, underpinned by increased sales of cheese
and skim milk powder (SMP). Likewise, greater shipments
of cheese, but also of SMP, are expected to boost exports
from the United States. In contrast, exports from South
America, Oceania, Asia and Africa are forecast to decline in
2017, largely reflecting supply constraints.
On the demand side, Asia is anticipated to drive
the expansion, with imports by the region predicted at
around 41 million tonnes, 1.5 percent more than in 2016.
Within Asia, China is behind much of that expected
increase, with its purchases fuelled by demand for higher
value-added dairy products, in particular cheese and
SMP. Elsewhere, imports are forecast to rise in Algeria,
Australia, the Russian Federation, Mexico, Indonesia, the
Republic of Korea, Japan, Thailand and Pakistan. Conversely,
imports are foreseen to decline significantly in Brazil, Saudi
Arabia, Oman, the United States, the EU, the Philippines,
Egypt, Malaysia, the United Arab Emirates, Cuba, Belarus
and Turkey.
Among the various dairy products, world trade in cheese
and SMP is expected to increase in 2017, while trade in
butter and WMP may contract.
After continuously rising for nine months from May
2016, international dairy prices tapered off for a short while
in early 2017, when increased deliveries by the EU and
the United States eased supply concerns. However, prices
strenghthened from May to September 2017, reflecting
a surge in butter prices and moderate increases in cheese
and whole milk powder, while skim milk powder prices
remained subdued. In October, the index declined by
4 percent as importers held back purchases awaiting the
emerging trend for export availabilities from Oceania.
MILK AND MILK PRODUCTS
Contact:[email protected]
FAO INTERNATIONAL DAIRY PRICE INDEX (2002-2004 = 100)
WORLD DAIRY MARKET AT A GLANCE
2015 2016estim.
2017f’cast
Change: 2017 over 2016
million tonnes, milk equiv. %
WORLD BALANCE
Total milk production 815.4 821.8 833.5 1.4
Total trade 70.0 70.7 71.6 1.3
SUPPLY AND DEMAND INDICATORS
Per caput food consumption:
World (kg/year) 110.4 110.1 110.4 0.3
Trade - share of prod. (%) 8.6 8.6 8.6 -0.1
FAO DAIRY PRICE INDEX(2002-2004=100)
2015 2016 2017 Jan-Oct
Change: Jan-Oct 2017
over Jan-Oct 2016
%
160 154 204 39.0
100
130
160
190
220
250
DNOSAJJMAMFJ
2016
2017
2015
Ma
rke
t sum
ma
ries
9FOOD OUTLOOKNOVEMBER 2017
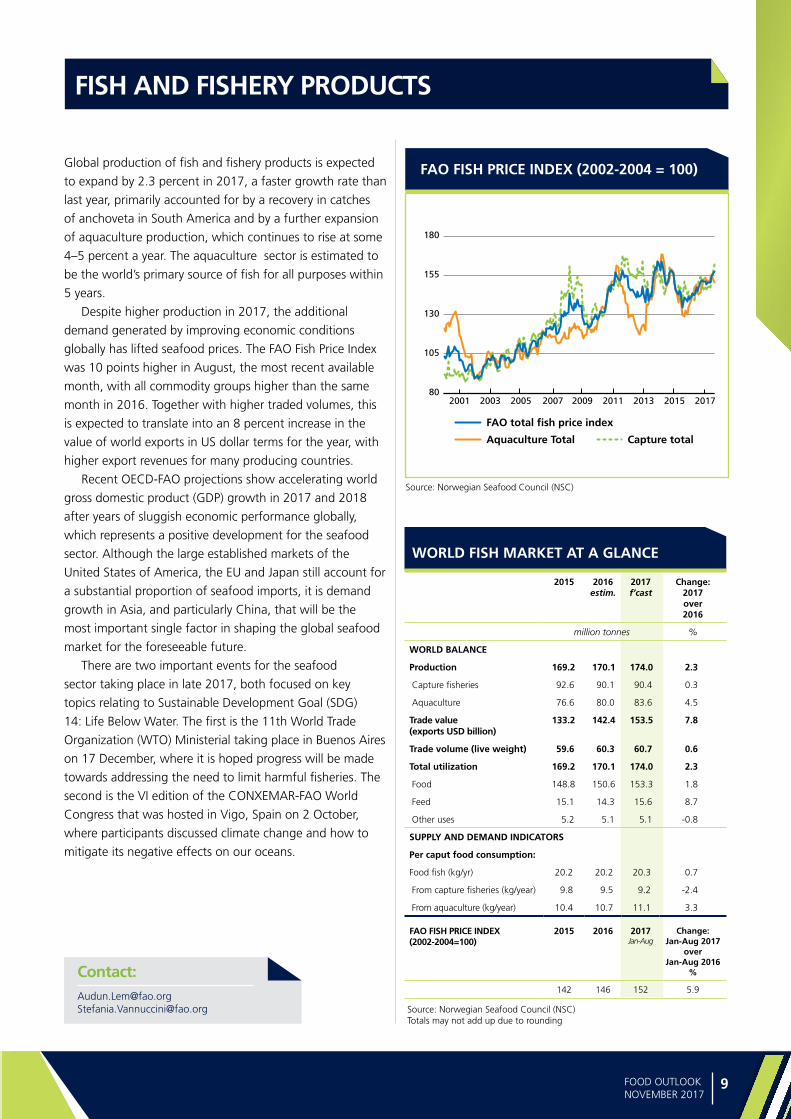
Global production of fish and fishery products is expected
to expand by 2.3 percent in 2017, a faster growth rate than
last year, primarily accounted for by a recovery in catches
of anchoveta in South America and by a further expansion
of aquaculture production, which continues to rise at some
4–5 percent a year. The aquaculture sector is estimated to
be the world’s primary source of fish for all purposes within
5 years.
Despite higher production in 2017, the additional
demand generated by improving economic conditions
globally has lifted seafood prices. The FAO Fish Price Index
was 10 points higher in August, the most recent available
month, with all commodity groups higher than the same
month in 2016. Together with higher traded volumes, this
is expected to translate into an 8 percent increase in the
value of world exports in US dollar terms for the year, with
higher export revenues for many producing countries.
Recent OECD-FAO projections show accelerating world
gross domestic product (GDP) growth in 2017 and 2018
after years of sluggish economic performance globally,
which represents a positive development for the seafood
sector. Although the large established markets of the
United States of America, the EU and Japan still account for
a substantial proportion of seafood imports, it is demand
growth in Asia, and particularly China, that will be the
most important single factor in shaping the global seafood
market for the foreseeable future.
There are two important events for the seafood
sector taking place in late 2017, both focused on key
topics relating to Sustainable Development Goal (SDG)
14: Life Below Water. The first is the 11th World Trade
Organization (WTO) Ministerial taking place in Buenos Aires
on 17 December, where it is hoped progress will be made
towards addressing the need to limit harmful fisheries. The
second is the VI edition of the CONXEMAR-FAO World
Congress that was hosted in Vigo, Spain on 2 October,
where participants discussed climate change and how to
mitigate its negative effects on our oceans.
FISH AND FISHERY PRODUCTS
Contact:[email protected]@fao.org
FAO FISH PRICE INDEX (2002-2004 = 100)
WORLD FISH MARKET AT A GLANCE
Source: Norwegian Seafood Council (NSC)Totals may not add up due to rounding
Source: Norwegian Seafood Council (NSC)
2015 2016estim.
2017f’cast
Change: 2017 over 2016
million tonnes %
WORLD BALANCE
Production 169.2 170.1 174.0 2.3
Capture fisheries 92.6 90.1 90.4 0.3
Aquaculture 76.6 80.0 83.6 4.5
Trade value (exports USD billion)
133.2 142.4 153.5 7.8
Trade volume (live weight) 59.6 60.3 60.7 0.6
Total utilization 169.2 170.1 174.0 2.3
Food 148.8 150.6 153.3 1.8
Feed 15.1 14.3 15.6 8.7
Other uses 5.2 5.1 5.1 -0.8
SUPPLY AND DEMAND INDICATORS
Per caput food consumption:
Food fish (kg/yr) 20.2 20.2 20.3 0.7
From capture fisheries (kg/year) 9.8 9.5 9.2 -2.4
From aquaculture (kg/year) 10.4 10.7 11.1 3.3
FAO FISH PRICE INDEX
(2002-2004=100)2015 2016 2017
Jan-AugChange:
Jan-Aug 2017 over
Jan-Aug 2016 %
142 146 152 5.9
80
105
130
155
180
201720152013201120092007200520032001
FAO total fish price index
Capture totalAquaculture Total

MAR
KET
ASSE
SSM
ENTS
MAR
KET
ASSE
SSM
ENTS
11FOOD OUTLOOK NOVEMBER 2017
WH
EA
T
Figure 1. IGC Wheat Price Index Figure 2. CBOT wheat futures for December
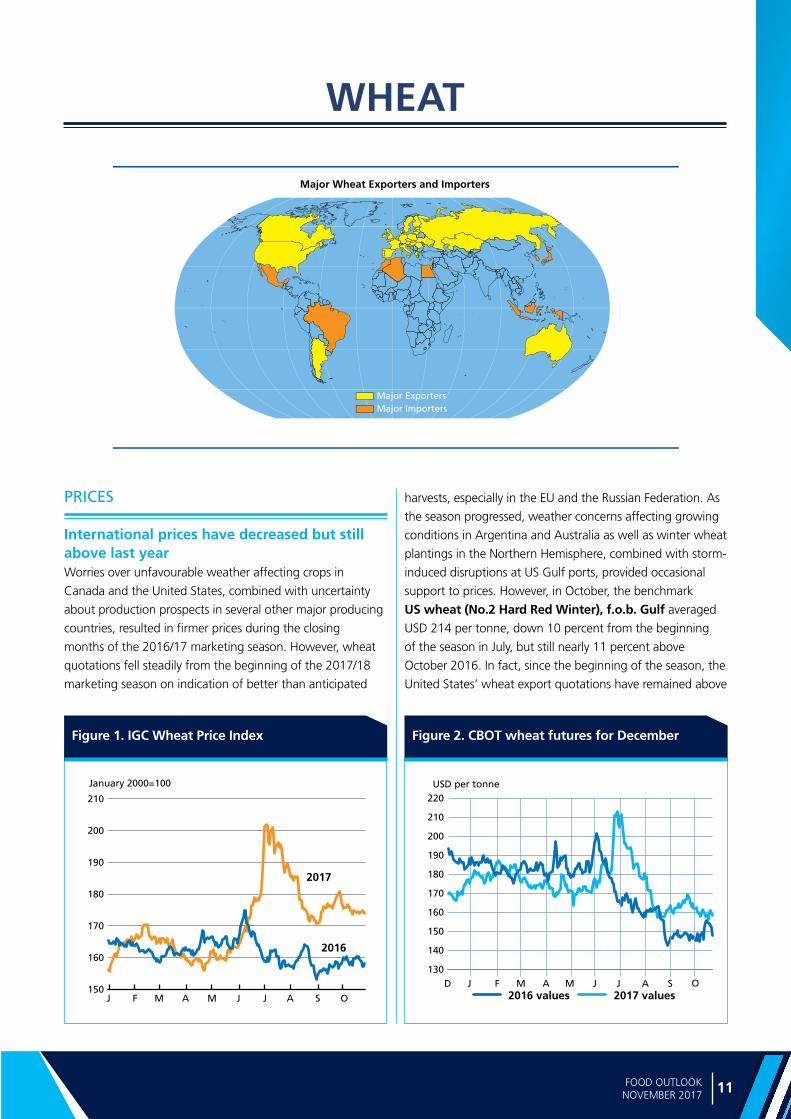
Major Wheat Exporters and Importers
Major ExportersMajor Importers
WHEAT
PRICES
International prices have decreased but still above last yearWorries over unfavourable weather affecting crops in
Canada and the United States, combined with uncertainty
about production prospects in several other major producing
countries, resulted in firmer prices during the closing
months of the 2016/17 marketing season. However, wheat
quotations fell steadily from the beginning of the 2017/18
marketing season on indication of better than anticipated
harvests, especially in the EU and the Russian Federation. As
the season progressed, weather concerns affecting growing
conditions in Argentina and Australia as well as winter wheat
plantings in the Northern Hemisphere, combined with storm-
induced disruptions at US Gulf ports, provided occasional
support to prices. However, in October, the benchmark
US wheat (No.2 Hard Red Winter), f.o.b. Gulf averaged
USD 214 per tonne, down 10 percent from the beginning
of the season in July, but still nearly 11 percent above
October 2016. In fact, since the beginning of the season, the
United States’ wheat export quotations have remained above
150
160
170
180
190
200
210
OSAJJMAMFJ
2017
2016
January 2000=100
130
140
150
160
170
180
190
200
210
220USD per tonne
S OD J F M A M2017 values2016 values
J J A

Ma
rke
t a
sse
ssm
en
ts
12 FOOD OUTLOOKNOVEMBER 2017
Table 1. World wheat market at a glance
Table 2. Wheat production: leading producers*
2015 2016 estim.
2017f”cast
Change:2017 over
2016
million tonnes %
European Union 160.5 144.5 150.0 3.8
China (Mainland) 130.2 128.9 130.2 1.0
India 86.5 92.3 98.4 6.6
Russian Federation 61.8 73.3 83.6 14.1
United States 56.1 62.8 47.4 -24.6
Canada 27.6 31.7 27.1 -14.5
Ukraine 26.5 26.0 26.6 2.0
Pakistan 25.1 25.5 26.0 2.0
Turkey 22.6 20.6 21.8 5.8
Australia 22.3 35.0 21.6 -38.3
Argentina 11.3 18.4 19.0 3.3
Kazakhstan 13.7 15.0 13.9 -7.5
Iran Islamic Rep. of 11.5 13.5 13.5 0.0
Egypt 9.0 9.0 8.8 -2.2
Other countries 69.1 63.7 65.0 2.0
World 733.9 760.2 752.8 -1.0
* Countries listed according to their position in global production (average 2015-2017)
1 Trade refers to exports based on a common July/June marketing season.2 May not equal the difference between supply (defined as production plus
carryover stocks) due to differences in individual country marketing years.3 Major exporters include Argentina, Australia, Canada, EU, Kazakhstan,
Russian Fed., Ukraine and the United States.4 Derived from the International Grains Council (IGC) wheat index.
2015/16 2016/17 estim.
2017/18 f’cast
Change: 2017/18
over 2016/17
million tonnes %
WORLD BALANCE
Production 733.9 760.2 752.8 -1.0
Trade1 166.7 177.4 175.2 -1.2
Total utilization 710.9 732.8 738.2 0.7
Food 491.8 497.7 503.1 1.1
Feed 134.4 136.3 137.8 1.1
Other uses 84.7 98.8 97.3 -1.5
Ending stocks2 222.4 245.2 258.2 5.3
SUPPLY AND DEMAND INDICATORS
Per caput food consumption:
World (kg/yr) 66.6 66.7 66.6 -0.1
LIFDC (kg/yr) 52.9 52.9 52.9 0.0
World stock-to-use ratio (%) 30.4 33.2 34.4
Major exporters stock-to-disappearance ratio3 (%)
16.1 18.7 17.4
FAO WHEAT PRICE INDEX4 (2002-2004=100)
2015 2016 2017 Jan-Oct
Change: Jan-Oct 2017
over Jan-Oct 2016
%
144 125 133 5.8
last year’s levels. This is primarily because of tighter supplies
of high quality wheat in the face of rising world demand, as
illustrated in Box 1. Wheat futures have followed a similar
movement since the beginning of the current season. In
October, the Chicago Board of Trade (CBOT) quotation
for December delivery averaged USD161 per tonne, up
7 percent from October 2016. More detailed analysis of
the futures markets can be found in Box 1 as well as in the
Market Indicators section of this report.
PRODUCTION
Wheat production down slightly from last yearFAO’s current forecast for world wheat production in 2017
stands at 752.8 million tonnes, which is 7.4 million tonnes,
or 1.0 percent, below the previous year’s level. Most of the
decrease this year is associated with significant production
cuts expected in Australia and the United States. However,
the global output is still forecast to be the second highest
on record.
In the United States, wheat production in 2017 is
forecast to decrease by 25 percent to 47.4 million tonnes.
The decline is principally due to a significant cut in the
winter-wheat-planted area and a return to trend yields from
last year’s above-average highs. Similarly, the spring and
durum outputs are also forecast to fall due to unfavourable
weather, although the impact of dryness was not as serious
as first expected, prompting slight upward production
revisions in recent months. Canada is forecast to harvest
a reduced crop of 27.1 million tonnes, about 15 percent
down from 2016, with a reduction in both plantings and
yields contributing to the contraction.
In Europe, harvesting of the 2017 wheat crop is nearly
complete. Production in the EU is forecast to increase by
4 percent to 150 million tonnes in 2017. Much of this
increase rests on an improved output in France, while
an upturn in overall yields also supported the year-on-
year production gain. Moreover, the generally favourable
weather improved overall wheat quality compared to 2016,
although rains at harvest time in Germany and Poland
adversely affected crop quality in these countries. In the
Russian Federation, improved weather conditions over
the course of the season led to several upward revisions
of the production forecast. With the harvest expected to
be complete by mid-November, the output is forecast at a
record high of 83.6 million tonnes, up 10 million tonnes
from 2016. In Ukraine, higher yields are expected to have
fostered a 2 percent increase in wheat production, estimated
at 26.6 million tonnes, with the bulk of the crop already
harvested in spring. In Kazakhstan, where the bulk of this
year’s crop has already been gathered, our latest estimates
13FOOD OUTLOOK NOVEMBER 2017
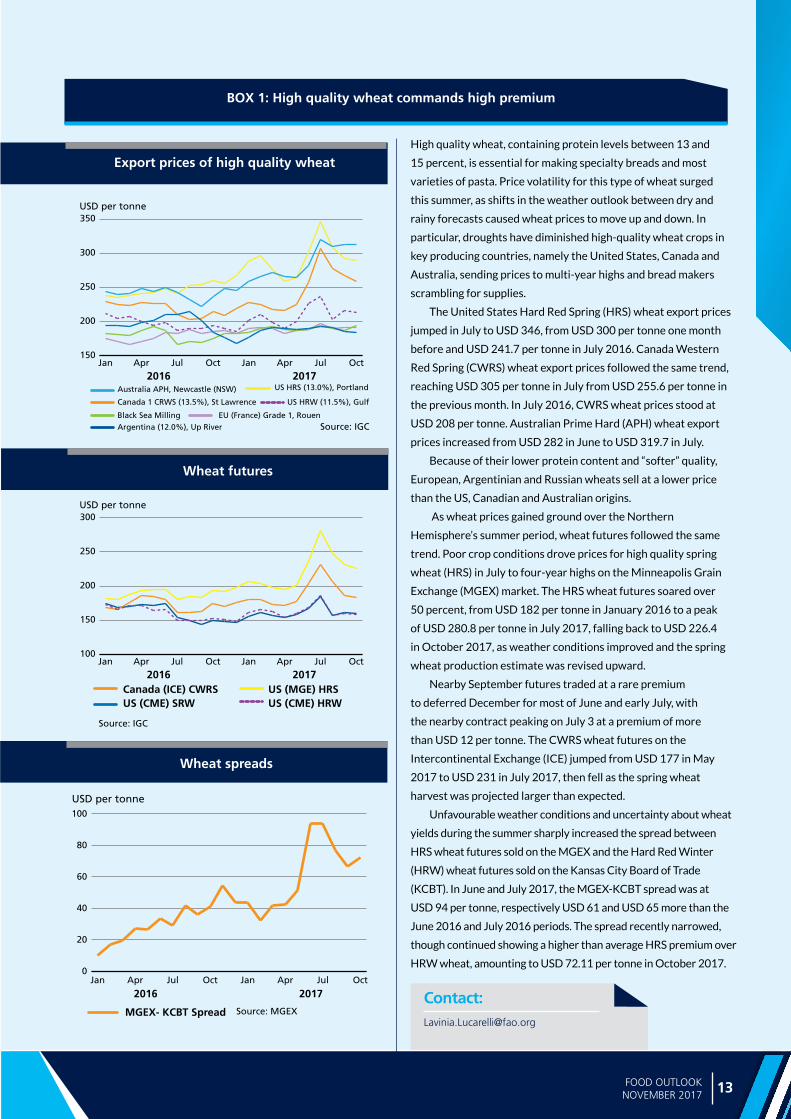
High quality wheat, containing protein levels between 13 and
15 percent, is essential for making specialty breads and most
varieties of pasta. Price volatility for this type of wheat surged
this summer, as shifts in the weather outlook between dry and
rainy forecasts caused wheat prices to move up and down. In
particular, droughts have diminished high-quality wheat crops in
key producing countries, namely the United States, Canada and
Australia, sending prices to multi-year highs and bread makers
scrambling for supplies.
The United States Hard Red Spring (HRS) wheat export prices
jumped in July to USD 346, from USD 300 per tonne one month
before and USD 241.7 per tonne in July 2016. Canada Western
Red Spring (CWRS) wheat export prices followed the same trend,
reaching USD 305 per tonne in July from USD 255.6 per tonne in
the previous month. In July 2016, CWRS wheat prices stood at
USD 208 per tonne. Australian Prime Hard (APH) wheat export
prices increased from USD 282 in June to USD 319.7 in July.
Because of their lower protein content and “softer” quality,
European, Argentinian and Russian wheats sell at a lower price
than the US, Canadian and Australian origins.
As wheat prices gained ground over the Northern
Hemisphere’s summer period, wheat futures followed the same
trend. Poor crop conditions drove prices for high quality spring
wheat (HRS) in July to four-year highs on the Minneapolis Grain
Exchange (MGEX) market. The HRS wheat futures soared over
50 percent, from USD 182 per tonne in January 2016 to a peak
of USD 280.8 per tonne in July 2017, falling back to USD 226.4
in October 2017, as weather conditions improved and the spring
wheat production estimate was revised upward.
Nearby September futures traded at a rare premium
to deferred December for most of June and early July, with
the nearby contract peaking on July 3 at a premium of more
than USD 12 per tonne. The CWRS wheat futures on the
Intercontinental Exchange (ICE) jumped from USD 177 in May
2017 to USD 231 in July 2017, then fell as the spring wheat
harvest was projected larger than expected.
Unfavourable weather conditions and uncertainty about wheat
yields during the summer sharply increased the spread between
HRS wheat futures sold on the MGEX and the Hard Red Winter
(HRW) wheat futures sold on the Kansas City Board of Trade
(KCBT). In June and July 2017, the MGEX-KCBT spread was at
USD 94 per tonne, respectively USD 61 and USD 65 more than the
June 2016 and July 2016 periods. The spread recently narrowed,
though continued showing a higher than average HRS premium over
HRW wheat, amounting to USD 72.11 per tonne in October 2017.
Export prices of high quality wheat
Wheat futures
Wheat spreads
BOX 1: High quality wheat commands high premium
150
200
250
300
350
OctJulAprJanOctJulAprJan
USD per tonne
Australia APH, Newcastle (NSW)
2016 2017
US HRW (11.5%), GulfCanada 1 CRWS (13.5%), St Lawrence
US HRS (13.0%), Portland
Source: IGCArgentina (12.0%), Up RiverBlack Sea Milling EU (France) Grade 1, Rouen
100
150
200
250
300
OctJulAprJanOctJulAprJan
USD per tonne
Canada (ICE) CWRS2016 2017
US (CME) HRW US (MGE) HRS
US (CME) SRW
Source: IGC
0
20
40
60
80
100
OctJulAprJanOctJulAprJan
USD per tonne
MGEX- KCBT Spread
2016 2017
Source: MGEXContact:[email protected]
Ma
rke
t asse
ssme
nts

Ma
rke
t a
sse
ssm
en
ts
14 FOOD OUTLOOKNOVEMBER 2017
put the wheat production at around 14 million tonnes, down
7.5 percent from the previous year.
In Asia, with most of the crop harvested, a small
increase in the regional output is forecast in 2017.
Most of the increase concerns India, where a rise in the
Government’s procurement price and beneficial weather
instigated a significant expansion in plantings. As a
result, the country’s 2017 wheat output is estimated at
98.4 million tonnes, 6.6 percent higher than the previous
year. In Pakistan, a moderate production increase is
foreseen, with output reaching 26 million tonnes this year,
reflecting generally good weather and an expanded use
of fertilizer that helped to boost yields and more than
compensate for a contraction in sowings. In China, the
world’s largest wheat grower, production is forecast to
increase by 1 percent to 130 million tonnes, putting it at a
similar level to that of 2015.
In the Near East, wheat production in Turkey is
forecast to rise by 6 percent to 21.8 million tonnes on
account of well distributed rains, while production in
the Islamic Republic of Iran is anticipated to remain
almost unchanged relative to last year’s output. On-going
conflicts continue to constrain agricultural production
in Afghanistan, Iraq and the Syrian Arab Republic.
As a result, wheat output levels in all three countries are
expected to remain below average, although favourable
weather in Syria helped support a moderate yearly increase.
In North Africa, above-average and well distributed
rains in Morocco resulted in a sharp recovery in wheat
production in 2017, estimated at 7.1 million tonnes, more
than double the 2016 output, which was adversely affected
by dry weather. Similarly, Algeria registered a yearly
production gain, mostly reflecting a larger harvested area.
In the Southern Hemisphere, the production outlook for
Australia indicates a decline in the 2017 output, following
the previous year’s exceptionally high level. Preliminary
forecasts put the 2017 output at 21.6 million tonnes,
38 percent down on a yearly basis. Dryness during the winter
months is the main factor behind this year’s drop, with
yields expected at below-average levels, although a smaller
harvested area is also expected to contribute to the decline.
In South America, the aggregate 2017 wheat production
is forecast to fall by 6 percent. Most of this decline pertains
to an expected 18 percent reduction in Brazil’s wheat
output, forecast at 5.5 million tonnes. Containing a larger
decline at the regional level, Argentina’s output is forecast
at a well above average level of 19 million tonnes, resting on
a price-driven expansion in sowings that more than offset a
small decrease in yields.
Looking ahead, planting of the 2018 wheat crop is
underway across northern hemisphere countries. In the
United States, drier weather in some key growing states
had slowed the pace of sowings compared with the
previous year. Plantings are expected to continue until
the end of November. In the EU, preliminary indications
suggest that wheat sowings could rise in 2018, as earlier
expectations of an area expansion for alternative oilseed
crops dissipated due to unfavourable weather during
the planting period, which comes before winter wheat
sowings. In the Russian Federation and Ukraine, recent
beneficial rains helped to replenish soil moisture and
supported a quickening of winter wheat plantings, with
sowing progress up compared to the previous year.
TRADE
Wheat trade to remain below the 2016/17 record levelFAO’s forecast for world trade (including wheat flour in
wheat equivalent) in 2017/18 (July/June) has been raised
by 500 000 tonnes since October to 175.2 million tonnes,
which is still down 2 million tonnes, or 1.2 percent, from
the all-time high of 177.4 million tonnes in 2016/17. The
latest upward revision reflects small adjustments to the
projected imports by Nigeria and Mexico.
The forecast small contraction in world trade in 2017/18
is largely driven by expected lower imports by Asia, more
than offsetting higher imports anticipated in Europe and
North America.
In Asia, total wheat imports in 2017/18 are forecast
at 88.7 million tonnes, down 2.3 million tonnes, or
2.5 percent, from 2016/17 with the bulk of the decrease
expected in China and India. Wheat imports by China
are currently forecast to reach 3.2 million tonnes, some
Figure 3 . Wheat production in major CIS producers
0
20
40
60
80
100
20172016201520142013
Russian Fed. Ukraine Kazakhstan
million tonnes
estim. f’cast
15FOOD OUTLOOK NOVEMBER 2017
WH
EA
T
1 million tonnes less than in 2016/17. Large domestic
supplies, especially following this year’s record harvest,
are the reason for the lower projected wheat purchases
by China from abroad. Similarly, wheat imports by India
are seen to decline by 2 million tonnes in 2017/18, to
4 million tonnes, in view of this year’s bumper harvest.
Wheat purchases by Thailand are also forecast to
decrease, by some 800 000 tonnes to 3 million tonnes,
with the main reason being the Government’s decision
to restrict imports of feed wheat, effective since the
beginning of this year. By contrast, several countries
in Asia are likely to import more wheat in 2017/18, in
particular the Syrian Arab Republic, where the ongoing
conflict has greatly increased the country’s reliance on
imports, despite some increase in this year’s domestic
production level.
In Africa, aggregate wheat imports in 2017/18 are
projected at around 49 million tonnes, slightly lower than
the 2017/18 record level. Imports by Egypt, the world’s
largest wheat importer, are forecast at 12 million tonnes,
some 400 000 tones above the 2016/17 estimated level.
The small drop in this year’s production, increasing demand
and high domestic prices are among the main factors
behind the anticipated high level of imports by Egypt. As
of October, foreign wheat deliveries with a moisture level
of up to 13.5 percent will be allowed for a nine-month
period; previously, the permissible moisture level was set at
13 percent. However, as in 2016/17, uncertainties remain
as to the eventual size of Egypt’s import purchases, due
to the changing policies. Higher wheat imports are also
forecast for South Africa, primarily because of the decline
in domestic production but also because of strong demand
which induced the Government to lower the import tariff
by 60 percent as of early October. The new tariff is the
lowest since February 2015. By contrast, wheat imports
by Morocco are set to decrease by 1 million tonnes, or
18 percent, to 4.5 million tonnes, as a result of a recovery
in domestic production this year.
In Latin America and the Caribbean, imports in
2017/18 are forecast to change little in most countries.
Smaller purchases are anticipated for Bolivia and Brazil.
Higher domestic wheat production is seen to result in a
nearly 44 percent drop in wheat imports by Bolivia, to
360 000 tonnes. In Brazil, large domestic supplies, due
to high carryover stocks from the previous season, could
result in imports declining by 260 000 tonnes to stand at
7.5 million tonnes. By contrast, wheat imports by Mexico
are anticipated to exceed the previous season’s level
by 300 000 tonnes to reach 5.3 million tonnes. Lower
production and strong demand are the main factors behind
this anticipated increase.
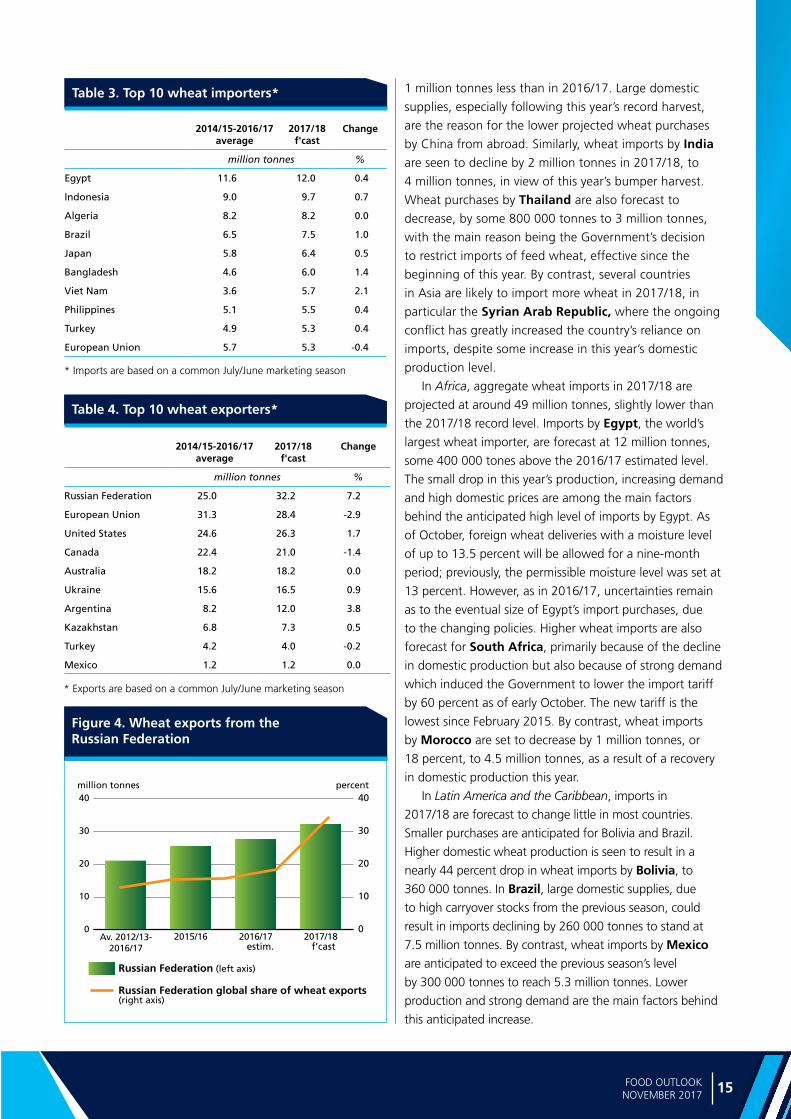
Figure 4. Wheat exports from the Russian Federation
0
10
20
30
40
2017/182016/172015/160
10
20
30
40
Av. 2012/13-2016/17
million tonnes percent
Russian Federation (left axis)
estim. f’cast
Russian Federation global share of wheat exports(right axis)
Table 3. Top 10 wheat importers*
2014/15-2016/17 average
2017/18f'cast
Change
million tonnes %
Egypt 11.6 12.0 0.4
Indonesia 9.0 9.7 0.7
Algeria 8.2 8.2 0.0
Brazil 6.5 7.5 1.0
Japan 5.8 6.4 0.5
Bangladesh 4.6 6.0 1.4
Viet Nam 3.6 5.7 2.1
Philippines 5.1 5.5 0.4
Turkey 4.9 5.3 0.4
European Union 5.7 5.3 -0.4
* Imports are based on a common July/June marketing season
Table 4. Top 10 wheat exporters*
2014/15-2016/17 average
2017/18f'cast
Change
million tonnes %
Russian Federation 25.0 32.2 7.2
European Union 31.3 28.4 -2.9
United States 24.6 26.3 1.7
Canada 22.4 21.0 -1.4
Australia 18.2 18.2 0.0
Ukraine 15.6 16.5 0.9
Argentina 8.2 12.0 3.8
Kazakhstan 6.8 7.3 0.5
Turkey 4.2 4.0 -0.2
Mexico 1.2 1.2 0.0
* Exports are based on a common July/June marketing season
Ma
rke
t a
sse
ssm
en
ts
16 FOOD OUTLOOKNOVEMBER 2017
In Europe, aggregate wheat imports in 2017/18 are
forecast to reach 7.7 million tonnes, up 460 000 tonnes
from the 2016/17 estimate, with most of the increase
in the EU. Total wheat imports by the EU are forecast at
5.3 million tonnes, slightly higher than in 2016/17, despite
this year’s sharp recovery in production. Strong demand for
durum wheat is the main reason behind the expectation for
higher imports.
In North America, tight domestic supplies of premium
wheat in the United States are likely to drive up imports to
4.1 million tonnes, 800 000 tonnes more than in 2016/17
and the highest level since 2013/14.
Regarding exports, overall supplies of wheat in 2017/18
should be more than adequate to meet the global import
demand. Aggregate wheat exports by the major exporting
countries3 in 2017/18 (July/June) are forecast to amount to
just under 162 million tonnes, some 1.5 million tonnes less
than in 2016/17.
Among the major exporters, competition for markets
is expected to remain stiff, as has been the case over the
past few seasons. Large supplies from the Black Sea region,
in particular from the Russian Federation following this
year’s bumper crop, are expected to further intensify this
competition for market shares. Wheat shipments from
the Russian Federation are forecast to increase to at least
32 million tonnes, 17 percent above the 2016/17 level and
an all-time high, which places the country as the world’s
largest wheat exporter. The increase in exports from the
Russian Federation will more than offset reduced sales by
Ukraine and Kazakhstan, the other two regional players.
Exports from the EU are also set to increase, by around
9 percent to just over 28 million tonnes. This year’s strong
recovery in production and more favourable exchange
rate are seen to boost sales from the EU, although the
overall shipments would remain well below the record
34 million tonnes attained in 2014/15. While Canada
is seen to export 21 million tonnes of wheat, slightly
more than last season, wheat sales by Argentina are
pegged at 12 million tonnes, nearly unchanged from the
previous year’s high level. By contrast, shipments from the
United States are forecast to fall, by almost 11 percent,
to around 26 million tonnes. Reduced domestic production
and a stronger US dollar are expected to weigh on sales
by the United States this season, although demand for the
United States’ high protein wheat is expected to continue
unabated (see Box 2).
3 Major exporters of wheat include Argentina, Australia, Canada, EU, Kazakhstan, Russian Fed., Ukraine and the United States.
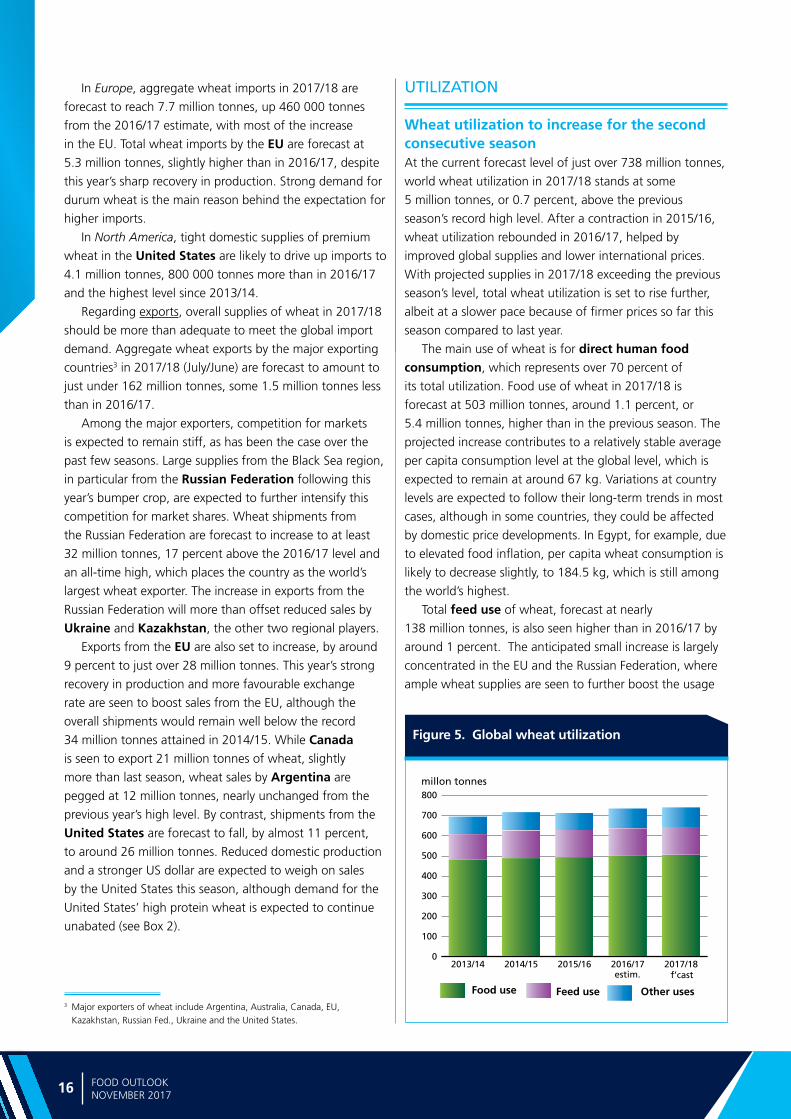
UTILIZATION
Wheat utilization to increase for the second consecutive seasonAt the current forecast level of just over 738 million tonnes,
world wheat utilization in 2017/18 stands at some
5 million tonnes, or 0.7 percent, above the previous
season’s record high level. After a contraction in 2015/16,
wheat utilization rebounded in 2016/17, helped by
improved global supplies and lower international prices.
With projected supplies in 2017/18 exceeding the previous
season’s level, total wheat utilization is set to rise further,
albeit at a slower pace because of firmer prices so far this
season compared to last year.
The main use of wheat is for direct human food consumption, which represents over 70 percent of
its total utilization. Food use of wheat in 2017/18 is
forecast at 503 million tonnes, around 1.1 percent, or
5.4 million tonnes, higher than in the previous season. The
projected increase contributes to a relatively stable average
per capita consumption level at the global level, which is
expected to remain at around 67 kg. Variations at country
levels are expected to follow their long-term trends in most
cases, although in some countries, they could be affected
by domestic price developments. In Egypt, for example, due
to elevated food inflation, per capita wheat consumption is
likely to decrease slightly, to 184.5 kg, which is still among
the world’s highest.
Total feed use of wheat, forecast at nearly
138 million tonnes, is also seen higher than in 2016/17 by
around 1 percent. The anticipated small increase is largely
concentrated in the EU and the Russian Federation, where
ample wheat supplies are seen to further boost the usage
Figure 5. Global wheat utilization
0
100
200
300
400
500
600
700
800
2017/182016/172015/162014/152013/14
millon tonnes
Food use Feed use Other uses
estim. f’cast

17FOOD OUTLOOK NOVEMBER 2017
WH
EA
T
of wheat for animal feed, more than offsetting anticipated
reductions in Canada and the United States, where supplies
are expected to be reduced because of lower production.
By contrast, total other uses of wheat (which includes
industrial use, seeds and post-harvest losses) is set to
remain close to the previous season’s level, at around
97 million tonnes. Based on derived estimates from recent
reports of the International Grains Council, total wheat
used for industrial production in 2017/18 could reach
23 million tonnes, just slightly higher than in 2016/17. Starch
manufacturing, which represents the primary industrial use
of wheat, is forecast to hover around 12 million tonnes,
marginally above the 2016/17 estimated level. Total wheat
use for the production of biofuels (excluding non-fuel uses) is
also seen to remain stable, at just below 9 million tonnes.
STOCKS
Wheat inventories to increase further, boosted by large supplies in ChinaGlobal wheat stocks are forecast to reach
258 million tonnes by the close of seasons in 2018, an all-
time high and 13 million tonnes, or 5 percent, above their
opening levels. However, this forecast is 3 million tonnes
below the previous FAO forecast published in October, with
most of the downward revision in the Russian Federation.
World wheat inventories have increased continuously
since 2013/14, as growth in global production has
exceeded expansion in total world utilization. Based on
the current prospects, the world wheat stock-to-use ratio in 2017/18 would reach a high of 34.4 percent,
up slightly from the previous season. However, the ratio of major wheat exporters’ closing stocks to their total disappearance (defined as domestic utilization
plus exports), which is considered to be a better measure
of availability in global markets, is set to decrease to
17.4 percent in 2017/18 from 18.7 percent in 2016/17.
This slight decrease reflects a cut in the total end-season
inventory level held by the major exporting countries
to 70 million tonnes, down 5 million tonnes from
their opening levels. Most of the decline is expected
in Australia, Canada and the United States, due to
reduced production levels, and in the EU, reflecting
higher utilization and exports. By contrast, following this
year’s record output in the Russian Federation, the
country’s end-season wheat inventories are set to reach
15 million tonnes, up 5 million tonnes from their revised
opening levels but 2.6 million tonnes below the October
forecast, mostly on account of an expected increase in
domestic use.
Figure 6. Wheat stocks and ratios
0
80
160
240
320
2017/182016/172015/162014/152013/140
10
20
30
40million tonnes percent
Major Exporters
Rest of the World
China
World Stock-to-use ratioStock-to-disappearance ratio of major exporters
estim. f’cast
Overall, the bulk of this season’s projected expansion
in world wheat reserves is expected to take place in
China, where wheat inventories are forecast to increase
by at least 18 million tonnes, or 20 percent, to around
110 million tonnes. After a decade of relative stability in the
level of wheat stocks in China, within the range of 50 to
55 million tonnes, inventories started to rise sharply from
2015/16, boosted by the increase in domestic production.
At the current forecast level, wheat stocks held in China
would represent some 43 percent of the world total.
18 FOOD OUTLOOKNOVEMBER 2017
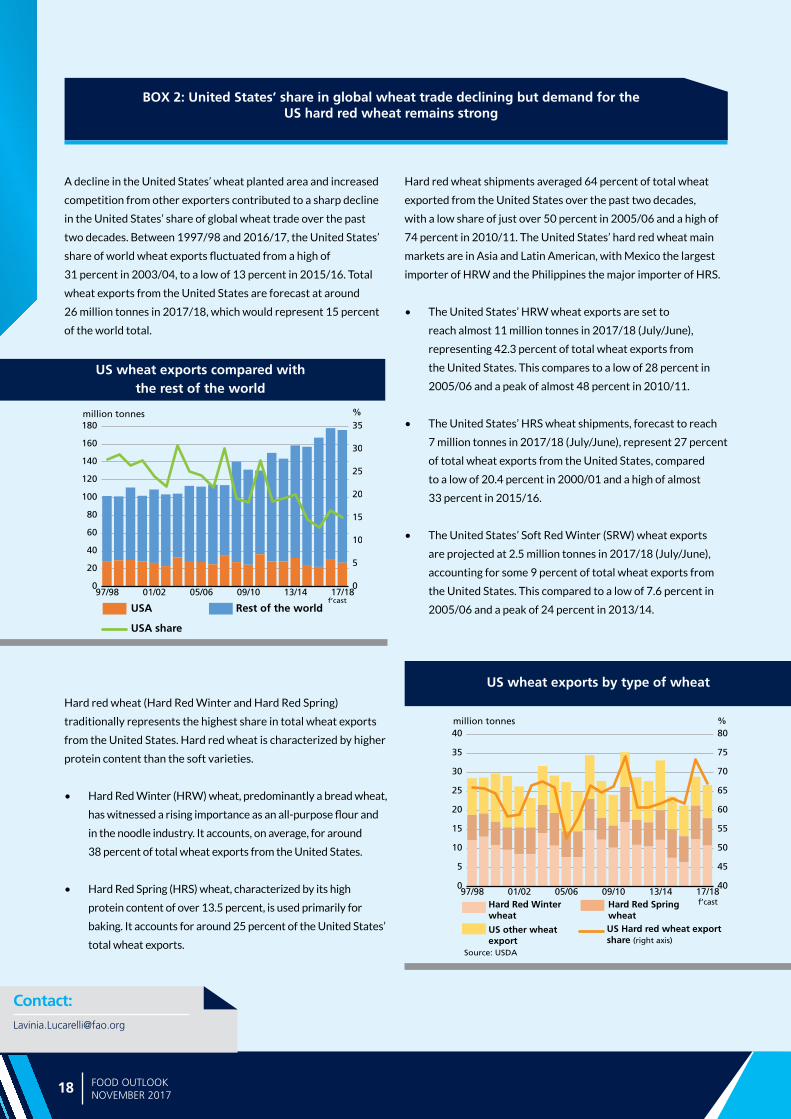
A decline in the United States’ wheat planted area and increased
competition from other exporters contributed to a sharp decline
in the United States’ share of global wheat trade over the past
two decades. Between 1997/98 and 2016/17, the United States’
share of world wheat exports fluctuated from a high of
31 percent in 2003/04, to a low of 13 percent in 2015/16. Total
wheat exports from the United States are forecast at around
26 million tonnes in 2017/18, which would represent 15 percent
of the world total.
US wheat exports compared with the rest of the world
US wheat exports by type of wheat
0
20
40
60
80
100
120
140
160
180
0
5
10
15
20
25
30
35
17/1813/1409/1005/0601/0297/98
million tonnes %
f’castUSA
USA share
Rest of the world
0
5
10
15
20
25
30
35
40
40
45
50
55
60
65
70
75
80
17/1813/1409/1005/0601/0297/98
million tonnes %
f’castHard Red Winter wheat
US Hard red wheat export share (right axis)
Hard Red Spring wheat
US other wheat export
Source: USDA
BOX 2: United States’ share in global wheat trade declining but demand for the US hard red wheat remains strong
Hard red wheat (Hard Red Winter and Hard Red Spring)
traditionally represents the highest share in total wheat exports
from the United States. Hard red wheat is characterized by higher
protein content than the soft varieties.
• Hard Red Winter (HRW) wheat, predominantly a bread wheat,
has witnessed a rising importance as an all-purpose flour and
in the noodle industry. It accounts, on average, for around
38 percent of total wheat exports from the United States.
• Hard Red Spring (HRS) wheat, characterized by its high
protein content of over 13.5 percent, is used primarily for
baking. It accounts for around 25 percent of the United States’
total wheat exports.
Hard red wheat shipments averaged 64 percent of total wheat
exported from the United States over the past two decades,
with a low share of just over 50 percent in 2005/06 and a high of
74 percent in 2010/11. The United States’ hard red wheat main
markets are in Asia and Latin American, with Mexico the largest
importer of HRW and the Philippines the major importer of HRS.
• The United States’ HRW wheat exports are set to
reach almost 11 million tonnes in 2017/18 (July/June),
representing 42.3 percent of total wheat exports from
the United States. This compares to a low of 28 percent in
2005/06 and a peak of almost 48 percent in 2010/11.
• The United States’ HRS wheat shipments, forecast to reach
7 million tonnes in 2017/18 (July/June), represent 27 percent
of total wheat exports from the United States, compared
to a low of 20.4 percent in 2000/01 and a high of almost
33 percent in 2015/16.
• The United States’ Soft Red Winter (SRW) wheat exports
are projected at 2.5 million tonnes in 2017/18 (July/June),
accounting for some 9 percent of total wheat exports from
the United States. This compared to a low of 7.6 percent in
2005/06 and a peak of 24 percent in 2013/14.
Contact:[email protected]
Ma
rke
t a
sse
ssm
en
ts

US wheat exports by type of wheat
Ma
rke
t a
sse
ssm
en
ts
20 FOOD OUTLOOKNOVEMBER 2017
Figure 2. CBOT maize December futuresFigure 1. Maize export price (US No. 2 yellow, Gulf)
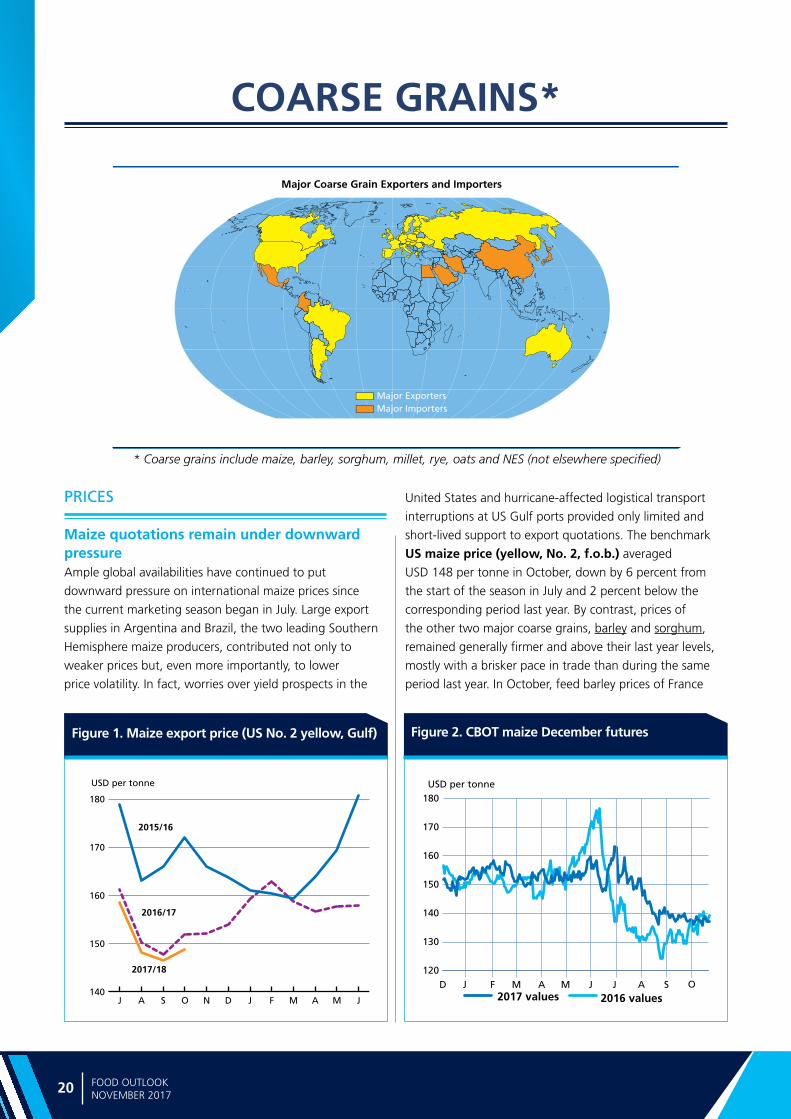
Major Coarse Grain Exporters and Importers
Major ExportersMajor Importers
COARSE GRAINS*
* Coarse grains include maize, barley, sorghum, millet, rye, oats and NES (not elsewhere specified)
PRICES
Maize quotations remain under downward pressureAmple global availabilities have continued to put
downward pressure on international maize prices since
the current marketing season began in July. Large export
supplies in Argentina and Brazil, the two leading Southern
Hemisphere maize producers, contributed not only to
weaker prices but, even more importantly, to lower
price volatility. In fact, worries over yield prospects in the
United States and hurricane-affected logistical transport
interruptions at US Gulf ports provided only limited and
short-lived support to export quotations. The benchmark
US maize price (yellow, No. 2, f.o.b.) averaged
USD 148 per tonne in October, down by 6 percent from
the start of the season in July and 2 percent below the
corresponding period last year. By contrast, prices of
the other two major coarse grains, barley and sorghum,
remained generally firmer and above their last year levels,
mostly with a brisker pace in trade than during the same
period last year. In October, feed barley prices of France
140
150
160
170
180
2016/17
2017/18
2015/16
USD per tonne
JMAMFJDNOSAJ
120
130
140
150
160
170
180USD per tonne
S OD J F M A M2017 values 2016 values
J J A

21FOOD OUTLOOK NOVEMBER 2017
CO
AR
SE G
RA
INS
Figure 3. Maize production in Southern Africa - leading producers
and the Black Sea origins averaged some 20 percent above
October 2016, while sorghum quotations (US Gulf) were up
10 percent from last year.
Turning to the futures markets, the CBOT maize futures for delivery in December 2017, the benchmark delivery
month for the new US crop, averaged USD 138 per tonne
in October, down 10 percent from the start of the season
but almost at par with the same period last year. Large
world supplies and the favourable weather over the summer
period which improved yield prospects, especially in the
United States, contributed to a sharp decline in maize futures
from their one-year high at the beginning of the season.
Stiffer competition among the major exporters also limited
the upside. More detailed analysis of the futures markets can
be found in the Market Indicators section of this report.
PRODUCTION
Global production of coarse grains to reach a record in 2017 FAO forecasts global coarse grains production in 2017
to reach 1359.7 million tonnes, 13.4 million tonnes, or
1.0 percent, higher than the previous year marking a
new record high. The annual growth is mainly driven by
strong recoveries in maize production in Southern Africa
and South America that more than outweighed a large
production cut in the United States.
Global maize production in 2017 is forecast at
1 063.6 million tonnes, 22.9 million tonnes, or 2.2 percent,
higher than the previous year.
In the United States, improved weather conditions in
the latter part of the season resulted in higher than expected
yields, triggering an upward revision of the production
forecast that now stands at 362.7 million tonnes, although
still 6 percent down from the previous year. The yearly
decrease stems from a contraction in plantings that more
than offset the positive impact of above-average yields. In
Canada, in contrast to a subdued early-season production
outlook, the latest estimate puts the 2017 output at a record
high of 13.6 million tonnes, reflecting above-average yields
and a larger planted area.
In Europe, drier weather in southern parts of the EU
dampened yields prospects and in combination with a
decrease in overall plantings, maize production in 2017 is
forecast to fall by 2 percent to 60 million tonnes. Similarly,
yields are estimated to fall in Ukraine, pushing this year’s maize output to 26.7 million tonnes, down 5 percent from
2016. In the Russian Federation, the maize output is also
forecast to decline by 9 percent from the record high of
2016 to 14 million tonnes. Dry weather conditions in the
summer and excessive rainfall during the harvest period are
the main factors driving the decrease.
In Asia, aggregate production in 2017 is forecast
to fall. Most of this decline is associated with China,
where a lower maize procurement price established by
the government triggered a contraction in plantings
and resulted in an output of 212.5 million tonnes,
down 3 percent from 2016. Elsewhere in Asia, maize
production in 2017 is expected to remain close to the
previous year’s levels, except in Indonesia, where robust
demand from the domestic feed industry spurred an
expansion in plantings, causing production to increase
by 1.5 million tonnes to reach an overall level of
21.5 million tonnes.
In the Southern Hemisphere, harvesting of the bulk of
the 2017 crop is complete.
In South America, production in Brazil is estimated at
99.4 million tonnes, 57 percent above the drought-reduced
output of 2016 and a record high. The sharp rebound is
driven by higher yields for both the first and second season
crops, and a larger planted area. Argentina also registered
a record output of 49.5 million tonnes. An expansion in the
sown area, instigated by high prices and by good weather,
which also helped boost yields, has driven this year’s
increase.
In Southern Africa, good weather raised yield levels
above previous year’s levels, and higher prices encouraged
an increase in plantings in South Africa, supporting a
record output of 17.5 million tonnes, more than double the
drought-affected production of 2016. Similarly, favourable
weather conditions in the neighbouring countries of
Malawi, Zambia and Zimbabwe resulted in strong
production rebounds this year.
0
4
8
12
16
20
20172016201520142013
million tonnes
estim. f’castSouth Africa Malawi
Zambia Others
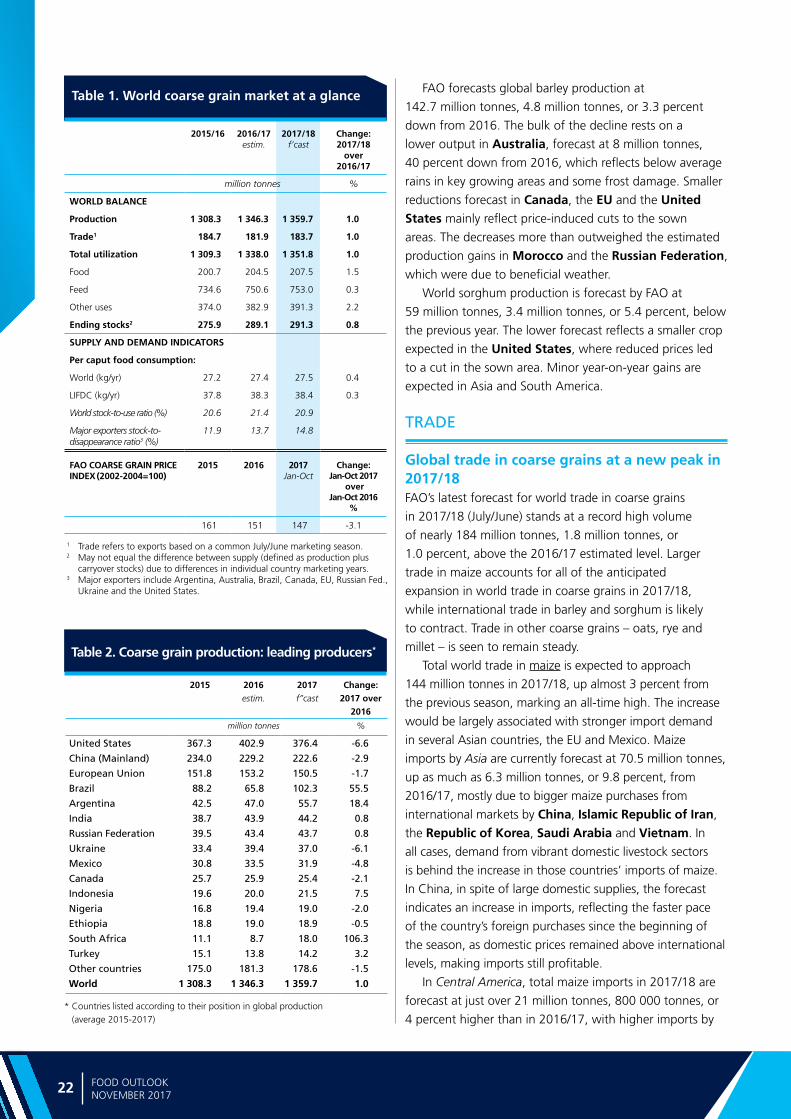
Ma
rke
t a
sse
ssm
en
ts
22 FOOD OUTLOOKNOVEMBER 2017
Table 1. World coarse grain market at a glance
Table 2. Coarse grain production: leading producers*
* Countries listed according to their position in global production (average 2015-2017)
2015 2016 estim.
2017f”cast
Change:2017 over
2016
million tonnes %
United States 367.3 402.9 376.4 -6.6
China (Mainland) 234.0 229.2 222.6 -2.9
European Union 151.8 153.2 150.5 -1.7
Brazil 88.2 65.8 102.3 55.5
Argentina 42.5 47.0 55.7 18.4
India 38.7 43.9 44.2 0.8
Russian Federation 39.5 43.4 43.7 0.8
Ukraine 33.4 39.4 37.0 -6.1
Mexico 30.8 33.5 31.9 -4.8
Canada 25.7 25.9 25.4 -2.1
Indonesia 19.6 20.0 21.5 7.5
Nigeria 16.8 19.4 19.0 -2.0
Ethiopia 18.8 19.0 18.9 -0.5
South Africa 11.1 8.7 18.0 106.3
Turkey 15.1 13.8 14.2 3.2
Other countries 175.0 181.3 178.6 -1.5
World 1 308.3 1 346.3 1 359.7 1.0
1 Trade refers to exports based on a common July/June marketing season.2 May not equal the difference between supply (defined as production plus
carryover stocks) due to differences in individual country marketing years.3 Major exporters include Argentina, Australia, Brazil, Canada, EU, Russian Fed.,
Ukraine and the United States.
2015/16 2016/17 estim.
2017/18 f’cast
Change: 2017/18
over 2016/17
million tonnes %
WORLD BALANCE
Production 1 308.3 1 346.3 1 359.7 1.0
Trade1 184.7 181.9 183.7 1.0
Total utilization 1 309.3 1 338.0 1 351.8 1.0
Food 200.7 204.5 207.5 1.5
Feed 734.6 750.6 753.0 0.3
Other uses 374.0 382.9 391.3 2.2
Ending stocks2 275.9 289.1 291.3 0.8
SUPPLY AND DEMAND INDICATORS
Per caput food consumption:
World (kg/yr) 27.2 27.4 27.5 0.4
LIFDC (kg/yr) 37.8 38.3 38.4 0.3
World stock-to-use ratio (%) 20.6 21.4 20.9
Major exporters stock-to-disappearance ratio3 (%)
11.9 13.7 14.8
FAO COARSE GRAIN PRICE INDEX (2002-2004=100)
2015 2016 2017 Jan-Oct
Change: Jan-Oct 2017
over Jan-Oct 2016
%
161 151 147 -3.1
FAO forecasts global barley production at
142.7 million tonnes, 4.8 million tonnes, or 3.3 percent
down from 2016. The bulk of the decline rests on a
lower output in Australia, forecast at 8 million tonnes,
40 percent down from 2016, which reflects below average
rains in key growing areas and some frost damage. Smaller
reductions forecast in Canada, the EU and the United States mainly reflect price-induced cuts to the sown
areas. The decreases more than outweighed the estimated
production gains in Morocco and the Russian Federation,
which were due to beneficial weather.
World sorghum production is forecast by FAO at
59 million tonnes, 3.4 million tonnes, or 5.4 percent, below
the previous year. The lower forecast reflects a smaller crop
expected in the United States, where reduced prices led
to a cut in the sown area. Minor year-on-year gains are
expected in Asia and South America.
TRADE
Global trade in coarse grains at a new peak in 2017/18FAO’s latest forecast for world trade in coarse grains
in 2017/18 (July/June) stands at a record high volume
of nearly 184 million tonnes, 1.8 million tonnes, or
1.0 percent, above the 2016/17 estimated level. Larger
trade in maize accounts for all of the anticipated
expansion in world trade in coarse grains in 2017/18,
while international trade in barley and sorghum is likely
to contract. Trade in other coarse grains – oats, rye and
millet – is seen to remain steady.
Total world trade in maize is expected to approach
144 million tonnes in 2017/18, up almost 3 percent from
the previous season, marking an all-time high. The increase
would be largely associated with stronger import demand
in several Asian countries, the EU and Mexico. Maize
imports by Asia are currently forecast at 70.5 million tonnes,
up as much as 6.3 million tonnes, or 9.8 percent, from
2016/17, mostly due to bigger maize purchases from
international markets by China, Islamic Republic of Iran,
the Republic of Korea, Saudi Arabia and Vietnam. In
all cases, demand from vibrant domestic livestock sectors
is behind the increase in those countries’ imports of maize.
In China, in spite of large domestic supplies, the forecast
indicates an increase in imports, reflecting the faster pace
of the country’s foreign purchases since the beginning of
the season, as domestic prices remained above international
levels, making imports still profitable.
In Central America, total maize imports in 2017/18 are
forecast at just over 21 million tonnes, 800 000 tonnes, or
4 percent higher than in 2016/17, with higher imports by
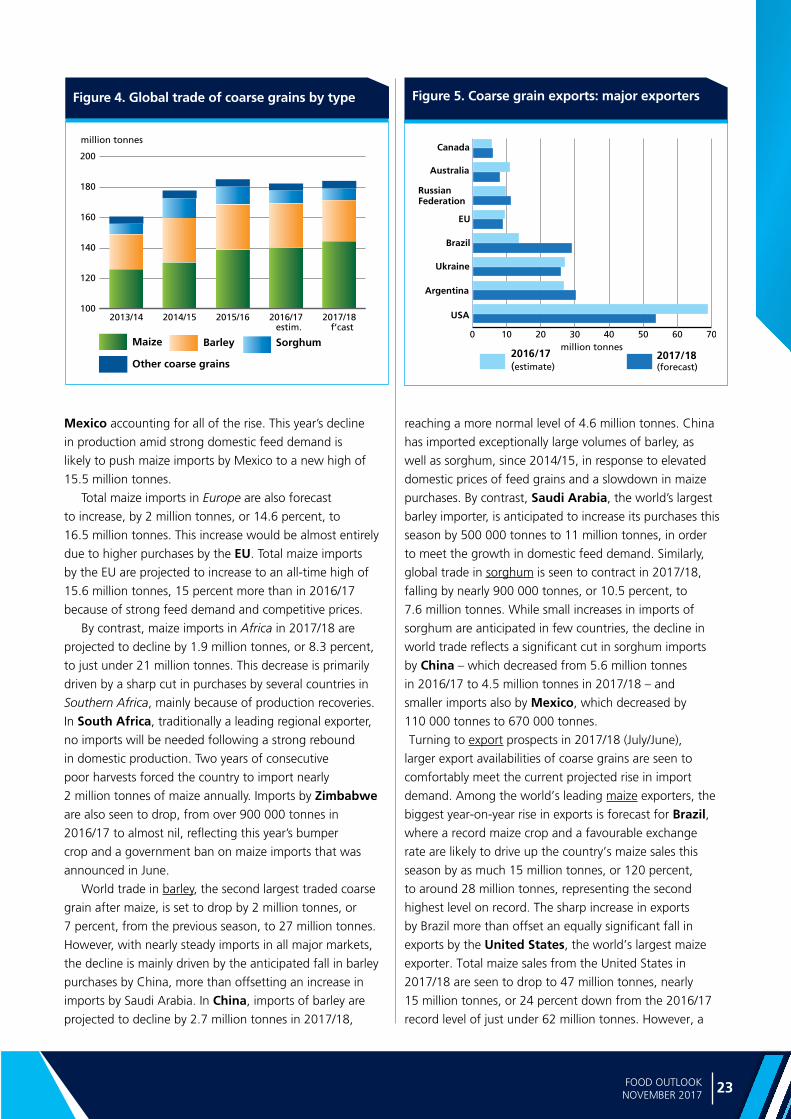
23FOOD OUTLOOK NOVEMBER 2017
CO
AR
SE G
RA
INS
Mexico accounting for all of the rise. This year’s decline
in production amid strong domestic feed demand is
likely to push maize imports by Mexico to a new high of
15.5 million tonnes.
Total maize imports in Europe are also forecast
to increase, by 2 million tonnes, or 14.6 percent, to
16.5 million tonnes. This increase would be almost entirely
due to higher purchases by the EU. Total maize imports
by the EU are projected to increase to an all-time high of
15.6 million tonnes, 15 percent more than in 2016/17
because of strong feed demand and competitive prices.
By contrast, maize imports in Africa in 2017/18 are
projected to decline by 1.9 million tonnes, or 8.3 percent,
to just under 21 million tonnes. This decrease is primarily
driven by a sharp cut in purchases by several countries in
Southern Africa, mainly because of production recoveries.
In South Africa, traditionally a leading regional exporter,
no imports will be needed following a strong rebound
in domestic production. Two years of consecutive
poor harvests forced the country to import nearly
2 million tonnes of maize annually. Imports by Zimbabwe
are also seen to drop, from over 900 000 tonnes in
2016/17 to almost nil, reflecting this year’s bumper
crop and a government ban on maize imports that was
announced in June.
World trade in barley, the second largest traded coarse
grain after maize, is set to drop by 2 million tonnes, or
7 percent, from the previous season, to 27 million tonnes.
However, with nearly steady imports in all major markets,
the decline is mainly driven by the anticipated fall in barley
purchases by China, more than offsetting an increase in
imports by Saudi Arabia. In China, imports of barley are
projected to decline by 2.7 million tonnes in 2017/18,
reaching a more normal level of 4.6 million tonnes. China
has imported exceptionally large volumes of barley, as
well as sorghum, since 2014/15, in response to elevated
domestic prices of feed grains and a slowdown in maize
purchases. By contrast, Saudi Arabia, the world’s largest
barley importer, is anticipated to increase its purchases this
season by 500 000 tonnes to 11 million tonnes, in order
to meet the growth in domestic feed demand. Similarly,
global trade in sorghum is seen to contract in 2017/18,
falling by nearly 900 000 tonnes, or 10.5 percent, to
7.6 million tonnes. While small increases in imports of
sorghum are anticipated in few countries, the decline in
world trade reflects a significant cut in sorghum imports
by China – which decreased from 5.6 million tonnes
in 2016/17 to 4.5 million tonnes in 2017/18 – and
smaller imports also by Mexico, which decreased by
110 000 tonnes to 670 000 tonnes.
Turning to export prospects in 2017/18 (July/June),
larger export availabilities of coarse grains are seen to
comfortably meet the current projected rise in import
demand. Among the world’s leading maize exporters, the
biggest year-on-year rise in exports is forecast for Brazil, where a record maize crop and a favourable exchange
rate are likely to drive up the country’s maize sales this
season by as much 15 million tonnes, or 120 percent,
to around 28 million tonnes, representing the second
highest level on record. The sharp increase in exports
by Brazil more than offset an equally significant fall in
exports by the United States, the world’s largest maize
exporter. Total maize sales from the United States in
2017/18 are seen to drop to 47 million tonnes, nearly
15 million tonnes, or 24 percent down from the 2016/17
record level of just under 62 million tonnes. However, a
Figure 4. Global trade of coarse grains by type
100
120
140
160
180
200
2017/182016/172015/162014/152013/14
million tonnes
Maize SorghumBarleyestim. f’cast
Other coarse grains
Figure 5. Coarse grain exports: major exporters
0 10 20 30 40 50 60 70
2016/17 (estimate)
2017/18 (forecast)
million tonnes
USA
EU
Canada
Brazil
Ukraine
Argentina
Australia
RussianFederation
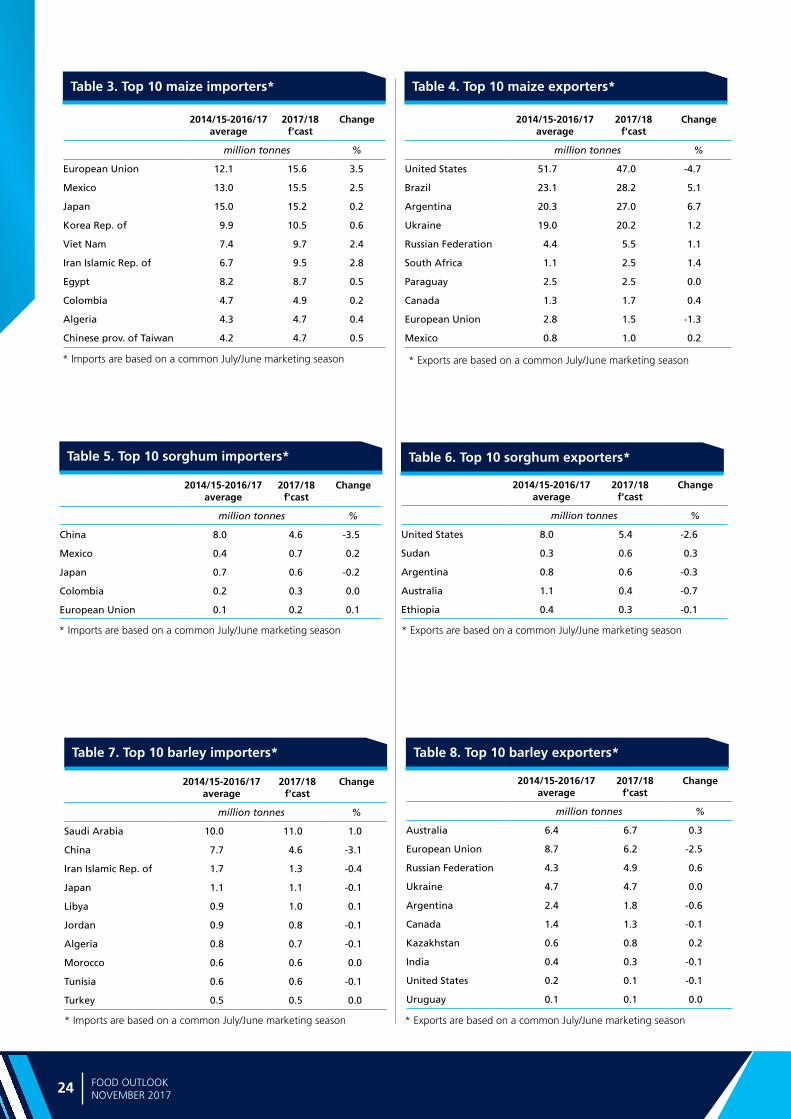
Ma
rke
t a
sse
ssm
en
ts
24 FOOD OUTLOOKNOVEMBER 2017
Table 3. Top 10 maize importers*
2014/15-2016/17 average
2017/18f'cast
Change
million tonnes %
European Union 12.1 15.6 3.5
Mexico 13.0 15.5 2.5
Japan 15.0 15.2 0.2
Korea Rep. of 9.9 10.5 0.6
Viet Nam 7.4 9.7 2.4
Iran Islamic Rep. of 6.7 9.5 2.8
Egypt 8.2 8.7 0.5
Colombia 4.7 4.9 0.2
Algeria 4.3 4.7 0.4
Chinese prov. of Taiwan 4.2 4.7 0.5
* Imports are based on a common July/June marketing season
Table 4. Top 10 maize exporters*
2014/15-2016/17 average
2017/18f'cast
Change
million tonnes %
United States 51.7 47.0 -4.7
Brazil 23.1 28.2 5.1
Argentina 20.3 27.0 6.7
Ukraine 19.0 20.2 1.2
Russian Federation 4.4 5.5 1.1
South Africa 1.1 2.5 1.4
Paraguay 2.5 2.5 0.0
Canada 1.3 1.7 0.4
European Union 2.8 1.5 -1.3
Mexico 0.8 1.0 0.2
* Exports are based on a common July/June marketing season
Table 5. Top 10 sorghum importers*
2014/15-2016/17 average
2017/18f'cast
Change
million tonnes %
China 8.0 4.6 -3.5
Mexico 0.4 0.7 0.2
Japan 0.7 0.6 -0.2
Colombia 0.2 0.3 0.0
European Union 0.1 0.2 0.1
* Imports are based on a common July/June marketing season
Table 6. Top 10 sorghum exporters*
2014/15-2016/17 average
2017/18f'cast
Change
million tonnes %
United States 8.0 5.4 -2.6
Sudan 0.3 0.6 0.3
Argentina 0.8 0.6 -0.3
Australia 1.1 0.4 -0.7
Ethiopia 0.4 0.3 -0.1
* Exports are based on a common July/June marketing season
Table 7. Top 10 barley importers*
2014/15-2016/17 average
2017/18f'cast
Change
million tonnes %
Saudi Arabia 10.0 11.0 1.0
China 7.7 4.6 -3.1
Iran Islamic Rep. of 1.7 1.3 -0.4
Japan 1.1 1.1 -0.1
Libya 0.9 1.0 0.1
Jordan 0.9 0.8 -0.1
Algeria 0.8 0.7 -0.1
Morocco 0.6 0.6 0.0
Tunisia 0.6 0.6 -0.1
Turkey 0.5 0.5 0.0
* Imports are based on a common July/June marketing season
Table 8. Top 10 barley exporters*
2014/15-2016/17 average
2017/18f'cast
Change
million tonnes %
Australia 6.4 6.7 0.3
European Union 8.7 6.2 -2.5
Russian Federation 4.3 4.9 0.6
Ukraine 4.7 4.7 0.0
Argentina 2.4 1.8 -0.6
Canada 1.4 1.3 -0.1
Kazakhstan 0.6 0.8 0.2
India 0.4 0.3 -0.1
United States 0.2 0.1 -0.1
Uruguay 0.1 0.1 0.0
* Exports are based on a common July/June marketing season
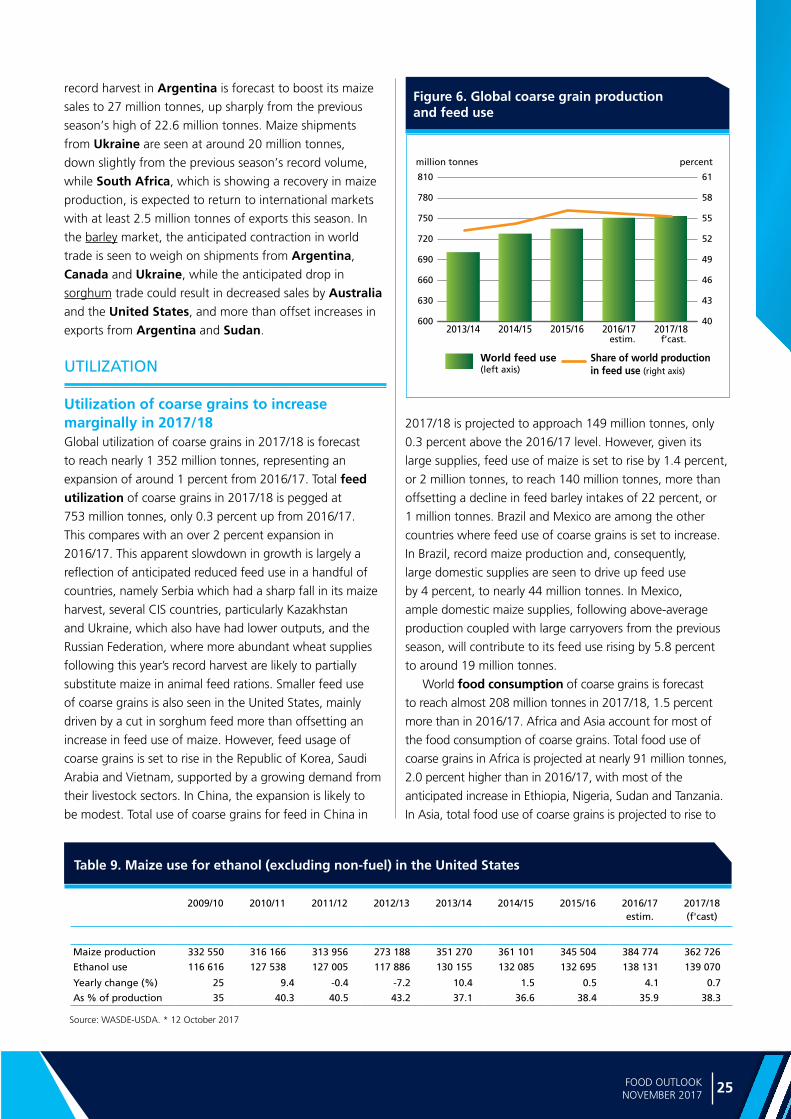
25FOOD OUTLOOK NOVEMBER 2017
CO
AR
SE G
RA
INS
record harvest in Argentina is forecast to boost its maize
sales to 27 million tonnes, up sharply from the previous
season’s high of 22.6 million tonnes. Maize shipments
from Ukraine are seen at around 20 million tonnes,
down slightly from the previous season’s record volume,
while South Africa, which is showing a recovery in maize
production, is expected to return to international markets
with at least 2.5 million tonnes of exports this season. In
the barley market, the anticipated contraction in world
trade is seen to weigh on shipments from Argentina,
Canada and Ukraine, while the anticipated drop in
sorghum trade could result in decreased sales by Australia
and the United States, and more than offset increases in
exports from Argentina and Sudan.
UTILIZATION
Utilization of coarse grains to increase marginally in 2017/18 Global utilization of coarse grains in 2017/18 is forecast
to reach nearly 1 352 million tonnes, representing an
expansion of around 1 percent from 2016/17. Total feed utilization of coarse grains in 2017/18 is pegged at
753 million tonnes, only 0.3 percent up from 2016/17.
This compares with an over 2 percent expansion in
2016/17. This apparent slowdown in growth is largely a
reflection of anticipated reduced feed use in a handful of
countries, namely Serbia which had a sharp fall in its maize
harvest, several CIS countries, particularly Kazakhstan
and Ukraine, which also have had lower outputs, and the
Russian Federation, where more abundant wheat supplies
following this year’s record harvest are likely to partially
substitute maize in animal feed rations. Smaller feed use
of coarse grains is also seen in the United States, mainly
driven by a cut in sorghum feed more than offsetting an
increase in feed use of maize. However, feed usage of
coarse grains is set to rise in the Republic of Korea, Saudi
Arabia and Vietnam, supported by a growing demand from
their livestock sectors. In China, the expansion is likely to
be modest. Total use of coarse grains for feed in China in
2017/18 is projected to approach 149 million tonnes, only
0.3 percent above the 2016/17 level. However, given its
large supplies, feed use of maize is set to rise by 1.4 percent,
or 2 million tonnes, to reach 140 million tonnes, more than
offsetting a decline in feed barley intakes of 22 percent, or
1 million tonnes. Brazil and Mexico are among the other
countries where feed use of coarse grains is set to increase.
In Brazil, record maize production and, consequently,
large domestic supplies are seen to drive up feed use
by 4 percent, to nearly 44 million tonnes. In Mexico,
ample domestic maize supplies, following above-average
production coupled with large carryovers from the previous
season, will contribute to its feed use rising by 5.8 percent
to around 19 million tonnes.
World food consumption of coarse grains is forecast
to reach almost 208 million tonnes in 2017/18, 1.5 percent
more than in 2016/17. Africa and Asia account for most of
the food consumption of coarse grains. Total food use of
coarse grains in Africa is projected at nearly 91 million tonnes,
2.0 percent higher than in 2016/17, with most of the
anticipated increase in Ethiopia, Nigeria, Sudan and Tanzania.
In Asia, total food use of coarse grains is projected to rise to
Figure 6. Global coarse grain production and feed use
600
630
660
690
720
750
780
810
2017/182016/172015/162014/152013/1440
43
46
49
52
55
58
61
million tonnes percent
World feed use (left axis)
Share of world production in feed use (right axis)
f’cast.estim.
2009/10 2010/11 2011/12 2012/13 2013/14 2014/15 2015/16 2016/17 estim.
2017/18 (f'cast)
Maize production 332 550 316 166 313 956 273 188 351 270 361 101 345 504 384 774 362 726
Ethanol use 116 616 127 538 127 005 117 886 130 155 132 085 132 695 138 131 139 070
Yearly change (%) 25 9.4 -0.4 -7.2 10.4 1.5 0.5 4.1 0.7
As % of production 35 40.3 40.5 43.2 37.1 36.6 38.4 35.9 38.3
Table 9. Maize use for ethanol (excluding non-fuel) in the United States
Source: WASDE-USDA. * 12 October 2017
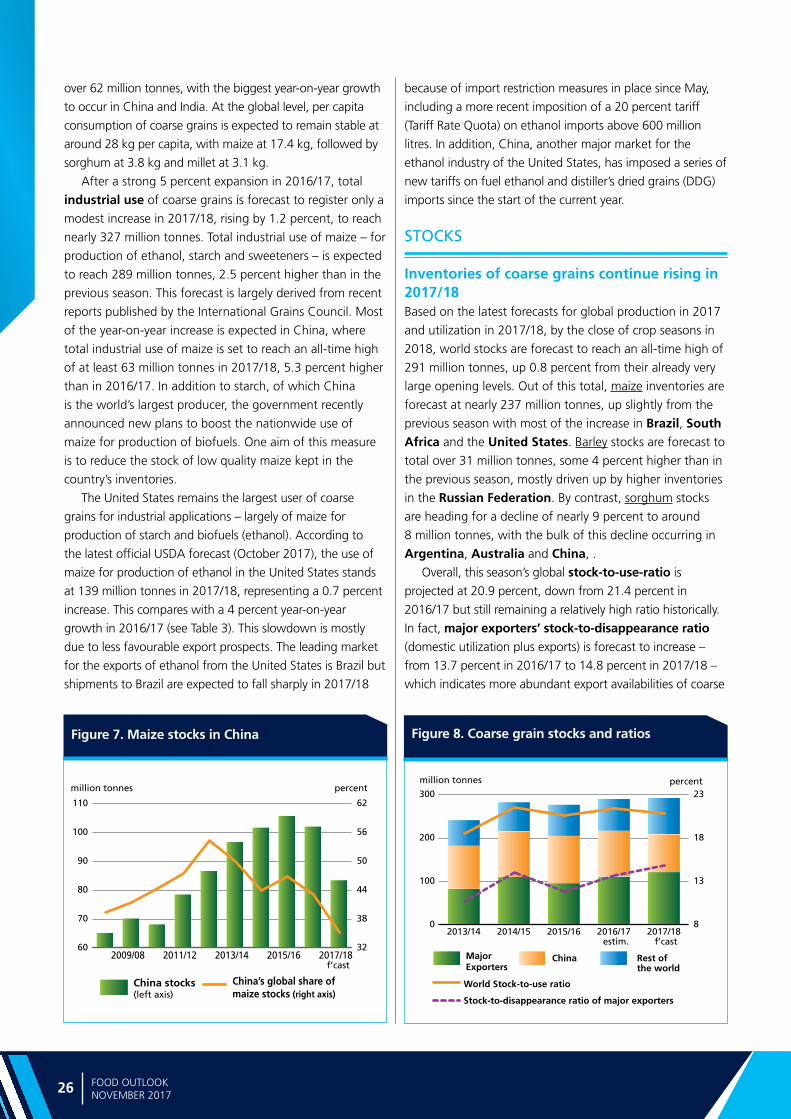
Ma
rke
t a
sse
ssm
en
ts
26 FOOD OUTLOOKNOVEMBER 2017
over 62 million tonnes, with the biggest year-on-year growth
to occur in China and India. At the global level, per capita
consumption of coarse grains is expected to remain stable at
around 28 kg per capita, with maize at 17.4 kg, followed by
sorghum at 3.8 kg and millet at 3.1 kg.
After a strong 5 percent expansion in 2016/17, total
industrial use of coarse grains is forecast to register only a
modest increase in 2017/18, rising by 1.2 percent, to reach
nearly 327 million tonnes. Total industrial use of maize – for
production of ethanol, starch and sweeteners – is expected
to reach 289 million tonnes, 2.5 percent higher than in the
previous season. This forecast is largely derived from recent
reports published by the International Grains Council. Most
of the year-on-year increase is expected in China, where
total industrial use of maize is set to reach an all-time high
of at least 63 million tonnes in 2017/18, 5.3 percent higher
than in 2016/17. In addition to starch, of which China
is the world’s largest producer, the government recently
announced new plans to boost the nationwide use of
maize for production of biofuels. One aim of this measure
is to reduce the stock of low quality maize kept in the
country’s inventories.
The United States remains the largest user of coarse
grains for industrial applications – largely of maize for
production of starch and biofuels (ethanol). According to
the latest official USDA forecast (October 2017), the use of
maize for production of ethanol in the United States stands
at 139 million tonnes in 2017/18, representing a 0.7 percent
increase. This compares with a 4 percent year-on-year
growth in 2016/17 (see Table 3). This slowdown is mostly
due to less favourable export prospects. The leading market
for the exports of ethanol from the United States is Brazil but
shipments to Brazil are expected to fall sharply in 2017/18
Figure 8. Coarse grain stocks and ratios
0
100
200
300
2017/182016/172015/162014/152013/148
13
18
23
million tonnes percent
Major Exporters
Rest of the world
China
World Stock-to-use ratio
Stock-to-disappearance ratio of major exporters
estim. f’cast
because of import restriction measures in place since May,
including a more recent imposition of a 20 percent tariff
(Tariff Rate Quota) on ethanol imports above 600 million
litres. In addition, China, another major market for the
ethanol industry of the United States, has imposed a series of
new tariffs on fuel ethanol and distiller’s dried grains (DDG)
imports since the start of the current year.
STOCKS
Inventories of coarse grains continue rising in 2017/18 Based on the latest forecasts for global production in 2017
and utilization in 2017/18, by the close of crop seasons in
2018, world stocks are forecast to reach an all-time high of
291 million tonnes, up 0.8 percent from their already very
large opening levels. Out of this total, maize inventories are
forecast at nearly 237 million tonnes, up slightly from the
previous season with most of the increase in Brazil, South Africa and the United States. Barley stocks are forecast to
total over 31 million tonnes, some 4 percent higher than in
the previous season, mostly driven up by higher inventories
in the Russian Federation. By contrast, sorghum stocks
are heading for a decline of nearly 9 percent to around
8 million tonnes, with the bulk of this decline occurring in
Argentina, Australia and China, .
Overall, this season’s global stock-to-use-ratio is
projected at 20.9 percent, down from 21.4 percent in
2016/17 but still remaining a relatively high ratio historically.
In fact, major exporters’ stock-to-disappearance ratio
(domestic utilization plus exports) is forecast to increase –
from 13.7 percent in 2016/17 to 14.8 percent in 2017/18 –
which indicates more abundant export availabilities of coarse
Figure 7. Maize stocks in China
60
70
80
90
100
110
2017/182015/162013/142011/122009/0832
38
44
50
56
62
million tonnes percent
China stocks(left axis)
China’s global share of maize stocks (right axis)
f’cast

27FOOD OUTLOOK NOVEMBER 2017
CO
AR
SE G
RA
INS
grains for world markets during the current season. Among
the major exporters, the biggest year-on-year increase in
inventories involves Brazil where, following a bumper maize
crop, ending stocks are projected to triple in size and reach
an all-time high of 15 million tonnes. To a much smaller
extent, total inventories of coarse grains in Argentina and
the Russian Federation are also heading for some increases
in 2017/18, more than offsetting projected drawdowns in
Australia and the EU.
On a regional basis, Asia ranks first in terms of total
stocks of coarse grains held, currently projected at nearly
118 million tonnes. At this forecast level, Asian inventories
would be some 16 million tonnes, or 12 percent, down from
their opening levels, mostly because of a sharp reduction
anticipated in China maize stocks. The largest Asian and
world stock holder of maize is, in fact China, which has
nearly 83 million tonnes in its inventories. This represents
81 percent of all maize held in Asia and 35 percent of the
world total. However, at 83 million tonnes, China stocks
would be down almost 19 million tonnes, or 18 percent,
below their opening levels. The sharp reduction is due,
in part, to this year’s fall in production as well as recent
attempts by the government to boost domestic maize
utilization.
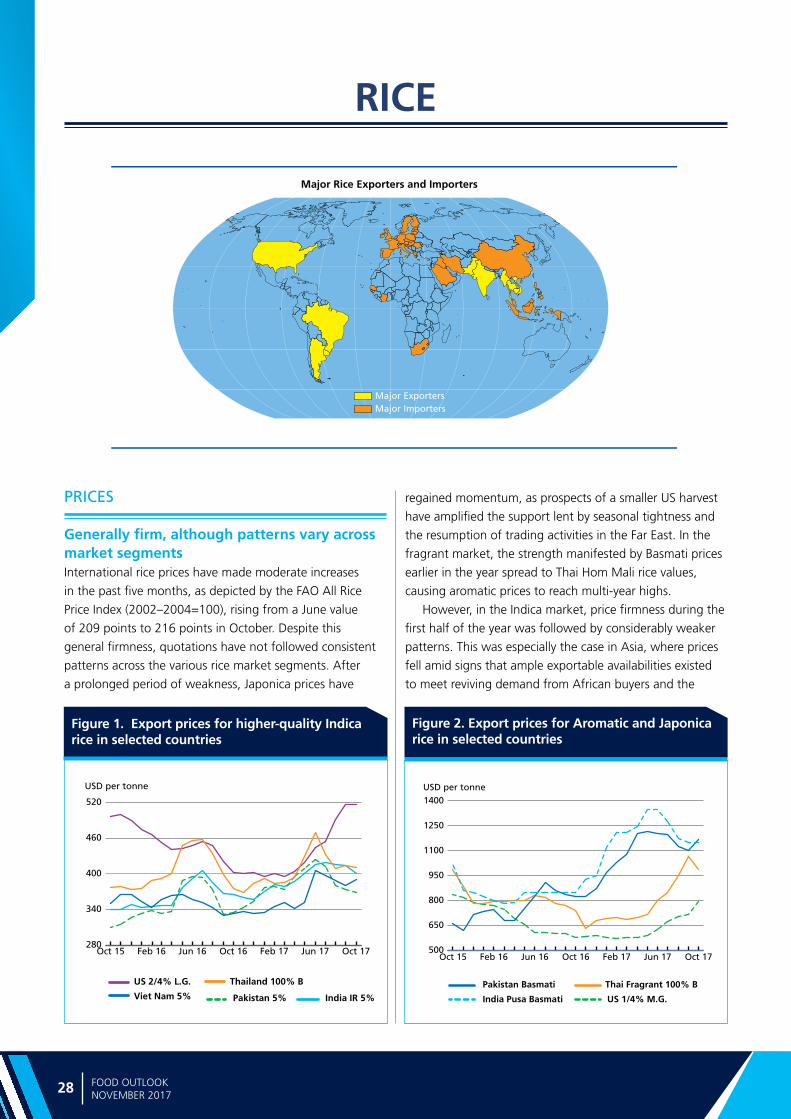
Ma
rke
t a
sse
ssm
en
ts
28 FOOD OUTLOOKNOVEMBER 2017
Figure 1. Export prices for higher-quality Indica rice in selected countries
RICE
Figure 2. Export prices for Aromatic and Japonica rice in selected countries
PRICES
Generally firm, although patterns vary across market segmentsInternational rice prices have made moderate increases
in the past five months, as depicted by the FAO All Rice
Price Index (2002–2004=100), rising from a June value
of 209 points to 216 points in October. Despite this
general firmness, quotations have not followed consistent
patterns across the various rice market segments. After
a prolonged period of weakness, Japonica prices have
regained momentum, as prospects of a smaller US harvest
have amplified the support lent by seasonal tightness and
the resumption of trading activities in the Far East. In the
fragrant market, the strength manifested by Basmati prices
earlier in the year spread to Thai Hom Mali rice values,
causing aromatic prices to reach multi-year highs.
However, in the Indica market, price firmness during the
first half of the year was followed by considerably weaker
patterns. This was especially the case in Asia, where prices
fell amid signs that ample exportable availabilities existed
to meet reviving demand from African buyers and the
Major Rice Exporters and Importers
Major ExportersMajor Importers
500
650
800
950
1100
1250
1400
Oct 17Jun 17Feb 17Oct 16Jun 16Feb 16Oct 15
USD per tonne
Pakistan Basmati Thai Fragrant 100% B
India Pusa Basmati US 1/4% M.G.
280
340
400
460
520
Oct 17Jun 17Feb 17Oct 16Jun 16Feb 16Oct 15
USD per tonne
US 2/4% L.G.
Viet Nam 5% India IR 5%
Thailand 100% B
Pakistan 5%
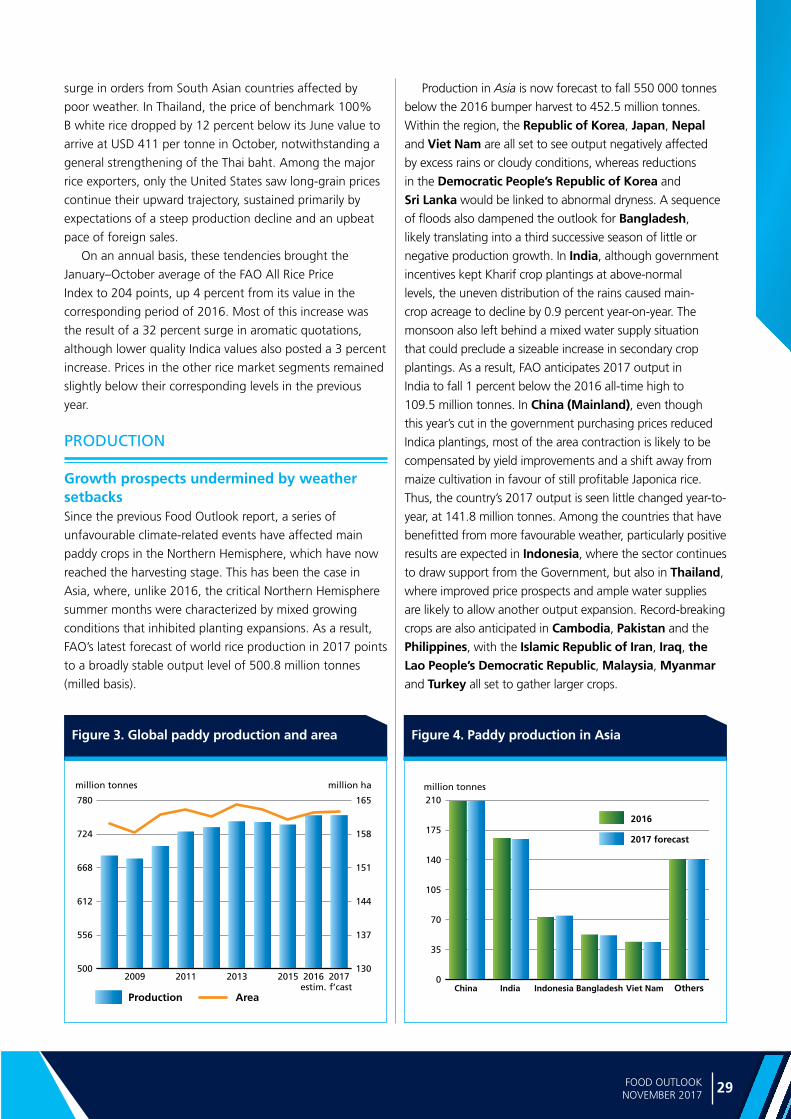
29FOOD OUTLOOK NOVEMBER 2017
RIC
E
Figure 3. Global paddy production and area Figure 4. Paddy production in Asia
surge in orders from South Asian countries affected by
poor weather. In Thailand, the price of benchmark 100%
B white rice dropped by 12 percent below its June value to
arrive at USD 411 per tonne in October, notwithstanding a
general strengthening of the Thai baht. Among the major
rice exporters, only the United States saw long-grain prices
continue their upward trajectory, sustained primarily by
expectations of a steep production decline and an upbeat
pace of foreign sales.
On an annual basis, these tendencies brought the
January–October average of the FAO All Rice Price
Index to 204 points, up 4 percent from its value in the
corresponding period of 2016. Most of this increase was
the result of a 32 percent surge in aromatic quotations,
although lower quality Indica values also posted a 3 percent
increase. Prices in the other rice market segments remained
slightly below their corresponding levels in the previous
year.
PRODUCTION
Growth prospects undermined by weather setbacks Since the previous Food Outlook report, a series of
unfavourable climate-related events have affected main
paddy crops in the Northern Hemisphere, which have now
reached the harvesting stage. This has been the case in
Asia, where, unlike 2016, the critical Northern Hemisphere
summer months were characterized by mixed growing
conditions that inhibited planting expansions. As a result,
FAO’s latest forecast of world rice production in 2017 points
to a broadly stable output level of 500.8 million tonnes
(milled basis).
Production in Asia is now forecast to fall 550 000 tonnes
below the 2016 bumper harvest to 452.5 million tonnes.
Within the region, the Republic of Korea, Japan, Nepal and Viet Nam are all set to see output negatively affected
by excess rains or cloudy conditions, whereas reductions
in the Democratic People’s Republic of Korea and
Sri Lanka would be linked to abnormal dryness. A sequence
of floods also dampened the outlook for Bangladesh,
likely translating into a third successive season of little or
negative production growth. In India, although government
incentives kept Kharif crop plantings at above-normal
levels, the uneven distribution of the rains caused main-
crop acreage to decline by 0.9 percent year-on-year. The
monsoon also left behind a mixed water supply situation
that could preclude a sizeable increase in secondary crop
plantings. As a result, FAO anticipates 2017 output in
India to fall 1 percent below the 2016 all-time high to
109.5 million tonnes. In China (Mainland), even though
this year’s cut in the government purchasing prices reduced
Indica plantings, most of the area contraction is likely to be
compensated by yield improvements and a shift away from
maize cultivation in favour of still profitable Japonica rice.
Thus, the country’s 2017 output is seen little changed year-to-
year, at 141.8 million tonnes. Among the countries that have
benefitted from more favourable weather, particularly positive
results are expected in Indonesia, where the sector continues
to draw support from the Government, but also in Thailand,
where improved price prospects and ample water supplies
are likely to allow another output expansion. Record-breaking
crops are also anticipated in Cambodia, Pakistan and the
Philippines, with the Islamic Republic of Iran, Iraq, the Lao People’s Democratic Republic, Malaysia, Myanmar and Turkey all set to gather larger crops.
500
556
612
668
724
780
201720162015201320112009130
137
144
151
158
165
million tonnes million ha
Production Areaestim. f’cast
0
35
70
105
140
175
210
2016
2017 forecast
million tonnes
India IndonesiaChina Bangladesh Viet Nam Others
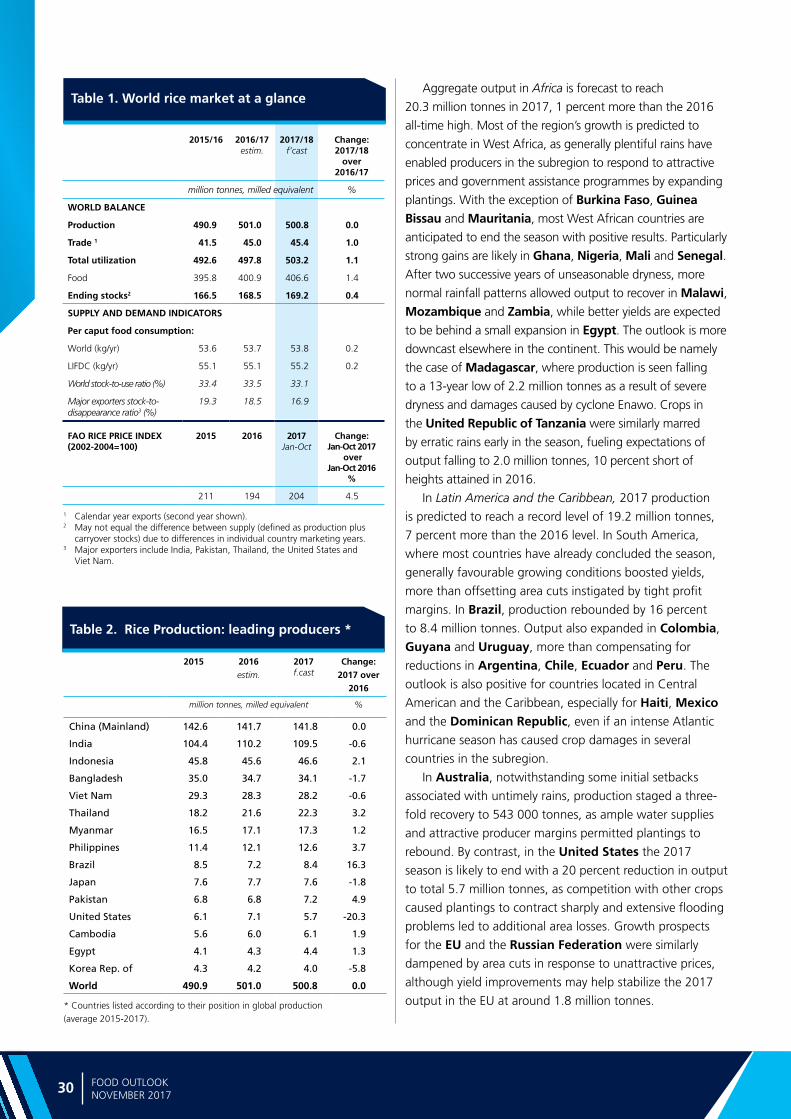
Ma
rke
t a
sse
ssm
en
ts
30 FOOD OUTLOOKNOVEMBER 2017
Table 1. World rice market at a glance
Table 2. Rice Production: leading producers *
2015 2016 estim.
2017f.cast
Change:2017 over
2016
million tonnes, milled equivalent %
China (Mainland) 142.6 141.7 141.8 0.0
India 104.4 110.2 109.5 -0.6
Indonesia 45.8 45.6 46.6 2.1
Bangladesh 35.0 34.7 34.1 -1.7
Viet Nam 29.3 28.3 28.2 -0.6
Thailand 18.2 21.6 22.3 3.2
Myanmar 16.5 17.1 17.3 1.2
Philippines 11.4 12.1 12.6 3.7
Brazil 8.5 7.2 8.4 16.3
Japan 7.6 7.7 7.6 -1.8
Pakistan 6.8 6.8 7.2 4.9
United States 6.1 7.1 5.7 -20.3
Cambodia 5.6 6.0 6.1 1.9
Egypt 4.1 4.3 4.4 1.3
Korea Rep. of 4.3 4.2 4.0 -5.8
World 490.9 501.0 500.8 0.0
* Countries listed according to their position in global production (average 2015-2017).
1 Calendar year exports (second year shown).2 May not equal the difference between supply (defined as production plus
carryover stocks) due to differences in individual country marketing years.3 Major exporters include India, Pakistan, Thailand, the United States and
Viet Nam.
2015/16 2016/17 estim.
2017/18 f’cast
Change: 2017/18
over 2016/17
million tonnes, milled equivalent %
WORLD BALANCE
Production 490.9 501.0 500.8 0.0
Trade 1 41.5 45.0 45.4 1.0
Total utilization 492.6 497.8 503.2 1.1
Food 395.8 400.9 406.6 1.4
Ending stocks2 166.5 168.5 169.2 0.4
SUPPLY AND DEMAND INDICATORS
Per caput food consumption:
World (kg/yr) 53.6 53.7 53.8 0.2
LIFDC (kg/yr) 55.1 55.1 55.2 0.2
World stock-to-use ratio (%) 33.4 33.5 33.1
Major exporters stock-to-disappearance ratio3 (%)
19.3 18.5 16.9
FAO RICE PRICE INDEX (2002-2004=100)
2015 2016 2017 Jan-Oct
Change: Jan-Oct 2017
over Jan-Oct 2016
%
211 194 204 4.5
Aggregate output in Africa is forecast to reach
20.3 million tonnes in 2017, 1 percent more than the 2016
all-time high. Most of the region’s growth is predicted to
concentrate in West Africa, as generally plentiful rains have
enabled producers in the subregion to respond to attractive
prices and government assistance programmes by expanding
plantings. With the exception of Burkina Faso, Guinea Bissau and Mauritania, most West African countries are
anticipated to end the season with positive results. Particularly
strong gains are likely in Ghana, Nigeria, Mali and Senegal. After two successive years of unseasonable dryness, more
normal rainfall patterns allowed output to recover in Malawi, Mozambique and Zambia, while better yields are expected
to be behind a small expansion in Egypt. The outlook is more
downcast elsewhere in the continent. This would be namely
the case of Madagascar, where production is seen falling
to a 13-year low of 2.2 million tonnes as a result of severe
dryness and damages caused by cyclone Enawo. Crops in
the United Republic of Tanzania were similarly marred
by erratic rains early in the season, fueling expectations of
output falling to 2.0 million tonnes, 10 percent short of
heights attained in 2016.
In Latin America and the Caribbean, 2017 production
is predicted to reach a record level of 19.2 million tonnes,
7 percent more than the 2016 level. In South America,
where most countries have already concluded the season,
generally favourable growing conditions boosted yields,
more than offsetting area cuts instigated by tight profit
margins. In Brazil, production rebounded by 16 percent
to 8.4 million tonnes. Output also expanded in Colombia,
Guyana and Uruguay, more than compensating for
reductions in Argentina, Chile, Ecuador and Peru. The
outlook is also positive for countries located in Central
American and the Caribbean, especially for Haiti, Mexico
and the Dominican Republic, even if an intense Atlantic
hurricane season has caused crop damages in several
countries in the subregion.
In Australia, notwithstanding some initial setbacks
associated with untimely rains, production staged a three-
fold recovery to 543 000 tonnes, as ample water supplies
and attractive producer margins permitted plantings to
rebound. By contrast, in the United States the 2017
season is likely to end with a 20 percent reduction in output
to total 5.7 million tonnes, as competition with other crops
caused plantings to contract sharply and extensive flooding
problems led to additional area losses. Growth prospects
for the EU and the Russian Federation were similarly
dampened by area cuts in response to unattractive prices,
although yield improvements may help stabilize the 2017
output in the EU at around 1.8 million tonnes.
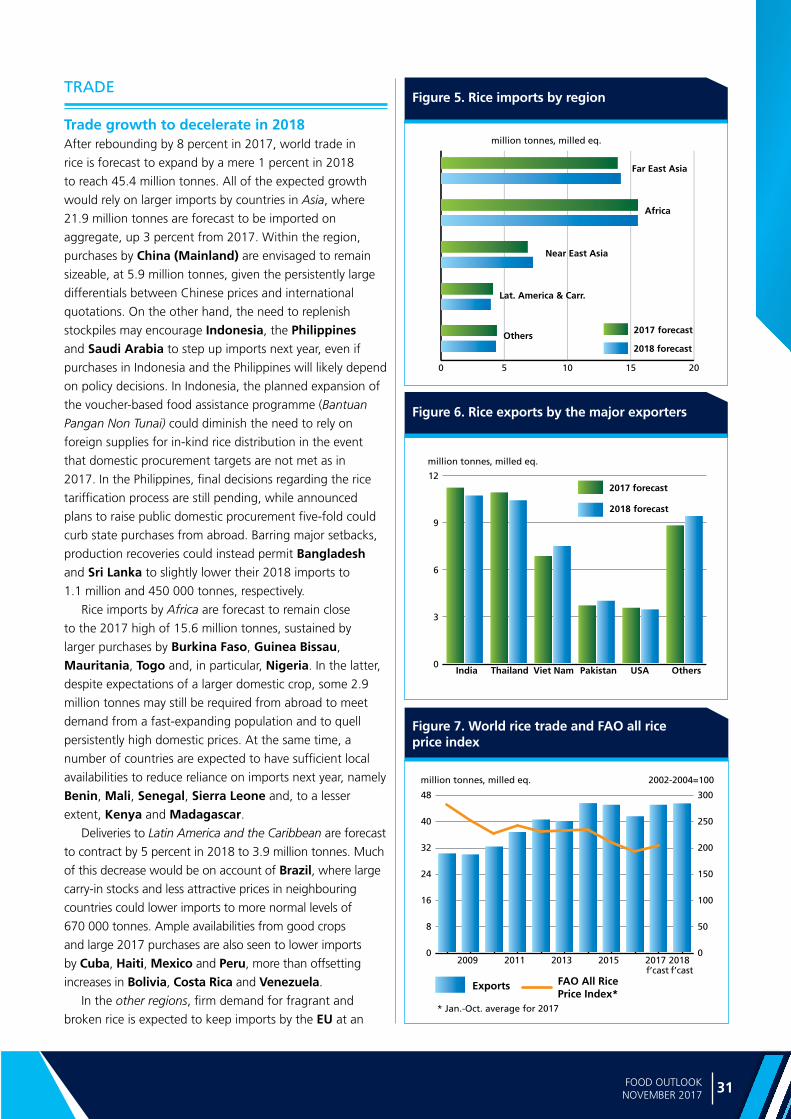
31FOOD OUTLOOK NOVEMBER 2017
RIC
E
Figure 7. World rice trade and FAO all rice price index
Figure 5. Rice imports by region
Figure 6. Rice exports by the major exporters
TRADE
Trade growth to decelerate in 2018After rebounding by 8 percent in 2017, world trade in
rice is forecast to expand by a mere 1 percent in 2018
to reach 45.4 million tonnes. All of the expected growth
would rely on larger imports by countries in Asia, where
21.9 million tonnes are forecast to be imported on
aggregate, up 3 percent from 2017. Within the region,
purchases by China (Mainland) are envisaged to remain
sizeable, at 5.9 million tonnes, given the persistently large
differentials between Chinese prices and international
quotations. On the other hand, the need to replenish
stockpiles may encourage Indonesia, the Philippines
and Saudi Arabia to step up imports next year, even if
purchases in Indonesia and the Philippines will likely depend
on policy decisions. In Indonesia, the planned expansion of
the voucher-based food assistance programme (Bantuan
Pangan Non Tunai) could diminish the need to rely on
foreign supplies for in-kind rice distribution in the event
that domestic procurement targets are not met as in
2017. In the Philippines, final decisions regarding the rice
tariffication process are still pending, while announced
plans to raise public domestic procurement five-fold could
curb state purchases from abroad. Barring major setbacks,
production recoveries could instead permit Bangladesh
and Sri Lanka to slightly lower their 2018 imports to
1.1 million and 450 000 tonnes, respectively.
Rice imports by Africa are forecast to remain close
to the 2017 high of 15.6 million tonnes, sustained by
larger purchases by Burkina Faso, Guinea Bissau, Mauritania, Togo and, in particular, Nigeria. In the latter,
despite expectations of a larger domestic crop, some 2.9
million tonnes may still be required from abroad to meet
demand from a fast-expanding population and to quell
persistently high domestic prices. At the same time, a
number of countries are expected to have sufficient local
availabilities to reduce reliance on imports next year, namely
Benin, Mali, Senegal, Sierra Leone and, to a lesser
extent, Kenya and Madagascar. Deliveries to Latin America and the Caribbean are forecast
to contract by 5 percent in 2018 to 3.9 million tonnes. Much
of this decrease would be on account of Brazil, where large
carry-in stocks and less attractive prices in neighbouring
countries could lower imports to more normal levels of
670 000 tonnes. Ample availabilities from good crops
and large 2017 purchases are also seen to lower imports
by Cuba, Haiti, Mexico and Peru, more than offsetting
increases in Bolivia, Costa Rica and Venezuela.
In the other regions, firm demand for fragrant and
broken rice is expected to keep imports by the EU at an
0
8
16
24
32
40
48
2018201720152013201120090
50
100
150
200
250
300
* Jan.-Oct. average for 2017
million tonnes, milled eq. 2002-2004=100
Exports FAO All RicePrice Index*
f’castf’cast
0 5 10 15 20
2017 forecast
2018 forecast
Far East Asia
Africa
Near East Asia
Lat. America & Carr.
Others
million tonnes, milled eq.
0
3
6
9
12
2018 forecast
2017 forecast
million tonnes, milled eq.
India Viet NamThailand Pakistan USA Others
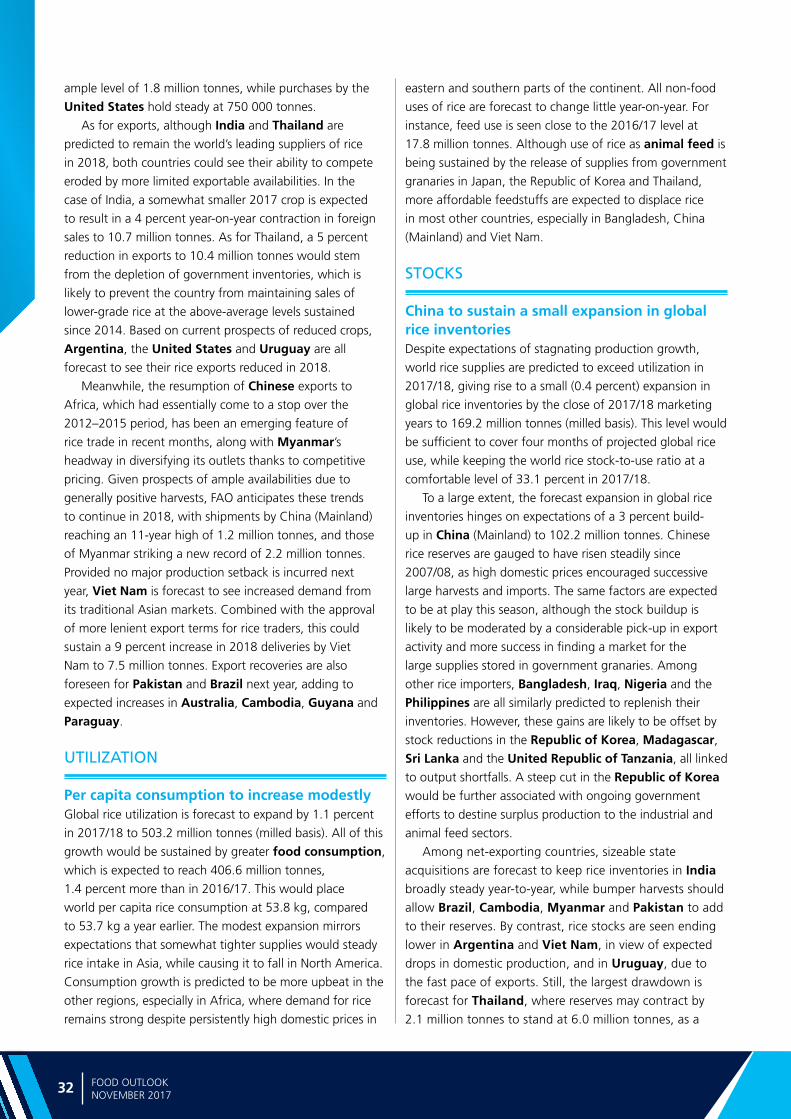
Ma
rke
t a
sse
ssm
en
ts
32 FOOD OUTLOOKNOVEMBER 2017
ample level of 1.8 million tonnes, while purchases by the
United States hold steady at 750 000 tonnes.
As for exports, although India and Thailand are
predicted to remain the world’s leading suppliers of rice
in 2018, both countries could see their ability to compete
eroded by more limited exportable availabilities. In the
case of India, a somewhat smaller 2017 crop is expected
to result in a 4 percent year-on-year contraction in foreign
sales to 10.7 million tonnes. As for Thailand, a 5 percent
reduction in exports to 10.4 million tonnes would stem
from the depletion of government inventories, which is
likely to prevent the country from maintaining sales of
lower-grade rice at the above-average levels sustained
since 2014. Based on current prospects of reduced crops,
Argentina, the United States and Uruguay are all
forecast to see their rice exports reduced in 2018.
Meanwhile, the resumption of Chinese exports to
Africa, which had essentially come to a stop over the
2012–2015 period, has been an emerging feature of
rice trade in recent months, along with Myanmar’s headway in diversifying its outlets thanks to competitive
pricing. Given prospects of ample availabilities due to
generally positive harvests, FAO anticipates these trends
to continue in 2018, with shipments by China (Mainland)
reaching an 11-year high of 1.2 million tonnes, and those
of Myanmar striking a new record of 2.2 million tonnes.
Provided no major production setback is incurred next
year, Viet Nam is forecast to see increased demand from
its traditional Asian markets. Combined with the approval
of more lenient export terms for rice traders, this could
sustain a 9 percent increase in 2018 deliveries by Viet
Nam to 7.5 million tonnes. Export recoveries are also
foreseen for Pakistan and Brazil next year, adding to
expected increases in Australia, Cambodia, Guyana and
Paraguay.
UTILIZATION
Per capita consumption to increase modestly Global rice utilization is forecast to expand by 1.1 percent
in 2017/18 to 503.2 million tonnes (milled basis). All of this
growth would be sustained by greater food consumption,
which is expected to reach 406.6 million tonnes,
1.4 percent more than in 2016/17. This would place
world per capita rice consumption at 53.8 kg, compared
to 53.7 kg a year earlier. The modest expansion mirrors
expectations that somewhat tighter supplies would steady
rice intake in Asia, while causing it to fall in North America.
Consumption growth is predicted to be more upbeat in the
other regions, especially in Africa, where demand for rice
remains strong despite persistently high domestic prices in
eastern and southern parts of the continent. All non-food
uses of rice are forecast to change little year-on-year. For
instance, feed use is seen close to the 2016/17 level at
17.8 million tonnes. Although use of rice as animal feed is
being sustained by the release of supplies from government
granaries in Japan, the Republic of Korea and Thailand,
more affordable feedstuffs are expected to displace rice
in most other countries, especially in Bangladesh, China
(Mainland) and Viet Nam.
STOCKS
China to sustain a small expansion in global rice inventories Despite expectations of stagnating production growth,
world rice supplies are predicted to exceed utilization in
2017/18, giving rise to a small (0.4 percent) expansion in
global rice inventories by the close of 2017/18 marketing
years to 169.2 million tonnes (milled basis). This level would
be sufficient to cover four months of projected global rice
use, while keeping the world rice stock-to-use ratio at a
comfortable level of 33.1 percent in 2017/18.
To a large extent, the forecast expansion in global rice
inventories hinges on expectations of a 3 percent build-
up in China (Mainland) to 102.2 million tonnes. Chinese
rice reserves are gauged to have risen steadily since
2007/08, as high domestic prices encouraged successive
large harvests and imports. The same factors are expected
to be at play this season, although the stock buildup is
likely to be moderated by a considerable pick-up in export
activity and more success in finding a market for the
large supplies stored in government granaries. Among
other rice importers, Bangladesh, Iraq, Nigeria and the
Philippines are all similarly predicted to replenish their
inventories. However, these gains are likely to be offset by
stock reductions in the Republic of Korea, Madagascar, Sri Lanka and the United Republic of Tanzania, all linked
to output shortfalls. A steep cut in the Republic of Korea
would be further associated with ongoing government
efforts to destine surplus production to the industrial and
animal feed sectors.
Among net-exporting countries, sizeable state
acquisitions are forecast to keep rice inventories in India
broadly steady year-to-year, while bumper harvests should
allow Brazil, Cambodia, Myanmar and Pakistan to add
to their reserves. By contrast, rice stocks are seen ending
lower in Argentina and Viet Nam, in view of expected
drops in domestic production, and in Uruguay, due to
the fast pace of exports. Still, the largest drawdown is
forecast for Thailand, where reserves may contract by 2.1 million tonnes to stand at 6.0 million tonnes, as a
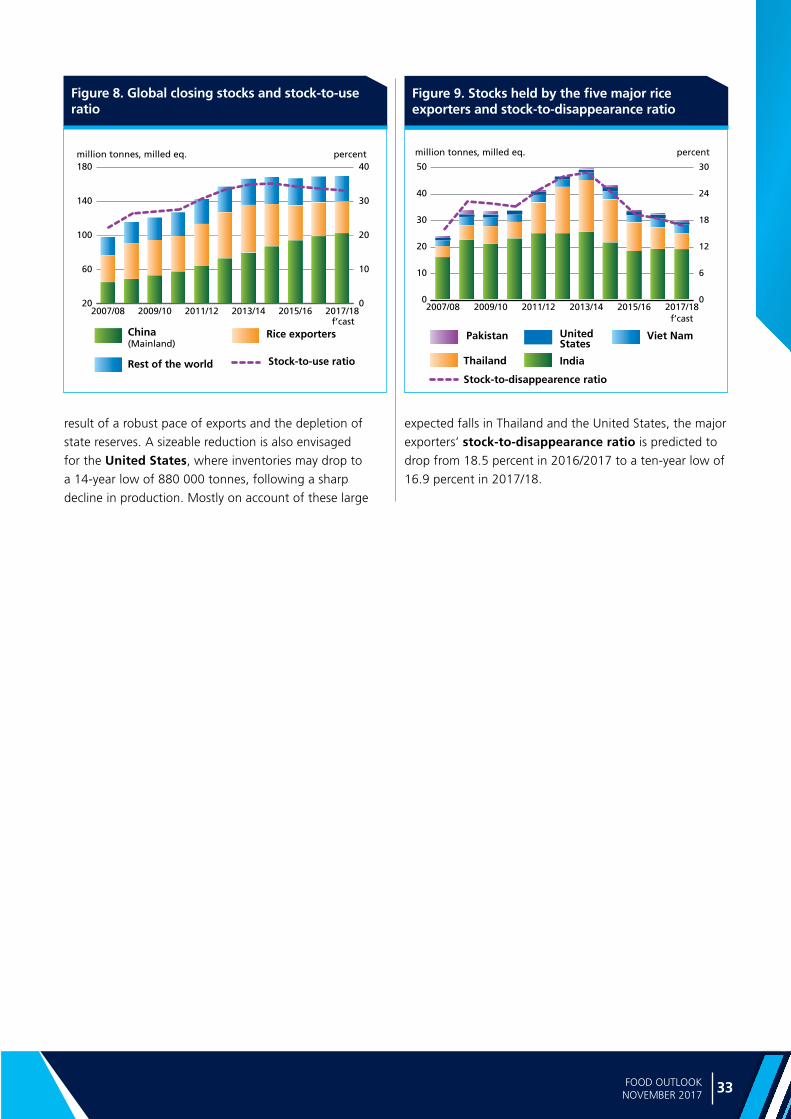
33FOOD OUTLOOK NOVEMBER 2017
RIC
E
Figure 8. Global closing stocks and stock-to-use ratio
Figure 9. Stocks held by the five major rice exporters and stock-to-disappearance ratio
result of a robust pace of exports and the depletion of
state reserves. A sizeable reduction is also envisaged
for the United States, where inventories may drop to
a 14-year low of 880 000 tonnes, following a sharp
decline in production. Mostly on account of these large
20
60
100
140
180
2017/182015/162013/142011/122009/102007/080
10
20
30
40million tonnes, milled eq. percent
Rice exporters
Rest of the world
China (Mainland)
Stock-to-use ratio
f’cast
0
10
20
30
40
50
2017/182015/162013/142011/122009/102007/080
6
12
18
24
30
million tonnes, milled eq. percent
India
Viet Nam
Thailand
Stock-to-disappearence ratio
f’cast
Pakistan United States
expected falls in Thailand and the United States, the major
exporters’ stock-to-disappearance ratio is predicted to
drop from 18.5 percent in 2016/2017 to a ten-year low of
16.9 percent in 2017/18.
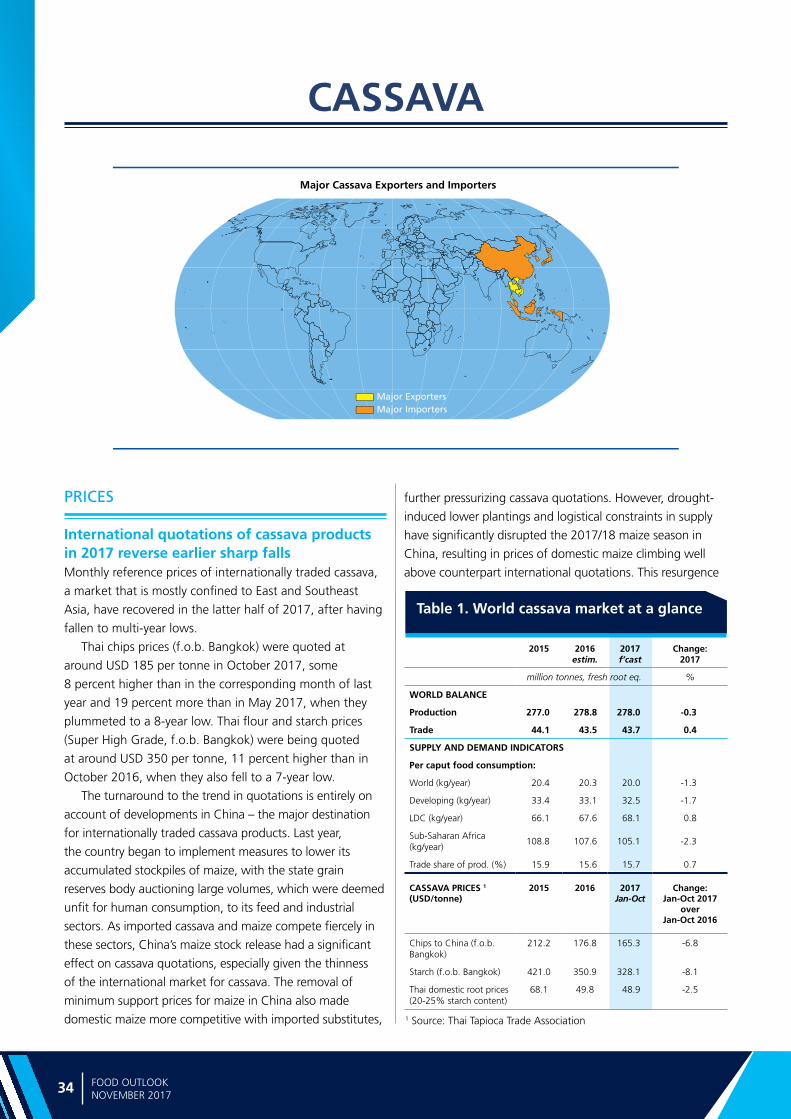
Ma
rke
t a
sse
ssm
en
ts
34 FOOD OUTLOOKNOVEMBER 2017
Major Cassava Exporters and Importers
Major ExportersMajor Importers
Table 1. World cassava market at a glance
CASSAVA
1 Source: Thai Tapioca Trade Association
PRICES
International quotations of cassava products in 2017 reverse earlier sharp falls Monthly reference prices of internationally traded cassava,
a market that is mostly confined to East and Southeast
Asia, have recovered in the latter half of 2017, after having
fallen to multi-year lows.
Thai chips prices (f.o.b. Bangkok) were quoted at
around USD 185 per tonne in October 2017, some
8 percent higher than in the corresponding month of last
year and 19 percent more than in May 2017, when they
plummeted to a 8-year low. Thai flour and starch prices
(Super High Grade, f.o.b. Bangkok) were being quoted
at around USD 350 per tonne, 11 percent higher than in
October 2016, when they also fell to a 7-year low.
The turnaround to the trend in quotations is entirely on
account of developments in China – the major destination
for internationally traded cassava products. Last year,
the country began to implement measures to lower its
accumulated stockpiles of maize, with the state grain
reserves body auctioning large volumes, which were deemed
unfit for human consumption, to its feed and industrial
sectors. As imported cassava and maize compete fiercely in
these sectors, China’s maize stock release had a significant
effect on cassava quotations, especially given the thinness
of the international market for cassava. The removal of
minimum support prices for maize in China also made
domestic maize more competitive with imported substitutes,
further pressurizing cassava quotations. However, drought-
induced lower plantings and logistical constraints in supply
have significantly disrupted the 2017/18 maize season in
China, resulting in prices of domestic maize climbing well
above counterpart international quotations. This resurgence
2015 2016 estim.
2017 f’cast
Change: 2017
million tonnes, fresh root eq. %
WORLD BALANCE
Production 277.0 278.8 278.0 -0.3
Trade 44.1 43.5 43.7 0.4
SUPPLY AND DEMAND INDICATORS
Per caput food consumption:
World (kg/year) 20.4 20.3 20.0 -1.3
Developing (kg/year) 33.4 33.1 32.5 -1.7
LDC (kg/year) 66.1 67.6 68.1 0.8
Sub-Saharan Africa (kg/year)
108.8 107.6 105.1 -2.3
Trade share of prod. (%) 15.9 15.6 15.7 0.7
CASSAVA PRICES 1 (USD/tonne)
2015 2016 2017 Jan-Oct
Change:Jan-Oct 2017
overJan-Oct 2016
Chips to China (f.o.b. Bangkok)
212.2 176.8 165.3 -6.8
Starch (f.o.b. Bangkok) 421.0 350.9 328.1 -8.1
Thai domestic root prices (20-25% starch content)
68.1 49.8 48.9 -2.5
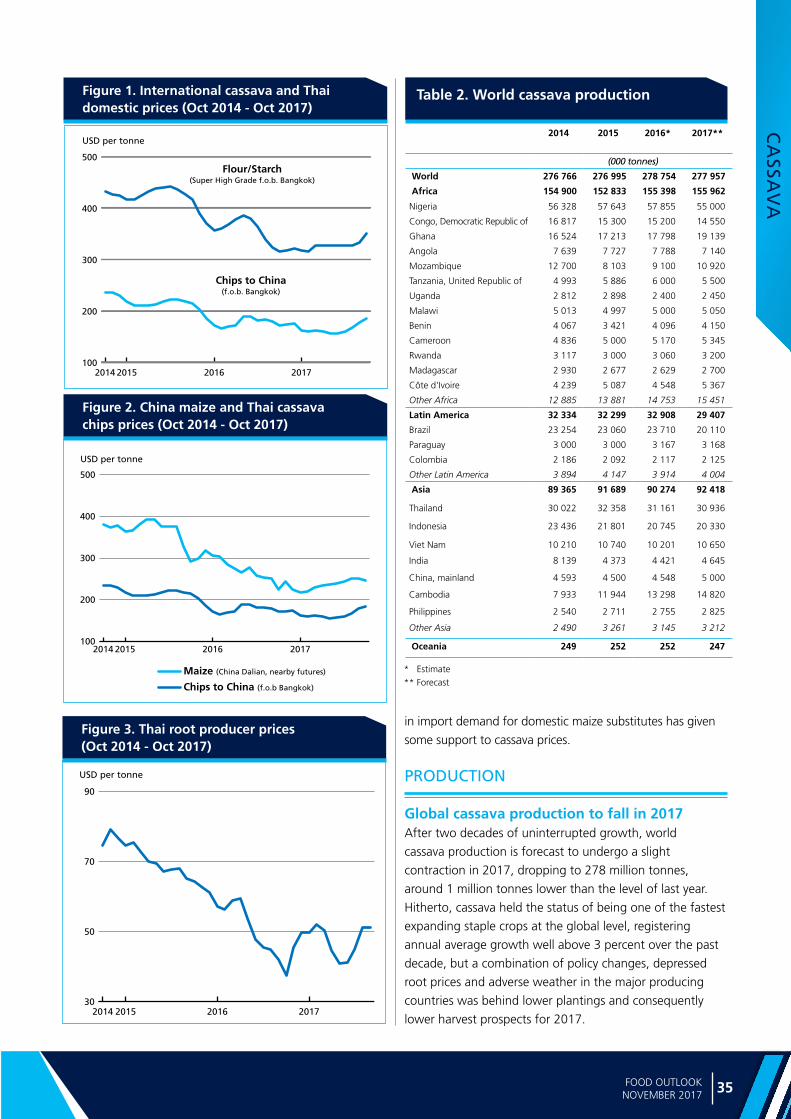
35FOOD OUTLOOK NOVEMBER 2017
CA
SSAV
A
2014 2015 2016* 2017**
(000 tonnes)
World 276 766 276 995 278 754 277 957
Africa 154 900 152 833 155 398 155 962
Nigeria 56 328 57 643 57 855 55 000
Congo, Democratic Republic of 16 817 15 300 15 200 14 550
Ghana 16 524 17 213 17 798 19 139
Angola 7 639 7 727 7 788 7 140
Mozambique 12 700 8 103 9 100 10 920
Tanzania, United Republic of 4 993 5 886 6 000 5 500
Uganda 2 812 2 898 2 400 2 450
Malawi 5 013 4 997 5 000 5 050
Benin 4 067 3 421 4 096 4 150
Cameroon 4 836 5 000 5 170 5 345
Rwanda 3 117 3 000 3 060 3 200
Madagascar 2 930 2 677 2 629 2 700
Côte d'Ivoire 4 239 5 087 4 548 5 367
Other Africa 12 885 13 881 14 753 15 451
Latin America 32 334 32 299 32 908 29 407
Brazil 23 254 23 060 23 710 20 110
Paraguay 3 000 3 000 3 167 3 168
Colombia 2 186 2 092 2 117 2 125
Other Latin America 3 894 4 147 3 914 4 004
Asia 89 365 91 689 90 274 92 418
Thailand 30 022 32 358 31 161 30 936
Indonesia 23 436 21 801 20 745 20 330
Viet Nam 10 210 10 740 10 201 10 650
India 8 139 4 373 4 421 4 645
China, mainland 4 593 4 500 4 548 5 000
Cambodia 7 933 11 944 13 298 14 820
Philippines 2 540 2 711 2 755 2 825
Other Asia 2 490 3 261 3 145 3 212
Oceania 249 252 252 247
* Estimate** Forecast
Table 2. World cassava productionFigure 1. International cassava and Thai domestic prices (Oct 2014 - Oct 2017)
Figure 2. China maize and Thai cassava chips prices (Oct 2014 - Oct 2017)
Figure 3. Thai root producer prices (Oct 2014 - Oct 2017)
100
200
300
400
500
2017201620152014
USD per tonne
Flour/Starch(Super High Grade f.o.b. Bangkok)
Chips to China(f.o.b. Bangkok)
100
200
300
400
500
2017201620152014
USD per tonne
Chips to China (f.o.b Bangkok)
Maize (China Dalian, nearby futures)
30
50
70
90
2017201620152014
USD per tonne
in import demand for domestic maize substitutes has given
some support to cassava prices.
PRODUCTION
Global cassava production to fall in 2017After two decades of uninterrupted growth, world
cassava production is forecast to undergo a slight
contraction in 2017, dropping to 278 million tonnes,
around 1 million tonnes lower than the level of last year.
Hitherto, cassava held the status of being one of the fastest
expanding staple crops at the global level, registering
annual average growth well above 3 percent over the past
decade, but a combination of policy changes, depressed
root prices and adverse weather in the major producing
countries was behind lower plantings and consequently
lower harvest prospects for 2017.
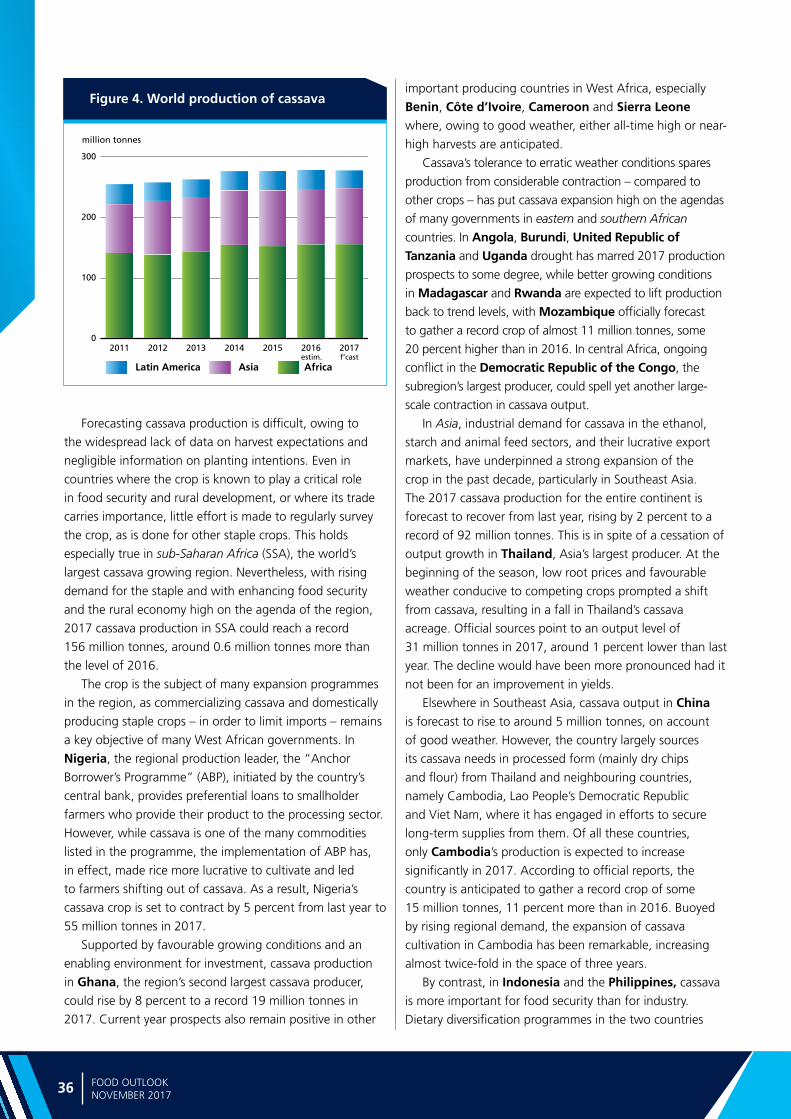
Ma
rke
t a
sse
ssm
en
ts
36 FOOD OUTLOOKNOVEMBER 2017
Forecasting cassava production is difficult, owing to
the widespread lack of data on harvest expectations and
negligible information on planting intentions. Even in
countries where the crop is known to play a critical role
in food security and rural development, or where its trade
carries importance, little effort is made to regularly survey
the crop, as is done for other staple crops. This holds
especially true in sub-Saharan Africa (SSA), the world’s
largest cassava growing region. Nevertheless, with rising
demand for the staple and with enhancing food security
and the rural economy high on the agenda of the region,
2017 cassava production in SSA could reach a record
156 million tonnes, around 0.6 million tonnes more than
the level of 2016.
The crop is the subject of many expansion programmes
in the region, as commercializing cassava and domestically
producing staple crops – in order to limit imports – remains
a key objective of many West African governments. In
Nigeria, the regional production leader, the “Anchor
Borrower’s Programme” (ABP), initiated by the country’s
central bank, provides preferential loans to smallholder
farmers who provide their product to the processing sector.
However, while cassava is one of the many commodities
listed in the programme, the implementation of ABP has,
in effect, made rice more lucrative to cultivate and led
to farmers shifting out of cassava. As a result, Nigeria’s
cassava crop is set to contract by 5 percent from last year to
55 million tonnes in 2017.
Supported by favourable growing conditions and an
enabling environment for investment, cassava production
in Ghana, the region’s second largest cassava producer,
could rise by 8 percent to a record 19 million tonnes in
2017. Current year prospects also remain positive in other
important producing countries in West Africa, especially
Benin, Côte d’Ivoire, Cameroon and Sierra Leone where, owing to good weather, either all-time high or near-
high harvests are anticipated.
Cassava’s tolerance to erratic weather conditions spares
production from considerable contraction – compared to
other crops – has put cassava expansion high on the agendas
of many governments in eastern and southern African
countries. In Angola, Burundi, United Republic of Tanzania and Uganda drought has marred 2017 production
prospects to some degree, while better growing conditions
in Madagascar and Rwanda are expected to lift production
back to trend levels, with Mozambique officially forecast
to gather a record crop of almost 11 million tonnes, some
20 percent higher than in 2016. In central Africa, ongoing
conflict in the Democratic Republic of the Congo, the
subregion’s largest producer, could spell yet another large-
scale contraction in cassava output.
In Asia, industrial demand for cassava in the ethanol,
starch and animal feed sectors, and their lucrative export
markets, have underpinned a strong expansion of the
crop in the past decade, particularly in Southeast Asia.
The 2017 cassava production for the entire continent is
forecast to recover from last year, rising by 2 percent to a
record of 92 million tonnes. This is in spite of a cessation of
output growth in Thailand, Asia’s largest producer. At the
beginning of the season, low root prices and favourable
weather conducive to competing crops prompted a shift
from cassava, resulting in a fall in Thailand’s cassava
acreage. Official sources point to an output level of
31 million tonnes in 2017, around 1 percent lower than last
year. The decline would have been more pronounced had it
not been for an improvement in yields.
Elsewhere in Southeast Asia, cassava output in China
is forecast to rise to around 5 million tonnes, on account
of good weather. However, the country largely sources
its cassava needs in processed form (mainly dry chips
and flour) from Thailand and neighbouring countries,
namely Cambodia, Lao People’s Democratic Republic
and Viet Nam, where it has engaged in efforts to secure
long-term supplies from them. Of all these countries,
only Cambodia’s production is expected to increase
significantly in 2017. According to official reports, the
country is anticipated to gather a record crop of some
15 million tonnes, 11 percent more than in 2016. Buoyed
by rising regional demand, the expansion of cassava
cultivation in Cambodia has been remarkable, increasing
almost twice-fold in the space of three years.
By contrast, in Indonesia and the Philippines, cassava
is more important for food security than for industry.
Dietary diversification programmes in the two countries
Figure 4. World production of cassava
0
100
200
300
2017201620152014201320122011
AfricaAsiaLatin Americaestim. f’cast
million tonnes
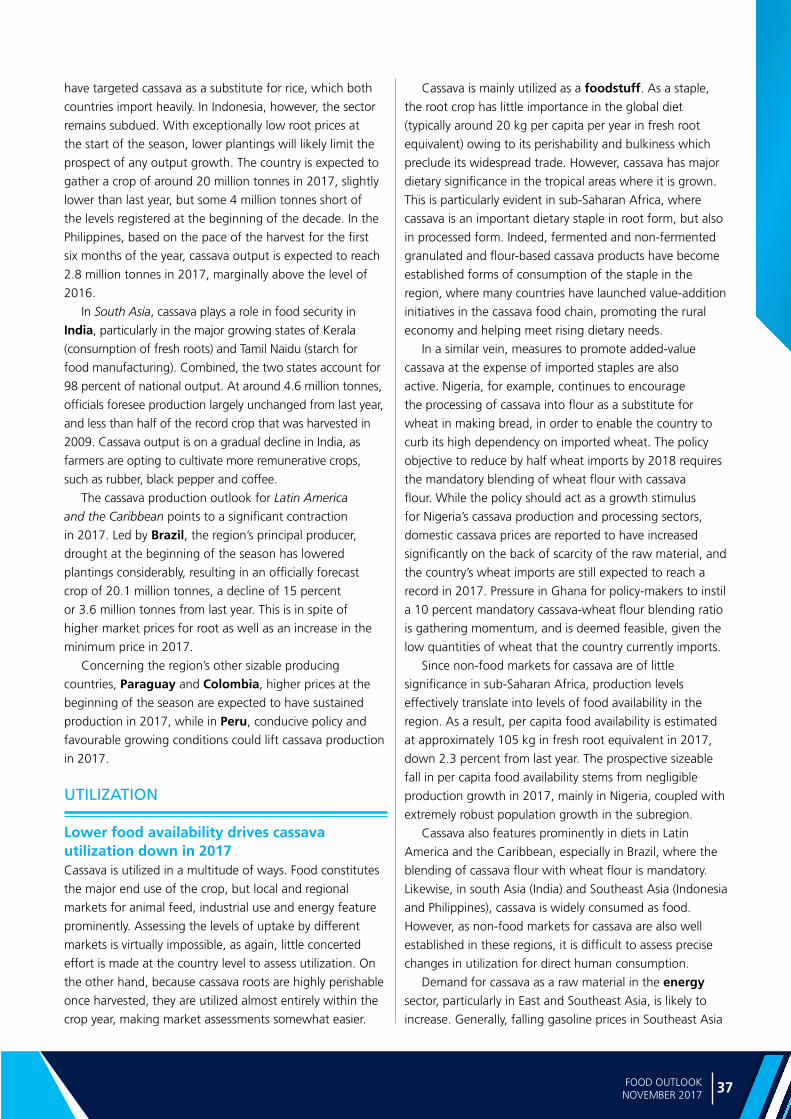
37FOOD OUTLOOK NOVEMBER 2017
CA
SSAV
A
have targeted cassava as a substitute for rice, which both
countries import heavily. In Indonesia, however, the sector
remains subdued. With exceptionally low root prices at
the start of the season, lower plantings will likely limit the
prospect of any output growth. The country is expected to
gather a crop of around 20 million tonnes in 2017, slightly
lower than last year, but some 4 million tonnes short of
the levels registered at the beginning of the decade. In the
Philippines, based on the pace of the harvest for the first
six months of the year, cassava output is expected to reach
2.8 million tonnes in 2017, marginally above the level of
2016.
In South Asia, cassava plays a role in food security in
India, particularly in the major growing states of Kerala
(consumption of fresh roots) and Tamil Naidu (starch for
food manufacturing). Combined, the two states account for
98 percent of national output. At around 4.6 million tonnes,
officials foresee production largely unchanged from last year,
and less than half of the record crop that was harvested in
2009. Cassava output is on a gradual decline in India, as
farmers are opting to cultivate more remunerative crops,
such as rubber, black pepper and coffee.
The cassava production outlook for Latin America
and the Caribbean points to a significant contraction
in 2017. Led by Brazil, the region’s principal producer,
drought at the beginning of the season has lowered
plantings considerably, resulting in an officially forecast
crop of 20.1 million tonnes, a decline of 15 percent
or 3.6 million tonnes from last year. This is in spite of
higher market prices for root as well as an increase in the
minimum price in 2017.
Concerning the region’s other sizable producing
countries, Paraguay and Colombia, higher prices at the
beginning of the season are expected to have sustained
production in 2017, while in Peru, conducive policy and
favourable growing conditions could lift cassava production
in 2017.
UTILIZATION
Lower food availability drives cassava utilization down in 2017Cassava is utilized in a multitude of ways. Food constitutes
the major end use of the crop, but local and regional
markets for animal feed, industrial use and energy feature
prominently. Assessing the levels of uptake by different
markets is virtually impossible, as again, little concerted
effort is made at the country level to assess utilization. On
the other hand, because cassava roots are highly perishable
once harvested, they are utilized almost entirely within the
crop year, making market assessments somewhat easier.
Cassava is mainly utilized as a foodstuff. As a staple,
the root crop has little importance in the global diet
(typically around 20 kg per capita per year in fresh root
equivalent) owing to its perishability and bulkiness which
preclude its widespread trade. However, cassava has major
dietary significance in the tropical areas where it is grown.
This is particularly evident in sub-Saharan Africa, where
cassava is an important dietary staple in root form, but also
in processed form. Indeed, fermented and non-fermented
granulated and flour-based cassava products have become
established forms of consumption of the staple in the
region, where many countries have launched value-addition
initiatives in the cassava food chain, promoting the rural
economy and helping meet rising dietary needs.
In a similar vein, measures to promote added-value
cassava at the expense of imported staples are also
active. Nigeria, for example, continues to encourage
the processing of cassava into flour as a substitute for
wheat in making bread, in order to enable the country to
curb its high dependency on imported wheat. The policy
objective to reduce by half wheat imports by 2018 requires
the mandatory blending of wheat flour with cassava
flour. While the policy should act as a growth stimulus
for Nigeria’s cassava production and processing sectors,
domestic cassava prices are reported to have increased
significantly on the back of scarcity of the raw material, and
the country’s wheat imports are still expected to reach a
record in 2017. Pressure in Ghana for policy-makers to instil
a 10 percent mandatory cassava-wheat flour blending ratio
is gathering momentum, and is deemed feasible, given the
low quantities of wheat that the country currently imports.
Since non-food markets for cassava are of little
significance in sub-Saharan Africa, production levels
effectively translate into levels of food availability in the
region. As a result, per capita food availability is estimated
at approximately 105 kg in fresh root equivalent in 2017,
down 2.3 percent from last year. The prospective sizeable
fall in per capita food availability stems from negligible
production growth in 2017, mainly in Nigeria, coupled with
extremely robust population growth in the subregion.
Cassava also features prominently in diets in Latin
America and the Caribbean, especially in Brazil, where the
blending of cassava flour with wheat flour is mandatory.
Likewise, in south Asia (India) and Southeast Asia (Indonesia
and Philippines), cassava is widely consumed as food.
However, as non-food markets for cassava are also well
established in these regions, it is difficult to assess precise
changes in utilization for direct human consumption.
Demand for cassava as a raw material in the energy
sector, particularly in East and Southeast Asia, is likely to
increase. Generally, falling gasoline prices in Southeast Asia
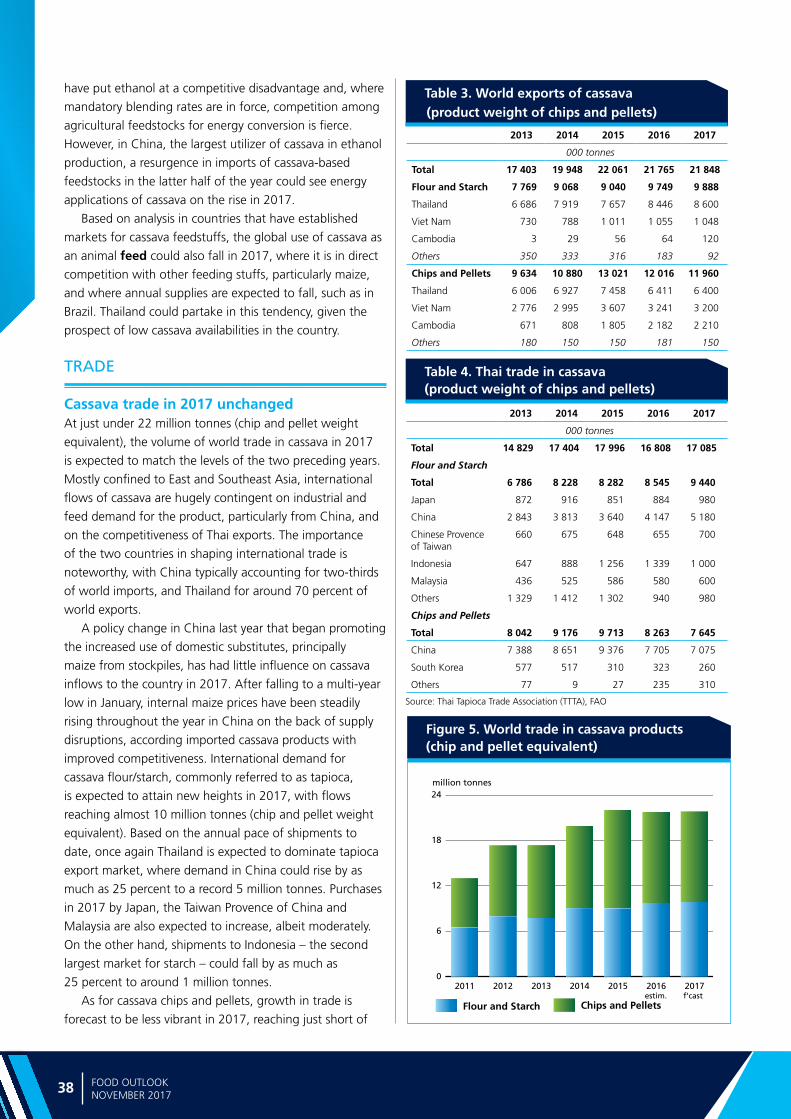
Ma
rke
t a
sse
ssm
en
ts
38 FOOD OUTLOOKNOVEMBER 2017
Figure 5. World trade in cassava products (chip and pellet equivalent)
2013 2014 2015 2016 2017
000 tonnes
Total 17 403 19 948 22 061 21 765 21 848
Flour and Starch 7 769 9 068 9 040 9 749 9 888
Thailand 6 686 7 919 7 657 8 446 8 600
Viet Nam 730 788 1 011 1 055 1 048
Cambodia 3 29 56 64 120
Others 350 333 316 183 92
Chips and Pellets 9 634 10 880 13 021 12 016 11 960
Thailand 6 006 6 927 7 458 6 411 6 400
Viet Nam 2 776 2 995 3 607 3 241 3 200
Cambodia 671 808 1 805 2 182 2 210
Others 180 150 150 181 150
2013 2014 2015 2016 2017
000 tonnes
Total 14 829 17 404 17 996 16 808 17 085
Flour and Starch
Total 6 786 8 228 8 282 8 545 9 440
Japan 872 916 851 884 980
China 2 843 3 813 3 640 4 147 5 180
Chinese Provence of Taiwan
660 675 648 655 700
Indonesia 647 888 1 256 1 339 1 000
Malaysia 436 525 586 580 600
Others 1 329 1 412 1 302 940 980
Chips and Pellets
Total 8 042 9 176 9 713 8 263 7 645
China 7 388 8 651 9 376 7 705 7 075
South Korea 577 517 310 323 260
Others 77 9 27 235 310
Table 3. World exports of cassava (product weight of chips and pellets)
Table 4. Thai trade in cassava (product weight of chips and pellets)
Source: Thai Tapioca Trade Association (TTTA), FAO
have put ethanol at a competitive disadvantage and, where
mandatory blending rates are in force, competition among
agricultural feedstocks for energy conversion is fierce.
However, in China, the largest utilizer of cassava in ethanol
production, a resurgence in imports of cassava-based
feedstocks in the latter half of the year could see energy
applications of cassava on the rise in 2017.
Based on analysis in countries that have established
markets for cassava feedstuffs, the global use of cassava as
an animal feed could also fall in 2017, where it is in direct
competition with other feeding stuffs, particularly maize,
and where annual supplies are expected to fall, such as in
Brazil. Thailand could partake in this tendency, given the
prospect of low cassava availabilities in the country.
TRADE
Cassava trade in 2017 unchangedAt just under 22 million tonnes (chip and pellet weight
equivalent), the volume of world trade in cassava in 2017
is expected to match the levels of the two preceding years.
Mostly confined to East and Southeast Asia, international
flows of cassava are hugely contingent on industrial and
feed demand for the product, particularly from China, and
on the competitiveness of Thai exports. The importance
of the two countries in shaping international trade is
noteworthy, with China typically accounting for two-thirds
of world imports, and Thailand for around 70 percent of
world exports.
A policy change in China last year that began promoting
the increased use of domestic substitutes, principally
maize from stockpiles, has had little influence on cassava
inflows to the country in 2017. After falling to a multi-year
low in January, internal maize prices have been steadily
rising throughout the year in China on the back of supply
disruptions, according imported cassava products with
improved competitiveness. International demand for
cassava flour/starch, commonly referred to as tapioca,
is expected to attain new heights in 2017, with flows
reaching almost 10 million tonnes (chip and pellet weight
equivalent). Based on the annual pace of shipments to
date, once again Thailand is expected to dominate tapioca
export market, where demand in China could rise by as
much as 25 percent to a record 5 million tonnes. Purchases
in 2017 by Japan, the Taiwan Provence of China and
Malaysia are also expected to increase, albeit moderately.
On the other hand, shipments to Indonesia – the second
largest market for starch – could fall by as much as
25 percent to around 1 million tonnes.
As for cassava chips and pellets, growth in trade is
forecast to be less vibrant in 2017, reaching just short of
0
6
12
18
24
2017201620152014201320122011
million tonnes
Flour and Starch Chips and Pelletsestim. f’cast

39FOOD OUTLOOK NOVEMBER 2017
CA
SSAV
A
12 million tonnes and nearly matching the volume of 2016.
Demand by China for cassava chips is expected to remain
robust, on account of cassava’s revived competitiveness
as a feedstock in its ethanol distilleries and as a feed
ingredient in its livestock sector. While Thailand is set to be
the dominant chip exporter, Viet Nam and Cambodia – the
other important suppliers in the region – are also forecast
to sustain their export shares of last year.
Prospects for an international cassava market expanding
beyond Asia remain largely elusive, with no sign of re-
emerging demand for substantial cassava volumes in
Europe (which once imported pellets in large quantities
for its feed sectors), or of significant exports from the
major producing regions of Africa or Latin America and
the Caribbean. This is in spite of Ghana and Nigeria having
been granted a duty free quota to export 4 million tonnes
of cassava chips to China on an annual basis.
OUTLOOK
Uncertainties prevail in non-food marketsGrowth prospects for world cassava sectors appear
delimited along the lines of geography that characterize the
role of cassava in the agricultural economy. For instance,
as cassava is principally a food crop in Africa, the sector is
providing a strong stimulus for rural development, poverty
alleviation, economic growth and, ultimately, food security.
There is also wider recognition of cassava as a choice crop
in the context of climate change adaptation strategies,
particularly in eastern and southern African countries
that have recently endured sustained periods of drought.
These considerations are providing cassava sectors in the
continent with a more assured long-term footing and are,
by and large, behind an annual average production growth
rate, which except for 2017, has outpaced population
growth for the past decade and beyond. The current year
anomaly is on account of a new policy in Nigeria that has
incentivized the cultivation of other crops at the expense of
cassava, resulting in cassava’s scarcity and very high prices.
Notwithstanding the prospect of higher root prices going
into the next season, given the importance of cassava to
Nigeria’s economy, official intervention could see production
growth back on track next year.
By contrast, cassava sectors in Asia are strongly
susceptible to developments in China, the principal
destination for cassava products. In fact, almost all cassava
sectors in Southeast Asia have been geared to meet China’s
high import demand, expanding in tandem with trade
growth. However, with highly competitive industrial and
feed procurement, the immediate future for cassava had
appeared bleak on account of China’s policy change to
promote domestically stockpiled maize to meet internal
demand. But because of supply problems of maize in the
country – poor crop prospects and logistical disruptions
in distribution – respite to regional cassava sectors was
provided by way of unfilled demand in China.
The downgrading of China’s 2017/18 maize supply
prospects may only provide a temporary stimulus to cassava
in the region. A bumper maize crop in the following season
or overcoming supply hurdles would pose a significant
threat to the cassava sector. So would a more active policy
of de-stocking maize. Given the thinness of international
cassava trade, even a minor recovery in China’s maize
supply would bring about serious ramifications to the
international market for cassava, as witnessed in the latter
half of last year.
The potential for cassava to compete in markets beyond
China is also uncertain, given that international maize
prices are currently hovering at relatively very low levels.
While cassava root prices in Southeast Asia have firmed
in recent months, the outlook for next year and beyond
will much depend on whether producers would be willing
to accept the risks of a possible strong decline in cassava
demand in China. Already some indication is provided by
way of a recent official survey in Thailand, which points to
9 percent drop in cassava area in 2018.
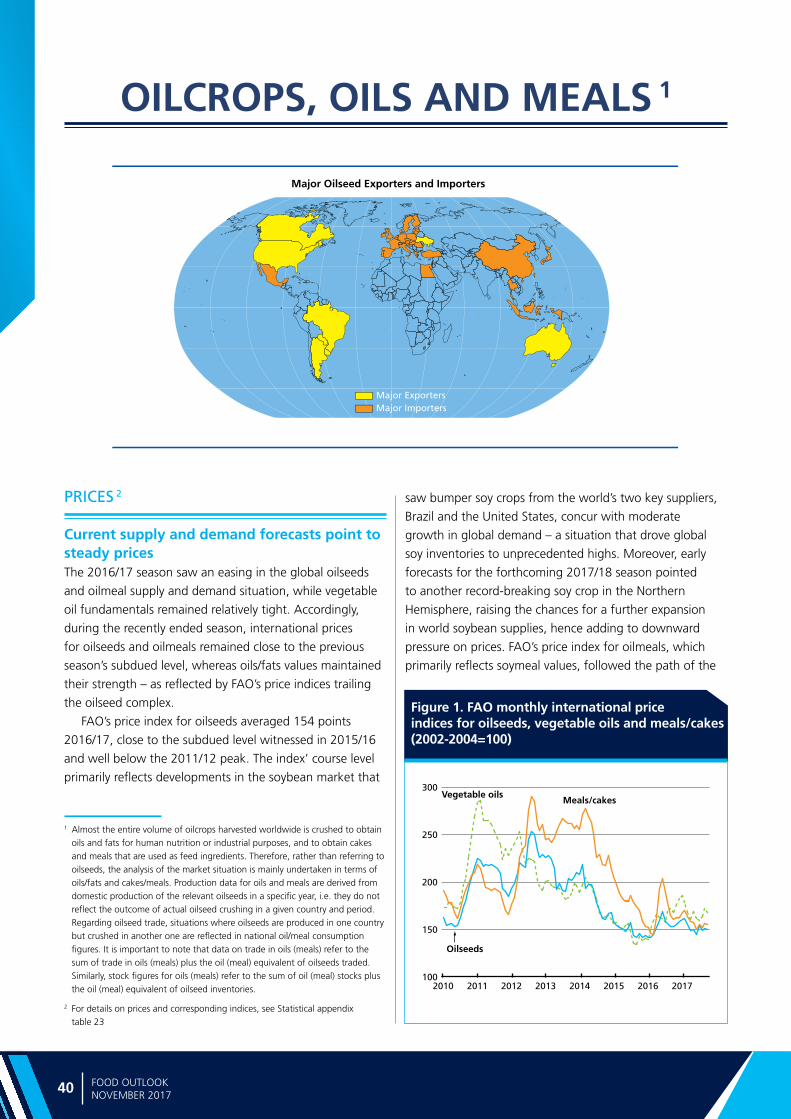
Ma
rke
t a
sse
ssm
en
ts
40 FOOD OUTLOOKNOVEMBER 2017
Major Oilseed Exporters and Importers
Major ExportersMajor Importers
Figure 1. FAO monthly international price indices for oilseeds, vegetable oils and meals/cakes (2002-2004=100)
OILCROPS, OILS AND MEALS 1
1 Almost the entire volume of oilcrops harvested worldwide is crushed to obtain oils and fats for human nutrition or industrial purposes, and to obtain cakes and meals that are used as feed ingredients. Therefore, rather than referring to oilseeds, the analysis of the market situation is mainly undertaken in terms of oils/fats and cakes/meals. Production data for oils and meals are derived from domestic production of the relevant oilseeds in a specific year, i.e. they do not reflect the outcome of actual oilseed crushing in a given country and period. Regarding oilseed trade, situations where oilseeds are produced in one country but crushed in another one are reflected in national oil/meal consumption figures. It is important to note that data on trade in oils (meals) refer to the sum of trade in oils (meals) plus the oil (meal) equivalent of oilseeds traded. Similarly, stock figures for oils (meals) refer to the sum of oil (meal) stocks plus the oil (meal) equivalent of oilseed inventories.
PRICES 2
Current supply and demand forecasts point to steady prices The 2016/17 season saw an easing in the global oilseeds
and oilmeal supply and demand situation, while vegetable
oil fundamentals remained relatively tight. Accordingly,
during the recently ended season, international prices
for oilseeds and oilmeals remained close to the previous
season’s subdued level, whereas oils/fats values maintained
their strength – as reflected by FAO’s price indices trailing
the oilseed complex.
FAO’s price index for oilseeds averaged 154 points
2016/17, close to the subdued level witnessed in 2015/16
and well below the 2011/12 peak. The index’ course level
primarily reflects developments in the soybean market that
saw bumper soy crops from the world’s two key suppliers,
Brazil and the United States, concur with moderate
growth in global demand – a situation that drove global
soy inventories to unprecedented highs. Moreover, early
forecasts for the forthcoming 2017/18 season pointed
to another record-breaking soy crop in the Northern
Hemisphere, raising the chances for a further expansion
in world soybean supplies, hence adding to downward
pressure on prices. FAO’s price index for oilmeals, which
primarily reflects soymeal values, followed the path of the
100
150
200
250
300
20172016201520142013201220112010
Meals/cakesVegetable oils
Oilseeds
2 For details on prices and corresponding indices, see Statistical appendix table 23

41FOOD OUTLOOK NOVEMBER 2017
OILC
RO
PS, O
ILS AN
D M
EA
LS
Figure 5. CBOT soybean futures for MarchFigure 2. FAO monthly price index for oilseeds (2002-2004=100)
Figure 3. FAO monthly price index for oilmeals/cakes (2002-2004=100)
Figure 4. FAO monthly price index for vegetable oils (2002-2004=100)
oilseeds index very closely, recording a slight fall compared
with 2015/16. Besides spill-over weakness from soybeans,
the softening in meal prices was driven by developments
in two closely related markets. Firstly, in 2016/17, meal-
rich soybeans were predominantly crushed for oil rather
than meal, a situation that has led to burdensome soymeal
supplies. Secondly, strong competition from competitively
priced feedgrains weighed on oilmeal prices throughout
2016/17.
FAO’s price index for vegetable oils averaged 171
points in 2016/17, up 16 points compared with 2015/16,
though well below the peaks recorded earlier in the
decade. The overall supply and demand balance of oils/
fats remained relatively tight, especially during the first
half of 2016/17, driving prices upward. International
quotations for palm oil, the world’s most consumed oil,
climbed to two-and-a-half year highs, underpinned by a
slower than anticipated recovery in palm oil production.
This, combined with robust global import demand, slowed
the replenishment of stocks in the world’s top suppliers,
Indonesia and Malaysia.
Preliminary forecasts for 2017/18 point to a broadly
balanced global supply and demand situation in both the
oilseed and meal market as well as in the oils segment. If
confirmed, this would provide limited scope for marked
upward or downward movements in prices. Stock-to-use
ratios similar to those observed in the last two seasons
and the convergence, during the last two to three months,
of the current Chicago Board of Trade futures price for
soybeans with that recorded last year seem to confirm
this picture. In the coming months, international oilseed,
oil and meal values will be influenced in particular by
changes in the production forecasts for soybeans in South
America and palm oil in Southeast Asia. Uncertainties
140
150
160
170
2016/17
2015/16
2014/15
SAJJMAMFJDNO
130
150
170
190
2014/15
2016/17
2015/16
SAJJMAMFJDNO
140
170
200
230
2015/16
2014/15
2016/17
SAJJMAMFJDNO
300
320
340
360
380
400
420
USD per tonne
S OJA M
March 2017 values March 2018 values
J A
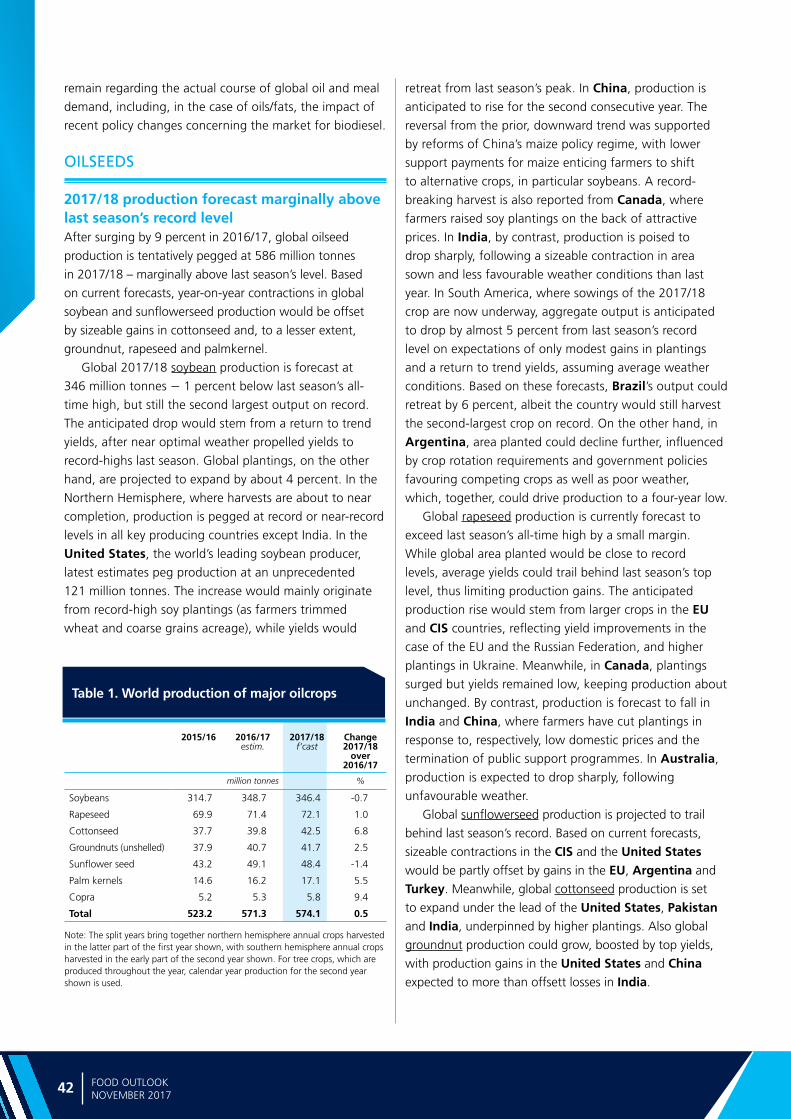
Ma
rke
t a
sse
ssm
en
ts
42 FOOD OUTLOOKNOVEMBER 2017
Note: The split years bring together northern hemisphere annual crops harvested in the latter part of the first year shown, with southern hemisphere annual crops harvested in the early part of the second year shown. For tree crops, which areproduced throughout the year, calendar year production for the second year shown is used.
2015/16 2016/17estim.
2017/18 f’cast
Change 2017/18
over 2016/17
million tonnes %
Soybeans 314.7 348.7 346.4 -0.7
Rapeseed 69.9 71.4 72.1 1.0
Cottonseed 37.7 39.8 42.5 6.8
Groundnuts (unshelled) 37.9 40.7 41.7 2.5
Sunflower seed 43.2 49.1 48.4 -1.4
Palm kernels 14.6 16.2 17.1 5.5
Copra 5.2 5.3 5.8 9.4
Total 523.2 571.3 574.1 0.5
Table 1. World production of major oilcrops
remain regarding the actual course of global oil and meal
demand, including, in the case of oils/fats, the impact of
recent policy changes concerning the market for biodiesel.
OILSEEDS
2017/18 production forecast marginally above last season’s record level After surging by 9 percent in 2016/17, global oilseed
production is tentatively pegged at 586 million tonnes
in 2017/18 – marginally above last season’s level. Based
on current forecasts, year-on-year contractions in global
soybean and sunflowerseed production would be offset
by sizeable gains in cottonseed and, to a lesser extent,
groundnut, rapeseed and palmkernel.
Global 2017/18 soybean production is forecast at
346 million tonnes — 1 percent below last season’s all-
time high, but still the second largest output on record.
The anticipated drop would stem from a return to trend
yields, after near optimal weather propelled yields to
record-highs last season. Global plantings, on the other
hand, are projected to expand by about 4 percent. In the
Northern Hemisphere, where harvests are about to near
completion, production is pegged at record or near-record
levels in all key producing countries except India. In the
United States, the world’s leading soybean producer,
latest estimates peg production at an unprecedented
121 million tonnes. The increase would mainly originate
from record-high soy plantings (as farmers trimmed
wheat and coarse grains acreage), while yields would
retreat from last season’s peak. In China, production is
anticipated to rise for the second consecutive year. The
reversal from the prior, downward trend was supported
by reforms of China’s maize policy regime, with lower
support payments for maize enticing farmers to shift
to alternative crops, in particular soybeans. A record-
breaking harvest is also reported from Canada, where
farmers raised soy plantings on the back of attractive
prices. In India, by contrast, production is poised to
drop sharply, following a sizeable contraction in area
sown and less favourable weather conditions than last
year. In South America, where sowings of the 2017/18
crop are now underway, aggregate output is anticipated
to drop by almost 5 percent from last season’s record
level on expectations of only modest gains in plantings
and a return to trend yields, assuming average weather
conditions. Based on these forecasts, Brazil’s output could
retreat by 6 percent, albeit the country would still harvest
the second-largest crop on record. On the other hand, in
Argentina, area planted could decline further, influenced
by crop rotation requirements and government policies
favouring competing crops as well as poor weather,
which, together, could drive production to a four-year low.
Global rapeseed production is currently forecast to
exceed last season’s all-time high by a small margin.
While global area planted would be close to record
levels, average yields could trail behind last season’s top
level, thus limiting production gains. The anticipated
production rise would stem from larger crops in the EU
and CIS countries, reflecting yield improvements in the
case of the EU and the Russian Federation, and higher
plantings in Ukraine. Meanwhile, in Canada, plantings
surged but yields remained low, keeping production about
unchanged. By contrast, production is forecast to fall in
India and China, where farmers have cut plantings in
response to, respectively, low domestic prices and the
termination of public support programmes. In Australia,
production is expected to drop sharply, following
unfavourable weather.
Global sunflowerseed production is projected to trail
behind last season’s record. Based on current forecasts,
sizeable contractions in the CIS and the United States
would be partly offset by gains in the EU, Argentina and
Turkey. Meanwhile, global cottonseed production is set
to expand under the lead of the United States, Pakistan
and India, underpinned by higher plantings. Also global
groundnut production could grow, boosted by top yields,
with production gains in the United States and China
expected to more than offsett losses in India.
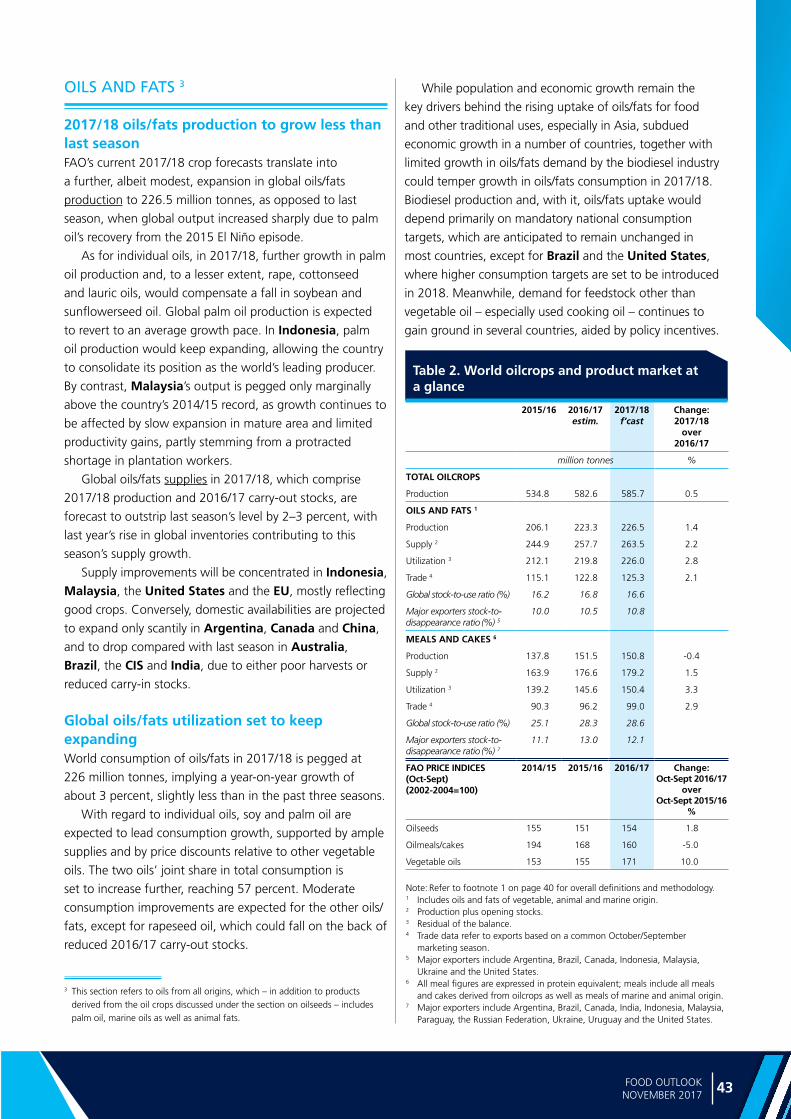
43FOOD OUTLOOK NOVEMBER 2017
Note: Refer to footnote 1 on page 40 for overall definitions and methodology.1 Includes oils and fats of vegetable, animal and marine origin.2 Production plus opening stocks.3 Residual of the balance.4 Trade data refer to exports based on a common October/September
marketing season.5 Major exporters include Argentina, Brazil, Canada, Indonesia, Malaysia,
Ukraine and the United States.6 All meal figures are expressed in protein equivalent; meals include all meals
and cakes derived from oilcrops as well as meals of marine and animal origin.7 Major exporters include Argentina, Brazil, Canada, India, Indonesia, Malaysia,
Paraguay, the Russian Federation, Ukraine, Uruguay and the United States.
Table 2. World oilcrops and product market ata glance
2015/16 2016/17 estim.
2017/18 f’cast
Change: 2017/18
over 2016/17
million tonnes %
TOTAL OILCROPS
Production 534.8 582.6 585.7 0.5
OILS AND FATS 1
Production 206.1 223.3 226.5 1.4
Supply 2 244.9 257.7 263.5 2.2
Utilization 3 212.1 219.8 226.0 2.8
Trade 4 115.1 122.8 125.3 2.1
Global stock-to-use ratio (%) 16.2 16.8 16.6
Major exporters stock-to-disappearance ratio (%) 5
10.0 10.5 10.8
MEALS AND CAKES 6
Production 137.8 151.5 150.8 -0.4
Supply 2 163.9 176.6 179.2 1.5
Utilization 3 139.2 145.6 150.4 3.3
Trade 4 90.3 96.2 99.0 2.9
Global stock-to-use ratio (%) 25.1 28.3 28.6
Major exporters stock-to-disappearance ratio (%) 7
11.1 13.0 12.1
FAO PRICE INDICES (Oct-Sept) (2002-2004=100)
2014/15 2015/16 2016/17 Change: Oct-Sept 2016/17
overOct-Sept 2015/16
%
Oilseeds 155 151 154 1.8
Oilmeals/cakes 194 168 160 -5.0
Vegetable oils 153 155 171 10.0
OILC
RO
PS, O
ILS AN
D M
EA
LS
OILS AND FATS 3
2017/18 oils/fats production to grow less than last seasonFAO’s current 2017/18 crop forecasts translate into
a further, albeit modest, expansion in global oils/fats
production to 226.5 million tonnes, as opposed to last
season, when global output increased sharply due to palm
oil’s recovery from the 2015 El Niño episode.
As for individual oils, in 2017/18, further growth in palm
oil production and, to a lesser extent, rape, cottonseed
and lauric oils, would compensate a fall in soybean and
sunflowerseed oil. Global palm oil production is expected
to revert to an average growth pace. In Indonesia, palm
oil production would keep expanding, allowing the country
to consolidate its position as the world’s leading producer.
By contrast, Malaysia’s output is pegged only marginally
above the country’s 2014/15 record, as growth continues to
be affected by slow expansion in mature area and limited
productivity gains, partly stemming from a protracted
shortage in plantation workers.
Global oils/fats supplies in 2017/18, which comprise
2017/18 production and 2016/17 carry-out stocks, are
forecast to outstrip last season’s level by 2–3 percent, with
last year’s rise in global inventories contributing to this
season’s supply growth.
Supply improvements will be concentrated in Indonesia,
Malaysia, the United States and the EU, mostly reflecting
good crops. Conversely, domestic availabilities are projected
to expand only scantily in Argentina, Canada and China, and to drop compared with last season in Australia, Brazil, the CIS and India, due to either poor harvests or
reduced carry-in stocks.
Global oils/fats utilization set to keep expanding World consumption of oils/fats in 2017/18 is pegged at
226 million tonnes, implying a year-on-year growth of
about 3 percent, slightly less than in the past three seasons.
With regard to individual oils, soy and palm oil are
expected to lead consumption growth, supported by ample
supplies and by price discounts relative to other vegetable
oils. The two oils’ joint share in total consumption is
set to increase further, reaching 57 percent. Moderate
consumption improvements are expected for the other oils/
fats, except for rapeseed oil, which could fall on the back of
reduced 2016/17 carry-out stocks.
While population and economic growth remain the
key drivers behind the rising uptake of oils/fats for food
and other traditional uses, especially in Asia, subdued
economic growth in a number of countries, together with
limited growth in oils/fats demand by the biodiesel industry
could temper growth in oils/fats consumption in 2017/18.
Biodiesel production and, with it, oils/fats uptake would
depend primarily on mandatory national consumption
targets, which are anticipated to remain unchanged in
most countries, except for Brazil and the United States,
where higher consumption targets are set to be introduced
in 2018. Meanwhile, demand for feedstock other than
vegetable oil – especially used cooking oil – continues to
gain ground in several countries, aided by policy incentives.
3 This section refers to oils from all origins, which – in addition to products derived from the oil crops discussed under the section on oilseeds – includes palm oil, marine oils as well as animal fats.
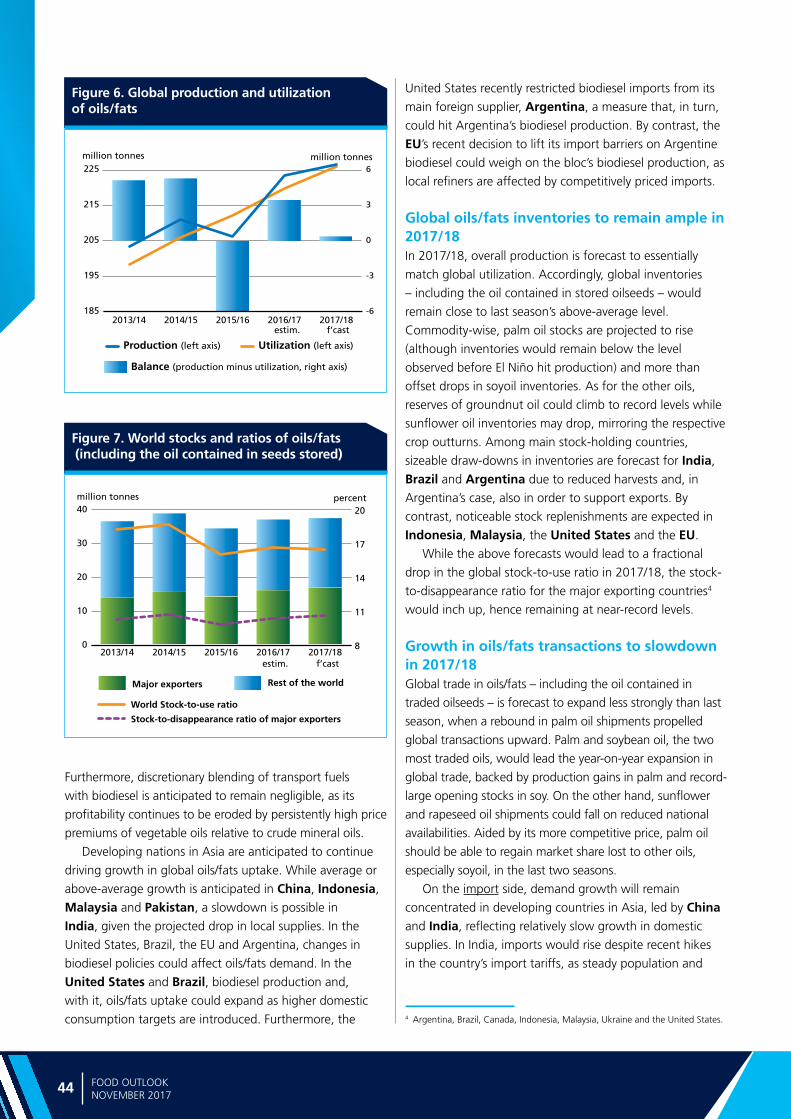
Ma
rke
t a
sse
ssm
en
ts
44 FOOD OUTLOOKNOVEMBER 2017
Figure 7. World stocks and ratios of oils/fats (including the oil contained in seeds stored)
Figure 6. Global production and utilizationof oils/fats
Furthermore, discretionary blending of transport fuels
with biodiesel is anticipated to remain negligible, as its
profitability continues to be eroded by persistently high price
premiums of vegetable oils relative to crude mineral oils.
Developing nations in Asia are anticipated to continue
driving growth in global oils/fats uptake. While average or
above-average growth is anticipated in China, Indonesia,
Malaysia and Pakistan, a slowdown is possible in
India, given the projected drop in local supplies. In the
United States, Brazil, the EU and Argentina, changes in
biodiesel policies could affect oils/fats demand. In the
United States and Brazil, biodiesel production and,
with it, oils/fats uptake could expand as higher domestic
consumption targets are introduced. Furthermore, the
United States recently restricted biodiesel imports from its
main foreign supplier, Argentina, a measure that, in turn,
could hit Argentina’s biodiesel production. By contrast, the
EU’s recent decision to lift its import barriers on Argentine
biodiesel could weigh on the bloc’s biodiesel production, as
local refiners are affected by competitively priced imports.
Global oils/fats inventories to remain ample in 2017/18 In 2017/18, overall production is forecast to essentially
match global utilization. Accordingly, global inventories
– including the oil contained in stored oilseeds – would
remain close to last season’s above-average level.
Commodity-wise, palm oil stocks are projected to rise
(although inventories would remain below the level
observed before El Niño hit production) and more than
offset drops in soyoil inventories. As for the other oils,
reserves of groundnut oil could climb to record levels while
sunflower oil inventories may drop, mirroring the respective
crop outturns. Among main stock-holding countries,
sizeable draw-downs in inventories are forecast for India,
Brazil and Argentina due to reduced harvests and, in
Argentina’s case, also in order to support exports. By
contrast, noticeable stock replenishments are expected in
Indonesia, Malaysia, the United States and the EU.
While the above forecasts would lead to a fractional
drop in the global stock-to-use ratio in 2017/18, the stock-
to-disappearance ratio for the major exporting countries4
would inch up, hence remaining at near-record levels.
Growth in oils/fats transactions to slowdown in 2017/18Global trade in oils/fats – including the oil contained in
traded oilseeds – is forecast to expand less strongly than last
season, when a rebound in palm oil shipments propelled
global transactions upward. Palm and soybean oil, the two
most traded oils, would lead the year-on-year expansion in
global trade, backed by production gains in palm and record-
large opening stocks in soy. On the other hand, sunflower
and rapeseed oil shipments could fall on reduced national
availabilities. Aided by its more competitive price, palm oil
should be able to regain market share lost to other oils,
especially soyoil, in the last two seasons.
On the import side, demand growth will remain
concentrated in developing countries in Asia, led by China
and India, reflecting relatively slow growth in domestic
supplies. In India, imports would rise despite recent hikes
in the country’s import tariffs, as steady population and
-6
-3
0
3
6
185
195
205
215
225
2017/182016/172015/162014/152013/14
million tonnes million tonnes
estim. f’cast
Balance (production minus utilization, right axis)
Production (left axis) Utilization (left axis)
0
10
20
30
40
2017/182016/172015/162014/152013/148
11
14
17
20
million tonnes percent
Major exporters Rest of the world
World Stock-to-use ratio
Stock-to-disappearance ratio of major exporters
estim. f’cast
4 Argentina, Brazil, Canada, Indonesia, Malaysia, Ukraine and the United States.
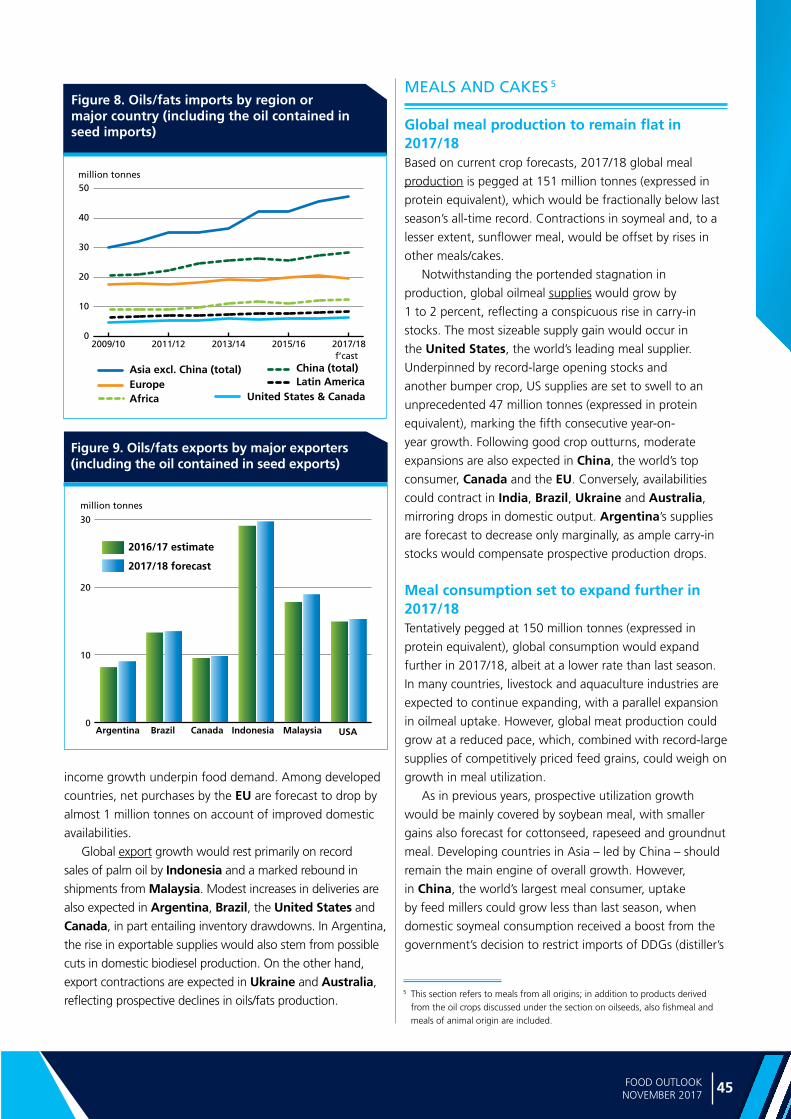
45FOOD OUTLOOK NOVEMBER 2017
Figure 8. Oils/fats imports by region or major country (including the oil contained in seed imports)
0
10
20
30
40
50
2017/182015/162013/142011/122009/10
Latin America Asia excl. China (total)Europe
China (total)
million tonnes
United States & CanadaAfrica
f’cast
OILC
RO
PS, O
ILS AN
D M
EA
LS
income growth underpin food demand. Among developed
countries, net purchases by the EU are forecast to drop by
almost 1 million tonnes on account of improved domestic
availabilities.
Global export growth would rest primarily on record
sales of palm oil by Indonesia and a marked rebound in
shipments from Malaysia. Modest increases in deliveries are
also expected in Argentina, Brazil, the United States and
Canada, in part entailing inventory drawdowns. In Argentina,
the rise in exportable supplies would also stem from possible
cuts in domestic biodiesel production. On the other hand,
export contractions are expected in Ukraine and Australia,
reflecting prospective declines in oils/fats production.
MEALS AND CAKES 5
Global meal production to remain flat in 2017/18Based on current crop forecasts, 2017/18 global meal
production is pegged at 151 million tonnes (expressed in
protein equivalent), which would be fractionally below last
season’s all-time record. Contractions in soymeal and, to a
lesser extent, sunflower meal, would be offset by rises in
other meals/cakes.
Notwithstanding the portended stagnation in
production, global oilmeal supplies would grow by
1 to 2 percent, reflecting a conspicuous rise in carry-in
stocks. The most sizeable supply gain would occur in
the United States, the world’s leading meal supplier.
Underpinned by record-large opening stocks and
another bumper crop, US supplies are set to swell to an
unprecedented 47 million tonnes (expressed in protein
equivalent), marking the fifth consecutive year-on-
year growth. Following good crop outturns, moderate
expansions are also expected in China, the world’s top
consumer, Canada and the EU. Conversely, availabilities
could contract in India, Brazil, Ukraine and Australia,
mirroring drops in domestic output. Argentina’s supplies
are forecast to decrease only marginally, as ample carry-in
stocks would compensate prospective production drops.
Meal consumption set to expand further in 2017/18 Tentatively pegged at 150 million tonnes (expressed in
protein equivalent), global consumption would expand
further in 2017/18, albeit at a lower rate than last season.
In many countries, livestock and aquaculture industries are
expected to continue expanding, with a parallel expansion
in oilmeal uptake. However, global meat production could
grow at a reduced pace, which, combined with record-large
supplies of competitively priced feed grains, could weigh on
growth in meal utilization.
As in previous years, prospective utilization growth
would be mainly covered by soybean meal, with smaller
gains also forecast for cottonseed, rapeseed and groundnut
meal. Developing countries in Asia – led by China – should
remain the main engine of overall growth. However,
in China, the world’s largest meal consumer, uptake
by feed millers could grow less than last season, when
domestic soymeal consumption received a boost from the
government’s decision to restrict imports of DDGs (distiller’s
Figure 9. Oils/fats exports by major exporters (including the oil contained in seed exports)
0
10
20
30
2017/18 forecast
2016/17 estimate
million tonnes
USAIndonesiaCanada MalaysiaArgentina Brazil
5 This section refers to meals from all origins; in addition to products derived from the oil crops discussed under the section on oilseeds, also fishmeal and meals of animal origin are included.
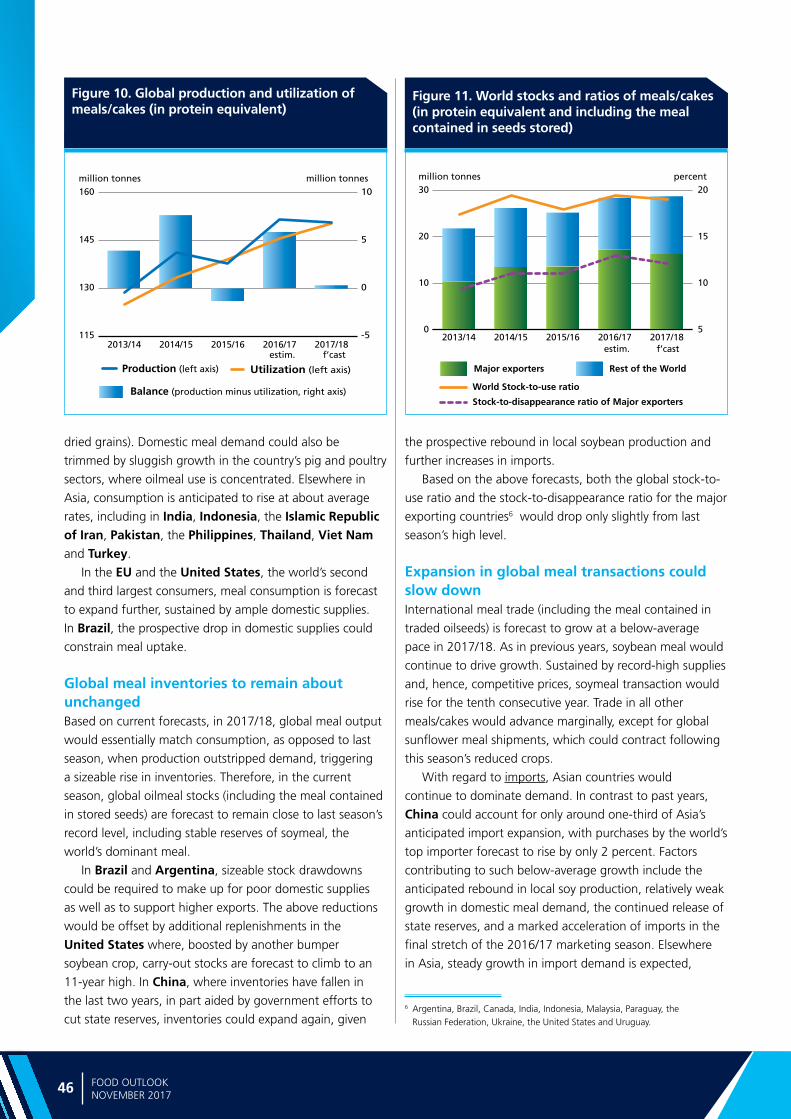
Ma
rke
t a
sse
ssm
en
ts
46 FOOD OUTLOOKNOVEMBER 2017
Figure 11. World stocks and ratios of meals/cakes (in protein equivalent and including the meal contained in seeds stored)
Figure 10. Global production and utilization of meals/cakes (in protein equivalent)
dried grains). Domestic meal demand could also be
trimmed by sluggish growth in the country’s pig and poultry
sectors, where oilmeal use is concentrated. Elsewhere in
Asia, consumption is anticipated to rise at about average
rates, including in India, Indonesia, the Islamic Republic of Iran, Pakistan, the Philippines, Thailand, Viet Nam
and Turkey.
In the EU and the United States, the world’s second
and third largest consumers, meal consumption is forecast
to expand further, sustained by ample domestic supplies.
In Brazil, the prospective drop in domestic supplies could
constrain meal uptake.
Global meal inventories to remain about unchangedBased on current forecasts, in 2017/18, global meal output
would essentially match consumption, as opposed to last
season, when production outstripped demand, triggering
a sizeable rise in inventories. Therefore, in the current
season, global oilmeal stocks (including the meal contained
in stored seeds) are forecast to remain close to last season’s
record level, including stable reserves of soymeal, the
world’s dominant meal.
In Brazil and Argentina, sizeable stock drawdowns
could be required to make up for poor domestic supplies
as well as to support higher exports. The above reductions
would be offset by additional replenishments in the
United States where, boosted by another bumper
soybean crop, carry-out stocks are forecast to climb to an
11-year high. In China, where inventories have fallen in
the last two years, in part aided by government efforts to
cut state reserves, inventories could expand again, given
the prospective rebound in local soybean production and
further increases in imports.
Based on the above forecasts, both the global stock-to-
use ratio and the stock-to-disappearance ratio for the major
exporting countries6 would drop only slightly from last
season’s high level.
Expansion in global meal transactions could slow downInternational meal trade (including the meal contained in
traded oilseeds) is forecast to grow at a below-average
pace in 2017/18. As in previous years, soybean meal would
continue to drive growth. Sustained by record-high supplies
and, hence, competitive prices, soymeal transaction would
rise for the tenth consecutive year. Trade in all other
meals/cakes would advance marginally, except for global
sunflower meal shipments, which could contract following
this season’s reduced crops.
With regard to imports, Asian countries would
continue to dominate demand. In contrast to past years,
China could account for only around one-third of Asia’s
anticipated import expansion, with purchases by the world’s
top importer forecast to rise by only 2 percent. Factors
contributing to such below-average growth include the
anticipated rebound in local soy production, relatively weak
growth in domestic meal demand, the continued release of
state reserves, and a marked acceleration of imports in the
final stretch of the 2016/17 marketing season. Elsewhere
in Asia, steady growth in import demand is expected,
-5
0
5
10
115
130
145
160
2017/182016/172015/162014/152013/14
million tonnes million tonnes
estim. f’cast
Balance (production minus utilization, right axis)
Production (left axis) Utilization (left axis)
0
10
20
30
2017/182016/172015/162014/152013/145
10
15
20million tonnes percent
Major exporters Rest of the World
World Stock-to-use ratio
Stock-to-disappearance ratio of Major exporters
estim. f’cast
6 Argentina, Brazil, Canada, India, Indonesia, Malaysia, Paraguay, the Russian Federation, Ukraine, the United States and Uruguay.
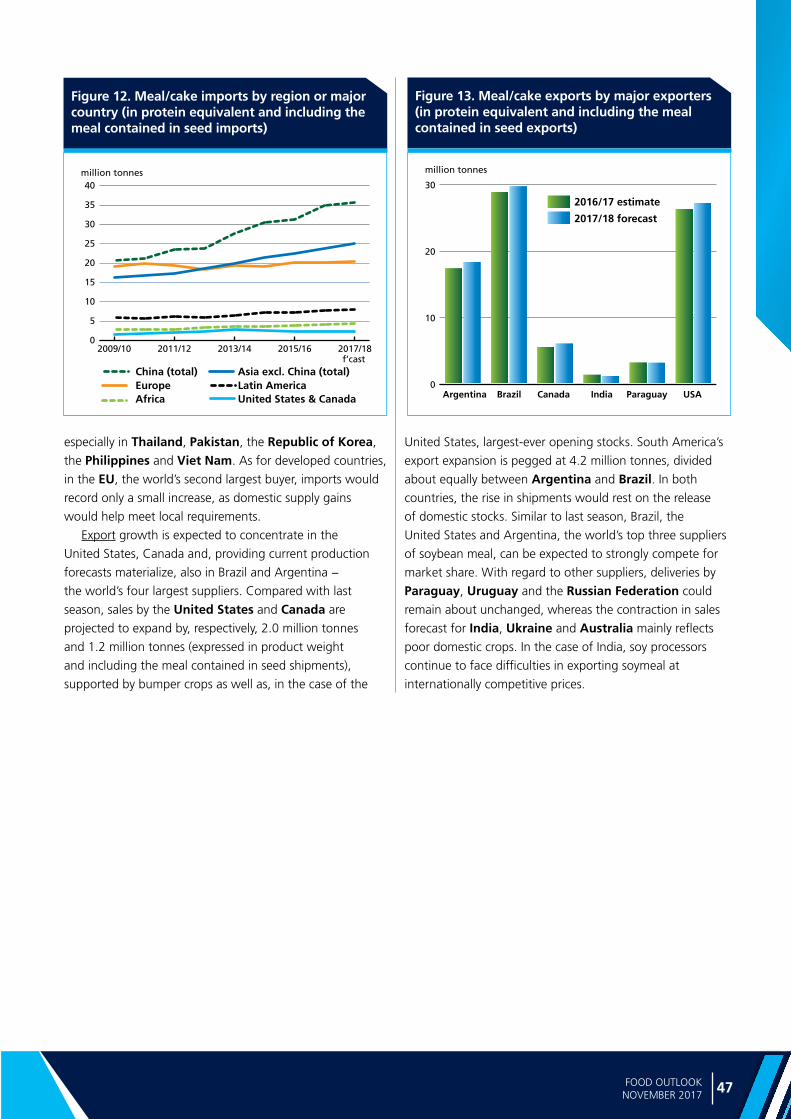
47FOOD OUTLOOK NOVEMBER 2017
Figure 12. Meal/cake imports by region or major country (in protein equivalent and including the meal contained in seed imports)
OILC
RO
PS, O
ILS AN
D M
EA
LS
Figure 13. Meal/cake exports by major exporters (in protein equivalent and including the meal contained in seed exports)
especially in Thailand, Pakistan, the Republic of Korea,
the Philippines and Viet Nam. As for developed countries,
in the EU, the world’s second largest buyer, imports would
record only a small increase, as domestic supply gains
would help meet local requirements.
Export growth is expected to concentrate in the
United States, Canada and, providing current production
forecasts materialize, also in Brazil and Argentina −
the world’s four largest suppliers. Compared with last
season, sales by the United States and Canada are
projected to expand by, respectively, 2.0 million tonnes
and 1.2 million tonnes (expressed in product weight
and including the meal contained in seed shipments),
supported by bumper crops as well as, in the case of the
United States, largest-ever opening stocks. South America’s
export expansion is pegged at 4.2 million tonnes, divided
about equally between Argentina and Brazil. In both
countries, the rise in shipments would rest on the release
of domestic stocks. Similar to last season, Brazil, the
United States and Argentina, the world’s top three suppliers
of soybean meal, can be expected to strongly compete for
market share. With regard to other suppliers, deliveries by
Paraguay, Uruguay and the Russian Federation could
remain about unchanged, whereas the contraction in sales
forecast for India, Ukraine and Australia mainly reflects
poor domestic crops. In the case of India, soy processors
continue to face difficulties in exporting soymeal at
internationally competitive prices.
0
5
10
15
20
25
30
35
40
2017/182015/162013/142011/122009/10
Latin America Asia excl. China (total)
EuropeChina (total)
million tonnes
United States & CanadaAfrica
f’cast
0
10
20
30
2016/17 estimate
2017/18 forecast
million tonnes
USACanada India ParaguayArgentina Brazil
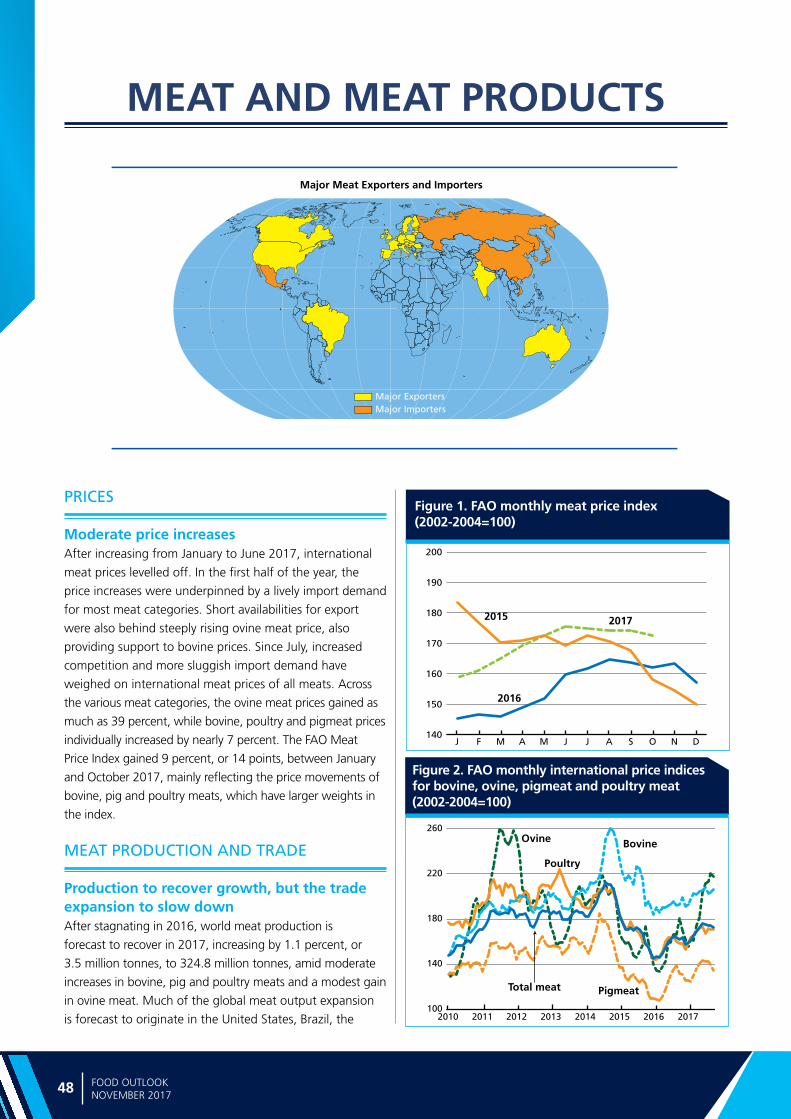
Ma
rke
t a
sse
ssm
en
ts
48 FOOD OUTLOOKNOVEMBER 2017
Figure 1. FAO monthly meat price index (2002-2004=100)
Figure 2. FAO monthly international price indices for bovine, ovine, pigmeat and poultry meat (2002-2004=100)
Major Meat Exporters and Importers
Major ExportersMajor Importers
MEAT AND MEAT PRODUCTS
PRICES
Moderate price increases After increasing from January to June 2017, international
meat prices levelled off. In the first half of the year, the
price increases were underpinned by a lively import demand
for most meat categories. Short availabilities for export
were also behind steeply rising ovine meat price, also
providing support to bovine prices. Since July, increased
competition and more sluggish import demand have
weighed on international meat prices of all meats. Across
the various meat categories, the ovine meat prices gained as
much as 39 percent, while bovine, poultry and pigmeat prices
individually increased by nearly 7 percent. The FAO Meat
Price Index gained 9 percent, or 14 points, between January
and October 2017, mainly reflecting the price movements of
bovine, pig and poultry meats, which have larger weights in
the index.
MEAT PRODUCTION AND TRADE
Production to recover growth, but the trade expansion to slow downAfter stagnating in 2016, world meat production is
forecast to recover in 2017, increasing by 1.1 percent, or
3.5 million tonnes, to 324.8 million tonnes, amid moderate
increases in bovine, pig and poultry meats and a modest gain
in ovine meat. Much of the global meat output expansion
is forecast to originate in the United States, Brazil, the
140
150
160
170
180
190
200
DNOSAJJMAMFJ
2015 2017
2016
100
140
180
220
260
20172016201520142013201220112010
Bovine
Poultry
Ovine
Total meat Pigmeat
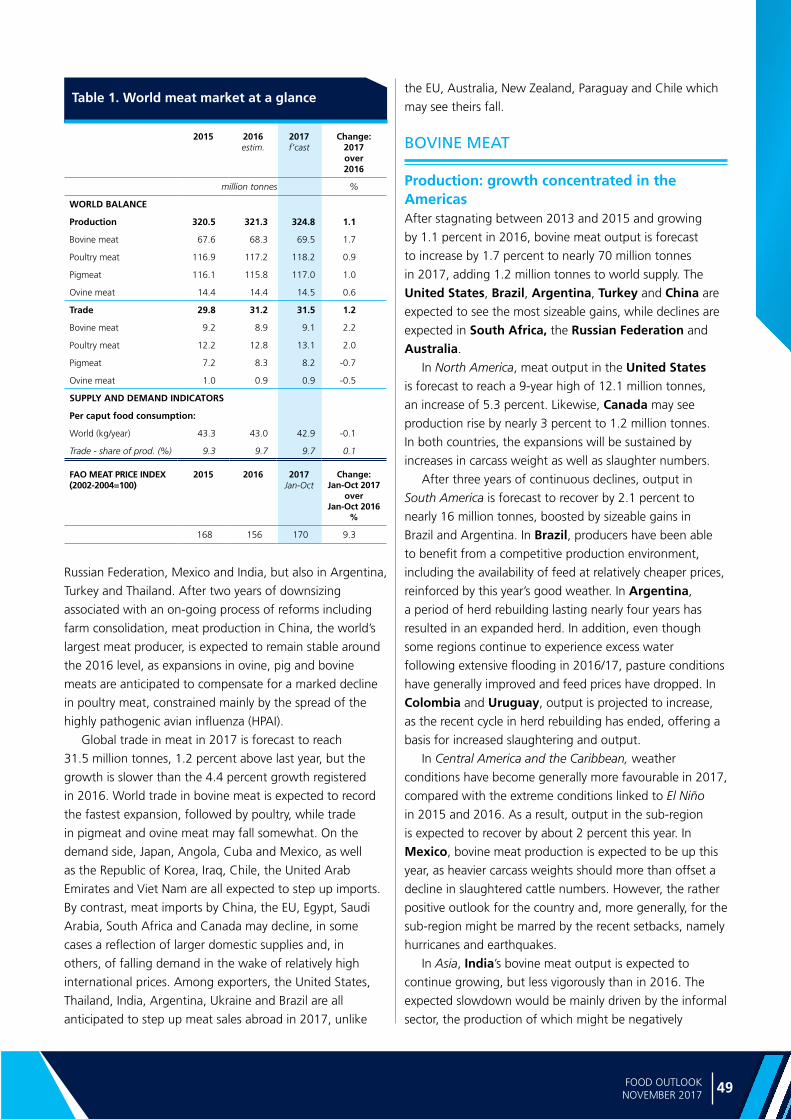
49FOOD OUTLOOK NOVEMBER 2017
ME
AT
AN
D M
EA
T P
RO
DU
CT
S
Table 1. World meat market at a glance
Russian Federation, Mexico and India, but also in Argentina,
Turkey and Thailand. After two years of downsizing
associated with an on-going process of reforms including
farm consolidation, meat production in China, the world’s
largest meat producer, is expected to remain stable around
the 2016 level, as expansions in ovine, pig and bovine
meats are anticipated to compensate for a marked decline
in poultry meat, constrained mainly by the spread of the
highly pathogenic avian influenza (HPAI).
Global trade in meat in 2017 is forecast to reach
31.5 million tonnes, 1.2 percent above last year, but the
growth is slower than the 4.4 percent growth registered
in 2016. World trade in bovine meat is expected to record
the fastest expansion, followed by poultry, while trade
in pigmeat and ovine meat may fall somewhat. On the
demand side, Japan, Angola, Cuba and Mexico, as well
as the Republic of Korea, Iraq, Chile, the United Arab
Emirates and Viet Nam are all expected to step up imports.
By contrast, meat imports by China, the EU, Egypt, Saudi
Arabia, South Africa and Canada may decline, in some
cases a reflection of larger domestic supplies and, in
others, of falling demand in the wake of relatively high
international prices. Among exporters, the United States,
Thailand, India, Argentina, Ukraine and Brazil are all
anticipated to step up meat sales abroad in 2017, unlike
the EU, Australia, New Zealand, Paraguay and Chile which
may see theirs fall.
BOVINE MEAT
Production: growth concentrated in the AmericasAfter stagnating between 2013 and 2015 and growing
by 1.1 percent in 2016, bovine meat output is forecast
to increase by 1.7 percent to nearly 70 million tonnes
in 2017, adding 1.2 million tonnes to world supply. The
United States, Brazil, Argentina, Turkey and China are
expected to see the most sizeable gains, while declines are
expected in South Africa, the Russian Federation and Australia.
In North America, meat output in the United States
is forecast to reach a 9-year high of 12.1 million tonnes,
an increase of 5.3 percent. Likewise, Canada may see
production rise by nearly 3 percent to 1.2 million tonnes.
In both countries, the expansions will be sustained by
increases in carcass weight as well as slaughter numbers.
After three years of continuous declines, output in
South America is forecast to recover by 2.1 percent to
nearly 16 million tonnes, boosted by sizeable gains in
Brazil and Argentina. In Brazil, producers have been able
to benefit from a competitive production environment,
including the availability of feed at relatively cheaper prices,
reinforced by this year’s good weather. In Argentina,
a period of herd rebuilding lasting nearly four years has
resulted in an expanded herd. In addition, even though
some regions continue to experience excess water
following extensive flooding in 2016/17, pasture conditions
have generally improved and feed prices have dropped. In
Colombia and Uruguay, output is projected to increase,
as the recent cycle in herd rebuilding has ended, offering a
basis for increased slaughtering and output.
In Central America and the Caribbean, weather
conditions have become generally more favourable in 2017,
compared with the extreme conditions linked to El Niño
in 2015 and 2016. As a result, output in the sub-region
is expected to recover by about 2 percent this year. In
Mexico, bovine meat production is expected to be up this
year, as heavier carcass weights should more than offset a
decline in slaughtered cattle numbers. However, the rather
positive outlook for the country and, more generally, for the
sub-region might be marred by the recent setbacks, namely
hurricanes and earthquakes.
In Asia, India’s bovine meat output is expected to
continue growing, but less vigorously than in 2016. The
expected slowdown would be mainly driven by the informal
sector, the production of which might be negatively
2015 2016estim.
2017f’cast
Change: 2017 over 2016
million tonnes %
WORLD BALANCE
Production 320.5 321.3 324.8 1.1
Bovine meat 67.6 68.3 69.5 1.7
Poultry meat 116.9 117.2 118.2 0.9
Pigmeat 116.1 115.8 117.0 1.0
Ovine meat 14.4 14.4 14.5 0.6
Trade 29.8 31.2 31.5 1.2
Bovine meat 9.2 8.9 9.1 2.2
Poultry meat 12.2 12.8 13.1 2.0
Pigmeat 7.2 8.3 8.2 -0.7
Ovine meat 1.0 0.9 0.9 -0.5
SUPPLY AND DEMAND INDICATORS
Per caput food consumption:
World (kg/year) 43.3 43.0 42.9 -0.1
Trade - share of prod. (%) 9.3 9.7 9.7 0.1
FAO MEAT PRICE INDEX(2002-2004=100)
2015 2016 2017 Jan-Oct
Change: Jan-Oct 2017
over Jan-Oct 2016
%
168 156 170 9.3
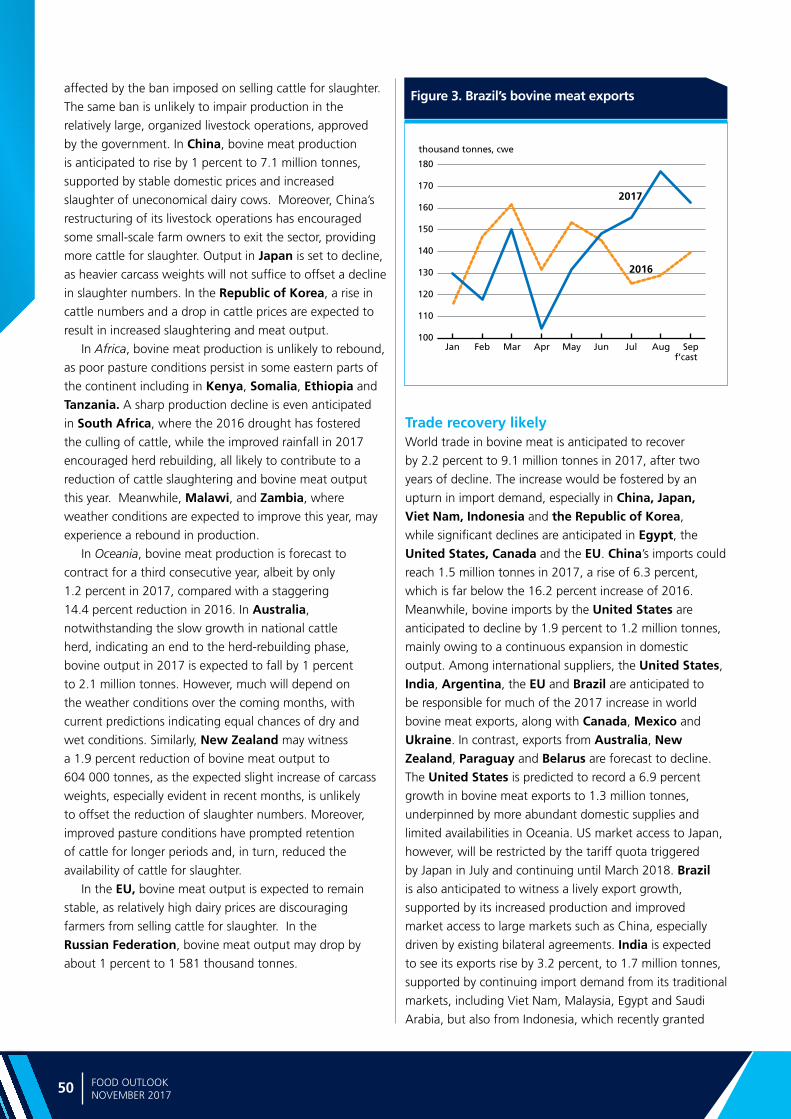
Ma
rke
t a
sse
ssm
en
ts
50 FOOD OUTLOOKNOVEMBER 2017
Figure 3. Brazil’s bovine meat exports
affected by the ban imposed on selling cattle for slaughter.
The same ban is unlikely to impair production in the
relatively large, organized livestock operations, approved
by the government. In China, bovine meat production
is anticipated to rise by 1 percent to 7.1 million tonnes,
supported by stable domestic prices and increased
slaughter of uneconomical dairy cows. Moreover, China’s
restructuring of its livestock operations has encouraged
some small-scale farm owners to exit the sector, providing
more cattle for slaughter. Output in Japan is set to decline,
as heavier carcass weights will not suffice to offset a decline
in slaughter numbers. In the Republic of Korea, a rise in
cattle numbers and a drop in cattle prices are expected to
result in increased slaughtering and meat output.
In Africa, bovine meat production is unlikely to rebound,
as poor pasture conditions persist in some eastern parts of
the continent including in Kenya, Somalia, Ethiopia and
Tanzania. A sharp production decline is even anticipated
in South Africa, where the 2016 drought has fostered
the culling of cattle, while the improved rainfall in 2017
encouraged herd rebuilding, all likely to contribute to a
reduction of cattle slaughtering and bovine meat output
this year. Meanwhile, Malawi, and Zambia, where
weather conditions are expected to improve this year, may
experience a rebound in production.
In Oceania, bovine meat production is forecast to
contract for a third consecutive year, albeit by only
1.2 percent in 2017, compared with a staggering
14.4 percent reduction in 2016. In Australia,
notwithstanding the slow growth in national cattle
herd, indicating an end to the herd-rebuilding phase,
bovine output in 2017 is expected to fall by 1 percent
to 2.1 million tonnes. However, much will depend on
the weather conditions over the coming months, with
current predictions indicating equal chances of dry and
wet conditions. Similarly, New Zealand may witness
a 1.9 percent reduction of bovine meat output to
604 000 tonnes, as the expected slight increase of carcass
weights, especially evident in recent months, is unlikely
to offset the reduction of slaughter numbers. Moreover,
improved pasture conditions have prompted retention
of cattle for longer periods and, in turn, reduced the
availability of cattle for slaughter.
In the EU, bovine meat output is expected to remain
stable, as relatively high dairy prices are discouraging
farmers from selling cattle for slaughter. In the
Russian Federation, bovine meat output may drop by
about 1 percent to 1 581 thousand tonnes.
Trade recovery likelyWorld trade in bovine meat is anticipated to recover
by 2.2 percent to 9.1 million tonnes in 2017, after two
years of decline. The increase would be fostered by an
upturn in import demand, especially in China, Japan, Viet Nam, Indonesia and the Republic of Korea,
while significant declines are anticipated in Egypt, the
United States, Canada and the EU. China’s imports could
reach 1.5 million tonnes in 2017, a rise of 6.3 percent,
which is far below the 16.2 percent increase of 2016.
Meanwhile, bovine imports by the United States are
anticipated to decline by 1.9 percent to 1.2 million tonnes,
mainly owing to a continuous expansion in domestic
output. Among international suppliers, the United States,
India, Argentina, the EU and Brazil are anticipated to
be responsible for much of the 2017 increase in world
bovine meat exports, along with Canada, Mexico and
Ukraine. In contrast, exports from Australia, New
Zealand, Paraguay and Belarus are forecast to decline.
The United States is predicted to record a 6.9 percent
growth in bovine meat exports to 1.3 million tonnes,
underpinned by more abundant domestic supplies and
limited availabilities in Oceania. US market access to Japan,
however, will be restricted by the tariff quota triggered
by Japan in July and continuing until March 2018. Brazil is also anticipated to witness a lively export growth,
supported by its increased production and improved
market access to large markets such as China, especially
driven by existing bilateral agreements. India is expected
to see its exports rise by 3.2 percent, to 1.7 million tonnes,
supported by continuing import demand from its traditional
markets, including Viet Nam, Malaysia, Egypt and Saudi
Arabia, but also from Indonesia, which recently granted
100
110
120
130
140
150
160
170
180
SepAugJulJunMayAprMarFebJan
2017
2016
f’cast
thousand tonnes, cwe
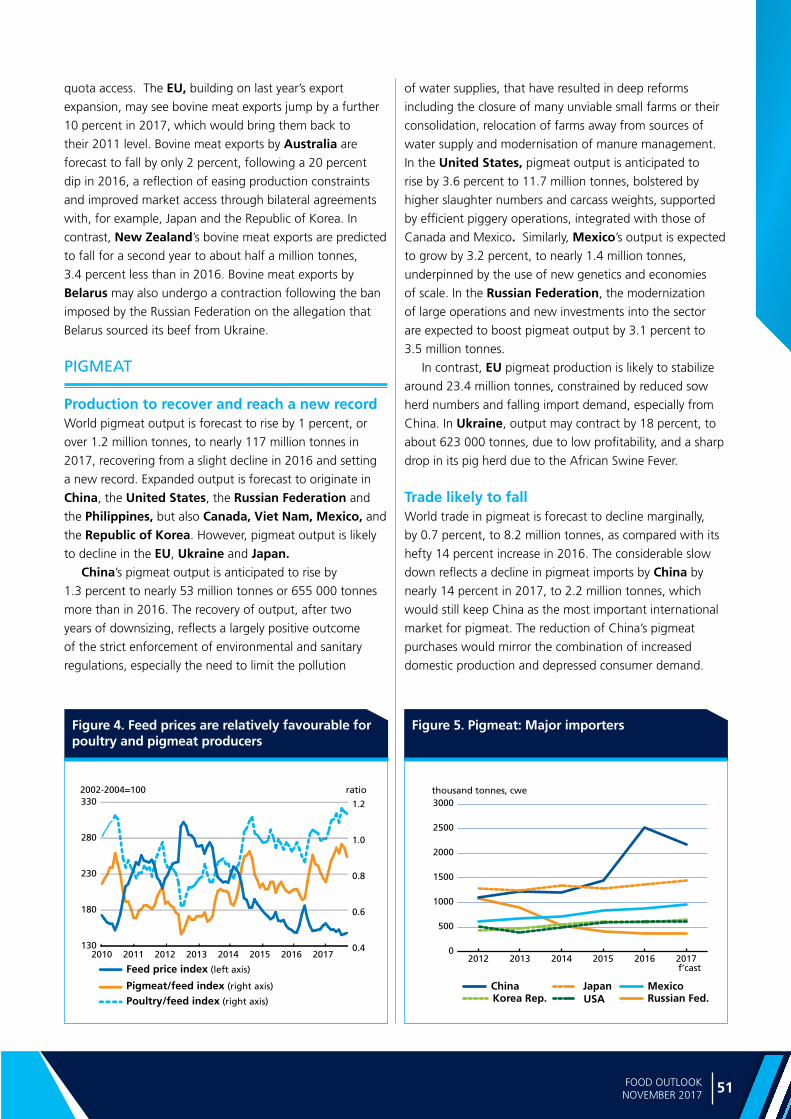
51FOOD OUTLOOK NOVEMBER 2017
ME
AT
AN
D M
EA
T P
RO
DU
CT
S
Figure 4. Feed prices are relatively favourable for poultry and pigmeat producers
Figure 5. Pigmeat: Major importers
quota access. The EU, building on last year’s export
expansion, may see bovine meat exports jump by a further
10 percent in 2017, which would bring them back to
their 2011 level. Bovine meat exports by Australia are
forecast to fall by only 2 percent, following a 20 percent
dip in 2016, a reflection of easing production constraints
and improved market access through bilateral agreements
with, for example, Japan and the Republic of Korea. In
contrast, New Zealand’s bovine meat exports are predicted
to fall for a second year to about half a million tonnes,
3.4 percent less than in 2016. Bovine meat exports by
Belarus may also undergo a contraction following the ban
imposed by the Russian Federation on the allegation that
Belarus sourced its beef from Ukraine.
PIGMEAT
Production to recover and reach a new record World pigmeat output is forecast to rise by 1 percent, or
over 1.2 million tonnes, to nearly 117 million tonnes in
2017, recovering from a slight decline in 2016 and setting
a new record. Expanded output is forecast to originate in
China, the United States, the Russian Federation and
the Philippines, but also Canada, Viet Nam, Mexico, and the Republic of Korea. However, pigmeat output is likely
to decline in the EU, Ukraine and Japan. China’s pigmeat output is anticipated to rise by
1.3 percent to nearly 53 million tonnes or 655 000 tonnes
more than in 2016. The recovery of output, after two
years of downsizing, reflects a largely positive outcome
of the strict enforcement of environmental and sanitary
regulations, especially the need to limit the pollution
of water supplies, that have resulted in deep reforms
including the closure of many unviable small farms or their
consolidation, relocation of farms away from sources of
water supply and modernisation of manure management.
In the United States, pigmeat output is anticipated to
rise by 3.6 percent to 11.7 million tonnes, bolstered by
higher slaughter numbers and carcass weights, supported
by efficient piggery operations, integrated with those of
Canada and Mexico. Similarly, Mexico’s output is expected
to grow by 3.2 percent, to nearly 1.4 million tonnes,
underpinned by the use of new genetics and economies
of scale. In the Russian Federation, the modernization
of large operations and new investments into the sector
are expected to boost pigmeat output by 3.1 percent to
3.5 million tonnes.
In contrast, EU pigmeat production is likely to stabilize
around 23.4 million tonnes, constrained by reduced sow
herd numbers and falling import demand, especially from
China. In Ukraine, output may contract by 18 percent, to
about 623 000 tonnes, due to low profitability, and a sharp
drop in its pig herd due to the African Swine Fever.
Trade likely to fallWorld trade in pigmeat is forecast to decline marginally,
by 0.7 percent, to 8.2 million tonnes, as compared with its
hefty 14 percent increase in 2016. The considerable slow
down reflects a decline in pigmeat imports by China by
nearly 14 percent in 2017, to 2.2 million tonnes, which
would still keep China as the most important international
market for pigmeat. The reduction of China’s pigmeat
purchases would mirror the combination of increased
domestic production and depressed consumer demand.
0.4
0.6
0.8
1.0
1.2
130
180
230
280
330
20172016201520142013201220112010
2002-2004=100 ratio
Feed price index (left axis)
Pigmeat/feed index (right axis)
Poultry/feed index (right axis)
0
500
1000
1500
2000
2500
3000
201720162015201420132012
China MexicoRussian Fed.
JapanUSAKorea Rep.
f’cast
thousand tonnes, cwe
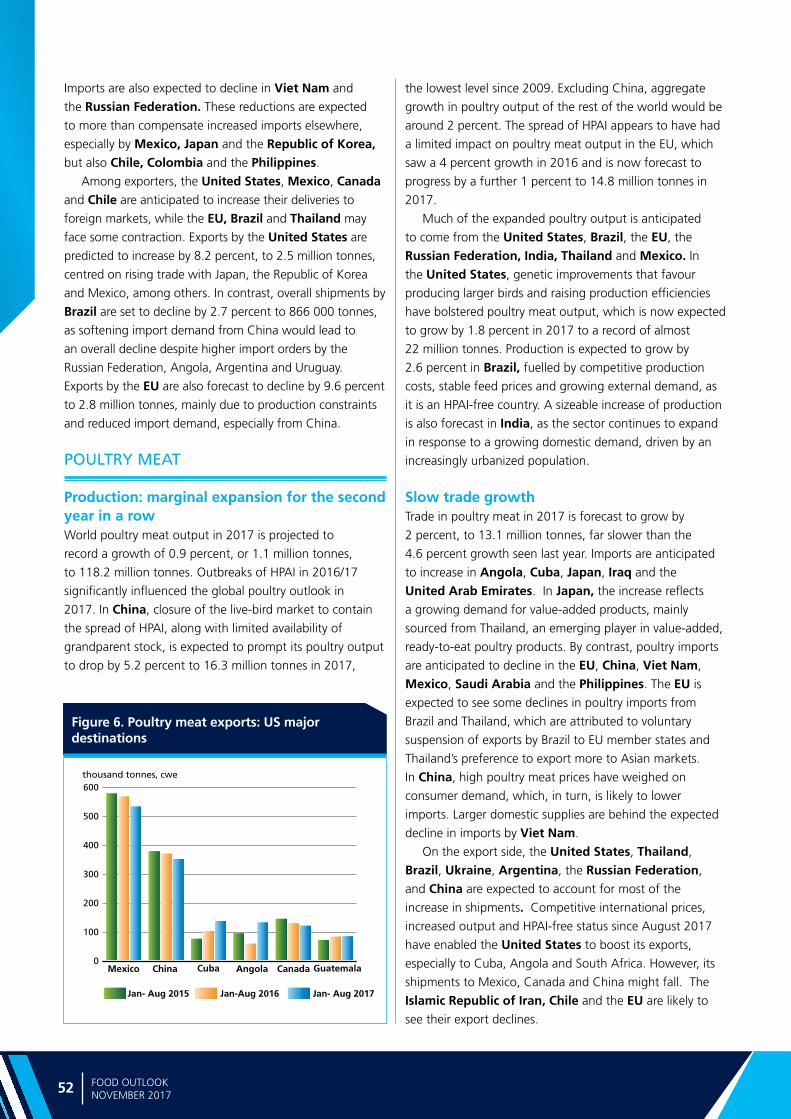
Ma
rke
t a
sse
ssm
en
ts
52 FOOD OUTLOOKNOVEMBER 2017
Figure 6. Poultry meat exports: US major destinations
Imports are also expected to decline in Viet Nam and
the Russian Federation. These reductions are expected
to more than compensate increased imports elsewhere,
especially by Mexico, Japan and the Republic of Korea, but also Chile, Colombia and the Philippines.
Among exporters, the United States, Mexico, Canada and Chile are anticipated to increase their deliveries to
foreign markets, while the EU, Brazil and Thailand may
face some contraction. Exports by the United States are
predicted to increase by 8.2 percent, to 2.5 million tonnes,
centred on rising trade with Japan, the Republic of Korea
and Mexico, among others. In contrast, overall shipments by
Brazil are set to decline by 2.7 percent to 866 000 tonnes,
as softening import demand from China would lead to
an overall decline despite higher import orders by the
Russian Federation, Angola, Argentina and Uruguay.
Exports by the EU are also forecast to decline by 9.6 percent
to 2.8 million tonnes, mainly due to production constraints
and reduced import demand, especially from China.
POULTRY MEAT
Production: marginal expansion for the second year in a rowWorld poultry meat output in 2017 is projected to
record a growth of 0.9 percent, or 1.1 million tonnes,
to 118.2 million tonnes. Outbreaks of HPAI in 2016/17
significantly influenced the global poultry outlook in
2017. In China, closure of the live-bird market to contain
the spread of HPAI, along with limited availability of
grandparent stock, is expected to prompt its poultry output
to drop by 5.2 percent to 16.3 million tonnes in 2017,
the lowest level since 2009. Excluding China, aggregate
growth in poultry output of the rest of the world would be
around 2 percent. The spread of HPAI appears to have had
a limited impact on poultry meat output in the EU, which
saw a 4 percent growth in 2016 and is now forecast to
progress by a further 1 percent to 14.8 million tonnes in
2017.
Much of the expanded poultry output is anticipated
to come from the United States, Brazil, the EU, the
Russian Federation, India, Thailand and Mexico. In
the United States, genetic improvements that favour
producing larger birds and raising production efficiencies
have bolstered poultry meat output, which is now expected
to grow by 1.8 percent in 2017 to a record of almost
22 million tonnes. Production is expected to grow by
2.6 percent in Brazil, fuelled by competitive production
costs, stable feed prices and growing external demand, as
it is an HPAI-free country. A sizeable increase of production
is also forecast in India, as the sector continues to expand
in response to a growing domestic demand, driven by an
increasingly urbanized population.
Slow trade growth Trade in poultry meat in 2017 is forecast to grow by
2 percent, to 13.1 million tonnes, far slower than the
4.6 percent growth seen last year. Imports are anticipated
to increase in Angola, Cuba, Japan, Iraq and the United Arab Emirates. In Japan, the increase reflects
a growing demand for value-added products, mainly
sourced from Thailand, an emerging player in value-added,
ready-to-eat poultry products. By contrast, poultry imports
are anticipated to decline in the EU, China, Viet Nam,
Mexico, Saudi Arabia and the Philippines. The EU is
expected to see some declines in poultry imports from
Brazil and Thailand, which are attributed to voluntary
suspension of exports by Brazil to EU member states and
Thailand’s preference to export more to Asian markets.
In China, high poultry meat prices have weighed on
consumer demand, which, in turn, is likely to lower
imports. Larger domestic supplies are behind the expected
decline in imports by Viet Nam.
On the export side, the United States, Thailand,
Brazil, Ukraine, Argentina, the Russian Federation,
and China are expected to account for most of the
increase in shipments. Competitive international prices,
increased output and HPAI-free status since August 2017
have enabled the United States to boost its exports,
especially to Cuba, Angola and South Africa. However, its
shipments to Mexico, Canada and China might fall. The
Islamic Republic of Iran, Chile and the EU are likely to
see their export declines.
0
100
200
300
400
500
600thousand tonnes, cwe
CubaMexico Angola CanadaChina
Jan- Aug 2015 Jan- Aug 2017Jan-Aug 2016
Guatemala
53FOOD OUTLOOK NOVEMBER 2017
ME
AT
AN
D M
EA
T P
RO
DU
CT
S
OVINE MEAT
Production continued modest growth Ovine meat production is forecast to increase by a modest
0.6 percent, to 14.5 million tonnes, confirming a trend
of small year-to-year gains. Asia and Africa account for
80 percent of production, and where traditional systems
are largely dominant. China, India, Pakistan, Nigeria, Algeria and countries of sub-Saharan Africa (SSA) are
among the largest ovine meat producers, but output in
Oceania continues to play the most critical role in world
trade. In 2017, as in the preceding two years, outputs
in both Australia and New Zealand have come under
pressure which may depress their joint output by as much
as 3.8 percent, despite a positive performance in the first
half of 2017. The contraction is expected to arise from the
process of herd rebuilding, which reduced the number of
lambs available for slaughtering. Meanwhile, in the EU,
output is projected to grow by 2.6 percent.
Trade to contract marginallyWorld trade in ovine meat is forecast to fall marginally in
2017, to 905 000 tonnes, 0.5 percent less than in 2016.
The small decline principally reflects a nearly 2 percent
decrease of exports from Australia and New Zealand,
primarily due to supply constraints. Import demand is
expected to rise slightly across main markets, especially in
China, Saudi Arabia and Malaysia, but to fall in the EU.
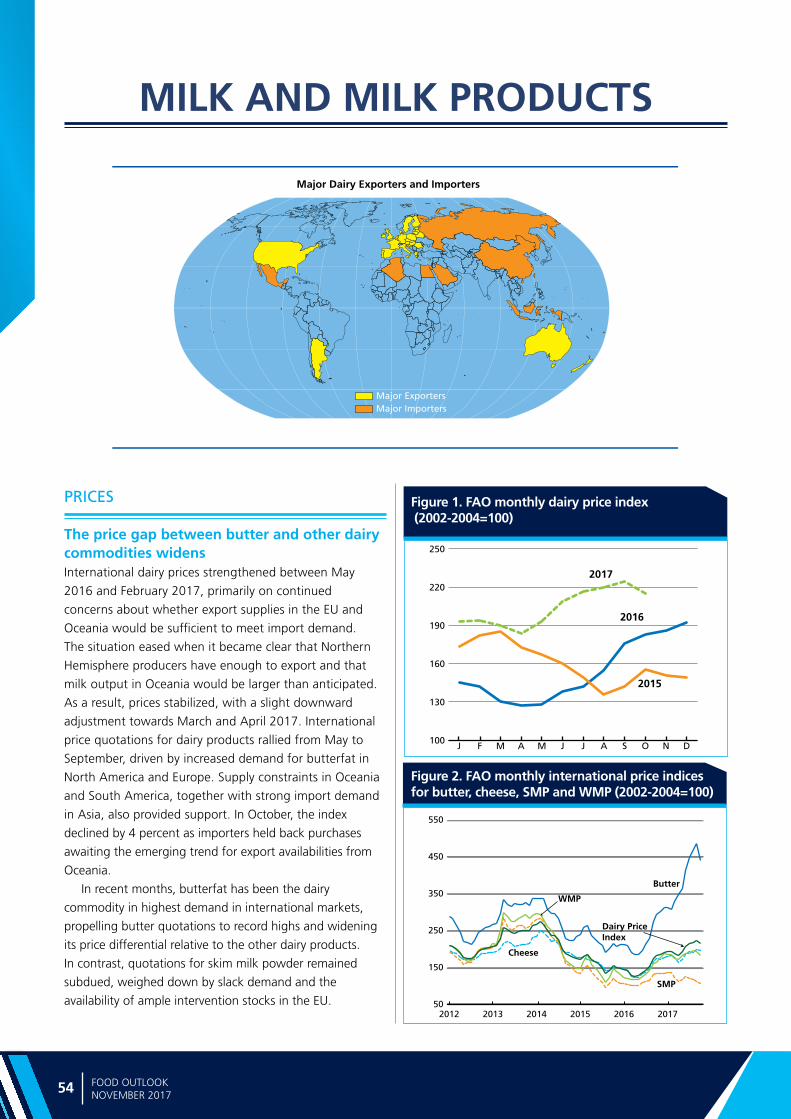
Ma
rke
t a
sse
ssm
en
ts
54 FOOD OUTLOOKNOVEMBER 2017
Major Dairy Exporters and Importers
Major ExportersMajor Importers
MILK AND MILK PRODUCTS
PRICES
The price gap between butter and other dairy commodities widens International dairy prices strengthened between May
2016 and February 2017, primarily on continued
concerns about whether export supplies in the EU and
Oceania would be sufficient to meet import demand.
The situation eased when it became clear that Northern
Hemisphere producers have enough to export and that
milk output in Oceania would be larger than anticipated.
As a result, prices stabilized, with a slight downward
adjustment towards March and April 2017. International
price quotations for dairy products rallied from May to
September, driven by increased demand for butterfat in
North America and Europe. Supply constraints in Oceania
and South America, together with strong import demand
in Asia, also provided support. In October, the index
declined by 4 percent as importers held back purchases
awaiting the emerging trend for export availabilities from
Oceania.
In recent months, butterfat has been the dairy
commodity in highest demand in international markets,
propelling butter quotations to record highs and widening
its price differential relative to the other dairy products.
In contrast, quotations for skim milk powder remained
subdued, weighed down by slack demand and the
availability of ample intervention stocks in the EU.
100
130
160
190
220
250
DNOSAJJMAMFJ
2016
2017
2015
50
150
250
350
450
550
201720162015201420132012
Butter
Cheese
WMP
SMP
Dairy PriceIndex
Figure 2. FAO monthly international price indices for butter, cheese, SMP and WMP (2002-2004=100)
Figure 1. FAO monthly dairy price index (2002-2004=100)
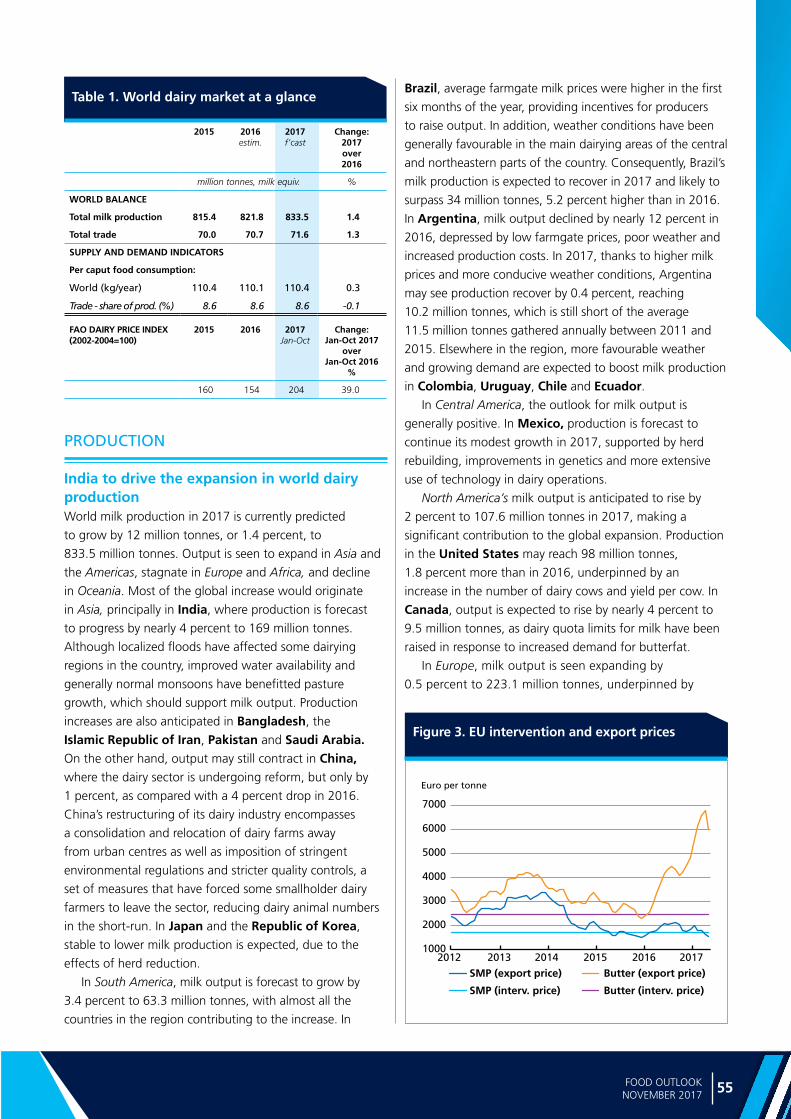
55FOOD OUTLOOK NOVEMBER 2017
MILK
AN
D M
ILK P
RO
DU
CT
S
Table 1. World dairy market at a glance
Figure 3. EU intervention and export prices
PRODUCTION
India to drive the expansion in world dairy production World milk production in 2017 is currently predicted
to grow by 12 million tonnes, or 1.4 percent, to
833.5 million tonnes. Output is seen to expand in Asia and
the Americas, stagnate in Europe and Africa, and decline
in Oceania. Most of the global increase would originate
in Asia, principally in India, where production is forecast
to progress by nearly 4 percent to 169 million tonnes.
Although localized floods have affected some dairying
regions in the country, improved water availability and
generally normal monsoons have benefitted pasture
growth, which should support milk output. Production
increases are also anticipated in Bangladesh, the
Islamic Republic of Iran, Pakistan and Saudi Arabia. On the other hand, output may still contract in China, where the dairy sector is undergoing reform, but only by
1 percent, as compared with a 4 percent drop in 2016.
China’s restructuring of its dairy industry encompasses
a consolidation and relocation of dairy farms away
from urban centres as well as imposition of stringent
environmental regulations and stricter quality controls, a
set of measures that have forced some smallholder dairy
farmers to leave the sector, reducing dairy animal numbers
in the short-run. In Japan and the Republic of Korea,
stable to lower milk production is expected, due to the
effects of herd reduction.
In South America, milk output is forecast to grow by
3.4 percent to 63.3 million tonnes, with almost all the
countries in the region contributing to the increase. In
Brazil, average farmgate milk prices were higher in the first
six months of the year, providing incentives for producers
to raise output. In addition, weather conditions have been
generally favourable in the main dairying areas of the central
and northeastern parts of the country. Consequently, Brazil’s
milk production is expected to recover in 2017 and likely to
surpass 34 million tonnes, 5.2 percent higher than in 2016.
In Argentina, milk output declined by nearly 12 percent in
2016, depressed by low farmgate prices, poor weather and
increased production costs. In 2017, thanks to higher milk
prices and more conducive weather conditions, Argentina
may see production recover by 0.4 percent, reaching
10.2 million tonnes, which is still short of the average
11.5 million tonnes gathered annually between 2011 and
2015. Elsewhere in the region, more favourable weather
and growing demand are expected to boost milk production
in Colombia, Uruguay, Chile and Ecuador. In Central America, the outlook for milk output is
generally positive. In Mexico, production is forecast to
continue its modest growth in 2017, supported by herd
rebuilding, improvements in genetics and more extensive
use of technology in dairy operations.
North America’s milk output is anticipated to rise by
2 percent to 107.6 million tonnes in 2017, making a
significant contribution to the global expansion. Production
in the United States may reach 98 million tonnes,
1.8 percent more than in 2016, underpinned by an
increase in the number of dairy cows and yield per cow. In
Canada, output is expected to rise by nearly 4 percent to
9.5 million tonnes, as dairy quota limits for milk have been
raised in response to increased demand for butterfat.
In Europe, milk output is seen expanding by
0.5 percent to 223.1 million tonnes, underpinned by
2015 2016estim.
2017f’cast
Change: 2017 over 2016
million tonnes, milk equiv. %
WORLD BALANCE
Total milk production 815.4 821.8 833.5 1.4
Total trade 70.0 70.7 71.6 1.3
SUPPLY AND DEMAND INDICATORS
Per caput food consumption:
World (kg/year) 110.4 110.1 110.4 0.3
Trade - share of prod. (%) 8.6 8.6 8.6 -0.1
FAO DAIRY PRICE INDEX(2002-2004=100)
2015 2016 2017 Jan-Oct
Change: Jan-Oct 2017
over Jan-Oct 2016
%
160 154 204 39.0
1000
2000
3000
4000
5000
6000
7000
201720162015201420132012
SMP (interv. price)
SMP (export price) Butter (export price)
Butter (interv. price)
Euro per tonne
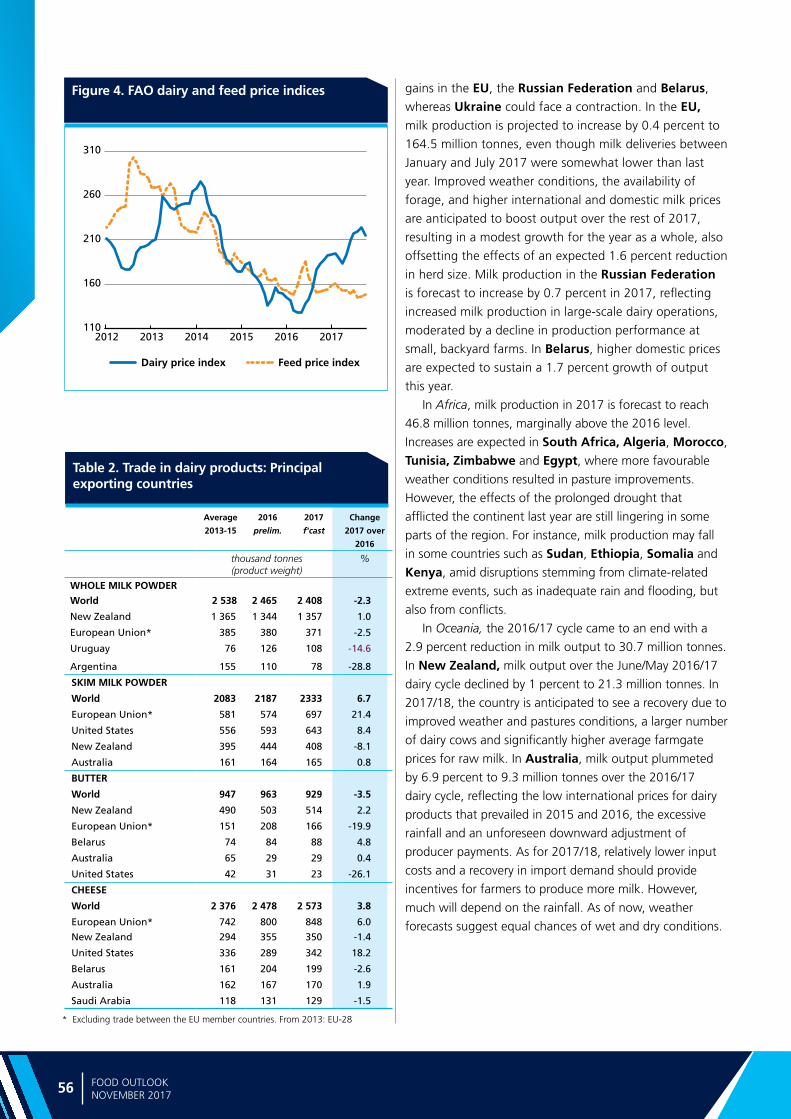
Ma
rke
t a
sse
ssm
en
ts
56 FOOD OUTLOOKNOVEMBER 2017
Figure 4. FAO dairy and feed price indices
Average
2013-15
2016
prelim.
2017
f'cast
Change
2017 over
2016
thousand tonnes (product weight)
%
WHOLE MILK POWDER
World 2 538 2 465 2 408 -2.3
New Zealand 1 365 1 344 1 357 1.0
European Union* 385 380 371 -2.5
Uruguay 76 126 108 -14.6
Argentina 155 110 78 -28.8
SKIM MILK POWDER
World 2083 2187 2333 6.7
European Union* 581 574 697 21.4
United States 556 593 643 8.4
New Zealand 395 444 408 -8.1
Australia 161 164 165 0.8
BUTTER
World 947 963 929 -3.5
New Zealand 490 503 514 2.2
European Union* 151 208 166 -19.9
Belarus 74 84 88 4.8
Australia 65 29 29 0.4
United States 42 31 23 -26.1
CHEESE
World 2 376 2 478 2 573 3.8
European Union* 742 800 848 6.0
New Zealand 294 355 350 -1.4
United States 336 289 342 18.2
Belarus 161 204 199 -2.6
Australia 162 167 170 1.9
Saudi Arabia 118 131 129 -1.5
Table 2. Trade in dairy products: Principal exporting countries
* Excluding trade between the EU member countries. From 2013: EU-28
gains in the EU, the Russian Federation and Belarus,
whereas Ukraine could face a contraction. In the EU, milk production is projected to increase by 0.4 percent to
164.5 million tonnes, even though milk deliveries between
January and July 2017 were somewhat lower than last
year. Improved weather conditions, the availability of
forage, and higher international and domestic milk prices
are anticipated to boost output over the rest of 2017,
resulting in a modest growth for the year as a whole, also
offsetting the effects of an expected 1.6 percent reduction
in herd size. Milk production in the Russian Federation
is forecast to increase by 0.7 percent in 2017, reflecting
increased milk production in large-scale dairy operations,
moderated by a decline in production performance at
small, backyard farms. In Belarus, higher domestic prices
are expected to sustain a 1.7 percent growth of output
this year.
In Africa, milk production in 2017 is forecast to reach
46.8 million tonnes, marginally above the 2016 level.
Increases are expected in South Africa, Algeria, Morocco,
Tunisia, Zimbabwe and Egypt, where more favourable
weather conditions resulted in pasture improvements.
However, the effects of the prolonged drought that
afflicted the continent last year are still lingering in some
parts of the region. For instance, milk production may fall
in some countries such as Sudan, Ethiopia, Somalia and
Kenya, amid disruptions stemming from climate-related
extreme events, such as inadequate rain and flooding, but
also from conflicts.
In Oceania, the 2016/17 cycle came to an end with a
2.9 percent reduction in milk output to 30.7 million tonnes.
In New Zealand, milk output over the June/May 2016/17
dairy cycle declined by 1 percent to 21.3 million tonnes. In
2017/18, the country is anticipated to see a recovery due to
improved weather and pastures conditions, a larger number
of dairy cows and significantly higher average farmgate
prices for raw milk. In Australia, milk output plummeted
by 6.9 percent to 9.3 million tonnes over the 2016/17
dairy cycle, reflecting the low international prices for dairy
products that prevailed in 2015 and 2016, the excessive
rainfall and an unforeseen downward adjustment of
producer payments. As for 2017/18, relatively lower input
costs and a recovery in import demand should provide
incentives for farmers to produce more milk. However,
much will depend on the rainfall. As of now, weather
forecasts suggest equal chances of wet and dry conditions.
110
160
210
260
310
201720162015201420132012
Dairy price index Feed price index
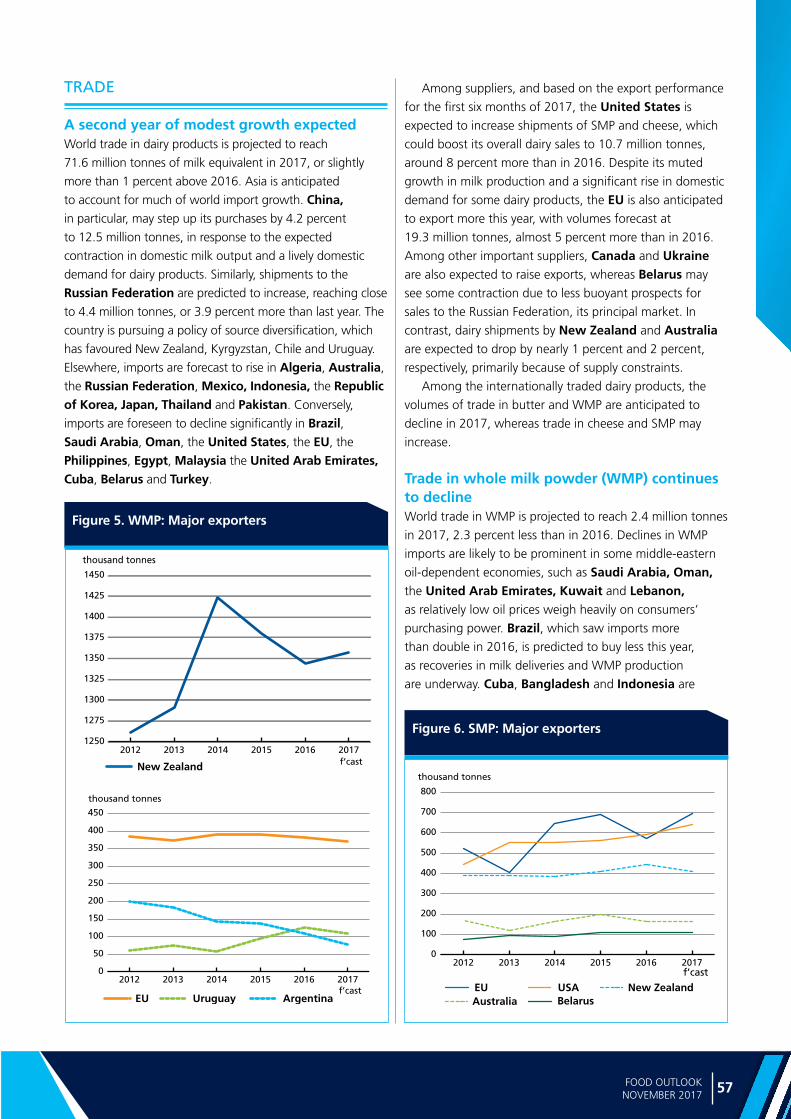
57FOOD OUTLOOK NOVEMBER 2017
MILK
AN
D M
ILK P
RO
DU
CT
S
Figure 5. WMP: Major exporters
Figure 6. SMP: Major exporters
TRADE
A second year of modest growth expected World trade in dairy products is projected to reach
71.6 million tonnes of milk equivalent in 2017, or slightly
more than 1 percent above 2016. Asia is anticipated
to account for much of world import growth. China, in particular, may step up its purchases by 4.2 percent
to 12.5 million tonnes, in response to the expected
contraction in domestic milk output and a lively domestic
demand for dairy products. Similarly, shipments to the
Russian Federation are predicted to increase, reaching close
to 4.4 million tonnes, or 3.9 percent more than last year. The
country is pursuing a policy of source diversification, which
has favoured New Zealand, Kyrgyzstan, Chile and Uruguay.
Elsewhere, imports are forecast to rise in Algeria, Australia,
the Russian Federation, Mexico, Indonesia, the Republic of Korea, Japan, Thailand and Pakistan. Conversely,
imports are foreseen to decline significantly in Brazil, Saudi Arabia, Oman, the United States, the EU, the
Philippines, Egypt, Malaysia the United Arab Emirates, Cuba, Belarus and Turkey.
Among suppliers, and based on the export performance
for the first six months of 2017, the United States is
expected to increase shipments of SMP and cheese, which
could boost its overall dairy sales to 10.7 million tonnes,
around 8 percent more than in 2016. Despite its muted
growth in milk production and a significant rise in domestic
demand for some dairy products, the EU is also anticipated
to export more this year, with volumes forecast at
19.3 million tonnes, almost 5 percent more than in 2016.
Among other important suppliers, Canada and Ukraine
are also expected to raise exports, whereas Belarus may
see some contraction due to less buoyant prospects for
sales to the Russian Federation, its principal market. In
contrast, dairy shipments by New Zealand and Australia
are expected to drop by nearly 1 percent and 2 percent,
respectively, primarily because of supply constraints.
Among the internationally traded dairy products, the
volumes of trade in butter and WMP are anticipated to
decline in 2017, whereas trade in cheese and SMP may
increase.
Trade in whole milk powder (WMP) continues to declineWorld trade in WMP is projected to reach 2.4 million tonnes
in 2017, 2.3 percent less than in 2016. Declines in WMP
imports are likely to be prominent in some middle-eastern
oil-dependent economies, such as Saudi Arabia, Oman, the United Arab Emirates, Kuwait and Lebanon, as relatively low oil prices weigh heavily on consumers’
purchasing power. Brazil, which saw imports more
than double in 2016, is predicted to buy less this year,
as recoveries in milk deliveries and WMP production
are underway. Cuba, Bangladesh and Indonesia are
0
50
100
150
200
250
300
350
400
450
201720162015201420132012
ArgentinaUruguayEUf’cast
thousand tonnes
1250
1275
1300
1325
1350
1375
1400
1425
1450
201720162015201420132012
New Zealand f’cast
thousand tonnes
0
100
200
300
400
500
600
700
800
201720162015201420132012
EU USA New ZealandBelarusAustralia
f’cast
thousand tonnes
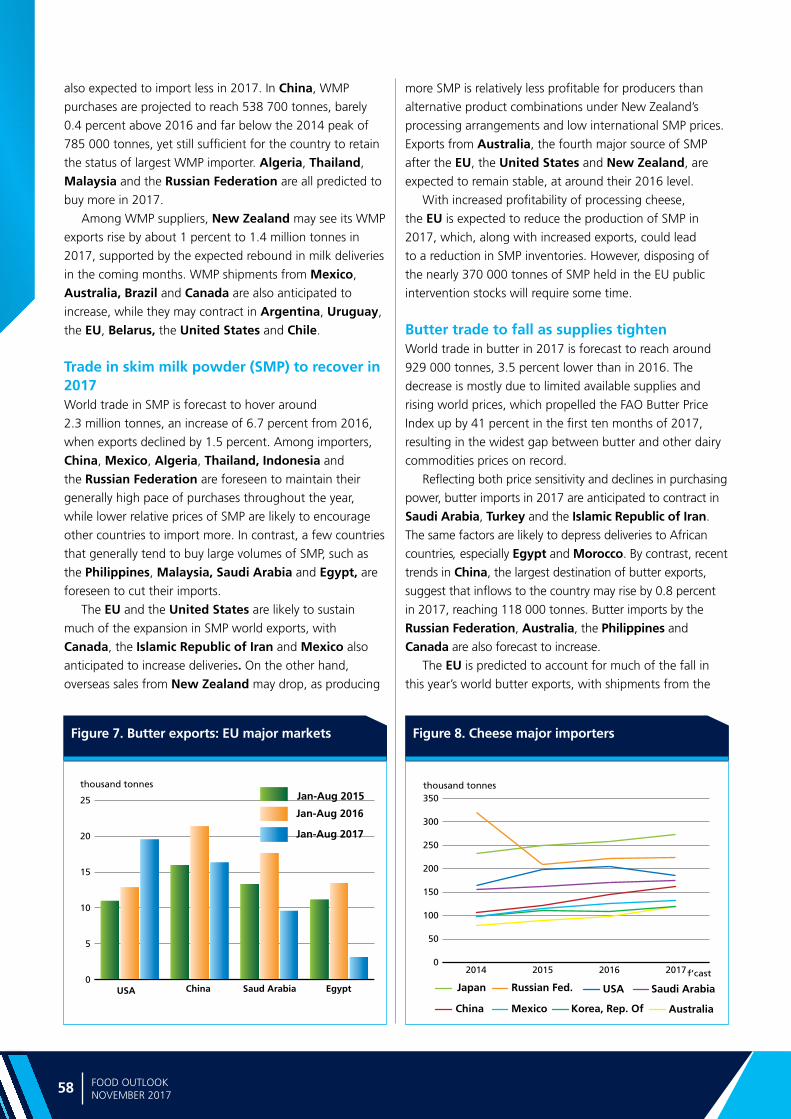
Ma
rke
t a
sse
ssm
en
ts
58 FOOD OUTLOOKNOVEMBER 2017
Figure 8. Cheese major importersFigure 7. Butter exports: EU major markets
also expected to import less in 2017. In China, WMP
purchases are projected to reach 538 700 tonnes, barely
0.4 percent above 2016 and far below the 2014 peak of
785 000 tonnes, yet still sufficient for the country to retain
the status of largest WMP importer. Algeria, Thailand,
Malaysia and the Russian Federation are all predicted to
buy more in 2017.
Among WMP suppliers, New Zealand may see its WMP
exports rise by about 1 percent to 1.4 million tonnes in
2017, supported by the expected rebound in milk deliveries
in the coming months. WMP shipments from Mexico,
Australia, Brazil and Canada are also anticipated to
increase, while they may contract in Argentina, Uruguay,
the EU, Belarus, the United States and Chile.
Trade in skim milk powder (SMP) to recover in 2017World trade in SMP is forecast to hover around
2.3 million tonnes, an increase of 6.7 percent from 2016,
when exports declined by 1.5 percent. Among importers,
China, Mexico, Algeria, Thailand, Indonesia and
the Russian Federation are foreseen to maintain their
generally high pace of purchases throughout the year,
while lower relative prices of SMP are likely to encourage
other countries to import more. In contrast, a few countries
that generally tend to buy large volumes of SMP, such as
the Philippines, Malaysia, Saudi Arabia and Egypt, are
foreseen to cut their imports.
The EU and the United States are likely to sustain
much of the expansion in SMP world exports, with
Canada, the Islamic Republic of Iran and Mexico also
anticipated to increase deliveries. On the other hand,
overseas sales from New Zealand may drop, as producing
more SMP is relatively less profitable for producers than
alternative product combinations under New Zealand’s
processing arrangements and low international SMP prices.
Exports from Australia, the fourth major source of SMP
after the EU, the United States and New Zealand, are
expected to remain stable, at around their 2016 level.
With increased profitability of processing cheese,
the EU is expected to reduce the production of SMP in
2017, which, along with increased exports, could lead
to a reduction in SMP inventories. However, disposing of
the nearly 370 000 tonnes of SMP held in the EU public
intervention stocks will require some time.
Butter trade to fall as supplies tightenWorld trade in butter in 2017 is forecast to reach around
929 000 tonnes, 3.5 percent lower than in 2016. The
decrease is mostly due to limited available supplies and
rising world prices, which propelled the FAO Butter Price
Index up by 41 percent in the first ten months of 2017,
resulting in the widest gap between butter and other dairy
commodities prices on record.
Reflecting both price sensitivity and declines in purchasing
power, butter imports in 2017 are anticipated to contract in
Saudi Arabia, Turkey and the Islamic Republic of Iran.
The same factors are likely to depress deliveries to African
countries, especially Egypt and Morocco. By contrast, recent
trends in China, the largest destination of butter exports,
suggest that inflows to the country may rise by 0.8 percent
in 2017, reaching 118 000 tonnes. Butter imports by the
Russian Federation, Australia, the Philippines and Canada are also forecast to increase.
The EU is predicted to account for much of the fall in
this year’s world butter exports, with shipments from the
0
5
10
15
20
25
thousand tonnes
Saud ArabiaUSA China Egypt
Jan-Aug 2015
Jan-Aug 2016
Jan-Aug 2017
0
50
100
150
200
250
300
350
2017201620152014
thousand tonnes
Japan Saudi ArabiaUSA
Mexico
f’cast
Russian Fed.
China Korea, Rep. Of Australia
59FOOD OUTLOOK NOVEMBER 2017
MILK
AN
D M
ILK P
RO
DU
CT
S
region now forecast at 166 200 tonnes, nearly 20 percent
less than in 2016. EU’s contraction would be largely the
result of a strong internal demand for butterfat and a
reduction in butter processing in favour of cheese, which
has become more profitable. Tight export availabilities
are also likely to depress butter exports from Australia,
Mexico, Uruguay and Argentina. By contrast, despite a
drop of nearly 11 percent from January to August 2017,
butter exports from New Zealand over the full year
are forecast to progress by about 2 percent, to nearly
514 000 tonnes, spurred by improved weather and pasture
conditions, and higher international prices.
Lively import demand to boost trade in cheese to a new recordInternational trade in cheese is forecast to increase by
3.8 percent to a record 2.6 million tonnes. Much of
the growth in world demand is forecast to come from
Australia, China, Japan, the Republic of Korea, Chile,
Mexico and Saudi Arabia, along with some support from
El Salvador, the Russian Federation and Kuwait. By
contrast, imports by the United States, Brazil, the EU and
Algeria are likely to decline.
Of the various sources of supply, the United States
and the EU are projected to account for much of the
increase in world cheese exports in 2017. Shipments from
the United States are expected to expand by as much as
18 percent, supported by a weaker US dollar and strong
demand in a number of markets, especially Mexico, the
Republic of Korea, Japan, Australia and Canada. As for the
EU, its cheese exports may grow by nearly 6 percent this
year to a historic high of 848 000 tonnes, underlining the
resilience of the EU’s dairy industry. Continuing with the
successful re-orientation that began with the imposition
of the Russian embargo in 2014, the EU is forecast to
expand its cheese exports to several destinations in 2017,
namely the United States, Japan, Switzerland, the Republic
of Korea, Saudi Arabia, Chile, Australia and Algeria.
Cheese exports by the Islamic Republic of Iran, Turkey
and Australia are also anticipated to rise, while supply
constraints may cause exports to fall in New Zealand and
Argentina. Belarus, which has been the main cheese
supplier to the Russian Federation since 2014, may also
export less this year.
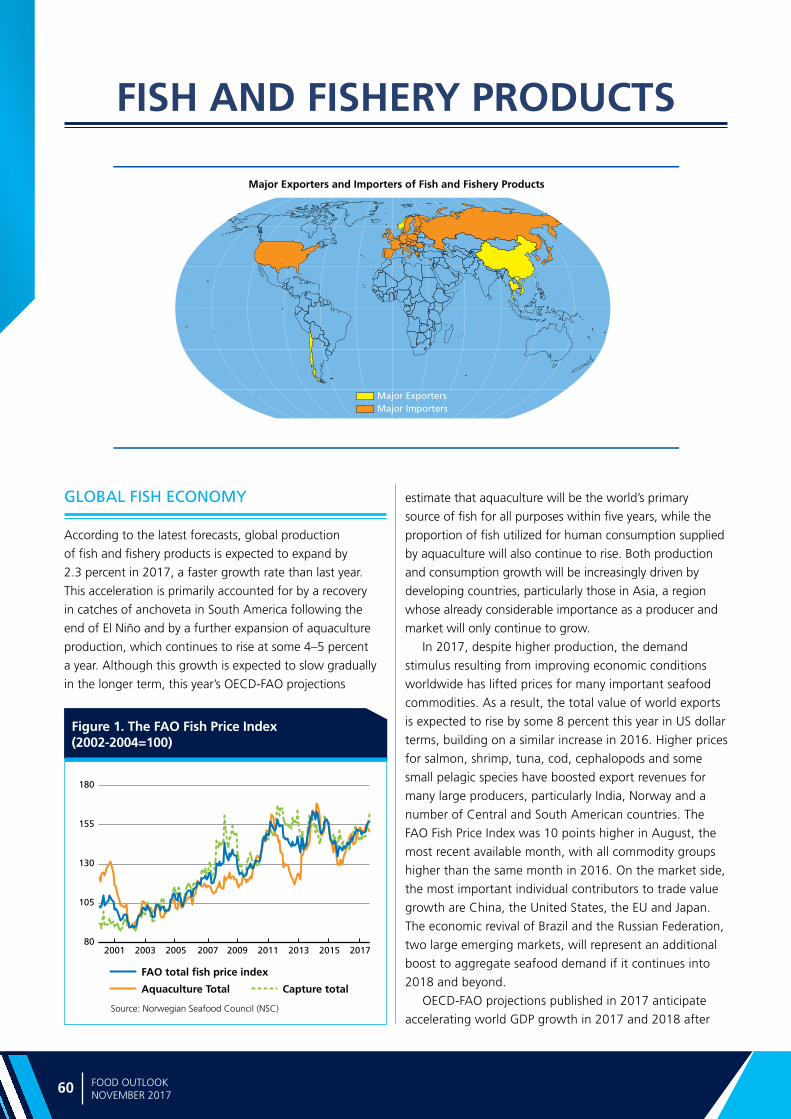
Ma
rke
t a
sse
ssm
en
ts
60 FOOD OUTLOOKNOVEMBER 2017
Major Exporters and Importers of Fish and Fishery Products
Major ExportersMajor Importers
Figure 1. The FAO Fish Price Index(2002-2004=100)
FISH AND FISHERY PRODUCTS
Source: Norwegian Seafood Council (NSC)
GLOBAL FISH ECONOMY
According to the latest forecasts, global production
of fish and fishery products is expected to expand by
2.3 percent in 2017, a faster growth rate than last year.
This acceleration is primarily accounted for by a recovery
in catches of anchoveta in South America following the
end of El Niño and by a further expansion of aquaculture
production, which continues to rise at some 4–5 percent
a year. Although this growth is expected to slow gradually
in the longer term, this year’s OECD-FAO projections
estimate that aquaculture will be the world’s primary
source of fish for all purposes within five years, while the
proportion of fish utilized for human consumption supplied
by aquaculture will also continue to rise. Both production
and consumption growth will be increasingly driven by
developing countries, particularly those in Asia, a region
whose already considerable importance as a producer and
market will only continue to grow.
In 2017, despite higher production, the demand
stimulus resulting from improving economic conditions
worldwide has lifted prices for many important seafood
commodities. As a result, the total value of world exports
is expected to rise by some 8 percent this year in US dollar
terms, building on a similar increase in 2016. Higher prices
for salmon, shrimp, tuna, cod, cephalopods and some
small pelagic species have boosted export revenues for
many large producers, particularly India, Norway and a
number of Central and South American countries. The
FAO Fish Price Index was 10 points higher in August, the
most recent available month, with all commodity groups
higher than the same month in 2016. On the market side,
the most important individual contributors to trade value
growth are China, the United States, the EU and Japan.
The economic revival of Brazil and the Russian Federation,
two large emerging markets, will represent an additional
boost to aggregate seafood demand if it continues into
2018 and beyond.
OECD-FAO projections published in 2017 anticipate
accelerating world GDP growth in 2017 and 2018 after
80
105
130
155
180
201720152013201120092007200520032001
FAO total fish price index
Capture totalAquaculture Total

61FOOD OUTLOOK NOVEMBER 2017
FISH A
ND
FISHE
RY
PR
OD
UC
TS
Table 1. World fish market at a glance
Source: Norwegian Seafood Council (NSC)Totals may not match due to rounding.
Figure 2. Ex-warehouse prices of shrimp in New York, USA*
years of sluggish economic performance in multiple world
regions, which is a positive development for the seafood
sector. However, this growth is not evenly distributed
geographically, as steady but slow economic expansion in
the EU and Japan has been contrasted with more robust
economic performance in the United States and rapid
growth in developing regions, particularly Asia. Seafood
demand is highly sensitive to increases in income, and thus
it is these economic trends, combined with population
growth rates, that will be the major determinants of
future trade flows and consumption patterns. While Latin
America and Africa are increasing their shares of the world
market relative to the United States, the EU and Japan, it
is the rapid transformation of large sections of the Asian
population into urbanized, middle-class consumers that
will be the most important single factor in shaping the
global seafood market for some time to come.
International cooperation in protecting the long-
term health of marine environments remains a priority.
At the Eleventh WTO Ministerial Conference taking
place in Buenos Aires on 10–13 December, discussions
will continue among participants regarding the need to
limit harmful fisheries subsidies. An agreement between
WTO members that addresses the issue of overcapacity
and overfishing resulting from such subsidy schemes
is considered an essential component of Sustainable
Development Goal (SDG) 14: Life Below Water, which
concerns the wellbeing of the world’s oceans. Another
crucially important aspect of SDG 14 is climate change
and how to mitigate its negative effects on fisheries
and other marine-based resources, which was the topic
of central focus at the VI edition of the CONXEMAR-
FAO World Congress that was hosted in Vigo, Spain, on
2 October.
SHRIMP
Global farmed shrimp supplies were low during the first
half of 2017, in balance with low to moderate demand in
the traditional and emerging markets. Starting from July,
however, the supply of farmed shrimp from Asia picked
up. China, the largest producer of shrimp, saw lower
production in 2017 compared with 2016 due to persistent
disease issues, while in Indonesia, unfavourable weather
2012 2013 2014 2015 2016 2017
Jan-June (thousand tonnes)
Frozen, raw 85.7 84.5 63.4 59.7 65.8 69.8
Cooked, frozen 11.3 12.4 9.5 8.5 8.7 8.9
Prepared/preserved* 23.2 23.1 17.0 16.9 16.4 18.9
Sushi (with rice) 0.9 1.2 0.8 1.6 1.2 1.3
Total* 122.8 122.2 94.1 86.9 92.8 99.7
(*Including other ) Source: Japan Ministry of Finance /INFOFISH
Table 2. Japanese imports of shrimp (by product)
* Farmed vannamei, headless shell-on
0
3
6
9
SeptMayJanSeptMayJanSeptMayJanSept2014 2015 2016 2017
Count 21/25 (India) Count 26/30 (India)Count 36/40 (India)Count 36/40 (Ecuador)
USD per lb.
Source: INFOFISH Trade News
Note: Headless, shell-on, farmed vannamei, ex-warehouse, NY, USA
2015 2016estim.
2017f’cast
Change: 2017 over 2016
million tonnes %
WORLD BALANCE
Production 169.2 170.1 174.0 2.3
Capture fisheries 92.6 90.1 90.4 0.3
Aquaculture 76.6 80.0 83.6 4.5
Trade value (exports USD billion)
133.2 142.4 153.5 7.8
Trade volume (live weight) 59.6 60.3 60.7 0.6
Total utilization 169.2 170.1 174.0 2.3
Food 148.8 150.6 153.3 1.8
Feed 15.1 14.3 15.6 8.7
Other uses 5.2 5.1 5.1 -0.8
SUPPLY AND DEMAND INDICATORS
Per caput food consumption:
Food fish (kg/yr) 20.2 20.2 20.3 0.7
From capture fisheries (kg/year) 9.8 9.5 9.2 -2.4
From aquaculture (kg/year) 10.4 10.7 11.1 3.3
FAO FISH PRICE INDEX
(2002-2004=100)2015 2016 2017
Jan-AugChange:
Jan-Aug 2017 over
Jan-Aug 2016 %
142 146 152 5.9
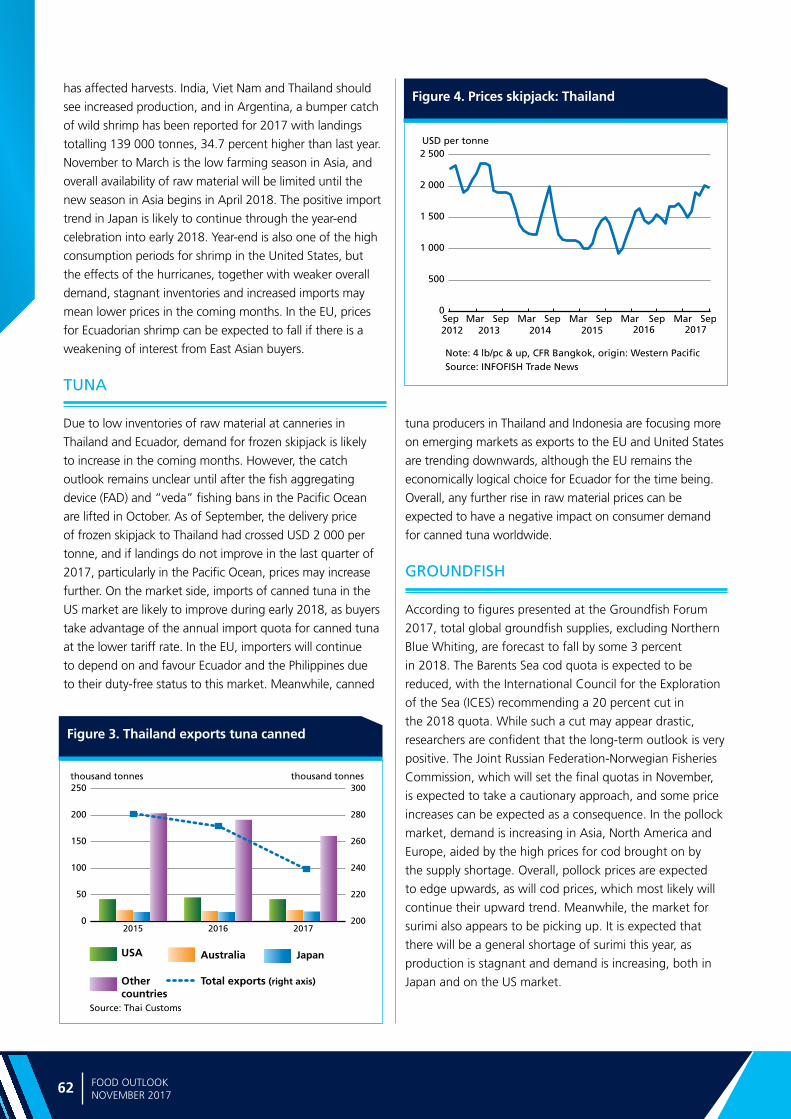
Ma
rke
t a
sse
ssm
en
ts
62 FOOD OUTLOOKNOVEMBER 2017
Figure 3. Thailand exports tuna canned
has affected harvests. India, Viet Nam and Thailand should
see increased production, and in Argentina, a bumper catch
of wild shrimp has been reported for 2017 with landings
totalling 139 000 tonnes, 34.7 percent higher than last year.
November to March is the low farming season in Asia, and
overall availability of raw material will be limited until the
new season in Asia begins in April 2018. The positive import
trend in Japan is likely to continue through the year-end
celebration into early 2018. Year-end is also one of the high
consumption periods for shrimp in the United States, but
the effects of the hurricanes, together with weaker overall
demand, stagnant inventories and increased imports may
mean lower prices in the coming months. In the EU, prices
for Ecuadorian shrimp can be expected to fall if there is a
weakening of interest from East Asian buyers.
TUNA
Due to low inventories of raw material at canneries in
Thailand and Ecuador, demand for frozen skipjack is likely
to increase in the coming months. However, the catch
outlook remains unclear until after the fish aggregating
device (FAD) and “veda” fishing bans in the Pacific Ocean
are lifted in October. As of September, the delivery price
of frozen skipjack to Thailand had crossed USD 2 000 per
tonne, and if landings do not improve in the last quarter of
2017, particularly in the Pacific Ocean, prices may increase
further. On the market side, imports of canned tuna in the
US market are likely to improve during early 2018, as buyers
take advantage of the annual import quota for canned tuna
at the lower tariff rate. In the EU, importers will continue
to depend on and favour Ecuador and the Philippines due
to their duty-free status to this market. Meanwhile, canned
tuna producers in Thailand and Indonesia are focusing more
on emerging markets as exports to the EU and United States
are trending downwards, although the EU remains the
economically logical choice for Ecuador for the time being.
Overall, any further rise in raw material prices can be
expected to have a negative impact on consumer demand
for canned tuna worldwide.
GROUNDFISH
According to figures presented at the Groundfish Forum
2017, total global groundfish supplies, excluding Northern
Blue Whiting, are forecast to fall by some 3 percent
in 2018. The Barents Sea cod quota is expected to be
reduced, with the International Council for the Exploration
of the Sea (ICES) recommending a 20 percent cut in
the 2018 quota. While such a cut may appear drastic,
researchers are confident that the long-term outlook is very
positive. The Joint Russian Federation-Norwegian Fisheries
Commission, which will set the final quotas in November,
is expected to take a cautionary approach, and some price
increases can be expected as a consequence. In the pollock
market, demand is increasing in Asia, North America and
Europe, aided by the high prices for cod brought on by
the supply shortage. Overall, pollock prices are expected
to edge upwards, as will cod prices, which most likely will
continue their upward trend. Meanwhile, the market for
surimi also appears to be picking up. It is expected that
there will be a general shortage of surimi this year, as
production is stagnant and demand is increasing, both in
Japan and on the US market.
Figure 4. Prices skipjack: Thailand
0
50
100
150
200
250
201720162015200
220
240
260
280
300
USA Australia Japan
Total exports (right axis)Other countries
Source: Thai Customs
thousand tonnes thousand tonnes
0
500
1 000
1 500
2 000
2 500
SepMarSepMar Sep Mar Sep Mar Sep Mar Sep2012 2013 2014 2015 2016 2017
USD per tonne
Source: INFOFISH Trade NewsNote: 4 lb/pc & up, CFR Bangkok, origin: Western Pacific

63FOOD OUTLOOK NOVEMBER 2017
FISH A
ND
FISHE
RY
PR
OD
UC
TS
Source: US Department of Commerce, Bureau of Census
Table 4. US imports of fresh and frozen catfish fillets (by origin)
2013 2014 2015 2016 2017
Jan-June (thousand tonnes)
Viet Nam 52.3 46.7 54.8 64.4 51.9
China 3.9 4.7 3.6 2.8 3.4
Panama 0.0 0.0 0.0 0.0 0.0
Others 0.3 0.1 0.1 0.0 0.0
Total 56.5 51.6 58.5 67.2 55.2
CEPHALOPODS
Demand for octopus and squid is growing stronger, but
poorer landings mean limited supplies. Inventories are also
low and observers expect prices to continue increasing
over the coming months. With low catches in Morocco
and Mauritania, the main market for octopus, Japan, will
be looking for supplies from alternative sources such as
China, Viet Nam, Mexico and Southeast Asia. For squid,
stocks off the coast of Argentina are reported to be in
poor condition, contributing to upward pressure on prices,
especially for Illex squid. China, which also imports large
quantities of squid from the Democratic People’s Republic
of Korea, is likely to see a sharp drop in shipments in the
medium term as pressure mounts to isolate the Democratic
People’s Republic of Korea from international trade. Overall,
cephalopod trade volumes are set to contract and prices
will remain high.
Figure 5. Export prices of cod in Norway
Source: National Marine Fisheries Service (NMFS)
Table 3. Chinese exports of Alaska pollock
2013 2014 2015 2016 2017
Jan-June (thousand tonnes)
Russian Federation
385.6 388.8 402.9 363.5 414.0
USA 24.6 25.9 23.7 18.8 31.3
Japan 24.5 25.3 14.3 6.9 3.2
Canada 0.2 1.0 0.8 0.9 0.1
Dem. People's Rep. of Korea
0.1 0.0 0.0 0.0 0.1
Others 4.5 2.0 0.0 0.6 0.1
Total 439.5 443.1 441.5 390.7 448.8
0
40
80
120
JunDecJunDecJunDecJunDec20172014 2015 2016
Fresh cod fillets Frozen cod fillets
NKr per kg
Source: Norwegian Seafood Council
Figure 6. Spain imports of squid and cuttlefish
0
20
40
60
80
201720162015110
120
130
140
150thousand tonnes
Falkland Isl.(Malvinas)Peru India
Total imports (right axis)
thousand tonnes
Other countries
Source: Agencia Tributaria
PANGASIUS
During the first half of 2017, global imports of frozen
pangasius fell slightly, mainly due to lower imports into the
single largest market, the United States, while demand also
continues to weaken in the EU. Imports into Latin America
and Asia, however, comprised approximately 51 percent of
the world’s total over the same period, increasing from a
42 percent share the previous year. Overall, prices remain
relatively strong. In Viet Nam, by far the largest pangasius
producing country, the Ministry of Agriculture and Rural
Development is actively promoting the consumption of
pangasius domestically as well as targeting expansion in
international markets, particularly China.
TILAPIA
In total, during the first half of 2017, approximately
170 000 tonnes of tilapia (whole, fillets and breaded)
entered the international market. While the US market
grapples with weak demand, some recovery in the tilapia
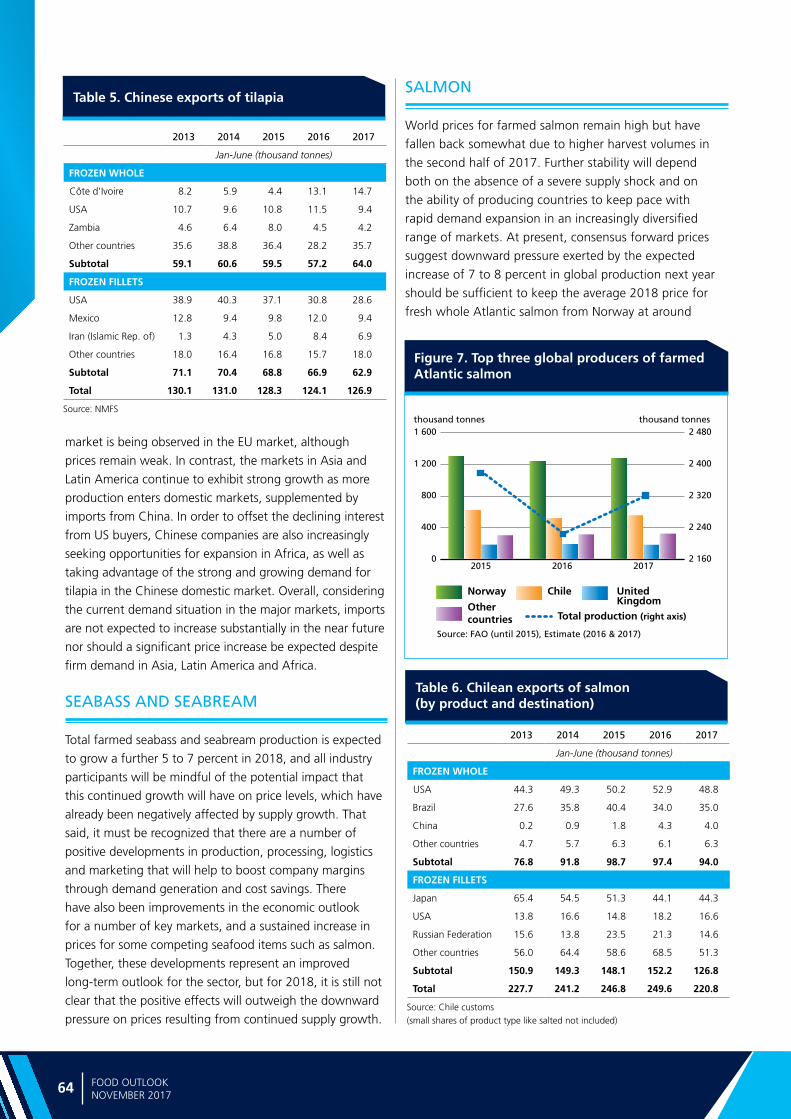
Ma
rke
t a
sse
ssm
en
ts
64 FOOD OUTLOOKNOVEMBER 2017
market is being observed in the EU market, although
prices remain weak. In contrast, the markets in Asia and
Latin America continue to exhibit strong growth as more
production enters domestic markets, supplemented by
imports from China. In order to offset the declining interest
from US buyers, Chinese companies are also increasingly
seeking opportunities for expansion in Africa, as well as
taking advantage of the strong and growing demand for
tilapia in the Chinese domestic market. Overall, considering
the current demand situation in the major markets, imports
are not expected to increase substantially in the near future
nor should a significant price increase be expected despite
firm demand in Asia, Latin America and Africa.
SEABASS AND SEABREAM
Total farmed seabass and seabream production is expected
to grow a further 5 to 7 percent in 2018, and all industry
participants will be mindful of the potential impact that
this continued growth will have on price levels, which have
already been negatively affected by supply growth. That
said, it must be recognized that there are a number of
positive developments in production, processing, logistics
and marketing that will help to boost company margins
through demand generation and cost savings. There
have also been improvements in the economic outlook
for a number of key markets, and a sustained increase in
prices for some competing seafood items such as salmon.
Together, these developments represent an improved
long-term outlook for the sector, but for 2018, it is still not
clear that the positive effects will outweigh the downward
pressure on prices resulting from continued supply growth.
Figure 7. Top three global producers of farmed Atlantic salmon
Source: Chile customs (small shares of product type like salted not included)
Table 6. Chilean exports of salmon (by product and destination)
2013 2014 2015 2016 2017
Jan-June (thousand tonnes)
FROZEN WHOLE
USA 44.3 49.3 50.2 52.9 48.8
Brazil 27.6 35.8 40.4 34.0 35.0
China 0.2 0.9 1.8 4.3 4.0
Other countries 4.7 5.7 6.3 6.1 6.3
Subtotal 76.8 91.8 98.7 97.4 94.0
FROZEN FILLETS
Japan 65.4 54.5 51.3 44.1 44.3
USA 13.8 16.6 14.8 18.2 16.6
Russian Federation 15.6 13.8 23.5 21.3 14.6
Other countries 56.0 64.4 58.6 68.5 51.3
Subtotal 150.9 149.3 148.1 152.2 126.8
Total 227.7 241.2 246.8 249.6 220.8
SALMON
World prices for farmed salmon remain high but have
fallen back somewhat due to higher harvest volumes in
the second half of 2017. Further stability will depend
both on the absence of a severe supply shock and on
the ability of producing countries to keep pace with
rapid demand expansion in an increasingly diversified
range of markets. At present, consensus forward prices
suggest downward pressure exerted by the expected
increase of 7 to 8 percent in global production next year
should be sufficient to keep the average 2018 price for
fresh whole Atlantic salmon from Norway at around
0
400
800
1 200
1 600
2017201620152 160
2 240
2 320
2 400
2 480thousand tonnes
Norway UnitedKingdom
Chile
Total production (right axis)
thousand tonnes
Other countries
Source: FAO (until 2015), Estimate (2016 & 2017)
Source: NMFS
Table 5. Chinese exports of tilapia
2013 2014 2015 2016 2017
Jan-June (thousand tonnes)
FROZEN WHOLE
Côte d'Ivoire 8.2 5.9 4.4 13.1 14.7
USA 10.7 9.6 10.8 11.5 9.4
Zambia 4.6 6.4 8.0 4.5 4.2
Other countries 35.6 38.8 36.4 28.2 35.7
Subtotal 59.1 60.6 59.5 57.2 64.0
FROZEN FILLETS
USA 38.9 40.3 37.1 30.8 28.6
Mexico 12.8 9.4 9.8 12.0 9.4
Iran (Islamic Rep. of) 1.3 4.3 5.0 8.4 6.9
Other countries 18.0 16.4 16.8 15.7 18.0
Subtotal 71.1 70.4 68.8 66.9 62.9
Total 130.1 131.0 128.3 124.1 126.9
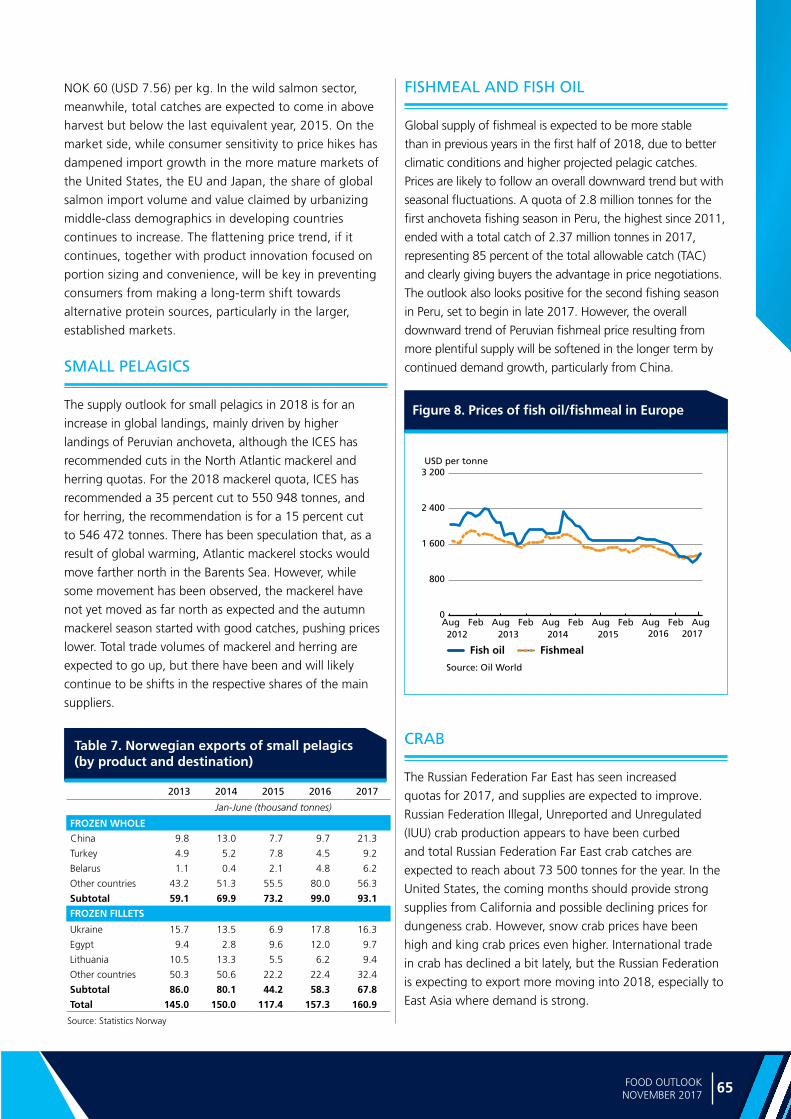
65FOOD OUTLOOK NOVEMBER 2017
MILK
AN
D M
ILK P
RO
DU
CT
S
Source: Statistics Norway
Table 7. Norwegian exports of small pelagics (by product and destination)
2013 2014 2015 2016 2017
Jan-June (thousand tonnes)
FROZEN WHOLE
China 9.8 13.0 7.7 9.7 21.3
Turkey 4.9 5.2 7.8 4.5 9.2
Belarus 1.1 0.4 2.1 4.8 6.2
Other countries 43.2 51.3 55.5 80.0 56.3
Subtotal 59.1 69.9 73.2 99.0 93.1
FROZEN FILLETS
Ukraine 15.7 13.5 6.9 17.8 16.3
Egypt 9.4 2.8 9.6 12.0 9.7
Lithuania 10.5 13.3 5.5 6.2 9.4
Other countries 50.3 50.6 22.2 22.4 32.4
Subtotal 86.0 80.1 44.2 58.3 67.8
Total 145.0 150.0 117.4 157.3 160.9
Figure 8. Prices of fish oil/fishmeal in Europe
0
800
1 600
2 400
3 200
AugFebAugFebAugFebAugFebAugFebAug2012 2013 2014 2015 2016 2017
Fish oil Fishmeal
USD per tonne
Source: Oil World
NOK 60 (USD 7.56) per kg. In the wild salmon sector,
meanwhile, total catches are expected to come in above
harvest but below the last equivalent year, 2015. On the
market side, while consumer sensitivity to price hikes has
dampened import growth in the more mature markets of
the United States, the EU and Japan, the share of global
salmon import volume and value claimed by urbanizing
middle-class demographics in developing countries
continues to increase. The flattening price trend, if it
continues, together with product innovation focused on
portion sizing and convenience, will be key in preventing
consumers from making a long-term shift towards
alternative protein sources, particularly in the larger,
established markets.
SMALL PELAGICS
The supply outlook for small pelagics in 2018 is for an
increase in global landings, mainly driven by higher
landings of Peruvian anchoveta, although the ICES has
recommended cuts in the North Atlantic mackerel and
herring quotas. For the 2018 mackerel quota, ICES has
recommended a 35 percent cut to 550 948 tonnes, and
for herring, the recommendation is for a 15 percent cut
to 546 472 tonnes. There has been speculation that, as a
result of global warming, Atlantic mackerel stocks would
move farther north in the Barents Sea. However, while
some movement has been observed, the mackerel have
not yet moved as far north as expected and the autumn
mackerel season started with good catches, pushing prices
lower. Total trade volumes of mackerel and herring are
expected to go up, but there have been and will likely
continue to be shifts in the respective shares of the main
suppliers.
FISHMEAL AND FISH OIL
Global supply of fishmeal is expected to be more stable
than in previous years in the first half of 2018, due to better
climatic conditions and higher projected pelagic catches.
Prices are likely to follow an overall downward trend but with
seasonal fluctuations. A quota of 2.8 million tonnes for the
first anchoveta fishing season in Peru, the highest since 2011,
ended with a total catch of 2.37 million tonnes in 2017,
representing 85 percent of the total allowable catch (TAC)
and clearly giving buyers the advantage in price negotiations.
The outlook also looks positive for the second fishing season
in Peru, set to begin in late 2017. However, the overall
downward trend of Peruvian fishmeal price resulting from
more plentiful supply will be softened in the longer term by
continued demand growth, particularly from China.
CRAB
The Russian Federation Far East has seen increased
quotas for 2017, and supplies are expected to improve.
Russian Federation Illegal, Unreported and Unregulated
(IUU) crab production appears to have been curbed
and total Russian Federation Far East crab catches are
expected to reach about 73 500 tonnes for the year. In the
United States, the coming months should provide strong
supplies from California and possible declining prices for
dungeness crab. However, snow crab prices have been
high and king crab prices even higher. International trade
in crab has declined a bit lately, but the Russian Federation
is expecting to export more moving into 2018, especially to
East Asia where demand is strong.
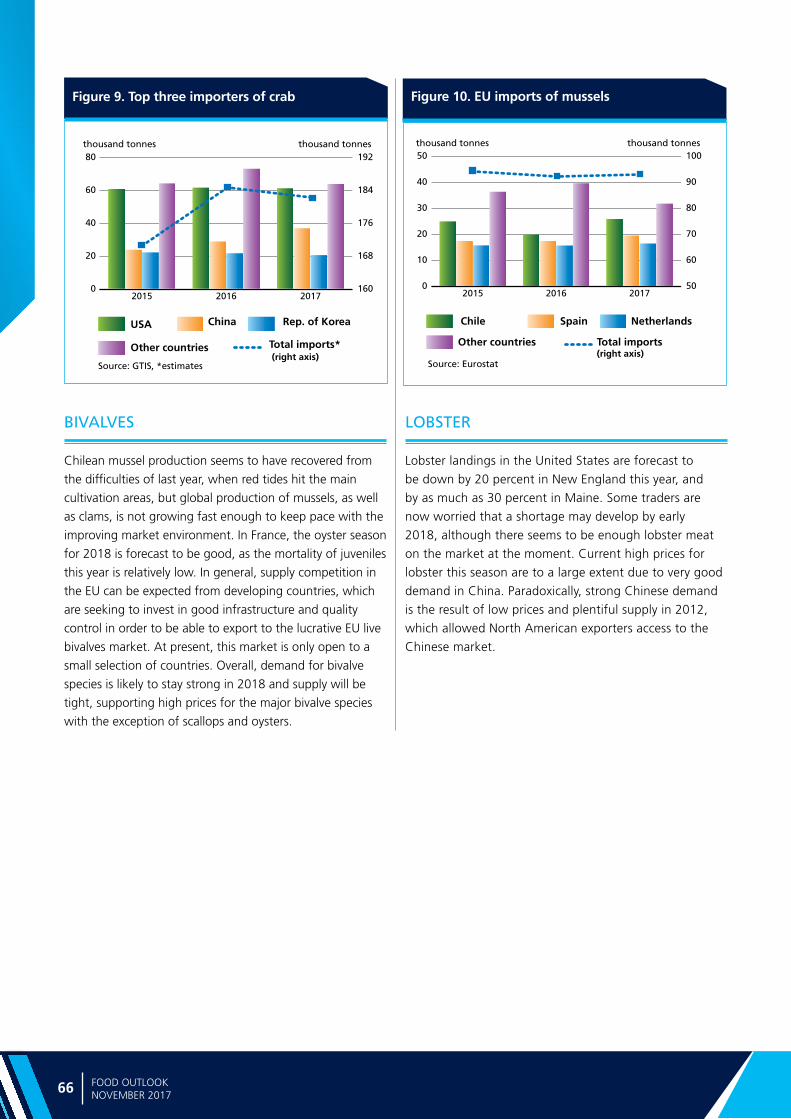
Ma
rke
t a
sse
ssm
en
ts
66 FOOD OUTLOOKNOVEMBER 2017
BIVALVES
Chilean mussel production seems to have recovered from
the difficulties of last year, when red tides hit the main
cultivation areas, but global production of mussels, as well
as clams, is not growing fast enough to keep pace with the
improving market environment. In France, the oyster season
for 2018 is forecast to be good, as the mortality of juveniles
this year is relatively low. In general, supply competition in
the EU can be expected from developing countries, which
are seeking to invest in good infrastructure and quality
control in order to be able to export to the lucrative EU live
bivalves market. At present, this market is only open to a
small selection of countries. Overall, demand for bivalve
species is likely to stay strong in 2018 and supply will be
tight, supporting high prices for the major bivalve species
with the exception of scallops and oysters.
Figure 10. EU imports of mussels
0
10
20
30
40
50
20172016201550
60
70
80
90
100thousand tonnes
NetherlandsChile Spain
Total imports (right axis)
thousand tonnes
Other countries
Source: Eurostat
Figure 9. Top three importers of crab
0
20
40
60
80
201720162015160
168
176
184
192thousand tonnes
USA Rep. of KoreaChina
Total imports* (right axis)
thousand tonnes
Other countries
Source: GTIS, *estimates
LOBSTER
Lobster landings in the United States are forecast to
be down by 20 percent in New England this year, and
by as much as 30 percent in Maine. Some traders are
now worried that a shortage may develop by early
2018, although there seems to be enough lobster meat
on the market at the moment. Current high prices for
lobster this season are to a large extent due to very good
demand in China. Paradoxically, strong Chinese demand
is the result of low prices and plentiful supply in 2012,
which allowed North American exporters access to the
Chinese market.


SPEC
IAL
FEAT
URE
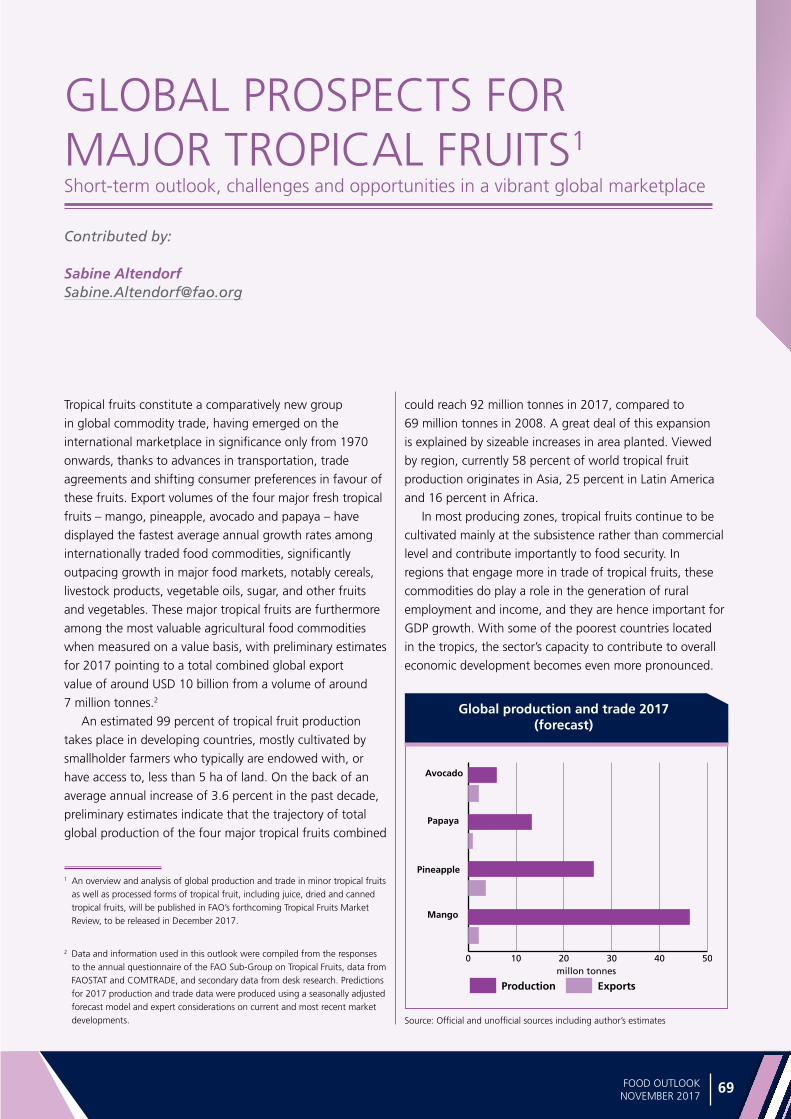
Spe
cial fe
atu
re
69FOOD OUTLOOKNOVEMBER 2017
GLOBAL PROSPECTS FOR MAJOR TROPICAL FRUITS1 Short-term outlook, challenges and opportunities in a vibrant global marketplace
Contributed by:
Sabine Altendorf [email protected]
Tropical fruits constitute a comparatively new group
in global commodity trade, having emerged on the
international marketplace in significance only from 1970
onwards, thanks to advances in transportation, trade
agreements and shifting consumer preferences in favour of
these fruits. Export volumes of the four major fresh tropical
fruits – mango, pineapple, avocado and papaya – have
displayed the fastest average annual growth rates among
internationally traded food commodities, significantly
outpacing growth in major food markets, notably cereals,
livestock products, vegetable oils, sugar, and other fruits
and vegetables. These major tropical fruits are furthermore
among the most valuable agricultural food commodities
when measured on a value basis, with preliminary estimates
for 2017 pointing to a total combined global export
value of around USD 10 billion from a volume of around
7 million tonnes.2
An estimated 99 percent of tropical fruit production
takes place in developing countries, mostly cultivated by
smallholder farmers who typically are endowed with, or
have access to, less than 5 ha of land. On the back of an
average annual increase of 3.6 percent in the past decade,
preliminary estimates indicate that the trajectory of total
global production of the four major tropical fruits combined
2 Data and information used in this outlook were compiled from the responses to the annual questionnaire of the FAO Sub-Group on Tropical Fruits, data from FAOSTAT and COMTRADE, and secondary data from desk research. Predictions for 2017 production and trade data were produced using a seasonally adjusted forecast model and expert considerations on current and most recent market developments.
could reach 92 million tonnes in 2017, compared to
69 million tonnes in 2008. A great deal of this expansion
is explained by sizeable increases in area planted. Viewed
by region, currently 58 percent of world tropical fruit
production originates in Asia, 25 percent in Latin America
and 16 percent in Africa.
In most producing zones, tropical fruits continue to be
cultivated mainly at the subsistence rather than commercial
level and contribute importantly to food security. In
regions that engage more in trade of tropical fruits, these
commodities do play a role in the generation of rural
employment and income, and they are hence important for
GDP growth. With some of the poorest countries located
in the tropics, the sector’s capacity to contribute to overall
economic development becomes even more pronounced.
Global production and trade 2017 (forecast)
Source: Official and unofficial sources including author’s estimates
1 An overview and analysis of global production and trade in minor tropical fruits as well as processed forms of tropical fruit, including juice, dried and canned tropical fruits, will be published in FAO’s forthcoming Tropical Fruits Market Review, to be released in December 2017.
0 10 20 30 40 50
ExportsProductionmillon tonnes
Avocado
Pineapple
Mango
Papaya

Spe
cia
l fe
atu
re
70 FOOD OUTLOOKNOVEMBER 2017
When countries are in a position to supply international
markets, the tropical fruits sector can be important in
generating foreign exchange earnings. For example, Costa
Rica’s exports of tropical fruits account for approximately
one-fifth of its entire agricultural export earnings.
Combined exports of the four major tropical fruits
represent only 5 percent of total production volume, with
the remainder destined for domestic utilization. This is
evident in the large number of countries engaging in the
production of tropical fruits in comparison with the very
small number of exporting nations. Changing consumer
preferences as incomes rise will likely set the share of
traded production on a higher trajectory in the future.
Indeed, freer trade, and particularly better market access,
could stimulate further technological gains in distribution,
leading to lower prices and thereby enabling tropical fruits
to reach more markets in larger quantities than before.
However, the threat of climate change and associated
extreme weather events looms heavily over the sector,
given that tropical zones have acute vulnerability to the
phenomenon.
PRODUCTION
After sustained growth that has been extremely robust
over much of the past decade, the pace of global
aggregate production of major tropical fruits is expected
to slow in 2017. Global production is estimated to reach
92.2 million tonnes in 2017. This translates into a year-
to-year increase of 1.9 percent from 2016, compared to
an annual average growth rate of 3.6 percent over the
previous ten years.
The slowdown in production growth has been
observed for all major tropical fruits and is chiefly
attributable to adverse – and at times severely disruptive –
weather conditions in the main growing regions (see
Box 1). However, on the back of fast growing global
demand, producing countries have continued to increase
the area under tropical fruits, providing an extent of
counterbalance to weather-related supply disruptions in
susceptible regions, thus averting more serious supply
shortages.
In terms of individual production volume by major
tropical fruit, mango ranks as the predominant variety, due
to the commodity’s popularity in India, where an estimated
40 percent of global production originates. Total production
of mango is forecast to reach a volume share of 51 percent
of total global major tropical fruit production in 2017.
Pineapple ranks second in global production importance,
with an expected share of 28 percent in 2017, thanks to
robust international demand, largely met by Costa Rica, the
Given the highly perishable nature of tropical fruits in production and in distribution, environmental
challenges are among the key obstacles to sustaining production and ensuring international markets are supplied. This is a particularly acute challenge since the vast majority of tropical fruits are produced on smallholder farms of less than 5 ha, where cultivation is highly dependent on rainfall and prone to the adverse effects of increasingly erratic weather events.
In 2016 and 2017, adverse weather conditions have caused considerable disruptions to global production for all major tropical fruits. Production of mango has been affected by drought in some of the major producing countries in Asia, South America and Africa, while pineapple and avocado production has undergone damage from flooding in the key producing countries in Central and South America. Drought has also hampered the production of papaya in the largest producing regions in South America, as well as the production of avocado in the southern part of Africa.
On average, new avocado plantings only bear fruits after four years, making avocado considerably vulnerable. Similarly, pineapple production is prone to adverse weather due to the fact that each plant bears only one fruit per year. More critically, long-lived mango trees bear fruit only after some 6 years and take between three and six months for fruits to ripen. Conversely, papaya plants can be grown in a plethora of topical soils, are fast growing and more resilient to changing weather conditions than most other tropical fruits. This makes papaya less prone to weather effects.
The intensity of the tropical storms in the Caribbean in September and October 2017 was particularly alarming to the tropical fruits industry, as devastating damage to harvests occurred in several small island states, including Cuba, Dominica and the Dominican Republic, where tropical fruits provide important sources of nutrition and income. In the Dominican Republic , for instance, measures to boost the country’s exports of tropical fruits were significantly undermined by poor weather in the first half of 2017 and, subsequently, by significant hurricane damage in September/October. A similar situation was observed in Cuba, which recently began an export campaign to support trade in the MD2 variety of “supersweet” pineapples. By contrast, in the important avocado-producing regions of Central and South America, which have widely installed more weather resilient systems, production has proven better able to withstand disruptive climatic events, highlighting the potential that adaptation measures may provide.
Box 1: Environmental challenges
Spe
cial fe
atu
re
71FOOD OUTLOOKNOVEMBER 2017
world’s leading exporter of pineapple, and by significant
domestic consumption in Brazil, the second largest
producer of pineapple. Papaya and avocado meanwhile
account for significantly lower volume shares, at an
estimated 15 percent and 6 percent, respectively, in 2017.
Papaya is mainly produced and consumed in India and
Brazil, where population growth has sustained domestic
demand.
When viewed in terms of producing countries, the
leading producer of major tropical fruits is India, accounting
for an estimated 28 percent of total global major tropical
fruit production in 2017, due to its strong position in
the production of mango and papaya. India produces
approximately 40 percent of total global mango and
papaya production, which is predominantly destined for
its domestic market. Other significant producers of tropical
fruits include China and Brazil, where again produce is
mainly destined for domestic consumption, and Mexico,
which is set to rank as the largest exporter of major tropical
fruits again in 2017.
TRADE
Seemingly, trade volumes of major tropical fruits stand
to be less affected by production shocks on a global
level, as only a small fraction of total output is traded
in international markets. However, the competitive
landscape for major tropical fruits is rather concentrated,
with few countries engaging in large-scale global trade.
Consequently, supply disturbances for producers who
are required to comply with strict certification and
phytosanitary standards can lead to short-term disruptions
in the supply to international markets. Against this, global
trade in major tropical fruits is expected to reach a new
peak in 2017 of around 7 million tonnes, up 5.2 percent
or 350 000 tonnes from last year. Trade prospects overall
would have been higher, had it not been for adverse
weather conditions in the leading exporting countries of
Mexico (avocado, mango and papaya) and Costa Rica
(pineapple), where supply shortages led to subsequent
disruptions in the pace of shipments during the first three
quarters of 2017 and also in recent months owing to
hurricane damage to production.
Globally, avocado and mango are the two tropical
fruits that have witnessed the strongest growth in
popularity. Between 1990 and 2017, world import
demand for avocado increased at an annual average
growth rate of 14 percent, significantly outperforming
supply and, thereby, driving up export, wholesale and
retail prices. Similarly, import demand for pineapple,
mango and papaya grew at annual average growth rates
Box 2: The role of technology in facilitating trade
Technology has been at the forefront of changes, making tropical fruits available to consumers globally at affordable prices. Advances in
transportation, in combination with other technological developments that have complemented the progress in transportation, have helped reduce delivery time, maintain product quality and cut shipping costs. In recent decades, it has become easier for shippers to deliver produce to purchasers thousands of miles away, with no substantial loss in freshness. The feasibility of long-distance trade in perishable products will likely increase further as shipping technologies continue to improve. In particular, advances in controlled atmosphere (CA) technologies have extended the shelf life of perishable products and continue to improve product quality and variety worldwide. With CA, products hold up better during transportation. CA technologies allow operators to lower the respiration rate of produce by monitoring and adjusting oxygen, carbon dioxide and nitrogen levels within a refrigerated container. In this way, CA can slow ripening, retard discolouration and maintain freshness of highly perishable tropical fruits that would not remain fresh during ordinary refrigerated ocean transport.
Source: Huang, Sophia (2010), “Global Trade of Fruits and Vegetables and
the Role of Consumer Demand”, in Hawkes et al., Trade, Food, Diet and
Health: Perspectives and Policy Options, Wiley Blackwell.
of 11 percent, 10 percent and 9 percent, respectively,
during the same time period.
In the past, trade flows were governed by the proximity
to markets, but this is no longer the case. Demand
has been greatly fostered by significant innovations in
distribution technology and logistics, where economies
of scale have lowered transport costs and delivery time,
making tropical fruits available and affordable year-round
in major destinations in the world. Policy has also played an
important role in the form of lower trade barriers, bilateral
and multilateral trade agreements, and the harmonization
of sanitary and phytosanitary regulations.
Rising demand in developed country markets has been
the predominant factor fuelling the expansion in global
shipments, particularly in the United States and the EU,
the two largest importing blocs, where increasing health
consciousness and more widespread awareness of the
Spe
cia
l fe
atu
re
72 FOOD OUTLOOKNOVEMBER 2017
....demand for fresh tropical fruits in major
consuming regions has been supported by
rising incomes.......
Global demand for tropical fruits is shaped by relatively high elasticities for price as well as for income.
Available data show a strong relationship between changes in income and demand for tropical fruits in the major import destinations, namely the United States of America and the EU, particularly for pineapple, mango and, to some extent, papaya. On the back of rising incomes in both importing zones, per capita availability of the four major fresh tropical fruits in terms of retail weight has increased at annual average rates ranging from 6 to 10 percent between 1990 and 2017. Similarly, demand for fresh tropical fruits in major consuming regions has been supported by rising incomes, as for example witnessed in India and Brazil, where mango and papaya consumption is expanding among an increasingly affluent population. Accordingly, demand for tropical fruits is observed to be particularly susceptible to income shocks and changes in own prices relative to those of other fruits, including temperate varieties, or other food items, whereby a sudden increase in the relative price of a tropical fruit or a shock in income could lead to substitution by other fruits or food items. By contrast, import demand for avocado has exhibited much more resilience to changes in income, especially over the past decade, as demonstrated by its uninterrupted robust growth in both major import destinations, the United States of America and the EU.
Box 3: Economic drivers of global tropical fruit demand
©Depositphotos
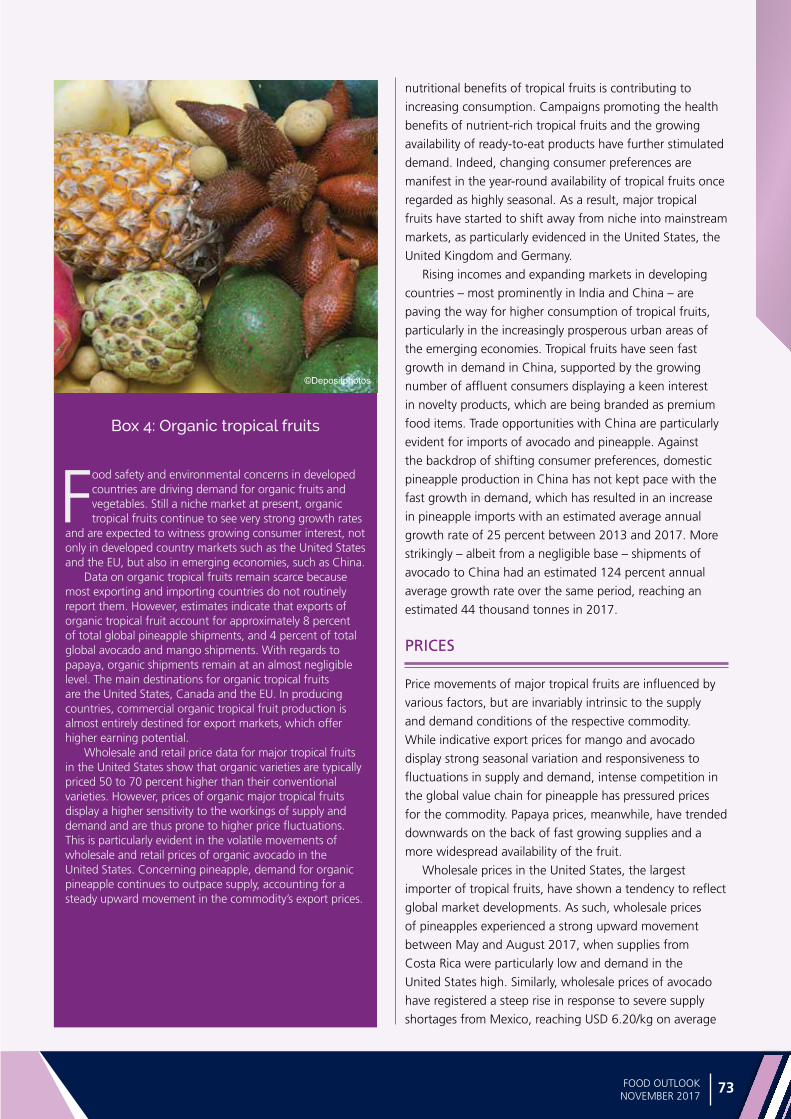
Spe
cial fe
atu
re
73FOOD OUTLOOKNOVEMBER 2017
nutritional benefits of tropical fruits is contributing to
increasing consumption. Campaigns promoting the health
benefits of nutrient-rich tropical fruits and the growing
availability of ready-to-eat products have further stimulated
demand. Indeed, changing consumer preferences are
manifest in the year-round availability of tropical fruits once
regarded as highly seasonal. As a result, major tropical
fruits have started to shift away from niche into mainstream
markets, as particularly evidenced in the United States, the
United Kingdom and Germany.
Rising incomes and expanding markets in developing
countries – most prominently in India and China – are
paving the way for higher consumption of tropical fruits,
particularly in the increasingly prosperous urban areas of
the emerging economies. Tropical fruits have seen fast
growth in demand in China, supported by the growing
number of affluent consumers displaying a keen interest
in novelty products, which are being branded as premium
food items. Trade opportunities with China are particularly
evident for imports of avocado and pineapple. Against
the backdrop of shifting consumer preferences, domestic
pineapple production in China has not kept pace with the
fast growth in demand, which has resulted in an increase
in pineapple imports with an estimated average annual
growth rate of 25 percent between 2013 and 2017. More
strikingly – albeit from a negligible base – shipments of
avocado to China had an estimated 124 percent annual
average growth rate over the same period, reaching an
estimated 44 thousand tonnes in 2017.
PRICES
Price movements of major tropical fruits are influenced by
various factors, but are invariably intrinsic to the supply
and demand conditions of the respective commodity.
While indicative export prices for mango and avocado
display strong seasonal variation and responsiveness to
fluctuations in supply and demand, intense competition in
the global value chain for pineapple has pressured prices
for the commodity. Papaya prices, meanwhile, have trended
downwards on the back of fast growing supplies and a
more widespread availability of the fruit.
Wholesale prices in the United States, the largest
importer of tropical fruits, have shown a tendency to reflect
global market developments. As such, wholesale prices
of pineapples experienced a strong upward movement
between May and August 2017, when supplies from
Costa Rica were particularly low and demand in the
United States high. Similarly, wholesale prices of avocado
have registered a steep rise in response to severe supply
shortages from Mexico, reaching USD 6.20/kg on average
Food safety and environmental concerns in developed countries are driving demand for organic fruits and vegetables. Still a niche market at present, organic tropical fruits continue to see very strong growth rates
and are expected to witness growing consumer interest, not only in developed country markets such as the United States and the EU, but also in emerging economies, such as China.
Data on organic tropical fruits remain scarce because most exporting and importing countries do not routinely report them. However, estimates indicate that exports of organic tropical fruit account for approximately 8 percent of total global pineapple shipments, and 4 percent of total global avocado and mango shipments. With regards to papaya, organic shipments remain at an almost negligible level. The main destinations for organic tropical fruits are the United States, Canada and the EU. In producing countries, commercial organic tropical fruit production is almost entirely destined for export markets, which offer higher earning potential.
Wholesale and retail price data for major tropical fruits in the United States show that organic varieties are typically priced 50 to 70 percent higher than their conventional varieties. However, prices of organic major tropical fruits display a higher sensitivity to the workings of supply and demand and are thus prone to higher price fluctuations. This is particularly evident in the volatile movements of wholesale and retail prices of organic avocado in the United States. Concerning pineapple, demand for organic pineapple continues to outpace supply, accounting for a steady upward movement in the commodity’s export prices.
Box 4: Organic tropical fruits
©Depositphotos

Spe
cia
l fe
atu
re
74 FOOD OUTLOOKNOVEMBER 2017
in September 2017, up from an average of USD 2.00/kg in
December 2016.
At the retail level, novelty price premiums are the main
driver of retail prices in developing country import markets,
notably in China, where recently introduced fruits, such
as avocado, are considered luxury items. In developed
country markets, the effects of novelty price premiums are
being gradually replaced by quality based price premiums.
As tropical fruits are becoming more widely available in
developed countries, consumers have started to display
a higher propensity to spend on tropical fruits that are
ripe and ready-to-eat, tree-ripened instead of warehouse-
ripened, and organic, allowing for higher price levels and
profit margins at the retail level. As with other maturing
food markets, demand for organic produce is burgeoning.
OUTLOOK
With around 2 700 species, tropical fruits provide
promising potential as a source of nutrition, but also
of income generation for those engaged in production
beyond subsistence. Projections for world GDP by the
IMF point to further growth in income, especially in the
major international market destinations of the United
States and the EU.3 Combined with rising incomes and
changing consumer preferences – including growing health
consciousness in some of the key developing country
markets – plentiful opportunities exist for the further
commercial development of tropical fruits. Especially given
their high export unit value and thus the potential to
achieve high profit margins, tropical fruits may represent a
viable option for diversification away from traditional export
crops, some of which have been exposed to downward
trends in prices caused by lacklustre demand and high
levels of competition in export markets.
Indeed, recent market developments in global trade
of major tropical fruits, particularly on the demand side,
point to a strongly positive outlook. Mango and avocado
are particularly well positioned to benefit from a sizeable
expansion in import demand. Both fruits are being widely
promoted as nutritional “super fruits” in developed country
markets. Trade volumes in pineapples are likely to continue
to be driven by relatively low unit prices, while papaya is
expected to benefit from more widespread availability and
higher consumer awareness in developed countries.
Marketing strategies tailored towards consumer
preferences as well as the positive nutritional characteristics
of major tropical fruits should support consumer demand.
This also applies to the plethora of minor tropical fruits,
3 IMF World Economic Outlook, October 2017
for which consumer awareness remains limited in
developed countries. Research and development efforts
by multinational trading companies targeted to align
major tropical fruits to consumer preferences in developed
country markets have recently resulted in innovations such
as vitamin-fortified mangoes, fat-reduced avocados, and
sweeter, small-sized pineapples. In this regard, product
diversification in terms of variety and clear positioning will
be of increasing importance for small producers to be able
to compete in the global market.
Notwithstanding prospects of increased demand in
developed countries, exporters should also target potential
demand in emerging economies, notably India and China,
where increasingly affluent populations could give rise
to greater product inflows. Costa Rica and Malaysia
signed trade agreements with China in 2015 and 2013,
respectively, and recent ratification of these agreements
has provided pineapple exporters from both countries
with access to a large and fast-growing consumer base.
The first Costa Rican pineapple shipments reached China
in the the thrid quarter of 2017, diverting volumes away
from the exporter’s traditional destinations. Such a shift
in export flows may present an opportunity for smaller
producers to supply more shipments to the United States
and Europe. With regard to pineapple, this could be
particularly beneficial to shipments from Côte d’Ivoire and
Ghana, potentially enabling both exporters to re-gain share
in the European market. Future trade opportunities also
present themselves on the backdrop of increasing flows
of international migration, which may give rise to higher
import demand for exotic or ethnic food items in previously
untapped markets.
Mexico, as the largest exporter of tropical fruits globally,
faces uncertainty in light of the pending outcome of
the NAFTA renegotiations, which threatens to result in
the implementation of an ad valorem tariff rate as high
as 35 percent to imports from Mexico. Approximately
75 percent of Mexico’s major tropical fruit exports are
destined to the United States. The application of an
ad valorem tax to shipments from Mexico would have
significant implications for price developments in the US,
since more than likely any tariff would be conferred to the
consumers.
Regarding organic tropical fruits, rising consumer
awareness of the potentially harmful effects of pesticide-
heavy production methods, particularly in pineapple, is
expected to support further substantial growth in the
demand for these products. However, a major obstacle
to export growth lies on the supply side, notably the
considerable costs of compliance involved with obtaining
certification, and the associated lower yields and higher
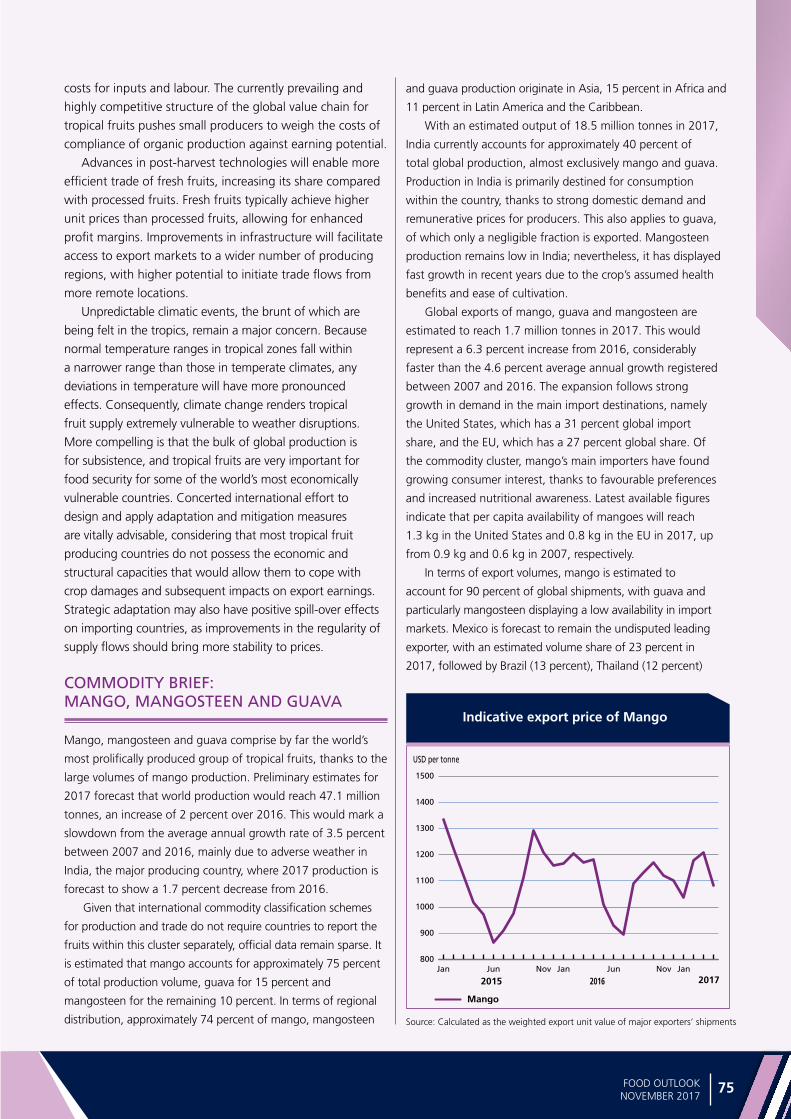
Spe
cial fe
atu
re
75FOOD OUTLOOKNOVEMBER 2017
costs for inputs and labour. The currently prevailing and
highly competitive structure of the global value chain for
tropical fruits pushes small producers to weigh the costs of
compliance of organic production against earning potential.
Advances in post-harvest technologies will enable more
efficient trade of fresh fruits, increasing its share compared
with processed fruits. Fresh fruits typically achieve higher
unit prices than processed fruits, allowing for enhanced
profit margins. Improvements in infrastructure will facilitate
access to export markets to a wider number of producing
regions, with higher potential to initiate trade flows from
more remote locations.
Unpredictable climatic events, the brunt of which are
being felt in the tropics, remain a major concern. Because
normal temperature ranges in tropical zones fall within
a narrower range than those in temperate climates, any
deviations in temperature will have more pronounced
effects. Consequently, climate change renders tropical
fruit supply extremely vulnerable to weather disruptions.
More compelling is that the bulk of global production is
for subsistence, and tropical fruits are very important for
food security for some of the world’s most economically
vulnerable countries. Concerted international effort to
design and apply adaptation and mitigation measures
are vitally advisable, considering that most tropical fruit
producing countries do not possess the economic and
structural capacities that would allow them to cope with
crop damages and subsequent impacts on export earnings.
Strategic adaptation may also have positive spill-over effects
on importing countries, as improvements in the regularity of
supply flows should bring more stability to prices.
COMMODITY BRIEF: MANGO, MANGOSTEEN AND GUAVA
Mango, mangosteen and guava comprise by far the world’s
most prolifically produced group of tropical fruits, thanks to the
large volumes of mango production. Preliminary estimates for
2017 forecast that world production would reach 47.1 million
tonnes, an increase of 2 percent over 2016. This would mark a
slowdown from the average annual growth rate of 3.5 percent
between 2007 and 2016, mainly due to adverse weather in
India, the major producing country, where 2017 production is
forecast to show a 1.7 percent decrease from 2016.
Given that international commodity classification schemes
for production and trade do not require countries to report the
fruits within this cluster separately, official data remain sparse. It
is estimated that mango accounts for approximately 75 percent
of total production volume, guava for 15 percent and
mangosteen for the remaining 10 percent. In terms of regional
distribution, approximately 74 percent of mango, mangosteen
and guava production originate in Asia, 15 percent in Africa and
11 percent in Latin America and the Caribbean.
With an estimated output of 18.5 million tonnes in 2017,
India currently accounts for approximately 40 percent of
total global production, almost exclusively mango and guava.
Production in India is primarily destined for consumption
within the country, thanks to strong domestic demand and
remunerative prices for producers. This also applies to guava,
of which only a negligible fraction is exported. Mangosteen
production remains low in India; nevertheless, it has displayed
fast growth in recent years due to the crop’s assumed health
benefits and ease of cultivation.
Global exports of mango, guava and mangosteen are
estimated to reach 1.7 million tonnes in 2017. This would
represent a 6.3 percent increase from 2016, considerably
faster than the 4.6 percent average annual growth registered
between 2007 and 2016. The expansion follows strong
growth in demand in the main import destinations, namely
the United States, which has a 31 percent global import
share, and the EU, which has a 27 percent global share. Of
the commodity cluster, mango’s main importers have found
growing consumer interest, thanks to favourable preferences
and increased nutritional awareness. Latest available figures
indicate that per capita availability of mangoes will reach
1.3 kg in the United States and 0.8 kg in the EU in 2017, up
from 0.9 kg and 0.6 kg in 2007, respectively.
In terms of export volumes, mango is estimated to
account for 90 percent of global shipments, with guava and
particularly mangosteen displaying a low availability in import
markets. Mexico is forecast to remain the undisputed leading
exporter, with an estimated volume share of 23 percent in
2017, followed by Brazil (13 percent), Thailand (12 percent)
Indicative export price of Mango
Source: Calculated as the weighted export unit value of major exporters’ shipments
800
900
1000
1100
1200
1300
1400
1500
JanNovJunJanNovJunJan
USD per tonne
2015 2016 2017
Mango
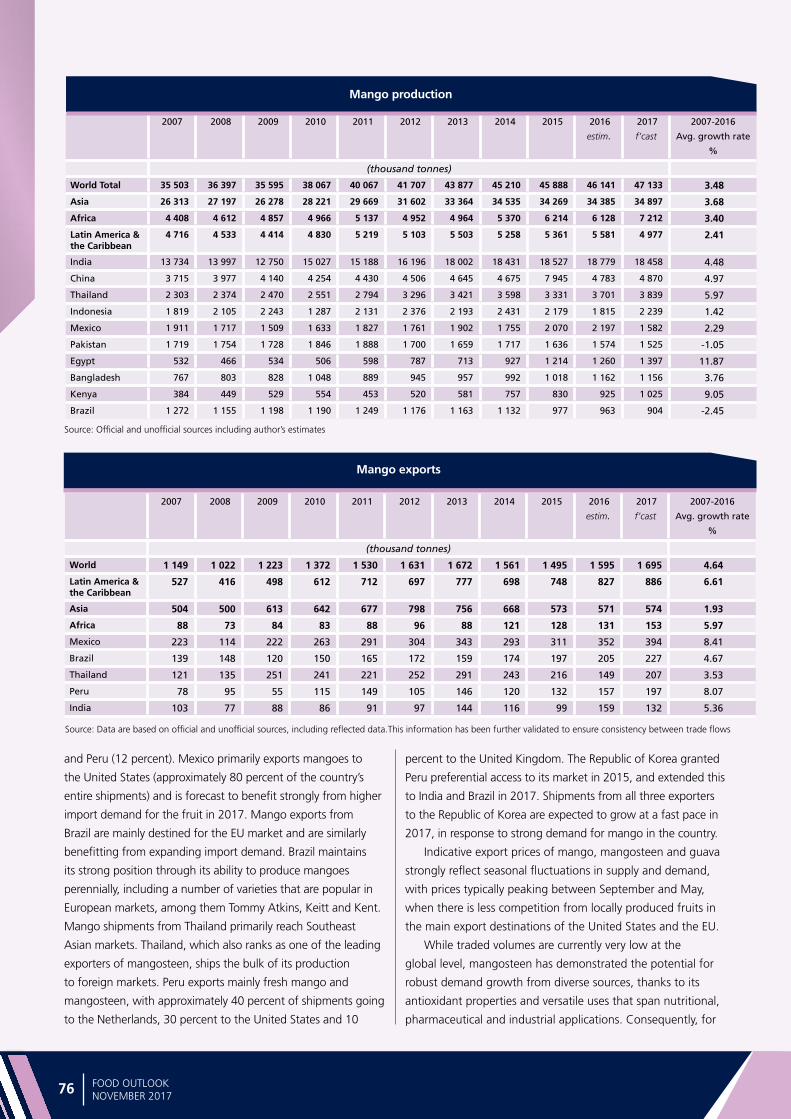
Spe
cia
l fe
atu
re
76 FOOD OUTLOOKNOVEMBER 2017
2007 2008 2009 2010 2011 2012 2013 2014 2015 2016
estim.
2017
f’cast
2007-2016
Avg. growth rate
%
(thousand tonnes)
World Total 35 503 36 397 35 595 38 067 40 067 41 707 43 877 45 210 45 888 46 141 47 133 3.48
Asia 26 313 27 197 26 278 28 221 29 669 31 602 33 364 34 535 34 269 34 385 34 897 3.68
Africa 4 408 4 612 4 857 4 966 5 137 4 952 4 964 5 370 6 214 6 128 7 212 3.40
Latin America & the Caribbean
4 716 4 533 4 414 4 830 5 219 5 103 5 503 5 258 5 361 5 581 4 977 2.41
India 13 734 13 997 12 750 15 027 15 188 16 196 18 002 18 431 18 527 18 779 18 458 4.48
China 3 715 3 977 4 140 4 254 4 430 4 506 4 645 4 675 7 945 4 783 4 870 4.97
Thailand 2 303 2 374 2 470 2 551 2 794 3 296 3 421 3 598 3 331 3 701 3 839 5.97
Indonesia 1 819 2 105 2 243 1 287 2 131 2 376 2 193 2 431 2 179 1 815 2 239 1.42
Mexico 1 911 1 717 1 509 1 633 1 827 1 761 1 902 1 755 2 070 2 197 1 582 2.29
Pakistan 1 719 1 754 1 728 1 846 1 888 1 700 1 659 1 717 1 636 1 574 1 525 -1.05
Egypt 532 466 534 506 598 787 713 927 1 214 1 260 1 397 11.87
Bangladesh 767 803 828 1 048 889 945 957 992 1 018 1 162 1 156 3.76
Kenya 384 449 529 554 453 520 581 757 830 925 1 025 9.05
Brazil 1 272 1 155 1 198 1 190 1 249 1 176 1 163 1 132 977 963 904 -2.45
Mango production
Source: Official and unofficial sources including author’s estimates
Mango exports
Source: Data are based on official and unofficial sources, including reflected data.This information has been further validated to ensure consistency between trade flows
and Peru (12 percent). Mexico primarily exports mangoes to
the United States (approximately 80 percent of the country’s
entire shipments) and is forecast to benefit strongly from higher
import demand for the fruit in 2017. Mango exports from
Brazil are mainly destined for the EU market and are similarly
benefitting from expanding import demand. Brazil maintains
its strong position through its ability to produce mangoes
perennially, including a number of varieties that are popular in
European markets, among them Tommy Atkins, Keitt and Kent.
Mango shipments from Thailand primarily reach Southeast
Asian markets. Thailand, which also ranks as one of the leading
exporters of mangosteen, ships the bulk of its production
to foreign markets. Peru exports mainly fresh mango and
mangosteen, with approximately 40 percent of shipments going
to the Netherlands, 30 percent to the United States and 10
percent to the United Kingdom. The Republic of Korea granted
Peru preferential access to its market in 2015, and extended this
to India and Brazil in 2017. Shipments from all three exporters
to the Republic of Korea are expected to grow at a fast pace in
2017, in response to strong demand for mango in the country.
Indicative export prices of mango, mangosteen and guava
strongly reflect seasonal fluctuations in supply and demand,
with prices typically peaking between September and May,
when there is less competition from locally produced fruits in
the main export destinations of the United States and the EU.
While traded volumes are currently very low at the
global level, mangosteen has demonstrated the potential for
robust demand growth from diverse sources, thanks to its
antioxidant properties and versatile uses that span nutritional,
pharmaceutical and industrial applications. Consequently, for
2007 2008 2009 2010 2011 2012 2013 2014 2015 2016
estim.
2017
f’cast
2007-2016
Avg. growth rate
%
(thousand tonnes)
World 1 149 1 022 1 223 1 372 1 530 1 631 1 672 1 561 1 495 1 595 1 695 4.64
Latin America & the Caribbean
527 416 498 612 712 697 777 698 748 827 886 6.61
Asia 504 500 613 642 677 798 756 668 573 571 574 1.93
Africa 88 73 84 83 88 96 88 121 128 131 153 5.97
Mexico 223 114 222 263 291 304 343 293 311 352 394 8.41
Brazil 139 148 120 150 165 172 159 174 197 205 227 4.67
Thailand 121 135 251 241 221 252 291 243 216 149 207 3.53
Peru 78 95 55 115 149 105 146 120 132 157 197 8.07
India 103 77 88 86 91 97 144 116 99 159 132 5.36
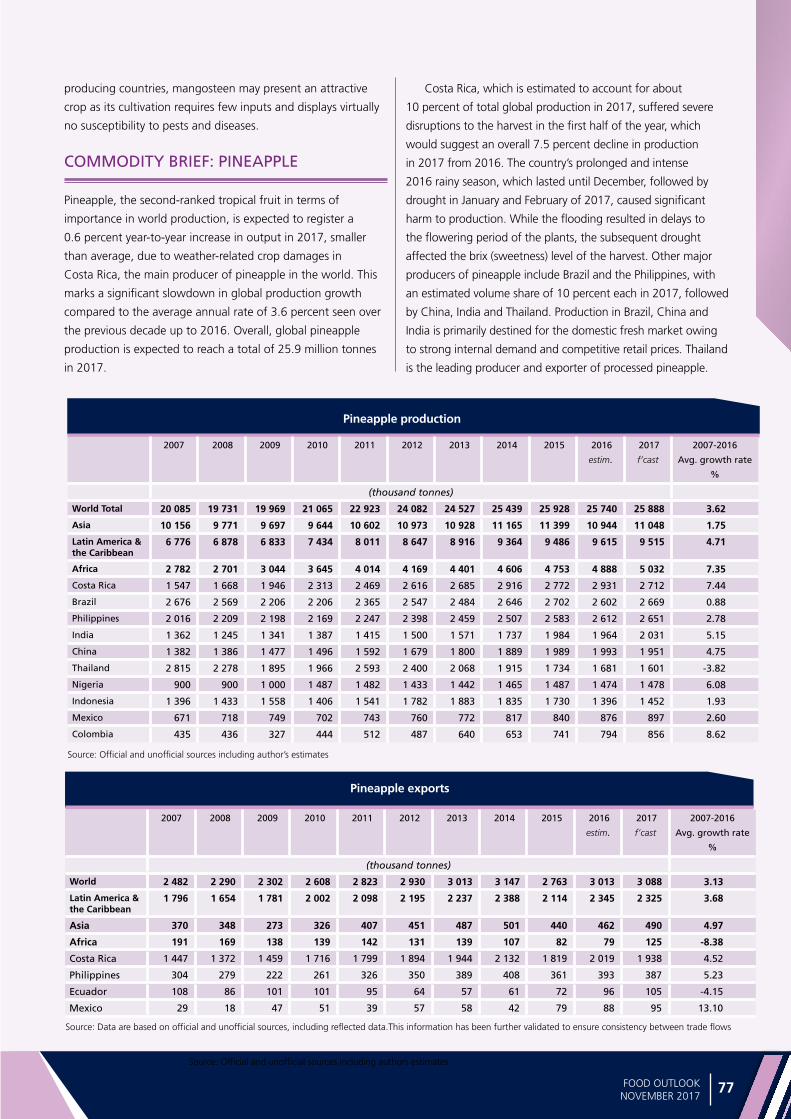
Spe
cial fe
atu
re
77FOOD OUTLOOKNOVEMBER 2017
Source: Official and unofficial sources including authors estimates
producing countries, mangosteen may present an attractive
crop as its cultivation requires few inputs and displays virtually
no susceptibility to pests and diseases.
COMMODITY BRIEF: PINEAPPLE
Pineapple, the second-ranked tropical fruit in terms of
importance in world production, is expected to register a
0.6 percent year-to-year increase in output in 2017, smaller
than average, due to weather-related crop damages in
Costa Rica, the main producer of pineapple in the world. This
marks a significant slowdown in global production growth
compared to the average annual rate of 3.6 percent seen over
the previous decade up to 2016. Overall, global pineapple
production is expected to reach a total of 25.9 million tonnes
in 2017.
Costa Rica, which is estimated to account for about
10 percent of total global production in 2017, suffered severe
disruptions to the harvest in the first half of the year, which
would suggest an overall 7.5 percent decline in production
in 2017 from 2016. The country’s prolonged and intense
2016 rainy season, which lasted until December, followed by
drought in January and February of 2017, caused significant
harm to production. While the flooding resulted in delays to
the flowering period of the plants, the subsequent drought
affected the brix (sweetness) level of the harvest. Other major
producers of pineapple include Brazil and the Philippines, with
an estimated volume share of 10 percent each in 2017, followed
by China, India and Thailand. Production in Brazil, China and
India is primarily destined for the domestic fresh market owing
to strong internal demand and competitive retail prices. Thailand
is the leading producer and exporter of processed pineapple.
Pineapple production
Source: Official and unofficial sources including author’s estimates
Pineapple exports
Source: Data are based on official and unofficial sources, including reflected data.This information has been further validated to ensure consistency between trade flows
2007 2008 2009 2010 2011 2012 2013 2014 2015 2016
estim.
2017
f’cast
2007-2016
Avg. growth rate
%
(thousand tonnes)
World 2 482 2 290 2 302 2 608 2 823 2 930 3 013 3 147 2 763 3 013 3 088 3.13
Latin America & the Caribbean
1 796 1 654 1 781 2 002 2 098 2 195 2 237 2 388 2 114 2 345 2 325 3.68
Asia 370 348 273 326 407 451 487 501 440 462 490 4.97
Africa 191 169 138 139 142 131 139 107 82 79 125 -8.38
Costa Rica 1 447 1 372 1 459 1 716 1 799 1 894 1 944 2 132 1 819 2 019 1 938 4.52
Philippines 304 279 222 261 326 350 389 408 361 393 387 5.23
Ecuador 108 86 101 101 95 64 57 61 72 96 105 -4.15
Mexico 29 18 47 51 39 57 58 42 79 88 95 13.10
2007 2008 2009 2010 2011 2012 2013 2014 2015 2016
estim.
2017
f’cast
2007-2016
Avg. growth rate
%
(thousand tonnes)
World Total 20 085 19 731 19 969 21 065 22 923 24 082 24 527 25 439 25 928 25 740 25 888 3.62
Asia 10 156 9 771 9 697 9 644 10 602 10 973 10 928 11 165 11 399 10 944 11 048 1.75
Latin America & the Caribbean
6 776 6 878 6 833 7 434 8 011 8 647 8 916 9 364 9 486 9 615 9 515 4.71
Africa 2 782 2 701 3 044 3 645 4 014 4 169 4 401 4 606 4 753 4 888 5 032 7.35
Costa Rica 1 547 1 668 1 946 2 313 2 469 2 616 2 685 2 916 2 772 2 931 2 712 7.44
Brazil 2 676 2 569 2 206 2 206 2 365 2 547 2 484 2 646 2 702 2 602 2 669 0.88
Philippines 2 016 2 209 2 198 2 169 2 247 2 398 2 459 2 507 2 583 2 612 2 651 2.78
India 1 362 1 245 1 341 1 387 1 415 1 500 1 571 1 737 1 984 1 964 2 031 5.15
China 1 382 1 386 1 477 1 496 1 592 1 679 1 800 1 889 1 989 1 993 1 951 4.75
Thailand 2 815 2 278 1 895 1 966 2 593 2 400 2 068 1 915 1 734 1 681 1 601 -3.82
Nigeria 900 900 1 000 1 487 1 482 1 433 1 442 1 465 1 487 1 474 1 478 6.08
Indonesia 1 396 1 433 1 558 1 406 1 541 1 782 1 883 1 835 1 730 1 396 1 452 1.93
Mexico 671 718 749 702 743 760 772 817 840 876 897 2.60
Colombia 435 436 327 444 512 487 640 653 741 794 856 8.62
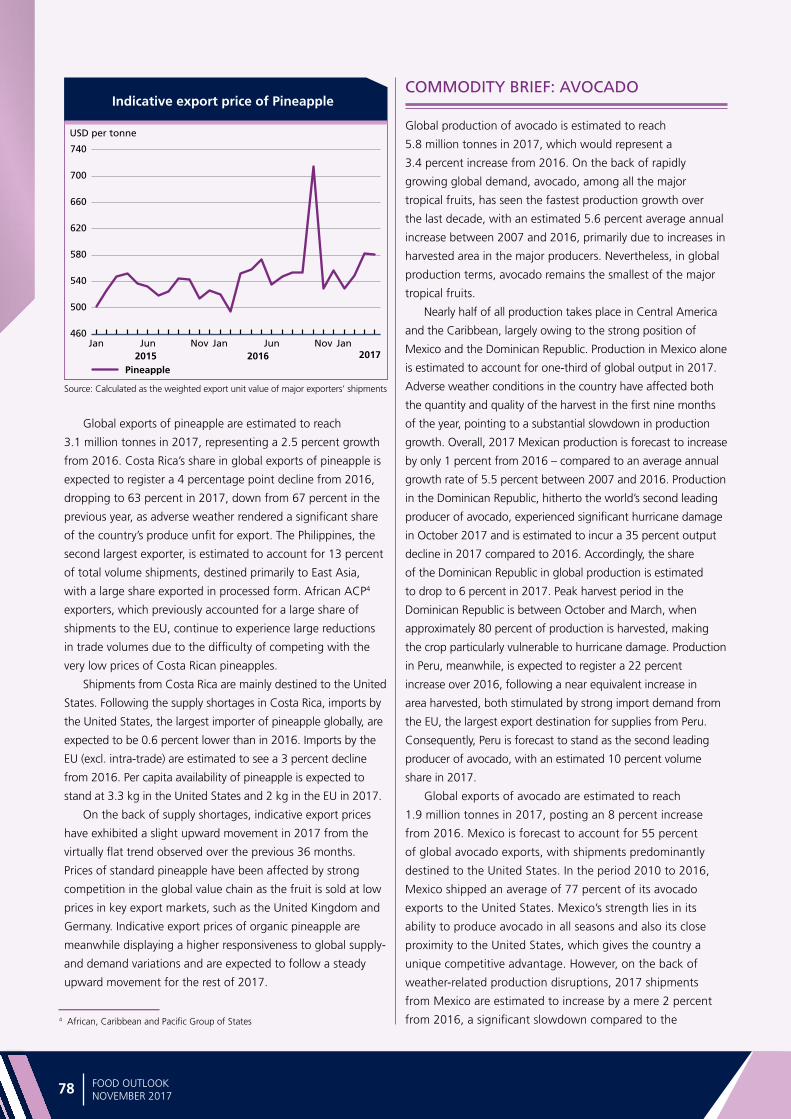
Spe
cia
l fe
atu
re
78 FOOD OUTLOOKNOVEMBER 2017
Global exports of pineapple are estimated to reach
3.1 million tonnes in 2017, representing a 2.5 percent growth
from 2016. Costa Rica’s share in global exports of pineapple is
expected to register a 4 percentage point decline from 2016,
dropping to 63 percent in 2017, down from 67 percent in the
previous year, as adverse weather rendered a significant share
of the country’s produce unfit for export. The Philippines, the
second largest exporter, is estimated to account for 13 percent
of total volume shipments, destined primarily to East Asia,
with a large share exported in processed form. African ACP4
exporters, which previously accounted for a large share of
shipments to the EU, continue to experience large reductions
in trade volumes due to the difficulty of competing with the
very low prices of Costa Rican pineapples.
Shipments from Costa Rica are mainly destined to the United
States. Following the supply shortages in Costa Rica, imports by
the United States, the largest importer of pineapple globally, are
expected to be 0.6 percent lower than in 2016. Imports by the
EU (excl. intra-trade) are estimated to see a 3 percent decline
from 2016. Per capita availability of pineapple is expected to
stand at 3.3 kg in the United States and 2 kg in the EU in 2017.
On the back of supply shortages, indicative export prices
have exhibited a slight upward movement in 2017 from the
virtually flat trend observed over the previous 36 months.
Prices of standard pineapple have been affected by strong
competition in the global value chain as the fruit is sold at low
prices in key export markets, such as the United Kingdom and
Germany. Indicative export prices of organic pineapple are
meanwhile displaying a higher responsiveness to global supply-
and demand variations and are expected to follow a steady
upward movement for the rest of 2017.
Indicative export price of Pineapple
Source: Calculated as the weighted export unit value of major exporters’ shipments
460
500
540
580
620
660
700
740
JanNovJunJanNovJunJan
USD per tonne
2015 2016 2017
Pineapple
COMMODITY BRIEF: AVOCADO
Global production of avocado is estimated to reach
5.8 million tonnes in 2017, which would represent a
3.4 percent increase from 2016. On the back of rapidly
growing global demand, avocado, among all the major
tropical fruits, has seen the fastest production growth over
the last decade, with an estimated 5.6 percent average annual
increase between 2007 and 2016, primarily due to increases in
harvested area in the major producers. Nevertheless, in global
production terms, avocado remains the smallest of the major
tropical fruits.
Nearly half of all production takes place in Central America
and the Caribbean, largely owing to the strong position of
Mexico and the Dominican Republic. Production in Mexico alone
is estimated to account for one-third of global output in 2017.
Adverse weather conditions in the country have affected both
the quantity and quality of the harvest in the first nine months
of the year, pointing to a substantial slowdown in production
growth. Overall, 2017 Mexican production is forecast to increase
by only 1 percent from 2016 – compared to an average annual
growth rate of 5.5 percent between 2007 and 2016. Production
in the Dominican Republic, hitherto the world’s second leading
producer of avocado, experienced significant hurricane damage
in October 2017 and is estimated to incur a 35 percent output
decline in 2017 compared to 2016. Accordingly, the share
of the Dominican Republic in global production is estimated
to drop to 6 percent in 2017. Peak harvest period in the
Dominican Republic is between October and March, when
approximately 80 percent of production is harvested, making
the crop particularly vulnerable to hurricane damage. Production
in Peru, meanwhile, is expected to register a 22 percent
increase over 2016, following a near equivalent increase in
area harvested, both stimulated by strong import demand from
the EU, the largest export destination for supplies from Peru.
Consequently, Peru is forecast to stand as the second leading
producer of avocado, with an estimated 10 percent volume
share in 2017.
Global exports of avocado are estimated to reach
1.9 million tonnes in 2017, posting an 8 percent increase
from 2016. Mexico is forecast to account for 55 percent
of global avocado exports, with shipments predominantly
destined to the United States. In the period 2010 to 2016,
Mexico shipped an average of 77 percent of its avocado
exports to the United States. Mexico’s strength lies in its
ability to produce avocado in all seasons and also its close
proximity to the United States, which gives the country a
unique competitive advantage. However, on the back of
weather-related production disruptions, 2017 shipments
from Mexico are estimated to increase by a mere 2 percent
from 2016, a significant slowdown compared to the 4 African, Caribbean and Pacific Group of States
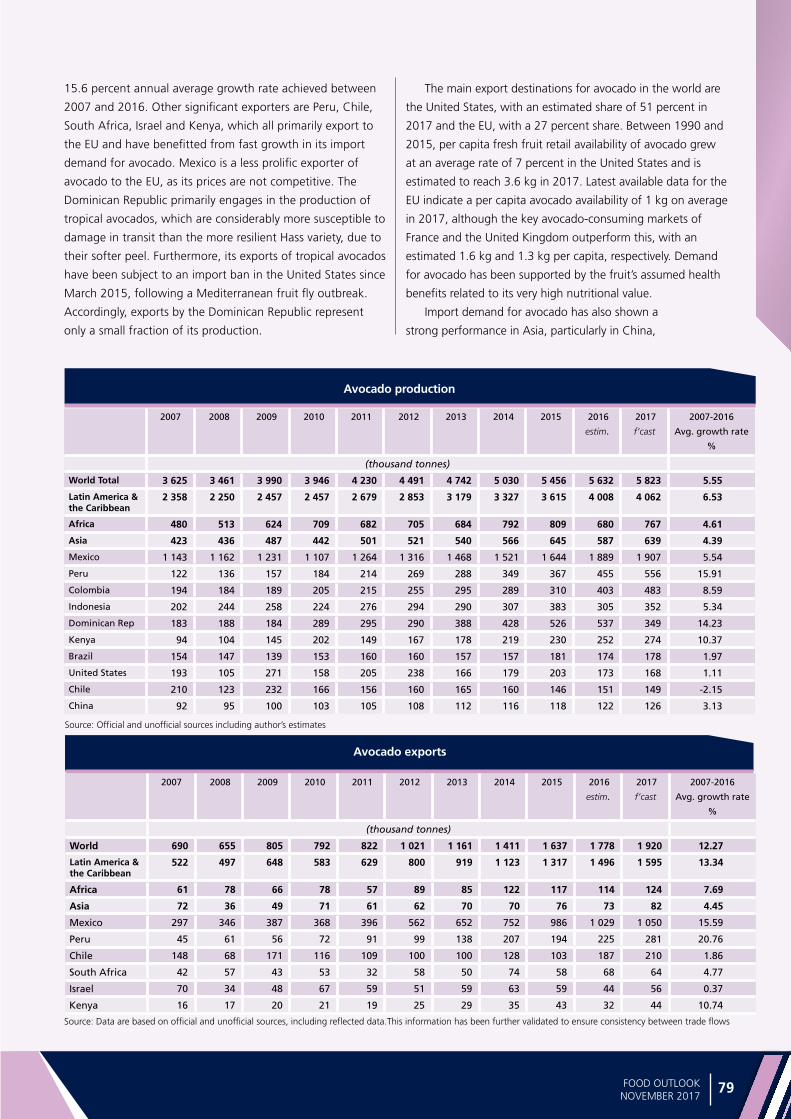
Spe
cial fe
atu
re
79FOOD OUTLOOKNOVEMBER 2017
15.6 percent annual average growth rate achieved between
2007 and 2016. Other significant exporters are Peru, Chile,
South Africa, Israel and Kenya, which all primarily export to
the EU and have benefitted from fast growth in its import
demand for avocado. Mexico is a less prolific exporter of
avocado to the EU, as its prices are not competitive. The
Dominican Republic primarily engages in the production of
tropical avocados, which are considerably more susceptible to
damage in transit than the more resilient Hass variety, due to
their softer peel. Furthermore, its exports of tropical avocados
have been subject to an import ban in the United States since
March 2015, following a Mediterranean fruit fly outbreak.
Accordingly, exports by the Dominican Republic represent
only a small fraction of its production.
The main export destinations for avocado in the world are
the United States, with an estimated share of 51 percent in
2017 and the EU, with a 27 percent share. Between 1990 and
2015, per capita fresh fruit retail availability of avocado grew
at an average rate of 7 percent in the United States and is
estimated to reach 3.6 kg in 2017. Latest available data for the
EU indicate a per capita avocado availability of 1 kg on average
in 2017, although the key avocado-consuming markets of
France and the United Kingdom outperform this, with an
estimated 1.6 kg and 1.3 kg per capita, respectively. Demand
for avocado has been supported by the fruit’s assumed health
benefits related to its very high nutritional value.
Import demand for avocado has also shown a
strong performance in Asia, particularly in China,
Avocado production
Source: Official and unofficial sources including author’s estimates
Avocado exports
Source: Data are based on official and unofficial sources, including reflected data.This information has been further validated to ensure consistency between trade flows
2007 2008 2009 2010 2011 2012 2013 2014 2015 2016
estim.
2017
f’cast
2007-2016
Avg. growth rate
%
(thousand tonnes)
World Total 3 625 3 461 3 990 3 946 4 230 4 491 4 742 5 030 5 456 5 632 5 823 5.55
Latin America & the Caribbean
2 358 2 250 2 457 2 457 2 679 2 853 3 179 3 327 3 615 4 008 4 062 6.53
Africa 480 513 624 709 682 705 684 792 809 680 767 4.61
Asia 423 436 487 442 501 521 540 566 645 587 639 4.39
Mexico 1 143 1 162 1 231 1 107 1 264 1 316 1 468 1 521 1 644 1 889 1 907 5.54
Peru 122 136 157 184 214 269 288 349 367 455 556 15.91
Colombia 194 184 189 205 215 255 295 289 310 403 483 8.59
Indonesia 202 244 258 224 276 294 290 307 383 305 352 5.34
Dominican Rep 183 188 184 289 295 290 388 428 526 537 349 14.23
Kenya 94 104 145 202 149 167 178 219 230 252 274 10.37
Brazil 154 147 139 153 160 160 157 157 181 174 178 1.97
United States 193 105 271 158 205 238 166 179 203 173 168 1.11
Chile 210 123 232 166 156 160 165 160 146 151 149 -2.15
China 92 95 100 103 105 108 112 116 118 122 126 3.13
2007 2008 2009 2010 2011 2012 2013 2014 2015 2016
estim.
2017
f’cast
2007-2016
Avg. growth rate
%
(thousand tonnes)
World 690 655 805 792 822 1 021 1 161 1 411 1 637 1 778 1 920 12.27
Latin America & the Caribbean
522 497 648 583 629 800 919 1 123 1 317 1 496 1 595 13.34
Africa 61 78 66 78 57 89 85 122 117 114 124 7.69
Asia 72 36 49 71 61 62 70 70 76 73 82 4.45
Mexico 297 346 387 368 396 562 652 752 986 1 029 1 050 15.59
Peru 45 61 56 72 91 99 138 207 194 225 281 20.76
Chile 148 68 171 116 109 100 100 128 103 187 210 1.86
South Africa 42 57 43 53 32 58 50 74 58 68 64 4.77
Israel 70 34 48 67 59 51 59 63 59 44 56 0.37
Kenya 16 17 20 21 19 25 29 35 43 32 44 10.74
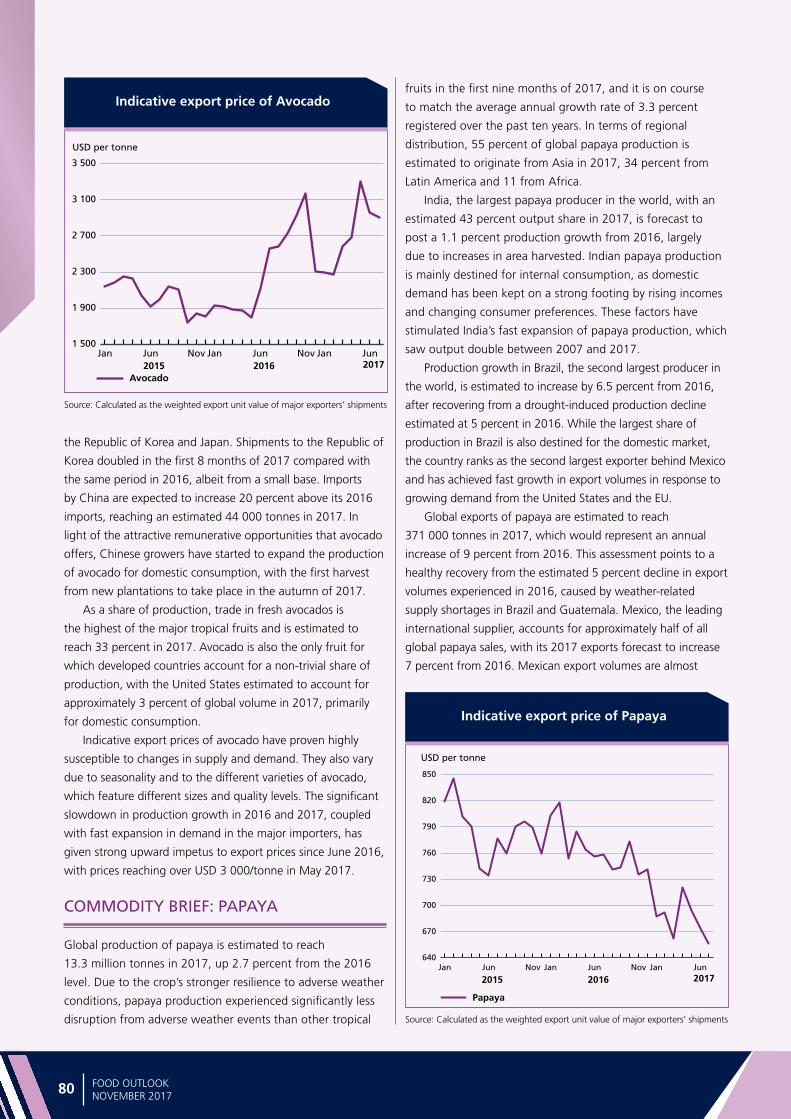
Spe
cia
l fe
atu
re
80 FOOD OUTLOOKNOVEMBER 2017
Indicative export price of Avocado
Source: Calculated as the weighted export unit value of major exporters’ shipments
1 500
1 900
2 300
2 700
3 100
3 500
JunJanNovJunJanNovJunJan
USD per tonne
2015 2016 2017Avocado
Indicative export price of Papaya
Source: Calculated as the weighted export unit value of major exporters’ shipments
the Republic of Korea and Japan. Shipments to the Republic of
Korea doubled in the first 8 months of 2017 compared with
the same period in 2016, albeit from a small base. Imports
by China are expected to increase 20 percent above its 2016
imports, reaching an estimated 44 000 tonnes in 2017. In
light of the attractive remunerative opportunities that avocado
offers, Chinese growers have started to expand the production
of avocado for domestic consumption, with the first harvest
from new plantations to take place in the autumn of 2017.
As a share of production, trade in fresh avocados is
the highest of the major tropical fruits and is estimated to
reach 33 percent in 2017. Avocado is also the only fruit for
which developed countries account for a non-trivial share of
production, with the United States estimated to account for
approximately 3 percent of global volume in 2017, primarily
for domestic consumption.
Indicative export prices of avocado have proven highly
susceptible to changes in supply and demand. They also vary
due to seasonality and to the different varieties of avocado,
which feature different sizes and quality levels. The significant
slowdown in production growth in 2016 and 2017, coupled
with fast expansion in demand in the major importers, has
given strong upward impetus to export prices since June 2016,
with prices reaching over USD 3 000/tonne in May 2017.
COMMODITY BRIEF: PAPAYA
Global production of papaya is estimated to reach
13.3 million tonnes in 2017, up 2.7 percent from the 2016
level. Due to the crop’s stronger resilience to adverse weather
conditions, papaya production experienced significantly less
disruption from adverse weather events than other tropical
fruits in the first nine months of 2017, and it is on course
to match the average annual growth rate of 3.3 percent
registered over the past ten years. In terms of regional
distribution, 55 percent of global papaya production is
estimated to originate from Asia in 2017, 34 percent from
Latin America and 11 from Africa.
India, the largest papaya producer in the world, with an
estimated 43 percent output share in 2017, is forecast to
post a 1.1 percent production growth from 2016, largely
due to increases in area harvested. Indian papaya production
is mainly destined for internal consumption, as domestic
demand has been kept on a strong footing by rising incomes
and changing consumer preferences. These factors have
stimulated India’s fast expansion of papaya production, which
saw output double between 2007 and 2017.
Production growth in Brazil, the second largest producer in
the world, is estimated to increase by 6.5 percent from 2016,
after recovering from a drought-induced production decline
estimated at 5 percent in 2016. While the largest share of
production in Brazil is also destined for the domestic market,
the country ranks as the second largest exporter behind Mexico
and has achieved fast growth in export volumes in response to
growing demand from the United States and the EU.
Global exports of papaya are estimated to reach
371 000 tonnes in 2017, which would represent an annual
increase of 9 percent from 2016. This assessment points to a
healthy recovery from the estimated 5 percent decline in export
volumes experienced in 2016, caused by weather-related
supply shortages in Brazil and Guatemala. Mexico, the leading
international supplier, accounts for approximately half of all
global papaya sales, with its 2017 exports forecast to increase
7 percent from 2016. Mexican export volumes are almost
640
670
700
730
760
790
820
850
JunJanNovJunJanNovJunJan
USD per tonne
2015 2016 2017
Papaya
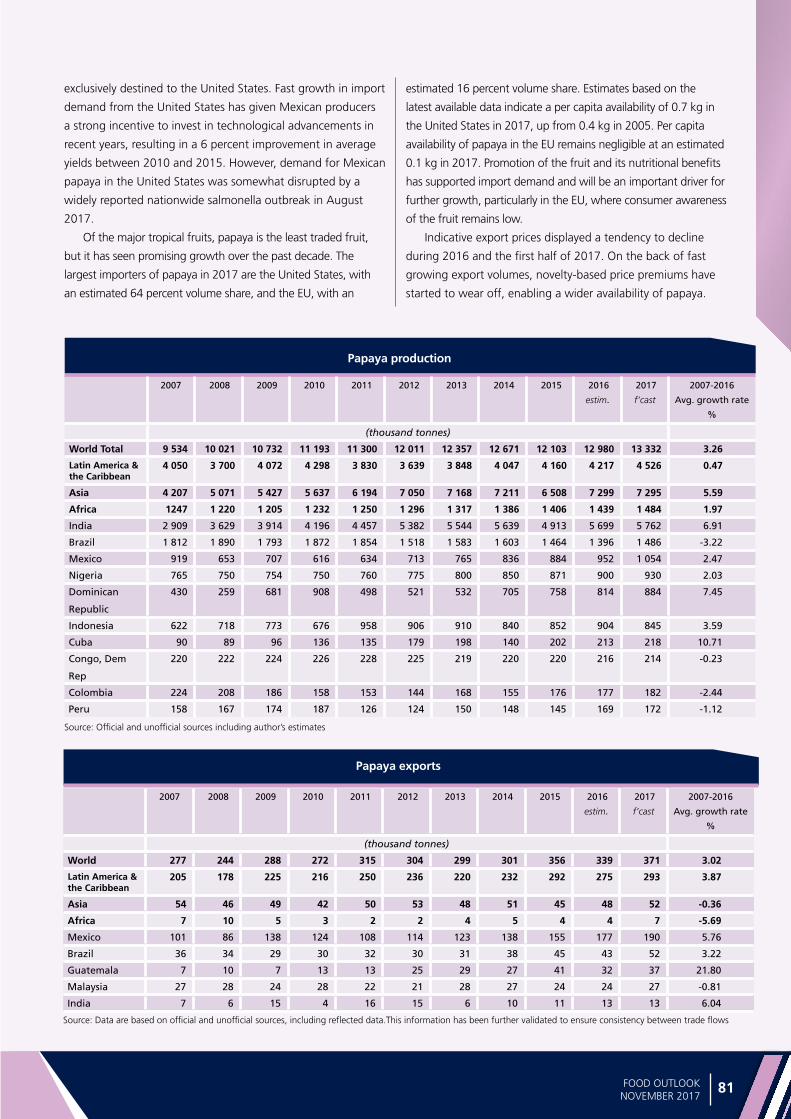
Spe
cial fe
atu
re
81FOOD OUTLOOKNOVEMBER 2017
exclusively destined to the United States. Fast growth in import
demand from the United States has given Mexican producers
a strong incentive to invest in technological advancements in
recent years, resulting in a 6 percent improvement in average
yields between 2010 and 2015. However, demand for Mexican
papaya in the United States was somewhat disrupted by a
widely reported nationwide salmonella outbreak in August
2017.
Of the major tropical fruits, papaya is the least traded fruit,
but it has seen promising growth over the past decade. The
largest importers of papaya in 2017 are the United States, with
an estimated 64 percent volume share, and the EU, with an
estimated 16 percent volume share. Estimates based on the
latest available data indicate a per capita availability of 0.7 kg in
the United States in 2017, up from 0.4 kg in 2005. Per capita
availability of papaya in the EU remains negligible at an estimated
0.1 kg in 2017. Promotion of the fruit and its nutritional benefits
has supported import demand and will be an important driver for
further growth, particularly in the EU, where consumer awareness
of the fruit remains low.
Indicative export prices displayed a tendency to decline
during 2016 and the first half of 2017. On the back of fast
growing export volumes, novelty-based price premiums have
started to wear off, enabling a wider availability of papaya.
Papaya production
Source: Official and unofficial sources including author’s estimates
2007 2008 2009 2010 2011 2012 2013 2014 2015 2016
estim.
2017
f’cast
2007-2016
Avg. growth rate
%
(thousand tonnes)
World Total 9 534 10 021 10 732 11 193 11 300 12 011 12 357 12 671 12 103 12 980 13 332 3.26
Latin America & the Caribbean
4 050 3 700 4 072 4 298 3 830 3 639 3 848 4 047 4 160 4 217 4 526 0.47
Asia 4 207 5 071 5 427 5 637 6 194 7 050 7 168 7 211 6 508 7 299 7 295 5.59
Africa 1247 1 220 1 205 1 232 1 250 1 296 1 317 1 386 1 406 1 439 1 484 1.97
India 2 909 3 629 3 914 4 196 4 457 5 382 5 544 5 639 4 913 5 699 5 762 6.91
Brazil 1 812 1 890 1 793 1 872 1 854 1 518 1 583 1 603 1 464 1 396 1 486 -3.22
Mexico 919 653 707 616 634 713 765 836 884 952 1 054 2.47
Nigeria 765 750 754 750 760 775 800 850 871 900 930 2.03
Dominican
Republic
430 259 681 908 498 521 532 705 758 814 884 7.45
Indonesia 622 718 773 676 958 906 910 840 852 904 845 3.59
Cuba 90 89 96 136 135 179 198 140 202 213 218 10.71
Congo, Dem
Rep
220 222 224 226 228 225 219 220 220 216 214 -0.23
Colombia 224 208 186 158 153 144 168 155 176 177 182 -2.44
Peru 158 167 174 187 126 124 150 148 145 169 172 -1.12
Papaya exports
Source: Data are based on official and unofficial sources, including reflected data.This information has been further validated to ensure consistency between trade flows
2007 2008 2009 2010 2011 2012 2013 2014 2015 2016
estim.
2017
f’cast
2007-2016
Avg. growth rate
%
(thousand tonnes)
World 277 244 288 272 315 304 299 301 356 339 371 3.02
Latin America & the Caribbean
205 178 225 216 250 236 220 232 292 275 293 3.87
Asia 54 46 49 42 50 53 48 51 45 48 52 -0.36
Africa 7 10 5 3 2 2 4 5 4 4 7 -5.69
Mexico 101 86 138 124 108 114 123 138 155 177 190 5.76
Brazil 36 34 29 30 32 30 31 38 45 43 52 3.22
Guatemala 7 10 7 13 13 25 29 27 41 32 37 21.80
Malaysia 27 28 24 28 22 21 28 27 24 24 27 -0.81
India 7 6 15 4 16 15 6 10 11 13 13 6.04
82 83
MA
JOR
POLI
CY
DEV
ELO
PMEN
TS
MAR
KET
POLIC
Y
DEVE
LOPM
ENTS
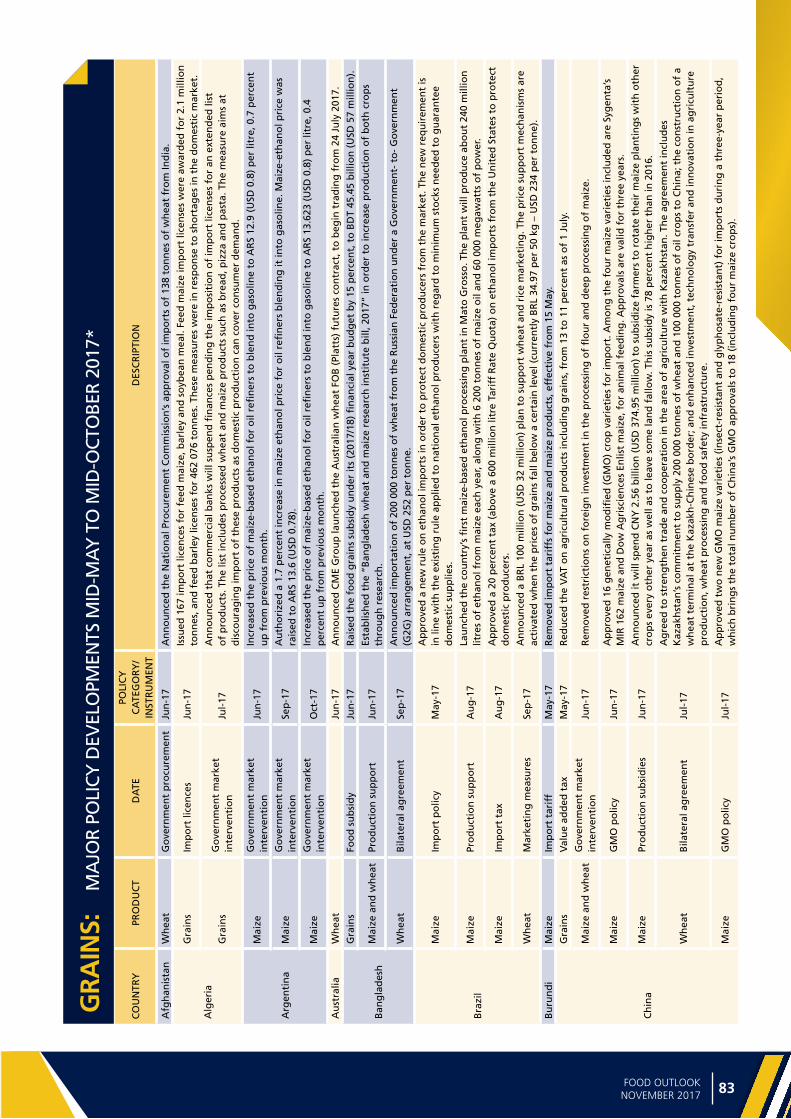
82 83FOOD OUTLOOKNOVEMBER 2017
GR
AIN
S
GRA
INS:
M
AJO
R PO
LICY
DEV
ELO
PMEN
TS M
ID-M
AY
TO
MID
-OCT
OBE
R 20
17*
CO
UN
TRY
PRO
DU
CT
DA
TEPO
LIC
Y
CA
TEG
OR
Y/
INST
RU
MEN
TD
ESC
RIP
TIO
N
Afg
han
ista
nW
hea
tG
ove
rnm
ent
pro
cure
men
tJu
n-1
7A
nn
ou
nce
d t
he
Nat
ion
al P
rocu
rem
ent
Co
mm
issi
on
’s a
pp
rova
l of
imp
ort
s o
f 13
8 to
nn
es o
f w
hea
t fr
om
Ind
ia.
Alg
eria
Gra
ins
Imp
ort
lice
nce
sJu
n-1
7Is
sued
167
imp
ort
lice
nce
s fo
r fe
ed m
aize
, bar
ley
and
so
ybea
n m
eal.
Feed
mai
ze im
po
rt li
cen
ses
wer
e aw
ard
ed f
or
2.1
mill
ion
to
nn
es, a
nd
fee
d b
arle
y lic
ense
s fo
r 46
2 07
6 to
nn
es. T
hes
e m
easu
res
wer
e in
res
po
nse
to
sh
ort
ages
in t
he
do
mes
tic
mar
ket.
Gra
ins
Go
vern
men
t m
arke
t in
terv
enti
on
Jul-
17A
nn
ou
nce
d t
hat
co
mm
erci
al b
anks
will
su
spen
d fi
nan
ces
pen
din
g t
he
imp
osi
tio
n o
f im
po
rt li
cen
ses
for
an e
xten
ded
list
o
f p
rod
uct
s. T
he
list
incl
ud
es p
roce
ssed
wh
eat
and
mai
ze p
rod
uct
s su
ch a
s b
read
, piz
za a
nd
pas
ta. T
he
mea
sure
aim
s at
d
isco
ura
gin
g im
po
rt o
f th
ese
pro
du
cts
as d
om
esti
c p
rod
uct
ion
can
co
ver
con
sum
er d
eman
d.
Arg
enti
na
Mai
zeG
ove
rnm
ent
mar
ket
inte
rven
tio
nJu
n-1
7In
crea
sed
th
e p
rice
of
mai
ze-b
ased
eth
ano
l fo
r o
il re
fin
ers
to b
len
d in
to g
aso
line
to A
RS
12.9
(U
SD 0
.8)
per
litr
e, 0
.7 p
erce
nt
up
fro
m p
revi
ou
s m
on
th.
Mai
zeG
ove
rnm
ent
mar
ket
inte
rven
tio
nSe
p-1
7A
uth
ori
zed
a 1
.7 p
erce
nt
incr
ease
in m
aize
eth
ano
l pri
ce f
or
oil
refi
ner
s b
len
din
g it
into
gas
olin
e. M
aize
-eth
ano
l pri
ce w
as
rais
ed t
o A
RS
13.6
(U
SD 0
.78)
.
Mai
zeG
ove
rnm
ent
mar
ket
inte
rven
tio
nO
ct-1
7In
crea
sed
th
e p
rice
of
mai
ze-b
ased
eth
ano
l fo
r o
il re
fin
ers
to b
len
d in
to g
aso
line
to A
RS
13.6
23 (
USD
0.8
) p
er li
tre,
0.4
p
erce
nt
up
fro
m p
revi
ou
s m
on
th.
Au
stra
liaW
hea
tJu
n-1
7A
nn
ou
nce
d C
ME
Gro
up
lau
nch
ed t
he
Au
stra
lian
wh
eat
FOB
(Pl
atts
) fu
ture
s co
ntr
act,
to
beg
in t
rad
ing
fro
m 2
4 Ju
ly 2
017.
Ban
gla
des
h
Gra
ins
Foo
d s
ub
sid
yJu
n-1
7R
aise
d t
he
foo
d g
rain
s su
bsi
dy
un
der
its
(201
7/18
) fi
nan
cial
yea
r b
ud
get
by
15 p
erce
nt,
to
BD
T 45
.45
bill
ion
(U
SD 5
7 m
illio
n).
Mai
ze a
nd
wh
eat
Pro
du
ctio
n s
up
po
rtJu
n-1
7Es
tab
lish
ed t
he
“Ban
gla
des
h w
hea
t an
d m
aize
res
earc
h in
stit
ute
bill
, 201
7” in
ord
er t
o in
crea
se p
rod
uct
ion
of
bo
th c
rop
s th
rou
gh
res
earc
h.
Wh
eat
Bila
tera
l ag
reem
ent
Sep
-17
An
no
un
ced
imp
ort
atio
n o
f 20
0 00
0 to
nn
es o
f w
hea
t fr
om
th
e R
uss
ian
Fed
erat
ion
un
der
a G
ove
rnm
ent-
to
- G
ove
rnm
ent
(G2G
) ar
ran
gem
ent,
at
USD
252
per
to
nn
e.
Bra
zil
Mai
zeIm
po
rt p
olic
yM
ay-1
7A
pp
rove
d a
new
ru
le o
n e
than
ol i
mp
ort
s in
ord
er t
o p
rote
ct d
om
esti
c p
rod
uce
rs f
rom
th
e m
arke
t. T
he
new
req
uir
emen
t is
in
lin
e w
ith
th
e ex
isti
ng
ru
le a
pp
lied
to
nat
ion
al e
than
ol p
rod
uce
rs w
ith
reg
ard
to
min
imu
m s
tock
s n
eed
ed t
o g
uar
ante
e d
om
esti
c su
pp
lies.
Mai
zePr
od
uct
ion
su
pp
ort
Au
g-1
7La
un
ched
th
e co
un
try’
s fi
rst
mai
ze-b
ased
eth
ano
l pro
cess
ing
pla
nt
in M
ato
Gro
sso
. Th
e p
lan
t w
ill p
rod
uce
ab
ou
t 24
0 m
illio
n
litre
s o
f et
han
ol f
rom
mai
ze e
ach
yea
r, al
on
g w
ith
6 2
00 t
on
nes
of
mai
ze o
il an
d 6
0 00
0 m
egaw
atts
of
po
wer
.
Mai
zeIm
po
rt t
axA
ug
-17
Ap
pro
ved
a 2
0 p
erce
nt
tax
(ab
ove
a 6
00 m
illio
n li
tre
Tari
ff R
ate
Qu
ota
) o
n e
than
ol i
mp
ort
s fr
om
th
e U
nit
ed S
tate
s to
pro
tect
d
om
esti
c p
rod
uce
rs.
Wh
eat
Mar
keti
ng
mea
sure
sSe
p-1
7A
nn
ou
nce
d a
BR
L 10
0 m
illio
n (
USD
32
mill
ion
) p
lan
to
su
pp
ort
wh
eat
and
ric
e m
arke
tin
g. T
he
pri
ce s
up
po
rt m
ech
anis
ms
are
acti
vate
d w
hen
th
e p
rice
s o
f g
rain
s fa
ll b
elo
w a
cer
tain
leve
l (cu
rren
tly
BR
L 34
.97
per
50
kg –
USD
234
per
to
nn
e).
Bu
run
di
Mai
zeIm
po
rt t
arif
fM
ay-1
7R
emo
ved
imp
ort
tar
iffs
fo
r m
aize
an
d m
aize
pro
du
cts,
eff
ecti
ve f
rom
15
May
.
Ch
ina
Gra
ins
Val
ue
add
ed t
axM
ay-1
7R
edu
ced
th
e V
AT
on
ag
ricu
ltu
ral p
rod
uct
s in
clu
din
g g
rain
s, f
rom
13
to 1
1 p
erce
nt
as o
f 1
July
.
Mai
ze a
nd
wh
eat
Go
vern
men
t m
arke
t in
terv
enti
on
Jun
-17
Rem
ove
d r
estr
icti
on
s o
n f
ore
ign
inve
stm
ent
in t
he
pro
cess
ing
of
flo
ur
and
dee
p p
roce
ssin
g o
f m
aize
.
Mai
zeG
MO
po
licy
Jun
-17
Ap
pro
ved
16
gen
etic
ally
mo
difi
ed (
GM
O)
cro
p v
arie
ties
fo
r im
po
rt. A
mo
ng
th
e fo
ur
mai
ze v
arie
ties
incl
ud
ed a
re S
ygen
ta’s
M
IR 1
62 m
aize
an
d D
ow
Ag
risc
ien
ces
Enlis
t m
aize
, fo
r an
imal
fee
din
g. A
pp
rova
ls a
re v
alid
fo
r th
ree
year
s.
Mai
zePr
od
uct
ion
su
bsi
die
sJu
n-1
7A
nn
ou
nce
d it
will
sp
end
CN
Y 2
.56
bill
ion
(U
SD 3
74.9
5 m
illio
n)
to s
ub
sid
ize
farm
ers
to r
ota
te t
hei
r m
aize
pla
nti
ng
s w
ith
oth
er
cro
ps
ever
y o
ther
yea
r as
wel
l as
to le
ave
som
e la
nd
fal
low
. Th
is s
ub
sid
y is
78
per
cen
t h
igh
er t
han
in 2
016.
Wh
eat
Bila
tera
l ag
reem
ent
Jul-
17
Ag
reed
to
str
eng
then
tra
de
and
co
op
erat
ion
in t
he
area
of
agri
cult
ure
wit
h K
azak
hst
an. T
he
agre
emen
t in
clu
des
K
azak
hst
an’s
co
mm
itm
ent
to s
up
ply
200
000
to
nn
es o
f w
hea
t an
d 1
00 0
00 t
on
nes
of
oil
cro
ps
to C
hin
a; t
he
con
stru
ctio
n o
f a
wh
eat
term
inal
at
the
Kaz
akh
-Ch
ines
e b
ord
er; a
nd
en
han
ced
inve
stm
ent,
tec
hn
olo
gy
tran
sfer
an
d in
no
vati
on
in a
gri
cult
ure
p
rod
uct
ion
, wh
eat
pro
cess
ing
an
d f
oo
d s
afet
y in
fras
tru
ctu
re.
Mai
zeG
MO
po
licy
Jul-
17A
pp
rove
d t
wo
new
GM
O m
aize
var
ieti
es (
inse
ct-r
esis
tan
t an
d g
lyp
ho
sate
-res
ista
nt)
fo
r im
po
rts
du
rin
g a
th
ree-
year
per
iod
, w
hic
h b
rin
gs
the
tota
l nu
mb
er o
f C
hin
a’s
GM
O a
pp
rova
ls t
o 1
8 (i
ncl
ud
ing
fo
ur
mai
ze c
rop
s).
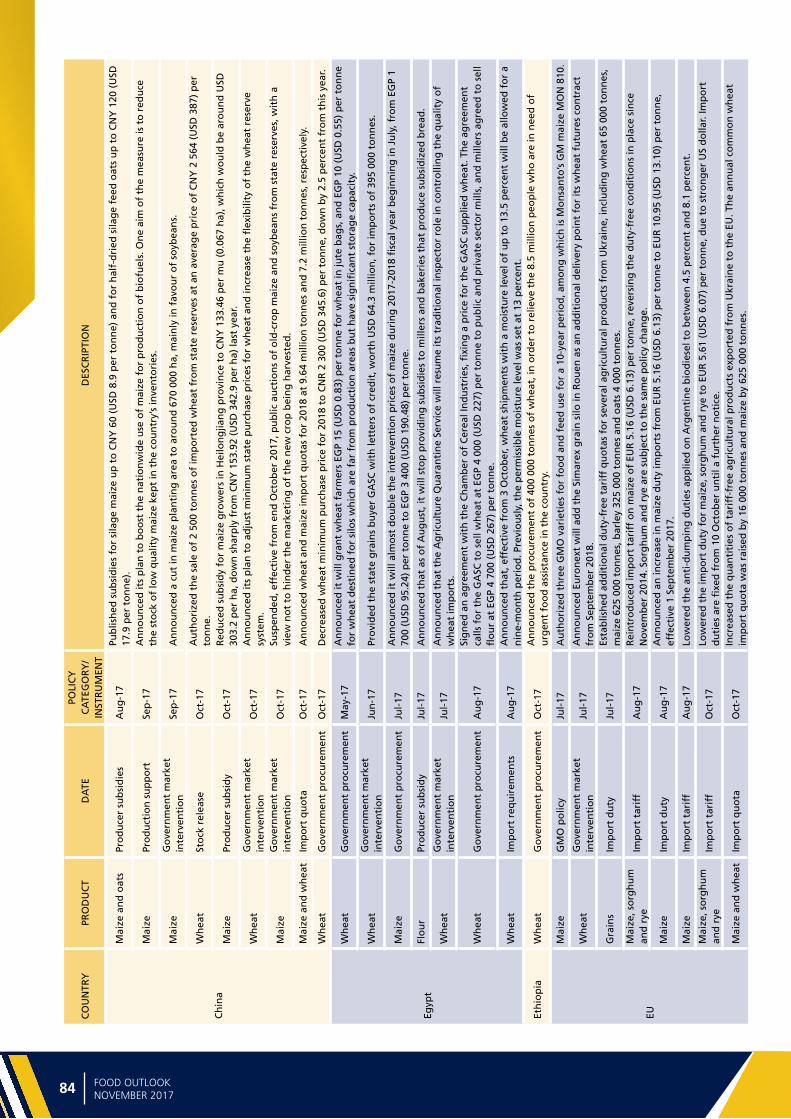
Ma
jor
po
licy
de
velo
pm
en
ts
84 85FOOD OUTLOOKNOVEMBER 2017
CO
UN
TRY
PRO
DU
CT
DA
TEPO
LIC
Y
CA
TEG
OR
Y/
INST
RU
MEN
TD
ESC
RIP
TIO
N
Ch
ina
Mai
ze a
nd
oat
sPr
od
uce
r su
bsi
die
sA
ug
-17
Pub
lish
ed s
ub
sid
ies
for
sila
ge
mai
ze u
p t
o C
NY
60
(USD
8.9
per
to
nn
e) a
nd
fo
r h
alf-
dri
ed s
ilag
e fe
ed o
ats
up
to
CN
Y 1
20 (
USD
17
.9 p
er t
on
ne)
.
Mai
zePr
od
uct
ion
su
pp
ort
Sep
-17
An
no
un
ced
its
pla
n t
o b
oo
st t
he
nat
ion
wid
e u
se o
f m
aize
fo
r p
rod
uct
ion
of
bio
fuel
s. O
ne
aim
of
the
mea
sure
is t
o r
edu
ce
the
sto
ck o
f lo
w q
ual
ity
mai
ze k
ept
in t
he
cou
ntr
y’s
inve
nto
ries
.
Mai
zeG
ove
rnm
ent
mar
ket
inte
rven
tio
nSe
p-1
7A
nn
ou
nce
d a
cu
t in
mai
ze p
lan
tin
g a
rea
to a
rou
nd
670
000
ha,
mai
nly
in f
avo
ur
of
soyb
ean
s.
Wh
eat
Sto
ck r
elea
seO
ct-1
7A
uth
ori
zed
th
e sa
le o
f 2
500
ton
nes
of
imp
ort
ed w
hea
t fr
om
sta
te r
eser
ves
at a
n a
vera
ge
pri
ce o
f C
NY
2 5
64 (
USD
387
) p
er
ton
ne.
Mai
zePr
od
uce
r su
bsi
dy
Oct
-17
Red
uce
d s
ub
sid
y fo
r m
aize
gro
wer
s in
Hei
lon
gjia
ng
pro
vin
ce t
o C
NY
133
.46
per
mu
(0.
067
ha)
, wh
ich
wo
uld
be
aro
un
d U
SD
303.
2 p
er h
a, d
ow
n s
har
ply
fro
m C
NY
153
.92
(USD
342
.9 p
er h
a) la
st y
ear.
Wh
eat
Go
vern
men
t m
arke
t in
terv
enti
on
Oct
-17
An
no
un
ced
its
pla
n t
o a
dju
st m
inim
um
sta
te p
urc
has
e p
rice
s fo
r w
hea
t an
d in
crea
se t
he
flex
ibili
ty o
f th
e w
hea
t re
serv
e sy
stem
.
Mai
zeG
ove
rnm
ent
mar
ket
inte
rven
tio
nO
ct-1
7Su
spen
ded
, eff
ecti
ve f
rom
en
d O
cto
ber
201
7, p
ub
lic a
uct
ion
s o
f o
ld-c
rop
mai
ze a
nd
so
ybea
ns
fro
m s
tate
res
erve
s, w
ith
a
view
no
t to
hin
der
th
e m
arke
tin
g o
f th
e n
ew c
rop
bei
ng
har
vest
ed.
Mai
ze a
nd
wh
eat
Imp
ort
qu
ota
Oct
-17
An
no
un
ced
wh
eat
and
mai
ze im
po
rt q
uo
tas
for
2018
at
9.64
mill
ion
to
nn
es a
nd
7.2
mill
ion
to
nn
es, r
esp
ecti
vely
.
Wh
eat
Go
vern
men
t p
rocu
rem
ent
Oct
-17
Dec
reas
ed w
hea
t m
inim
um
pu
rch
ase
pri
ce f
or
2018
to
CN
R 2
300
(U
SD 3
45.6
) p
er t
on
ne,
do
wn
by
2.5
per
cen
t fr
om
th
is y
ear.
Egyp
t
Wh
eat
Go
vern
men
t p
rocu
rem
ent
May
-17
An
no
un
ced
it w
ill g
ran
t w
hea
t fa
rmer
s EG
P 15
(U
SD 0
.83)
per
to
nn
e fo
r w
hea
t in
jute
bag
s, a
nd
EG
P 10
(U
SD 0
.55)
per
to
nn
e fo
r w
hea
t d
esti
ned
fo
r si
los
wh
ich
are
far
fro
m p
rod
uct
ion
are
as b
ut
hav
e si
gn
ifica
nt
sto
rag
e ca
pac
ity.
Wh
eat
Go
vern
men
t m
arke
t in
terv
enti
on
Jun
-17
Pro
vid
ed t
he
stat
e g
rain
s b
uye
r G
ASC
wit
h le
tter
s o
f cr
edit
, wo
rth
USD
64.
3 m
illio
n, f
or
imp
ort
s o
f 39
5 00
0 to
nn
es.
Mai
zeG
ove
rnm
ent
pro
cure
men
tJu
l-17
An
no
un
ced
it w
ill a
lmo
st d
ou
ble
th
e in
terv
enti
on
pri
ces
of
mai
ze d
uri
ng
201
7-20
18 fi
scal
yea
r b
egin
nin
g in
Ju
ly, f
rom
EG
P 1
700
(USD
95.
24)
per
to
nn
e to
EG
P 3
400
(USD
190
.48)
per
to
nn
e.
Flo
ur
Pro
du
cer
sub
sid
yJu
l-17
An
no
un
ced
th
at a
s o
f A
ug
ust
, it
will
sto
p p
rovi
din
g s
ub
sid
ies
to m
iller
s an
d b
aker
ies
that
pro
du
ce s
ub
sid
ized
bre
ad.
Wh
eat
Go
vern
men
t m
arke
t in
terv
enti
on
Jul-
17A
nn
ou
nce
d t
hat
th
e A
gri
cult
ure
Qu
aran
tin
e Se
rvic
e w
ill r
esu
me
its
trad
itio
nal
insp
ecto
r ro
le in
co
ntr
olli
ng
th
e q
ual
ity
of
wh
eat
imp
ort
s.
Wh
eat
Go
vern
men
t p
rocu
rem
ent
Au
g-1
7Si
gn
ed a
n a
gre
emen
t w
ith
th
e C
ham
ber
of
Cer
eal I
nd
ust
ries
, fixi
ng
a p
rice
fo
r th
e G
ASC
su
pp
lied
wh
eat.
Th
e ag
reem
ent
calls
fo
r th
e G
ASC
to
sel
l wh
eat
at E
GP
4 00
0 (U
SD 2
27)
per
to
nn
e to
pu
blic
an
d p
riva
te s
ecto
r m
ills,
an
d m
iller
s ag
reed
to
sel
l fl
ou
r at
EG
P 4
700
(USD
267
) p
er t
on
ne.
Wh
eat
Imp
ort
req
uir
emen
tsA
ug
-17
An
no
un
ced
th
at, e
ffec
tive
fro
m 3
Oct
ob
er, w
hea
t sh
ipm
ents
wit
h a
mo
istu
re le
vel o
f u
p t
o 1
3.5
per
cen
t w
ill b
e al
low
ed f
or
a n
ine-
mo
nth
per
iod
. Pre
vio
usl
y, t
he
per
mis
sib
le m
ois
ture
leve
l was
set
at
13 p
erce
nt.
Eth
iop
iaW
hea
tG
ove
rnm
ent
pro
cure
men
tO
ct-1
7A
nn
ou
nce
d t
he
pro
cure
men
t o
f 40
0 00
0 to
nn
es o
f w
hea
t, in
ord
er t
o r
elie
ve t
he
8.5
mill
ion
peo
ple
wh
o a
re in
nee
d o
f u
rgen
t fo
od
ass
ista
nce
in t
he
cou
ntr
y.
EU
Mai
zeG
MO
po
licy
Jul-
17A
uth
ori
zed
th
ree
GM
O v
arie
ties
fo
r fo
od
an
d f
eed
use
fo
r a
10-y
ear
per
iod
, am
on
g w
hic
h is
Mo
nsa
nto
’s G
M m
aize
MO
N 8
10.
Wh
eat
Go
vern
men
t m
arke
t in
terv
enti
on
Jul-
17A
nn
ou
nce
d E
uro
nex
t w
ill a
dd
th
e Si
mar
ex g
rain
silo
in R
ou
en a
s an
ad
dit
ion
al d
eliv
ery
po
int
for
its
wh
eat
futu
res
con
trac
t fr
om
Sep
tem
ber
201
8.
Gra
ins
Imp
ort
du
tyJu
l-17
Esta
blis
hed
ad
dit
ion
al d
uty
-fre
e ta
riff
qu
ota
s fo
r se
vera
l ag
ricu
ltu
ral p
rod
uct
s fr
om
Ukr
ain
e, in
clu
din
g w
hea
t 65
000
to
nn
es,
mai
ze 6
25 0
00 t
on
nes
, bar
ley
325
000
ton
nes
an
d o
ats
4 00
0 to
nn
es.
Mai
ze, s
org
hu
m
and
rye
Imp
ort
tar
iff
Au
g-1
7R
ein
tro
du
ced
imp
ort
tar
iff
on
mai
ze o
f EU
R 5
.16
(USD
6.1
3) p
er t
on
ne,
rev
ersi
ng
th
e d
uty
-fre
e co
nd
itio
ns
in p
lace
sin
ce
No
vem
ber
201
4. S
org
hu
m a
nd
rye
are
su
bje
ct t
o t
he
sam
e p
olic
y ch
ang
e.
Mai
zeIm
po
rt d
uty
Au
g-1
7A
nn
ou
nce
d a
n in
crea
se in
mai
ze d
uty
imp
ort
s fr
om
EU
R 5
.16
(USD
6.1
3) p
er t
on
ne
to E
UR
10.
95 (
USD
13.
10)
per
to
nn
e,
effe
ctiv
e 1
Sep
tem
ber
201
7.
Mai
zeIm
po
rt t
arif
fA
ug
-17
Low
ered
th
e an
ti-d
um
pin
g d
uti
es a
pp
lied
on
Arg
enti
ne
bio
die
sel t
o b
etw
een
4.5
per
cen
t an
d 8
.1 p
erce
nt.
Mai
ze, s
org
hu
m
and
rye
Imp
ort
tar
iff
Oct
-17
Low
ered
th
e im
po
rt d
uty
fo
r m
aize
, so
rgh
um
an
d r
ye t
o E
UR
5.6
1 (U
SD 6
.07)
per
to
nn
e, d
ue
to s
tro
ng
er U
S d
olla
r. Im
po
rt
du
ties
are
fixe
d f
rom
10
Oct
ob
er u
nti
l a f
urt
her
no
tice
.
Mai
ze a
nd
wh
eat
Imp
ort
qu
ota
Oct
-17
Incr
ease
d t
he
qu
anti
ties
of
tari
ff-f
ree
agri
cult
ura
l pro
du
cts
exp
ort
ed f
rom
Ukr
ain
e to
th
e EU
. Th
e an
nu
al c
om
mo
n w
hea
t im
po
rt q
uo
ta w
as r
aise
d b
y 16
000
to
nn
es a
nd
mai
ze b
y 62
5 00
0 to
nn
es.
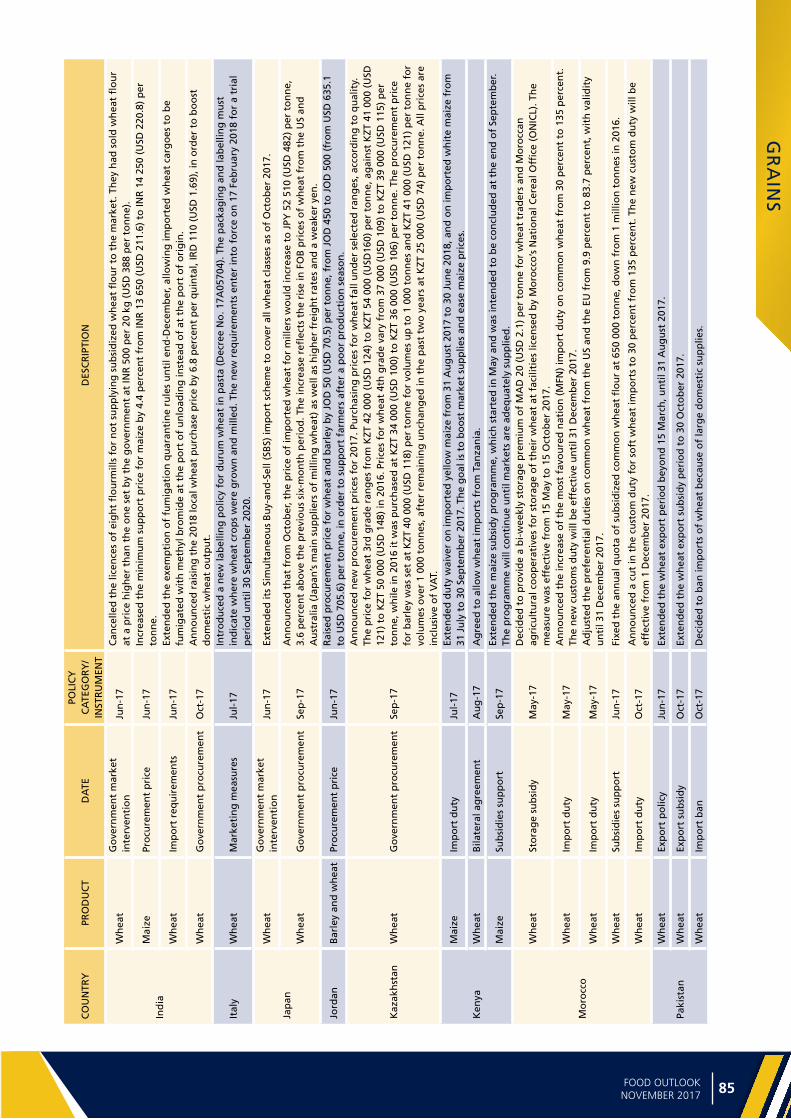
84 85FOOD OUTLOOKNOVEMBER 2017
GR
AIN
S
CO
UN
TRY
PRO
DU
CT
DA
TEPO
LIC
Y
CA
TEG
OR
Y/
INST
RU
MEN
TD
ESC
RIP
TIO
N
Ind
ia
Wh
eat
Go
vern
men
t m
arke
t in
terv
enti
on
Jun
-17
Can
celle
d t
he
licen
ces
of
eig
ht
flo
urm
ills
for
no
t su
pp
lyin
g s
ub
sid
ized
wh
eat
flo
ur
to t
he
mar
ket.
Th
ey h
ad s
old
wh
eat
flo
ur
at a
pri
ce h
igh
er t
han
th
e o
ne
set
by
the
go
vern
men
t at
INR
500
per
20
kg (
USD
388
per
to
nn
e).
Mai
zePr
ocu
rem
ent
pri
ceJu
n-1
7In
crea
sed
th
e m
inim
um
su
pp
ort
pri
ce f
or
mai
ze b
y 4.
4 p
erce
nt
fro
m IN
R 1
3 65
0 (U
SD 2
11.6
) to
INR
14
250
(USD
220
.8)
per
to
nn
e.
Wh
eat
Imp
ort
req
uir
emen
tsJu
n-1
7Ex
ten
ded
th
e ex
emp
tio
n o
f fu
mig
atio
n q
uar
anti
ne
rule
s u
nti
l en
d-D
ecem
ber
, allo
win
g im
po
rted
wh
eat
carg
oes
to
be
fum
igat
ed w
ith
met
hyl
bro
mid
e at
th
e p
ort
of
un
load
ing
inst
ead
of
at t
he
po
rt o
f o
rig
in.
Wh
eat
Go
vern
men
t p
rocu
rem
ent
Oct
-17
An
no
un
ced
rai
sin
g t
he
2018
loca
l wh
eat
pu
rch
ase
pri
ce b
y 6.
8 p
erce
nt
per
qu
inta
l, IR
D 1
10 (
USD
1.6
9), i
n o
rder
to
bo
ost
d
om
esti
c w
hea
t o
utp
ut.
Ital
yW
hea
tM
arke
tin
g m
easu
res
Jul-
17In
tro
du
ced
a n
ew la
bel
ling
po
licy
for
du
rum
wh
eat
in p
asta
(D
ecre
e N
o. 1
7A05
704)
. Th
e p
acka
gin
g a
nd
lab
ellin
g m
ust
in
dic
ate
wh
ere
wh
eat
cro
ps
wer
e g
row
n a
nd
mill
ed. T
he
new
req
uir
emen
ts e
nte
r in
to f
orc
e o
n 1
7 Fe
bru
ary
2018
fo
r a
tria
l p
erio
d u
nti
l 30
Sep
tem
ber
202
0.
Jap
an
Wh
eat
Go
vern
men
t m
arke
t in
terv
enti
on
Jun
-17
Exte
nd
ed it
s Si
mu
ltan
eou
s B
uy-
and
-Sel
l (SB
S) im
po
rt s
chem
e to
co
ver
all w
hea
t cl
asse
s as
of
Oct
ob
er 2
017.
Wh
eat
Go
vern
men
t p
rocu
rem
ent
Sep
-17
An
no
un
ced
th
at f
rom
Oct
ob
er, t
he
pri
ce o
f im
po
rted
wh
eat
for
mill
ers
wo
uld
incr
ease
to
JPY
52
510
(USD
482
) p
er t
on
ne,
3.
6 p
erce
nt
abo
ve t
he
pre
vio
us
six-
mo
nth
per
iod
. Th
e in
crea
se r
eflec
ts t
he
rise
in F
OB
pri
ces
of
wh
eat
fro
m t
he
US
and
A
ust
ralia
(Ja
pan
’s m
ain
su
pp
liers
of
mill
ing
wh
eat)
as
wel
l as
hig
her
fre
igh
t ra
tes
and
a w
eake
r ye
n.
Jord
anB
arle
y an
d w
hea
tPr
ocu
rem
ent
pri
ceJu
n-1
7R
aise
d p
rocu
rem
ent
pri
ce f
or
wh
eat
and
bar
ley
by
JOD
50
(USD
70.
5) p
er t
on
ne,
fro
m J
OD
450
to
JO
D 5
00 (
fro
m U
SD 6
35.1
to
USD
705
.6)
per
to
nn
e, in
ord
er t
o s
up
po
rt f
arm
ers
afte
r a
po
or
pro
du
ctio
n s
easo
n.
Kaz
akh
stan
Wh
eat
Go
vern
men
t p
rocu
rem
ent
Sep
-17
An
no
un
ced
new
pro
cure
men
t p
rice
s fo
r 20
17. P
urc
has
ing
pri
ces
for
wh
eat
fall
un
der
sel
ecte
d r
ang
es, a
cco
rdin
g t
o q
ual
ity.
Th
e p
rice
fo
r w
hea
t 3r
d g
rad
e ra
ng
es f
rom
KZT
42
000
(USD
124
) to
KZT
54
000
(USD
160)
per
to
nn
e, a
gai
nst
KZT
41
000
(USD
12
1) t
o K
ZT 5
0 00
0 (U
SD 1
48)
in 2
016.
Pri
ces
for
wh
eat
4th
gra
de
vary
fro
m 3
7 00
0 (U
SD 1
09)
to K
ZT 3
9 00
0 (U
SD 1
15)
per
to
nn
e, w
hile
in 2
016
it w
as p
urc
has
ed a
t K
ZT 3
4 00
0 (U
SD 1
00)
to K
ZT 3
6 00
0 (U
SD 1
06)
per
to
nn
e. T
he
pro
cure
men
t p
rice
fo
r b
arle
y w
as s
et a
t K
ZT 4
0 00
0 (U
SD 1
18)
per
to
nn
e fo
r vo
lum
es u
p t
o 1
000
to
nn
es a
nd
KZT
41
000
(USD
121
) p
er t
on
ne
for
volu
mes
ove
r 1
000
ton
nes
, aft
er r
emai
nin
g u
nch
ang
ed in
th
e p
ast
two
yea
rs a
t K
ZT 2
5 00
0 (U
SD 7
4) p
er t
on
ne.
All
pri
ces
are
incl
usi
ve o
f V
AT.
Ken
ya
Mai
zeIm
po
rt d
uty
Jul-
17Ex
ten
ded
du
ty w
aive
r o
n im
po
rted
yel
low
mai
ze f
rom
31
Au
gu
st 2
017
to 3
0 Ju
ne
2018
, an
d o
n im
po
rted
wh
ite
mai
ze f
rom
31
Ju
ly t
o 3
0 Se
pte
mb
er 2
017.
Th
e g
oal
is t
o b
oo
st m
arke
t su
pp
lies
and
eas
e m
aize
pri
ces.
Wh
eat
Bila
tera
l ag
reem
ent
Au
g-1
7A
gre
ed t
o a
llow
wh
eat
imp
ort
s fr
om
Tan
zan
ia.
Mai
zeSu
bsi
die
s su
pp
ort
Sep
-17
Exte
nd
ed t
he
mai
ze s
ub
sid
y p
rog
ram
me,
wh
ich
sta
rted
in M
ay a
nd
was
inte
nd
ed t
o b
e co
ncl
ud
ed a
t th
e en
d o
f Se
pte
mb
er.
The
pro
gra
mm
e w
ill c
on
tin
ue
un
til m
arke
ts a
re a
deq
uat
ely
sup
plie
d.
Mo
rocc
o
Wh
eat
Sto
rag
e su
bsi
dy
May
-17
Dec
ided
to
pro
vid
e a
bi-
wee
kly
sto
rag
e p
rem
ium
of
MA
D 2
0 (U
SD 2
.1)
per
to
nn
e fo
r w
hea
t tr
ader
s an
d M
oro
ccan
ag
ricu
ltu
ral c
oo
per
ativ
es f
or
sto
rag
e o
f th
eir
wh
eat
at f
acili
ties
lice
nse
d b
y M
oro
cco
’s N
atio
nal
Cer
eal O
ffice
(O
NIC
L). T
he
mea
sure
was
eff
ecti
ve f
rom
15
May
to
15
Oct
ob
er 2
017.
Wh
eat
Imp
ort
du
tyM
ay-1
7A
nn
ou
nce
d t
he
incr
ease
of
the
mo
st f
avo
ure
d n
atio
n (
MFN
) im
po
rt d
uty
on
co
mm
on
wh
eat
fro
m 3
0 p
erce
nt
to 1
35 p
erce
nt.
Th
e n
ew c
ust
om
s d
uty
will
be
effe
ctiv
e u
nti
l 31
Dec
emb
er 2
017.
Wh
eat
Imp
ort
du
tyM
ay-1
7A
dju
sted
th
e p
refe
ren
tial
du
ties
on
co
mm
on
wh
eat
fro
m t
he
US
and
th
e EU
fro
m 9
.9 p
erce
nt
to 8
3.7
per
cen
t, w
ith
val
idit
y u
nti
l 31
Dec
emb
er 2
017.
Wh
eat
Sub
sid
ies
sup
po
rtJu
n-1
7Fi
xed
th
e an
nu
al q
uo
ta o
f su
bsi
diz
ed c
om
mo
n w
hea
t fl
ou
r at
650
000
to
nn
e, d
ow
n f
rom
1 m
illio
n t
on
nes
in 2
016.
Wh
eat
Imp
ort
du
tyO
ct-1
7A
nn
ou
nce
d a
cu
t in
th
e cu
sto
m d
uty
fo
r so
ft w
hea
t im
po
rts
to 3
0 p
erce
nt
fro
m 1
35 p
erce
nt.
Th
e n
ew c
ust
om
du
ty w
ill b
e ef
fect
ive
fro
m 1
Dec
emb
er 2
017.
Paki
stan
Wh
eat
Exp
ort
po
licy
Jun
-17
Exte
nd
ed t
he
wh
eat
exp
ort
per
iod
bey
on
d 1
5 M
arch
, un
til 3
1 A
ug
ust
201
7.
Wh
eat
Exp
ort
su
bsi
dy
Oct
-17
Exte
nd
ed t
he
wh
eat
exp
ort
su
bsi
dy
per
iod
to
30
Oct
ob
er 2
017.
Wh
eat
Imp
ort
ban
Oct
-17
Dec
ided
to
ban
imp
ort
s o
f w
hea
t b
ecau
se o
f la
rge
do
mes
tic
sup
plie
s.
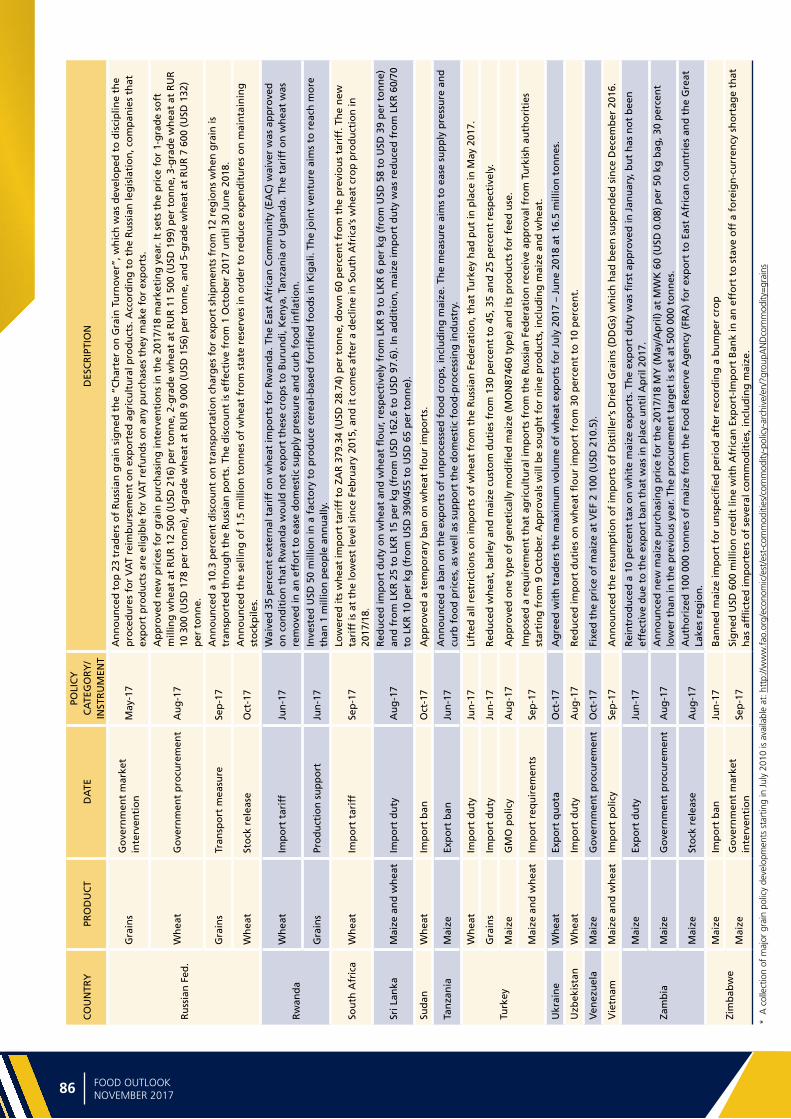
Ma
jor
po
licy
de
velo
pm
en
ts
86 87FOOD OUTLOOKNOVEMBER 2017
CO
UN
TRY
PRO
DU
CT
DA
TEPO
LIC
Y
CA
TEG
OR
Y/
INST
RU
MEN
TD
ESC
RIP
TIO
N
Ru
ssia
n F
ed.
Gra
ins
Go
vern
men
t m
arke
t in
terv
enti
on
May
-17
An
no
un
ced
to
p 2
3 tr
ader
s o
f R
uss
ian
gra
in s
ign
ed t
he
“Ch
arte
r o
n G
rain
Tu
rno
ver”
, wh
ich
was
dev
elo
ped
to
dis
cip
line
the
pro
ced
ure
s fo
r V
AT
reim
bu
rsem
ent
on
exp
ort
ed a
gri
cult
ura
l pro
du
cts.
Acc
ord
ing
to
th
e R
uss
ian
leg
isla
tio
n, c
om
pan
ies
that
ex
po
rt p
rod
uct
s ar
e el
igib
le f
or
VA
T re
fun
ds
on
an
y p
urc
has
es t
hey
mak
e fo
r ex
po
rts.
Wh
eat
Go
vern
men
t p
rocu
rem
ent
Au
g-1
7
Ap
pro
ved
new
pri
ces
for
gra
in p
urc
has
ing
inte
rven
tio
ns
in t
he
2017
/18
mar
keti
ng
yea
r. It
set
s th
e p
rice
fo
r 1-
gra
de
soft
m
illin
g w
hea
t at
RU
R 1
2 50
0 (U
SD 2
16)
per
to
nn
e, 2
-gra
de
wh
eat
at R
UR
11
500
(USD
199
) p
er t
on
ne,
3-g
rad
e w
hea
t at
RU
R
10 3
00 (
USD
178
per
to
nn
e), 4
-gra
de
wh
eat
at R
UR
9 0
00 (
USD
156
) p
er t
on
ne,
an
d 5
-gra
de
wh
eat
at R
UR
7 6
00 (
USD
132
) p
er t
on
ne.
Gra
ins
Tran
spo
rt m
easu
reSe
p-1
7A
nn
ou
nce
d a
10.
3 p
erce
nt
dis
cou
nt
on
tra
nsp
ort
atio
n c
har
ges
fo
r ex
po
rt s
hip
men
ts f
rom
12
reg
ion
s w
hen
gra
in is
tr
ansp
ort
ed t
hro
ug
h t
he
Ru
ssia
n p
ort
s. T
he
dis
cou
nt
is e
ffec
tive
fro
m 1
Oct
ob
er 2
017
un
til 3
0 Ju
ne
2018
.
Wh
eat
Sto
ck r
elea
seO
ct-1
7A
nn
ou
nce
d t
he
selli
ng
of
1.5
mill
ion
to
nn
es o
f w
hea
t fr
om
sta
te r
eser
ves
in o
rder
to
red
uce
exp
end
itu
res
on
mai
nta
inin
g
sto
ckp
iles.
Rw
and
aW
hea
tIm
po
rt t
arif
fJu
n-1
7W
aive
d 3
5 p
erce
nt
exte
rnal
tar
iff
on
wh
eat
imp
ort
s fo
r R
wan
da.
Th
e Ea
st A
fric
an C
om
mu
nit
y (E
AC
) w
aive
r w
as a
pp
rove
d
on
co
nd
itio
n t
hat
Rw
and
a w
ou
ld n
ot
exp
ort
th
ese
cro
ps
to B
uru
nd
i, K
enya
, Tan
zan
ia o
r U
gan
da.
Th
e ta
riff
on
wh
eat
was
re
mo
ved
in a
n e
ffo
rt t
o e
ase
do
mes
tic
sup
ply
pre
ssu
re a
nd
cu
rb f
oo
d in
flat
ion
.
Gra
ins
Pro
du
ctio
n s
up
po
rt
Jun
-17
Inve
sted
USD
50
mill
ion
in a
fac
tory
to
pro
du
ce c
erea
l-b
ased
fo
rtifi
ed f
oo
ds
in K
igal
i. Th
e jo
int
ven
ture
aim
s to
rea
ch m
ore
th
an 1
mill
ion
peo
ple
an
nu
ally
.
Sou
th A
fric
aW
hea
tIm
po
rt t
arif
fSe
p-1
7Lo
wer
ed it
s w
hea
t im
po
rt t
arif
f to
ZA
R 3
79.3
4 (U
SD 2
8.74
) p
er t
on
ne,
do
wn
60
per
cen
t fr
om
th
e p
revi
ou
s ta
riff
. Th
e n
ew
tari
ff is
at
the
low
est
leve
l sin
ce F
ebru
ary
2015
, an
d it
co
mes
aft
er a
dec
line
in S
ou
th A
fric
a’s
wh
eat
cro
p p
rod
uct
ion
in
2017
/18.
Sri L
anka
Mai
ze a
nd
wh
eat
Imp
ort
du
tyA
ug
-17
Red
uce
d im
po
rt d
uty
on
wh
eat
and
wh
eat
flo
ur,
resp
ecti
vely
fro
m L
KR
9 t
o L
KR
6 p
er k
g (
fro
m U
SD 5
8 to
USD
39
per
to
nn
e)
and
fro
m L
KR
25
to L
KR
15
per
kg
(fr
om
USD
162
.6 t
o U
SD 9
7.6)
. In
ad
dit
ion
, mai
ze im
po
rt d
uty
was
red
uce
d f
rom
LK
R 6
0/70
to
LK
R 1
0 p
er k
g (
fro
m U
SD 3
90/4
55 t
o U
SD 6
5 p
er t
on
ne)
.
Sud
anW
hea
tIm
po
rt b
anO
ct-1
7A
pp
rove
d a
tem
po
rary
ban
on
wh
eat
flo
ur
imp
ort
s.
Tan
zan
iaM
aize
Exp
ort
ban
Jun
-17
An
no
un
ced
a b
an o
n t
he
exp
ort
s o
f u
np
roce
ssed
fo
od
cro
ps,
incl
ud
ing
mai
ze. T
he
mea
sure
aim
s to
eas
e su
pp
ly p
ress
ure
an
d
curb
fo
od
pri
ces,
as
wel
l as
sup
po
rt t
he
do
mes
tic
foo
d-p
roce
ssin
g in
du
stry
.
Turk
ey
Wh
eat
Imp
ort
du
tyJu
n-1
7Li
fted
all
rest
rict
ion
s o
n im
po
rts
of
wh
eat
fro
m t
he
Ru
ssia
n F
eder
atio
n, t
hat
Tu
rkey
had
pu
t in
pla
ce in
May
201
7.
Gra
ins
Imp
ort
du
tyJu
n-1
7R
edu
ced
wh
eat,
bar
ley
and
mai
ze c
ust
om
du
ties
fro
m 1
30 p
erce
nt
to 4
5, 3
5 an
d 2
5 p
erce
nt
resp
ecti
vely
.
Mai
zeG
MO
po
licy
Au
g-1
7A
pp
rove
d o
ne
typ
e o
f g
enet
ical
ly m
od
ified
mai
ze (
MO
N87
460
typ
e) a
nd
its
pro
du
cts
for
feed
use
.
Mai
ze a
nd
wh
eat
Imp
ort
req
uir
emen
tsSe
p-1
7Im
po
sed
a r
equ
irem
ent
that
ag
ricu
ltu
ral i
mp
ort
s fr
om
th
e R
uss
ian
Fed
erat
ion
rec
eive
ap
pro
val f
rom
Tu
rkis
h a
uth
ori
ties
st
arti
ng
fro
m 9
Oct
ob
er. A
pp
rova
ls w
ill b
e so
ug
ht
for
nin
e p
rod
uct
s, in
clu
din
g m
aize
an
d w
hea
t.
Ukr
ain
eW
hea
tEx
po
rt q
uo
taO
ct-1
7A
gre
ed w
ith
tra
der
s th
e m
axim
um
vo
lum
e o
f w
hea
t ex
po
rts
for
July
201
7 –
Jun
e 20
18 a
t 16
.5 m
illio
n t
on
nes
.
Uzb
ekis
tan
Wh
eat
Imp
ort
du
tyA
ug
-17
Red
uce
d im
po
rt d
uti
es o
n w
hea
t fl
ou
r im
po
rt f
rom
30
per
cen
t to
10
per
cen
t.
Ven
ezu
ela
Mai
zeG
ove
rnm
ent
pro
cure
men
tO
ct-1
7Fi
xed
th
e p
rice
of
mai
ze a
t V
EF 2
100
(U
SD 2
10.5
).
Vie
tnam
Mai
ze a
nd
wh
eat
Imp
ort
po
licy
Sep
-17
An
no
un
ced
th
e re
sum
pti
on
of
imp
ort
s o
f D
isti
ller’
s D
ried
Gra
ins
(DD
Gs)
wh
ich
had
bee
n s
usp
end
ed s
ince
Dec
emb
er 2
016.
Zam
bia
Mai
zeEx
po
rt d
uty
Jun
-17
Rei
ntr
od
uce
d a
10
per
cen
t ta
x o
n w
hit
e m
aize
exp
ort
s. T
he
exp
ort
du
ty w
as fi
rst
app
rove
d in
Jan
uar
y, b
ut
has
no
t b
een
ef
fect
ive
du
e to
th
e ex
po
rt b
an t
hat
was
in p
lace
un
til A
pri
l 201
7.
Mai
zeG
ove
rnm
ent
pro
cure
men
tA
ug
-17
An
no
un
ced
new
mai
ze p
urc
has
ing
pri
ce f
or
the
2017
/18
MY
(M
ay/A
pri
l) a
t M
WK
60
(USD
0.0
8) p
er 5
0 kg
bag
, 30
per
cen
t lo
wer
th
an in
th
e p
revi
ou
s ye
ar. T
he
pro
cure
men
t ta
rget
is s
et a
t 50
0 00
0 to
nn
es.
Mai
zeSt
ock
rel
ease
Au
g-1
7A
uth
ori
zed
100
000
to
nn
es o
f m
aize
fro
m t
he
Foo
d R
eser
ve A
gen
cy (
FRA
) fo
r ex
po
rt t
o E
ast
Afr
ican
co
un
trie
s an
d t
he
Gre
at
Lake
s re
gio
n.
Zim
bab
we
Mai
zeIm
po
rt b
anJu
n-1
7B
ann
ed m
aize
imp
ort
fo
r u
nsp
ecifi
ed p
erio
d a
fter
rec
ord
ing
a b
um
per
cro
p
Mai
zeG
ove
rnm
ent
mar
ket
inte
rven
tio
nSe
p-1
7Si
gn
ed U
SD 6
00 m
illio
n c
red
it li
ne
wit
h A
fric
an E
xpo
rt-I
mp
ort
Ban
k in
an
eff
ort
to
sta
ve o
ff a
fo
reig
n-c
urr
ency
sh
ort
age
that
h
as a
fflic
ted
imp
ort
ers
of
seve
ral c
om
mo
dit
ies,
incl
ud
ing
mai
ze.
* A
col
lect
ion
of m
ajor
gra
in p
olic
y de
velo
pmen
ts s
tart
ing
in J
uly
2010
is a
vaila
ble
at: h
ttp:
//ww
w.f
ao.o
rg/e
cono
mic
/est
/est
-com
mod
ities
/com
mod
ity-p
olic
y-ar
chiv
e/en
/?gr
oupA
ND
com
mod
ity=
grai
ns

86 87FOOD OUTLOOKNOVEMBER 2017
RIC
E
CO
UN
TRY
PRO
DU
CT
DA
TEPO
LIC
Y
CA
TEG
OR
Y/
INST
RU
MEN
TD
ESC
RIP
TIO
N
Ru
ssia
n F
ed.
Gra
ins
Go
vern
men
t m
arke
t in
terv
enti
on
May
-17
An
no
un
ced
to
p 2
3 tr
ader
s o
f R
uss
ian
gra
in s
ign
ed t
he
“Ch
arte
r o
n G
rain
Tu
rno
ver”
, wh
ich
was
dev
elo
ped
to
dis
cip
line
the
pro
ced
ure
s fo
r V
AT
reim
bu
rsem
ent
on
exp
ort
ed a
gri
cult
ura
l pro
du
cts.
Acc
ord
ing
to
th
e R
uss
ian
leg
isla
tio
n, c
om
pan
ies
that
ex
po
rt p
rod
uct
s ar
e el
igib
le f
or
VA
T re
fun
ds
on
an
y p
urc
has
es t
hey
mak
e fo
r ex
po
rts.
Wh
eat
Go
vern
men
t p
rocu
rem
ent
Au
g-1
7
Ap
pro
ved
new
pri
ces
for
gra
in p
urc
has
ing
inte
rven
tio
ns
in t
he
2017
/18
mar
keti
ng
yea
r. It
set
s th
e p
rice
fo
r 1-
gra
de
soft
m
illin
g w
hea
t at
RU
R 1
2 50
0 (U
SD 2
16)
per
to
nn
e, 2
-gra
de
wh
eat
at R
UR
11
500
(USD
199
) p
er t
on
ne,
3-g
rad
e w
hea
t at
RU
R
10 3
00 (
USD
178
per
to
nn
e), 4
-gra
de
wh
eat
at R
UR
9 0
00 (
USD
156
) p
er t
on
ne,
an
d 5
-gra
de
wh
eat
at R
UR
7 6
00 (
USD
132
) p
er t
on
ne.
Gra
ins
Tran
spo
rt m
easu
reSe
p-1
7A
nn
ou
nce
d a
10.
3 p
erce
nt
dis
cou
nt
on
tra
nsp
ort
atio
n c
har
ges
fo
r ex
po
rt s
hip
men
ts f
rom
12
reg
ion
s w
hen
gra
in is
tr
ansp
ort
ed t
hro
ug
h t
he
Ru
ssia
n p
ort
s. T
he
dis
cou
nt
is e
ffec
tive
fro
m 1
Oct
ob
er 2
017
un
til 3
0 Ju
ne
2018
.
Wh
eat
Sto
ck r
elea
seO
ct-1
7A
nn
ou
nce
d t
he
selli
ng
of
1.5
mill
ion
to
nn
es o
f w
hea
t fr
om
sta
te r
eser
ves
in o
rder
to
red
uce
exp
end
itu
res
on
mai
nta
inin
g
sto
ckp
iles.
Rw
and
aW
hea
tIm
po
rt t
arif
fJu
n-1
7W
aive
d 3
5 p
erce
nt
exte
rnal
tar
iff
on
wh
eat
imp
ort
s fo
r R
wan
da.
Th
e Ea
st A
fric
an C
om
mu
nit
y (E
AC
) w
aive
r w
as a
pp
rove
d
on
co
nd
itio
n t
hat
Rw
and
a w
ou
ld n
ot
exp
ort
th
ese
cro
ps
to B
uru
nd
i, K
enya
, Tan
zan
ia o
r U
gan
da.
Th
e ta
riff
on
wh
eat
was
re
mo
ved
in a
n e
ffo
rt t
o e
ase
do
mes
tic
sup
ply
pre
ssu
re a
nd
cu
rb f
oo
d in
flat
ion
.
Gra
ins
Pro
du
ctio
n s
up
po
rt
Jun
-17
Inve
sted
USD
50
mill
ion
in a
fac
tory
to
pro
du
ce c
erea
l-b
ased
fo
rtifi
ed f
oo
ds
in K
igal
i. Th
e jo
int
ven
ture
aim
s to
rea
ch m
ore
th
an 1
mill
ion
peo
ple
an
nu
ally
.
Sou
th A
fric
aW
hea
tIm
po
rt t
arif
fSe
p-1
7Lo
wer
ed it
s w
hea
t im
po
rt t
arif
f to
ZA
R 3
79.3
4 (U
SD 2
8.74
) p
er t
on
ne,
do
wn
60
per
cen
t fr
om
th
e p
revi
ou
s ta
riff
. Th
e n
ew
tari
ff is
at
the
low
est
leve
l sin
ce F
ebru
ary
2015
, an
d it
co
mes
aft
er a
dec
line
in S
ou
th A
fric
a’s
wh
eat
cro
p p
rod
uct
ion
in
2017
/18.
Sri L
anka
Mai
ze a
nd
wh
eat
Imp
ort
du
tyA
ug
-17
Red
uce
d im
po
rt d
uty
on
wh
eat
and
wh
eat
flo
ur,
resp
ecti
vely
fro
m L
KR
9 t
o L
KR
6 p
er k
g (
fro
m U
SD 5
8 to
USD
39
per
to
nn
e)
and
fro
m L
KR
25
to L
KR
15
per
kg
(fr
om
USD
162
.6 t
o U
SD 9
7.6)
. In
ad
dit
ion
, mai
ze im
po
rt d
uty
was
red
uce
d f
rom
LK
R 6
0/70
to
LK
R 1
0 p
er k
g (
fro
m U
SD 3
90/4
55 t
o U
SD 6
5 p
er t
on
ne)
.
Sud
anW
hea
tIm
po
rt b
anO
ct-1
7A
pp
rove
d a
tem
po
rary
ban
on
wh
eat
flo
ur
imp
ort
s.
Tan
zan
iaM
aize
Exp
ort
ban
Jun
-17
An
no
un
ced
a b
an o
n t
he
exp
ort
s o
f u
np
roce
ssed
fo
od
cro
ps,
incl
ud
ing
mai
ze. T
he
mea
sure
aim
s to
eas
e su
pp
ly p
ress
ure
an
d
curb
fo
od
pri
ces,
as
wel
l as
sup
po
rt t
he
do
mes
tic
foo
d-p
roce
ssin
g in
du
stry
.
Turk
ey
Wh
eat
Imp
ort
du
tyJu
n-1
7Li
fted
all
rest
rict
ion
s o
n im
po
rts
of
wh
eat
fro
m t
he
Ru
ssia
n F
eder
atio
n, t
hat
Tu
rkey
had
pu
t in
pla
ce in
May
201
7.
Gra
ins
Imp
ort
du
tyJu
n-1
7R
edu
ced
wh
eat,
bar
ley
and
mai
ze c
ust
om
du
ties
fro
m 1
30 p
erce
nt
to 4
5, 3
5 an
d 2
5 p
erce
nt
resp
ecti
vely
.
Mai
zeG
MO
po
licy
Au
g-1
7A
pp
rove
d o
ne
typ
e o
f g
enet
ical
ly m
od
ified
mai
ze (
MO
N87
460
typ
e) a
nd
its
pro
du
cts
for
feed
use
.
Mai
ze a
nd
wh
eat
Imp
ort
req
uir
emen
tsSe
p-1
7Im
po
sed
a r
equ
irem
ent
that
ag
ricu
ltu
ral i
mp
ort
s fr
om
th
e R
uss
ian
Fed
erat
ion
rec
eive
ap
pro
val f
rom
Tu
rkis
h a
uth
ori
ties
st
arti
ng
fro
m 9
Oct
ob
er. A
pp
rova
ls w
ill b
e so
ug
ht
for
nin
e p
rod
uct
s, in
clu
din
g m
aize
an
d w
hea
t.
Ukr
ain
eW
hea
tEx
po
rt q
uo
taO
ct-1
7A
gre
ed w
ith
tra
der
s th
e m
axim
um
vo
lum
e o
f w
hea
t ex
po
rts
for
July
201
7 –
Jun
e 20
18 a
t 16
.5 m
illio
n t
on
nes
.
Uzb
ekis
tan
Wh
eat
Imp
ort
du
tyA
ug
-17
Red
uce
d im
po
rt d
uti
es o
n w
hea
t fl
ou
r im
po
rt f
rom
30
per
cen
t to
10
per
cen
t.
Ven
ezu
ela
Mai
zeG
ove
rnm
ent
pro
cure
men
tO
ct-1
7Fi
xed
th
e p
rice
of
mai
ze a
t V
EF 2
100
(U
SD 2
10.5
).
Vie
tnam
Mai
ze a
nd
wh
eat
Imp
ort
po
licy
Sep
-17
An
no
un
ced
th
e re
sum
pti
on
of
imp
ort
s o
f D
isti
ller’
s D
ried
Gra
ins
(DD
Gs)
wh
ich
had
bee
n s
usp
end
ed s
ince
Dec
emb
er 2
016.
Zam
bia
Mai
zeEx
po
rt d
uty
Jun
-17
Rei
ntr
od
uce
d a
10
per
cen
t ta
x o
n w
hit
e m
aize
exp
ort
s. T
he
exp
ort
du
ty w
as fi
rst
app
rove
d in
Jan
uar
y, b
ut
has
no
t b
een
ef
fect
ive
du
e to
th
e ex
po
rt b
an t
hat
was
in p
lace
un
til A
pri
l 201
7.
Mai
zeG
ove
rnm
ent
pro
cure
men
tA
ug
-17
An
no
un
ced
new
mai
ze p
urc
has
ing
pri
ce f
or
the
2017
/18
MY
(M
ay/A
pri
l) a
t M
WK
60
(USD
0.0
8) p
er 5
0 kg
bag
, 30
per
cen
t lo
wer
th
an in
th
e p
revi
ou
s ye
ar. T
he
pro
cure
men
t ta
rget
is s
et a
t 50
0 00
0 to
nn
es.
Mai
zeSt
ock
rel
ease
Au
g-1
7A
uth
ori
zed
100
000
to
nn
es o
f m
aize
fro
m t
he
Foo
d R
eser
ve A
gen
cy (
FRA
) fo
r ex
po
rt t
o E
ast
Afr
ican
co
un
trie
s an
d t
he
Gre
at
Lake
s re
gio
n.
Zim
bab
we
Mai
zeIm
po
rt b
anJu
n-1
7B
ann
ed m
aize
imp
ort
fo
r u
nsp
ecifi
ed p
erio
d a
fter
rec
ord
ing
a b
um
per
cro
p
Mai
zeG
ove
rnm
ent
mar
ket
inte
rven
tio
nSe
p-1
7Si
gn
ed U
SD 6
00 m
illio
n c
red
it li
ne
wit
h A
fric
an E
xpo
rt-I
mp
ort
Ban
k in
an
eff
ort
to
sta
ve o
ff a
fo
reig
n-c
urr
ency
sh
ort
age
that
h
as a
fflic
ted
imp
ort
ers
of
seve
ral c
om
mo
dit
ies,
incl
ud
ing
mai
ze.
RICE
: M
AJO
R PO
LICY
DEV
ELO
PMEN
TS M
ID-M
AY
TO
MID
-OCT
OBE
R 20
17*
CO
UN
TRY
DA
TEPO
LIC
Y C
ATE
GO
RY
/IN
STR
UM
ENT
DES
CR
IPTI
ON
Ban
gla
des
h
May
-17
to
Sep
-17
Imp
ort
ten
der
Issu
ed s
even
inte
rnat
ion
al t
end
ers
sin
ce m
id-M
ay, s
eeki
ng
a c
om
bin
ed 3
50 0
00 t
on
nes
of
no
n-B
asm
ati p
arb
oile
d r
ice.
May
-17
Imp
ort
ag
reem
ent
Ren
ewed
an
MO
U w
ith
Vie
t N
am, g
ivin
g B
ang
lad
esh
th
e o
pti
on
to
imp
ort
up
to
1.0
mill
ion
to
nn
es o
f V
ietn
ames
e ri
ce p
er y
ear,
un
til 2
022.
Th
e ag
reem
ent
was
so
on
fo
llow
ed b
y th
e p
urc
has
e o
f 25
0 00
0 to
nn
es o
f V
ietn
ames
e ri
ce.
Jun
-17
Bu
dg
etar
y al
loca
tio
ns,
p
rod
uct
ion
su
pp
ort
, G
ove
rnm
ent
pro
cure
men
t
An
no
un
ced
th
at a
llotm
ents
fo
r ag
ricu
ltu
ral s
ub
sid
ies
wo
uld
be
kep
t st
ead
y at
BD
T 90
bill
ion
(U
SD 1
.1 b
illio
n)
in it
s 20
17/2
018
bu
dg
etar
y al
loca
tio
ns.
In s
up
po
rt o
f th
e ag
ricu
ltu
ral s
ecto
r, st
eps
wo
uld
be
take
n t
o a
rres
t en
cro
ach
men
t o
f ag
ricu
ltu
ral l
and
, red
uce
po
st-h
arve
st lo
sses
, ex
pan
d ir
rig
atio
n c
ove
rag
e, a
nd
ad
van
ce r
esea
rch
an
d s
up
ply
of
imp
rove
d s
eed
var
ieti
es, i
ncl
ud
ing
th
rou
gh
gen
etic
en
gin
eeri
ng
. In
cen
tive
s to
pro
mo
te m
ech
aniz
atio
n w
ou
ld a
lso
co
nti
nu
e. A
ric
e im
po
rt t
arg
et o
f 60
0 00
0 to
nn
es w
as s
et f
or
the
2017
/201
8 fi
scal
yea
r (J
uly
-Ju
ne)
. Th
e g
ove
rnm
ent
wo
uld
see
k to
pu
rch
ase
a se
par
ate
1.6
mill
ion
to
nn
es o
f ri
ce lo
cally
in 2
017/
18, c
om
par
ed w
ith
1.8
5 m
illio
n t
on
nes
th
e p
revi
ou
s ye
ar.
Jun
-17
Foo
d s
ub
sid
ies,
tax
po
licy
Set
asid
e B
DT
45.5
bill
ion
(U
SD 5
56 m
illio
n)
to p
rovi
de
foo
d s
ub
sid
ies
du
rin
g t
he
2017
/201
8 fi
scal
yea
r (J
uly
-Ju
ne)
, up
fro
m a
rev
ised
bu
dg
et o
f B
DT
37.2
bill
ion
(U
SD 4
55 m
illio
n)
for
the
pre
vio
us
year
. Th
e fo
od
gra
in d
istr
ibu
tio
n t
arg
et w
as s
et a
t 2.
74 m
illio
n t
on
nes
, up
16
per
cen
t fr
om
a
revi
sed
tar
get
fo
r th
e p
revi
ou
s ye
ar. O
f th
is v
olu
me,
2.1
6 m
illio
n t
on
nes
wo
uld
be
in t
he
form
of
rice
, co
mp
ared
wit
h 1
.86
mill
ion
to
nn
es
in 2
016/
2017
. In
ad
dit
ion
, VA
T ex
emp
tio
ns
wo
uld
co
nti
nu
e fo
r lo
cal r
ice
alo
ng
wit
h o
ther
bas
ic f
oo
dst
uff
s an
d b
e ex
ten
ded
to
imp
ort
ed r
ice,
u
nd
er a
rev
ised
VA
T re
gim
e.
Jun
-17
Fin
ance
an
d c
red
it f
acili
ties
Inst
ruct
ed b
anks
to
issu
e Le
tter
s o
f C
red
it (
LC)
to r
ice
imp
ort
ers
at a
zer
o m
arg
in. T
he
mea
sure
see
ks t
o f
acili
tate
imp
ort
s o
f ri
ce in
ord
er t
o
com
pen
sate
fo
r fl
oo
d-r
elat
ed o
utp
ut
loss
es a
nd
will
be
effe
ctiv
e u
nti
l 31
Dec
emb
er 2
017.
Jun
-17
Imp
ort
tar
iff
Red
uce
d c
ust
om
s d
uti
es o
n im
po
rted
hu
sked
, sem
i/wh
olly
mill
ed a
nd
bro
ken
ric
e to
10
per
cen
t, d
ow
n f
rom
a p
revi
ou
s le
vel o
f 25
per
cen
t.
The
3 p
erce
nt
Reg
ula
tory
Du
ty, i
mp
ose
d o
n t
op
of
cust
om
s d
uti
es, w
as a
lso
res
cin
ded
fo
r ri
ce. T
he
mea
sure
wen
t in
to e
ffec
t o
n 2
1 Ju
ne
2017
.
Jul-
17Fi
nan
ce a
nd
cre
dit
fac
iliti
esA
llow
ed b
anks
to
issu
e le
tter
s o
f cr
edit
to
ric
e im
po
rter
s o
n a
def
erre
d p
aym
ent
or
usa
nce
bas
is, o
r u
nd
er b
uye
r's
cred
it. T
he
mea
sure
see
ks t
o
faci
litat
e p
riva
te s
ecto
r im
po
rts
of
rice
an
d w
ill b
e ef
fect
ive
un
til 3
1 D
ecem
ber
201
7.
Au
g-1
7Im
po
rt a
gre
emen
tSi
gn
ed a
n M
OU
wit
h C
amb
od
ia, g
ivin
g B
ang
lad
esh
th
e o
pti
on
to
imp
ort
up
to
1 m
illio
n t
on
nes
of
rice
un
til 2
022.
Au
g-1
7Im
po
rt a
gre
emen
tSi
gn
ed a
n M
OU
wit
h T
hai
lan
d, a
llow
ing
Ban
gla
des
h t
o p
urc
has
e u
p t
o 1
.0 m
illio
n t
on
nes
of
Thai
ric
e p
er y
ear
un
til 2
021.
Au
g-1
7Im
po
rt t
arif
fR
edu
ced
cu
sto
ms
du
ties
on
imp
ort
ed h
usk
ed, s
emi/w
ho
lly m
illed
an
d b
roke
n r
ice
fro
m 1
0 p
erce
nt
to 2
per
cen
t, e
ffec
tive
17
Au
gu
st 2
017.
Sep
-17
Imp
ort
ag
reem
ent
Sig
ned
an
MO
U w
ith
Mya
nm
ar, g
ivin
g it
th
e o
pti
on
to
pu
rch
ase
250
000
ton
nes
of
wh
ite
rice
an
d 5
0 00
0 to
nn
es o
f p
arb
oile
d r
ice,
per
yea
r, u
nti
l 202
2. A
n O
cto
ber
dec
isio
n a
uth
ori
zed
th
e fi
rst
pu
rch
ase
un
der
th
e ag
reem
ent,
fo
r a
tota
l of
100
000
ton
nes
.
Oct
-17
Imp
ort
ag
reem
ent
Rea
ched
dea
ls w
ith
offi
cial
s in
Ind
ia a
nd
Th
aila
nd
to
pu
rch
ase
a to
tal o
f 25
0 00
0 to
nn
es o
f ri
ce, a
cco
rdin
g t
o o
ffici
al s
tate
men
ts t
o t
he
pre
ss.
Bra
zil
Jul-
17M
inim
um
su
pp
ort
pri
ces
Ap
pro
ved
min
imu
m s
up
po
rt p
rice
s (M
SPs)
fo
r th
e 20
18/1
9 se
aso
n (
2017
/18
seas
on
fo
r B
razi
l), e
ffec
tive
fro
m F
ebru
ary
2018
to
Jan
uar
y 20
19.
The
MSP
fo
r fi
ne
lon
g-g
rain
pad
dy
was
rai
sed
by
3 p
erce
nt
to B
RL
720.
20 (
USD
227
.54)
per
to
nn
e fo
r th
e So
uth
ern
reg
ion
(ex
cep
t Pa
ran
á)
and
to
BR
L 72
0.17
(U
SD 2
27.5
3) f
or
all o
ther
reg
ion
s. T
he
MSP
s fo
r lo
ng
-gra
in p
add
y w
ere
inst
ead
left
un
vari
ed a
t B
RL
378.
0 (U
SD 1
19.4
) p
er
ton
ne
for
the
Sou
ther
n r
egio
n (
exce
pt
Para
ná)
an
d a
t B
RL
407.
5 (U
SD 1
28.7
) p
er t
on
ne
for
oth
er r
egio
ns.
Cam
bo
dia
Au
g-1
7Pr
od
uct
ion
su
pp
ort
, cr
edit
fa
cilit
ies
An
no
un
ced
th
at a
cre
dit
lin
e fo
r ri
ce m
iller
s an
d e
xpo
rter
s w
ou
ld b
e ra
ised
fro
m U
SD 2
7 m
illio
n t
o U
SD 5
0 m
illio
n. T
he
fun
ds
will
pro
vid
e p
roce
sso
rs a
nd
tra
der
s w
ith
low
-in
tere
st lo
ans
thro
ug
h t
he
Ru
ral D
evel
op
men
t B
ank
(RD
B)
in o
rder
to
ass
ist
them
in p
urc
has
ing
pad
dy
fro
m
the
2017
mai
n c
rop
har
vest
an
d s
tab
ilize
pri
ces.
Ad
dit
ion
al f
un
ds
wo
uld
go
to
bo
lste
r st
ora
ge
and
dry
ing
cap
acit
y.
Ch
ina
(Mai
nla
nd
)M
ay-1
7 to
O
ct-1
7St
ock
rel
ease
Sold
9.5
mill
ion
to
nn
es o
f p
add
y fr
om
sta
te r
eser
ves,
ou
t o
f a
tota
l of
67.9
mill
ion
to
nn
es o
f p
add
y o
ffer
ed t
hro
ug
h 3
7 au
ctio
ns
hel
d b
etw
een
17
May
201
7 an
d 1
3 O
cto
ber
201
7.

Ma
jor
po
licy
de
velo
pm
en
ts
88 89FOOD OUTLOOKNOVEMBER 2017
CO
UN
TRY
DA
TEPO
LIC
Y C
ATE
GO
RY
/IN
STR
UM
ENT
DES
CR
IPTI
ON
Co
lom
bia
Jun
-17
War
eho
use
rec
eip
ts
pro
gra
mm
e, m
arke
tin
g
assi
stan
ce
An
no
un
ced
th
at it
wo
uld
off
er a
CO
P 28
890
(U
SD 9
.5)
per
to
nn
e as
sist
ance
to
co
ver
the
mo
nth
ly s
tora
ge
cost
s o
f u
p t
o 2
84 8
55 t
on
nes
of
pad
dy
har
vest
ed d
uri
ng
th
e se
con
d s
emes
ter
of
2016
, fro
m 9
Ju
ne
2017
to
30
Jun
e 20
17. I
n a
dd
itio
n, C
OP
20 0
00 (
USD
6.6
) p
er t
on
ne
wo
uld
b
e o
ffer
ed t
o a
id r
ice
pro
du
cers
in m
arke
tin
g s
om
e 30
000
to
nn
es.
Au
g-1
7Su
pp
ort
pri
ces,
war
eho
use
re
ceip
ts p
rog
ram
Dec
ided
th
at t
he
sto
rag
e in
cen
tive
pro
gra
mm
e fo
r 20
17 s
eco
nd
-sem
este
r cr
op
s w
ou
ld b
e im
ple
men
ted
fro
m 1
1 A
ug
ust
201
7 to
30
Dec
emb
er 2
017.
Th
e sc
hem
e w
ill e
xten
d a
CO
P 28
890
(U
SD 9
.6)
ou
tlay
to
co
ver
the
cost
of
sto
rin
g a
to
nn
e o
f p
add
y p
er m
on
th, f
or
up
to
40
0 00
0 to
nn
es, p
rovi
ded
th
at t
hes
e vo
lum
es a
re p
urc
has
ed a
t re
fere
nce
pad
dy
pri
ces
of
CO
P 10
6 25
0–15
7 00
0 p
er 1
25 k
g (
USD
283
-418
per
to
nn
e). V
olu
mes
pu
rch
ased
un
der
th
e p
rog
ram
me
will
det
erm
ine
po
ten
tial
ric
e im
po
rt r
equ
irem
ents
fo
r 20
18 a
nd
th
eir
allo
cati
on
am
on
g
par
tici
pan
ts, a
s w
ell a
s en
titi
es' e
ligib
ility
to
par
tici
pat
e in
pu
blic
pro
cure
men
t ca
mp
aig
ns,
sp
ecia
l cre
dit
lin
es a
nd
exp
ort
neg
oti
atio
ns,
sh
ou
ld
the
nee
d f
or
thes
e ar
ise.
Au
g-1
7Pr
od
uct
ion
su
pp
ort
Dec
ided
to
ext
end
a m
arke
tin
g a
ssis
tan
ce p
acka
ge
for
up
to
161
800
to
nn
es o
f p
add
y fr
om
th
e 20
17 s
eco
nd
-sem
este
r h
arve
st, i
n o
rder
to
aid
ri
ce p
rod
uce
rs c
op
ing
wit
h d
eclin
es in
loca
l qu
ota
tio
ns
ensu
ing
fro
m s
ucc
essi
ve b
um
per
har
vest
s. T
he
pac
kag
e w
ill c
on
sist
of
a C
OP
64 0
00
(USD
21.
3) o
utl
ay p
er t
on
ne
of
pad
dy
mar
kete
d b
y p
rod
uce
rs b
etw
een
24
Au
gu
st a
nd
15
No
vem
ber
201
7, e
xcep
t fo
r fa
rmer
s in
Caq
uet
á,
Cas
anar
e, T
olim
a, H
uila
an
d M
eta,
wh
o w
ill r
ecei
ve a
n a
dd
itio
nal
CO
P 50
000
(U
SD 1
6.6)
per
to
nn
e o
f p
add
y so
ld f
or
up
to
116
000
to
nn
es.
Co
sta
Ric
a
May
-17
Sup
po
rt p
rice
sLo
wer
ed t
he
refe
ren
ce p
rod
uce
r p
rice
of
pad
dy
by
3 p
erce
nt
to C
RC
21
457
per
73.
6 kg
bag
(U
SD 5
03 p
er t
on
ne)
. A s
ucc
essi
ve d
ecis
ion
mad
e th
e re
vise
d r
ate
effe
ctiv
e as
of
1 Ju
ly 2
017.
Sep
-17
Safe
gu
ard
mea
sure
s
Put
in p
lace
saf
egu
ard
mea
sure
s o
n s
elec
ted
cla
sses
of
hu
sked
ric
e im
po
rts
(SA
C c
od
es 1
0062
0000
091
and
100
6200
099)
, ori
gin
atin
g in
co
un
trie
s n
ot
par
ty t
o a
pre
fere
nti
al t
rad
e ag
reem
ent
wit
h C
ost
a R
ica.
Eff
ecti
ve f
rom
6 S
epte
mb
er 2
017
to 3
1 D
ecem
ber
201
7, a
n a
dd
itio
nal
im
po
rt t
arif
f o
f 11
.67
per
cen
t w
ill b
e le
vied
on
th
ese
clas
ses,
sin
ce c
um
ula
tive
imp
ort
s fr
om
1 J
anu
ary
2017
su
rpas
sed
a 3
805
.2 t
on
ne
thre
sho
ld t
hat
act
ivat
es t
he
mea
sure
. Th
e su
rch
arg
e w
ill b
e ap
plie
d o
n t
op
of
a 35
per
cen
t im
po
rt d
uty
acc
rued
by
thes
e cl
asse
s.
Co
te d
'Ivo
ire
Jul-
17Pr
ice
con
tro
lsSe
t p
rice
cap
s o
n v
ario
us
com
mo
dit
ies,
incl
ud
ing
imp
ort
ed r
ice,
fo
r a
per
iod
of
six
mo
nth
s. P
rice
cei
ling
s o
n im
po
rted
ric
e ra
ng
e fr
om
XO
F 30
7 to
397
(U
SD 0
.55-
0.71
) p
er k
g a
t th
e re
tail
leve
l in
Ab
idja
n, b
ut
vary
dep
end
ing
on
th
e o
rig
in a
nd
qu
alit
y o
f su
pp
lies
and
pla
ce o
f sa
le, a
s w
ell
as t
he
stag
e o
f th
e m
arke
tin
g c
hai
n.
Egyp
tJu
l-17
Exp
ort
ban
An
no
un
ced
th
at t
he
ban
on
ric
e ex
po
rts
wo
uld
rem
ain
in p
lace
, in
ord
er t
o e
nsu
re s
uffi
cien
t lo
cal a
vaila
bili
ties
an
d b
uild
str
ateg
ic r
eser
ves.
Th
e ai
m w
ou
ld b
e to
sta
bili
ze c
on
sum
er p
rice
s at
EG
P 6.
5 (U
SD 0
.4)
per
kg
du
rin
g t
he
2017
sea
son
.
Gu
inea
-Bis
sau
Au
g-1
7Pr
ice
con
tro
lsSe
t a
max
imu
m r
etai
l pri
ce o
f X
OF
16 5
00 p
er 5
0 kg
of
fully
bro
ken
ric
e (U
SD 0
.59
per
kg
) in
Bis
sau
, an
d o
f X
OF
17 0
00 p
er 5
0 kg
(U
SD 0
.61
per
kg
) fo
r o
ther
par
ts o
f th
e co
un
try.
Th
e g
ove
rnm
ent
wo
uld
als
o t
ake
oth
er s
tep
s to
qu
ell i
ncr
ease
s in
do
mes
tic
rice
pri
ces,
incl
ud
ing
te
mp
ora
ry t
ax r
elie
f m
easu
res,
acc
ord
ing
to
pre
ss r
epo
rts.
Ind
ia
Jun
-17
Sup
po
rt p
rice
s, G
ove
rnm
ent
pro
cure
men
tR
aise
d m
inim
um
su
pp
ort
pri
ces
by
5.4
per
cen
t fo
r co
mm
on
pad
dy
to IN
R 1
5 50
0 (U
SD 2
39)
per
to
nn
e an
d b
y 5.
3 p
erce
nt
for
Gra
de
A p
add
y to
IN
R 1
5 90
0 (U
SD 2
45)
per
to
nn
e.
Jun
-17
Trad
e ag
reem
ent
Dec
ided
to
allo
w 6
7 64
0 to
nn
es o
f ri
ce, a
lon
g w
ith
oth
er p
rod
uct
s, t
o b
e ex
po
rted
to
th
e R
epu
blic
of
Mal
div
es in
201
7/18
, wit
ho
ut
any
exis
tin
g o
r fu
ture
res
tric
tio
ns.
Th
e m
easu
re w
ent
into
eff
ect
in A
pri
l 201
7.
Ind
on
esia
Au
g-1
7G
ove
rnm
ent
pro
cure
men
t,
pu
rch
asin
g p
rice
s
An
no
un
ced
th
at t
he
stat
e en
terp
rise
, Bu
log
, had
bee
n a
llow
ed t
o p
ay u
p t
o ID
R 4
070
–8 0
30 p
er k
g (
USD
296
–584
per
to
nn
e) f
or
sup
plie
s p
urc
has
ed f
rom
th
e lo
cal m
arke
t, 1
0 p
erce
nt
mo
re t
han
th
e ap
plic
able
go
vern
men
t p
urc
has
e p
rice
s. T
he
mo
ve is
gea
red
at
enab
ling
th
e ag
ency
to
ste
p-u
p lo
cal p
rocu
rem
ent
du
rin
g t
he
2017
off
seas
on
har
vest
, as
hig
her
mar
ket
pri
ces
rela
tive
to
go
vern
men
t p
rice
s h
ad s
low
ed it
s p
ace
of
stat
e p
urc
has
es f
rom
th
e d
om
esti
c m
arke
t.
Au
g-1
7Pr
ice
con
tro
ls
Set
the
max
imu
m r
etai
l pri
ce (
MR
P) f
or
med
ium
qu
alit
y ri
ce a
t ID
R 9
450
–10
250
(USD
0.6
9–0.
75)
per
kg
, dep
end
ing
on
th
e va
rio
us
pro
vin
ces.
Pr
ice
ceili
ng
s ra
ng
ing
fro
m ID
R 1
2 80
0 to
13
600
(USD
0.9
3 to
0.9
9) p
er k
g w
ere
inst
ead
set
fo
r p
rem
ium
qu
alit
ies,
wh
ile n
o c
eilin
g w
ou
ld
app
ly f
or
spec
ialt
y ri
ce. T
he
MR
Ps w
ent
into
eff
ect
on
1 S
epte
mb
er 2
017
and
co
mp
are
to a
cei
ling
of
IDR
9 5
00 (
USD
0.6
9) p
er k
g t
hat
ap
plie
d
to a
ll ri
ce q
ual
itie
s b
etw
een
Sep
tem
ber
201
6 an
d J
uly
201
7.
Iraq
Jun
-17
Imp
ort
ag
reem
ent
Exte
nd
ed a
n M
OU
on
th
e p
urc
has
e o
f ri
ce f
rom
th
e U
nit
ed S
tate
s fo
r it
s p
ub
lic d
istr
ibu
tio
n s
yste
m u
nti
l Jan
uar
y 20
18.
Ital
yA
ug
-17
Ori
gin
lab
ellin
gIs
sued
a d
ecis
ion
req
uir
ing
th
at la
bel
s o
f al
l ric
e (p
rod
uct
s fa
llin
g u
nd
er H
S co
de
1006
) m
arke
ted
in It
aly
ind
icat
e th
e co
un
try
in w
hic
h t
he
pro
du
ct w
as g
row
n, p
roce
ssed
an
d p
acka
ged
. Th
e m
easu
re w
ill b
e ef
fect
ive
fro
m 1
6 Fe
bru
ary
2018
un
til 3
1 D
ecem
ber
202
0, o
n a
tri
al b
asis
, o
r u
nti
l ru
les
on
ori
gin
lab
ellin
g a
re im
ple
men
ted
at
the
Euro
pea
n U
nio
n le
vel.
Jap
anSe
p-1
7Im
po
rt r
egu
lati
on
Issu
ed r
ule
s p
roh
ibit
ing
th
e sa
le o
r tr
ansf
er o
f im
po
rted
ric
e am
on
g e
nti
ties
par
tici
pat
ing
in s
imu
ltan
eou
s b
uy
and
sel
l ten
der
s, u
nle
ss t
he
sup
plie
s ar
e o
ther
wis
e p
roce
ssed
, pac
kag
ed o
r tr
ansf
orm
ed.

88 89FOOD OUTLOOKNOVEMBER 2017
RIC
E
CO
UN
TRY
DA
TEPO
LIC
Y C
ATE
GO
RY
/IN
STR
UM
ENT
DES
CR
IPTI
ON
Ken
ya
Jun
-17
Pro
du
ctio
n s
up
po
rtA
nn
ou
nce
d t
hat
it w
ou
ld w
aive
KES
100
mill
ion
(U
SD 0
.9 m
illio
n)
wo
rth
of
serv
ice
char
ges
pay
able
by
rice
far
mer
s in
th
e M
wea
Irri
gat
ion
Sc
hem
e, in
ord
er t
o a
ssis
t th
em in
co
pin
g w
ith
loss
es in
curr
ed in
201
6 as
a r
esu
lt o
f d
rou
gh
t.
Jun
-17
Imp
ort
tar
iff
Ren
ewed
exe
mp
tio
ns
to t
he
75 p
erce
nt
rice
imp
ort
du
ty a
pp
licab
le u
nd
er t
he
Co
mm
on
Ext
ern
al T
arif
f o
f th
e Ea
st A
fric
an C
om
mu
nit
y. Im
po
rt
tari
ffs
for
pad
dy,
hu
sked
, mill
ed a
nd
bro
ken
ric
e w
ill c
on
tin
ue
to b
e 35
per
cen
t (o
r U
SD 2
00 p
er t
on
ne,
wh
ich
ever
is h
igh
er)
for
a p
erio
d o
f o
ne
year
, eff
ecti
ve 1
Ju
ly 2
017.
Lib
eria
Au
g-1
7Im
po
rt t
arif
fR
enew
ed im
po
rt t
arif
f ex
emp
tio
ns
on
sem
i/wh
olly
mill
ed a
nd
bro
ken
ric
e, w
ith
imm
edia
te e
ffec
t.
Paki
stan
May
-17
Bu
dg
etar
y al
loca
tio
ns,
p
rod
uct
ion
su
pp
ort
An
no
un
ced
th
at it
wo
uld
mai
nta
in s
ub
sid
ies
on
fer
tiliz
er p
rice
s an
d e
lect
rici
ty r
ates
fo
r ag
ricu
ltu
ral t
ub
e w
ells
in 2
017/
2018
, as
par
t o
f it
s b
ud
get
ary
allo
cati
on
s. A
mo
ng
oth
er m
easu
res
to p
rom
ote
ag
ricu
ltu
ral p
rod
uct
ion
gro
wth
, it
wo
uld
als
o r
edu
ce c
ust
om
s d
uti
es le
vied
on
co
mb
ine
har
vest
ers,
alo
ng
wit
h s
ales
tax
es o
n a
gri
cult
ura
l die
sel e
ng
ines
. In
ad
dit
ion
to
rai
sin
g t
he
agri
cult
ure
cre
dit
tar
get
fo
r 20
17/2
018
by
43 p
erce
nt
to P
KR
1 0
01 b
illio
n (
USD
9.5
bill
ion
), it
als
o a
nn
ou
nce
d t
hat
it w
ou
ld la
un
ch a
new
cre
dit
sch
eme
pro
vid
ing
sm
allh
old
ers
cult
ivat
ing
up
to
12.
5 ac
res
(5.1
ha)
wit
h u
p t
o P
KR
50
000
(USD
473
.5)
of
cred
it a
t a
con
cess
ion
ary
rate
of
9.9
per
cen
t p
er y
ear.
May
-17
Exp
ort
pro
mo
tio
nA
nn
ou
nce
d t
hat
it w
ou
ld a
llow
ric
e to
be
war
eho
use
d o
uts
ide
Paki
stan
in o
rder
to
fac
ilita
te r
ice
exp
ort
s.
Phili
pp
ines
May
-17
Imp
ort
qu
ota
An
no
un
ced
th
at v
olu
mes
imp
ort
ed a
s p
art
of
its
2016
Min
imu
m A
cces
s V
olu
me
(MA
V)
com
mit
men
ts w
ou
ld b
e al
low
ed t
o e
nte
r th
e co
un
try
un
til 3
0 Ju
ne
2017
.
Jun
-17
Imp
ort
reg
ula
tio
n, i
mp
ort
te
nd
er
Acc
ord
ing
to
offi
cial
sta
tem
ents
to
th
e p
ress
, dec
ided
th
at in
tern
atio
nal
ric
e p
urc
has
es b
y th
e st
ate-
ow
ned
Nat
ion
al F
oo
d A
uth
ori
ty w
ou
ld
no
t b
e lim
ited
to
go
vern
men
t-to
-go
vern
men
t (G
2G)
tran
sact
ion
s. In
stea
d, p
riva
te s
ecto
r su
pp
liers
wo
uld
be
invi
ted
to
par
tici
pat
e in
imp
ort
te
nd
ers
lau
nch
ed b
y th
e ag
ency
. Mo
reo
ver,
tota
l vo
lum
es s
ou
gh
t w
ou
ld b
e su
bd
ivid
ed in
to lo
ts t
o e
nco
ura
ge
com
pet
itio
n, a
nd
del
iver
ies
wo
uld
be
stag
ed in
ord
er t
o a
void
pea
k h
arve
st p
erio
ds,
wh
ile t
he
term
s o
f p
aym
ent
are
red
uce
d f
rom
365
day
s to
15
day
s.
Jul-
17Im
po
rt t
end
erIs
sued
an
inte
rnat
ion
al t
end
er t
o p
urc
has
e 25
0 00
0 to
nn
es o
f 25
per
cen
t b
roke
n r
ice,
op
en t
o p
riva
te s
ecto
r en
titi
es. S
up
plie
rs w
ere
invi
ted
to
su
bm
it t
hei
r b
ids
by
25 J
uly
201
7 fo
r ei
gh
t lo
ts c
on
sist
ing
of
25 0
00–5
0 00
0 to
nn
es o
f ri
ce f
rom
an
y o
rig
in. O
f th
e to
tal v
olu
me,
120
000
to
nn
es
wer
e re
qu
ired
to
arr
ive
no
late
r th
an A
ug
ust
201
7 an
d t
he
rem
ain
der
th
e fo
llow
ing
mo
nth
.
Au
g-1
7Im
po
rt q
uo
ta
Op
ened
ap
plic
atio
ns
for
pri
vate
sec
tor
imp
ort
s o
f 80
5 20
0 to
nn
es o
f ri
ce, u
nd
er W
TO-m
and
ated
Min
imu
m A
cces
s V
olu
me
(MA
V)
qu
ota
s.
Vo
lum
es im
po
rted
sh
ou
ld c
om
pri
se s
pec
ialt
y ri
ce a
nd
/or
wel
l-m
illed
ric
e w
ith
max
imu
m b
roke
n c
on
ten
t o
f 25
per
cen
t. Q
uan
titi
es im
po
rted
u
nd
er t
he
qu
ota
will
acc
rue
a 35
per
cen
t im
po
rt t
arif
f an
d m
ust
be
del
iver
ed b
etw
een
20
Dec
emb
er 2
017
and
28
Feb
ruar
y 20
18, o
r fr
om
1
Jun
e 20
18 t
o 3
1 A
ug
ust
201
8.
Rep
ub
lic o
f K
ore
a
Sep
-17
Foo
d a
idA
nn
ou
nce
d t
hat
it w
ou
ld e
xpan
d it
s fo
od
aid
del
iver
ies
of
rice
, up
on
co
mp
leti
ng
its
acce
ssio
n t
o t
he
Foo
d A
ssis
tan
ce C
on
ven
tio
n a
t th
e en
d o
f 20
17. T
o t
hes
e ef
fect
s, it
aim
ed t
o p
rovi
de
up
to
50
000
ton
nes
of
rice
as
foo
d a
id t
hro
ug
h t
he
Wo
rld
Fo
od
Pro
gra
m in
201
8.
Sep
-17
Go
vern
men
t p
rocu
rem
ent
An
no
un
ced
th
at t
he
go
vern
men
t w
ou
ld p
urc
has
e 72
0 00
0 to
nn
es o
f ri
ce f
rom
th
e 20
17 h
arve
st. T
he
volu
me
wo
uld
incl
ud
e 35
0 00
0 to
nn
es a
s p
art
of
the
Pub
lic R
ice
Sto
ckh
old
ing
Pro
gra
m, a
nd
370
000
to
nn
es g
eare
d a
t st
abili
zin
g d
om
esti
c p
rice
s.
Rw
and
aJu
n-1
7Im
po
rt t
arif
fD
ecid
ed t
hat
th
e 75
per
cen
t ri
ce im
po
rt d
uty
ap
plic
able
un
der
th
e C
om
mo
n E
xter
nal
Tar
iff
of
the
East
Afr
ican
Co
mm
un
ity
wo
uld
no
t b
e ap
plie
d f
or
ano
ther
yea
r. A
cco
rdin
gly
, im
po
rts
of
pad
dy,
hu
sked
, mill
ed a
nd
bro
ken
ric
e w
ou
ld c
on
tin
ue
to a
ccru
e a
45 p
erce
nt
(or
USD
345
p
er t
on
ne,
wh
ich
ever
is h
igh
er)
tari
ff u
nti
l 30
Jun
e 20
18.
Sen
egal
Jul-
17Pr
od
uct
ion
su
pp
ort
An
no
un
ced
th
at p
add
y p
rice
s w
ou
ld b
e fi
xed
at
XO
F 12
5 p
er k
g (
USD
225
per
to
nn
e) in
ord
er t
o e
nsu
re s
uffi
cien
t re
turn
s fo
r ri
ce f
arm
ers.
Sri L
anka
May
-17
Imp
ort
tar
iff
Dec
ided
th
at t
he
Spec
ial C
om
mo
dit
y Le
vy (
SCL)
of
LKR
5 p
er k
g (
USD
32
per
to
nn
e) im
po
sed
on
imp
ort
s o
f se
mi/w
ho
lly m
illed
ric
e w
ou
ld b
e va
lid u
nti
l 31
Au
gu
st 2
017.
Jun
-17
Imp
ort
qu
ota
An
no
un
ced
th
at t
he
go
vern
men
t w
ou
ld im
po
rt 1
00 0
00 t
on
nes
of
rice
, in
ord
er t
o e
nsu
re s
uffi
cien
t lo
cal a
vaila
bili
ties
an
d r
efu
rbis
h
sto
ckp
iles.
Jun
-17
and
A
ug
-17
Imp
ort
tar
iff
Dec
ided
th
at im
po
rted
bro
ken
ric
e w
ou
ld a
ccru
e a
Spec
ial C
om
mo
dit
y Le
vy (
SCL)
of
LKR
5 p
er k
g (
USD
32
per
to
nn
e) f
or
3 m
on
ths,
sta
rtin
g
fro
m 1
Ju
ly 2
017.
An
Au
gu
st d
ecis
ion
low
ered
th
e SC
L o
n b
roke
n r
ice
to L
KR
0.2
5 p
er k
g (
USD
2 p
er t
on
ne)
, eff
ecti
ve u
nti
l 31
Dec
emb
er 2
017.
Au
g-1
7Pr
ice
con
tro
ls
Rai
sed
th
e m
axim
um
ret
ail p
rice
of
imp
ort
ed N
adu
ric
e b
y 4
per
cen
t to
LK
R 7
5 (U
SD 0
.5)
per
kg
an
d lo
wer
ed t
he
pri
ce c
eilin
g f
or
imp
ort
ed
raw
ric
e b
y 7
per
cen
t to
LK
R 6
5 (U
SD 0
.4)
per
kg
. Th
e re
vise
d r
ates
to
ok
effe
ct o
n 4
Au
gu
st 2
017,
wh
ile p
rice
cap
s fo
r lo
cally
pro
du
ced
ric
e an
d
for
imp
ort
ed S
amb
a ri
ce w
ere
left
un
vari
ed. T
he
max
imu
m r
etai
l pri
ces
of
all l
oca
lly p
rod
uce
d a
nd
imp
ort
ed r
ice
wer
e su
cces
sive
ly r
emo
ved
, ef
fect
ive
fro
m 1
6 A
ug
ust
201
7.
Sep
-17
Co
nsu
mer
pri
ces
Low
ered
pri
ces
of
eig
ht
qu
alit
ies
of
rice
so
ld t
hro
ug
h L
ak S
ath
osa
ou
tlet
s b
y 2–
8 p
erce
nt
to L
KR
60–
90 (
USD
0.4
–0.6
) p
er k
g, e
ffec
tive
29
Sep
tem
ber
201
7.
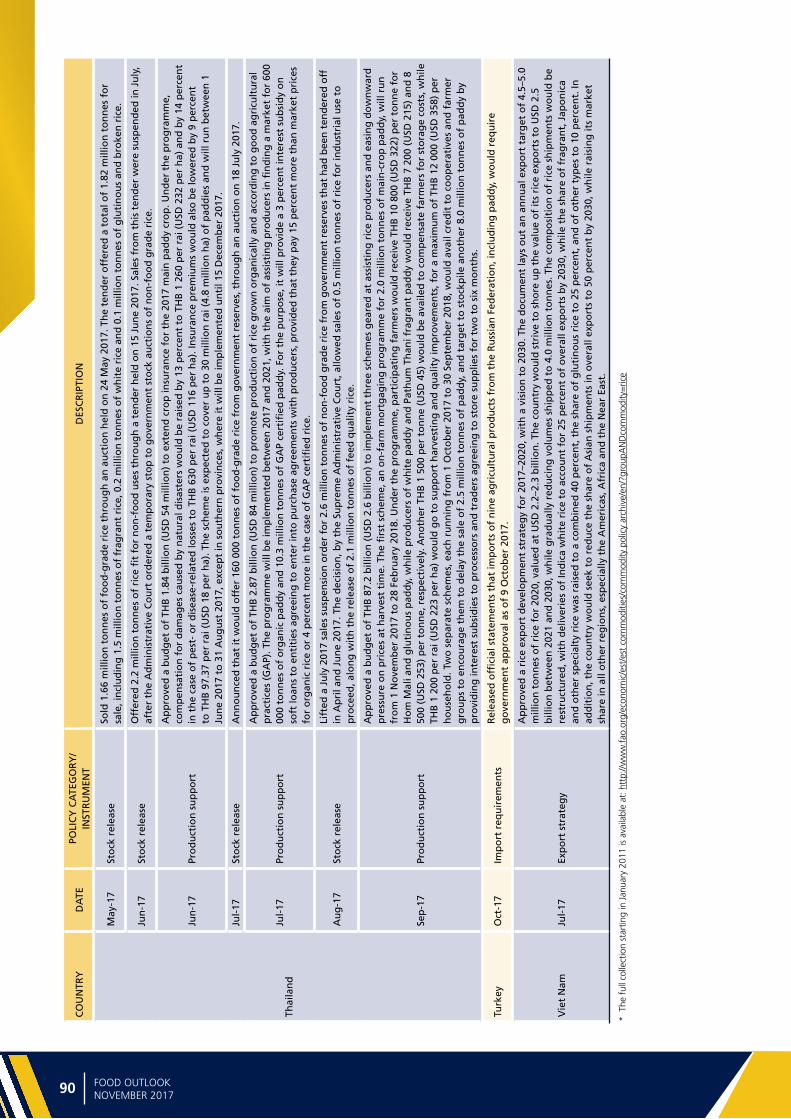
Ma
jor
po
licy
de
velo
pm
en
ts
90 91FOOD OUTLOOKNOVEMBER 2017
CO
UN
TRY
DA
TEPO
LIC
Y C
ATE
GO
RY
/IN
STR
UM
ENT
DES
CR
IPTI
ON
Thai
lan
d
May
-17
Sto
ck r
elea
seSo
ld 1
.66
mill
ion
to
nn
es o
f fo
od
-gra
de
rice
th
rou
gh
an
au
ctio
n h
eld
on
24
May
201
7. T
he
ten
der
off
ered
a t
ota
l of
1.82
mill
ion
to
nn
es f
or
sale
, in
clu
din
g 1
.5 m
illio
n t
on
nes
of
frag
ran
t ri
ce, 0
.2 m
illio
n t
on
nes
of
wh
ite
rice
an
d 0
.1 m
illio
n t
on
nes
of
glu
tin
ou
s an
d b
roke
n r
ice.
Jun
-17
Sto
ck r
elea
seO
ffer
ed 2
.2 m
illio
n t
on
nes
of
rice
fit
for
no
n-f
oo
d u
ses
thro
ug
h a
ten
der
hel
d o
n 1
5 Ju
ne
2017
. Sal
es f
rom
th
is t
end
er w
ere
susp
end
ed in
Ju
ly,
afte
r th
e A
dm
inis
trat
ive
Co
urt
ord
ered
a t
emp
ora
ry s
top
to
go
vern
men
t st
ock
au
ctio
ns
of
no
n-f
oo
d g
rad
e ri
ce.
Jun
-17
Pro
du
ctio
n s
up
po
rt
Ap
pro
ved
a b
ud
get
of
THB
1.8
4 b
illio
n (
USD
54
mill
ion
) to
ext
end
cro
p in
sura
nce
fo
r th
e 20
17 m
ain
pad
dy
cro
p. U
nd
er t
he
pro
gra
mm
e,
com
pen
sati
on
fo
r d
amag
es c
ause
d b
y n
atu
ral d
isas
ters
wo
uld
be
rais
ed b
y 13
per
cen
t to
TH
B 1
260
per
rai
(U
SD 2
32 p
er h
a) a
nd
by
14 p
erce
nt
in t
he
case
of
pes
t- o
r d
isea
se-r
elat
ed lo
sses
to
TH
B 6
30 p
er r
ai (
USD
116
per
ha)
. In
sura
nce
pre
miu
ms
wo
uld
als
o b
e lo
wer
ed b
y 9
per
cen
t to
TH
B 9
7.37
per
rai
(U
SD 1
8 p
er h
a). T
he
sch
eme
is e
xpec
ted
to
co
ver
up
to
30
mill
ion
rai
(4.
8 m
illio
n h
a) o
f p
add
ies
and
will
ru
n b
etw
een
1
Jun
e 20
17 t
o 3
1 A
ug
ust
201
7, e
xcep
t in
so
uth
ern
pro
vin
ces,
wh
ere
it w
ill b
e im
ple
men
ted
un
til 1
5 D
ecem
ber
201
7.
Jul-
17St
ock
rel
ease
An
no
un
ced
th
at it
wo
uld
off
er 1
60 0
00 t
on
nes
of
foo
d-g
rad
e ri
ce f
rom
go
vern
men
t re
serv
es, t
hro
ug
h a
n a
uct
ion
on
18
July
201
7.
Jul-
17Pr
od
uct
ion
su
pp
ort
Ap
pro
ved
a b
ud
get
of
THB
2.8
7 b
illio
n (
USD
84
mill
ion
) to
pro
mo
te p
rod
uct
ion
of
rice
gro
wn
org
anic
ally
an
d a
cco
rdin
g t
o g
oo
d a
gri
cult
ura
l p
ract
ices
(G
AP)
. Th
e p
rog
ram
me
will
be
imp
lem
ente
d b
etw
een
201
7 an
d 2
021,
wit
h t
he
aim
of
assi
stin
g p
rod
uce
rs in
fin
din
g a
mar
ket
for
600
000
ton
nes
of
org
anic
pad
dy
and
10.
3 m
illio
n t
on
nes
of
GA
P ce
rtifi
ed p
add
y. F
or
the
pu
rpo
se, i
t w
ill p
rovi
de
a 3
per
cen
t in
tere
st s
ub
sid
y o
n
soft
loan
s to
en
titi
es a
gre
ein
g t
o e
nte
r in
to p
urc
has
e ag
reem
ents
wit
h p
rod
uce
rs, p
rovi
ded
th
at t
hey
pay
15
per
cen
t m
ore
th
an m
arke
t p
rice
s fo
r o
rgan
ic r
ice
or
4 p
erce
nt
mo
re in
th
e ca
se o
f G
AP
cert
ified
ric
e.
Au
g-1
7St
ock
rel
ease
Lift
ed a
Ju
ly 2
017
sale
s su
spen
sio
n o
rder
fo
r 2.
6 m
illio
n t
on
nes
of
no
n-f
oo
d g
rad
e ri
ce f
rom
go
vern
men
t re
serv
es t
hat
had
bee
n t
end
ered
off
in
Ap
ril a
nd
Ju
ne
2017
. Th
e d
ecis
ion
, by
the
Sup
rem
e A
dm
inis
trat
ive
Co
urt
, allo
wed
sal
es o
f 0.
5 m
illio
n t
on
nes
of
rice
fo
r in
du
stri
al u
se t
o
pro
ceed
, alo
ng
wit
h t
he
rele
ase
of
2.1
mill
ion
to
nn
es o
f fe
ed q
ual
ity
rice
.
Sep
-17
Pro
du
ctio
n s
up
po
rt
Ap
pro
ved
a b
ud
get
of
THB
87.
2 b
illio
n (
USD
2.6
bill
ion
) to
imp
lem
ent
thre
e sc
hem
es g
eare
d a
t as
sist
ing
ric
e p
rod
uce
rs a
nd
eas
ing
do
wn
war
d
pre
ssu
re o
n p
rice
s at
har
vest
tim
e. T
he
firs
t sc
hem
e, a
n o
n-f
arm
mo
rtg
agin
g p
rog
ram
me
for
2.0
mill
ion
to
nn
es o
f m
ain
-cro
p p
add
y, w
ill r
un
fr
om
1 N
ove
mb
er 2
017
to 2
8 Fe
bru
ary
2018
. Un
der
th
e p
rog
ram
me,
par
tici
pat
ing
far
mer
s w
ou
ld r
ecei
ve T
HB
10
800
(USD
322
) p
er t
on
ne
for
Ho
m M
ali a
nd
glu
tin
ou
s p
add
y, w
hile
pro
du
cers
of
wh
ite
pad
dy
and
Pat
hu
m T
han
i fra
gra
nt
pad
dy
wo
uld
rec
eive
TH
B 7
200
(U
SD 2
15)
and
8
500
(USD
253
) p
er t
on
ne,
res
pec
tive
ly. A
no
ther
TH
B 1
500
per
to
nn
e (U
SD 4
5) w
ou
ld b
e av
aile
d t
o c
om
pen
sate
far
mer
s fo
r st
ora
ge
cost
s, w
hile
TH
B 1
200
per
rai
(U
SD 2
23 p
er h
a) w
ou
ld g
o t
o s
up
po
rt h
arve
stin
g a
nd
qu
alit
y im
pro
vem
ents
, fo
r a
max
imu
m o
f TH
B 1
2 00
0 (U
SD 3
58)
per
h
ou
seh
old
. Tw
o s
epar
ate
sch
emes
, eac
h r
un
nin
g f
rom
1 O
cto
ber
201
7 to
30
Sep
tem
ber
201
8, w
ou
ld a
vail
cred
it t
o c
oo
per
ativ
es a
nd
far
mer
g
rou
ps
to e
nco
ura
ge
them
to
del
ay t
he
sale
of
2.5
mill
ion
to
nn
es o
f p
add
y, a
nd
tar
get
to
sto
ckp
ile a
no
ther
8.0
mill
ion
to
nn
es o
f p
add
y b
y p
rovi
din
g in
tere
st s
ub
sid
ies
to p
roce
sso
rs a
nd
tra
der
s ag
reei
ng
to
sto
re s
up
plie
s fo
r tw
o t
o s
ix m
on
ths.
Turk
eyO
ct-1
7Im
po
rt r
equ
irem
ents
Rel
ease
d o
ffici
al s
tate
men
ts t
hat
imp
ort
s o
f n
ine
agri
cult
ura
l pro
du
cts
fro
m t
he
Ru
ssia
n F
eder
atio
n, i
ncl
ud
ing
pad
dy,
wo
uld
req
uir
e g
ove
rnm
ent
app
rova
l as
of
9 O
cto
ber
201
7.
Vie
t N
amJu
l-17
Exp
ort
str
ateg
y
Ap
pro
ved
a r
ice
exp
ort
dev
elo
pm
ent
stra
teg
y fo
r 20
17–2
020,
wit
h a
vis
ion
to
203
0. T
he
do
cum
ent
lays
ou
t an
an
nu
al e
xpo
rt t
arg
et o
f 4.
5–5.
0 m
illio
n t
on
nes
of
rice
fo
r 20
20, v
alu
ed a
t U
SD 2
.2–2
.3 b
illio
n. T
he
cou
ntr
y w
ou
ld s
triv
e to
sh
ore
up
th
e va
lue
of
its
rice
exp
ort
s to
USD
2.5
b
illio
n b
etw
een
202
1 an
d 2
030,
wh
ile g
rad
ual
ly r
edu
cin
g v
olu
mes
sh
ipp
ed t
o 4
.0 m
illio
n t
on
nes
. Th
e co
mp
osi
tio
n o
f ri
ce s
hip
men
ts w
ou
ld b
e re
stru
ctu
red
, wit
h d
eliv
erie
s o
f In
dic
a w
hit
e ri
ce t
o a
cco
un
t fo
r 25
per
cen
t o
f o
vera
ll ex
po
rts
by
2030
, wh
ile t
he
shar
e o
f fr
agra
nt,
Jap
on
ica
and
oth
er s
pec
ialt
y ri
ce w
as r
aise
d t
o a
co
mb
ined
40
per
cen
t, t
he
shar
e o
f g
luti
no
us
rice
to
25
per
cen
t, a
nd
of
oth
er t
ypes
to
10
per
cen
t. In
ad
dit
ion
, th
e co
un
try
wo
uld
see
k to
red
uce
th
e sh
are
of
Asi
an s
hip
men
ts in
ove
rall
exp
ort
s to
50
per
cen
t b
y 20
30, w
hile
rai
sin
g it
s m
arke
t sh
are
in a
ll o
ther
reg
ion
s, e
spec
ially
th
e A
mer
icas
, Afr
ica
and
th
e N
ear
East
.
* T
he f
ull c
olle
ctio
n st
artin
g in
Jan
uary
201
1 is
ava
ilabl
e at
: htt
p://w
ww
.fao
.org
/eco
nom
ic/e
st/e
st c
omm
oditi
es/c
omm
odity
pol
icy
arch
ive/
en/?
grou
pAN
Dco
mm
odity
=ric
e

90 91FOOD OUTLOOKNOVEMBER 2017
OILC
RO
PS
CO
UN
TRY
DA
TEPO
LIC
Y C
ATE
GO
RY
/IN
STR
UM
ENT
DES
CR
IPTI
ON
Thai
lan
d
May
-17
Sto
ck r
elea
seSo
ld 1
.66
mill
ion
to
nn
es o
f fo
od
-gra
de
rice
th
rou
gh
an
au
ctio
n h
eld
on
24
May
201
7. T
he
ten
der
off
ered
a t
ota
l of
1.82
mill
ion
to
nn
es f
or
sale
, in
clu
din
g 1
.5 m
illio
n t
on
nes
of
frag
ran
t ri
ce, 0
.2 m
illio
n t
on
nes
of
wh
ite
rice
an
d 0
.1 m
illio
n t
on
nes
of
glu
tin
ou
s an
d b
roke
n r
ice.
Jun
-17
Sto
ck r
elea
seO
ffer
ed 2
.2 m
illio
n t
on
nes
of
rice
fit
for
no
n-f
oo
d u
ses
thro
ug
h a
ten
der
hel
d o
n 1
5 Ju
ne
2017
. Sal
es f
rom
th
is t
end
er w
ere
susp
end
ed in
Ju
ly,
afte
r th
e A
dm
inis
trat
ive
Co
urt
ord
ered
a t
emp
ora
ry s
top
to
go
vern
men
t st
ock
au
ctio
ns
of
no
n-f
oo
d g
rad
e ri
ce.
Jun
-17
Pro
du
ctio
n s
up
po
rt
Ap
pro
ved
a b
ud
get
of
THB
1.8
4 b
illio
n (
USD
54
mill
ion
) to
ext
end
cro
p in
sura
nce
fo
r th
e 20
17 m
ain
pad
dy
cro
p. U
nd
er t
he
pro
gra
mm
e,
com
pen
sati
on
fo
r d
amag
es c
ause
d b
y n
atu
ral d
isas
ters
wo
uld
be
rais
ed b
y 13
per
cen
t to
TH
B 1
260
per
rai
(U
SD 2
32 p
er h
a) a
nd
by
14 p
erce
nt
in t
he
case
of
pes
t- o
r d
isea
se-r
elat
ed lo
sses
to
TH
B 6
30 p
er r
ai (
USD
116
per
ha)
. In
sura
nce
pre
miu
ms
wo
uld
als
o b
e lo
wer
ed b
y 9
per
cen
t to
TH
B 9
7.37
per
rai
(U
SD 1
8 p
er h
a). T
he
sch
eme
is e
xpec
ted
to
co
ver
up
to
30
mill
ion
rai
(4.
8 m
illio
n h
a) o
f p
add
ies
and
will
ru
n b
etw
een
1
Jun
e 20
17 t
o 3
1 A
ug
ust
201
7, e
xcep
t in
so
uth
ern
pro
vin
ces,
wh
ere
it w
ill b
e im
ple
men
ted
un
til 1
5 D
ecem
ber
201
7.
Jul-
17St
ock
rel
ease
An
no
un
ced
th
at it
wo
uld
off
er 1
60 0
00 t
on
nes
of
foo
d-g
rad
e ri
ce f
rom
go
vern
men
t re
serv
es, t
hro
ug
h a
n a
uct
ion
on
18
July
201
7.
Jul-
17Pr
od
uct
ion
su
pp
ort
Ap
pro
ved
a b
ud
get
of
THB
2.8
7 b
illio
n (
USD
84
mill
ion
) to
pro
mo
te p
rod
uct
ion
of
rice
gro
wn
org
anic
ally
an
d a
cco
rdin
g t
o g
oo
d a
gri
cult
ura
l p
ract
ices
(G
AP)
. Th
e p
rog
ram
me
will
be
imp
lem
ente
d b
etw
een
201
7 an
d 2
021,
wit
h t
he
aim
of
assi
stin
g p
rod
uce
rs in
fin
din
g a
mar
ket
for
600
000
ton
nes
of
org
anic
pad
dy
and
10.
3 m
illio
n t
on
nes
of
GA
P ce
rtifi
ed p
add
y. F
or
the
pu
rpo
se, i
t w
ill p
rovi
de
a 3
per
cen
t in
tere
st s
ub
sid
y o
n
soft
loan
s to
en
titi
es a
gre
ein
g t
o e
nte
r in
to p
urc
has
e ag
reem
ents
wit
h p
rod
uce
rs, p
rovi
ded
th
at t
hey
pay
15
per
cen
t m
ore
th
an m
arke
t p
rice
s fo
r o
rgan
ic r
ice
or
4 p
erce
nt
mo
re in
th
e ca
se o
f G
AP
cert
ified
ric
e.
Au
g-1
7St
ock
rel
ease
Lift
ed a
Ju
ly 2
017
sale
s su
spen
sio
n o
rder
fo
r 2.
6 m
illio
n t
on
nes
of
no
n-f
oo
d g
rad
e ri
ce f
rom
go
vern
men
t re
serv
es t
hat
had
bee
n t
end
ered
off
in
Ap
ril a
nd
Ju
ne
2017
. Th
e d
ecis
ion
, by
the
Sup
rem
e A
dm
inis
trat
ive
Co
urt
, allo
wed
sal
es o
f 0.
5 m
illio
n t
on
nes
of
rice
fo
r in
du
stri
al u
se t
o
pro
ceed
, alo
ng
wit
h t
he
rele
ase
of
2.1
mill
ion
to
nn
es o
f fe
ed q
ual
ity
rice
.
Sep
-17
Pro
du
ctio
n s
up
po
rt
Ap
pro
ved
a b
ud
get
of
THB
87.
2 b
illio
n (
USD
2.6
bill
ion
) to
imp
lem
ent
thre
e sc
hem
es g
eare
d a
t as
sist
ing
ric
e p
rod
uce
rs a
nd
eas
ing
do
wn
war
d
pre
ssu
re o
n p
rice
s at
har
vest
tim
e. T
he
firs
t sc
hem
e, a
n o
n-f
arm
mo
rtg
agin
g p
rog
ram
me
for
2.0
mill
ion
to
nn
es o
f m
ain
-cro
p p
add
y, w
ill r
un
fr
om
1 N
ove
mb
er 2
017
to 2
8 Fe
bru
ary
2018
. Un
der
th
e p
rog
ram
me,
par
tici
pat
ing
far
mer
s w
ou
ld r
ecei
ve T
HB
10
800
(USD
322
) p
er t
on
ne
for
Ho
m M
ali a
nd
glu
tin
ou
s p
add
y, w
hile
pro
du
cers
of
wh
ite
pad
dy
and
Pat
hu
m T
han
i fra
gra
nt
pad
dy
wo
uld
rec
eive
TH
B 7
200
(U
SD 2
15)
and
8
500
(USD
253
) p
er t
on
ne,
res
pec
tive
ly. A
no
ther
TH
B 1
500
per
to
nn
e (U
SD 4
5) w
ou
ld b
e av
aile
d t
o c
om
pen
sate
far
mer
s fo
r st
ora
ge
cost
s, w
hile
TH
B 1
200
per
rai
(U
SD 2
23 p
er h
a) w
ou
ld g
o t
o s
up
po
rt h
arve
stin
g a
nd
qu
alit
y im
pro
vem
ents
, fo
r a
max
imu
m o
f TH
B 1
2 00
0 (U
SD 3
58)
per
h
ou
seh
old
. Tw
o s
epar
ate
sch
emes
, eac
h r
un
nin
g f
rom
1 O
cto
ber
201
7 to
30
Sep
tem
ber
201
8, w
ou
ld a
vail
cred
it t
o c
oo
per
ativ
es a
nd
far
mer
g
rou
ps
to e
nco
ura
ge
them
to
del
ay t
he
sale
of
2.5
mill
ion
to
nn
es o
f p
add
y, a
nd
tar
get
to
sto
ckp
ile a
no
ther
8.0
mill
ion
to
nn
es o
f p
add
y b
y p
rovi
din
g in
tere
st s
ub
sid
ies
to p
roce
sso
rs a
nd
tra
der
s ag
reei
ng
to
sto
re s
up
plie
s fo
r tw
o t
o s
ix m
on
ths.
Turk
eyO
ct-1
7Im
po
rt r
equ
irem
ents
Rel
ease
d o
ffici
al s
tate
men
ts t
hat
imp
ort
s o
f n
ine
agri
cult
ura
l pro
du
cts
fro
m t
he
Ru
ssia
n F
eder
atio
n, i
ncl
ud
ing
pad
dy,
wo
uld
req
uir
e g
ove
rnm
ent
app
rova
l as
of
9 O
cto
ber
201
7.
Vie
t N
amJu
l-17
Exp
ort
str
ateg
y
Ap
pro
ved
a r
ice
exp
ort
dev
elo
pm
ent
stra
teg
y fo
r 20
17–2
020,
wit
h a
vis
ion
to
203
0. T
he
do
cum
ent
lays
ou
t an
an
nu
al e
xpo
rt t
arg
et o
f 4.
5–5.
0 m
illio
n t
on
nes
of
rice
fo
r 20
20, v
alu
ed a
t U
SD 2
.2–2
.3 b
illio
n. T
he
cou
ntr
y w
ou
ld s
triv
e to
sh
ore
up
th
e va
lue
of
its
rice
exp
ort
s to
USD
2.5
b
illio
n b
etw
een
202
1 an
d 2
030,
wh
ile g
rad
ual
ly r
edu
cin
g v
olu
mes
sh
ipp
ed t
o 4
.0 m
illio
n t
on
nes
. Th
e co
mp
osi
tio
n o
f ri
ce s
hip
men
ts w
ou
ld b
e re
stru
ctu
red
, wit
h d
eliv
erie
s o
f In
dic
a w
hit
e ri
ce t
o a
cco
un
t fo
r 25
per
cen
t o
f o
vera
ll ex
po
rts
by
2030
, wh
ile t
he
shar
e o
f fr
agra
nt,
Jap
on
ica
and
oth
er s
pec
ialt
y ri
ce w
as r
aise
d t
o a
co
mb
ined
40
per
cen
t, t
he
shar
e o
f g
luti
no
us
rice
to
25
per
cen
t, a
nd
of
oth
er t
ypes
to
10
per
cen
t. In
ad
dit
ion
, th
e co
un
try
wo
uld
see
k to
red
uce
th
e sh
are
of
Asi
an s
hip
men
ts in
ove
rall
exp
ort
s to
50
per
cen
t b
y 20
30, w
hile
rai
sin
g it
s m
arke
t sh
are
in a
ll o
ther
reg
ion
s, e
spec
ially
th
e A
mer
icas
, Afr
ica
and
th
e N
ear
East
.
OIL
CRO
PS:
MA
JOR
POLI
CY D
EVEL
OPM
ENTS
MID
-MA
Y T
O M
ID-O
CTO
BER
2017
*
CO
UN
TRY
PRO
DU
CT
DA
TEPO
LIC
Y
CA
TEG
OR
Y/
INST
RU
MEN
TD
ESC
RIP
TIO
N
Arg
enti
na
Ag
ricu
ltu
ral P
olic
yM
ay-1
7So
ybea
ns
Set
the
leve
l of
sub
sid
ies
pro
vid
ed t
o s
oyb
ean
far
mer
s in
th
e co
un
try’
s d
isad
van
tag
ed n
ort
her
n r
egio
ns
at A
RS
290
per
to
nn
e.
Seed
po
licy
Jun
-17
Ag
ricu
ltu
ral
cro
ps
Urg
ed f
arm
ers
to d
ecla
re t
he
qu
anti
ty a
nd
ori
gin
of
seed
s ke
pt
on
-far
m f
or
pla
nti
ng
, so
as
to e
nsu
re f
ull
tran
spar
ency
in t
he
do
mes
tic
seed
mar
ket
and
fac
ilita
te t
he
colle
ctio
n o
f ro
yalt
ies
by
seed
pro
du
cers
.
Bio
fuel
po
licy
Jun
e-17
to
O
ct-1
7B
iod
iese
lTe
mp
ora
rily
su
spen
ded
th
e co
un
try’
s ex
po
rt d
uty
on
bio
die
sel,
wit
h a
vie
w t
o im
pro
ve t
he
com
pet
itiv
enes
s o
f A
rgen
tin
e b
iod
iese
l o
n t
he
wo
rld
mar
ket.
Au
stra
lia/
Euro
pea
n U
nio
nFr
ee t
rad
e ag
reem
ent
May
-17
Rap
esee
dC
on
du
cted
a jo
int
sco
pin
g e
xerc
ise
on
a f
utu
re f
ree
trad
e ag
reem
ent
bet
wee
n A
ust
ralia
an
d t
he
Euro
pea
n U
nio
n, w
hic
h c
ou
ld
faci
litat
e ex
po
rts
of
Au
stra
lian
rap
esee
d t
o t
he
EU.
Au
stra
liaG
MO
po
licy
Jun
-17
Rap
esee
dIs
sued
a p
arlia
men
tary
pet
itio
n c
allin
g f
or
com
pen
sati
on
of
farm
ers
wh
en G
M-r
apes
eed
co
nta
min
atio
n c
ause
s th
em t
o lo
se t
hei
r G
M-f
ree
or
org
anic
cer
tifi
cati
on
.
Bo
livia
Exp
ort
po
licy
May
-17
Soyb
ean
sR
aise
d a
nn
ual
so
ybea
n e
xpo
rt q
uo
ta, i
n a
bid
to
pro
mo
te f
ore
ign
sal
es w
hile
co
nti
nu
ing
to
gu
aran
tee
that
do
mes
tic
con
sum
pti
on
re
qu
irem
ents
are
met
.
Bra
zil
Pest
co
ntr
ol
May
-17
Soyb
ean
sSe
t u
p a
wo
rkin
g g
rou
p w
ith
co
un
terp
arts
fro
m P
arag
uay
an
d B
oliv
ia t
o d
evel
op
join
t p
rog
ram
mes
on
co
ntr
olli
ng
th
e sp
read
of
Asi
an s
oyb
ean
ru
st in
So
uth
Am
eric
a.
Bra
zil/C
hin
aB
ilate
ral c
oo
per
atio
nM
ay-1
7So
ybea
ns
Set
up
a B
razi
lian
-Ch
ines
e in
vest
men
t fu
nd
fo
r in
fras
tru
ctu
re p
roje
cts,
wit
h a
vie
w t
o a
llow
Ch
ina
to in
vest
in B
razi
lian
rai
lro
ad,
hig
hw
ay a
nd
po
rt v
entu
res
that
wo
uld
low
er t
he
cost
of
ship
pin
g r
aw a
gri
cult
ura
l pro
du
cts
such
as
soyb
ean
s to
Ch
ina.
Bra
zil
Ag
ricu
ltu
ral P
olic
yJu
n-1
7A
gri
cult
ura
l cr
op
s
Pres
ente
d t
he
agri
cult
ura
l su
pp
ort
pro
gra
mm
e fo
r 20
17/1
8 th
at g
ran
ts in
crea
sed
loan
s fo
r co
mm
erci
al f
arm
ing
(fo
cusi
ng
on
in
vest
men
ts in
on
-far
m s
tock
-ho
ldin
g f
acili
ties
an
d im
pro
ved
pro
du
ctio
n t
ech
no
log
ies)
an
d r
aise
s p
ub
lic o
utl
ays
for
cro
p in
sura
nce
su
bsi
die
s.
Pest
co
ntr
ol
Jul-
17So
ybea
ns
Envi
sag
ed t
o e
xten
d a
n a
nn
ual
so
ybea
n-f
ree
per
iod
to
th
e St
ate
of
Mat
o G
ross
o d
o S
ul.
This
is m
ean
t to
hel
p c
on
tro
l th
e sp
read
o
f A
sian
so
ybea
n r
ust
fro
m o
ne
gro
win
g s
easo
n t
o t
he
nex
t.
Tran
spo
rt
infr
astr
uct
ure
Au
g-1
7So
ybea
ns,
gra
ins
Allo
cate
d f
un
ds
for
up
gra
din
g t
he
last
un
pav
ed s
tret
ch o
f h
igh
way
BR
163,
th
e ke
y ar
tery
lin
kin
g t
he
Stat
e o
f M
ato
Gro
sso
to
B
razi
l’s n
ewly
op
ened
po
rts
on
th
e n
ort
h-A
tlan
tic
coas
t.
Bio
fuel
po
licy
Sep
-17
Bio
die
sel
Co
nsi
der
ed r
aisi
ng
man
dat
ory
ble
nd
ing
of
bio
die
sel i
nto
reg
ula
r tr
ansp
ort
die
sel f
rom
8 p
erce
nt
to 1
0 p
erce
nt
in M
arch
201
8, o
ne
year
ear
lier
than
ori
gin
ally
pla
nn
ed.
Can
ada
Feed
sta
nd
ard
sM
ay-1
7C
amel
ina
oil
Ap
pro
ved
th
e u
se o
f m
ech
anic
ally
ext
ract
ed c
amel
ina
oil
as a
fee
d in
gre
die
nt
for
farm
ed fi
sh.
GM
O p
olic
yM
ay-1
7G
M f
oo
dR
ejec
ted
a d
raft
par
liam
enta
ry b
ill c
allin
g f
or
man
dat
ory
lab
ellin
g o
f g
enet
ical
ly m
od
ified
fo
od
s.
Hea
lth
po
licy
May
-17
Hyd
rog
enat
ed
veg
etab
le o
ilsA
nn
ou
nce
d p
lan
s to
pro
hib
it t
he
use
of
par
tial
ly h
ydro
gen
ated
oils
by
sum
mer
201
8, in
a b
id t
o r
edu
ce t
he
po
pu
lati
on
’s t
ran
s-fa
t in
take
to
th
e lo
wes
t le
vel p
oss
ible
.
Sect
or
dev
elo
pm
ent
mea
sure
sM
ay-1
7R
apes
eed
Set
up
a p
ub
lic-p
riva
te r
esea
rch
par
tner
ship
to
dev
elo
p a
dva
nce
d h
igh
-yie
ldin
g r
apes
eed
var
ieti
es, w
ith
a v
iew
to
up
ho
ld t
he
com
pet
itiv
enes
s o
f th
e co
un
try’
s ra
pes
eed
sec
tor.
Mar
ket
reg
ula
tio
nM
ay-1
7G
rain
s an
d
oils
eed
sPl
ann
ed e
xten
din
g, b
eyo
nd
its
exp
iry
dat
e o
f 1
Au
gu
st 2
017,
a t
emp
ora
ry r
even
ue
cap
on
rai
l tra
nsp
ort
s o
f g
rain
s an
d o
ilsee
ds
fro
m C
anad
a’s
Wes
tern
reg
ion
s to
th
e co
un
try’
s m
ain
po
rts.
Pest
icid
e re
gu
lati
on
Sep
-17
Inse
ctic
ide
'Mat
ado
r'Pr
op
ose
d, b
ased
on
saf
ety
con
cern
s, t
he
com
ple
te p
has
e-o
ut
of
Mat
ado
r, an
inse
ctic
ide
wid
ely
use
d in
rap
esee
d c
ult
ivat
ion
.
Hea
lth
po
licy
Sep
-17
Hyd
rog
enat
ed
veg
etab
le o
ilsC
on
firm
ed a
co
un
try-
wid
e b
an o
n p
arti
ally
hyd
rog
enat
ed o
ils. W
ith
en
try
into
fo
rce
in S
epte
mb
er 2
018,
th
e b
an w
ill in
clu
de
imp
ort
ed p
rod
uct
s an
d f
oo
ds
pre
par
ed a
nd
ser
ved
in r
esta
ura
nts
.
Can
ada/
Euro
pea
n
Un
ion
Free
tra
de
agre
emen
tSe
p-1
7R
apes
eed
oil
An
no
un
ced
th
e p
rovi
sio
nal
imp
lem
enta
tio
n, f
rom
21
Sep
tem
ber
201
7, o
f th
e C
om
pre
hen
sive
Eco
no
mic
Tra
de
Ag
reem
ent
(CET
A),
w
hic
h e
nta
ils t
he
elim
inat
ion
of
the
EU's
tar
iffs
on
Can
adia
n r
apes
eed
oil
imp
ort
s.

Ma
jor
po
licy
de
velo
pm
en
ts
92 93FOOD OUTLOOKNOVEMBER 2017
CO
UN
TRY
PRO
DU
CT
DA
TEPO
LIC
Y
CA
TEG
OR
Y/
INST
RU
MEN
TD
ESC
RIP
TIO
N
Ch
ina
Ag
ricu
ltu
ral P
olic
yM
ay-1
7A
ll cr
op
sPl
ann
ed in
tro
du
cin
g n
ew a
gri
cult
ura
l in
sura
nce
pro
gra
mm
es in
sel
ecte
d c
ou
nti
es t
o c
om
pen
sate
far
mer
s fo
r cr
op
loss
es r
esu
ltin
g
fro
m n
atu
ral d
isas
ters
.
Foo
d s
tan
dar
ds
May
-17
Edib
le o
ilmea
lsA
nn
ou
nce
d t
hat
a n
ew s
afet
y st
and
ard
fo
r ed
ible
oilm
eals
wo
uld
co
me
into
fo
rce
on
23
Jun
e 20
17.
Ag
ricu
ltu
ral P
olic
yM
ay-1
7A
rab
le c
rop
sIs
sued
gu
idel
ines
co
nce
rnin
g t
he
futu
re d
istr
ibu
tio
n o
f ar
able
lan
d a
s p
art
of
the
cou
ntr
y’s
nat
ion
al f
oo
d s
ecu
rity
str
ateg
y, w
ith
a
view
to
op
tim
ize
the
cou
ntr
y’s
agri
cult
ura
l pro
du
ctio
n p
atte
rn, w
hile
mak
ing
ag
ricu
ltu
ral s
up
po
rt p
rog
ram
mes
mo
re e
ffec
tive
.
Ch
ina/
Bra
zil
Bila
tera
l co
op
erat
ion
May
-17
Soyb
ean
sSe
t u
p a
Bra
zilia
n-C
hin
ese
inve
stm
ent
fun
d f
or
infr
astr
uct
ure
pro
ject
s, w
ith
a v
iew
to
allo
w C
hin
a to
inve
st in
Bra
zilia
n r
ailr
oad
, h
igh
way
an
d p
ort
ven
ture
s th
at w
ou
ld lo
wer
th
e co
st o
f sh
ipp
ing
raw
ag
ricu
ltu
ral p
rod
uct
s su
ch a
s so
ybea
ns
to C
hin
a.
Ch
ina/
Ind
on
esia
Bila
tera
l co
op
erat
ion
Jun
-17
Bio
die
sel
Co
nd
uct
ed b
ilate
ral t
alks
to
exp
lore
th
e p
oss
ibili
ty o
f i)
Ind
on
esia
ass
isti
ng
Ch
ina
in it
s ef
fort
s to
rai
se d
om
esti
c b
iod
iese
l co
nsu
mp
tio
n, a
nd
ii)
Ch
ina
inve
stin
g in
Ind
on
esia
’s d
ow
nst
ream
pal
m o
il p
roce
ssin
g s
ecto
r.
Ch
ina
Imp
ort
po
licy
Jun
-17
GM
rap
esee
d,
soyb
ean
Ren
ewed
imp
ort
ap
pro
vals
fo
r 14
GM
O c
rop
s (i
ncl
ud
ing
th
ree
rap
esee
d a
nd
fo
ur
soyb
ean
var
ieti
es)
and
ap
pro
ved
tw
o n
ew G
MO
cr
op
s (i
ncl
ud
ing
a n
ew s
oyb
ean
var
iety
), u
nd
er b
road
er e
ffo
rts
to p
rom
ote
eco
no
mic
an
d t
rad
e ti
es w
ith
th
e U
nit
ed S
tate
s.
Ag
ricu
ltu
ral P
olic
yJu
n-1
7So
ybea
ns
An
no
un
ced
an
incr
ease
in p
ub
lic o
utl
ays
for
farm
er s
ub
sid
y p
aym
ents
mea
nt
to e
nco
ura
ge
cro
p r
ota
tio
n, n
ota
bly
bet
wee
n m
aize
an
d s
oyb
ean
s.
Imp
ort
po
licy
Au
g-1
7So
ybea
n o
ilA
gre
ed t
o r
esu
me
imp
ort
s o
f so
ybea
n o
il fr
om
Arg
enti
na,
as
par
t o
f co
mp
reh
ensi
ve b
ilate
ral t
alks
on
bal
anci
ng
tra
de
bet
wee
n
the
two
co
un
trie
s.
Imp
ort
po
licy
Sep
-17
Veg
etab
le o
ilG
ran
ted
a t
wo
-yea
r tr
ansi
tio
nal
per
iod
– u
nti
l 30
Sep
tem
ber
201
9 –
for
the
imp
lem
enta
tio
n o
f n
ew f
oo
d im
po
rt r
egu
lati
on
s re
qu
irin
g im
po
rter
s o
f b
ulk
veg
etab
le o
ils t
o r
evie
w r
elev
ant
hea
lth
cer
tifi
cate
s an
d c
on
du
ct o
n-s
ite
insp
ecti
on
s o
f fo
reig
n
esta
blis
hm
ents
fro
m w
hic
h p
rod
uct
s ar
e so
urc
ed.
Pub
lic s
tock
po
licy
Sep
-17
Soyb
ean
sR
esu
med
sal
es o
f o
ld-c
rop
so
ybea
ns
fro
m s
tate
res
erve
s.
Ag
ricu
ltu
ral p
olic
ySe
p-1
7So
ybea
ns
Set
sub
sid
y p
aym
ents
gra
nte
d t
o s
oyb
ean
pro
du
cers
in H
eilo
ng
jian
g P
rovi
nce
fo
r th
e 20
16/1
7 se
aso
n a
t C
NY
118
.58
per
mu
(U
SD
267
per
ha)
.
Ch
ina/
Ukr
ain
eTr
ade
stan
dar
ds
Sep
-17
Sun
flo
wer
seed
ca
keA
gre
ed o
n s
anit
ary
and
bio
safe
ty p
roto
cols
reg
ula
tin
g im
po
rts
of
Ukr
ain
ian
su
nfl
ow
erse
ed c
ake
into
Ch
ina.
Ch
ina
Ag
ricu
ltu
ral p
olic
yO
ct-1
7M
aize
, so
ybea
ns
Low
ered
su
bsi
dy
pay
men
ts p
rovi
ded
to
mai
ze g
row
ers
in a
n e
ffo
rt t
o c
urb
nat
ion
al m
aize
pro
du
ctio
n a
nd
eve
ntu
ally
cu
t d
om
esti
c st
ock
s, s
imu
ltan
eou
sly
enco
ura
gin
g f
arm
ers
to p
lan
t al
tern
ativ
e cr
op
s, in
clu
din
g s
oyb
ean
s.
Pub
lic s
tock
po
licy
Oct
-17
Soyb
ean
s, m
aize
Susp
end
ed, f
rom
en
d O
cto
ber
201
7, p
ub
lic a
uct
ion
s o
f o
ld-c
rop
mai
ze a
nd
so
ybea
ns
fro
m s
tate
res
erve
s, w
ith
a v
iew
no
t to
in
terf
ere
wit
h t
he
mar
keti
ng
of
the
new
201
7/18
cro
p.
Euro
pea
n U
nio
nPe
stic
ide
reg
ula
tio
nM
ay-1
7N
eon
ico
tin
oid
-b
ased
in
sect
icid
es
Co
nsi
der
ed c
on
vert
ing
th
e EU
’s t
emp
ora
ry m
ora
tori
um
on
neo
nic
oti
no
id-b
ased
inse
ctic
ides
(w
hic
h u
sed
to
be
wid
ely
emp
loye
d in
ra
pes
eed
cu
ltiv
atio
n)
into
a p
erm
anen
t b
an.
Euro
pea
n U
nio
n/
Au
stra
liaFr
ee t
rad
e ag
reem
ent
May
-17
Rap
esee
dC
on
du
cted
a jo
int
sco
pin
g e
xerc
ise
on
a f
utu
re f
ree
trad
e ag
reem
ent
bet
wee
n A
ust
ralia
an
d t
he
EU, w
hic
h c
ou
ld f
acili
tate
exp
ort
s o
f A
ust
ralia
n r
apes
eed
to
th
e EU
.
Euro
pea
n U
nio
n
Sect
or
dev
elo
pm
ent
mea
sure
sJu
l-17
Soyb
ean
sLa
un
ched
an
EU
-wid
e in
itia
tive
pro
mo
tin
g t
he
pro
du
ctio
n o
f n
on
-GM
so
ybea
ns
and
oth
er le
gu
me
cro
ps
for
foo
d a
nd
fee
d. T
he
pro
gra
mm
e is
mea
nt
to c
on
trib
ute
to
th
e d
evel
op
men
t o
f m
ore
su
stai
nab
le a
nd
res
ilien
t ag
ricu
ltu
ral s
yste
ms,
wh
ile t
akin
g in
to
acco
un
t g
row
ing
dem
and
fo
r G
M-f
ree
foo
ds
and
po
ssib
ly c
urb
ing
th
e EU
's d
epen
den
ce o
n im
po
rted
so
ybea
ns.
Imp
ort
po
licy
(an
ti-
du
mp
ing
du
ties
)Se
p-1
7B
iod
iese
lLo
wer
ed, e
ffec
tive
19
Sep
tem
ber
201
7, t
he
EU's
an
ti-d
um
pin
g d
uti
es o
n b
iod
iese
l im
po
rts
fro
m A
rgen
tin
a fr
om
22.
0–25
.7 p
erce
nt
to 4
.5–8
.1 p
erce
nt.
Pest
icid
e re
gu
lati
on
Sep
-17
Her
bic
ide
'Gly
ph
osa
te'
Post
po
ned
th
e d
ecis
ion
on
th
e p
rop
ose
d 1
0-ye
ar r
enew
al o
f th
e lic
ense
fo
r g
lyp
ho
sate
-bas
ed h
erb
icid
es, w
hic
h a
re w
idel
y u
sed
in
oils
eed
cu
ltiv
atio
n.
Euro
pea
n U
nio
n/
Can
ada
Free
tra
de
agre
emen
tSe
p-1
7R
apes
eed
oil
An
no
un
ced
th
e p
rovi
sio
nal
imp
lem
enta
tio
n, f
rom
21
Sep
tem
ber
201
7, o
f th
e C
om
pre
hen
sive
Eco
no
mic
Tra
de
Ag
reem
ent
(CET
A),
w
hic
h e
nta
ils t
he
elim
inat
ion
of
the
EU's
tar
iffs
on
Can
adia
n r
apes
eed
oil
imp
ort
s.
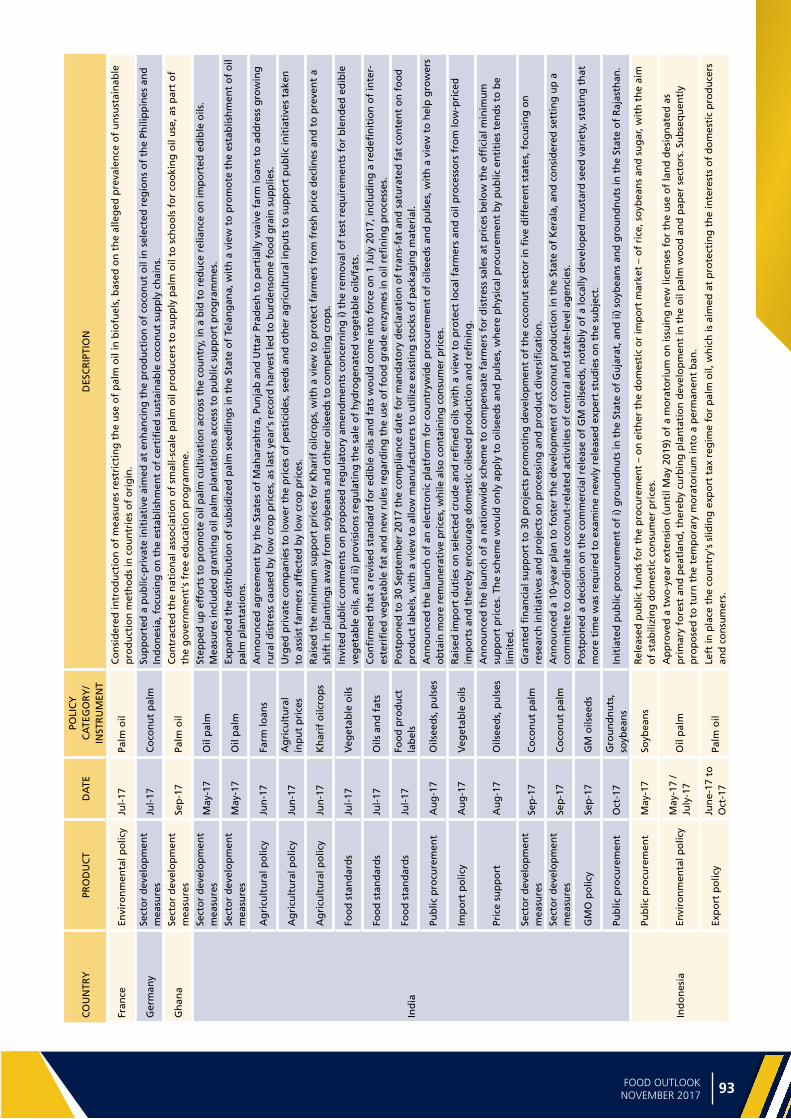
92 93FOOD OUTLOOKNOVEMBER 2017
OILC
RO
PS
* A
col
lect
ion
of m
ajor
pol
icy
deve
lopm
ents
sta
rtin
g in
Jan
uary
201
1 is
ava
ilabl
e at
: ht
tp://
ww
w.f
ao.o
rg/e
cono
mic
/est
/est
-com
mod
ities
/com
mod
ity-p
olic
y-ar
chiv
e/en
/?gr
oupA
ND
com
mod
ity=
Oils
eeds
,%20
oils
%20
and%
20m
eals
CO
UN
TRY
PRO
DU
CT
DA
TEPO
LIC
Y
CA
TEG
OR
Y/
INST
RU
MEN
TD
ESC
RIP
TIO
N
Fran
ceEn
viro
nm
enta
l po
licy
Jul-
17Pa
lm o
ilC
on
sid
ered
intr
od
uct
ion
of
mea
sure
s re
stri
ctin
g t
he
use
of
pal
m o
il in
bio
fuel
s, b
ased
on
th
e al
leg
ed p
reva
len
ce o
f u
nsu
stai
nab
le
pro
du
ctio
n m
eth
od
s in
co
un
trie
s o
f o
rig
in.
Ger
man
ySe
cto
r d
evel
op
men
t m
easu
res
Jul-
17C
oco
nu
t p
alm
Sup
po
rted
a p
ub
lic-p
riva
te in
itia
tive
aim
ed a
t en
han
cin
g t
he
pro
du
ctio
n o
f co
con
ut
oil
in s
elec
ted
reg
ion
s o
f th
e Ph
ilip
pin
es a
nd
In
do
nes
ia, f
ocu
sin
g o
n t
he
esta
blis
hm
ent
of
cert
ified
su
stai
nab
le c
oco
nu
t su
pp
ly c
hai
ns.
Gh
ana
Sect
or
dev
elo
pm
ent
mea
sure
sSe
p-1
7Pa
lm o
ilC
on
trac
ted
th
e n
atio
nal
ass
oci
atio
n o
f sm
all-
scal
e p
alm
oil
pro
du
cers
to
su
pp
ly p
alm
oil
to s
cho
ols
fo
r co
oki
ng
oil
use
, as
par
t o
f th
e g
ove
rnm
ent'
s fr
ee e
du
cati
on
pro
gra
mm
e.
Ind
ia
Sect
or
dev
elo
pm
ent
mea
sure
sM
ay-1
7O
il p
alm
Step
ped
up
eff
ort
s to
pro
mo
te o
il p
alm
cu
ltiv
atio
n a
cro
ss t
he
cou
ntr
y, in
a b
id t
o r
edu
ce r
elia
nce
on
imp
ort
ed e
dib
le o
ils.
Mea
sure
s in
clu
ded
gra
nti
ng
oil
pal
m p
lan
tati
on
s ac
cess
to
pu
blic
su
pp
ort
pro
gra
mm
es.
Sect
or
dev
elo
pm
ent
mea
sure
sM
ay-1
7O
il p
alm
Exp
and
ed t
he
dis
trib
uti
on
of
sub
sid
ized
pal
m s
eed
ling
s in
th
e St
ate
of
Tela
ng
ana,
wit
h a
vie
w t
o p
rom
ote
th
e es
tab
lish
men
t o
f o
il p
alm
pla
nta
tio
ns.
Ag
ricu
ltu
ral p
olic
yJu
n-1
7Fa
rm lo
ans
An
no
un
ced
ag
reem
ent
by
the
Stat
es o
f M
ahar
ash
tra,
Pu
nja
b a
nd
Utt
ar P
rad
esh
to
par
tial
ly w
aive
far
m lo
ans
to a
dd
ress
gro
win
g
rura
l dis
tres
s ca
use
d b
y lo
w c
rop
pri
ces,
as
last
yea
r's
reco
rd h
arve
st le
d t
o b
urd
enso
me
foo
d g
rain
su
pp
lies.
Ag
ricu
ltu
ral p
olic
yJu
n-1
7A
gri
cult
ura
l in
pu
t p
rice
sU
rged
pri
vate
co
mp
anie
s to
low
er t
he
pri
ces
of
pes
tici
des
, see
ds
and
oth
er a
gri
cult
ura
l in
pu
ts t
o s
up
po
rt p
ub
lic in
itia
tive
s ta
ken
to
ass
ist
farm
ers
affe
cted
by
low
cro
p p
rice
s.
Ag
ricu
ltu
ral p
olic
yJu
n-1
7K
har
if o
ilcro
ps
Rai
sed
th
e m
inim
um
su
pp
ort
pri
ces
for
Kh
arif
oilc
rop
s, w
ith
a v
iew
to
pro
tect
far
mer
s fr
om
fre
sh p
rice
dec
lines
an
d t
o p
reve
nt
a sh
ift
in p
lan
tin
gs
away
fro
m s
oyb
ean
s an
d o
ther
oils
eed
s to
co
mp
etin
g c
rop
s.
Foo
d s
tan
dar
ds
Jul-
17V
eget
able
oils
Invi
ted
pu
blic
co
mm
ents
on
pro
po
sed
reg
ula
tory
am
end
men
ts c
on
cern
ing
i) t
he
rem
ova
l of
test
req
uir
emen
ts f
or
ble
nd
ed e
dib
le
veg
etab
le o
ils, a
nd
ii)
pro
visi
on
s re
gu
lati
ng
th
e sa
le o
f h
ydro
gen
ated
veg
etab
le o
ils/f
ats.
Foo
d s
tan
dar
ds
Jul-
17O
ils a
nd
fat
sC
on
firm
ed t
hat
a r
evis
ed s
tan
dar
d f
or
edib
le o
ils a
nd
fat
s w
ou
ld c
om
e in
to f
orc
e o
n 1
Ju
ly 2
017,
incl
ud
ing
a r
edefi
nit
ion
of
inte
r-es
teri
fied
veg
etab
le f
at a
nd
new
ru
les
reg
ard
ing
th
e u
se o
f fo
od
gra
de
enzy
mes
in o
il re
fin
ing
pro
cess
es.
Foo
d s
tan
dar
ds
Jul-
17Fo
od
pro
du
ct
lab
els
Post
po
ned
to
30
Sep
tem
ber
201
7 th
e co
mp
lian
ce d
ate
for
man
dat
ory
dec
lara
tio
n o
f tr
ans-
fat
and
sat
ura
ted
fat
co
nte
nt
on
fo
od
p
rod
uct
lab
els,
wit
h a
vie
w t
o a
llow
man
ufa
ctu
rers
to
uti
lize
exis
tin
g s
tock
s o
f p
acka
gin
g m
ater
ial.
Pub
lic p
rocu
rem
ent
Au
g-1
7O
ilsee
ds,
pu
lses
An
no
un
ced
th
e la
un
ch o
f an
ele
ctro
nic
pla
tfo
rm f
or
cou
ntr
ywid
e p
rocu
rem
ent
of
oils
eed
s an
d p
uls
es, w
ith
a v
iew
to
hel
p g
row
ers
ob
tain
mo
re r
emu
ner
ativ
e p
rice
s, w
hile
als
o c
on
tain
ing
co
nsu
mer
pri
ces.
Imp
ort
po
licy
Au
g-1
7V
eget
able
oils
Rai
sed
imp
ort
du
ties
on
sel
ecte
d c
rud
e an
d r
efin
ed o
ils w
ith
a v
iew
to
pro
tect
loca
l far
mer
s an
d o
il p
roce
sso
rs f
rom
low
-pri
ced
im
po
rts
and
th
ereb
y en
cou
rag
e d
om
esti
c o
ilsee
d p
rod
uct
ion
an
d r
efin
ing
.
Pric
e su
pp
ort
Au
g-1
7O
ilsee
ds,
pu
lses
An
no
un
ced
th
e la
un
ch o
f a
nat
ion
wid
e sc
hem
e to
co
mp
ensa
te f
arm
ers
for
dis
tres
s sa
les
at p
rice
s b
elo
w t
he
offi
cial
min
imu
m
sup
po
rt p
rice
s. T
he
sch
eme
wo
uld
on
ly a
pp
ly t
o o
ilsee
ds
and
pu
lses
, wh
ere
ph
ysic
al p
rocu
rem
ent
by
pu
blic
en
titi
es t
end
s to
be
limit
ed.
Sect
or
dev
elo
pm
ent
mea
sure
sSe
p-1
7C
oco
nu
t p
alm
Gra
nte
d fi
nan
cial
su
pp
ort
to
30
pro
ject
s p
rom
oti
ng
dev
elo
pm
ent
of
the
coco
nu
t se
cto
r in
five
dif
fere
nt
stat
es, f
ocu
sin
g o
n
rese
arch
init
iati
ves
and
pro
ject
s o
n p
roce
ssin
g a
nd
pro
du
ct d
iver
sifi
cati
on
.
Sect
or
dev
elo
pm
ent
mea
sure
sSe
p-1
7C
oco
nu
t p
alm
An
no
un
ced
a 1
0-ye
ar p
lan
to
fo
ster
th
e d
evel
op
men
t o
f co
con
ut
pro
du
ctio
n in
th
e St
ate
of
Ker
ala,
an
d c
on
sid
ered
set
tin
g u
p a
co
mm
itte
e to
co
ord
inat
e co
con
ut-
rela
ted
act
ivit
ies
of
cen
tral
an
d s
tate
-lev
el a
gen
cies
.
GM
O p
olic
ySe
p-1
7G
M o
ilsee
ds
Post
po
ned
a d
ecis
ion
on
th
e co
mm
erci
al r
elea
se o
f G
M o
ilsee
ds,
no
tab
ly o
f a
loca
lly d
evel
op
ed m
ust
ard
see
d v
arie
ty, s
tati
ng
th
at
mo
re t
ime
was
req
uir
ed t
o e
xam
ine
new
ly r
elea
sed
exp
ert
stu
die
s o
n t
he
sub
ject
.
Pub
lic p
rocu
rem
ent
Oct
-17
Gro
un
dn
uts
, so
ybea
ns
Init
iate
d p
ub
lic p
rocu
rem
ent
of
i) g
rou
nd
nu
ts in
th
e St
ate
of
Gu
jara
t, a
nd
ii)
soyb
ean
s an
d g
rou
nd
nu
ts in
th
e St
ate
of
Raj
asth
an.
Ind
on
esia
Pub
lic p
rocu
rem
ent
May
-17
Soyb
ean
sR
elea
sed
pu
blic
fu
nd
s fo
r th
e p
rocu
rem
ent
– o
n e
ith
er t
he
do
mes
tic
or
imp
ort
mar
ket
– o
f ri
ce, s
oyb
ean
s an
d s
ug
ar, w
ith
th
e ai
m
of
stab
ilizi
ng
do
mes
tic
con
sum
er p
rice
s.
Envi
ron
men
tal p
olic
yM
ay-1
7 /
July
-17
Oil
pal
mA
pp
rove
d a
tw
o-y
ear
exte
nsi
on
(u
nti
l May
201
9) o
f a
mo
rato
riu
m o
n is
suin
g n
ew li
cen
ses
for
the
use
of
lan
d d
esig
nat
ed a
s p
rim
ary
fore
st a
nd
pea
tlan
d, t
her
eby
curb
ing
pla
nta
tio
n d
evel
op
men
t in
th
e o
il p
alm
wo
od
an
d p
aper
sec
tors
. Su
bse
qu
entl
y p
rop
ose
d t
o t
urn
th
e te
mp
ora
ry m
ora
tori
um
into
a p
erm
anen
t b
an.
Exp
ort
po
licy
Jun
e-17
to
O
ct-1
7Pa
lm o
ilLe
ft in
pla
ce t
he
cou
ntr
y's
slid
ing
exp
ort
tax
reg
ime
for
pal
m o
il, w
hic
h is
aim
ed a
t p
rote
ctin
g t
he
inte
rest
s o
f d
om
esti
c p
rod
uce
rs
and
co
nsu
mer
s.
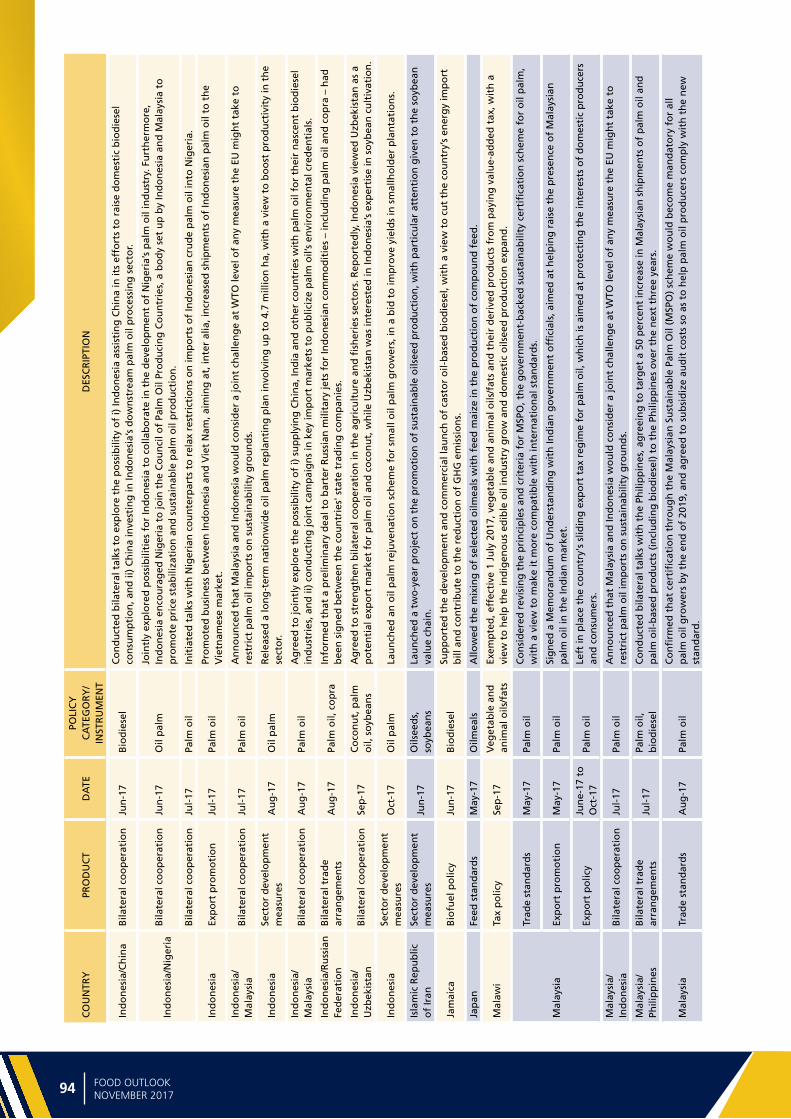
Ma
jor
po
licy
de
velo
pm
en
ts
94 95FOOD OUTLOOKNOVEMBER 2017
CO
UN
TRY
PRO
DU
CT
DA
TEPO
LIC
Y
CA
TEG
OR
Y/
INST
RU
MEN
TD
ESC
RIP
TIO
N
Ind
on
esia
/Ch
ina
Bila
tera
l co
op
erat
ion
Jun
-17
Bio
die
sel
Co
nd
uct
ed b
ilate
ral t
alks
to
exp
lore
th
e p
oss
ibili
ty o
f i)
Ind
on
esia
ass
isti
ng
Ch
ina
in it
s ef
fort
s to
rai
se d
om
esti
c b
iod
iese
l co
nsu
mp
tio
n, a
nd
ii)
Ch
ina
inve
stin
g in
Ind
on
esia
’s d
ow
nst
ream
pal
m o
il p
roce
ssin
g s
ecto
r.
Ind
on
esia
/Nig
eria
Bila
tera
l co
op
erat
ion
Jun
-17
Oil
pal
mJo
intl
y ex
plo
red
po
ssib
iliti
es f
or
Ind
on
esia
to
co
llab
ora
te in
th
e d
evel
op
men
t o
f N
iger
ia’s
pal
m o
il in
du
stry
. Fu
rth
erm
ore
, In
do
nes
ia e
nco
ura
ged
Nig
eria
to
join
th
e C
ou
nci
l of
Palm
Oil
Pro
du
cin
g C
ou
ntr
ies,
a b
od
y se
t u
p b
y In
do
nes
ia a
nd
Mal
aysi
a to
p
rom
ote
pri
ce s
tab
iliza
tio
n a
nd
su
stai
nab
le p
alm
oil
pro
du
ctio
n.
Bila
tera
l co
op
erat
ion
Jul-
17Pa
lm o
ilIn
itia
ted
tal
ks w
ith
Nig
eria
n c
ou
nte
rpar
ts t
o r
elax
res
tric
tio
ns
on
imp
ort
s o
f In
do
nes
ian
cru
de
pal
m o
il in
to N
iger
ia.
Ind
on
esia
Exp
ort
pro
mo
tio
nJu
l-17
Palm
oil
Pro
mo
ted
bu
sin
ess
bet
wee
n In
do
nes
ia a
nd
Vie
t N
am, a
imin
g a
t, in
ter
alia
, in
crea
sed
sh
ipm
ents
of
Ind
on
esia
n p
alm
oil
to t
he
Vie
tnam
ese
mar
ket.
Ind
on
esia
/M
alay
sia
Bila
tera
l co
op
erat
ion
Jul-
17Pa
lm o
ilA
nn
ou
nce
d t
hat
Mal
aysi
a an
d In
do
nes
ia w
ou
ld c
on
sid
er a
join
t ch
alle
ng
e at
WTO
leve
l of
any
mea
sure
th
e EU
mig
ht
take
to
re
stri
ct p
alm
oil
imp
ort
s o
n s
ust
ain
abili
ty g
rou
nd
s.
Ind
on
esia
Sect
or
dev
elo
pm
ent
mea
sure
sA
ug
-17
Oil
pal
mR
elea
sed
a lo
ng
-ter
m n
atio
nw
ide
oil
pal
m r
epla
nti
ng
pla
n in
volv
ing
up
to
4.7
mill
ion
ha,
wit
h a
vie
w t
o b
oo
st p
rod
uct
ivit
y in
th
e se
cto
r.
Ind
on
esia
/M
alay
sia
Bila
tera
l co
op
erat
ion
Au
g-1
7Pa
lm o
ilA
gre
ed t
o jo
intl
y ex
plo
re t
he
po
ssib
ility
of
i) s
up
ply
ing
Ch
ina,
Ind
ia a
nd
oth
er c
ou
ntr
ies
wit
h p
alm
oil
for
thei
r n
asce
nt
bio
die
sel
ind
ust
ries
, an
d ii
) co
nd
uct
ing
join
t ca
mp
aig
ns
in k
ey im
po
rt m
arke
ts t
o p
ub
liciz
e p
alm
oil’
s en
viro
nm
enta
l cre
den
tial
s.
Ind
on
esia
/Ru
ssia
n
Fed
erat
ion
Bila
tera
l tra
de
arra
ng
emen
tsA
ug
-17
Palm
oil,
co
pra
Info
rmed
th
at a
pre
limin
ary
dea
l to
bar
ter
Ru
ssia
n m
ilita
ry je
ts f
or
Ind
on
esia
n c
om
mo
dit
ies
– in
clu
din
g p
alm
oil
and
co
pra
– h
ad
bee
n s
ign
ed b
etw
een
th
e co
un
trie
s' s
tate
tra
din
g c
om
pan
ies.
Ind
on
esia
/U
zbek
ista
nB
ilate
ral c
oo
per
atio
nSe
p-1
7C
oco
nu
t, p
alm
o
il, s
oyb
ean
sA
gre
ed t
o s
tren
gth
en b
ilate
ral c
oo
per
atio
n in
th
e ag
ricu
ltu
re a
nd
fish
erie
s se
cto
rs. R
epo
rted
ly, I
nd
on
esia
vie
wed
Uzb
ekis
tan
as
a p
ote
nti
al e
xpo
rt m
arke
t fo
r p
alm
oil
and
co
con
ut,
wh
ile U
zbek
ista
n w
as in
tere
sted
in In
do
nes
ia’s
exp
erti
se in
so
ybea
n c
ult
ivat
ion
.
Ind
on
esia
Sect
or
dev
elo
pm
ent
mea
sure
sO
ct-1
7O
il p
alm
Lau
nch
ed a
n o
il p
alm
rej
uve
nat
ion
sch
eme
for
smal
l oil
pal
m g
row
ers,
in a
bid
to
imp
rove
yie
lds
in s
mal
lho
lder
pla
nta
tio
ns.
Isla
mic
Rep
ub
lic
of
Iran
Sect
or
dev
elo
pm
ent
mea
sure
sJu
n-1
7O
ilsee
ds,
so
ybea
ns
Lau
nch
ed a
tw
o-y
ear
pro
ject
on
th
e p
rom
oti
on
of
sust
ain
able
oils
eed
pro
du
ctio
n, w
ith
par
ticu
lar
atte
nti
on
giv
en t
o t
he
soyb
ean
va
lue
chai
n.
Jam
aica
Bio
fuel
po
licy
Jun
-17
Bio
die
sel
Sup
po
rted
th
e d
evel
op
men
t an
d c
om
mer
cial
lau
nch
of
cast
or
oil-
bas
ed b
iod
iese
l, w
ith
a v
iew
to
cu
t th
e co
un
try’
s en
erg
y im
po
rt
bill
an
d c
on
trib
ute
to
th
e re
du
ctio
n o
f G
HG
em
issi
on
s.
Jap
anFe
ed s
tan
dar
ds
May
-17
Oilm
eals
Allo
wed
th
e m
ixin
g o
f se
lect
ed o
ilmea
ls w
ith
fee
d m
aize
in t
he
pro
du
ctio
n o
f co
mp
ou
nd
fee
d.
Mal
awi
Tax
po
licy
Sep
-17
Veg
etab
le a
nd
an
imal
oils
/fat
sEx
emp
ted
, eff
ecti
ve 1
Ju
ly 2
017,
veg
etab
le a
nd
an
imal
oils
/fat
s an
d t
hei
r d
eriv
ed p
rod
uct
s fr
om
pay
ing
val
ue-
add
ed t
ax, w
ith
a
view
to
hel
p t
he
ind
igen
ou
s ed
ible
oil
ind
ust
ry g
row
an
d d
om
esti
c o
ilsee
d p
rod
uct
ion
exp
and
.
Mal
aysi
a
Trad
e st
and
ard
sM
ay-1
7Pa
lm o
ilC
on
sid
ered
rev
isin
g t
he
pri
nci
ple
s an
d c
rite
ria
for
MSP
O, t
he
go
vern
men
t-b
acke
d s
ust
ain
abili
ty c
erti
fica
tio
n s
chem
e fo
r o
il p
alm
, w
ith
a v
iew
to
mak
e it
mo
re c
om
pat
ible
wit
h in
tern
atio
nal
sta
nd
ard
s.
Exp
ort
pro
mo
tio
nM
ay-1
7Pa
lm o
ilSi
gn
ed a
Mem
ora
nd
um
of
Un
der
stan
din
g w
ith
Ind
ian
go
vern
men
t o
ffici
als,
aim
ed a
t h
elp
ing
rai
se t
he
pre
sen
ce o
f M
alay
sian
p
alm
oil
in t
he
Ind
ian
mar
ket.
Exp
ort
po
licy
Jun
e-17
to
O
ct-1
7Pa
lm o
ilLe
ft in
pla
ce t
he
cou
ntr
y's
slid
ing
exp
ort
tax
reg
ime
for
pal
m o
il, w
hic
h is
aim
ed a
t p
rote
ctin
g t
he
inte
rest
s o
f d
om
esti
c p
rod
uce
rs
and
co
nsu
mer
s.
Mal
aysi
a/In
do
nes
iaB
ilate
ral c
oo
per
atio
nJu
l-17
Palm
oil
An
no
un
ced
th
at M
alay
sia
and
Ind
on
esia
wo
uld
co
nsi
der
a jo
int
chal
len
ge
at W
TO le
vel o
f an
y m
easu
re t
he
EU m
igh
t ta
ke t
o
rest
rict
pal
m o
il im
po
rts
on
su
stai
nab
ility
gro
un
ds.
Mal
aysi
a/Ph
ilip
pin
esB
ilate
ral t
rad
e ar
ran
gem
ents
Jul-
17Pa
lm o
il,
bio
die
sel
Co
nd
uct
ed b
ilate
ral t
alks
wit
h t
he
Phili
pp
ines
, ag
reei
ng
to
tar
get
a 5
0 p
erce
nt
incr
ease
in M
alay
sian
sh
ipm
ents
of
pal
m o
il an
d
pal
m o
il-b
ased
pro
du
cts
(in
clu
din
g b
iod
iese
l) t
o t
he
Phili
pp
ines
ove
r th
e n
ext
thre
e ye
ars.
Mal
aysi
aTr
ade
stan
dar
ds
Au
g-1
7Pa
lm o
ilC
on
firm
ed t
hat
cer
tifi
cati
on
th
rou
gh
th
e M
alay
sian
Su
stai
nab
le P
alm
Oil
(MSP
O)
sch
eme
wo
uld
bec
om
e m
and
ato
ry f
or
all
pal
m o
il g
row
ers
by
the
end
of
2019
, an
d a
gre
ed t
o s
ub
sid
ize
aud
it c
ost
s so
as
to h
elp
pal
m o
il p
rod
uce
rs c
om
ply
wit
h t
he
new
st
and
ard
.
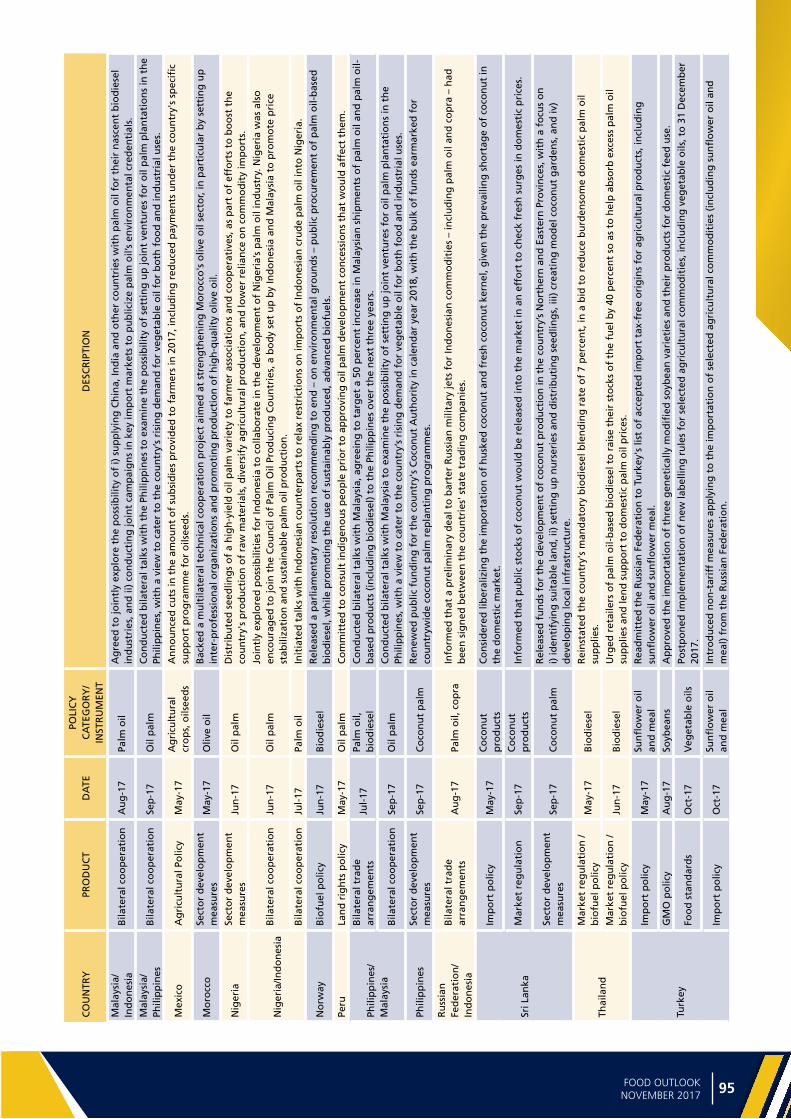
94 95FOOD OUTLOOKNOVEMBER 2017
OILC
RO
PS
CO
UN
TRY
PRO
DU
CT
DA
TEPO
LIC
Y
CA
TEG
OR
Y/
INST
RU
MEN
TD
ESC
RIP
TIO
N
Mal
aysi
a/In
do
nes
iaB
ilate
ral c
oo
per
atio
nA
ug
-17
Palm
oil
Ag
reed
to
join
tly
exp
lore
th
e p
oss
ibili
ty o
f i)
su
pp
lyin
g C
hin
a, In
dia
an
d o
ther
co
un
trie
s w
ith
pal
m o
il fo
r th
eir
nas
cen
t b
iod
iese
l in
du
stri
es, a
nd
ii)
con
du
ctin
g jo
int
cam
pai
gn
s in
key
imp
ort
mar
kets
to
pu
blic
ize
pal
m o
il’s
envi
ron
men
tal c
red
enti
als.
Mal
aysi
a/Ph
ilip
pin
esB
ilate
ral c
oo
per
atio
nSe
p-1
7O
il p
alm
Co
nd
uct
ed b
ilate
ral t
alks
wit
h t
he
Phili
pp
ines
to
exa
min
e th
e p
oss
ibili
ty o
f se
ttin
g u
p jo
int
ven
ture
s fo
r o
il p
alm
pla
nta
tio
ns
in t
he
Phili
pp
ines
, wit
h a
vie
w t
o c
ater
to
th
e co
un
try’
s ri
sin
g d
eman
d f
or
veg
etab
le o
il fo
r b
oth
fo
od
an
d in
du
stri
al u
ses.
Mex
ico
Ag
ricu
ltu
ral P
olic
yM
ay-1
7A
gri
cult
ura
l cr
op
s, o
ilsee
ds
An
no
un
ced
cu
ts in
th
e am
ou
nt
of
sub
sid
ies
pro
vid
ed t
o f
arm
ers
in 2
017,
incl
ud
ing
red
uce
d p
aym
ents
un
der
th
e co
un
try'
s sp
ecifi
c su
pp
ort
pro
gra
mm
e fo
r o
ilsee
ds.
Mo
rocc
oSe
cto
r d
evel
op
men
t m
easu
res
May
-17
Oliv
e o
ilB
acke
d a
mu
ltila
tera
l tec
hn
ical
co
op
erat
ion
pro
ject
aim
ed a
t st
ren
gth
enin
g M
oro
cco
's o
live
oil
sect
or,
in p
arti
cula
r b
y se
ttin
g u
p
inte
r-p
rofe
ssio
nal
org
aniz
atio
ns
and
pro
mo
tin
g p
rod
uct
ion
of
hig
h-q
ual
ity
oliv
e o
il.
Nig
eria
Sect
or
dev
elo
pm
ent
mea
sure
sJu
n-1
7O
il p
alm
Dis
trib
ute
d s
eed
ling
s o
f a
hig
h-y
ield
oil
pal
m v
arie
ty t
o f
arm
er a
sso
ciat
ion
s an
d c
oo
per
ativ
es, a
s p
art
of
effo
rts
to b
oo
st t
he
cou
ntr
y's
pro
du
ctio
n o
f ra
w m
ater
ials
, div
ersi
fy a
gri
cult
ura
l pro
du
ctio
n, a
nd
low
er r
elia
nce
on
co
mm
od
ity
imp
ort
s.
Nig
eria
/Ind
on
esia
Bila
tera
l co
op
erat
ion
Jun
-17
Oil
pal
mJo
intl
y ex
plo
red
po
ssib
iliti
es f
or
Ind
on
esia
to
co
llab
ora
te in
th
e d
evel
op
men
t o
f N
iger
ia’s
pal
m o
il in
du
stry
. Nig
eria
was
als
o
enco
ura
ged
to
join
th
e C
ou
nci
l of
Palm
Oil
Pro
du
cin
g C
ou
ntr
ies,
a b
od
y se
t u
p b
y In
do
nes
ia a
nd
Mal
aysi
a to
pro
mo
te p
rice
st
abili
zati
on
an
d s
ust
ain
able
pal
m o
il p
rod
uct
ion
.
Bila
tera
l co
op
erat
ion
Jul-
17Pa
lm o
ilIn
itia
ted
tal
ks w
ith
Ind
on
esia
n c
ou
nte
rpar
ts t
o r
elax
res
tric
tio
ns
on
imp
ort
s o
f In
do
nes
ian
cru
de
pal
m o
il in
to N
iger
ia.
No
rway
Bio
fuel
po
licy
Jun
-17
Bio
die
sel
Rel
ease
d a
par
liam
enta
ry r
eso
luti
on
rec
om
men
din
g t
o e
nd
– o
n e
nvi
ron
men
tal g
rou
nd
s –
pu
blic
pro
cure
men
t o
f p
alm
oil-
bas
ed
bio
die
sel,
wh
ile p
rom
oti
ng
th
e u
se o
f su
stai
nab
ly p
rod
uce
d, a
dva
nce
d b
iofu
els.
Peru
Lan
d r
igh
ts p
olic
yM
ay-1
7O
il p
alm
Co
mm
itte
d t
o c
on
sult
ind
igen
ou
s p
eop
le p
rio
r to
ap
pro
vin
g o
il p
alm
dev
elo
pm
ent
con
cess
ion
s th
at w
ou
ld a
ffec
t th
em.
Phili
pp
ines
/M
alay
sia
Bila
tera
l tra
de
arra
ng
emen
tsJu
l-17
Palm
oil,
b
iod
iese
lC
on
du
cted
bila
tera
l tal
ks w
ith
Mal
aysi
a, a
gre
ein
g t
o t
arg
et a
50
per
cen
t in
crea
se in
Mal
aysi
an s
hip
men
ts o
f p
alm
oil
and
pal
m o
il-b
ased
pro
du
cts
(in
clu
din
g b
iod
iese
l) t
o t
he
Phili
pp
ines
ove
r th
e n
ext
thre
e ye
ars.
Bila
tera
l co
op
erat
ion
Sep
-17
Oil
pal
mC
on
du
cted
bila
tera
l tal
ks w
ith
Mal
aysi
a to
exa
min
e th
e p
oss
ibili
ty o
f se
ttin
g u
p jo
int
ven
ture
s fo
r o
il p
alm
pla
nta
tio
ns
in t
he
Phili
pp
ines
, wit
h a
vie
w t
o c
ater
to
th
e co
un
try’
s ri
sin
g d
eman
d f
or
veg
etab
le o
il fo
r b
oth
fo
od
an
d in
du
stri
al u
ses.
Phili
pp
ines
Sect
or
dev
elo
pm
ent
mea
sure
sSe
p-1
7C
oco
nu
t p
alm
Ren
ewed
pu
blic
fu
nd
ing
fo
r th
e co
un
try'
s C
oco
nu
t A
uth
ori
ty in
cal
end
ar y
ear
2018
, wit
h t
he
bu
lk o
f fu
nd
s ea
rmar
ked
fo
r co
un
tryw
ide
coco
nu
t p
alm
rep
lan
tin
g p
rog
ram
mes
.
Ru
ssia
n
Fed
erat
ion
/In
do
nes
ia
Bila
tera
l tra
de
arra
ng
emen
tsA
ug
-17
Palm
oil,
co
pra
Info
rmed
th
at a
pre
limin
ary
dea
l to
bar
ter
Ru
ssia
n m
ilita
ry je
ts f
or
Ind
on
esia
n c
om
mo
dit
ies
– in
clu
din
g p
alm
oil
and
co
pra
– h
ad
bee
n s
ign
ed b
etw
een
th
e co
un
trie
s' s
tate
tra
din
g c
om
pan
ies.
Sri L
anka
Imp
ort
po
licy
May
-17
Co
con
ut
pro
du
cts
Co
nsi
der
ed li
ber
aliz
ing
th
e im
po
rtat
ion
of
hu
sked
co
con
ut
and
fre
sh c
oco
nu
t ke
rnel
, giv
en t
he
pre
vaili
ng
sh
ort
age
of
coco
nu
t in
th
e d
om
esti
c m
arke
t.
Mar
ket
reg
ula
tio
nSe
p-1
7C
oco
nu
t p
rod
uct
sIn
form
ed t
hat
pu
blic
sto
cks
of
coco
nu
t w
ou
ld b
e re
leas
ed in
to t
he
mar
ket
in a
n e
ffo
rt t
o c
hec
k fr
esh
su
rges
in d
om
esti
c p
rice
s.
Sect
or
dev
elo
pm
ent
mea
sure
sSe
p-1
7C
oco
nu
t p
alm
Rel
ease
d f
un
ds
for
the
dev
elo
pm
ent
of
coco
nu
t p
rod
uct
ion
in t
he
cou
ntr
y’s
No
rth
ern
an
d E
aste
rn P
rovi
nce
s, w
ith
a f
ocu
s o
n
i) id
enti
fyin
g s
uit
able
lan
d, i
i) s
etti
ng
up
nu
rser
ies
and
dis
trib
uti
ng
see
dlin
gs,
iii)
cre
atin
g m
od
el c
oco
nu
t g
ard
ens,
an
d iv
) d
evel
op
ing
loca
l in
fras
tru
ctu
re.
Thai
lan
d
Mar
ket
reg
ula
tio
n /
bio
fuel
po
licy
May
-17
Bio
die
sel
Rei
nst
ated
th
e co
un
try'
s m
and
ato
ry b
iod
iese
l ble
nd
ing
rat
e o
f 7
per
cen
t, in
a b
id t
o r
edu
ce b
urd
enso
me
do
mes
tic
pal
m o
il su
pp
lies.
Mar
ket
reg
ula
tio
n /
bio
fuel
po
licy
Jun
-17
Bio
die
sel
Urg
ed r
etai
lers
of
pal
m o
il-b
ased
bio
die
sel t
o r
aise
th
eir
sto
cks
of
the
fuel
by
40 p
erce
nt
so a
s to
hel
p a
bso
rb e
xces
s p
alm
oil
sup
plie
s an
d le
nd
su
pp
ort
to
do
mes
tic
pal
m o
il p
rice
s.
Turk
ey
Imp
ort
po
licy
May
-17
Sun
flo
wer
oil
and
mea
lR
ead
mit
ted
th
e R
uss
ian
Fed
erat
ion
to
Tu
rkey
's li
st o
f ac
cep
ted
imp
ort
tax
-fre
e o
rig
ins
for
agri
cult
ura
l pro
du
cts,
incl
ud
ing
su
nfl
ow
er o
il an
d s
un
flo
wer
mea
l.
GM
O p
olic
yA
ug
-17
Soyb
ean
sA
pp
rove
d t
he
imp
ort
atio
n o
f th
ree
gen
etic
ally
mo
difi
ed s
oyb
ean
var
ieti
es a
nd
th
eir
pro
du
cts
for
do
mes
tic
feed
use
.
Foo
d s
tan
dar
ds
Oct
-17
Veg
etab
le o
ilsPo
stp
on
ed im
ple
men
tati
on
of
new
lab
ellin
g r
ule
s fo
r se
lect
ed a
gri
cult
ura
l co
mm
od
itie
s, in
clu
din
g v
eget
able
oils
, to
31
Dec
emb
er
2017
.
Imp
ort
po
licy
Oct
-17
Sun
flo
wer
oil
and
mea
lIn
tro
du
ced
no
n-t
arif
f m
easu
res
app
lyin
g t
o t
he
imp
ort
atio
n o
f se
lect
ed a
gri
cult
ura
l co
mm
od
itie
s (i
ncl
ud
ing
su
nfl
ow
er o
il an
d
mea
l) f
rom
th
e R
uss
ian
Fed
erat
ion
.

Ma
jor
po
licy
de
velo
pm
en
ts
96 97FOOD OUTLOOKNOVEMBER 2017
CO
UN
TRY
PRO
DU
CT
DA
TEPO
LIC
Y
CA
TEG
OR
Y/
INST
RU
MEN
TD
ESC
RIP
TIO
N
Ukr
ain
ePr
ice
con
tro
lJu
n-1
7Su
nfl
ow
er o
il,
bu
tter
Dis
con
tin
ued
, fro
m 1
Ju
ly 2
017,
sta
te c
on
tro
ls o
f fo
od
pri
ces
(in
clu
din
g p
rice
s o
f su
nfl
ow
er o
il an
d b
utt
er)
that
wer
e m
ean
t to
ch
eck
rise
s in
loca
l ret
ail p
rice
s.
Ukr
ain
e/C
hin
aTr
ade
stan
dar
ds
Sep
-17
Sun
flo
wer
seed
ca
keA
gre
ed o
n s
anit
ary
and
bio
safe
ty p
roto
cols
reg
ula
tin
g im
po
rts
of
Ukr
ain
ian
su
nfl
ow
erse
ed c
ake
into
Ch
ina.
Un
ited
Ara
b
Emir
ates
Bio
fuel
po
licy
Sep
-17
Bio
die
sel
Lau
nch
ed a
bio
die
sel b
len
d d
esti
ned
fo
r th
e co
un
try’
s co
mm
erci
al a
nd
ind
ust
rial
seg
men
t, in
a b
id t
o h
elp
red
uce
th
e co
un
try’
s G
HG
em
issi
on
s. T
he
fuel
co
nta
ins
5 p
erce
nt
bio
die
sel p
rod
uce
d f
rom
veg
etab
le o
il, u
sed
co
oki
ng
oil
or
anim
al f
at.
Un
ited
Kin
gd
om
Bio
fuel
po
licy
Sep
-17
Bio
die
sel
Pub
lish
ed a
lon
g-t
erm
str
ateg
y fo
r ra
isin
g t
he
sup
ply
an
d s
ust
ain
abili
ty o
f re
new
able
tra
nsp
ort
fu
els
in t
he
cou
ntr
y, w
ith
a v
iew
to
low
er t
he
GH
G in
ten
sity
of
tran
spo
rt f
uel
s, w
hile
pro
vid
ing
a s
tab
le p
olic
y en
viro
nm
ent
for
inve
stm
ents
into
ren
ewab
le lo
w-
carb
on
fu
els.
Un
ited
Sta
tes
Bio
fuel
po
licy
Jun
-17
Bio
die
sel
An
no
un
ced
man
dat
ory
5 p
erce
nt
bio
die
sel b
len
ds
in h
om
e h
eati
ng
oil
in N
ew Y
ork
Cit
y an
d d
ow
nst
ate
New
Yo
rk c
ou
nti
es.
Bio
fuel
po
licy
Jul-
17B
iofu
els
Pub
lish
ed p
rop
osa
ls f
or
man
dat
ory
co
nsu
mp
tio
n o
f to
tal,
con
ven
tio
nal
an
d a
dva
nce
d r
enew
able
fu
els
in 2
018,
as
wel
l as
bio
mas
s-b
ased
die
sel i
n 2
019.
Bio
fuel
po
licy
Jul-
17B
iod
iese
lR
elea
sed
a U
S co
urt
ru
le e
stab
lish
ing
th
at t
he
met
ho
do
log
y u
sed
by
the
cou
ntr
y's
Envi
ron
men
tal P
rote
ctio
n A
gen
cy t
o ju
stif
y p
ast
red
uct
ion
s in
bio
fuel
co
nsu
mp
tio
n m
and
ates
was
inco
rrec
t.Im
po
rt p
olic
y (c
ou
nte
rvai
ling
d
uti
es)
Au
g-1
7B
iod
iese
lIn
tro
du
ced
pre
limin
ary
cou
nte
rvai
ling
du
ties
on
imp
ort
s o
f b
iod
iese
l fro
m A
rgen
tin
a an
d In
do
nes
ia, c
laim
ing
th
at A
rgen
tin
a an
d In
do
nes
ia r
ecei
ved
su
bsi
die
s o
f, r
esp
ecti
vely
, 50–
64 p
erce
nt
and
41–
68 p
erce
nt.
Fin
al d
uty
det
erm
inat
ion
s w
ou
ld b
e d
ue
on
7
No
vem
ber
201
7.
Bio
fuel
po
licy
Au
g-1
7B
iod
iese
lA
nn
ou
nce
d t
hat
, in
th
e st
ate
of
Min
nes
ota
, th
e m
and
ato
ry b
iod
iese
l ble
nd
ing
rat
e w
ou
ld b
e ra
ised
fro
m 1
0 to
20
per
cen
t in
May
20
18.
Hea
lth
po
licy
Au
g-1
7So
ybea
n o
ilA
llow
ed f
oo
d m
anu
fact
ure
rs a
nd
res
tau
ran
ts t
o m
ake
qu
alifi
ed h
ealt
h c
laim
s lin
kin
g s
oyb
ean
oil
con
sum
pti
on
to
a r
edu
ced
ris
k o
f co
ron
ary
hea
rt d
isea
se.
Pest
icid
e re
gu
lati
on
Sep
-17
Her
bic
ide
'Dic
amb
a'C
on
sid
ered
res
tric
tin
g t
he
use
of
dic
amb
a-b
ased
her
bic
ides
, wh
ich
are
ext
ensi
vely
use
d in
so
ybea
n c
ult
ivat
ion
. Th
is c
on
sid
erat
ion
ca
me
afte
r re
po
rts
of
po
ssib
le d
amag
e to
cro
ps
no
t re
sist
ant
to t
he
chem
ical
.
Bio
fuel
po
licy
Sep
-17
/ O
ct-1
7B
iod
iese
lC
on
sid
ered
low
erin
g t
he
man
dat
ory
ren
ewab
le f
uel
co
nsu
mp
tio
n t
arg
ets
for
2018
–201
9 p
rop
ose
d in
Ju
ly 2
017,
on
co
nce
rns
that
th
e o
rig
inal
ly p
rop
ose
d t
arg
ets
cou
ld le
ad t
o in
adeq
uat
e d
om
esti
c su
pp
lies
of
bio
fuel
to
co
nsu
mer
s. In
Oct
ob
er 2
017,
aft
er
mee
tin
g r
esis
tan
ce f
rom
law
mak
ers,
th
e in
itia
tive
was
ab
and
on
ed.
Imp
ort
po
licy
(co
un
terv
ailin
g
du
ties
)O
ct-1
7B
iod
iese
lIn
tro
du
ced
(in
ad
dit
ion
to
th
e p
relim
inar
y co
un
terv
ailin
g d
uti
es im
po
sed
in A
ug
ust
201
7) a
nti
-du
mp
ing
du
ties
on
imp
ort
s o
f b
iod
iese
l fro
m A
rgen
tin
a an
d In
do
nes
ia, c
laim
ing
th
at A
rgen
tin
a an
d In
do
nes
ia s
old
th
is m
erch
and
ise
in t
he
Un
ited
Sta
tes
at
du
mp
ing
mar
gin
s o
f 70
an
d 5
1 p
erce
nt
resp
ecti
vely
. Fin
al d
uty
det
erm
inat
ion
s w
ou
ld b
e d
ue
on
3 J
anu
ary
2018
. U
zbek
ista
n/
Ind
on
esia
Bila
tera
l co
op
erat
ion
Sep
-17
Co
con
ut,
pal
m
oil,
so
ybea
ns
Ag
reed
to
str
eng
then
bila
tera
l co
op
erat
ion
in t
he
agri
cult
ure
an
d fi
sher
ies
sect
ors
. Rep
ort
edly
, In
do
nes
ia v
iew
ed U
zbek
ista
n a
s a
po
ten
tial
exp
ort
mar
ket
for
pal
m o
il an
d c
oco
nu
t, w
hile
Uzb
ekis
tan
was
inte
rest
ed in
Ind
on
esia
’s e
xper
tise
in s
oyb
ean
cu
ltiv
atio
n.
Uzb
ekis
tan
Mar
ket
reg
ula
tio
nO
ct-1
7V
eget
able
oils
, co
tto
nse
ed m
eal
Inst
ruct
ed s
tate
ag
enci
es t
o s
tep
up
eff
ort
s to
co
mb
at u
nre
aso
nab
le a
nd
art
ifici
al o
vers
tati
ng
of
pri
ces
for
a n
um
ber
of
bas
ic f
oo
d
and
fee
d s
tuff
s, in
clu
din
g v
eget
able
oil
and
co
tto
nse
ed m
eal.
Van
uat
uSe
cto
r d
evel
op
men
t m
easu
res
Au
g-1
7C
oco
nu
t p
alm
Co
mm
itte
d t
o s
up
po
rt t
he
pla
nti
ng
of
1 m
illio
n c
oco
nu
t tr
ees
by
2026
, in
an
eff
ort
to
rev
ive
the
cou
ntr
y's
coco
nu
t in
du
stry
.
Zam
bia
Sect
or
dev
elo
pm
ent
mea
sure
sSe
p-1
7Pa
lm o
ilA
lloca
ted
pu
blic
fu
nd
s to
a lo
cal p
alm
oil
ven
ture
in a
bid
to
hel
p r
edu
ce t
he
cou
ntr
y’s
dep
end
ence
on
imp
ort
s o
f cr
ud
e p
alm
oil
and
co
oki
ng
oils
.
Zim
bab
we
Sect
or
dev
elo
pm
ent
mea
sure
sJu
l-17
Oils
eed
s,
soyb
ean
sC
on
sid
ered
lau
nch
ing
, jo
intl
y w
ith
th
e p
riva
te s
ecto
r, a
loan
fac
ility
to
su
pp
ort
loca
l oils
eed
far
mer
s, w
ith
a v
iew
to
sti
mu
late
d
om
esti
c p
rod
uct
ion
, esp
ecia
lly o
f so
y.
Mar
ket
reg
ula
tio
nA
ug
-17
Soyb
ean
sFi
xed
th
e p
rice
fo
r so
ybea
ns
del
iver
ed t
o t
he
stat
e-o
wn
ed G
rain
Mar
keti
ng
Bo
ard
ab
ove
th
e p
reva
ilin
g m
arke
t p
rice
, in
a b
id t
o
stim
ula
te d
om
esti
c so
ybea
n p
rod
uct
ion
an
d r
edu
ce t
he
cou
ntr
y’s
dep
end
ence
on
imp
ort
ed e
dib
le o
il.Im
po
rt p
olic
ySe
p-1
7So
ybea
ns
Lift
ed a
tem
po
rary
ban
on
so
ybea
n im
po
rts,
in a
n e
ffo
rt t
o e
nsu
re a
deq
uat
e su
pp
lies
of
coo
kin
g o
il in
th
e co
un
try.
Glo
bal
WTO
/FA
O C
od
ex
Alim
enta
riu
s C
om
mis
sio
nJu
l-17
Fish
oil
Issu
ed a
det
aile
d s
tan
dar
d f
or
fish
oil
inte
nd
ed f
or
hu
man
co
nsu
mp
tio
n, i
ncl
ud
ing
pro
visi
on
s fo
r d
iffe
ren
tiat
ing
cer
tain
wild
ori
gin
fi
sh o
ils f
rom
th
eir
farm
ed c
ou
nte
rpar
ts.
* A d
etai
led
desc
riptio
n of
maj
or p
olic
y de
velo
pmen
ts f
rom
Jan
uary
201
1 on
war
ds is
ava
ilabl
e at
htt
p://w
ww
.fao
.org
/eco
nom
ic/e
st/e
st-c
omm
oditi
es/c
omm
odity
-pol
icy-
arch
ive/
en/?
grou
pAN
Dco
mm
odity
=O
ilsee
ds,%
20oi
ls%
20an
d%20
mea
ls.
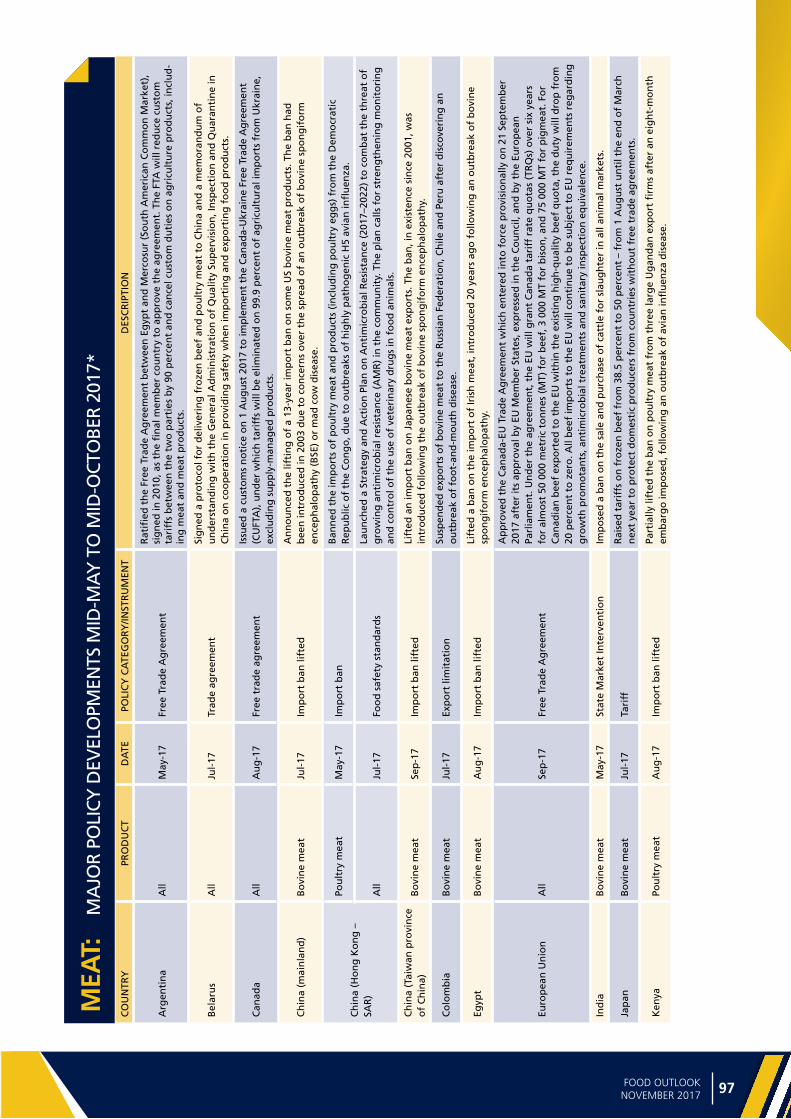
96 97FOOD OUTLOOKNOVEMBER 2017
ME
AT
CO
UN
TRY
PRO
DU
CT
DA
TEPO
LIC
Y
CA
TEG
OR
Y/
INST
RU
MEN
TD
ESC
RIP
TIO
N
Ukr
ain
ePr
ice
con
tro
lJu
n-1
7Su
nfl
ow
er o
il,
bu
tter
Dis
con
tin
ued
, fro
m 1
Ju
ly 2
017,
sta
te c
on
tro
ls o
f fo
od
pri
ces
(in
clu
din
g p
rice
s o
f su
nfl
ow
er o
il an
d b
utt
er)
that
wer
e m
ean
t to
ch
eck
rise
s in
loca
l ret
ail p
rice
s.
Ukr
ain
e/C
hin
aTr
ade
stan
dar
ds
Sep
-17
Sun
flo
wer
seed
ca
keA
gre
ed o
n s
anit
ary
and
bio
safe
ty p
roto
cols
reg
ula
tin
g im
po
rts
of
Ukr
ain
ian
su
nfl
ow
erse
ed c
ake
into
Ch
ina.
Un
ited
Ara
b
Emir
ates
Bio
fuel
po
licy
Sep
-17
Bio
die
sel
Lau
nch
ed a
bio
die
sel b
len
d d
esti
ned
fo
r th
e co
un
try’
s co
mm
erci
al a
nd
ind
ust
rial
seg
men
t, in
a b
id t
o h
elp
red
uce
th
e co
un
try’
s G
HG
em
issi
on
s. T
he
fuel
co
nta
ins
5 p
erce
nt
bio
die
sel p
rod
uce
d f
rom
veg
etab
le o
il, u
sed
co
oki
ng
oil
or
anim
al f
at.
Un
ited
Kin
gd
om
Bio
fuel
po
licy
Sep
-17
Bio
die
sel
Pub
lish
ed a
lon
g-t
erm
str
ateg
y fo
r ra
isin
g t
he
sup
ply
an
d s
ust
ain
abili
ty o
f re
new
able
tra
nsp
ort
fu
els
in t
he
cou
ntr
y, w
ith
a v
iew
to
low
er t
he
GH
G in
ten
sity
of
tran
spo
rt f
uel
s, w
hile
pro
vid
ing
a s
tab
le p
olic
y en
viro
nm
ent
for
inve
stm
ents
into
ren
ewab
le lo
w-
carb
on
fu
els.
Un
ited
Sta
tes
Bio
fuel
po
licy
Jun
-17
Bio
die
sel
An
no
un
ced
man
dat
ory
5 p
erce
nt
bio
die
sel b
len
ds
in h
om
e h
eati
ng
oil
in N
ew Y
ork
Cit
y an
d d
ow
nst
ate
New
Yo
rk c
ou
nti
es.
Bio
fuel
po
licy
Jul-
17B
iofu
els
Pub
lish
ed p
rop
osa
ls f
or
man
dat
ory
co
nsu
mp
tio
n o
f to
tal,
con
ven
tio
nal
an
d a
dva
nce
d r
enew
able
fu
els
in 2
018,
as
wel
l as
bio
mas
s-b
ased
die
sel i
n 2
019.
Bio
fuel
po
licy
Jul-
17B
iod
iese
lR
elea
sed
a U
S co
urt
ru
le e
stab
lish
ing
th
at t
he
met
ho
do
log
y u
sed
by
the
cou
ntr
y's
Envi
ron
men
tal P
rote
ctio
n A
gen
cy t
o ju
stif
y p
ast
red
uct
ion
s in
bio
fuel
co
nsu
mp
tio
n m
and
ates
was
inco
rrec
t.Im
po
rt p
olic
y (c
ou
nte
rvai
ling
d
uti
es)
Au
g-1
7B
iod
iese
lIn
tro
du
ced
pre
limin
ary
cou
nte
rvai
ling
du
ties
on
imp
ort
s o
f b
iod
iese
l fro
m A
rgen
tin
a an
d In
do
nes
ia, c
laim
ing
th
at A
rgen
tin
a an
d In
do
nes
ia r
ecei
ved
su
bsi
die
s o
f, r
esp
ecti
vely
, 50–
64 p
erce
nt
and
41–
68 p
erce
nt.
Fin
al d
uty
det
erm
inat
ion
s w
ou
ld b
e d
ue
on
7
No
vem
ber
201
7.
Bio
fuel
po
licy
Au
g-1
7B
iod
iese
lA
nn
ou
nce
d t
hat
, in
th
e st
ate
of
Min
nes
ota
, th
e m
and
ato
ry b
iod
iese
l ble
nd
ing
rat
e w
ou
ld b
e ra
ised
fro
m 1
0 to
20
per
cen
t in
May
20
18.
Hea
lth
po
licy
Au
g-1
7So
ybea
n o
ilA
llow
ed f
oo
d m
anu
fact
ure
rs a
nd
res
tau
ran
ts t
o m
ake
qu
alifi
ed h
ealt
h c
laim
s lin
kin
g s
oyb
ean
oil
con
sum
pti
on
to
a r
edu
ced
ris
k o
f co
ron
ary
hea
rt d
isea
se.
Pest
icid
e re
gu
lati
on
Sep
-17
Her
bic
ide
'Dic
amb
a'C
on
sid
ered
res
tric
tin
g t
he
use
of
dic
amb
a-b
ased
her
bic
ides
, wh
ich
are
ext
ensi
vely
use
d in
so
ybea
n c
ult
ivat
ion
. Th
is c
on
sid
erat
ion
ca
me
afte
r re
po
rts
of
po
ssib
le d
amag
e to
cro
ps
no
t re
sist
ant
to t
he
chem
ical
.
Bio
fuel
po
licy
Sep
-17
/ O
ct-1
7B
iod
iese
lC
on
sid
ered
low
erin
g t
he
man
dat
ory
ren
ewab
le f
uel
co
nsu
mp
tio
n t
arg
ets
for
2018
–201
9 p
rop
ose
d in
Ju
ly 2
017,
on
co
nce
rns
that
th
e o
rig
inal
ly p
rop
ose
d t
arg
ets
cou
ld le
ad t
o in
adeq
uat
e d
om
esti
c su
pp
lies
of
bio
fuel
to
co
nsu
mer
s. In
Oct
ob
er 2
017,
aft
er
mee
tin
g r
esis
tan
ce f
rom
law
mak
ers,
th
e in
itia
tive
was
ab
and
on
ed.
Imp
ort
po
licy
(co
un
terv
ailin
g
du
ties
)O
ct-1
7B
iod
iese
lIn
tro
du
ced
(in
ad
dit
ion
to
th
e p
relim
inar
y co
un
terv
ailin
g d
uti
es im
po
sed
in A
ug
ust
201
7) a
nti
-du
mp
ing
du
ties
on
imp
ort
s o
f b
iod
iese
l fro
m A
rgen
tin
a an
d In
do
nes
ia, c
laim
ing
th
at A
rgen
tin
a an
d In
do
nes
ia s
old
th
is m
erch
and
ise
in t
he
Un
ited
Sta
tes
at
du
mp
ing
mar
gin
s o
f 70
an
d 5
1 p
erce
nt
resp
ecti
vely
. Fin
al d
uty
det
erm
inat
ion
s w
ou
ld b
e d
ue
on
3 J
anu
ary
2018
. U
zbek
ista
n/
Ind
on
esia
Bila
tera
l co
op
erat
ion
Sep
-17
Co
con
ut,
pal
m
oil,
so
ybea
ns
Ag
reed
to
str
eng
then
bila
tera
l co
op
erat
ion
in t
he
agri
cult
ure
an
d fi
sher
ies
sect
ors
. Rep
ort
edly
, In
do
nes
ia v
iew
ed U
zbek
ista
n a
s a
po
ten
tial
exp
ort
mar
ket
for
pal
m o
il an
d c
oco
nu
t, w
hile
Uzb
ekis
tan
was
inte
rest
ed in
Ind
on
esia
’s e
xper
tise
in s
oyb
ean
cu
ltiv
atio
n.
Uzb
ekis
tan
Mar
ket
reg
ula
tio
nO
ct-1
7V
eget
able
oils
, co
tto
nse
ed m
eal
Inst
ruct
ed s
tate
ag
enci
es t
o s
tep
up
eff
ort
s to
co
mb
at u
nre
aso
nab
le a
nd
art
ifici
al o
vers
tati
ng
of
pri
ces
for
a n
um
ber
of
bas
ic f
oo
d
and
fee
d s
tuff
s, in
clu
din
g v
eget
able
oil
and
co
tto
nse
ed m
eal.
Van
uat
uSe
cto
r d
evel
op
men
t m
easu
res
Au
g-1
7C
oco
nu
t p
alm
Co
mm
itte
d t
o s
up
po
rt t
he
pla
nti
ng
of
1 m
illio
n c
oco
nu
t tr
ees
by
2026
, in
an
eff
ort
to
rev
ive
the
cou
ntr
y's
coco
nu
t in
du
stry
.
Zam
bia
Sect
or
dev
elo
pm
ent
mea
sure
sSe
p-1
7Pa
lm o
ilA
lloca
ted
pu
blic
fu
nd
s to
a lo
cal p
alm
oil
ven
ture
in a
bid
to
hel
p r
edu
ce t
he
cou
ntr
y’s
dep
end
ence
on
imp
ort
s o
f cr
ud
e p
alm
oil
and
co
oki
ng
oils
.
Zim
bab
we
Sect
or
dev
elo
pm
ent
mea
sure
sJu
l-17
Oils
eed
s,
soyb
ean
sC
on
sid
ered
lau
nch
ing
, jo
intl
y w
ith
th
e p
riva
te s
ecto
r, a
loan
fac
ility
to
su
pp
ort
loca
l oils
eed
far
mer
s, w
ith
a v
iew
to
sti
mu
late
d
om
esti
c p
rod
uct
ion
, esp
ecia
lly o
f so
y.
Mar
ket
reg
ula
tio
nA
ug
-17
Soyb
ean
sFi
xed
th
e p
rice
fo
r so
ybea
ns
del
iver
ed t
o t
he
stat
e-o
wn
ed G
rain
Mar
keti
ng
Bo
ard
ab
ove
th
e p
reva
ilin
g m
arke
t p
rice
, in
a b
id t
o
stim
ula
te d
om
esti
c so
ybea
n p
rod
uct
ion
an
d r
edu
ce t
he
cou
ntr
y’s
dep
end
ence
on
imp
ort
ed e
dib
le o
il.Im
po
rt p
olic
ySe
p-1
7So
ybea
ns
Lift
ed a
tem
po
rary
ban
on
so
ybea
n im
po
rts,
in a
n e
ffo
rt t
o e
nsu
re a
deq
uat
e su
pp
lies
of
coo
kin
g o
il in
th
e co
un
try.
Glo
bal
WTO
/FA
O C
od
ex
Alim
enta
riu
s C
om
mis
sio
nJu
l-17
Fish
oil
Issu
ed a
det
aile
d s
tan
dar
d f
or
fish
oil
inte
nd
ed f
or
hu
man
co
nsu
mp
tio
n, i
ncl
ud
ing
pro
visi
on
s fo
r d
iffe
ren
tiat
ing
cer
tain
wild
ori
gin
fi
sh o
ils f
rom
th
eir
farm
ed c
ou
nte
rpar
ts.
MEA
T:
MA
JOR
POLI
CY D
EVEL
OPM
ENTS
MID
-MA
Y T
O M
ID-O
CTO
BER
2017
*
CO
UN
TRY
PRO
DU
CT
DA
TEPO
LIC
Y C
ATE
GO
RY
/INST
RU
MEN
TD
ESC
RIP
TIO
N
Arg
enti
na
All
May
-17
Free
Tra
de
Ag
reem
ent
Rat
ified
th
e Fr
ee T
rad
e A
gre
emen
t b
etw
een
Eg
ypt
and
Mer
cosu
r (S
ou
th A
mer
ican
Co
mm
on
Mar
ket)
, si
gn
ed in
201
0, a
s th
e fi
nal
mem
ber
co
un
try
to a
pp
rove
th
e ag
reem
ent.
Th
e FT
A w
ill r
edu
ce c
ust
om
ta
riff
s b
etw
een
th
e tw
o p
arti
es b
y 90
per
cen
t an
d c
ance
l cu
sto
m d
uti
es o
n a
gri
cult
ure
pro
du
cts,
incl
ud
-in
g m
eat
and
mea
t p
rod
uct
s.
Bel
aru
sA
llJu
l-17
Trad
e ag
reem
ent
Sig
ned
a p
roto
col f
or
del
iver
ing
fro
zen
bee
f an
d p
ou
ltry
mea
t to
Ch
ina
and
a m
emo
ran
du
m o
f u
nd
erst
and
ing
wit
h t
he
Gen
eral
Ad
min
istr
atio
n o
f Q
ual
ity
Sup
ervi
sio
n, I
nsp
ecti
on
an
d Q
uar
anti
ne
in
Ch
ina
on
co
op
erat
ion
in p
rovi
din
g s
afet
y w
hen
imp
ort
ing
an
d e
xpo
rtin
g f
oo
d p
rod
uct
s.
Can
ada
All
Au
g-1
7Fr
ee t
rad
e ag
reem
ent
Issu
ed a
cu
sto
ms
no
tice
on
1 A
ug
ust
201
7 to
imp
lem
ent
the
Can
ada-
Ukr
ain
e Fr
ee T
rad
e A
gre
emen
t (C
UFT
A),
un
der
wh
ich
tar
iffs
will
be
elim
inat
ed o
n 9
9.9
per
cen
t o
f ag
ricu
ltu
ral i
mp
ort
s fr
om
Ukr
ain
e,
excl
ud
ing
su
pp
ly-m
anag
ed p
rod
uct
s.
Ch
ina
(mai
nla
nd
)B
ovi
ne
mea
tJu
l-17
Imp
ort
ban
lift
edA
nn
ou
nce
d t
he
lifti
ng
of
a 13
-yea
r im
po
rt b
an o
n s
om
e U
S b
ovi
ne
mea
t p
rod
uct
s. T
he
ban
had
b
een
intr
od
uce
d in
200
3 d
ue
to c
on
cern
s o
ver
the
spre
ad o
f an
ou
tbre
ak o
f b
ovi
ne
spo
ng
ifo
rm
ence
ph
alo
pat
hy
(BSE
) o
r m
ad c
ow
dis
ease
.
Ch
ina
(Ho
ng
Ko
ng
–
SAR
)
Pou
ltry
mea
tM
ay-1
7Im
po
rt b
anB
ann
ed t
he
imp
ort
s o
f p
ou
ltry
mea
t an
d p
rod
uct
s (i
ncl
ud
ing
po
ult
ry e
gg
s) f
rom
th
e D
emo
crat
ic
Rep
ub
lic o
f th
e C
on
go
, du
e to
ou
tbre
aks
of
hig
hly
pat
ho
gen
ic H
5 av
ian
infl
uen
za.
All
Jul-
17Fo
od
saf
ety
stan
dar
ds
Lau
nch
ed a
Str
ateg
y an
d A
ctio
n P
lan
on
An
tim
icro
bia
l Res
ista
nce
(20
17–2
022)
to
co
mb
at t
he
thre
at o
f g
row
ing
an
tim
icro
bia
l res
ista
nce
(A
MR
) in
th
e co
mm
un
ity.
Th
e p
lan
cal
ls f
or
stre
ng
then
ing
mo
nit
ori
ng
an
d c
on
tro
l of
the
use
of
vete
rin
ary
dru
gs
in f
oo
d a
nim
als.
Ch
ina
(Tai
wan
pro
vin
ce
of
Ch
ina)
Bo
vin
e m
eat
Sep
-17
Imp
ort
ban
lift
edLi
fted
an
imp
ort
ban
on
Jap
anes
e b
ovi
ne
mea
t ex
po
rts.
Th
e b
an, i
n e
xist
ence
sin
ce 2
001,
was
in
tro
du
ced
fo
llow
ing
th
e o
utb
reak
of
bo
vin
e sp
on
gif
orm
en
cep
hal
op
ath
y.
Co
lom
bia
Bo
vin
e m
eat
Jul-
17Ex
po
rt li
mit
atio
nSu
spen
ded
exp
ort
s o
f b
ovi
ne
mea
t to
th
e R
uss
ian
Fed
erat
ion
, Ch
ile a
nd
Per
u a
fter
dis
cove
rin
g a
n
ou
tbre
ak o
f fo
ot-
and
-mo
uth
dis
ease
.
Egyp
tB
ovi
ne
mea
tA
ug
-17
Imp
ort
ban
lift
edLi
fted
a b
an o
n t
he
imp
ort
of
Iris
h m
eat,
intr
od
uce
d 2
0 ye
ars
ago
fo
llow
ing
an
ou
tbre
ak o
f b
ovi
ne
spo
ng
ifo
rm e
nce
ph
alo
pat
hy.
Euro
pea
n U
nio
nA
llSe
p-1
7Fr
ee T
rad
e A
gre
emen
t
Ap
pro
ved
th
e C
anad
a-EU
Tra
de
Ag
reem
ent
wh
ich
en
tere
d in
to f
orc
e p
rovi
sio
nal
ly o
n 2
1 Se
pte
mb
er
2017
aft
er it
s ap
pro
val b
y EU
Mem
ber
Sta
tes,
exp
ress
ed in
th
e C
ou
nci
l, an
d b
y th
e Eu
rop
ean
Pa
rlia
men
t. U
nd
er t
he
agre
emen
t, t
he
EU w
ill g
ran
t C
anad
a ta
riff
rat
e q
uo
tas
(TR
Qs)
ove
r si
x ye
ars
for
alm
ost
50
000
met
ric
ton
nes
(M
T) f
or
bee
f, 3
000
MT
for
bis
on
, an
d 7
5 00
0 M
T fo
r p
igm
eat.
Fo
r C
anad
ian
bee
f ex
po
rted
to
th
e EU
wit
hin
th
e ex
isti
ng
hig
h-q
ual
ity
bee
f q
uo
ta, t
he
du
ty w
ill d
rop
fro
m
20 p
erce
nt
to z
ero
. All
bee
f im
po
rts
to t
he
EU w
ill c
on
tin
ue
to b
e su
bje
ct t
o E
U r
equ
irem
ents
reg
ard
ing
g
row
th p
rom
ota
nts
, an
tim
icro
bia
l tre
atm
ents
an
d s
anit
ary
insp
ecti
on
eq
uiv
alen
ce.
Ind
iaB
ovi
ne
mea
tM
ay-1
7St
ate
Mar
ket
Inte
rven
tio
nIm
po
sed
a b
an o
n t
he
sale
an
d p
urc
has
e o
f ca
ttle
fo
r sl
aug
hte
r in
all
anim
al m
arke
ts.
Jap
anB
ovi
ne
mea
tJu
l-17
Tari
ffR
aise
d t
arif
fs o
n f
roze
n b
eef
fro
m 3
8.5
per
cen
t to
50
per
cen
t –
fro
m 1
Au
gu
st u
nti
l th
e en
d o
f M
arch
n
ext
year
to
pro
tect
do
mes
tic
pro
du
cers
fro
m c
ou
ntr
ies
wit
ho
ut
free
tra
de
agre
emen
ts.
Ken
yaPo
ult
ry m
eat
Au
g-1
7Im
po
rt b
an li
fted
Part
ially
lift
ed t
he
ban
on
po
ult
ry m
eat
fro
m t
hre
e la
rge
Ug
and
an e
xpo
rt fi
rms
afte
r an
eig
ht-
mo
nth
em
bar
go
imp
ose
d, f
ollo
win
g a
n o
utb
reak
of
avia
n in
flu
enza
dis
ease
.
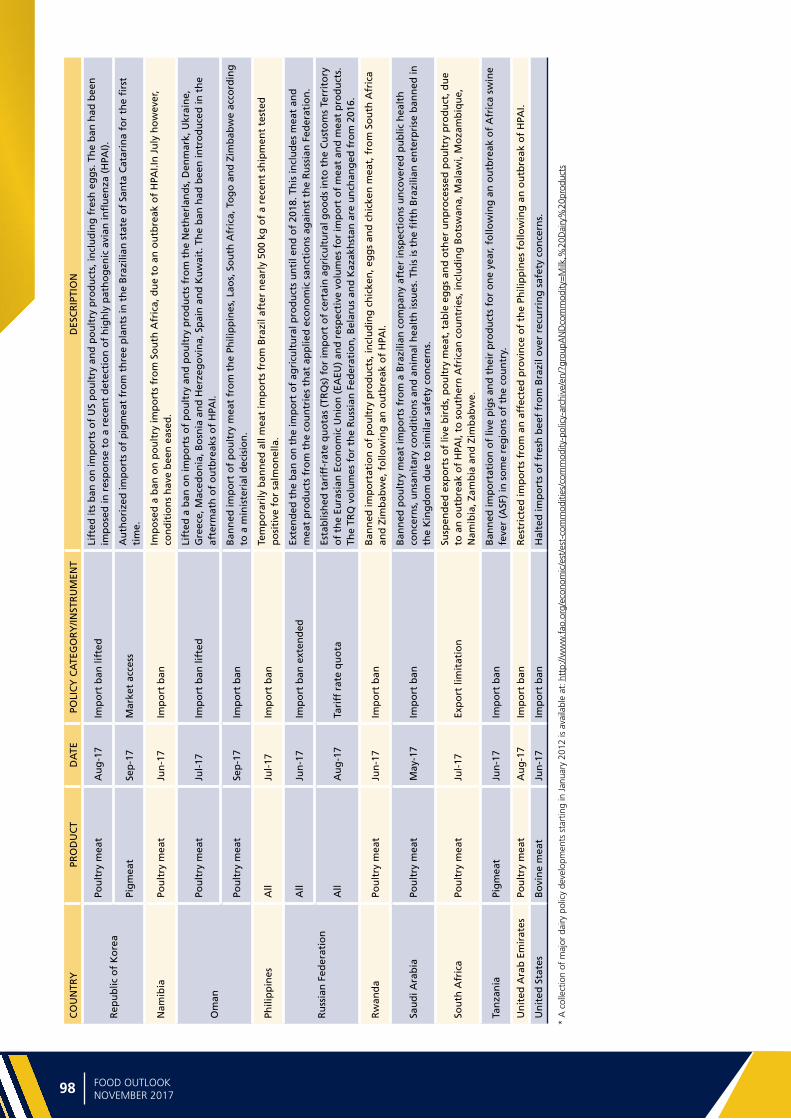
Ma
jor
po
licy
de
velo
pm
en
ts
98 99FOOD OUTLOOKNOVEMBER 2017
* A
col
lect
ion
of m
ajor
dai
ry p
olic
y de
velo
pmen
ts s
tart
ing
in J
anua
ry 2
012
is a
vaila
ble
at: h
ttp:
//ww
w.f
ao.o
rg/e
cono
mic
/est
/est
-com
mod
ities
/com
mod
ity-p
olic
y-ar
chiv
e/en
/?gr
oupA
ND
com
mod
ity=
Milk
,%20
Dai
ry%
20pr
oduc
ts
CO
UN
TRY
PRO
DU
CT
DA
TEPO
LIC
Y C
ATE
GO
RY
/INST
RU
MEN
TD
ESC
RIP
TIO
N
Rep
ub
lic o
f K
ore
a
Pou
ltry
mea
tA
ug
-17
Imp
ort
ban
lift
edLi
fted
its
ban
on
imp
ort
s o
f U
S p
ou
ltry
an
d p
ou
ltry
pro
du
cts,
incl
ud
ing
fre
sh e
gg
s. T
he
ban
had
bee
n
imp
ose
d in
res
po
nse
to
a r
ecen
t d
etec
tio
n o
f h
igh
ly p
ath
og
enic
avi
an in
flu
enza
(H
PAI)
.
Pig
mea
tSe
p-1
7M
arke
t ac
cess
Au
tho
rize
d im
po
rts
of
pig
mea
t fr
om
th
ree
pla
nts
in t
he
Bra
zilia
n s
tate
of
San
ta C
atar
ina
for
the
firs
t ti
me.
Nam
ibia
Pou
ltry
mea
tJu
n-1
7Im
po
rt b
anIm
po
sed
a b
an o
n p
ou
ltry
imp
ort
s fr
om
So
uth
Afr
ica,
du
e to
an
ou
tbre
ak o
f H
PAI.I
n J
uly
ho
wev
er,
con
dit
ion
s h
ave
bee
n e
ased
.
Om
an
Pou
ltry
mea
tJu
l-17
Imp
ort
ban
lift
edLi
fted
a b
an o
n im
po
rts
of
po
ult
ry a
nd
po
ult
ry p
rod
uct
s fr
om
th
e N
eth
erla
nd
s, D
enm
ark,
Ukr
ain
e,
Gre
ece,
Mac
edo
nia
, Bo
snia
an
d H
erze
go
vin
a, S
pai
n a
nd
Ku
wai
t. T
he
ban
had
bee
n in
tro
du
ced
in t
he
afte
rmat
h o
f o
utb
reak
s o
f H
PAI.
Pou
ltry
mea
tSe
p-1
7Im
po
rt b
anB
ann
ed im
po
rt o
f p
ou
ltry
mea
t fr
om
th
e Ph
ilip
pin
es, L
aos,
So
uth
Afr
ica,
To
go
an
d Z
imb
abw
e ac
cord
ing
to
a m
inis
teri
al d
ecis
ion
.
Phili
pp
ines
All
Jul-
17Im
po
rt b
anTe
mp
ora
rily
ban
ned
all
mea
t im
po
rts
fro
m B
razi
l aft
er n
earl
y 50
0 kg
of
a re
cen
t sh
ipm
ent
test
ed
po
siti
ve f
or
salm
on
ella
.
Ru
ssia
n F
eder
atio
n
All
Jun
-17
Imp
ort
ban
ext
end
edEx
ten
ded
th
e b
an o
n t
he
imp
ort
of
agri
cult
ura
l pro
du
cts
un
til e
nd
of
2018
. Th
is in
clu
des
mea
t an
d
mea
t p
rod
uct
s fr
om
th
e co
un
trie
s th
at a
pp
lied
eco
no
mic
san
ctio
ns
agai
nst
th
e R
uss
ian
Fed
erat
ion
.
All
Au
g-1
7Ta
riff
rat
e q
uo
taEs
tab
lish
ed t
arif
f-ra
te q
uo
tas
(TR
Qs)
fo
r im
po
rt o
f ce
rtai
n a
gri
cult
ura
l go
od
s in
to t
he
Cu
sto
ms
Terr
ito
ry
of
the
Eura
sian
Eco
no
mic
Un
ion
(EA
EU)
and
res
pec
tive
vo
lum
es f
or
imp
ort
of
mea
t an
d m
eat
pro
du
cts.
Th
e TR
Q v
olu
mes
fo
r th
e R
uss
ian
Fed
erat
ion
, Bel
aru
s an
d K
azak
hst
an a
re u
nch
ang
ed f
rom
201
6.
Rw
and
aPo
ult
ry m
eat
Jun
-17
Imp
ort
ban
Ban
ned
imp
ort
atio
n o
f p
ou
ltry
pro
du
cts,
incl
ud
ing
ch
icke
n, e
gg
s an
d c
hic
ken
mea
t, f
rom
So
uth
Afr
ica
and
Zim
bab
we,
fo
llow
ing
an
ou
tbre
ak o
f H
PAI.
Sau
di A
rab
iaPo
ult
ry m
eat
May
-17
Imp
ort
ban
Ban
ned
po
ult
ry m
eat
imp
ort
s fr
om
a B
razi
lian
co
mp
any
afte
r in
spec
tio
ns
un
cove
red
pu
blic
hea
lth
co
nce
rns,
un
san
itar
y co
nd
itio
ns
and
an
imal
hea
lth
issu
es. T
his
is t
he
fift
h B
razi
lian
en
terp
rise
ban
ned
in
the
Kin
gd
om
du
e to
sim
ilar
safe
ty c
on
cern
s.
Sou
th A
fric
aPo
ult
ry m
eat
Jul-
17Ex
po
rt li
mit
atio
nSu
spen
ded
exp
ort
s o
f liv
e b
ird
s, p
ou
ltry
mea
t, t
able
eg
gs
and
oth
er u
np
roce
ssed
po
ult
ry p
rod
uct
, du
e to
an
ou
tbre
ak o
f H
PAI,
to s
ou
ther
n A
fric
an c
ou
ntr
ies,
incl
ud
ing
Bo
tsw
ana,
Mal
awi,
Mo
zam
biq
ue,
N
amib
ia, Z
amb
ia a
nd
Zim
bab
we.
Tan
zan
iaPi
gm
eat
Jun
-17
Imp
ort
ban
Ban
ned
imp
ort
atio
n o
f liv
e p
igs
and
th
eir
pro
du
cts
for
on
e ye
ar, f
ollo
win
g a
n o
utb
reak
of
Afr
ica
swin
e fe
ver
(ASF
) in
so
me
reg
ion
s o
f th
e co
un
try.
Un
ited
Ara
b E
mir
ates
Pou
ltry
mea
tA
ug
-17
Imp
ort
ban
Res
tric
ted
imp
ort
s fr
om
an
aff
ecte
d p
rovi
nce
of
the
Phili
pp
ines
fo
llow
ing
an
ou
tbre
ak o
f H
PAI.
Un
ited
Sta
tes
Bo
vin
e m
eat
Jun
-17
Imp
ort
ban
Hal
ted
imp
ort
s o
f fr
esh
bee
f fr
om
Bra
zil o
ver
recu
rrin
g s
afet
y co
nce
rns.

98 99FOOD OUTLOOKNOVEMBER 2017
DA
IRY
DA
IRY:
M
AJO
R PO
LICY
DEV
ELO
PMEN
TS M
ID-M
AY
TO
MID
-OCT
OBE
R 20
17*
CO
UN
TRY
PRO
DU
CT
DA
TEPO
LIC
Y C
ATE
GO
RY
/INST
RU
MEN
TD
ESC
RIP
TIO
N
Can
ada
Ch
eese
Au
g-1
7Ta
riff
rat
e q
uo
ta
An
no
un
ced
a n
ew t
arif
f ra
te q
uo
ta (
TRQ
) ad
min
istr
atio
n p
olic
y ap
plic
able
to
th
e 16
000
met
ric
ton
nes
(M
T) o
f ch
eese
th
at w
ill b
e al
low
ed t
o b
e im
po
rted
un
der
th
e C
anad
a-EU
Co
mp
reh
ensi
ve E
con
om
ic
and
Tra
de
Ag
reem
ent
(CET
A).
Of
the
tota
l TR
Q, 6
0 p
erce
nt
will
be
allo
cate
d t
o s
mal
l an
d m
ediu
m-s
ized
en
terp
rise
s w
ith
th
e re
mai
nin
g 4
0 p
erce
nt
allo
cate
d t
o la
rge
com
pan
ies.
In b
oth
cas
es, 5
0 p
erce
nt
will
b
e al
loca
ted
to
man
ufa
ctu
rers
an
d t
he
bal
ance
to
dis
trib
ute
rs a
nd
ret
aile
rs. T
he
1 70
0 M
T o
f b
ulk
EU
in
du
stri
al c
hee
se T
RQ
will
be
allo
cate
d e
nti
rely
to
man
ufa
ctu
rers
of
furt
her
pro
cess
ed f
oo
d p
rod
uct
s.
Ch
ina
(mai
nla
nd
)
Ch
eese
Oct
-17
Imp
ort
ban
Ban
ned
, tem
po
rari
ly, i
mp
ort
s o
f so
ft c
hee
se p
rod
uct
s fr
om
th
e EU
.
Dai
ry p
rod
uct
sO
ct-1
7Fo
od
saf
ety
stan
dar
ds
Ap
plie
d t
he
Ad
min
istr
ativ
e M
easu
res
for
the
Reg
istr
atio
n o
f R
ecip
es f
or
Form
ula
Po
wd
er P
rod
uct
s fo
r In
fan
ts a
nd
Yo
un
g C
hild
ren
, wh
ich
man
dat
e d
om
esti
c an
d o
vers
eas
pro
du
cers
to
: i)
reg
iste
r th
eir
faci
litie
s w
ith
th
e C
hin
a Fo
od
an
d D
rug
Ad
min
istr
atio
n (
CFD
A)
and
th
e C
erti
fica
tio
n a
nd
Acc
red
itat
ion
A
dm
inis
trat
ion
of
the
Peo
ple
's R
epu
blic
of
Ch
ina
(CN
CA
); a
nd
ii)
limit
th
e n
um
ber
of
pro
du
cts
and
b
ran
ds
pro
du
ced
.
Euro
pea
n U
nio
nD
airy
pro
du
cts
Sep
-17
Free
tra
de
agre
emen
tA
pp
rove
d t
he
free
tra
de
agre
emen
t w
ith
Can
ada,
wh
ich
en
tere
d in
to f
orc
e 21
Sep
tem
ber
201
7, a
fter
it
s ap
pro
val b
y EU
Mem
ber
Sta
tes,
exp
ress
ed in
th
e C
ou
nci
l, an
d b
y th
e Eu
rop
ean
Par
liam
ent.
Ind
iaD
airy
pro
du
cts
Jun
-17
Imp
ort
ban
ext
end
edEx
ten
ded
th
e p
roh
ibit
ion
on
imp
ort
of
milk
an
d m
ilk p
rod
uct
s (i
ncl
ud
ing
ch
oco
late
s an
d c
ho
cola
te
pro
du
cts,
an
d c
and
ies/
con
fect
ion
ary/
foo
d p
rep
arat
ion
s w
ith
milk
or
milk
so
lids
as a
n in
gre
die
nt)
ef
fect
ive
un
til 2
3 Ju
ne
2018
or
un
til f
urt
her
ord
ers.
Th
e p
roh
ibit
ion
has
bee
n in
pla
ce s
ince
200
8.
Ind
on
esia
Dai
ry p
rod
uct
sA
ug
-17
Imp
ort
po
licy
Intr
od
uce
d a
req
uir
emen
t th
at U
S d
airy
-pro
du
ct e
stab
lish
men
ts m
ust
pay
a f
ee t
o u
nd
erg
o t
he
revi
ew
pro
cess
to
exp
ort
dai
ry p
rod
uct
s to
Ind
on
esia
. Th
e re
view
pro
cess
co
nsi
sts
of
thre
e p
has
es: d
ocu
men
t re
view
, on
site
rev
iew
an
d e
valu
atio
n o
f o
nsi
te a
ud
its.
Mex
ico
Dai
ry p
rod
uct
sJu
l-17
Imp
ort
ban
Susp
end
ed a
ll d
airy
imp
ort
s fr
om
Co
lom
bia
aft
er n
ew o
utb
reak
s o
f fo
ot-
and
-mo
uth
dis
ease
wer
e d
etec
ted
in t
he
An
dea
n c
ou
ntr
y.
Ru
ssia
n F
eder
atio
n
Dai
ry p
rod
uct
sJu
n-1
7Im
po
rt b
an e
xten
ded
Exte
nd
ed u
nti
l th
e en
d o
f 20
18 t
he
ban
on
th
e im
po
rt o
f ag
ricu
ltu
ral p
rod
uct
s in
clu
din
g m
ilk a
nd
milk
p
rod
uct
s fr
om
th
e co
un
trie
s th
at a
pp
lied
eco
no
mic
san
ctio
ns
agai
nst
th
e R
uss
ian
Fed
erat
ion
.
Dai
ry p
rod
uct
sA
ug
-17
Tari
ff r
ate
qu
ota
Esta
blis
hed
tar
iff-
rate
qu
ota
s (T
RQ
s) a
nd
res
pec
tive
vo
lum
es f
or
2018
imp
ort
s o
f a
nu
mb
er o
f p
rod
uct
s,
such
as
wh
ey, i
nto
th
e Eu
rasi
an E
con
om
ic U
nio
n (
EAEU
). T
he
volu
me
of
wh
ey a
nd
mo
difi
ed w
hey
p
rod
uct
s th
at w
ill b
e al
low
ed t
o e
nte
r in
to t
he
Ru
ssia
n F
eder
atio
n is
set
at
15 0
00 m
etri
c to
nn
es.
* A
col
lect
ion
of m
ajor
dai
ry p
olic
y de
velo
pmen
ts s
tart
ing
in J
anua
ry 2
012
is a
vaila
ble
at: h
ttp:
//ww
w.f
ao.o
rg/e
cono
mic
/est
/est
-com
mod
ities
/com
mod
ity-p
olic
y-ar
chiv
e/en
/?gr
oupA
ND
com
mod
ity=
Milk
,%20
Dai
ry%
20pr
oduc
ts
Sta
tist
ica
l a
pp
en
dix
100 101FOOD OUTLOOKNOVEMBER 2017
Appendix Table 1 (a) & (b) Cereal statistics 102-103
Appendix Table 2 (a) & (b) Wheat statistics 104-105
Appendix Table 3 (a) & (b) Coarse grains statistics 106-107
Appendix Table 4 (a) & (b) Maize statistics 108-109
Appendix Table 5 (a) & (b) Barley statistics 110-111
Appendix Table 6 (a) & (b) Sorghum statistics 112-113
Appendix Table 7 (a) & (b) Other Coarse grains statistics 112-113
Appendix Table 8 (a) & (b) Rice statistics 114-115
Appendix Table 9 Cereal supply and utilization in main exporting countries 116
Appendix Table 10 Total oilcrops statistics 117
Appendix Table 11 Total oils and fats statistics 118
Appendix Table 12 Total meals and cakes statistics 119
Appendix Table 13 Total meat statistics 120
Appendix Table 14 Bovine meat statistics 121
Appendix Table 15 Ovine meat statistics 122
Appendix Table 16 Pigmeat statistics 123
Appendix Table 17 Poultry meat statistics 124
Appendix Table 18 Milk and milk products statistics 125
Appendix Table 19 Fish and fishery products statistics 126
Appendix Table 20 Selected international prices for wheat and coarse grains 127
Appendix Table 21 Wheat and maize futures prices 127
Appendix Table 22 Selected international prices for rice and price indices 128
Appendix Table 23 Selected international prices for oilcrop products and price indices 129
Appendix Table 24 Selected international prices for milk products and dairy price indices 130
Appendix Table 25 Selected international meat prices 131
Appendix Table 26 Selected international meat prices and FAO meat price index 132
Appendix Table 27 Fish price indices 133
Appendix Table 28 Selected international commodity prices 133
Statistical appendix tables
Statistica
l ap
pe
nd
ix
100 101FOOD OUTLOOKNOVEMBER 2017
General• FAO estimates and forecasts are
based on official and unofficial
sources.
• Unless otherwise stated, all charts
and tables refer to FAO data as
source.
• Estimates of world imports and
exports may not always match, mainly
because shipments and deliveries
do not necessarily occur in the same
marketing year.
• Tonnes refer to metric tonnes.
• All totals are computed from
unrounded data.
• Regional totals may include estimates
for countries not listed. The countries
shown in the tables were chosen
based on their importance of either
production or trade in each region.
The totals shown for Central America
include countries in the Caribbean.
• Estimates for China also include those
for the Taiwan Province, Hong Kong
SAR and Macao SAR, unless otherwise
stated.
• Up to 2012/13, the European
Union includes 27 member states.
From 2013/14, the European Union
includes 28 member states.
• ‘-‘ means nil or negligible.
• Cereals include wheat, rice and
coarse grains. Coarse grains include
maize, barley, sorghum, millet,
rye, oats and NES (not elsewhere
specified).
Production• Cereals: Data refer to the calendar
year in which the whole harvest or
bulk of harvest takes place.
Utilization• Cereals: Data are on individual
country’s marketing year basis.
Trade• Trade between European Union
member states is excluded, unless
otherwise stated.
• Wheat: Trade data include wheat
flour in wheat grain equivalent. The
time reference period is July/June,
unless otherwise stated.
• Coarse grains: The time reference
period is July/June, unless otherwise
stated.
• Rice, dairy and meat products:
The time reference period is January/
December.
• Oilseeds, oils and fats and meals:
The time reference period is October/
September, unless otherwise stated.
Stocks• Cereals: Data refer to carry-overs at
the close of national crop seasons
ending in the year shown.
Price indices• The FAO price indices are calculated
using the Laspeyres formula; the weights used are based on the average export value of each commodity for the 2002-2004
period.
COUNTRY CLASSIFICATION
In the presentation of statistical
material, countries are subdivided
according to geographical location as
well as into the following two main
economic groupings: “developed
countries” (including the developed
market economies and the transition
markets) and “developing countries”
(including the developing market
economies and the Asia centrally
planned countries). The designation
“Developed” and “Developing”
economies is intended for statistical
convenience and does not necessarily
express a judgement about the stage
reached by a particular country or area
in the development process.
References are also made to special
country groupings: Low-Income
Food-Deficit Countries (LIFDCs),
Least Developed Countries (LDCs).
The LIFDCs include 54 countries that
are net importers of basic foodstuffs
with per caput income below the
level used by the World Bank to
determine eligibility for International
Development Aid (IDA) assistance (i.e.
USD 1 945 in 2011). The LDCs group
currently includes 48 countries with
low income as well as weak human
resources and low level of economic
diversification. The list is reviewed
every three years by the Economic and
Social Council of the United Nations.
DISCLAIMER
The designations employed and
the presentation of material in
this publication do not imply the
expression of any opinion whatsoever
on the part of the Food and
Agriculture Organization of the United
Nations concerning the legal status
of any country, territory, city or area
or of its authorities, or concerning
the delimitation of its frontiers or
boundaries.
NOTES
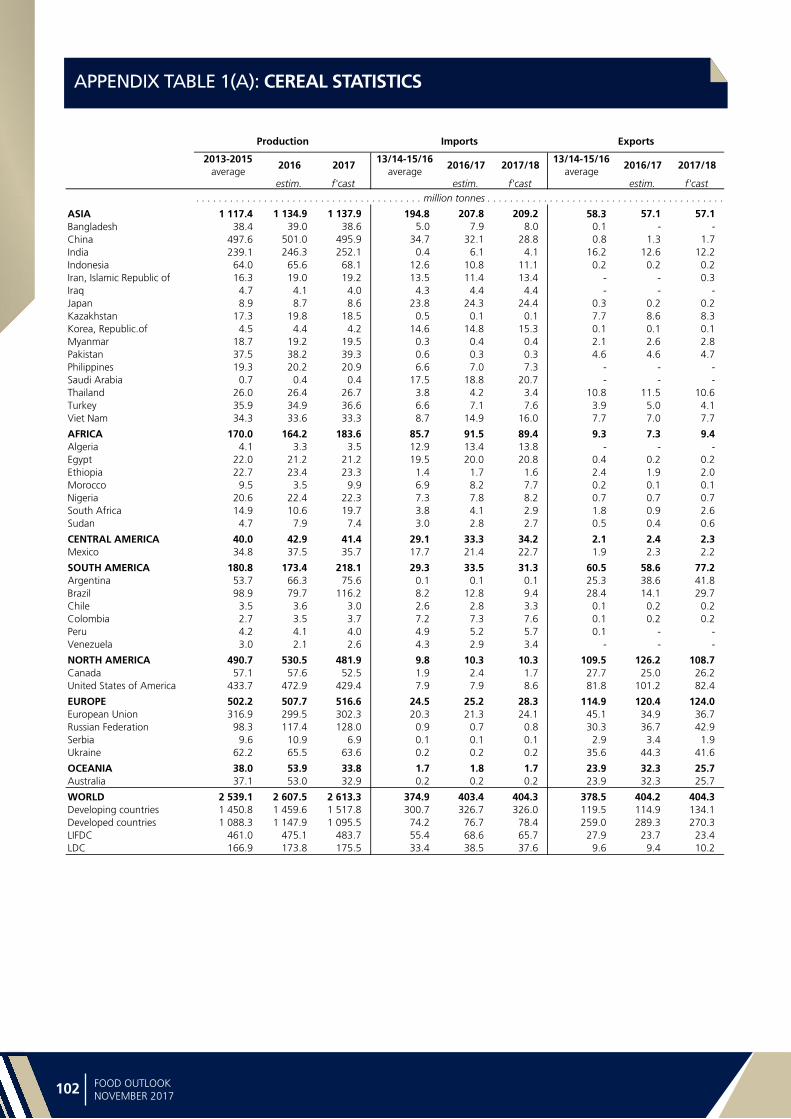
Sta
tist
ica
l a
pp
en
dix
102 103FOOD OUTLOOKNOVEMBER 2017
APPENDIX TABLE 1(A): CEREAL STATISTICS
2013-2015
average2016 2017
13/14-15/16average
2016/17 2017/1813/14-15/16
average2016/17 2017/18
estim. f'cast estim. f'cast estim. f'cast
ASIA 1 117.4 1 134.9 1 137.9 194.8 207.8 209.2 58.3 57.1 57.1Bangladesh 38.4 39.0 38.6 5.0 7.9 8.0 0.1 - -China 497.6 501.0 495.9 34.7 32.1 28.8 0.8 1.3 1.7India 239.1 246.3 252.1 0.4 6.1 4.1 16.2 12.6 12.2Indonesia 64.0 65.6 68.1 12.6 10.8 11.1 0.2 0.2 0.2Iran, Islamic Republic of 16.3 19.0 19.2 13.5 11.4 13.4 - - 0.3Iraq 4.7 4.1 4.0 4.3 4.4 4.4 - - -Japan 8.9 8.7 8.6 23.8 24.3 24.4 0.3 0.2 0.2Kazakhstan 17.3 19.8 18.5 0.5 0.1 0.1 7.7 8.6 8.3Korea, Republic.of 4.5 4.4 4.2 14.6 14.8 15.3 0.1 0.1 0.1Myanmar 18.7 19.2 19.5 0.3 0.4 0.4 2.1 2.6 2.8Pakistan 37.5 38.2 39.3 0.6 0.3 0.3 4.6 4.6 4.7Philippines 19.3 20.2 20.9 6.6 7.0 7.3 - - -Saudi Arabia 0.7 0.4 0.4 17.5 18.8 20.7 - - -Thailand 26.0 26.4 26.7 3.8 4.2 3.4 10.8 11.5 10.6Turkey 35.9 34.9 36.6 6.6 7.1 7.6 3.9 5.0 4.1Viet Nam 34.3 33.6 33.3 8.7 14.9 16.0 7.7 7.0 7.7
AFRICA 170.0 164.2 183.6 85.7 91.5 89.4 9.3 7.3 9.4Algeria 4.1 3.3 3.5 12.9 13.4 13.8 - - -Egypt 22.0 21.2 21.2 19.5 20.0 20.8 0.4 0.2 0.2Ethiopia 22.7 23.4 23.3 1.4 1.7 1.6 2.4 1.9 2.0Morocco 9.5 3.5 9.9 6.9 8.2 7.7 0.2 0.1 0.1Nigeria 20.6 22.4 22.3 7.3 7.8 8.2 0.7 0.7 0.7South Africa 14.9 10.6 19.7 3.8 4.1 2.9 1.8 0.9 2.6Sudan 4.7 7.9 7.4 3.0 2.8 2.7 0.5 0.4 0.6
CENTRAL AMERICA 40.0 42.9 41.4 29.1 33.3 34.2 2.1 2.4 2.3Mexico 34.8 37.5 35.7 17.7 21.4 22.7 1.9 2.3 2.2
SOUTH AMERICA 180.8 173.4 218.1 29.3 33.5 31.3 60.5 58.6 77.2Argentina 53.7 66.3 75.6 0.1 0.1 0.1 25.3 38.6 41.8Brazil 98.9 79.7 116.2 8.2 12.8 9.4 28.4 14.1 29.7Chile 3.5 3.6 3.0 2.6 2.8 3.3 0.1 0.2 0.2Colombia 2.7 3.5 3.7 7.2 7.3 7.6 0.1 0.2 0.2Peru 4.2 4.1 4.0 4.9 5.2 5.7 0.1 - -Venezuela 3.0 2.1 2.6 4.3 2.9 3.4 - - -
NORTH AMERICA 490.7 530.5 481.9 9.8 10.3 10.3 109.5 126.2 108.7Canada 57.1 57.6 52.5 1.9 2.4 1.7 27.7 25.0 26.2United States of America 433.7 472.9 429.4 7.9 7.9 8.6 81.8 101.2 82.4
EUROPE 502.2 507.7 516.6 24.5 25.2 28.3 114.9 120.4 124.0European Union 316.9 299.5 302.3 20.3 21.3 24.1 45.1 34.9 36.7Russian Federation 98.3 117.4 128.0 0.9 0.7 0.8 30.3 36.7 42.9Serbia 9.6 10.9 6.9 0.1 0.1 0.1 2.9 3.4 1.9Ukraine 62.2 65.5 63.6 0.2 0.2 0.2 35.6 44.3 41.6
OCEANIA 38.0 53.9 33.8 1.7 1.8 1.7 23.9 32.3 25.7Australia 37.1 53.0 32.9 0.2 0.2 0.2 23.9 32.3 25.7
WORLD 2 539.1 2 607.5 2 613.3 374.9 403.4 404.3 378.5 404.2 404.3Developing countries 1 450.8 1 459.6 1 517.8 300.7 326.7 326.0 119.5 114.9 134.1Developed countries 1 088.3 1 147.9 1 095.5 74.2 76.7 78.4 259.0 289.3 270.3LIFDC 461.0 475.1 483.7 55.4 68.6 65.7 27.9 23.7 23.4LDC 166.9 173.8 175.5 33.4 38.5 37.6 9.6 9.4 10.2
APPENDIX TABLE 1(A): CEREAL STATISTICS
Production Imports Exports
. . . . . . . . . . . . . . . . . . . . . . . . . . . . . . . . . . . . . . . . million tonnes . . . . . . . . . . . . . . . . . . . . . . . . . . . . . . . . . . . . . . . . . .
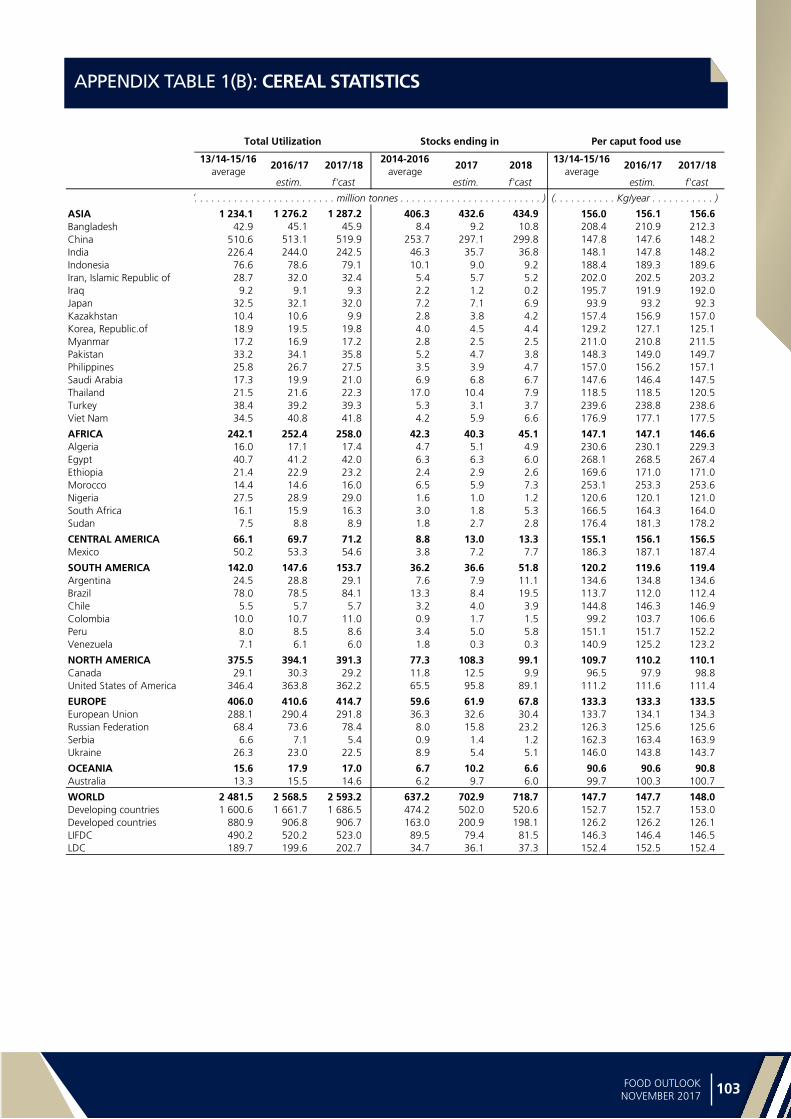
Statistica
l ap
pe
nd
ix
102 103FOOD OUTLOOKNOVEMBER 2017
APPENDIX TABLE 1(B): CEREAL STATISTICS
13/14-15/16
average2016/17 2017/18
2014-2016average
2017 201813/14-15/16
average2016/17 2017/18
estim. f'cast estim. f'cast estim. f'cast
ASIA 1 234.1 1 276.2 1 287.2 406.3 432.6 434.9 156.0 156.1 156.6Bangladesh 42.9 45.1 45.9 8.4 9.2 10.8 208.4 210.9 212.3China 510.6 513.1 519.9 253.7 297.1 299.8 147.8 147.6 148.2India 226.4 244.0 242.5 46.3 35.7 36.8 148.1 147.8 148.2Indonesia 76.6 78.6 79.1 10.1 9.0 9.2 188.4 189.3 189.6Iran, Islamic Republic of 28.7 32.0 32.4 5.4 5.7 5.2 202.0 202.5 203.2Iraq 9.2 9.1 9.3 2.2 1.2 0.2 195.7 191.9 192.0Japan 32.5 32.1 32.0 7.2 7.1 6.9 93.9 93.2 92.3Kazakhstan 10.4 10.6 9.9 2.8 3.8 4.2 157.4 156.9 157.0Korea, Republic.of 18.9 19.5 19.8 4.0 4.5 4.4 129.2 127.1 125.1Myanmar 17.2 16.9 17.2 2.8 2.5 2.5 211.0 210.8 211.5Pakistan 33.2 34.1 35.8 5.2 4.7 3.8 148.3 149.0 149.7Philippines 25.8 26.7 27.5 3.5 3.9 4.7 157.0 156.2 157.1Saudi Arabia 17.3 19.9 21.0 6.9 6.8 6.7 147.6 146.4 147.5Thailand 21.5 21.6 22.3 17.0 10.4 7.9 118.5 118.5 120.5Turkey 38.4 39.2 39.3 5.3 3.1 3.7 239.6 238.8 238.6Viet Nam 34.5 40.8 41.8 4.2 5.9 6.6 176.9 177.1 177.5
AFRICA 242.1 252.4 258.0 42.3 40.3 45.1 147.1 147.1 146.6Algeria 16.0 17.1 17.4 4.7 5.1 4.9 230.6 230.1 229.3Egypt 40.7 41.2 42.0 6.3 6.3 6.0 268.1 268.5 267.4Ethiopia 21.4 22.9 23.2 2.4 2.9 2.6 169.6 171.0 171.0Morocco 14.4 14.6 16.0 6.5 5.9 7.3 253.1 253.3 253.6Nigeria 27.5 28.9 29.0 1.6 1.0 1.2 120.6 120.1 121.0South Africa 16.1 15.9 16.3 3.0 1.8 5.3 166.5 164.3 164.0Sudan 7.5 8.8 8.9 1.8 2.7 2.8 176.4 181.3 178.2
CENTRAL AMERICA 66.1 69.7 71.2 8.8 13.0 13.3 155.1 156.1 156.5Mexico 50.2 53.3 54.6 3.8 7.2 7.7 186.3 187.1 187.4
SOUTH AMERICA 142.0 147.6 153.7 36.2 36.6 51.8 120.2 119.6 119.4Argentina 24.5 28.8 29.1 7.6 7.9 11.1 134.6 134.8 134.6Brazil 78.0 78.5 84.1 13.3 8.4 19.5 113.7 112.0 112.4Chile 5.5 5.7 5.7 3.2 4.0 3.9 144.8 146.3 146.9Colombia 10.0 10.7 11.0 0.9 1.7 1.5 99.2 103.7 106.6Peru 8.0 8.5 8.6 3.4 5.0 5.8 151.1 151.7 152.2Venezuela 7.1 6.1 6.0 1.8 0.3 0.3 140.9 125.2 123.2
NORTH AMERICA 375.5 394.1 391.3 77.3 108.3 99.1 109.7 110.2 110.1Canada 29.1 30.3 29.2 11.8 12.5 9.9 96.5 97.9 98.8United States of America 346.4 363.8 362.2 65.5 95.8 89.1 111.2 111.6 111.4
EUROPE 406.0 410.6 414.7 59.6 61.9 67.8 133.3 133.3 133.5European Union 288.1 290.4 291.8 36.3 32.6 30.4 133.7 134.1 134.3Russian Federation 68.4 73.6 78.4 8.0 15.8 23.2 126.3 125.6 125.6Serbia 6.6 7.1 5.4 0.9 1.4 1.2 162.3 163.4 163.9Ukraine 26.3 23.0 22.5 8.9 5.4 5.1 146.0 143.8 143.7
OCEANIA 15.6 17.9 17.0 6.7 10.2 6.6 90.6 90.6 90.8Australia 13.3 15.5 14.6 6.2 9.7 6.0 99.7 100.3 100.7
WORLD 2 481.5 2 568.5 2 593.2 637.2 702.9 718.7 147.7 147.7 148.0Developing countries 1 600.6 1 661.7 1 686.5 474.2 502.0 520.6 152.7 152.7 153.0Developed countries 880.9 906.8 906.7 163.0 200.9 198.1 126.2 126.2 126.1LIFDC 490.2 520.2 523.0 89.5 79.4 81.5 146.3 146.4 146.5LDC 189.7 199.6 202.7 34.7 36.1 37.3 152.4 152.5 152.4
APPENDIX TABLE 1(B): CEREAL STATISTICS
Total Utilization Stocks ending in Per caput food use
(. . . . . . . . . . . . . . . . . . . . . . . . . million tonnes . . . . . . . . . . . . . . . . . . . . . . . . . ) (. . . . . . . . . . . Kg/year . . . . . . . . . . . )
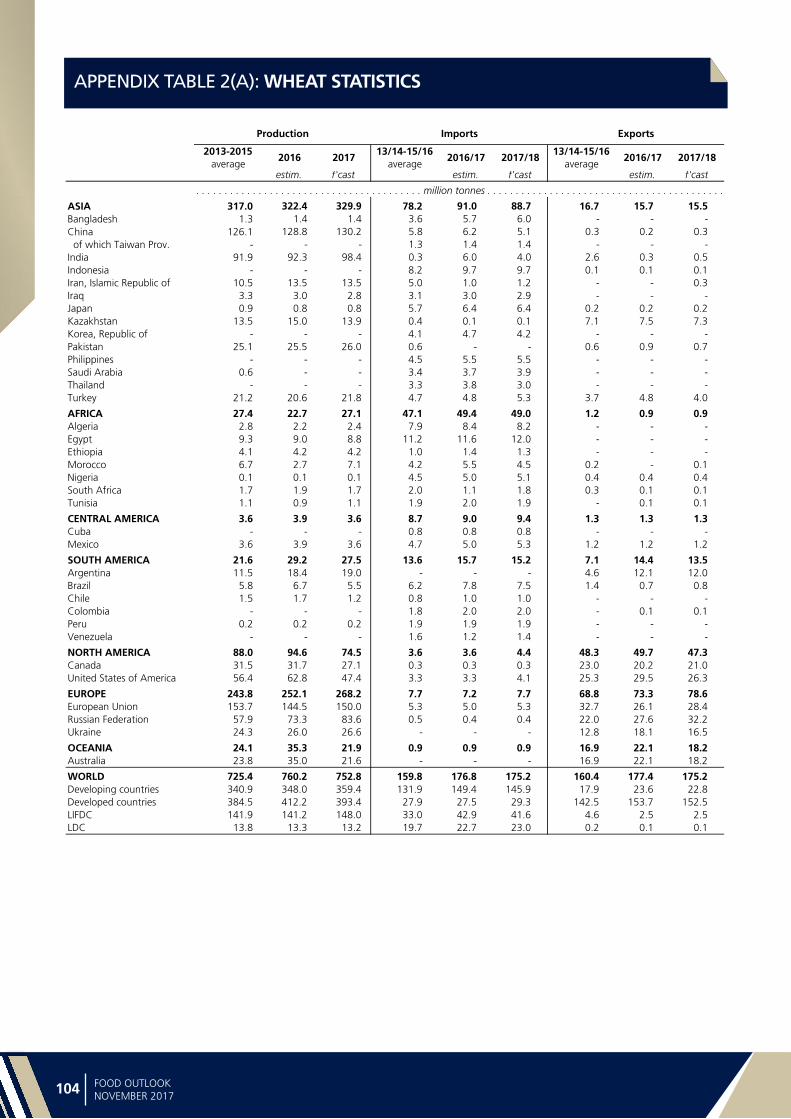
Sta
tist
ica
l a
pp
en
dix
104 105FOOD OUTLOOKNOVEMBER 2017
APPENDIX TABLE 2(A): WHEAT STATISTICS
2013-2015
average2016 2017
13/14-15/16average
2016/17 2017/1813/14-15/16
average2016/17 2017/18
estim. f'cast estim. f'cast estim. f'cast
ASIA 317.0 322.4 329.9 78.2 91.0 88.7 16.7 15.7 15.5Bangladesh 1.3 1.4 1.4 3.6 5.7 6.0 - - -China 126.1 128.8 130.2 5.8 6.2 5.1 0.3 0.2 0.3 of which Taiwan Prov. - - - 1.3 1.4 1.4 - - -India 91.9 92.3 98.4 0.3 6.0 4.0 2.6 0.3 0.5Indonesia - - - 8.2 9.7 9.7 0.1 0.1 0.1Iran, Islamic Republic of 10.5 13.5 13.5 5.0 1.0 1.2 - - 0.3Iraq 3.3 3.0 2.8 3.1 3.0 2.9 - - -Japan 0.9 0.8 0.8 5.7 6.4 6.4 0.2 0.2 0.2Kazakhstan 13.5 15.0 13.9 0.4 0.1 0.1 7.1 7.5 7.3Korea, Republic of - - - 4.1 4.7 4.2 - - -Pakistan 25.1 25.5 26.0 0.6 - - 0.6 0.9 0.7Philippines - - - 4.5 5.5 5.5 - - -Saudi Arabia 0.6 - - 3.4 3.7 3.9 - - -Thailand - - - 3.3 3.8 3.0 - - -Turkey 21.2 20.6 21.8 4.7 4.8 5.3 3.7 4.8 4.0
AFRICA 27.4 22.7 27.1 47.1 49.4 49.0 1.2 0.9 0.9Algeria 2.8 2.2 2.4 7.9 8.4 8.2 - - -Egypt 9.3 9.0 8.8 11.2 11.6 12.0 - - -Ethiopia 4.1 4.2 4.2 1.0 1.4 1.3 - - -Morocco 6.7 2.7 7.1 4.2 5.5 4.5 0.2 - 0.1Nigeria 0.1 0.1 0.1 4.5 5.0 5.1 0.4 0.4 0.4South Africa 1.7 1.9 1.7 2.0 1.1 1.8 0.3 0.1 0.1Tunisia 1.1 0.9 1.1 1.9 2.0 1.9 - 0.1 0.1
CENTRAL AMERICA 3.6 3.9 3.6 8.7 9.0 9.4 1.3 1.3 1.3Cuba - - - 0.8 0.8 0.8 - - -Mexico 3.6 3.9 3.6 4.7 5.0 5.3 1.2 1.2 1.2
SOUTH AMERICA 21.6 29.2 27.5 13.6 15.7 15.2 7.1 14.4 13.5Argentina 11.5 18.4 19.0 - - - 4.6 12.1 12.0Brazil 5.8 6.7 5.5 6.2 7.8 7.5 1.4 0.7 0.8Chile 1.5 1.7 1.2 0.8 1.0 1.0 - - -Colombia - - - 1.8 2.0 2.0 - 0.1 0.1Peru 0.2 0.2 0.2 1.9 1.9 1.9 - - -Venezuela - - - 1.6 1.2 1.4 - - -
NORTH AMERICA 88.0 94.6 74.5 3.6 3.6 4.4 48.3 49.7 47.3Canada 31.5 31.7 27.1 0.3 0.3 0.3 23.0 20.2 21.0United States of America 56.4 62.8 47.4 3.3 3.3 4.1 25.3 29.5 26.3
EUROPE 243.8 252.1 268.2 7.7 7.2 7.7 68.8 73.3 78.6European Union 153.7 144.5 150.0 5.3 5.0 5.3 32.7 26.1 28.4Russian Federation 57.9 73.3 83.6 0.5 0.4 0.4 22.0 27.6 32.2Ukraine 24.3 26.0 26.6 - - - 12.8 18.1 16.5
OCEANIA 24.1 35.3 21.9 0.9 0.9 0.9 16.9 22.1 18.2Australia 23.8 35.0 21.6 - - - 16.9 22.1 18.2
WORLD 725.4 760.2 752.8 159.8 176.8 175.2 160.4 177.4 175.2Developing countries 340.9 348.0 359.4 131.9 149.4 145.9 17.9 23.6 22.8Developed countries 384.5 412.2 393.4 27.9 27.5 29.3 142.5 153.7 152.5LIFDC 141.9 141.2 148.0 33.0 42.9 41.6 4.6 2.5 2.5LDC 13.8 13.3 13.2 19.7 22.7 23.0 0.2 0.1 0.1
APPENDIX TABLE 2(A): WHEAT STATISTICS
Production Imports Exports
. . . . . . . . . . . . . . . . . . . . . . . . . . . . . . . . . . . . . . . . million tonnes . . . . . . . . . . . . . . . . . . . . . . . . . . . . . . . . . . . . . . . . . .

Statistica
l ap
pe
nd
ix
104 105FOOD OUTLOOKNOVEMBER 2017
APPENDIX TABLE 2(B): WHEAT STATISTICS
13/14-15/16
average2016/17 2017/18
2014-2016average
2017 201813/14-15/16
average2016/17 2017/18
estim. f'cast estim. f'cast estim. f'cast
ASIA 370.2 386.1 384.2 117.2 140.4 157.6 64.5 64.9 65.2Bangladesh 4.6 6.1 6.5 0.9 2.4 3.3 23.8 25.5 26.7China 124.2 117.0 116.4 62.1 91.9 110.4 62.5 62.3 62.3 of which Taiwan Prov. 1.3 1.4 1.4 0.4 0.4 0.4 45.4 45.4 45.3India 90.2 104.1 100.9 21.3 13.5 14.0 59.4 59.8 60.0Indonesia 7.9 9.7 10.0 1.0 1.2 1.0 24.6 25.4 25.8Iran, Islamic Republic of 14.8 15.2 15.4 3.1 3.5 2.3 166.4 166.9 167.6Iraq 6.4 6.6 6.7 1.8 1.0 - 152.8 153.2 152.8Japan 6.5 6.4 6.4 1.6 1.6 1.5 40.5 40.6 40.6Kazakhstan 7.3 7.1 6.8 2.4 2.9 2.7 143.1 142.1 142.0Korea, Republic of 4.1 4.6 4.4 0.7 0.9 1.0 47.5 47.8 47.9Pakistan 24.7 24.9 26.2 3.0 2.7 1.8 125.3 125.5 125.6Philippines 4.5 5.3 5.3 0.6 0.8 1.0 23.0 23.2 23.4Saudi Arabia 3.5 3.6 3.9 2.8 2.9 2.9 101.2 100.2 101.3Thailand 3.1 3.4 3.0 0.9 1.7 1.7 15.9 16.4 18.5Turkey 22.2 22.4 22.6 2.9 1.2 1.7 210.3 210.0 209.9
AFRICA 70.2 73.1 74.3 18.7 18.2 18.0 50.4 49.9 49.3Algeria 10.0 10.7 10.8 2.9 3.5 3.3 208.9 208.7 208.1Egypt 20.3 21.0 21.1 4.2 4.0 3.7 184.9 186.0 184.5Ethiopia 5.1 5.6 5.7 0.6 0.8 0.7 41.9 43.0 43.1Morocco 9.4 9.8 10.8 4.9 4.8 5.5 201.1 201.3 201.5Nigeria 4.0 4.0 4.1 0.2 0.2 0.2 20.5 19.2 19.2South Africa 3.2 3.3 3.2 0.6 0.3 0.5 57.4 57.0 57.0Tunisia 3.0 3.1 3.0 0.6 0.3 0.2 210.7 210.5 210.3
CENTRAL AMERICA 10.7 11.3 11.4 1.9 2.2 2.4 43.9 44.2 44.3Cuba 0.8 0.8 0.8 0.1 0.1 0.1 55.3 56.1 56.4Mexico 7.0 7.4 7.4 0.7 0.8 1.0 48.3 48.6 48.8
SOUTH AMERICA 26.4 27.0 27.1 7.7 9.2 10.6 59.2 58.9 58.6Argentina 5.7 6.1 6.2 2.6 1.7 2.6 117.5 117.5 117.6Brazil 11.2 11.3 11.3 1.4 2.8 3.4 52.5 52.5 52.6Chile 2.2 2.2 2.3 1.0 1.4 1.3 108.7 109.1 109.4Colombia 1.5 1.6 1.6 0.4 1.0 0.8 28.4 29.4 29.5Peru 2.0 2.0 2.0 0.6 0.6 0.6 60.3 60.4 60.5Venezuela 1.6 1.2 1.3 0.3 - 0.1 53.1 37.4 40.7
NORTH AMERICA 41.0 41.8 39.3 28.6 39.0 30.9 82.4 82.7 82.8Canada 8.5 10.0 8.4 7.6 6.9 4.8 80.5 81.3 81.9United States of America 32.5 31.8 30.9 21.1 32.1 26.1 82.7 82.9 82.9
EUROPE 179.4 184.2 192.8 25.9 29.5 33.9 107.3 107.6 107.8European Union 123.2 125.8 128.0 14.6 14.8 13.5 108.9 109.3 109.6Russian Federation 36.4 40.6 46.7 4.5 9.6 14.7 100.1 100.0 100.0Ukraine 11.6 9.7 9.7 3.6 1.0 1.5 112.2 112.0 112.0
OCEANIA 8.0 9.3 9.1 4.3 6.7 4.8 67.0 66.6 66.4Australia 6.9 8.2 7.9 3.9 6.4 4.4 79.8 80.0 80.2
WORLD 705.9 732.8 738.2 204.4 245.2 258.2 66.6 66.7 66.6Developing countries 441.4 461.6 461.4 137.2 161.0 179.8 59.9 60.0 60.0Developed countries 264.5 271.2 276.8 67.2 84.2 78.3 95.1 95.3 95.4LIFDC 169.3 186.7 185.1 37.3 29.8 29.4 52.9 52.9 52.9LDC 32.3 35.4 35.7 8.1 9.2 9.2 29.1 29.6 29.5
APPENDIX TABLE 2(B): WHEAT STATISTICS
Total Utilization Stocks ending in Per caput food use
(. . . . . . . . . . . . . . . . . . . . . . . . . million tonnes . . . . . . . . . . . . . . . . . . . . . . . . . ) (. . . . . . . . . . . Kg/year . . . . . . . . . . . )
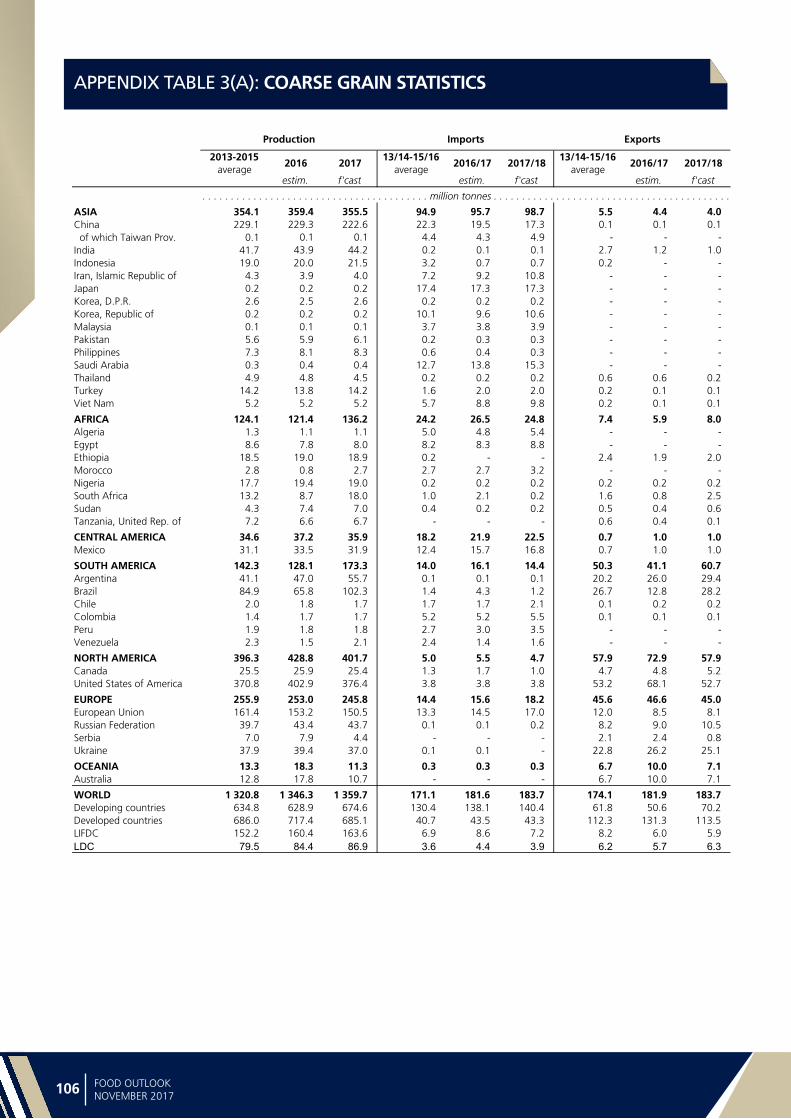
Sta
tist
ica
l a
pp
en
dix
106 107FOOD OUTLOOKNOVEMBER 2017
APPENDIX TABLE 3(A): COARSE GRAIN STATISTICS
2013-2015
average2016 2017
13/14-15/16average
2016/17 2017/1813/14-15/16
average2016/17 2017/18
estim. f'cast estim. f'cast estim. f'cast
ASIA 354.1 359.4 355.5 94.9 95.7 98.7 5.5 4.4 4.0China 229.1 229.3 222.6 22.3 19.5 17.3 0.1 0.1 0.1 of which Taiwan Prov. 0.1 0.1 0.1 4.4 4.3 4.9 - - -India 41.7 43.9 44.2 0.2 0.1 0.1 2.7 1.2 1.0Indonesia 19.0 20.0 21.5 3.2 0.7 0.7 0.2 - -Iran, Islamic Republic of 4.3 3.9 4.0 7.2 9.2 10.8 - - -Japan 0.2 0.2 0.2 17.4 17.3 17.3 - - -Korea, D.P.R. 2.6 2.5 2.6 0.2 0.2 0.2 - - -Korea, Republic of 0.2 0.2 0.2 10.1 9.6 10.6 - - -Malaysia 0.1 0.1 0.1 3.7 3.8 3.9 - - -Pakistan 5.6 5.9 6.1 0.2 0.3 0.3 - - -Philippines 7.3 8.1 8.3 0.6 0.4 0.3 - - -Saudi Arabia 0.3 0.4 0.4 12.7 13.8 15.3 - - -Thailand 4.9 4.8 4.5 0.2 0.2 0.2 0.6 0.6 0.2Turkey 14.2 13.8 14.2 1.6 2.0 2.0 0.2 0.1 0.1Viet Nam 5.2 5.2 5.2 5.7 8.8 9.8 0.2 0.1 0.1
AFRICA 124.1 121.4 136.2 24.2 26.5 24.8 7.4 5.9 8.0Algeria 1.3 1.1 1.1 5.0 4.8 5.4 - - -Egypt 8.6 7.8 8.0 8.2 8.3 8.8 - - -Ethiopia 18.5 19.0 18.9 0.2 - - 2.4 1.9 2.0Morocco 2.8 0.8 2.7 2.7 2.7 3.2 - - -Nigeria 17.7 19.4 19.0 0.2 0.2 0.2 0.2 0.2 0.2South Africa 13.2 8.7 18.0 1.0 2.1 0.2 1.6 0.8 2.5Sudan 4.3 7.4 7.0 0.4 0.2 0.2 0.5 0.4 0.6Tanzania, United Rep. of 7.2 6.6 6.7 - - - 0.6 0.4 0.1
CENTRAL AMERICA 34.6 37.2 35.9 18.2 21.9 22.5 0.7 1.0 1.0Mexico 31.1 33.5 31.9 12.4 15.7 16.8 0.7 1.0 1.0
SOUTH AMERICA 142.3 128.1 173.3 14.0 16.1 14.4 50.3 41.1 60.7Argentina 41.1 47.0 55.7 0.1 0.1 0.1 20.2 26.0 29.4Brazil 84.9 65.8 102.3 1.4 4.3 1.2 26.7 12.8 28.2Chile 2.0 1.8 1.7 1.7 1.7 2.1 0.1 0.2 0.2Colombia 1.4 1.7 1.7 5.2 5.2 5.5 0.1 0.1 0.1Peru 1.9 1.8 1.8 2.7 3.0 3.5 - - -Venezuela 2.3 1.5 2.1 2.4 1.4 1.6 - - -
NORTH AMERICA 396.3 428.8 401.7 5.0 5.5 4.7 57.9 72.9 57.9Canada 25.5 25.9 25.4 1.3 1.7 1.0 4.7 4.8 5.2United States of America 370.8 402.9 376.4 3.8 3.8 3.8 53.2 68.1 52.7
EUROPE 255.9 253.0 245.8 14.4 15.6 18.2 45.6 46.6 45.0European Union 161.4 153.2 150.5 13.3 14.5 17.0 12.0 8.5 8.1Russian Federation 39.7 43.4 43.7 0.1 0.1 0.2 8.2 9.0 10.5Serbia 7.0 7.9 4.4 - - - 2.1 2.4 0.8Ukraine 37.9 39.4 37.0 0.1 0.1 - 22.8 26.2 25.1
OCEANIA 13.3 18.3 11.3 0.3 0.3 0.3 6.7 10.0 7.1Australia 12.8 17.8 10.7 - - - 6.7 10.0 7.1
WORLD 1 320.8 1 346.3 1 359.7 171.1 181.6 183.7 174.1 181.9 183.7Developing countries 634.8 628.9 674.6 130.4 138.1 140.4 61.8 50.6 70.2Developed countries 686.0 717.4 685.1 40.7 43.5 43.3 112.3 131.3 113.5LIFDC 152.2 160.4 163.6 6.9 8.6 7.2 8.2 6.0 5.9LDC 79.5 84.4 86.9 3.6 4.4 3.9 6.2 5.7 6.3
APPENDIX TABLE 3(A): COARSE GRAIN STATISTICS
Production Imports Exports
. . . . . . . . . . . . . . . . . . . . . . . . . . . . . . . . . . . . . . . . million tonnes . . . . . . . . . . . . . . . . . . . . . . . . . . . . . . . . . . . . . . . . . .
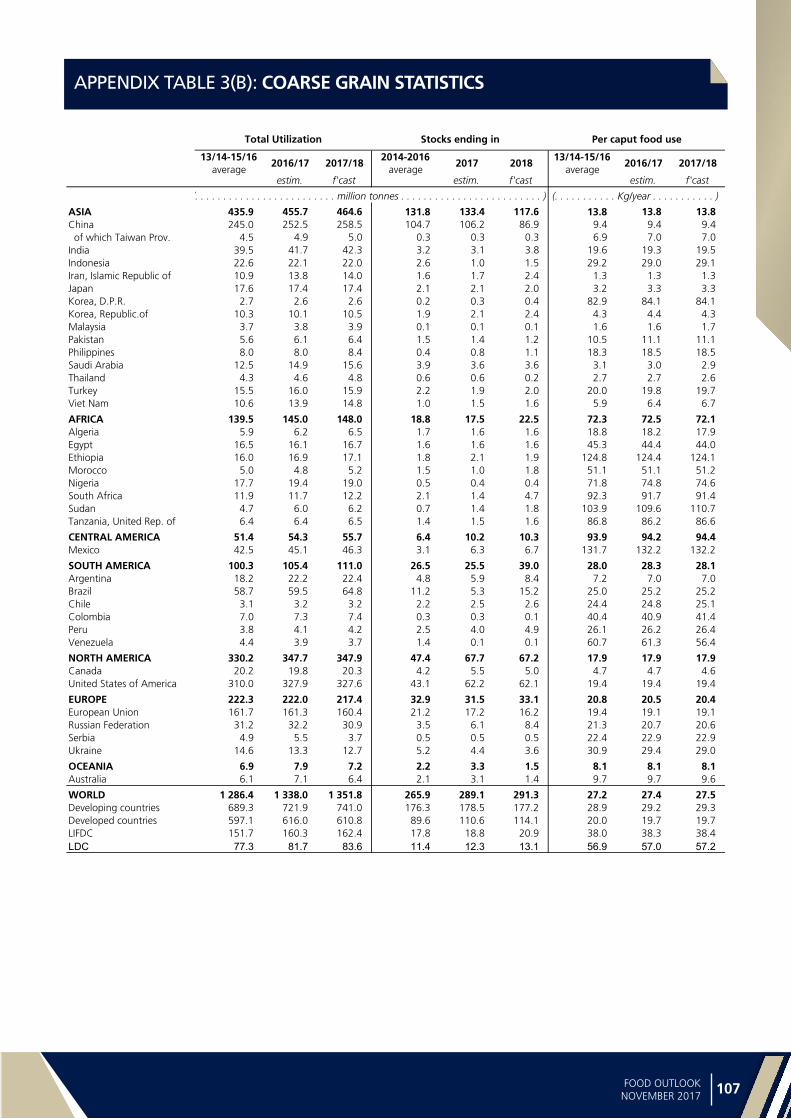
Statistica
l ap
pe
nd
ix
106 107FOOD OUTLOOKNOVEMBER 2017
APPENDIX TABLE 3(B): COARSE GRAIN STATISTICS
13/14-15/16
average2016/17 2017/18
2014-2016average
2017 201813/14-15/16
average2016/17 2017/18
estim. f'cast estim. f'cast estim. f'cast
ASIA 435.9 455.7 464.6 131.8 133.4 117.6 13.8 13.8 13.8China 245.0 252.5 258.5 104.7 106.2 86.9 9.4 9.4 9.4 of which Taiwan Prov. 4.5 4.9 5.0 0.3 0.3 0.3 6.9 7.0 7.0India 39.5 41.7 42.3 3.2 3.1 3.8 19.6 19.3 19.5Indonesia 22.6 22.1 22.0 2.6 1.0 1.5 29.2 29.0 29.1Iran, Islamic Republic of 10.9 13.8 14.0 1.6 1.7 2.4 1.3 1.3 1.3Japan 17.6 17.4 17.4 2.1 2.1 2.0 3.2 3.3 3.3Korea, D.P.R. 2.7 2.6 2.6 0.2 0.3 0.4 82.9 84.1 84.1Korea, Republic.of 10.3 10.1 10.5 1.9 2.1 2.4 4.3 4.4 4.3Malaysia 3.7 3.8 3.9 0.1 0.1 0.1 1.6 1.6 1.7Pakistan 5.6 6.1 6.4 1.5 1.4 1.2 10.5 11.1 11.1Philippines 8.0 8.0 8.4 0.4 0.8 1.1 18.3 18.5 18.5Saudi Arabia 12.5 14.9 15.6 3.9 3.6 3.6 3.1 3.0 2.9Thailand 4.3 4.6 4.8 0.6 0.6 0.2 2.7 2.7 2.6Turkey 15.5 16.0 15.9 2.2 1.9 2.0 20.0 19.8 19.7Viet Nam 10.6 13.9 14.8 1.0 1.5 1.6 5.9 6.4 6.7
AFRICA 139.5 145.0 148.0 18.8 17.5 22.5 72.3 72.5 72.1Algeria 5.9 6.2 6.5 1.7 1.6 1.6 18.8 18.2 17.9Egypt 16.5 16.1 16.7 1.6 1.6 1.6 45.3 44.4 44.0Ethiopia 16.0 16.9 17.1 1.8 2.1 1.9 124.8 124.4 124.1Morocco 5.0 4.8 5.2 1.5 1.0 1.8 51.1 51.1 51.2Nigeria 17.7 19.4 19.0 0.5 0.4 0.4 71.8 74.8 74.6South Africa 11.9 11.7 12.2 2.1 1.4 4.7 92.3 91.7 91.4Sudan 4.7 6.0 6.2 0.7 1.4 1.8 103.9 109.6 110.7Tanzania, United Rep. of 6.4 6.4 6.5 1.4 1.5 1.6 86.8 86.2 86.6
CENTRAL AMERICA 51.4 54.3 55.7 6.4 10.2 10.3 93.9 94.2 94.4Mexico 42.5 45.1 46.3 3.1 6.3 6.7 131.7 132.2 132.2
SOUTH AMERICA 100.3 105.4 111.0 26.5 25.5 39.0 28.0 28.3 28.1Argentina 18.2 22.2 22.4 4.8 5.9 8.4 7.2 7.0 7.0Brazil 58.7 59.5 64.8 11.2 5.3 15.2 25.0 25.2 25.2Chile 3.1 3.2 3.2 2.2 2.5 2.6 24.4 24.8 25.1Colombia 7.0 7.3 7.4 0.3 0.3 0.1 40.4 40.9 41.4Peru 3.8 4.1 4.2 2.5 4.0 4.9 26.1 26.2 26.4Venezuela 4.4 3.9 3.7 1.4 0.1 0.1 60.7 61.3 56.4
NORTH AMERICA 330.2 347.7 347.9 47.4 67.7 67.2 17.9 17.9 17.9Canada 20.2 19.8 20.3 4.2 5.5 5.0 4.7 4.7 4.6United States of America 310.0 327.9 327.6 43.1 62.2 62.1 19.4 19.4 19.4
EUROPE 222.3 222.0 217.4 32.9 31.5 33.1 20.8 20.5 20.4European Union 161.7 161.3 160.4 21.2 17.2 16.2 19.4 19.1 19.1Russian Federation 31.2 32.2 30.9 3.5 6.1 8.4 21.3 20.7 20.6Serbia 4.9 5.5 3.7 0.5 0.5 0.5 22.4 22.9 22.9Ukraine 14.6 13.3 12.7 5.2 4.4 3.6 30.9 29.4 29.0
OCEANIA 6.9 7.9 7.2 2.2 3.3 1.5 8.1 8.1 8.1Australia 6.1 7.1 6.4 2.1 3.1 1.4 9.7 9.7 9.6
WORLD 1 286.4 1 338.0 1 351.8 265.9 289.1 291.3 27.2 27.4 27.5Developing countries 689.3 721.9 741.0 176.3 178.5 177.2 28.9 29.2 29.3Developed countries 597.1 616.0 610.8 89.6 110.6 114.1 20.0 19.7 19.7LIFDC 151.7 160.3 162.4 17.8 18.8 20.9 38.0 38.3 38.4LDC 77.3 81.7 83.6 11.4 12.3 13.1 56.9 57.0 57.2
APPENDIX TABLE 3(B): COARSE GRAIN STATISTICS
Total Utilization Stocks ending in Per caput food use
(. . . . . . . . . . . . . . . . . . . . . . . . . million tonnes . . . . . . . . . . . . . . . . . . . . . . . . . ) (. . . . . . . . . . . Kg/year . . . . . . . . . . . )
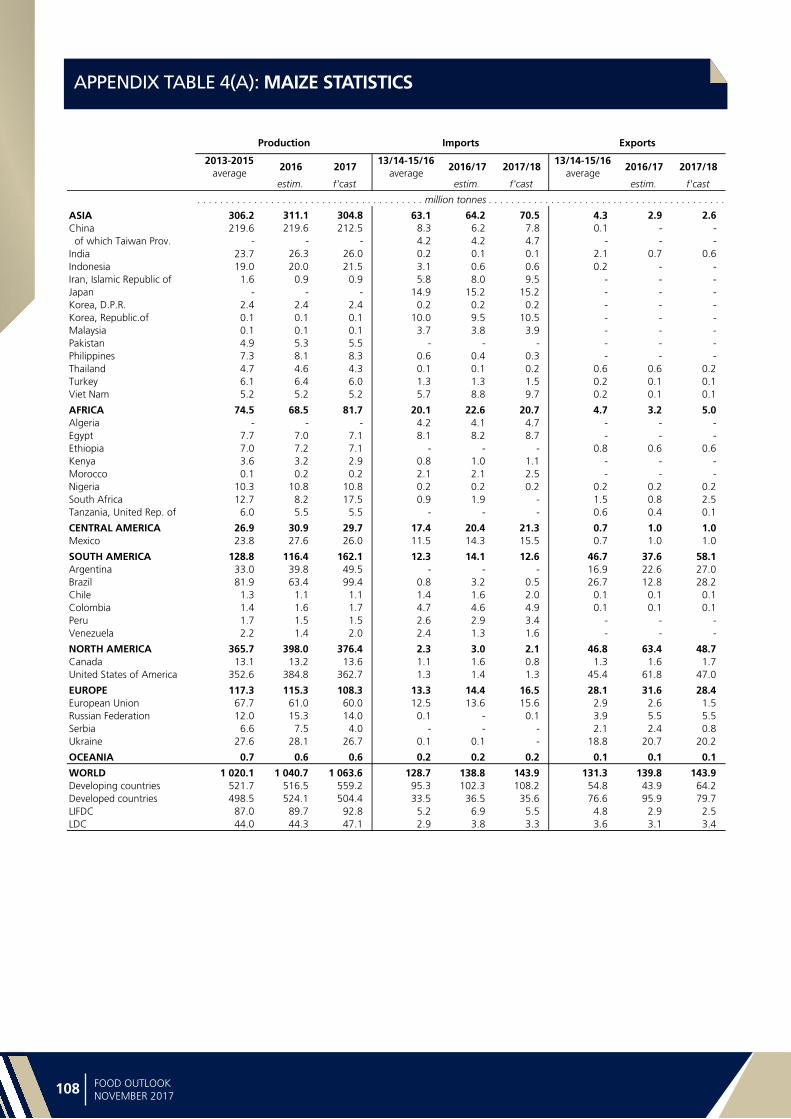
Sta
tist
ica
l a
pp
en
dix
108 109FOOD OUTLOOKNOVEMBER 2017
APPENDIX TABLE 4(A): MAIZE STATISTICS
2013-2015
average2016 2017
13/14-15/16average
2016/17 2017/1813/14-15/16
average2016/17 2017/18
estim. f'cast estim. f'cast estim. f'cast
ASIA 306.2 311.1 304.8 63.1 64.2 70.5 4.3 2.9 2.6China 219.6 219.6 212.5 8.3 6.2 7.8 0.1 - - of which Taiwan Prov. - - - 4.2 4.2 4.7 - - -India 23.7 26.3 26.0 0.2 0.1 0.1 2.1 0.7 0.6Indonesia 19.0 20.0 21.5 3.1 0.6 0.6 0.2 - -Iran, Islamic Republic of 1.6 0.9 0.9 5.8 8.0 9.5 - - -Japan - - - 14.9 15.2 15.2 - - -Korea, D.P.R. 2.4 2.4 2.4 0.2 0.2 0.2 - - -Korea, Republic.of 0.1 0.1 0.1 10.0 9.5 10.5 - - -Malaysia 0.1 0.1 0.1 3.7 3.8 3.9 - - -Pakistan 4.9 5.3 5.5 - - - - - -Philippines 7.3 8.1 8.3 0.6 0.4 0.3 - - -Thailand 4.7 4.6 4.3 0.1 0.1 0.2 0.6 0.6 0.2Turkey 6.1 6.4 6.0 1.3 1.3 1.5 0.2 0.1 0.1Viet Nam 5.2 5.2 5.2 5.7 8.8 9.7 0.2 0.1 0.1
AFRICA 74.5 68.5 81.7 20.1 22.6 20.7 4.7 3.2 5.0Algeria - - - 4.2 4.1 4.7 - - -Egypt 7.7 7.0 7.1 8.1 8.2 8.7 - - -Ethiopia 7.0 7.2 7.1 - - - 0.8 0.6 0.6Kenya 3.6 3.2 2.9 0.8 1.0 1.1 - - -Morocco 0.1 0.2 0.2 2.1 2.1 2.5 - - -Nigeria 10.3 10.8 10.8 0.2 0.2 0.2 0.2 0.2 0.2South Africa 12.7 8.2 17.5 0.9 1.9 - 1.5 0.8 2.5Tanzania, United Rep. of 6.0 5.5 5.5 - - - 0.6 0.4 0.1
CENTRAL AMERICA 26.9 30.9 29.7 17.4 20.4 21.3 0.7 1.0 1.0Mexico 23.8 27.6 26.0 11.5 14.3 15.5 0.7 1.0 1.0
SOUTH AMERICA 128.8 116.4 162.1 12.3 14.1 12.6 46.7 37.6 58.1Argentina 33.0 39.8 49.5 - - - 16.9 22.6 27.0Brazil 81.9 63.4 99.4 0.8 3.2 0.5 26.7 12.8 28.2Chile 1.3 1.1 1.1 1.4 1.6 2.0 0.1 0.1 0.1Colombia 1.4 1.6 1.7 4.7 4.6 4.9 0.1 0.1 0.1Peru 1.7 1.5 1.5 2.6 2.9 3.4 - - -Venezuela 2.2 1.4 2.0 2.4 1.3 1.6 - - -
NORTH AMERICA 365.7 398.0 376.4 2.3 3.0 2.1 46.8 63.4 48.7Canada 13.1 13.2 13.6 1.1 1.6 0.8 1.3 1.6 1.7United States of America 352.6 384.8 362.7 1.3 1.4 1.3 45.4 61.8 47.0
EUROPE 117.3 115.3 108.3 13.3 14.4 16.5 28.1 31.6 28.4European Union 67.7 61.0 60.0 12.5 13.6 15.6 2.9 2.6 1.5Russian Federation 12.0 15.3 14.0 0.1 - 0.1 3.9 5.5 5.5Serbia 6.6 7.5 4.0 - - - 2.1 2.4 0.8Ukraine 27.6 28.1 26.7 0.1 0.1 - 18.8 20.7 20.2
OCEANIA 0.7 0.6 0.6 0.2 0.2 0.2 0.1 0.1 0.1
WORLD 1 020.1 1 040.7 1 063.6 128.7 138.8 143.9 131.3 139.8 143.9Developing countries 521.7 516.5 559.2 95.3 102.3 108.2 54.8 43.9 64.2Developed countries 498.5 524.1 504.4 33.5 36.5 35.6 76.6 95.9 79.7LIFDC 87.0 89.7 92.8 5.2 6.9 5.5 4.8 2.9 2.5LDC 44.0 44.3 47.1 2.9 3.8 3.3 3.6 3.1 3.4
APPENDIX TABLE 4(A): MAIZE STATISTICS
Production Imports Exports
. . . . . . . . . . . . . . . . . . . . . . . . . . . . . . . . . . . . . . . . million tonnes . . . . . . . . . . . . . . . . . . . . . . . . . . . . . . . . . . . . . . . . . .
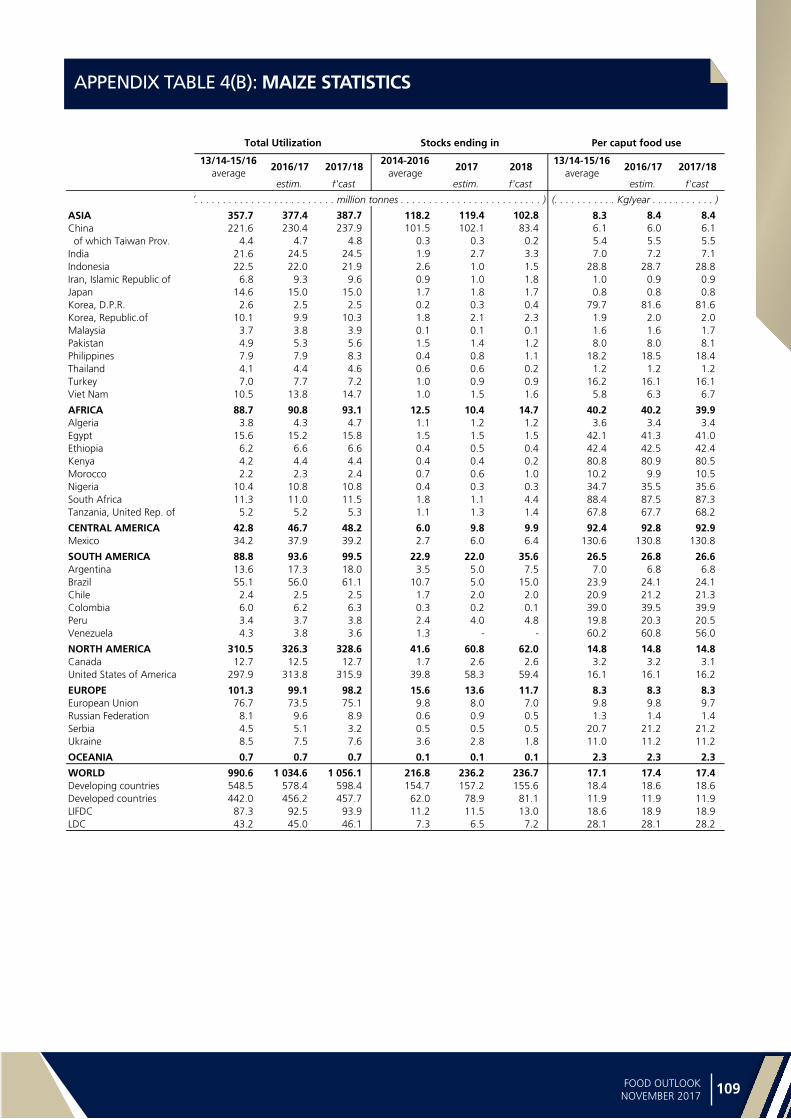
Statistica
l ap
pe
nd
ix
108 109FOOD OUTLOOKNOVEMBER 2017
APPENDIX TABLE 4(B): MAIZE STATISTICS
13/14-15/16
average2016/17 2017/18
2014-2016average
2017 201813/14-15/16
average2016/17 2017/18
estim. f'cast estim. f'cast estim. f'cast
ASIA 357.7 377.4 387.7 118.2 119.4 102.8 8.3 8.4 8.4China 221.6 230.4 237.9 101.5 102.1 83.4 6.1 6.0 6.1 of which Taiwan Prov. 4.4 4.7 4.8 0.3 0.3 0.2 5.4 5.5 5.5India 21.6 24.5 24.5 1.9 2.7 3.3 7.0 7.2 7.1Indonesia 22.5 22.0 21.9 2.6 1.0 1.5 28.8 28.7 28.8Iran, Islamic Republic of 6.8 9.3 9.6 0.9 1.0 1.8 1.0 0.9 0.9Japan 14.6 15.0 15.0 1.7 1.8 1.7 0.8 0.8 0.8Korea, D.P.R. 2.6 2.5 2.5 0.2 0.3 0.4 79.7 81.6 81.6Korea, Republic.of 10.1 9.9 10.3 1.8 2.1 2.3 1.9 2.0 2.0Malaysia 3.7 3.8 3.9 0.1 0.1 0.1 1.6 1.6 1.7Pakistan 4.9 5.3 5.6 1.5 1.4 1.2 8.0 8.0 8.1Philippines 7.9 7.9 8.3 0.4 0.8 1.1 18.2 18.5 18.4Thailand 4.1 4.4 4.6 0.6 0.6 0.2 1.2 1.2 1.2Turkey 7.0 7.7 7.2 1.0 0.9 0.9 16.2 16.1 16.1Viet Nam 10.5 13.8 14.7 1.0 1.5 1.6 5.8 6.3 6.7
AFRICA 88.7 90.8 93.1 12.5 10.4 14.7 40.2 40.2 39.9Algeria 3.8 4.3 4.7 1.1 1.2 1.2 3.6 3.4 3.4Egypt 15.6 15.2 15.8 1.5 1.5 1.5 42.1 41.3 41.0Ethiopia 6.2 6.6 6.6 0.4 0.5 0.4 42.4 42.5 42.4Kenya 4.2 4.4 4.4 0.4 0.4 0.2 80.8 80.9 80.5Morocco 2.2 2.3 2.4 0.7 0.6 1.0 10.2 9.9 10.5Nigeria 10.4 10.8 10.8 0.4 0.3 0.3 34.7 35.5 35.6South Africa 11.3 11.0 11.5 1.8 1.1 4.4 88.4 87.5 87.3Tanzania, United Rep. of 5.2 5.2 5.3 1.1 1.3 1.4 67.8 67.7 68.2
CENTRAL AMERICA 42.8 46.7 48.2 6.0 9.8 9.9 92.4 92.8 92.9Mexico 34.2 37.9 39.2 2.7 6.0 6.4 130.6 130.8 130.8
SOUTH AMERICA 88.8 93.6 99.5 22.9 22.0 35.6 26.5 26.8 26.6Argentina 13.6 17.3 18.0 3.5 5.0 7.5 7.0 6.8 6.8Brazil 55.1 56.0 61.1 10.7 5.0 15.0 23.9 24.1 24.1Chile 2.4 2.5 2.5 1.7 2.0 2.0 20.9 21.2 21.3Colombia 6.0 6.2 6.3 0.3 0.2 0.1 39.0 39.5 39.9Peru 3.4 3.7 3.8 2.4 4.0 4.8 19.8 20.3 20.5Venezuela 4.3 3.8 3.6 1.3 - - 60.2 60.8 56.0
NORTH AMERICA 310.5 326.3 328.6 41.6 60.8 62.0 14.8 14.8 14.8Canada 12.7 12.5 12.7 1.7 2.6 2.6 3.2 3.2 3.1United States of America 297.9 313.8 315.9 39.8 58.3 59.4 16.1 16.1 16.2
EUROPE 101.3 99.1 98.2 15.6 13.6 11.7 8.3 8.3 8.3European Union 76.7 73.5 75.1 9.8 8.0 7.0 9.8 9.8 9.7Russian Federation 8.1 9.6 8.9 0.6 0.9 0.5 1.3 1.4 1.4Serbia 4.5 5.1 3.2 0.5 0.5 0.5 20.7 21.2 21.2Ukraine 8.5 7.5 7.6 3.6 2.8 1.8 11.0 11.2 11.2
OCEANIA 0.7 0.7 0.7 0.1 0.1 0.1 2.3 2.3 2.3
WORLD 990.6 1 034.6 1 056.1 216.8 236.2 236.7 17.1 17.4 17.4Developing countries 548.5 578.4 598.4 154.7 157.2 155.6 18.4 18.6 18.6Developed countries 442.0 456.2 457.7 62.0 78.9 81.1 11.9 11.9 11.9LIFDC 87.3 92.5 93.9 11.2 11.5 13.0 18.6 18.9 18.9LDC 43.2 45.0 46.1 7.3 6.5 7.2 28.1 28.1 28.2
APPENDIX TABLE 4(B): MAIZE STATISTICS
Total Utilization Stocks ending in Per caput food use
(. . . . . . . . . . . . . . . . . . . . . . . . . million tonnes . . . . . . . . . . . . . . . . . . . . . . . . . ) (. . . . . . . . . . . Kg/year . . . . . . . . . . . )
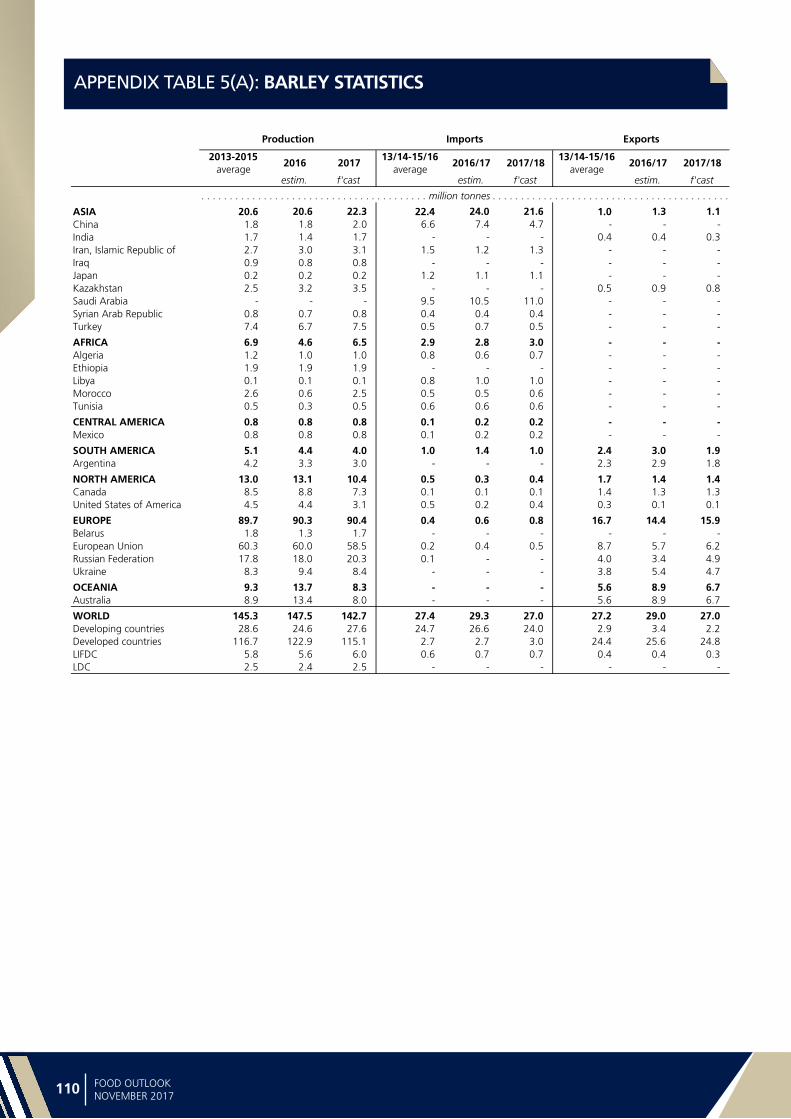
Sta
tist
ica
l a
pp
en
dix
110 111FOOD OUTLOOKNOVEMBER 2017
APPENDIX TABLE 5(A): BARLEY STATISTICS
2013-2015
average2016 2017
13/14-15/16average
2016/17 2017/1813/14-15/16
average2016/17 2017/18
estim. f'cast estim. f'cast estim. f'cast
ASIA 20.6 20.6 22.3 22.4 24.0 21.6 1.0 1.3 1.1China 1.8 1.8 2.0 6.6 7.4 4.7 - - -India 1.7 1.4 1.7 - - - 0.4 0.4 0.3Iran, Islamic Republic of 2.7 3.0 3.1 1.5 1.2 1.3 - - -Iraq 0.9 0.8 0.8 - - - - - -Japan 0.2 0.2 0.2 1.2 1.1 1.1 - - -Kazakhstan 2.5 3.2 3.5 - - - 0.5 0.9 0.8Saudi Arabia - - - 9.5 10.5 11.0 - - -Syrian Arab Republic 0.8 0.7 0.8 0.4 0.4 0.4 - - -Turkey 7.4 6.7 7.5 0.5 0.7 0.5 - - -
AFRICA 6.9 4.6 6.5 2.9 2.8 3.0 - - -Algeria 1.2 1.0 1.0 0.8 0.6 0.7 - - -Ethiopia 1.9 1.9 1.9 - - - - - -Libya 0.1 0.1 0.1 0.8 1.0 1.0 - - -Morocco 2.6 0.6 2.5 0.5 0.5 0.6 - - -Tunisia 0.5 0.3 0.5 0.6 0.6 0.6 - - -
CENTRAL AMERICA 0.8 0.8 0.8 0.1 0.2 0.2 - - -Mexico 0.8 0.8 0.8 0.1 0.2 0.2 - - -
SOUTH AMERICA 5.1 4.4 4.0 1.0 1.4 1.0 2.4 3.0 1.9Argentina 4.2 3.3 3.0 - - - 2.3 2.9 1.8
NORTH AMERICA 13.0 13.1 10.4 0.5 0.3 0.4 1.7 1.4 1.4Canada 8.5 8.8 7.3 0.1 0.1 0.1 1.4 1.3 1.3United States of America 4.5 4.4 3.1 0.5 0.2 0.4 0.3 0.1 0.1
EUROPE 89.7 90.3 90.4 0.4 0.6 0.8 16.7 14.4 15.9Belarus 1.8 1.3 1.7 - - - - - -European Union 60.3 60.0 58.5 0.2 0.4 0.5 8.7 5.7 6.2Russian Federation 17.8 18.0 20.3 0.1 - - 4.0 3.4 4.9Ukraine 8.3 9.4 8.4 - - - 3.8 5.4 4.7
OCEANIA 9.3 13.7 8.3 - - - 5.6 8.9 6.7Australia 8.9 13.4 8.0 - - - 5.6 8.9 6.7
WORLD 145.3 147.5 142.7 27.4 29.3 27.0 27.2 29.0 27.0Developing countries 28.6 24.6 27.6 24.7 26.6 24.0 2.9 3.4 2.2Developed countries 116.7 122.9 115.1 2.7 2.7 3.0 24.4 25.6 24.8LIFDC 5.8 5.6 6.0 0.6 0.7 0.7 0.4 0.4 0.3LDC 2.5 2.4 2.5 - - - - - -
APPENDIX TABLE 5(A): BARLEY STATISTICS
Production Imports Exports
. . . . . . . . . . . . . . . . . . . . . . . . . . . . . . . . . . . . . . . . million tonnes . . . . . . . . . . . . . . . . . . . . . . . . . . . . . . . . . . . . . . . . . .

Statistica
l ap
pe
nd
ix
110 111FOOD OUTLOOKNOVEMBER 2017
APPENDIX TABLE 5(B): BARLEY STATISTICS
13/14-15/16
average2016/17 2017/18
2014-2016average
2017 201813/14-15/16
average2016/17 2017/18
estim. f'cast estim. f'cast estim. f'cast
ASIA 40.9 43.9 42.5 10.3 11.0 12.2 0.6 0.6 0.6China 8.1 8.9 7.9 1.9 2.2 1.8 0.2 0.2 0.2India 1.3 1.1 1.4 - - - 0.9 0.7 0.9Iran, Islamic Republic of 4.0 4.5 4.4 0.6 0.7 0.6 0.3 0.3 0.3Iraq 0.9 0.8 0.8 - - - 3.7 3.5 3.4Japan 1.4 1.4 1.4 0.2 0.2 0.2 2.3 2.3 2.4Kazakhstan 2.0 2.1 1.9 0.3 0.6 1.4 1.1 1.1 1.1Saudi Arabia 9.0 11.2 11.0 3.6 3.3 3.3 0.9 0.9 0.9Syrian Arab Republic 1.3 1.3 1.1 0.5 0.3 0.5 14.5 15.2 15.3Turkey 7.7 7.6 7.9 1.2 0.9 1.0 1.1 1.0 1.0
AFRICA 9.3 8.9 9.1 2.1 1.4 1.8 3.3 3.2 3.2Algeria 2.0 1.8 1.7 0.6 0.4 0.4 15.2 14.8 14.5Ethiopia 1.9 1.9 1.9 0.1 0.1 - 16.3 16.2 16.0Libya 0.9 1.1 1.1 - - - 13.4 13.2 13.0Morocco 2.7 2.4 2.7 0.9 0.4 0.8 40.8 41.1 40.6Tunisia 1.1 1.0 1.0 0.4 0.3 0.4 8.1 7.9 7.8
CENTRAL AMERICA 0.9 0.9 0.9 0.1 0.1 0.1 - - -Mexico 0.9 0.9 0.9 0.1 0.1 0.1 - - -
SOUTH AMERICA 3.4 3.5 3.2 0.7 0.5 0.6 0.5 0.5 0.5Argentina 1.7 1.3 1.3 0.6 0.3 0.5 - - -
NORTH AMERICA 10.7 10.2 10.1 3.4 4.4 2.9 0.5 0.5 0.5Canada 6.2 5.8 6.0 1.5 2.1 1.4 0.3 0.3 0.3United States of America 4.5 4.4 4.1 1.9 2.3 1.5 0.6 0.5 0.5
EUROPE 72.4 76.3 73.0 10.9 11.0 13.3 1.0 1.0 0.9Belarus 1.7 1.6 1.6 0.4 0.3 0.4 - - -European Union 51.4 55.7 53.3 7.7 6.0 5.5 0.8 0.7 0.7Russian Federation 13.4 13.2 12.9 1.5 3.5 6.1 1.2 1.2 1.2Ukraine 4.4 4.2 3.6 1.1 0.9 1.0 3.2 2.8 2.6
OCEANIA 3.8 4.4 4.1 1.0 1.8 0.6 0.2 0.2 0.1Australia 3.4 4.0 3.7 0.9 1.7 0.5 0.3 0.2 0.2
WORLD 141.5 148.1 142.9 28.5 30.2 31.4 1.1 1.0 1.1Developing countries 48.9 51.3 50.0 11.0 9.5 9.9 1.1 1.1 1.1Developed countries 92.6 96.8 92.9 17.4 20.7 21.5 1.0 0.9 0.9LIFDC 6.0 6.0 6.0 1.0 1.0 1.3 1.2 1.2 1.3LDC 2.5 2.5 2.5 0.2 0.2 0.2 1.9 1.8 1.8
APPENDIX TABLE 5(B): BARLEY STATISTICS
Total Utilization Stocks ending in Per caput food use
(. . . . . . . . . . . . . . . . . . . . . . . . . million tonnes . . . . . . . . . . . . . . . . . . . . . . . . . ) (. . . . . . . . . . . Kg/year . . . . . . . . . . . )

Sta
tist
ica
l a
pp
en
dix
112 113FOOD OUTLOOKNOVEMBER 2017
APPENDIX TABLE 6(A): SORGHUM STATISTICS
APPENDIX TABLE 7(A): OTHER COARSE GRAIN STATISTICS: MILLET, RYE, OATS AND OTHER GRAINS
2013-2015
average2016 2017
13/14-15/16average
2016/17 2017/1813/14-15/16
average2016/17 2017/18
estim. f'cast estim. f'cast estim. f'cast
ASIA 8.8 8.4 9.1 8.4 6.3 5.3 0.1 - -China 2.9 3.0 3.3 7.3 5.7 4.6 - - -India 5.0 4.6 5.0 - - - 0.1 - -Japan - - - 1.0 0.5 0.6 - - -
AFRICA 25.1 28.4 28.0 1.0 1.0 1.0 1.0 0.9 1.2Burkina Faso 1.7 1.7 1.7 - - - 0.2 - -Ethiopia 4.1 4.4 4.3 0.1 - - 0.4 0.3 0.3Nigeria 5.9 6.9 6.5 - - - - - -Sudan 3.6 5.9 5.6 0.3 0.2 0.1 0.5 0.4 0.6
CENTRAL AMERICA 6.8 5.4 5.3 0.6 0.8 0.7 - - -Mexico 6.5 5.0 5.0 0.6 0.8 0.7 - - -
SOUTH AMERICA 6.6 5.0 5.2 0.4 0.3 0.4 1.1 0.4 0.6Argentina 3.4 3.0 2.5 - - - 1.0 0.4 0.6Brazil 2.2 1.2 1.9 - - - - - -Venezuela 0.1 0.1 0.1 - - - - - -
NORTH AMERICA 12.1 12.2 9.3 0.1 0.1 - 7.4 6.1 5.4United States of America 12.1 12.2 9.3 0.1 - - 7.4 6.1 5.4
EUROPE 1.2 1.2 1.1 0.1 0.2 0.2 0.1 0.1 0.1European Union 0.6 0.6 0.7 0.1 0.2 0.2 - - -
OCEANIA 1.9 1.8 1.0 0.1 - - 1.0 1.0 0.4Australia 1.9 1.8 1.0 - - - 1.0 1.0 0.4
WORLD 62.4 62.4 59.0 10.5 8.7 7.6 10.6 8.5 7.6Developing countries 47.1 47.0 47.5 9.2 7.8 6.7 2.1 1.4 1.8Developed countries 15.3 15.3 11.5 1.3 0.9 0.9 8.5 7.2 5.9LIFDC 29.8 32.7 32.5 1.0 0.8 0.8 1.0 0.9 1.2LDC 17.1 19.7 19.4 0.7 0.6 0.6 0.9 0.8 1.1
APPENDIX TABLE 6(A): SORGHUM STATISTICS
Production Imports Exports
. . . . . . . . . . . . . . . . . . . . . . . . . . . . . . . . . . . . . . . . million tonnes . . . . . . . . . . . . . . . . . . . . . . . . . . . . . . . . . . . . . . . . . .
2013-2015 average
2016 201713/14-15/16
average2016/17 2017/18
13/14-15/16average
2016/17 2017/18
estim. f'cast estim. f'cast estim. f'cast
ASIA 18.5 19.3 19.3 0.9 1.2 1.3 0.1 0.2 0.3
AFRICA 17.6 19.9 20.0 0.1 0.1 0.1 1.8 1.8 1.8
CENTRAL AMERICA 0.1 0.1 0.1 0.1 0.5 0.3 - - -
SOUTH AMERICA 1.8 2.3 2.0 0.3 0.3 0.4 0.1 0.1 0.1
NORTH AMERICA 5.5 5.5 5.6 2.1 2.1 2.2 2.1 2.0 2.4
EUROPE 47.7 46.2 46.0 0.6 0.4 0.7 0.7 0.5 0.6
OCEANIA 1.5 2.2 1.4 - 0.1 0.1 - - -0.1
WORLD 93.0 95.7 94.4 4.5 4.8 5.2 5.0 4.6 5.2
APPENDIX TABLE 7(A): OTHER COARSE GRAIN STATISTICS: MILLET, RYE, OATS AND OTHER GRAINS
Production Imports Exports
. . . . . . . . . . . . . . . . . . . . . . . . . . . . . . . . . . . . . . . . million tonnes . . . . . . . . . . . . . . . . . . . . . . . . . . . . . . . . . . . . . . . . . .
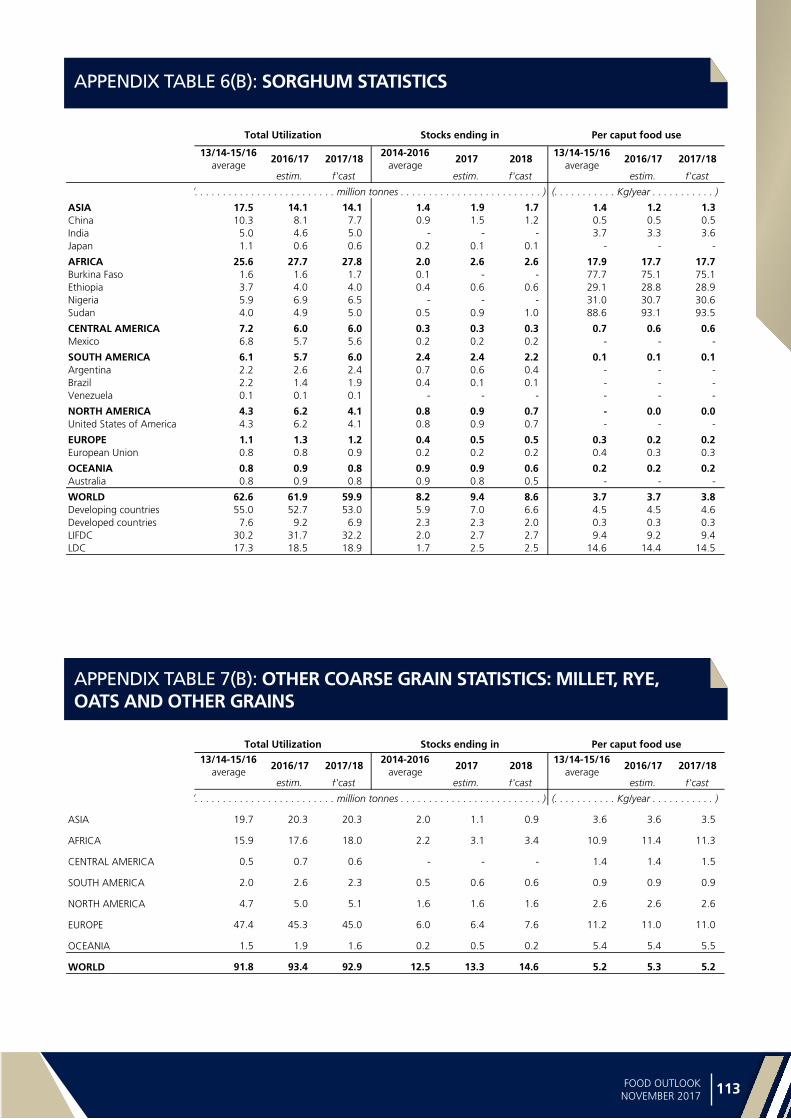
Statistica
l ap
pe
nd
ix
112 113FOOD OUTLOOKNOVEMBER 2017
APPENDIX TABLE 7(B): OTHER COARSE GRAIN STATISTICS: MILLET, RYE, OATS AND OTHER GRAINS
APPENDIX TABLE 6(B): SORGHUM STATISTICS
13/14-15/16
average2016/17 2017/18
2014-2016average
2017 201813/14-15/16
average2016/17 2017/18
estim. f'cast estim. f'cast estim. f'cast
ASIA 17.5 14.1 14.1 1.4 1.9 1.7 1.4 1.2 1.3China 10.3 8.1 7.7 0.9 1.5 1.2 0.5 0.5 0.5India 5.0 4.6 5.0 - - - 3.7 3.3 3.6Japan 1.1 0.6 0.6 0.2 0.1 0.1 - - -
AFRICA 25.6 27.7 27.8 2.0 2.6 2.6 17.9 17.7 17.7Burkina Faso 1.6 1.6 1.7 0.1 - - 77.7 75.1 75.1Ethiopia 3.7 4.0 4.0 0.4 0.6 0.6 29.1 28.8 28.9Nigeria 5.9 6.9 6.5 - - - 31.0 30.7 30.6Sudan 4.0 4.9 5.0 0.5 0.9 1.0 88.6 93.1 93.5
CENTRAL AMERICA 7.2 6.0 6.0 0.3 0.3 0.3 0.7 0.6 0.6Mexico 6.8 5.7 5.6 0.2 0.2 0.2 - - -
SOUTH AMERICA 6.1 5.7 6.0 2.4 2.4 2.2 0.1 0.1 0.1Argentina 2.2 2.6 2.4 0.7 0.6 0.4 - - -Brazil 2.2 1.4 1.9 0.4 0.1 0.1 - - -Venezuela 0.1 0.1 0.1 - - - - - -
NORTH AMERICA 4.3 6.2 4.1 0.8 0.9 0.7 - 0.0 0.0United States of America 4.3 6.2 4.1 0.8 0.9 0.7 - - -
EUROPE 1.1 1.3 1.2 0.4 0.5 0.5 0.3 0.2 0.2European Union 0.8 0.8 0.9 0.2 0.2 0.2 0.4 0.3 0.3
OCEANIA 0.8 0.9 0.8 0.9 0.9 0.6 0.2 0.2 0.2Australia 0.8 0.9 0.8 0.9 0.8 0.5 - - -
WORLD 62.6 61.9 59.9 8.2 9.4 8.6 3.7 3.7 3.8Developing countries 55.0 52.7 53.0 5.9 7.0 6.6 4.5 4.5 4.6Developed countries 7.6 9.2 6.9 2.3 2.3 2.0 0.3 0.3 0.3LIFDC 30.2 31.7 32.2 2.0 2.7 2.7 9.4 9.2 9.4LDC 17.3 18.5 18.9 1.7 2.5 2.5 14.6 14.4 14.5
APPENDIX TABLE 6(A): SORGHUM STATISTICS
Total Utilization Stocks ending in Per caput food use
(. . . . . . . . . . . . . . . . . . . . . . . . . million tonnes . . . . . . . . . . . . . . . . . . . . . . . . . ) (. . . . . . . . . . . Kg/year . . . . . . . . . . . )
13/14-15/16average
2016/17 2017/182014-2016
average2017 2018
13/14-15/16average
2016/17 2017/18
estim. f'cast estim. f'cast estim. f'cast
ASIA 19.7 20.3 20.3 2.0 1.1 0.9 3.6 3.6 3.5
AFRICA 15.9 17.6 18.0 2.2 3.1 3.4 10.9 11.4 11.3
CENTRAL AMERICA 0.5 0.7 0.6 - - - 1.4 1.4 1.5
SOUTH AMERICA 2.0 2.6 2.3 0.5 0.6 0.6 0.9 0.9 0.9
NORTH AMERICA 4.7 5.0 5.1 1.6 1.6 1.6 2.6 2.6 2.6
EUROPE 47.4 45.3 45.0 6.0 6.4 7.6 11.2 11.0 11.0
OCEANIA 1.5 1.9 1.6 0.2 0.5 0.2 5.4 5.4 5.5
WORLD 91.8 93.4 92.9 12.5 13.3 14.6 5.2 5.3 5.2
APPENDIX TABLE 7(A): OTHER COARSE GRAIN STATISTICS: MILLET, RYE, OATS AND OTHER GRAINS
Total Utilization Stocks ending in Per caput food use
(. . . . . . . . . . . . . . . . . . . . . . . . . million tonnes . . . . . . . . . . . . . . . . . . . . . . . . . ) (. . . . . . . . . . . Kg/year . . . . . . . . . . . )

Sta
tist
ica
l a
pp
en
dix
114 115FOOD OUTLOOKNOVEMBER 2017
APPENDIX TABLE 8(A): RICE STATISTICS
2013-2015
average2016 2017
2014-2016average
2017 20182014-2016
average2017 2018
estim. f'cast f'cast f'cast f'cast f'cast
ASIA 446.2 453.0 452.5 21.8 21.1 21.9 36.2 37.1 37.6Bangladesh 34.5 34.7 34.1 0.8 1.5 1.0 - - -China 142.4 142.9 143.0 6.6 6.4 6.4 0.4 0.9 1.2 of which Taiwan Prov. 1.2 1.2 1.2 0.1 0.1 0.1 0.1 - -India 105.5 110.2 109.5 - - - 10.9 11.2 10.7Indonesia 45.0 45.6 46.6 1.2 0.4 0.8 - - -Iran, Islamic Republic of 1.5 1.6 1.7 1.2 1.2 1.4 - - -Iraq 0.2 0.1 0.2 1.0 1.1 1.2 - - -Japan 7.8 7.7 7.6 0.7 0.7 0.7 0.1 - -Korea DPR 1.6 1.7 1.4 0.1 - - - - -Korea, Republic of 4.2 4.2 4.0 0.4 0.4 0.5 - - -Malaysia 1.9 1.9 2.0 1.0 0.8 1.0 0.1 - -Myanmar 16.8 17.1 17.3 - - - 1.6 2.0 2.2Pakistan 6.9 6.8 7.2 - - - 4.0 3.7 4.0Philippines 12.0 12.1 12.6 1.5 1.1 1.4 - - -Saudi Arabia - - - 1.4 1.3 1.5 - - -Sri Lanka 2.9 3.0 1.7 0.5 0.6 0.4 - - -Thailand 21.1 21.6 22.3 0.2 0.2 0.2 10.2 10.9 10.4Viet Nam 29.0 28.3 28.2 0.5 0.5 0.5 7.5 6.8 7.5
AFRICA 18.5 20.1 20.3 14.4 15.6 15.6 0.7 0.6 0.5Cote D'ivoire 0.5 0.5 0.5 1.3 1.5 1.5 - - -Egypt 4.2 4.3 4.4 0.1 0.1 - 0.4 0.2 0.2Madagascar 2.5 2.6 2.2 0.3 0.4 0.4 - - -Nigeria 2.8 3.0 3.2 2.6 2.6 2.9 - - -Senegal 0.4 0.7 0.8 1.3 1.2 1.2 - - -South Africa - - - 0.8 0.9 0.9 - - -Tanzania, United Rep. of 1.7 2.2 2.0 0.2 0.1 0.1 0.2 0.2 0.2
CENTRAL AMERICA 1.8 1.8 1.9 2.2 2.4 2.3 0.1 0.1 -Cuba 0.4 0.3 0.3 0.5 0.5 0.5 - - -Mexico 0.2 0.2 0.2 0.7 0.7 0.6 - 0.1 -
SOUTH AMERICA 16.9 16.0 17.3 1.6 1.8 1.7 3.1 3.0 3.1Argentina 1.1 1.0 0.9 - - - 0.4 0.5 0.4Brazil 8.2 7.2 8.4 0.5 0.8 0.7 0.8 0.5 0.7Peru 2.1 2.2 2.0 0.2 0.3 0.3 0.1 - -Uruguay 1.0 0.9 1.0 - - - 0.8 0.9 0.8
NORTH AMERICA 6.4 7.1 5.7 1.2 1.2 1.2 3.3 3.6 3.4Canada - - - 0.4 0.4 0.4 - - -United States of America 6.4 7.1 5.7 0.8 0.8 0.8 3.3 3.6 3.4
EUROPE 2.5 2.6 2.6 2.3 2.4 2.4 0.5 0.5 0.4European Union 1.8 1.8 1.8 1.7 1.8 1.8 0.3 0.3 0.2Russian Federation 0.7 0.7 0.7 0.2 0.2 0.2 0.2 0.2 0.2
OCEANIA 0.6 0.2 0.6 0.5 0.5 0.5 0.3 0.2 0.4Australia 0.6 0.2 0.5 0.2 0.2 0.2 0.3 0.2 0.4
WORLD 493.0 501.0 500.8 44.0 45.0 45.4 44.0 45.0 45.4Developing countries 475.1 482.7 483.8 38.4 39.2 39.7 39.9 40.7 41.1Developed countries 17.9 18.2 17.0 5.6 5.8 5.8 4.1 4.3 4.4LIFDC 166.9 173.5 172.1 15.5 17.2 16.9 15.1 15.3 15.0LDC 73.6 76.1 75.4 10.1 11.3 10.6 3.3 3.6 3.8
APPENDIX TABLE 8(A): RICE STATISTICS
Production Imports Exports
. . . . . . . . . . . . . . . . . . . . . . . . . . . . . . . . . million tonnes, milled equivalent . . . . . . . . . . . . . . . . . . . . . . . . . . . . . . . . . . .
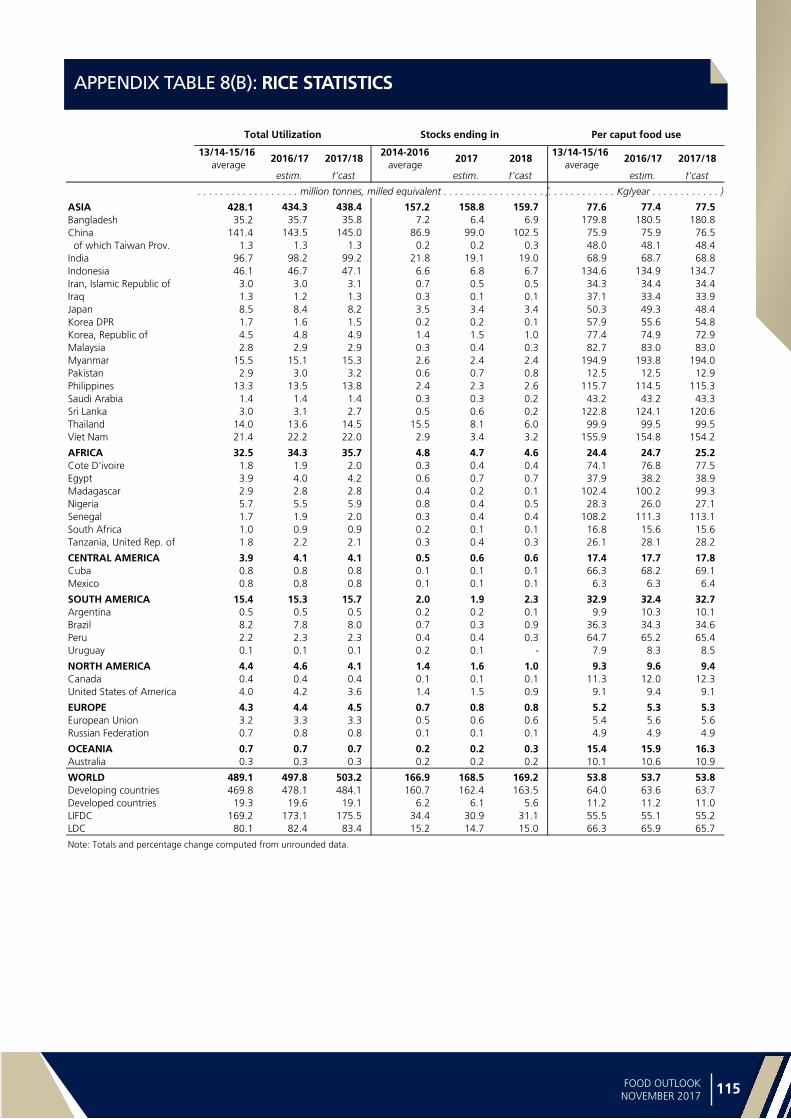
Statistica
l ap
pe
nd
ix
114 115FOOD OUTLOOKNOVEMBER 2017
APPENDIX TABLE 8(B): RICE STATISTICS
13/14-15/16
average2016/17 2017/18
2014-2016average
2017 201813/14-15/16
average2016/17 2017/18
estim. f'cast estim. f'cast estim. f'cast
ASIA 428.1 434.3 438.4 157.2 158.8 159.7 77.6 77.4 77.5Bangladesh 35.2 35.7 35.8 7.2 6.4 6.9 179.8 180.5 180.8China 141.4 143.5 145.0 86.9 99.0 102.5 75.9 75.9 76.5 of which Taiwan Prov. 1.3 1.3 1.3 0.2 0.2 0.3 48.0 48.1 48.4India 96.7 98.2 99.2 21.8 19.1 19.0 68.9 68.7 68.8Indonesia 46.1 46.7 47.1 6.6 6.8 6.7 134.6 134.9 134.7Iran, Islamic Republic of 3.0 3.0 3.1 0.7 0.5 0.5 34.3 34.4 34.4Iraq 1.3 1.2 1.3 0.3 0.1 0.1 37.1 33.4 33.9Japan 8.5 8.4 8.2 3.5 3.4 3.4 50.3 49.3 48.4Korea DPR 1.7 1.6 1.5 0.2 0.2 0.1 57.9 55.6 54.8Korea, Republic of 4.5 4.8 4.9 1.4 1.5 1.0 77.4 74.9 72.9Malaysia 2.8 2.9 2.9 0.3 0.4 0.3 82.7 83.0 83.0Myanmar 15.5 15.1 15.3 2.6 2.4 2.4 194.9 193.8 194.0Pakistan 2.9 3.0 3.2 0.6 0.7 0.8 12.5 12.5 12.9Philippines 13.3 13.5 13.8 2.4 2.3 2.6 115.7 114.5 115.3Saudi Arabia 1.4 1.4 1.4 0.3 0.3 0.2 43.2 43.2 43.3Sri Lanka 3.0 3.1 2.7 0.5 0.6 0.2 122.8 124.1 120.6Thailand 14.0 13.6 14.5 15.5 8.1 6.0 99.9 99.5 99.5Viet Nam 21.4 22.2 22.0 2.9 3.4 3.2 155.9 154.8 154.2
AFRICA 32.5 34.3 35.7 4.8 4.7 4.6 24.4 24.7 25.2Cote D'ivoire 1.8 1.9 2.0 0.3 0.4 0.4 74.1 76.8 77.5Egypt 3.9 4.0 4.2 0.6 0.7 0.7 37.9 38.2 38.9Madagascar 2.9 2.8 2.8 0.4 0.2 0.1 102.4 100.2 99.3Nigeria 5.7 5.5 5.9 0.8 0.4 0.5 28.3 26.0 27.1Senegal 1.7 1.9 2.0 0.3 0.4 0.4 108.2 111.3 113.1South Africa 1.0 0.9 0.9 0.2 0.1 0.1 16.8 15.6 15.6Tanzania, United Rep. of 1.8 2.2 2.1 0.3 0.4 0.3 26.1 28.1 28.2
CENTRAL AMERICA 3.9 4.1 4.1 0.5 0.6 0.6 17.4 17.7 17.8Cuba 0.8 0.8 0.8 0.1 0.1 0.1 66.3 68.2 69.1Mexico 0.8 0.8 0.8 0.1 0.1 0.1 6.3 6.3 6.4
SOUTH AMERICA 15.4 15.3 15.7 2.0 1.9 2.3 32.9 32.4 32.7Argentina 0.5 0.5 0.5 0.2 0.2 0.1 9.9 10.3 10.1Brazil 8.2 7.8 8.0 0.7 0.3 0.9 36.3 34.3 34.6Peru 2.2 2.3 2.3 0.4 0.4 0.3 64.7 65.2 65.4Uruguay 0.1 0.1 0.1 0.2 0.1 - 7.9 8.3 8.5
NORTH AMERICA 4.4 4.6 4.1 1.4 1.6 1.0 9.3 9.6 9.4Canada 0.4 0.4 0.4 0.1 0.1 0.1 11.3 12.0 12.3United States of America 4.0 4.2 3.6 1.4 1.5 0.9 9.1 9.4 9.1
EUROPE 4.3 4.4 4.5 0.7 0.8 0.8 5.2 5.3 5.3European Union 3.2 3.3 3.3 0.5 0.6 0.6 5.4 5.6 5.6Russian Federation 0.7 0.8 0.8 0.1 0.1 0.1 4.9 4.9 4.9
OCEANIA 0.7 0.7 0.7 0.2 0.2 0.3 15.4 15.9 16.3Australia 0.3 0.3 0.3 0.2 0.2 0.2 10.1 10.6 10.9
WORLD 489.1 497.8 503.2 166.9 168.5 169.2 53.8 53.7 53.8Developing countries 469.8 478.1 484.1 160.7 162.4 163.5 64.0 63.6 63.7Developed countries 19.3 19.6 19.1 6.2 6.1 5.6 11.2 11.2 11.0LIFDC 169.2 173.1 175.5 34.4 30.9 31.1 55.5 55.1 55.2LDC 80.1 82.4 83.4 15.2 14.7 15.0 66.3 65.9 65.7
Note: Totals and percentage change computed from unrounded data.
APPENDIX TABLE 8(A): RICE STATISTICS
Total Utilization Stocks ending in Per caput food use
. . . . . . . . . . . . . . . . . . million tonnes, milled equivalent . . . . . . . . . . . . . . . . . . )(. . . . . . . . . . . . Kg/year . . . . . . . . . . . . )
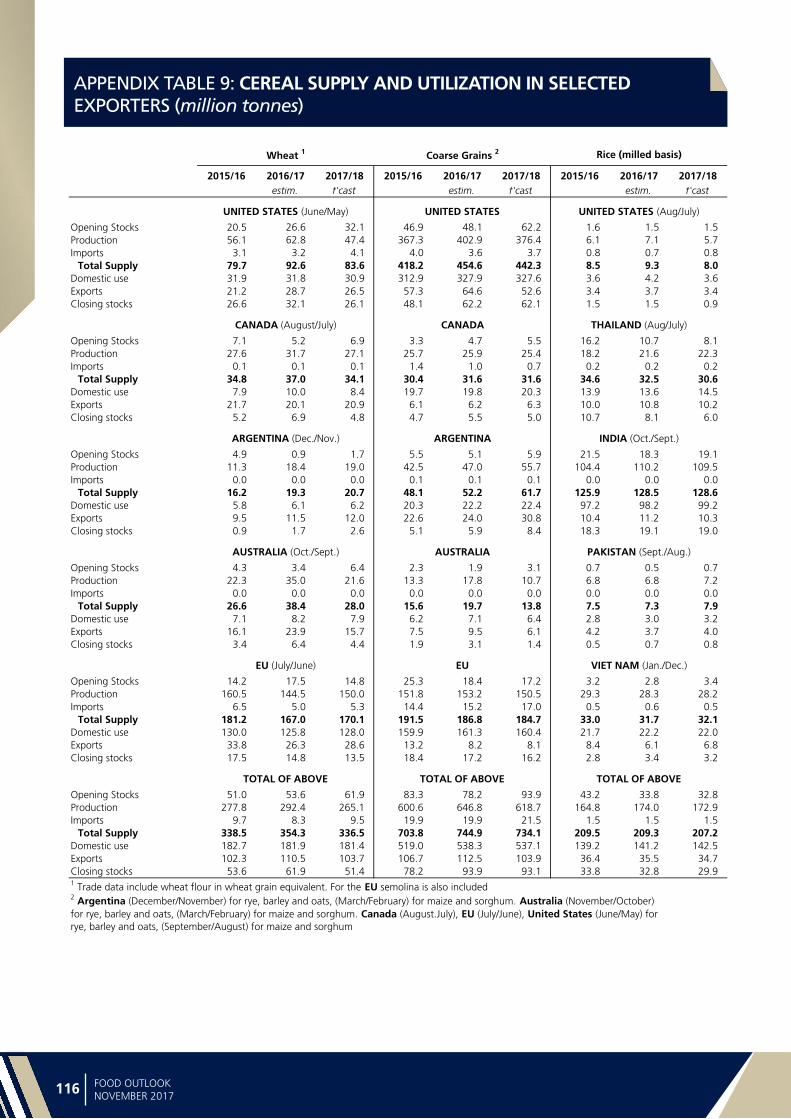
Sta
tist
ica
l a
pp
en
dix
116 117FOOD OUTLOOKNOVEMBER 2017
APPENDIX TABLE 9: CEREAL SUPPLY AND UTILIZATION IN SELECTED EXPORTERS (million tonnes)
2015/16 2016/17 2017/18 2015/16 2016/17 2017/18 2015/16 2016/17 2017/18estim. f'cast estim. f'cast estim. f'cast
Opening Stocks 20.5 26.6 32.1 46.9 48.1 62.2 1.6 1.5 1.5Production 56.1 62.8 47.4 367.3 402.9 376.4 6.1 7.1 5.7Imports 3.1 3.2 4.1 4.0 3.6 3.7 0.8 0.7 0.8
Total Supply 79.7 92.6 83.6 418.2 454.6 442.3 8.5 9.3 8.0Domestic use 31.9 31.8 30.9 312.9 327.9 327.6 3.6 4.2 3.6Exports 21.2 28.7 26.5 57.3 64.6 52.6 3.4 3.7 3.4Closing stocks 26.6 32.1 26.1 48.1 62.2 62.1 1.5 1.5 0.9
Opening Stocks 7.1 5.2 6.9 3.3 4.7 5.5 16.2 10.7 8.1Production 27.6 31.7 27.1 25.7 25.9 25.4 18.2 21.6 22.3Imports 0.1 0.1 0.1 1.4 1.0 0.7 0.2 0.2 0.2
Total Supply 34.8 37.0 34.1 30.4 31.6 31.6 34.6 32.5 30.6Domestic use 7.9 10.0 8.4 19.7 19.8 20.3 13.9 13.6 14.5Exports 21.7 20.1 20.9 6.1 6.2 6.3 10.0 10.8 10.2Closing stocks 5.2 6.9 4.8 4.7 5.5 5.0 10.7 8.1 6.0
Opening Stocks 4.9 0.9 1.7 5.5 5.1 5.9 21.5 18.3 19.1Production 11.3 18.4 19.0 42.5 47.0 55.7 104.4 110.2 109.5Imports 0.0 0.0 0.0 0.1 0.1 0.1 0.0 0.0 0.0
Total Supply 16.2 19.3 20.7 48.1 52.2 61.7 125.9 128.5 128.6Domestic use 5.8 6.1 6.2 20.3 22.2 22.4 97.2 98.2 99.2Exports 9.5 11.5 12.0 22.6 24.0 30.8 10.4 11.2 10.3Closing stocks 0.9 1.7 2.6 5.1 5.9 8.4 18.3 19.1 19.0
Opening Stocks 4.3 3.4 6.4 2.3 1.9 3.1 0.7 0.5 0.7Production 22.3 35.0 21.6 13.3 17.8 10.7 6.8 6.8 7.2Imports 0.0 0.0 0.0 0.0 0.0 0.0 0.0 0.0 0.0
Total Supply 26.6 38.4 28.0 15.6 19.7 13.8 7.5 7.3 7.9Domestic use 7.1 8.2 7.9 6.2 7.1 6.4 2.8 3.0 3.2Exports 16.1 23.9 15.7 7.5 9.5 6.1 4.2 3.7 4.0Closing stocks 3.4 6.4 4.4 1.9 3.1 1.4 0.5 0.7 0.8
Opening Stocks 14.2 17.5 14.8 25.3 18.4 17.2 3.2 2.8 3.4Production 160.5 144.5 150.0 151.8 153.2 150.5 29.3 28.3 28.2Imports 6.5 5.0 5.3 14.4 15.2 17.0 0.5 0.6 0.5
Total Supply 181.2 167.0 170.1 191.5 186.8 184.7 33.0 31.7 32.1Domestic use 130.0 125.8 128.0 159.9 161.3 160.4 21.7 22.2 22.0Exports 33.8 26.3 28.6 13.2 8.2 8.1 8.4 6.1 6.8Closing stocks 17.5 14.8 13.5 18.4 17.2 16.2 2.8 3.4 3.2
Opening Stocks 51.0 53.6 61.9 83.3 78.2 93.9 43.2 33.8 32.8Production 277.8 292.4 265.1 600.6 646.8 618.7 164.8 174.0 172.9Imports 9.7 8.3 9.5 19.9 19.9 21.5 1.5 1.5 1.5
Total Supply 338.5 354.3 336.5 703.8 744.9 734.1 209.5 209.3 207.2Domestic use 182.7 181.9 181.4 519.0 538.3 537.1 139.2 141.2 142.5Exports 102.3 110.5 103.7 106.7 112.5 103.9 36.4 35.5 34.7Closing stocks 53.6 61.9 51.4 78.2 93.9 93.1 33.8 32.8 29.91 Trade data include wheat flour in wheat grain equivalent. For the EU semolina is also included2 Argentina (December/November) for rye, barley and oats, (March/February) for maize and sorghum. Australia (November/October) for rye, barley and oats, (March/February) for maize and sorghum. Canada (August.July), EU (July/June), United States (June/May) for rye, barley and oats, (September/August) for maize and sorghum
PAKISTAN (Sept./Aug.)
EU (July/June) EU VIET NAM (Jan./Dec.)
TOTAL OF ABOVE TOTAL OF ABOVE TOTAL OF ABOVE
AUSTRALIA (Oct./Sept.) AUSTRALIA
APPENDIX TABLE 9: CEREAL SUPPLY AND UTILIZATION IN SELECTED EXPORTERS (million tonnes)
Wheat 1 Coarse Grains 2 Rice (milled basis)
UNITED STATES (Aug/July)UNITED STATES (June/May) UNITED STATES
CANADA (August/July) CANADA THAILAND (Aug/July)
ARGENTINA (Dec./Nov.) ARGENTINA INDIA (Oct./Sept.)

Statistica
l ap
pe
nd
ix
116 117FOOD OUTLOOKNOVEMBER 2017
APPENDIX TABLE 10: TOTAL OILCROPS STATISTICS (million tonnes)
13/14-15/16
average2016/17 2017/18
13/14-15/16 average
2016/17 2017/1813/14-15/16
average2016/17 2017/18
estim. f'cast estim. f'cast estim. f'cast
ASIA 130.5 135.0 136.9 111.1 131.7 136.8 3.3 3.9 3.4China 58.7 58.6 61.2 82.5 98.1 100.5 1.1 1.0 1.0 of which Taiwan Prov. 0.1 0.1 0.1 2.5 2.6 2.7 - - -India 34.7 38.9 35.9 0.4 0.3 0.3 0.8 1.3 1.0Indonesia 11.2 11.4 12.3 2.5 2.8 3.0 0.1 0.1 0.1Iran, Islamic Republic of 0.7 0.7 0.7 1.3 2.2 2.5 0.1 0.1 0.1Japan 0.3 0.3 0.3 5.8 6.1 6.2 - - -Korea, Republic.of 0.2 0.1 0.2 1.6 1.5 1.7 - - -Malaysia 4.8 5.0 5.2 0.8 0.9 1.1 0.1 0.1 0.1Pakistan 4.9 4.3 4.9 1.8 2.9 3.2 - - -Thailand 0.8 1.1 1.2 2.4 2.8 3.3 - - -Turkey 3.2 3.2 3.6 3.0 3.3 3.3 0.1 0.1 0.1
AFRICA 17.9 18.0 18.5 3.8 4.9 4.9 0.7 0.7 0.7Nigeria 5.1 5.0 5.0 - - 0.1 0.1 0.1 0.1
CENTRAL AMERICA 1.7 2.0 1.9 6.5 6.6 6.7 0.2 0.2 0.2Mexico 1.3 1.5 1.4 5.7 5.9 5.9 - - -
SOUTH AMERICA 174.7 196.2 188.8 2.3 3.8 4.2 69.6 81.3 83.2Argentina 61.9 61.1 60.6 0.2 1.6 1.6 10.4 8.1 9.7Brazil 96.1 117.1 110.5 0.4 0.3 0.4 50.8 63.9 64.4Paraguay 9.4 10.6 10.1 - - - 5.0 6.0 5.7Uruguay 3.3 3.6 3.4 - - - 3.0 3.1 3.3
NORTH AMERICA 136.1 154.8 162.0 3.0 2.3 2.3 65.5 76.6 80.3Canada 25.2 27.3 29.2 0.6 0.7 0.6 14.4 16.4 18.0United States of America 110.9 127.5 132.8 2.4 1.7 1.7 51.1 60.2 62.3
EUROPE 66.5 70.6 72.9 21.3 23.8 22.2 6.1 6.9 6.9European Union 33.7 31.7 34.9 18.5 21.1 19.6 1.1 1.0 1.0Russian Federation 13.4 16.0 16.3 2.1 2.0 1.9 0.5 1.0 1.0Ukraine 17.0 20.7 19.4 - - - 3.9 4.4 4.3
OCEANIA 4.9 6.0 4.7 - - - 2.8 3.7 2.4Australia 4.5 5.6 4.2 - - - 2.7 3.6 2.3
WORLD 532.3 582.6 585.7 147.9 173.2 177.2 148.1 173.2 177.1Developing countries 325.0 351.3 346.2 117.8 140.9 146.5 73.8 86.1 87.6Developed countries 207.3 231.3 239.5 30.1 32.3 30.7 74.3 87.1 89.5LIFDC 58.5 62.3 59.8 4.0 5.4 6.3 1.6 2.1 1.8LDC 10.8 11.0 10.9 1.1 1.5 2.1 0.5 0.5 0.5
1 The split years bring together northern hemisphere annual crops harevested in the latter part of the first year shown, with southern hemisphere annual crops harvested in the early part of the second year shown; for tree crops which are produced throughout the year, calendar year production for the second year shown is used.
APPENDIX TABLE 10: TOTAL OILCROPS STATISTICS (million tonnes)
Production 1 Imports Exports
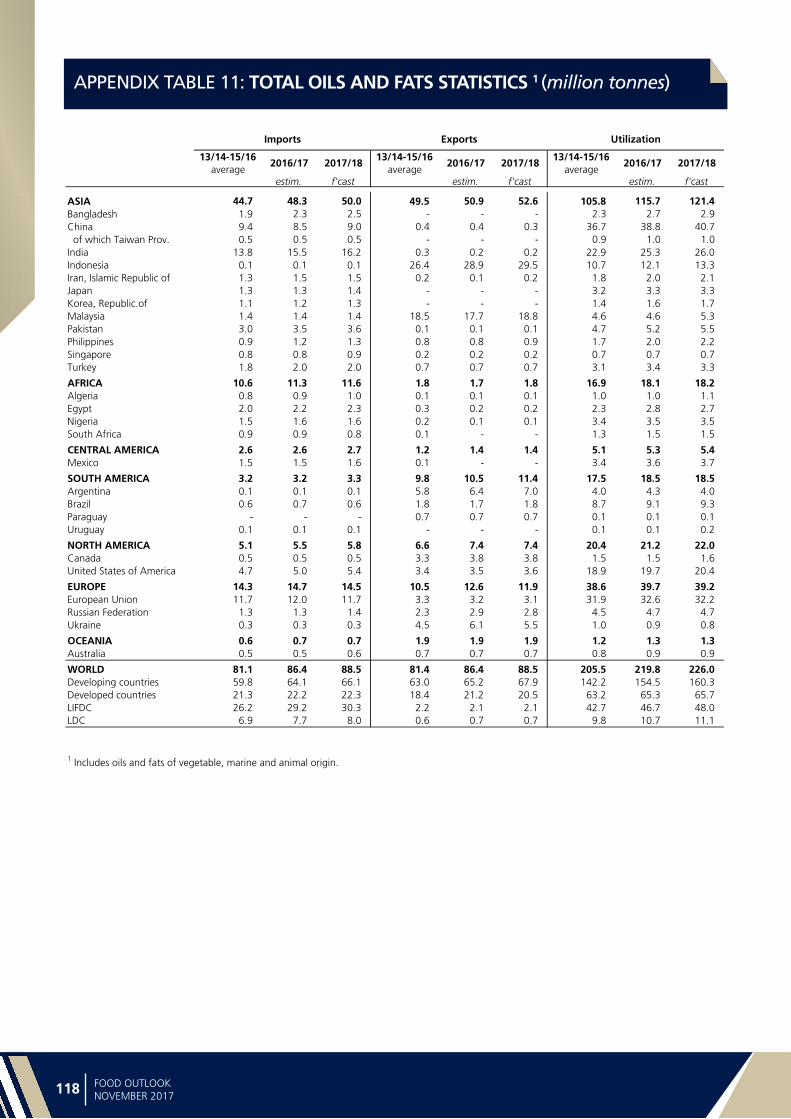
Sta
tist
ica
l a
pp
en
dix
118 119FOOD OUTLOOKNOVEMBER 2017
APPENDIX TABLE 11: TOTAL OILS AND FATS STATISTICS 1 (million tonnes)
13/14-15/16
average2016/17 2017/18
13/14-15/16 average
2016/17 2017/1813/14-15/16
average2016/17 2017/18
estim. f'cast estim. f'cast estim. f'cast
ASIA 44.7 48.3 50.0 49.5 50.9 52.6 105.8 115.7 121.4Bangladesh 1.9 2.3 2.5 - - - 2.3 2.7 2.9China 9.4 8.5 9.0 0.4 0.4 0.3 36.7 38.8 40.7 of which Taiwan Prov. 0.5 0.5 0.5 - - - 0.9 1.0 1.0India 13.8 15.5 16.2 0.3 0.2 0.2 22.9 25.3 26.0Indonesia 0.1 0.1 0.1 26.4 28.9 29.5 10.7 12.1 13.3Iran, Islamic Republic of 1.3 1.5 1.5 0.2 0.1 0.2 1.8 2.0 2.1Japan 1.3 1.3 1.4 - - - 3.2 3.3 3.3Korea, Republic.of 1.1 1.2 1.3 - - - 1.4 1.6 1.7Malaysia 1.4 1.4 1.4 18.5 17.7 18.8 4.6 4.6 5.3Pakistan 3.0 3.5 3.6 0.1 0.1 0.1 4.7 5.2 5.5Philippines 0.9 1.2 1.3 0.8 0.8 0.9 1.7 2.0 2.2Singapore 0.8 0.8 0.9 0.2 0.2 0.2 0.7 0.7 0.7Turkey 1.8 2.0 2.0 0.7 0.7 0.7 3.1 3.4 3.3
AFRICA 10.6 11.3 11.6 1.8 1.7 1.8 16.9 18.1 18.2Algeria 0.8 0.9 1.0 0.1 0.1 0.1 1.0 1.0 1.1Egypt 2.0 2.2 2.3 0.3 0.2 0.2 2.3 2.8 2.7Nigeria 1.5 1.6 1.6 0.2 0.1 0.1 3.4 3.5 3.5South Africa 0.9 0.9 0.8 0.1 - - 1.3 1.5 1.5
CENTRAL AMERICA 2.6 2.6 2.7 1.2 1.4 1.4 5.1 5.3 5.4Mexico 1.5 1.5 1.6 0.1 - - 3.4 3.6 3.7
SOUTH AMERICA 3.2 3.2 3.3 9.8 10.5 11.4 17.5 18.5 18.5Argentina 0.1 0.1 0.1 5.8 6.4 7.0 4.0 4.3 4.0Brazil 0.6 0.7 0.6 1.8 1.7 1.8 8.7 9.1 9.3Paraguay - - - 0.7 0.7 0.7 0.1 0.1 0.1Uruguay 0.1 0.1 0.1 - - - 0.1 0.1 0.2
NORTH AMERICA 5.1 5.5 5.8 6.6 7.4 7.4 20.4 21.2 22.0Canada 0.5 0.5 0.5 3.3 3.8 3.8 1.5 1.5 1.6United States of America 4.7 5.0 5.4 3.4 3.5 3.6 18.9 19.7 20.4
EUROPE 14.3 14.7 14.5 10.5 12.6 11.9 38.6 39.7 39.2European Union 11.7 12.0 11.7 3.3 3.2 3.1 31.9 32.6 32.2Russian Federation 1.3 1.3 1.4 2.3 2.9 2.8 4.5 4.7 4.7Ukraine 0.3 0.3 0.3 4.5 6.1 5.5 1.0 0.9 0.8
OCEANIA 0.6 0.7 0.7 1.9 1.9 1.9 1.2 1.3 1.3Australia 0.5 0.5 0.6 0.7 0.7 0.7 0.8 0.9 0.9
WORLD 81.1 86.4 88.5 81.4 86.4 88.5 205.5 219.8 226.0Developing countries 59.8 64.1 66.1 63.0 65.2 67.9 142.2 154.5 160.3Developed countries 21.3 22.2 22.3 18.4 21.2 20.5 63.2 65.3 65.7LIFDC 26.2 29.2 30.3 2.2 2.1 2.1 42.7 46.7 48.0LDC 6.9 7.7 8.0 0.6 0.7 0.7 9.8 10.7 11.1
1 Includes oils and fats of vegetable, marine and animal origin.
APPENDIX TABLE 11: TOTAL OILS AND FATS STATISTICS 1 (million tonnes)
Imports Exports Utilization
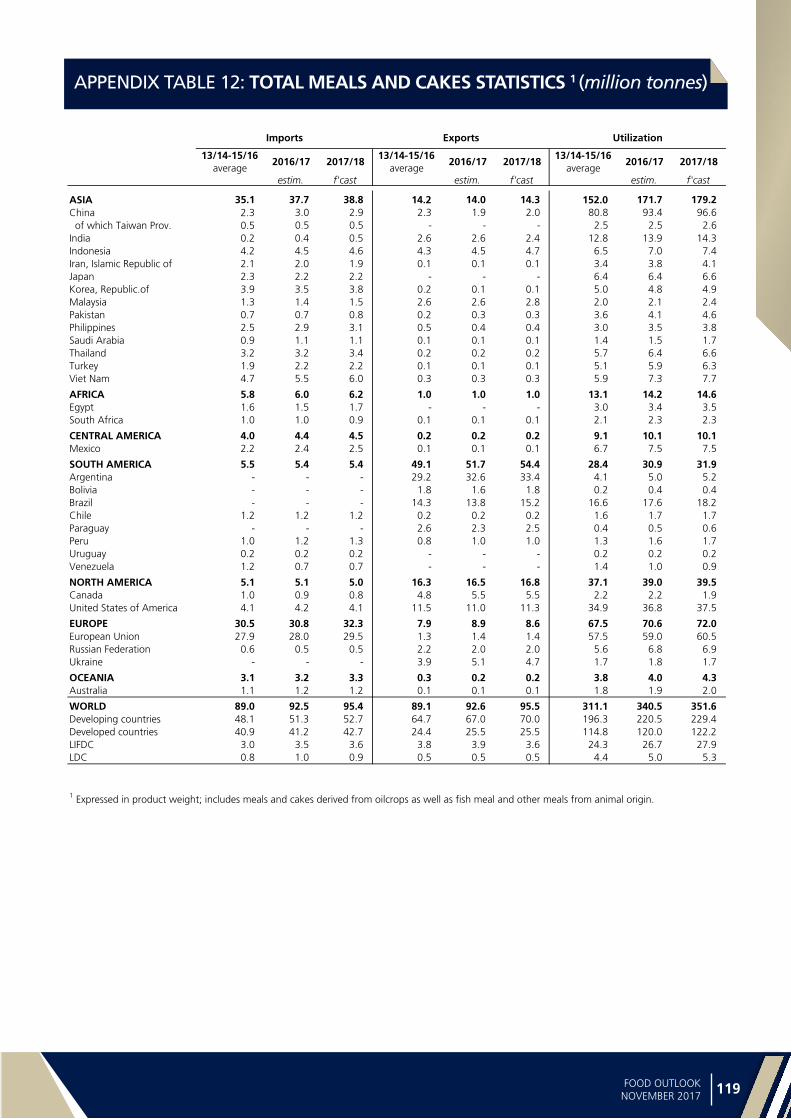
Statistica
l ap
pe
nd
ix
118 119FOOD OUTLOOKNOVEMBER 2017
APPENDIX TABLE 12: TOTAL MEALS AND CAKES STATISTICS 1 (million tonnes)
13/14-15/16
average2016/17 2017/18
13/14-15/16 average
2016/17 2017/1813/14-15/16
average2016/17 2017/18
estim. f'cast estim. f'cast estim. f'cast
ASIA 35.1 37.7 38.8 14.2 14.0 14.3 152.0 171.7 179.2China 2.3 3.0 2.9 2.3 1.9 2.0 80.8 93.4 96.6 of which Taiwan Prov. 0.5 0.5 0.5 - - - 2.5 2.5 2.6India 0.2 0.4 0.5 2.6 2.6 2.4 12.8 13.9 14.3Indonesia 4.2 4.5 4.6 4.3 4.5 4.7 6.5 7.0 7.4Iran, Islamic Republic of 2.1 2.0 1.9 0.1 0.1 0.1 3.4 3.8 4.1Japan 2.3 2.2 2.2 - - - 6.4 6.4 6.6Korea, Republic.of 3.9 3.5 3.8 0.2 0.1 0.1 5.0 4.8 4.9Malaysia 1.3 1.4 1.5 2.6 2.6 2.8 2.0 2.1 2.4Pakistan 0.7 0.7 0.8 0.2 0.3 0.3 3.6 4.1 4.6Philippines 2.5 2.9 3.1 0.5 0.4 0.4 3.0 3.5 3.8Saudi Arabia 0.9 1.1 1.1 0.1 0.1 0.1 1.4 1.5 1.7Thailand 3.2 3.2 3.4 0.2 0.2 0.2 5.7 6.4 6.6Turkey 1.9 2.2 2.2 0.1 0.1 0.1 5.1 5.9 6.3Viet Nam 4.7 5.5 6.0 0.3 0.3 0.3 5.9 7.3 7.7
AFRICA 5.8 6.0 6.2 1.0 1.0 1.0 13.1 14.2 14.6Egypt 1.6 1.5 1.7 - - - 3.0 3.4 3.5South Africa 1.0 1.0 0.9 0.1 0.1 0.1 2.1 2.3 2.3
CENTRAL AMERICA 4.0 4.4 4.5 0.2 0.2 0.2 9.1 10.1 10.1Mexico 2.2 2.4 2.5 0.1 0.1 0.1 6.7 7.5 7.5
SOUTH AMERICA 5.5 5.4 5.4 49.1 51.7 54.4 28.4 30.9 31.9Argentina - - - 29.2 32.6 33.4 4.1 5.0 5.2Bolivia - - - 1.8 1.6 1.8 0.2 0.4 0.4Brazil - - - 14.3 13.8 15.2 16.6 17.6 18.2Chile 1.2 1.2 1.2 0.2 0.2 0.2 1.6 1.7 1.7Paraguay - - - 2.6 2.3 2.5 0.4 0.5 0.6Peru 1.0 1.2 1.3 0.8 1.0 1.0 1.3 1.6 1.7Uruguay 0.2 0.2 0.2 - - - 0.2 0.2 0.2Venezuela 1.2 0.7 0.7 - - - 1.4 1.0 0.9
NORTH AMERICA 5.1 5.1 5.0 16.3 16.5 16.8 37.1 39.0 39.5Canada 1.0 0.9 0.8 4.8 5.5 5.5 2.2 2.2 1.9United States of America 4.1 4.2 4.1 11.5 11.0 11.3 34.9 36.8 37.5
EUROPE 30.5 30.8 32.3 7.9 8.9 8.6 67.5 70.6 72.0European Union 27.9 28.0 29.5 1.3 1.4 1.4 57.5 59.0 60.5Russian Federation 0.6 0.5 0.5 2.2 2.0 2.0 5.6 6.8 6.9Ukraine - - - 3.9 5.1 4.7 1.7 1.8 1.7
OCEANIA 3.1 3.2 3.3 0.3 0.2 0.2 3.8 4.0 4.3Australia 1.1 1.2 1.2 0.1 0.1 0.1 1.8 1.9 2.0
WORLD 89.0 92.5 95.4 89.1 92.6 95.5 311.1 340.5 351.6Developing countries 48.1 51.3 52.7 64.7 67.0 70.0 196.3 220.5 229.4Developed countries 40.9 41.2 42.7 24.4 25.5 25.5 114.8 120.0 122.2LIFDC 3.0 3.5 3.6 3.8 3.9 3.6 24.3 26.7 27.9LDC 0.8 1.0 0.9 0.5 0.5 0.5 4.4 5.0 5.3
1 Expressed in product weight; includes meals and cakes derived from oilcrops as well as fish meal and other meals from animal origin.
APPENDIX TABLE 12: TOTAL MEALS AND CAKES STATISTICS
Imports Exports Utilization
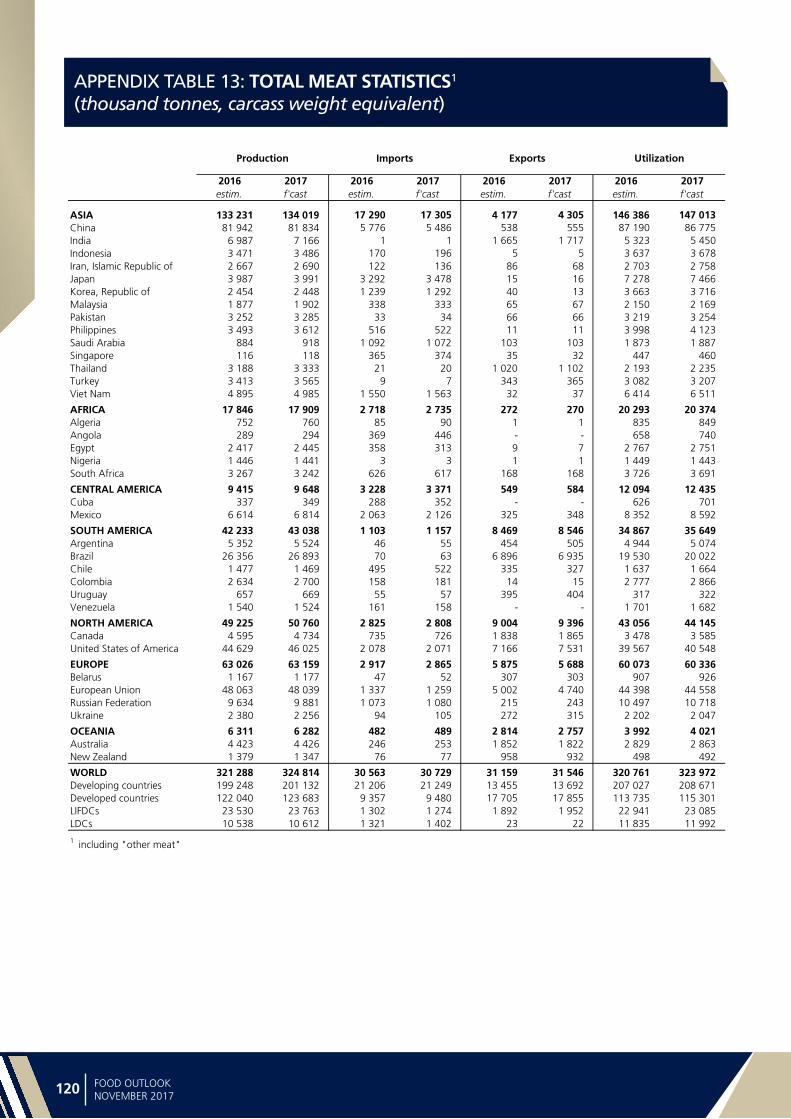
Sta
tist
ica
l a
pp
en
dix
120 121FOOD OUTLOOKNOVEMBER 2017
APPENDIX TABLE 13: TOTAL MEAT STATISTICS1
(thousand tonnes, carcass weight equivalent)
2016 2017 2016 2017 2016 2017 2016 2017estim. f'cast estim. f'cast estim. f'cast estim. f'cast
ASIA 133 231 134 019 17 290 17 305 4 177 4 305 146 386 147 013China 81 942 81 834 5 776 5 486 538 555 87 190 86 775India 6 987 7 166 1 1 1 665 1 717 5 323 5 450Indonesia 3 471 3 486 170 196 5 5 3 637 3 678Iran, Islamic Republic of 2 667 2 690 122 136 86 68 2 703 2 758Japan 3 987 3 991 3 292 3 478 15 16 7 278 7 466Korea, Republic of 2 454 2 448 1 239 1 292 40 13 3 663 3 716Malaysia 1 877 1 902 338 333 65 67 2 150 2 169Pakistan 3 252 3 285 33 34 66 66 3 219 3 254Philippines 3 493 3 612 516 522 11 11 3 998 4 123Saudi Arabia 884 918 1 092 1 072 103 103 1 873 1 887Singapore 116 118 365 374 35 32 447 460Thailand 3 188 3 333 21 20 1 020 1 102 2 193 2 235Turkey 3 413 3 565 9 7 343 365 3 082 3 207Viet Nam 4 895 4 985 1 550 1 563 32 37 6 414 6 511
AFRICA 17 846 17 909 2 718 2 735 272 270 20 293 20 374Algeria 752 760 85 90 1 1 835 849Angola 289 294 369 446 - - 658 740Egypt 2 417 2 445 358 313 9 7 2 767 2 751Nigeria 1 446 1 441 3 3 1 1 1 449 1 443South Africa 3 267 3 242 626 617 168 168 3 726 3 691
CENTRAL AMERICA 9 415 9 648 3 228 3 371 549 584 12 094 12 435Cuba 337 349 288 352 - - 626 701Mexico 6 614 6 814 2 063 2 126 325 348 8 352 8 592
SOUTH AMERICA 42 233 43 038 1 103 1 157 8 469 8 546 34 867 35 649Argentina 5 352 5 524 46 55 454 505 4 944 5 074Brazil 26 356 26 893 70 63 6 896 6 935 19 530 20 022Chile 1 477 1 469 495 522 335 327 1 637 1 664Colombia 2 634 2 700 158 181 14 15 2 777 2 866Uruguay 657 669 55 57 395 404 317 322Venezuela 1 540 1 524 161 158 - - 1 701 1 682
NORTH AMERICA 49 225 50 760 2 825 2 808 9 004 9 396 43 056 44 145Canada 4 595 4 734 735 726 1 838 1 865 3 478 3 585United States of America 44 629 46 025 2 078 2 071 7 166 7 531 39 567 40 548
EUROPE 63 026 63 159 2 917 2 865 5 875 5 688 60 073 60 336Belarus 1 167 1 177 47 52 307 303 907 926European Union 48 063 48 039 1 337 1 259 5 002 4 740 44 398 44 558Russian Federation 9 634 9 881 1 073 1 080 215 243 10 497 10 718Ukraine 2 380 2 256 94 105 272 315 2 202 2 047
OCEANIA 6 311 6 282 482 489 2 814 2 757 3 992 4 021Australia 4 423 4 426 246 253 1 852 1 822 2 829 2 863New Zealand 1 379 1 347 76 77 958 932 498 492
WORLD 321 288 324 814 30 563 30 729 31 159 31 546 320 761 323 972Developing countries 199 248 201 132 21 206 21 249 13 455 13 692 207 027 208 671Developed countries 122 040 123 683 9 357 9 480 17 705 17 855 113 735 115 301LIFDCs 23 530 23 763 1 302 1 274 1 892 1 952 22 941 23 085LDCs 10 538 10 612 1 321 1 402 23 22 11 835 11 992
1 including "other meat"
Exports Utilization
APPENDIX TABLE 13: TOTAL MEAT STATISTICS
Production Imports
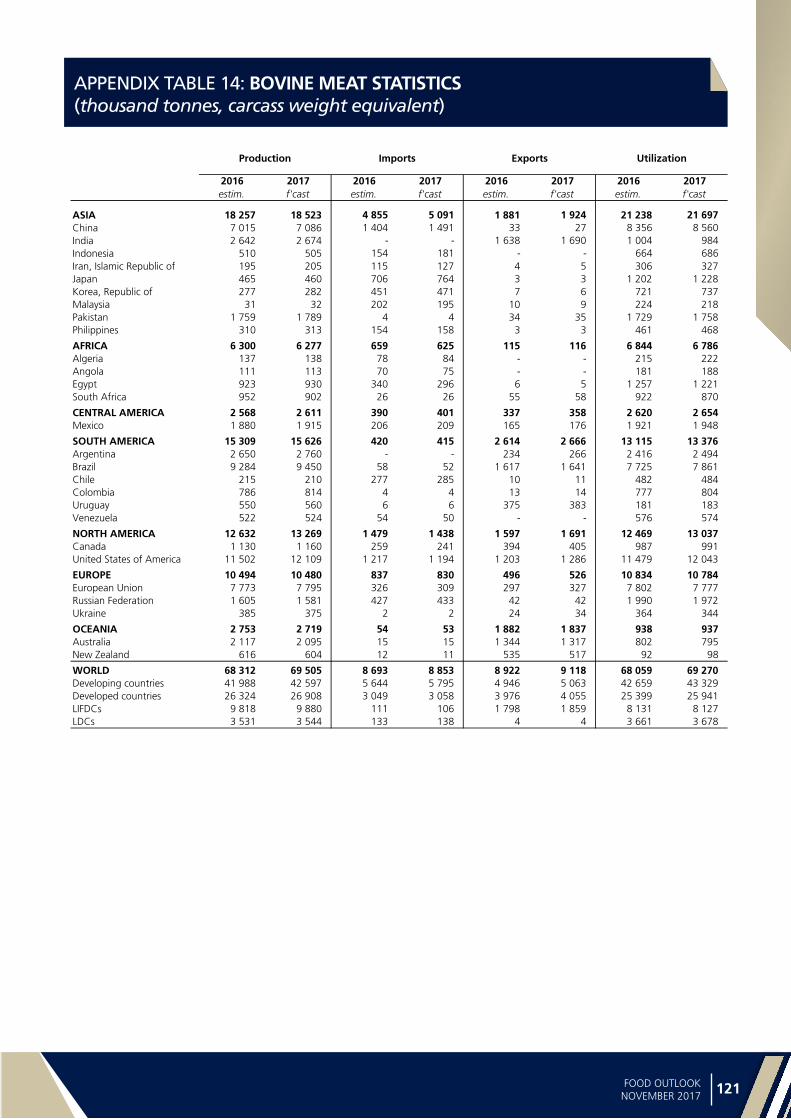
Statistica
l ap
pe
nd
ix
120 121FOOD OUTLOOKNOVEMBER 2017
APPENDIX TABLE 14: BOVINE MEAT STATISTICS (thousand tonnes, carcass weight equivalent)
2016 2017 2016 2017 2016 2017 2016 2017estim. f'cast estim. f'cast estim. f'cast estim. f'cast
ASIA 18 257 18 523 4 855 5 091 1 881 1 924 21 238 21 697China 7 015 7 086 1 404 1 491 33 27 8 356 8 560India 2 642 2 674 - - 1 638 1 690 1 004 984Indonesia 510 505 154 181 - - 664 686Iran, Islamic Republic of 195 205 115 127 4 5 306 327Japan 465 460 706 764 3 3 1 202 1 228Korea, Republic of 277 282 451 471 7 6 721 737Malaysia 31 32 202 195 10 9 224 218Pakistan 1 759 1 789 4 4 34 35 1 729 1 758Philippines 310 313 154 158 3 3 461 468
AFRICA 6 300 6 277 659 625 115 116 6 844 6 786Algeria 137 138 78 84 - - 215 222Angola 111 113 70 75 - - 181 188Egypt 923 930 340 296 6 5 1 257 1 221South Africa 952 902 26 26 55 58 922 870
CENTRAL AMERICA 2 568 2 611 390 401 337 358 2 620 2 654Mexico 1 880 1 915 206 209 165 176 1 921 1 948
SOUTH AMERICA 15 309 15 626 420 415 2 614 2 666 13 115 13 376Argentina 2 650 2 760 - - 234 266 2 416 2 494Brazil 9 284 9 450 58 52 1 617 1 641 7 725 7 861Chile 215 210 277 285 10 11 482 484Colombia 786 814 4 4 13 14 777 804Uruguay 550 560 6 6 375 383 181 183Venezuela 522 524 54 50 - - 576 574
NORTH AMERICA 12 632 13 269 1 479 1 438 1 597 1 691 12 469 13 037Canada 1 130 1 160 259 241 394 405 987 991United States of America 11 502 12 109 1 217 1 194 1 203 1 286 11 479 12 043
EUROPE 10 494 10 480 837 830 496 526 10 834 10 784European Union 7 773 7 795 326 309 297 327 7 802 7 777Russian Federation 1 605 1 581 427 433 42 42 1 990 1 972Ukraine 385 375 2 2 24 34 364 344
OCEANIA 2 753 2 719 54 53 1 882 1 837 938 937Australia 2 117 2 095 15 15 1 344 1 317 802 795New Zealand 616 604 12 11 535 517 92 98
WORLD 68 312 69 505 8 693 8 853 8 922 9 118 68 059 69 270Developing countries 41 988 42 597 5 644 5 795 4 946 5 063 42 659 43 329Developed countries 26 324 26 908 3 049 3 058 3 976 4 055 25 399 25 941LIFDCs 9 818 9 880 111 106 1 798 1 859 8 131 8 127LDCs 3 531 3 544 133 138 4 4 3 661 3 678
APPENDIX TABLE 14: BOVINE MEAT STATISTICS
Production Imports Exports Utilization
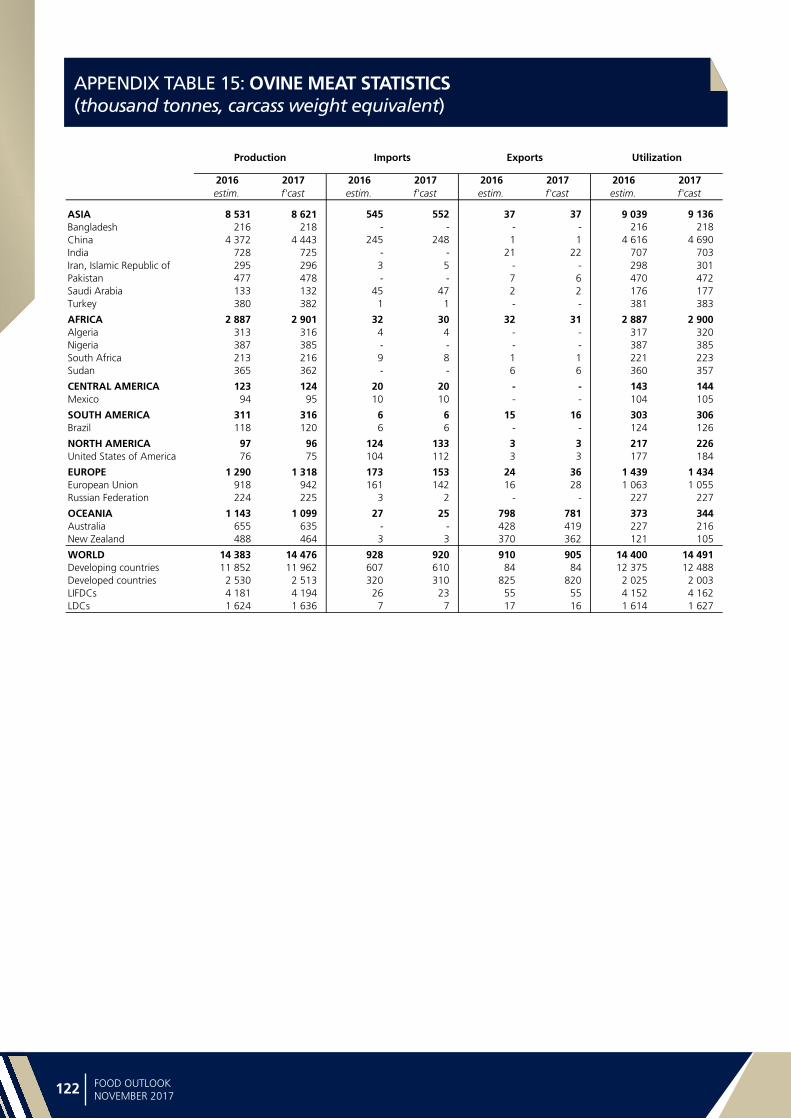
Sta
tist
ica
l a
pp
en
dix
122 123FOOD OUTLOOKNOVEMBER 2017
APPENDIX TABLE 15: OVINE MEAT STATISTICS (thousand tonnes, carcass weight equivalent)
2016 2017 2016 2017 2016 2017 2016 2017estim. f'cast estim. f'cast estim. f'cast estim. f'cast
ASIA 8 531 8 621 545 552 37 37 9 039 9 136Bangladesh 216 218 - - - - 216 218China 4 372 4 443 245 248 1 1 4 616 4 690India 728 725 - - 21 22 707 703Iran, Islamic Republic of 295 296 3 5 - - 298 301Pakistan 477 478 - - 7 6 470 472Saudi Arabia 133 132 45 47 2 2 176 177Turkey 380 382 1 1 - - 381 383
AFRICA 2 887 2 901 32 30 32 31 2 887 2 900Algeria 313 316 4 4 - - 317 320Nigeria 387 385 - - - - 387 385South Africa 213 216 9 8 1 1 221 223Sudan 365 362 - - 6 6 360 357
CENTRAL AMERICA 123 124 20 20 - - 143 144Mexico 94 95 10 10 - - 104 105
SOUTH AMERICA 311 316 6 6 15 16 303 306Brazil 118 120 6 6 - - 124 126
NORTH AMERICA 97 96 124 133 3 3 217 226United States of America 76 75 104 112 3 3 177 184
EUROPE 1 290 1 318 173 153 24 36 1 439 1 434European Union 918 942 161 142 16 28 1 063 1 055Russian Federation 224 225 3 2 - - 227 227
OCEANIA 1 143 1 099 27 25 798 781 373 344Australia 655 635 - - 428 419 227 216New Zealand 488 464 3 3 370 362 121 105
WORLD 14 383 14 476 928 920 910 905 14 400 14 491Developing countries 11 852 11 962 607 610 84 84 12 375 12 488Developed countries 2 530 2 513 320 310 825 820 2 025 2 003LIFDCs 4 181 4 194 26 23 55 55 4 152 4 162LDCs 1 624 1 636 7 7 17 16 1 614 1 627
APPENDIX TABLE 15: OVINE MEAT STATISTICS
Production Imports Exports Utilization
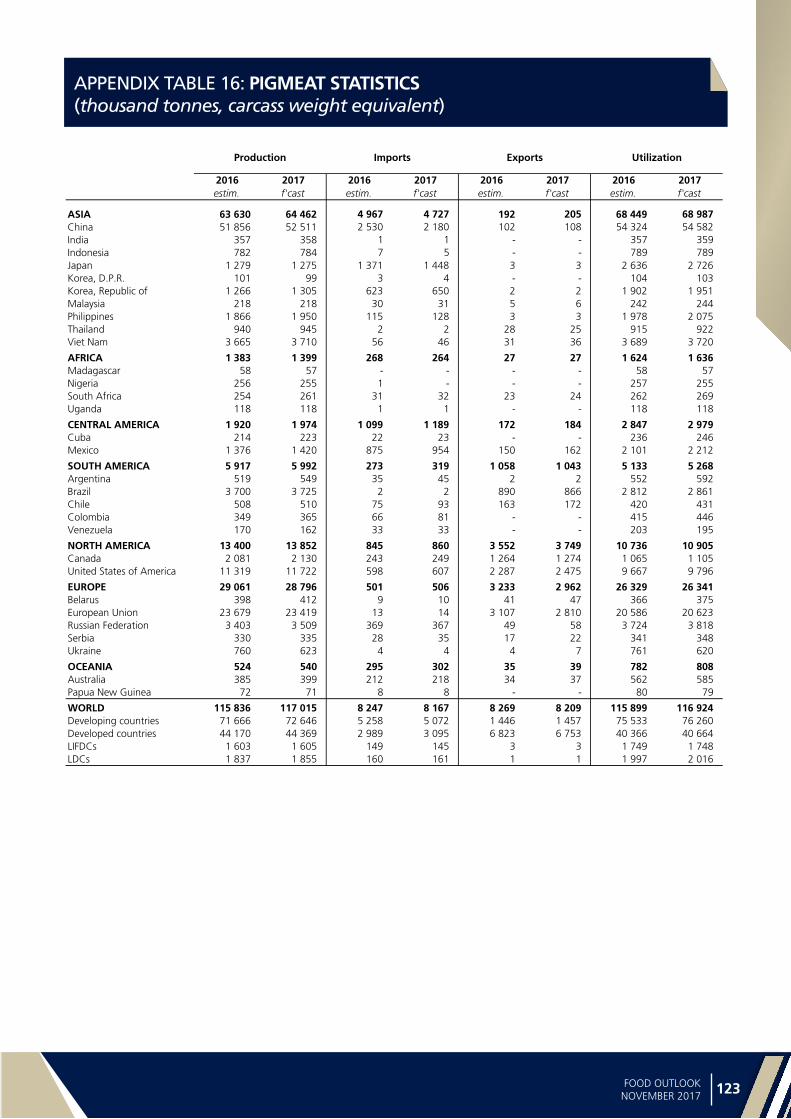
Statistica
l ap
pe
nd
ix
122 123FOOD OUTLOOKNOVEMBER 2017
APPENDIX TABLE 16: PIGMEAT STATISTICS (thousand tonnes, carcass weight equivalent)
2016 2017 2016 2017 2016 2017 2016 2017estim. f'cast estim. f'cast estim. f'cast estim. f'cast
ASIA 63 630 64 462 4 967 4 727 192 205 68 449 68 987China 51 856 52 511 2 530 2 180 102 108 54 324 54 582India 357 358 1 1 - - 357 359Indonesia 782 784 7 5 - - 789 789Japan 1 279 1 275 1 371 1 448 3 3 2 636 2 726Korea, D.P.R. 101 99 3 4 - - 104 103Korea, Republic of 1 266 1 305 623 650 2 2 1 902 1 951Malaysia 218 218 30 31 5 6 242 244Philippines 1 866 1 950 115 128 3 3 1 978 2 075Thailand 940 945 2 2 28 25 915 922Viet Nam 3 665 3 710 56 46 31 36 3 689 3 720
AFRICA 1 383 1 399 268 264 27 27 1 624 1 636Madagascar 58 57 - - - - 58 57Nigeria 256 255 1 - - - 257 255South Africa 254 261 31 32 23 24 262 269Uganda 118 118 1 1 - - 118 118
CENTRAL AMERICA 1 920 1 974 1 099 1 189 172 184 2 847 2 979Cuba 214 223 22 23 - - 236 246Mexico 1 376 1 420 875 954 150 162 2 101 2 212
SOUTH AMERICA 5 917 5 992 273 319 1 058 1 043 5 133 5 268Argentina 519 549 35 45 2 2 552 592Brazil 3 700 3 725 2 2 890 866 2 812 2 861Chile 508 510 75 93 163 172 420 431Colombia 349 365 66 81 - - 415 446Venezuela 170 162 33 33 - - 203 195
NORTH AMERICA 13 400 13 852 845 860 3 552 3 749 10 736 10 905Canada 2 081 2 130 243 249 1 264 1 274 1 065 1 105United States of America 11 319 11 722 598 607 2 287 2 475 9 667 9 796
EUROPE 29 061 28 796 501 506 3 233 2 962 26 329 26 341Belarus 398 412 9 10 41 47 366 375European Union 23 679 23 419 13 14 3 107 2 810 20 586 20 623Russian Federation 3 403 3 509 369 367 49 58 3 724 3 818Serbia 330 335 28 35 17 22 341 348Ukraine 760 623 4 4 4 7 761 620
OCEANIA 524 540 295 302 35 39 782 808Australia 385 399 212 218 34 37 562 585Papua New Guinea 72 71 8 8 - - 80 79
WORLD 115 836 117 015 8 247 8 167 8 269 8 209 115 899 116 924Developing countries 71 666 72 646 5 258 5 072 1 446 1 457 75 533 76 260Developed countries 44 170 44 369 2 989 3 095 6 823 6 753 40 366 40 664LIFDCs 1 603 1 605 149 145 3 3 1 749 1 748LDCs 1 837 1 855 160 161 1 1 1 997 2 016
APPENDIX TABLE 16: PIGMEAT STATISTICS
Production Imports Exports Utilization

Sta
tist
ica
l a
pp
en
dix
124 125FOOD OUTLOOKNOVEMBER 2017
APPENDIX TABLE 17: POULTRY MEAT STATISTICS (thousand tonnes, carcass weight equivalent)
2016 2017 2016 2017 2016 2017 2016 2017estim. f'cast estim. f'cast estim. f'cast estim. f'cast
ASIA 40 857 40 458 6 873 6 884 2 043 2 115 45 678 45 210China 17 214 16 311 1 591 1 562 387 405 18 419 17 469India 3 111 3 260 - - 4 3 3 107 3 257Indonesia 2 071 2 090 4 4 - - 2 074 2 094Iran, Islamic Republic of 2 160 2 172 - - 78 58 2 082 2 114Japan 2 230 2 243 1 179 1 228 9 9 3 390 3 462Korea, Republic of 900 850 144 149 31 4 1 008 995Kuwait 50 53 129 133 - - 179 186Malaysia 1 625 1 650 73 72 50 52 1 648 1 670Saudi Arabia 638 670 903 885 70 70 1 471 1 485Singapore 96 98 176 182 13 14 258 266Thailand 2 056 2 194 3 2 955 1 042 1 108 1 138Turkey 1 913 1 963 - - 327 342 1 586 1 621Yemen 144 137 78 83 - - 222 220
AFRICA 5 835 5 890 1 727 1 782 90 87 7 471 7 585Angola 35 33 218 288 - - 253 321South Africa 1 825 1 840 560 551 81 79 2 304 2 312
CENTRAL AMERICA 4 684 4 818 1 701 1 742 38 39 6 347 6 521Cuba 35 36 242 303 - - 277 339Mexico 3 161 3 281 959 940 8 9 4 112 4 212
SOUTH AMERICA 20 488 20 896 402 415 4 715 4 754 16 174 16 557Argentina 1 984 2 014 11 9 187 205 1 808 1 818Brazil 13 223 13 567 3 3 4 364 4 403 8 862 9 167Chile 728 722 143 144 153 135 718 731Venezuela 840 830 74 75 - - 914 905
NORTH AMERICA 22 870 23 316 368 368 3 833 3 935 19 418 19 760Canada 1 364 1 423 213 215 179 186 1 386 1 447United States of America 21 506 21 893 151 149 3 654 3 749 18 028 18 308
EUROPE 20 988 21 372 1 240 1 209 2 037 2 079 20 195 20 502European Union 14 651 14 841 737 693 1 500 1 492 13 888 14 042Russian Federation 4 312 4 476 226 230 124 142 4 419 4 564Ukraine 1 190 1 213 85 97 244 273 1 032 1 037
OCEANIA 1 459 1 492 102 105 57 60 1 504 1 537Australia 1 244 1 275 18 18 34 36 1 229 1 257New Zealand 187 189 1 1 23 24 165 166
WORLD 117 181 118 241 12 412 12 506 12 814 13 069 116 787 117 672Developing countries 69 662 69 846 9 606 9 682 6 877 6 986 72 390 72 526Developed countries 47 519 48 395 2 805 2 824 5 937 6 083 44 397 45 146LIFDCs 6 224 6 379 988 970 31 30 7 180 7 319LDCs 2 862 2 894 994 1 069 2 2 3 854 3 962
APPENDIX TABLE 17: POULTRY MEAT STATISTICS
Production Imports Exports Utilization
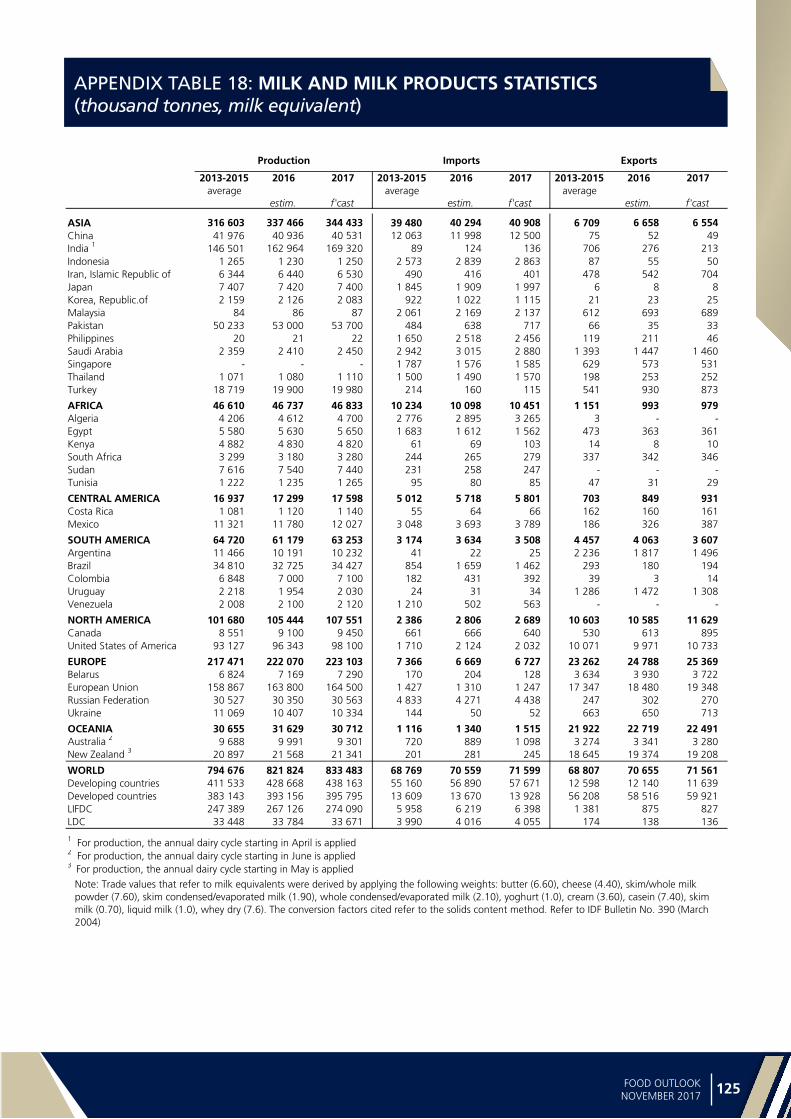
Statistica
l ap
pe
nd
ix
124 125FOOD OUTLOOKNOVEMBER 2017
APPENDIX TABLE 18: MILK AND MILK PRODUCTS STATISTICS (thousand tonnes, milk equivalent)
2013-2015
average2016 2017 2013-2015
average2016 2017 2013-2015
average2016 2017
estim. f'cast estim. f'cast estim. f'cast
ASIA 316 603 337 466 344 433 39 480 40 294 40 908 6 709 6 658 6 554China 41 976 40 936 40 531 12 063 11 998 12 500 75 52 49India 1 146 501 162 964 169 320 89 124 136 706 276 213Indonesia 1 265 1 230 1 250 2 573 2 839 2 863 87 55 50Iran, Islamic Republic of 6 344 6 440 6 530 490 416 401 478 542 704Japan 7 407 7 420 7 400 1 845 1 909 1 997 6 8 8Korea, Republic.of 2 159 2 126 2 083 922 1 022 1 115 21 23 25Malaysia 84 86 87 2 061 2 169 2 137 612 693 689Pakistan 50 233 53 000 53 700 484 638 717 66 35 33Philippines 20 21 22 1 650 2 518 2 456 119 211 46Saudi Arabia 2 359 2 410 2 450 2 942 3 015 2 880 1 393 1 447 1 460Singapore - - - 1 787 1 576 1 585 629 573 531Thailand 1 071 1 080 1 110 1 500 1 490 1 570 198 253 252Turkey 18 719 19 900 19 980 214 160 115 541 930 873
AFRICA 46 610 46 737 46 833 10 234 10 098 10 451 1 151 993 979Algeria 4 206 4 612 4 700 2 776 2 895 3 265 3 - -Egypt 5 580 5 630 5 650 1 683 1 612 1 562 473 363 361Kenya 4 882 4 830 4 820 61 69 103 14 8 10South Africa 3 299 3 180 3 280 244 265 279 337 342 346Sudan 7 616 7 540 7 440 231 258 247 - - -Tunisia 1 222 1 235 1 265 95 80 85 47 31 29
CENTRAL AMERICA 16 937 17 299 17 598 5 012 5 718 5 801 703 849 931Costa Rica 1 081 1 120 1 140 55 64 66 162 160 161Mexico 11 321 11 780 12 027 3 048 3 693 3 789 186 326 387
SOUTH AMERICA 64 720 61 179 63 253 3 174 3 634 3 508 4 457 4 063 3 607Argentina 11 466 10 191 10 232 41 22 25 2 236 1 817 1 496Brazil 34 810 32 725 34 427 854 1 659 1 462 293 180 194Colombia 6 848 7 000 7 100 182 431 392 39 3 14Uruguay 2 218 1 954 2 030 24 31 34 1 286 1 472 1 308Venezuela 2 008 2 100 2 120 1 210 502 563 - - -
NORTH AMERICA 101 680 105 444 107 551 2 386 2 806 2 689 10 603 10 585 11 629Canada 8 551 9 100 9 450 661 666 640 530 613 895United States of America 93 127 96 343 98 100 1 710 2 124 2 032 10 071 9 971 10 733
EUROPE 217 471 222 070 223 103 7 366 6 669 6 727 23 262 24 788 25 369Belarus 6 824 7 169 7 290 170 204 128 3 634 3 930 3 722European Union 158 867 163 800 164 500 1 427 1 310 1 247 17 347 18 480 19 348Russian Federation 30 527 30 350 30 563 4 833 4 271 4 438 247 302 270Ukraine 11 069 10 407 10 334 144 50 52 663 650 713
OCEANIA 30 655 31 629 30 712 1 116 1 340 1 515 21 922 22 719 22 491Australia 2 9 688 9 991 9 301 720 889 1 098 3 274 3 341 3 280New Zealand 3 20 897 21 568 21 341 201 281 245 18 645 19 374 19 208
WORLD 794 676 821 824 833 483 68 769 70 559 71 599 68 807 70 655 71 561Developing countries 411 533 428 668 438 163 55 160 56 890 57 671 12 598 12 140 11 639Developed countries 383 143 393 156 395 795 13 609 13 670 13 928 56 208 58 516 59 921LIFDC 247 389 267 126 274 090 5 958 6 219 6 398 1 381 875 827LDC 33 448 33 784 33 671 3 990 4 016 4 055 174 138 136
1 For production, the annual dairy cycle starting in April is applied2 For production, the annual dairy cycle starting in June is applied3 For production, the annual dairy cycle starting in May is applied
Note: Trade values that refer to milk equivalents were derived by applying the following weights: butter (6.60), cheese (4.40), skim/whole milk powder (7.60), skim condensed/evaporated milk (1.90), whole condensed/evaporated milk (2.10), yoghurt (1.0), cream (3.60), casein (7.40), skim milk (0.70), liquid milk (1.0), whey dry (7.6). The conversion factors cited refer to the solids content method. Refer to IDF Bulletin No. 390 (March 2004)
APPENDIX TABLE 18: MILK AND MILK PRODUCTS STATISTICS
Production Imports Exports
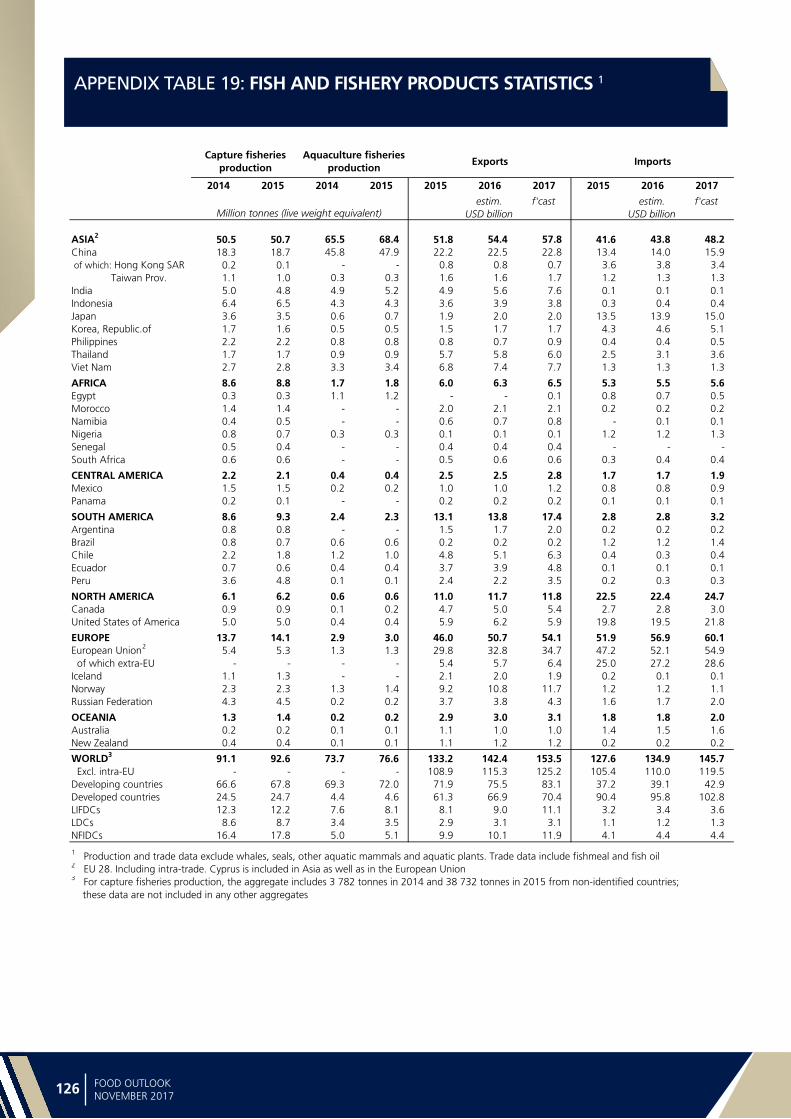
Sta
tist
ica
l a
pp
en
dix
126 127FOOD OUTLOOKNOVEMBER 2017
APPENDIX TABLE 19: FISH AND FISHERY PRODUCTS STATISTICS 1
2014 2015 2014 2015 2015 2016 2017 2015 2016 2017
estim. f'cast estim. f'cast
ASIA2 50.5 50.7 65.5 68.4 51.8 54.4 57.8 41.6 43.8 48.2China 18.3 18.7 45.8 47.9 22.2 22.5 22.8 13.4 14.0 15.9 of which: Hong Kong SAR 0.2 0.1 - - 0.8 0.8 0.7 3.6 3.8 3.4 Taiwan Prov. 1.1 1.0 0.3 0.3 1.6 1.6 1.7 1.2 1.3 1.3India 5.0 4.8 4.9 5.2 4.9 5.6 7.6 0.1 0.1 0.1Indonesia 6.4 6.5 4.3 4.3 3.6 3.9 3.8 0.3 0.4 0.4Japan 3.6 3.5 0.6 0.7 1.9 2.0 2.0 13.5 13.9 15.0Korea, Republic.of 1.7 1.6 0.5 0.5 1.5 1.7 1.7 4.3 4.6 5.1Philippines 2.2 2.2 0.8 0.8 0.8 0.7 0.9 0.4 0.4 0.5Thailand 1.7 1.7 0.9 0.9 5.7 5.8 6.0 2.5 3.1 3.6Viet Nam 2.7 2.8 3.3 3.4 6.8 7.4 7.7 1.3 1.3 1.3
AFRICA 8.6 8.8 1.7 1.8 6.0 6.3 6.5 5.3 5.5 5.6Egypt 0.3 0.3 1.1 1.2 - - 0.1 0.8 0.7 0.5Morocco 1.4 1.4 - - 2.0 2.1 2.1 0.2 0.2 0.2Namibia 0.4 0.5 - - 0.6 0.7 0.8 - 0.1 0.1Nigeria 0.8 0.7 0.3 0.3 0.1 0.1 0.1 1.2 1.2 1.3Senegal 0.5 0.4 - - 0.4 0.4 0.4 - - -South Africa 0.6 0.6 - - 0.5 0.6 0.6 0.3 0.4 0.4
CENTRAL AMERICA 2.2 2.1 0.4 0.4 2.5 2.5 2.8 1.7 1.7 1.9Mexico 1.5 1.5 0.2 0.2 1.0 1.0 1.2 0.8 0.8 0.9Panama 0.2 0.1 - - 0.2 0.2 0.2 0.1 0.1 0.1
SOUTH AMERICA 8.6 9.3 2.4 2.3 13.1 13.8 17.4 2.8 2.8 3.2Argentina 0.8 0.8 - - 1.5 1.7 2.0 0.2 0.2 0.2Brazil 0.8 0.7 0.6 0.6 0.2 0.2 0.2 1.2 1.2 1.4Chile 2.2 1.8 1.2 1.0 4.8 5.1 6.3 0.4 0.3 0.4Ecuador 0.7 0.6 0.4 0.4 3.7 3.9 4.8 0.1 0.1 0.1Peru 3.6 4.8 0.1 0.1 2.4 2.2 3.5 0.2 0.3 0.3
NORTH AMERICA 6.1 6.2 0.6 0.6 11.0 11.7 11.8 22.5 22.4 24.7Canada 0.9 0.9 0.1 0.2 4.7 5.0 5.4 2.7 2.8 3.0United States of America 5.0 5.0 0.4 0.4 5.9 6.2 5.9 19.8 19.5 21.8
EUROPE 13.7 14.1 2.9 3.0 46.0 50.7 54.1 51.9 56.9 60.1European Union2 5.4 5.3 1.3 1.3 29.8 32.8 34.7 47.2 52.1 54.9 of which extra-EU - - - - 5.4 5.7 6.4 25.0 27.2 28.6Iceland 1.1 1.3 - - 2.1 2.0 1.9 0.2 0.1 0.1Norway 2.3 2.3 1.3 1.4 9.2 10.8 11.7 1.2 1.2 1.1Russian Federation 4.3 4.5 0.2 0.2 3.7 3.8 4.3 1.6 1.7 2.0
OCEANIA 1.3 1.4 0.2 0.2 2.9 3.0 3.1 1.8 1.8 2.0Australia 0.2 0.2 0.1 0.1 1.1 1.0 1.0 1.4 1.5 1.6New Zealand 0.4 0.4 0.1 0.1 1.1 1.2 1.2 0.2 0.2 0.2
WORLD3 91.1 92.6 73.7 76.6 133.2 142.4 153.5 127.6 134.9 145.7 Excl. intra-EU - - - - 108.9 115.3 125.2 105.4 110.0 119.5Developing countries 66.6 67.8 69.3 72.0 71.9 75.5 83.1 37.2 39.1 42.9Developed countries 24.5 24.7 4.4 4.6 61.3 66.9 70.4 90.4 95.8 102.8LIFDCs 12.3 12.2 7.6 8.1 8.1 9.0 11.1 3.2 3.4 3.6LDCs 8.6 8.7 3.4 3.5 2.9 3.1 3.1 1.1 1.2 1.3NFIDCs 16.4 17.8 5.0 5.1 9.9 10.1 11.9 4.1 4.4 4.4
1 Production and trade data exclude whales, seals, other aquatic mammals and aquatic plants. Trade data include fishmeal and fish oil2 EU 28. Including intra-trade. Cyprus is included in Asia as well as in the European Union3 For capture fisheries production, the aggregate includes 3 782 tonnes in 2014 and 38 732 tonnes in 2015 from non-identified countries; these data are not included in any other aggregates
Million tonnes (live weight equivalent) USD billion USD billion
APPENDIX TABLE 19: FISH AND FISHERY PRODUCTS STATISTICS 1
Exports ImportsCapture fisheries
productionAquaculture fisheries
production
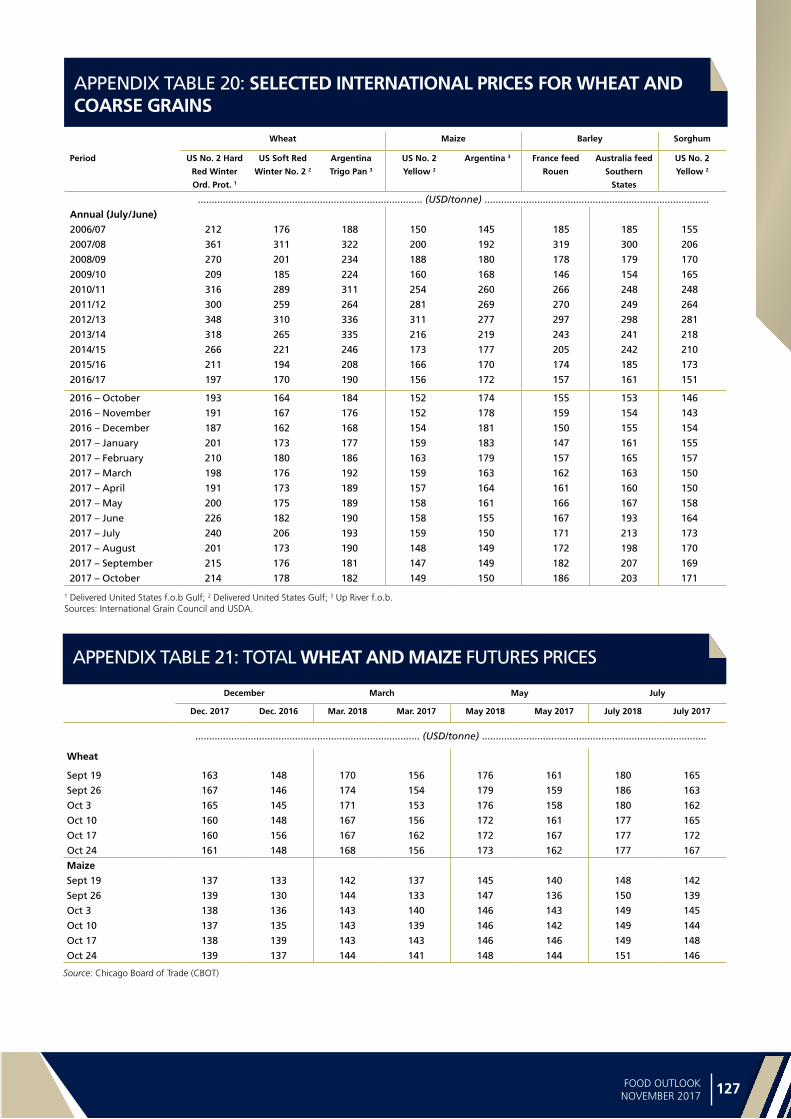
Statistica
l ap
pe
nd
ix
126 127FOOD OUTLOOKNOVEMBER 2017
APPENDIX TABLE 20: SELECTED INTERNATIONAL PRICES FOR WHEAT AND COARSE GRAINS
APPENDIX TABLE 21: TOTAL WHEAT AND MAIZE FUTURES PRICES
Wheat Maize Barley Sorghum
Period US No. 2 Hard
Red Winter
Ord. Prot. 1
US Soft Red
Winter No. 2 2
Argentina
Trigo Pan 3
US No. 2
Yellow 2
Argentina 3 France feed
Rouen
Australia feed
Southern
States
US No. 2
Yellow 2
................................................................................. (USD/tonne) .................................................................................
Annual (July/June)
2006/07 212 176 188 150 145 185 185 155
2007/08 361 311 322 200 192 319 300 206
2008/09 270 201 234 188 180 178 179 170
2009/10 209 185 224 160 168 146 154 165
2010/11 316 289 311 254 260 266 248 248
2011/12 300 259 264 281 269 270 249 264
2012/13 348 310 336 311 277 297 298 281
2013/14 318 265 335 216 219 243 241 218
2014/15 266 221 246 173 177 205 242 210
2015/16 211 194 208 166 170 174 185 173
2016/17 197 170 190 156 172 157 161 151
2016 – October 193 164 184 152 174 155 153 146
2016 – November 191 167 176 152 178 159 154 143
2016 – December 187 162 168 154 181 150 155 154
2017 – January 201 173 177 159 183 147 161 155
2017 – February 210 180 186 163 179 157 165 157
2017 – March 198 176 192 159 163 162 163 150
2017 – April 191 173 189 157 164 161 160 150
2017 – May 200 175 189 158 161 166 167 158
2017 – June 226 182 190 158 155 167 193 164
2017 – July 240 206 193 159 150 171 213 173
2017 – August 201 173 190 148 149 172 198 170
2017 – September 215 176 181 147 149 182 207 169
2017 – October 214 178 182 149 150 186 203 171
December March May July
Dec. 2017 Dec. 2016 Mar. 2018 Mar. 2017 May 2018 May 2017 July 2018 July 2017
................................................................................. (USD/tonne) .................................................................................
Wheat
Sept 19 163 148 170 156 176 161 180 165
Sept 26 167 146 174 154 179 159 186 163
Oct 3 165 145 171 153 176 158 180 162
Oct 10 160 148 167 156 172 161 177 165
Oct 17 160 156 167 162 172 167 177 172
Oct 24 161 148 168 156 173 162 177 167
Maize
Sept 19 137 133 142 137 145 140 148 142
Sept 26 139 130 144 133 147 136 150 139
Oct 3 138 136 143 140 146 143 149 145
Oct 10 137 135 143 139 146 142 149 144
Oct 17 138 139 143 143 146 146 149 148
Oct 24 139 137 144 141 148 144 151 146
Source: Chicago Board of Trade (CBOT)
1 Delivered United States f.o.b Gulf; 2 Delivered United States Gulf; 3 Up River f.o.b. Sources: International Grain Council and USDA.
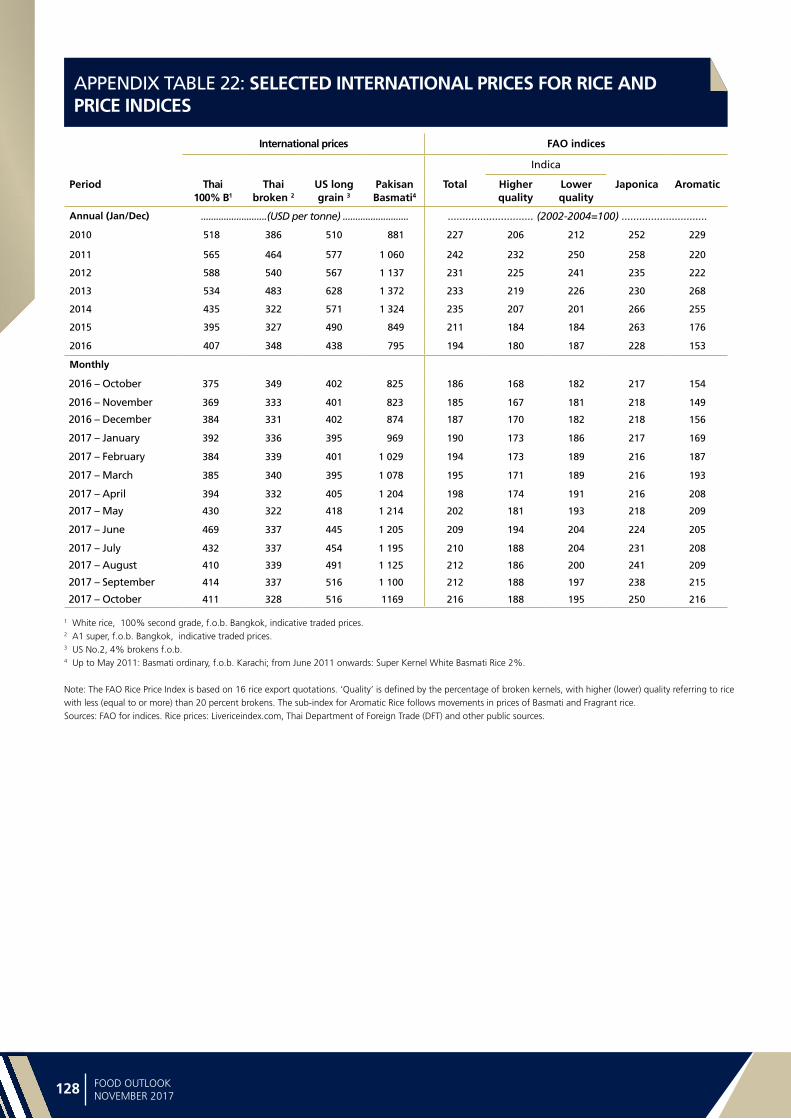
Sta
tist
ica
l a
pp
en
dix
128 129FOOD OUTLOOKNOVEMBER 2017
APPENDIX TABLE 22: SELECTED INTERNATIONAL PRICES FOR RICE AND PRICE INDICES
International prices FAO indices
Indica
Period Thai 100% B1
Thai broken 2
US long grain 3
Pakisan Basmati4
Total Higher quality
Lower quality
Japonica Aromatic
Annual (Jan/Dec) ..........................(USD per tonne) .......................... ............................. (2002-2004=100) .............................
2010 518 386 510 881 227 206 212 252 229
2011 565 464 577 1 060 242 232 250 258 220
2012 588 540 567 1 137 231 225 241 235 222
2013 534 483 628 1 372 233 219 226 230 268
2014 435 322 571 1 324 235 207 201 266 255
2015 395 327 490 849 211 184 184 263 176
2016 407 348 438 795 194 180 187 228 153
Monthly
2016 – October 375 349 402 825 186 168 182 217 154
2016 – November 369 333 401 823 185 167 181 218 149
2016 – December 384 331 402 874 187 170 182 218 156
2017 – January 392 336 395 969 190 173 186 217 169
2017 – February 384 339 401 1 029 194 173 189 216 187
2017 – March 385 340 395 1 078 195 171 189 216 193
2017 – April 394 332 405 1 204 198 174 191 216 208
2017 – May 430 322 418 1 214 202 181 193 218 209
2017 – June 469 337 445 1 205 209 194 204 224 205
2017 – July 432 337 454 1 195 210 188 204 231 208
2017 – August 410 339 491 1 125 212 186 200 241 209
2017 – September 414 337 516 1 100 212 188 197 238 215
2017 – October 411 328 516 1169 216 188 195 250 216
1 White rice, 100% second grade, f.o.b. Bangkok, indicative traded prices.2 A1 super, f.o.b. Bangkok, indicative traded prices.3 US No.2, 4% brokens f.o.b.4 Up to May 2011: Basmati ordinary, f.o.b. Karachi; from June 2011 onwards: Super Kernel White Basmati Rice 2%.
Note: The FAO Rice Price Index is based on 16 rice export quotations. ‘Quality’ is defined by the percentage of broken kernels, with higher (lower) quality referring to rice with less (equal to or more) than 20 percent brokens. The sub-index for Aromatic Rice follows movements in prices of Basmati and Fragrant rice.Sources: FAO for indices. Rice prices: Livericeindex.com, Thai Department of Foreign Trade (DFT) and other public sources.
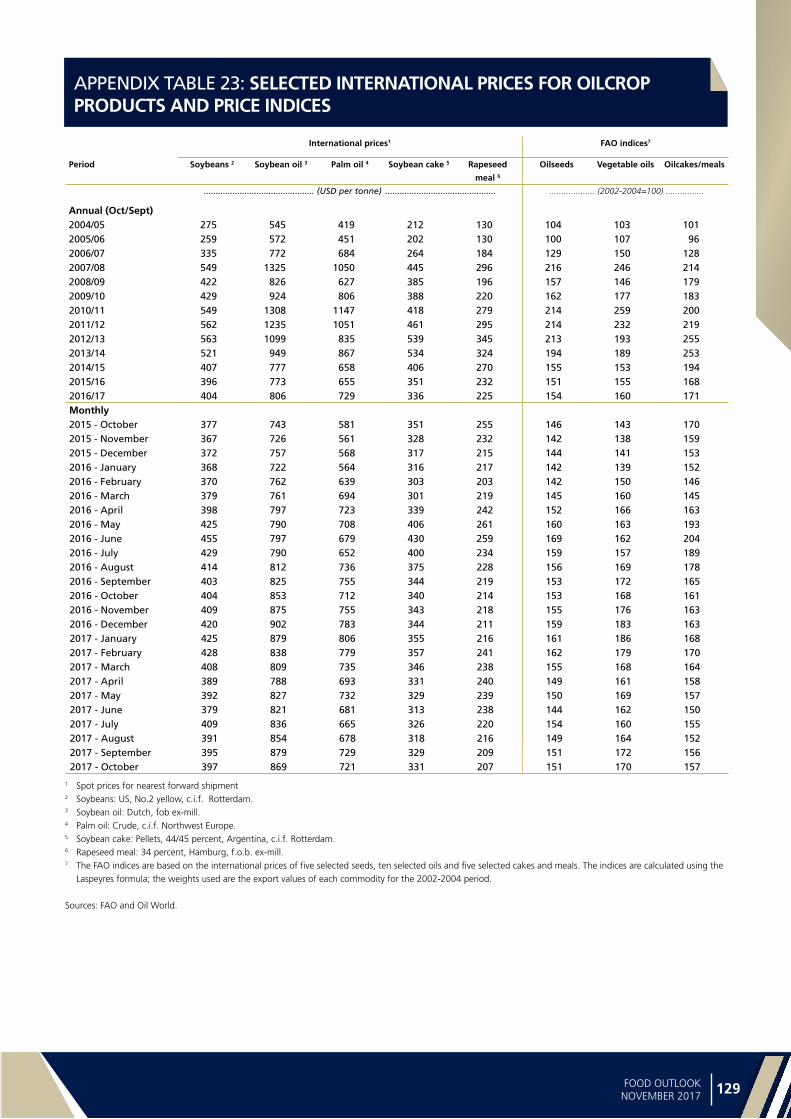
Statistica
l ap
pe
nd
ix
128 129FOOD OUTLOOKNOVEMBER 2017
APPENDIX TABLE 23: SELECTED INTERNATIONAL PRICES FOR OILCROP PRODUCTS AND PRICE INDICES
International prices1 FAO indices7
Period Soybeans 2 Soybean oil 3 Palm oil 4 Soybean cake 5 Rapeseed
meal 6
Oilseeds Vegetable oils Oilcakes/meals
.............................................. (USD per tonne) .............................................. ................... (2002-2004=100) ................
Annual (Oct/Sept)
2004/05 275 545 419 212 130 104 103 1012005/06 259 572 451 202 130 100 107 962006/07 335 772 684 264 184 129 150 1282007/08 549 1325 1050 445 296 216 246 2142008/09 422 826 627 385 196 157 146 1792009/10 429 924 806 388 220 162 177 1832010/11 549 1308 1147 418 279 214 259 2002011/12 562 1235 1051 461 295 214 232 2192012/13 563 1099 835 539 345 213 193 2552013/14 521 949 867 534 324 194 189 2532014/15 407 777 658 406 270 155 153 1942015/16 396 773 655 351 232 151 155 1682016/17 404 806 729 336 225 154 160 171Monthly2015 - October 377 743 581 351 255 146 143 1702015 - November 367 726 561 328 232 142 138 1592015 - December 372 757 568 317 215 144 141 1532016 - January 368 722 564 316 217 142 139 1522016 - February 370 762 639 303 203 142 150 1462016 - March 379 761 694 301 219 145 160 1452016 - April 398 797 723 339 242 152 166 1632016 - May 425 790 708 406 261 160 163 1932016 - June 455 797 679 430 259 169 162 2042016 - July 429 790 652 400 234 159 157 1892016 - August 414 812 736 375 228 156 169 1782016 - September 403 825 755 344 219 153 172 1652016 - October 404 853 712 340 214 153 168 1612016 - November 409 875 755 343 218 155 176 1632016 - December 420 902 783 344 211 159 183 1632017 - January 425 879 806 355 216 161 186 1682017 - February 428 838 779 357 241 162 179 1702017 - March 408 809 735 346 238 155 168 1642017 - April 389 788 693 331 240 149 161 1582017 - May 392 827 732 329 239 150 169 1572017 - June 379 821 681 313 238 144 162 1502017 - July 409 836 665 326 220 154 160 1552017 - August 391 854 678 318 216 149 164 1522017 - September 395 879 729 329 209 151 172 1562017 - October 397 869 721 331 207 151 170 157
1 Spot prices for nearest forward shipment 2 Soybeans: US, No.2 yellow, c.i.f. Rotterdam.3 Soybean oil: Dutch, fob ex-mill.4 Palm oil: Crude, c.i.f. Northwest Europe.5 Soybean cake: Pellets, 44/45 percent, Argentina, c.i.f. Rotterdam.6 Rapeseed meal: 34 percent, Hamburg, f.o.b. ex-mill.7 The FAO indices are based on the international prices of five selected seeds, ten selected oils and five selected cakes and meals. The indices are calculated using the
Laspeyres formula; the weights used are the export values of each commodity for the 2002-2004 period.
Sources: FAO and Oil World.

Sta
tist
ica
l a
pp
en
dix
130 131FOOD OUTLOOKNOVEMBER 2017
APPENDIX TABLE 24: SELECTED INTERNATIONAL PRICES FOR MILK PRODUCTS AND DAIRY PRICE INDEX
International prices FAO dairy price index
Period Butter 1 Skim milk powder 2 Whole milk powder 3 Cheddar cheese 4
Annual (Jan/Dec) .................................................. (USD per tonne) .................................................. ... (2002-2004=100) ...
2007 3 337 4 336 4 354 4 055 220
2008 3 701 3 251 3 891 4 633 223
2009 2 736 2 332 2 556 2 957 150
2010 4 270 3 081 3 514 4 010 207
2011 4 876 3 556 4 018 4 310 230
2012 3 547 3 119 3 358 3 821 194
2013 4 484 4 293 4 745 4 402 243
2014 4 010 3 647 3 868 4 456 224
2015 3 212 2 113 2 509 3 340 160
2016 3 350 1 983 2 457 3 094 154
Monthly
2016 – October 4 213 2 314 2 874 3 631 183
2016 – November 4 328 2 299 3 125 3 613 186
2016 – December 4 497 2 307 3 273 3 725 193
2017 – January 4 479 2 337 3 234 3 756 193
2017 – February 4 409 2 332 3 249 3 825 194
2017 – March 4 730 2 121 3 063 3 688 190
2017 – April 4 994 1 935 2 990 3 438 184
2017 – May 5 205 2 004 3 188 3 619 193
2017 – June 5 938 2 156 3 273 3 900 209
2017 – July 6 438 2 085 3 296 4 031 217
2017 – August 6 724 2 031 3 417 4 008 220
2017 – September 6 950 1 951 3 372 4 151 224
2017 – October 6 306 1 856 3 198 4 125 215
1 Butter, 82% butterfat, f.o.b. Oceania and EU; average indicative traded prices2 Skim Milk Powder, 26% butterfat, f.o.b. Oceania and EU, average indicative traded prices3 Whole Milk Powder, 1.25% butterfat, f.o.b. Oceania and EU, average indicative traded prices4 Cheddar Cheese, 39% max. moisture, f.o.b. Oceania, indicative traded prices
Note: The FAO Dairy Price Index is derived from a trade-weighted average of a selection of representative internationally-traded dairy productsSources: FAO for indices. Product prices: Mid-point of price ranges reported by Dairy Market News (USDA)
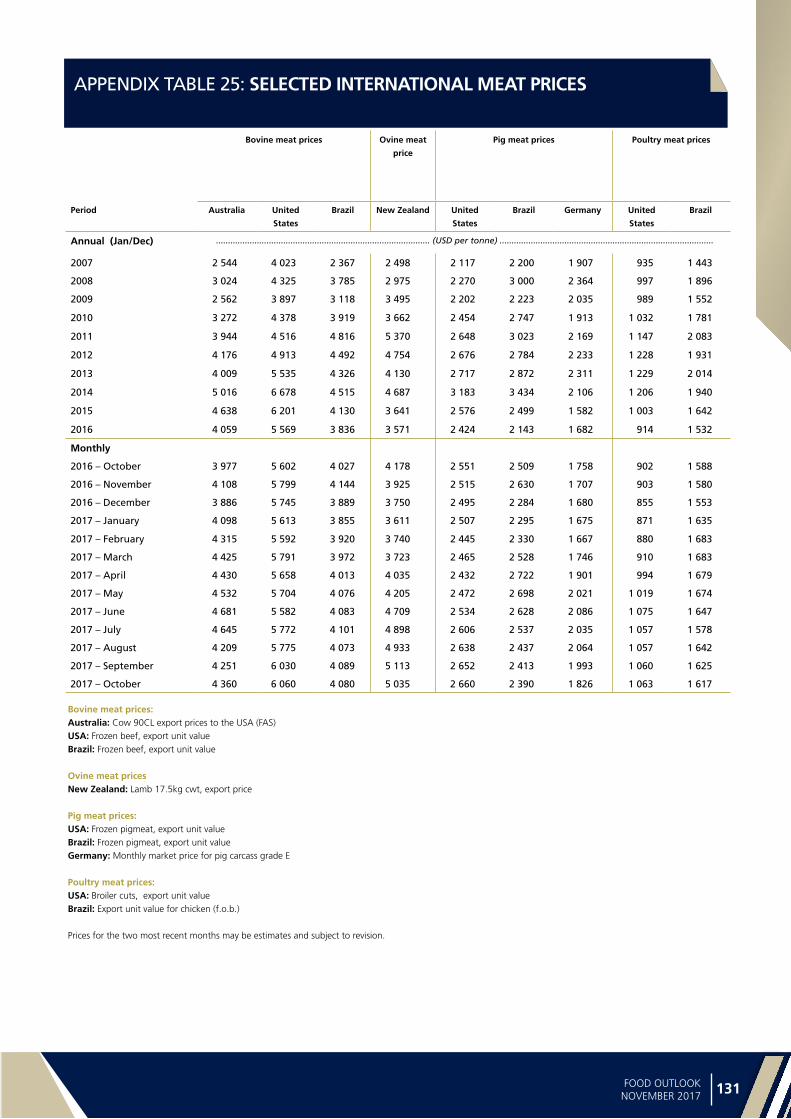
Statistica
l ap
pe
nd
ix
130 131FOOD OUTLOOKNOVEMBER 2017
APPENDIX TABLE 25: SELECTED INTERNATIONAL MEAT PRICES
Bovine meat prices Ovine meat
price
Pig meat prices Poultry meat prices
Period Australia United
States
Brazil New Zealand United
States
Brazil Germany United
States
Brazil
Annual (Jan/Dec) ......................................................................................... (USD per tonne) .........................................................................................
2007 2 544 4 023 2 367 2 498 2 117 2 200 1 907 935 1 443
2008 3 024 4 325 3 785 2 975 2 270 3 000 2 364 997 1 896
2009 2 562 3 897 3 118 3 495 2 202 2 223 2 035 989 1 552
2010 3 272 4 378 3 919 3 662 2 454 2 747 1 913 1 032 1 781
2011 3 944 4 516 4 816 5 370 2 648 3 023 2 169 1 147 2 083
2012 4 176 4 913 4 492 4 754 2 676 2 784 2 233 1 228 1 931
2013 4 009 5 535 4 326 4 130 2 717 2 872 2 311 1 229 2 014
2014 5 016 6 678 4 515 4 687 3 183 3 434 2 106 1 206 1 940
2015 4 638 6 201 4 130 3 641 2 576 2 499 1 582 1 003 1 642
2016 4 059 5 569 3 836 3 571 2 424 2 143 1 682 914 1 532
Monthly
2016 – October 3 977 5 602 4 027 4 178 2 551 2 509 1 758 902 1 588
2016 – November 4 108 5 799 4 144 3 925 2 515 2 630 1 707 903 1 580
2016 – December 3 886 5 745 3 889 3 750 2 495 2 284 1 680 855 1 553
2017 – January 4 098 5 613 3 855 3 611 2 507 2 295 1 675 871 1 635
2017 – February 4 315 5 592 3 920 3 740 2 445 2 330 1 667 880 1 683
2017 – March 4 425 5 791 3 972 3 723 2 465 2 528 1 746 910 1 683
2017 – April 4 430 5 658 4 013 4 035 2 432 2 722 1 901 994 1 679
2017 – May 4 532 5 704 4 076 4 205 2 472 2 698 2 021 1 019 1 674
2017 – June 4 681 5 582 4 083 4 709 2 534 2 628 2 086 1 075 1 647
2017 – July 4 645 5 772 4 101 4 898 2 606 2 537 2 035 1 057 1 578
2017 – August 4 209 5 775 4 073 4 933 2 638 2 437 2 064 1 057 1 642
2017 – September 4 251 6 030 4 089 5 113 2 652 2 413 1 993 1 060 1 625
2017 – October 4 360 6 060 4 080 5 035 2 660 2 390 1 826 1 063 1 617
Bovine meat prices:Australia: Cow 90CL export prices to the USA (FAS)USA: Frozen beef, export unit valueBrazil: Frozen beef, export unit value
Ovine meat pricesNew Zealand: Lamb 17.5kg cwt, export price
Pig meat prices:USA: Frozen pigmeat, export unit valueBrazil: Frozen pigmeat, export unit valueGermany: Monthly market price for pig carcass grade E
Poultry meat prices:USA: Broiler cuts, export unit valueBrazil: Export unit value for chicken (f.o.b.)
Prices for the two most recent months may be estimates and subject to revision.
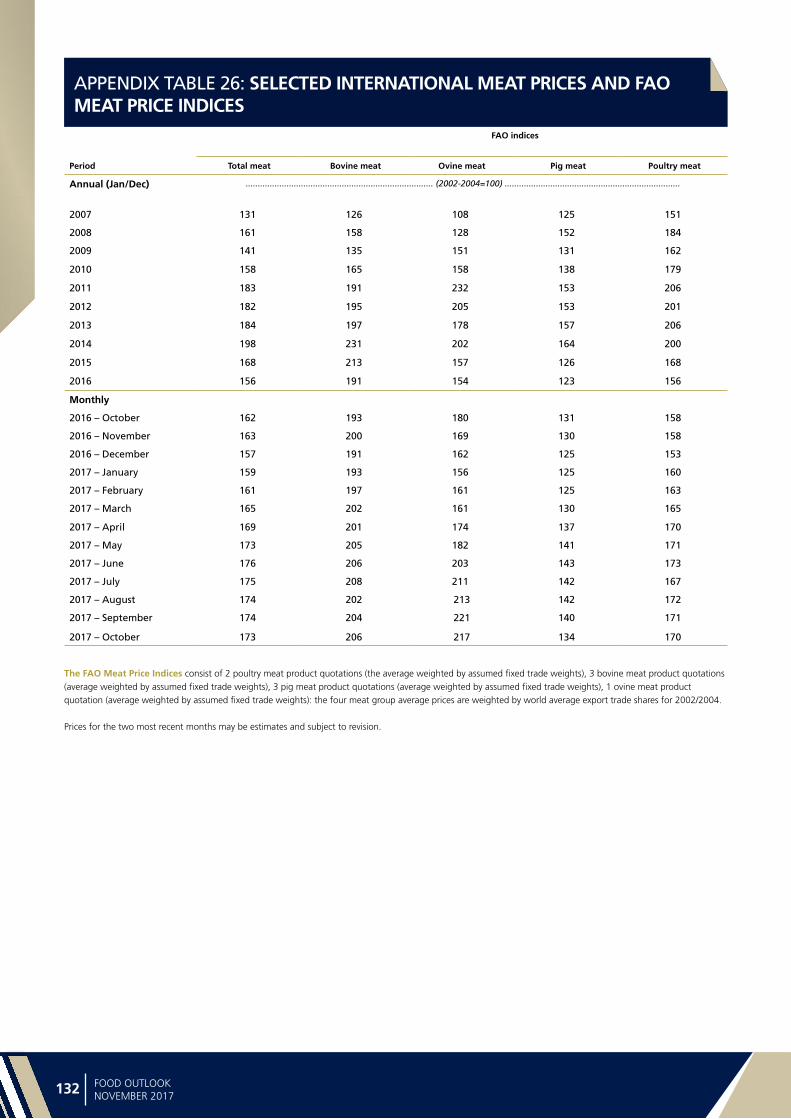
Sta
tist
ica
l a
pp
en
dix
132 133FOOD OUTLOOKNOVEMBER 2017
APPENDIX TABLE 26: SELECTED INTERNATIONAL MEAT PRICES AND FAO MEAT PRICE INDICES
FAO indices
Period Total meat Bovine meat Ovine meat Pig meat Poultry meat
Annual (Jan/Dec) .............................................................................. (2002-2004=100) .........................................................................
2007 131 126 108 125 151
2008 161 158 128 152 184
2009 141 135 151 131 162
2010 158 165 158 138 179
2011 183 191 232 153 206
2012 182 195 205 153 201
2013 184 197 178 157 206
2014 198 231 202 164 200
2015 168 213 157 126 168
2016 156 191 154 123 156
Monthly
2016 – October 162 193 180 131 158
2016 – November 163 200 169 130 158
2016 – December 157 191 162 125 153
2017 – January 159 193 156 125 160
2017 – February 161 197 161 125 163
2017 – March 165 202 161 130 165
2017 – April 169 201 174 137 170
2017 – May 173 205 182 141 171
2017 – June 176 206 203 143 173
2017 – July 175 208 211 142 167
2017 – August 174 202 213 142 172
2017 – September 174 204 221 140 171
2017 – October 173 206 217 134 170
The FAO Meat Price Indices consist of 2 poultry meat product quotations (the average weighted by assumed fixed trade weights), 3 bovine meat product quotations (average weighted by assumed fixed trade weights), 3 pig meat product quotations (average weighted by assumed fixed trade weights), 1 ovine meat product quotation (average weighted by assumed fixed trade weights): the four meat group average prices are weighted by world average export trade shares for 2002/2004.
Prices for the two most recent months may be estimates and subject to revision.
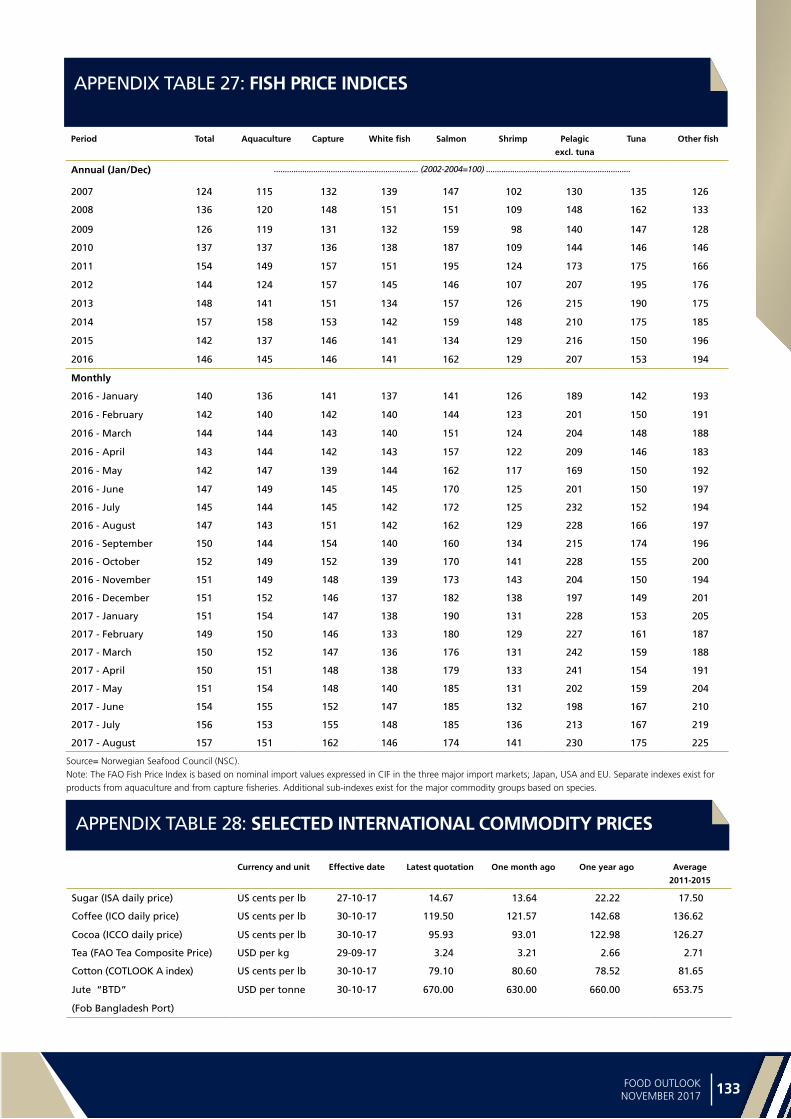
Statistica
l ap
pe
nd
ix
132 133FOOD OUTLOOKNOVEMBER 2017
APPENDIX TABLE 27: FISH PRICE INDICES
APPENDIX TABLE 28: SELECTED INTERNATIONAL COMMODITY PRICES
Period Total Aquaculture Capture White fish Salmon Shrimp Pelagic
excl. tuna
Tuna Other fish
Annual (Jan/Dec) .................................................................. (2002-2004=100) ..................................................................
2007 124 115 132 139 147 102 130 135 126
2008 136 120 148 151 151 109 148 162 133
2009 126 119 131 132 159 98 140 147 128
2010 137 137 136 138 187 109 144 146 146
2011 154 149 157 151 195 124 173 175 166
2012 144 124 157 145 146 107 207 195 176
2013 148 141 151 134 157 126 215 190 175
2014 157 158 153 142 159 148 210 175 185
2015 142 137 146 141 134 129 216 150 196
2016 146 145 146 141 162 129 207 153 194
Monthly
2016 - January 140 136 141 137 141 126 189 142 193
2016 - February 142 140 142 140 144 123 201 150 191
2016 - March 144 144 143 140 151 124 204 148 188
2016 - April 143 144 142 143 157 122 209 146 183
2016 - May 142 147 139 144 162 117 169 150 192
2016 - June 147 149 145 145 170 125 201 150 197
2016 - July 145 144 145 142 172 125 232 152 194
2016 - August 147 143 151 142 162 129 228 166 197
2016 - September 150 144 154 140 160 134 215 174 196
2016 - October 152 149 152 139 170 141 228 155 200
2016 - November 151 149 148 139 173 143 204 150 194
2016 - December 151 152 146 137 182 138 197 149 201
2017 - January 151 154 147 138 190 131 228 153 205
2017 - February 149 150 146 133 180 129 227 161 187
2017 - March 150 152 147 136 176 131 242 159 188
2017 - April 150 151 148 138 179 133 241 154 191
2017 - May 151 154 148 140 185 131 202 159 204
2017 - June 154 155 152 147 185 132 198 167 210
2017 - July 156 153 155 148 185 136 213 167 219
2017 - August 157 151 162 146 174 141 230 175 225
Source= Norwegian Seafood Council (NSC).Note: The FAO Fish Price Index is based on nominal import values expressed in CIF in the three major import markets; Japan, USA and EU. Separate indexes exist for products from aquaculture and from capture fisheries. Additional sub-indexes exist for the major commodity groups based on species.
Currency and unit Effective date Latest quotation One month ago One year ago Average
2011-2015
Sugar (ISA daily price) US cents per lb 27-10-17 14.67 13.64 22.22 17.50
Coffee (ICO daily price) US cents per lb 30-10-17 119.50 121.57 142.68 136.62
Cocoa (ICCO daily price) US cents per lb 30-10-17 95.93 93.01 122.98 126.27
Tea (FAO Tea Composite Price) USD per kg 29-09-17 3.24 3.21 2.66 2.71
Cotton (COTLOOK A index) US cents per lb 30-10-17 79.10 80.60 78.52 81.65
Jute “BTD” USD per tonne 30-10-17 670.00 630.00 660.00 653.75
(Fob Bangladesh Port)

134 135
MAR
KET
INID
CATO
RS
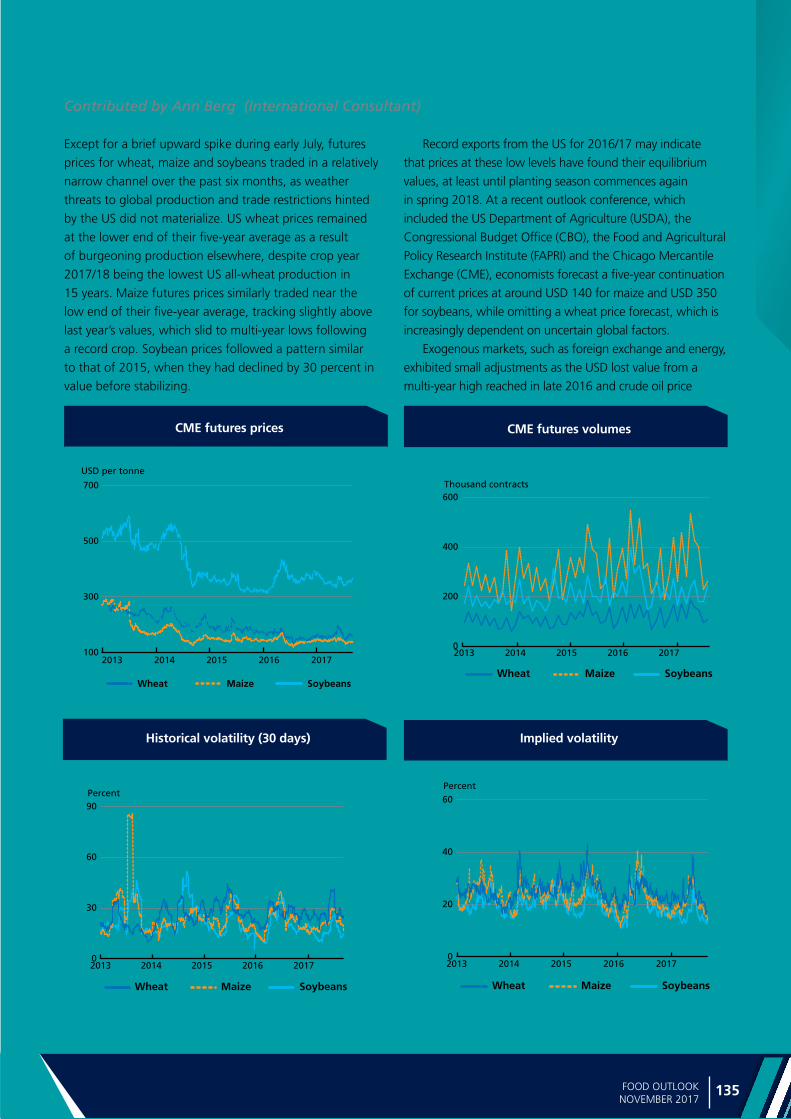
Ma
rke
t ind
icato
rs
134 135FOOD OUTLOOKNOVEMBER 2017
Except for a brief upward spike during early July, futures
prices for wheat, maize and soybeans traded in a relatively
narrow channel over the past six months, as weather
threats to global production and trade restrictions hinted
by the US did not materialize. US wheat prices remained
at the lower end of their five-year average as a result
of burgeoning production elsewhere, despite crop year
2017/18 being the lowest US all-wheat production in
15 years. Maize futures prices similarly traded near the
low end of their five-year average, tracking slightly above
last year’s values, which slid to multi-year lows following
a record crop. Soybean prices followed a pattern similar
to that of 2015, when they had declined by 30 percent in
value before stabilizing.
CME futures prices CME futures volumes
Historical volatility (30 days) Implied volatility
100
300
500
700
20172016201520142013
Wheat Maize Soybeans
USD per tonne
0
30
60
90
20172016201520142013
Wheat Maize Soybeans
Percent
Record exports from the US for 2016/17 may indicate
that prices at these low levels have found their equilibrium
values, at least until planting season commences again
in spring 2018. At a recent outlook conference, which
included the US Department of Agriculture (USDA), the
Congressional Budget Office (CBO), the Food and Agricultural
Policy Research Institute (FAPRI) and the Chicago Mercantile
Exchange (CME), economists forecast a five-year continuation
of current prices at around USD 140 for maize and USD 350
for soybeans, while omitting a wheat price forecast, which is
increasingly dependent on uncertain global factors.
Exogenous markets, such as foreign exchange and energy,
exhibited small adjustments as the USD lost value from a
multi-year high reached in late 2016 and crude oil price
Futures marketsContributed by Ann Berg (International Consultant)
0
200
400
600
20172016201520142013
Wheat Maize Soybeans
Thousand contracts
0
20
40
60
20172016201520142013
Wheat Maize Soybeans
Percent

Ma
rke
t in
dic
ato
rs
136 137FOOD OUTLOOKNOVEMBER 2017
recovered from its multi-year low around the same time to
stabilize at about USD 50 per barrel. Record-setting equity
prices in the US have seemingly had negligible effects on
commodity prices. All in all, markets could be characterized as
rather featureless, tinged by complacency.
FORWARD CURVES
Forward curves for wheat and maize displayed abnormally
steep upward sloping (contango) price configurations
extending to December 2017. For maize, the December
2017/December 2018 spread exhibited USD 18 per tonne
carry versus USD 16 and USD 8 per tonne carries respectively
for the previous two years. For wheat, the 2017/December
2018 spread displayed USD 29 per tonne carry versus USD
28 per tonne and USD 14 per tonne carries, respectively, in
the previous two years. These wide curves, besides reflecting
ample inventories may also reflect three consecutive years of
declining farm income. Very low basis levels in the domestic
market indicate that producers have been willing sellers of
wheat and maize (as well as soybeans) despite low prices,
possibly indicative of tight cash flows. The forward curve
for soybeans, reflecting the harvest-time norm over the
last several years, was slightly inclined – exhibiting a USD 4
difference for the November 2017/November 2018 spread
versus a small carry of USD 1 (contango) for the November
2016/ November 2017 spread.
VOLUMES
Trade volumes, which reached record or near record levels for
wheat, maize and soybeans in 2016, were poised to match
or exceed those levels for wheat and maize but projected
to decline by about 15 percent for soybeans. Similar to last
year, when prices were seeking market clearing levels while
exhibiting low volatility, volumes defied the conventional
wisdom that low prices deter trading interest. However,
trading has been increasingly generated by algorithmic
programs (about 50 percent according to the CME) which
often seek small anomalies across several markets and
increasingly operate without human supervision. Additionally,
open interest (the number of outstanding contracts at a
given point in time for a futures contract) increased for maize
and soybeans futures markets year-on-year (y/y) and for all
three commodities when options on futures were included.
Options trading increased y/y by almost 30 percent for maize
and soybeans, and 16 percent for wheat. This probably
reflects the rising electronic trade in these markets – now
representing 70 percent – which have been slow to migrate
away from the “open outcry” mode of trading.
Forward curves snapshots as of October 2015, 2016 and 2017
Wheat
Maize
Soybeans
150
160
170
180
190
200
MayMarchDecSeptJulyMayMarchDec
2017
2015
2016
USD per tonne
130
140
150
160
170
MayMarchDecSeptJulyMayMarchDec
2017
2015
2016
USD per tonne
320
330
340
350
360
370
380
390
MarJanNovSeptAugJulMayMarJanNov
2017
2015
2016
USD per tonne
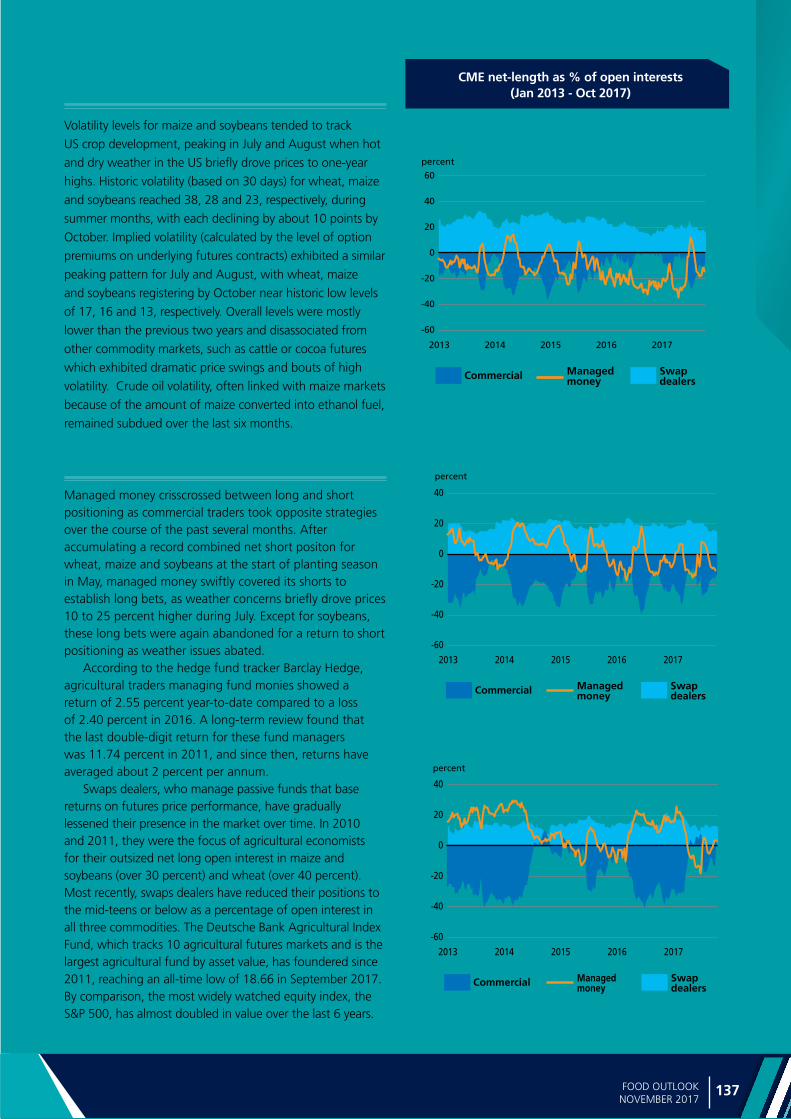
Ma
rke
t ind
icato
rs
136 137FOOD OUTLOOKNOVEMBER 2017
VOLATILITY
Volatility levels for maize and soybeans tended to track
US crop development, peaking in July and August when hot
and dry weather in the US briefly drove prices to one-year
highs. Historic volatility (based on 30 days) for wheat, maize
and soybeans reached 38, 28 and 23, respectively, during
summer months, with each declining by about 10 points by
October. Implied volatility (calculated by the level of option
premiums on underlying futures contracts) exhibited a similar
peaking pattern for July and August, with wheat, maize
and soybeans registering by October near historic low levels
of 17, 16 and 13, respectively. Overall levels were mostly
lower than the previous two years and disassociated from
other commodity markets, such as cattle or cocoa futures
which exhibited dramatic price swings and bouts of high
volatility. Crude oil volatility, often linked with maize markets
because of the amount of maize converted into ethanol fuel,
remained subdued over the last six months.
INVESTMENT FLOWS
Managed money crisscrossed between long and short positioning as commercial traders took opposite strategies over the course of the past several months. After accumulating a record combined net short positon for wheat, maize and soybeans at the start of planting season in May, managed money swiftly covered its shorts to establish long bets, as weather concerns briefly drove prices 10 to 25 percent higher during July. Except for soybeans, these long bets were again abandoned for a return to short positioning as weather issues abated.
According to the hedge fund tracker Barclay Hedge, agricultural traders managing fund monies showed a return of 2.55 percent year-to-date compared to a loss of 2.40 percent in 2016. A long-term review found that the last double-digit return for these fund managers was 11.74 percent in 2011, and since then, returns have averaged about 2 percent per annum.
Swaps dealers, who manage passive funds that base returns on futures price performance, have gradually lessened their presence in the market over time. In 2010 and 2011, they were the focus of agricultural economists for their outsized net long open interest in maize and soybeans (over 30 percent) and wheat (over 40 percent). Most recently, swaps dealers have reduced their positions to the mid-teens or below as a percentage of open interest in all three commodities. The Deutsche Bank Agricultural Index Fund, which tracks 10 agricultural futures markets and is the largest agricultural fund by asset value, has foundered since 2011, reaching an all-time low of 18.66 in September 2017. By comparison, the most widely watched equity index, the S&P 500, has almost doubled in value over the last 6 years.
CME net-length as % of open interests (Jan 2013 - Oct 2017)
Maize
Soybeans
Wheat
-60
-40
-20
0
20
40
60
20172016201520142013
percent
Commercial Managedmoney
Swapdealers
-60
-40
-20
0
20
40
20172016201520142013
percent
Commercial Managedmoney
Swapdealers
-60
-40
-20
0
20
40
20172016201520142013
percent
Commercial Managedmoney
Swapdealers

Ma
rke
t in
dic
ato
rs
138 139FOOD OUTLOOKNOVEMBER 2017
Ocean freight rates
OCEAN FREIGHT MARKET (OCTOBER 2016 - OCTOBER 2017)
The dry bulk freight market posted solid gains over the
past six months, although trends were two-sided, with
sectors for the largest vessels remaining distinctly volatile.
Weakness initially reflected a seasonal slowdown in
demand, coupled with uncertainties about global trade.
However, markets edged higher since mid-July, with the
Baltic Dry Index (BDI) – a composite measure of activity
on key routes – reaching its highest since March 2014, on
broad-based gains across constituent segments. Reflecting
cautious optimism among market participants against a
brighter economic backdrop and improved fundamentals,
the BDI was up by 86% y/y.
Gains over the past six months were steepest for
Capesize vessels, primarily associated with the shipment
of heavy raw materials. Pressured by limited activity on
key iron ore routes from Western Australia and Brazil, the
corresponding Baltic sub-Index bottomed out in mid-July,
dropping by more than two-thirds since late April. Values
mostly soared thereafter on renewed buying interest
from China, highlighted by record iron ore imports in
September, with coal deliveries in the same month at
a near-three year high. With occasional support from
strength on transatlantic routes and an upturn in period
fixing, the sub-Index was 92% higher y/y.
Panamax rates also exhibited mixed trends throughout
the period. With steep losses in May-June followed by volatile
growth, average values firmed slightly since late April, but
registered a sharp y/y increase. Initial declines mainly stemmed
from limited activity out of South America, particularly for
new crop grains and oilseeds. A weaker tone in Australia and
Indonesia amid increasing tonnage supply in the Pacific also
weighed on sentiment.
Despite occasional pressure from excess tonnage in some
regions, the market staged a recovery in the period since,
the sub-Index touching a near four-year high more recently.
Dispatches from South America and the USA ramped up
in recent months, with Brazil a particularly active exporter
Baltic Capesize sub-Index(20 October 2016 - 20 October 2017)
Baltic Exchange sub-Indices – Grains and oilseeds carrying sectors(20 October 2016 - 20 October 2017)
Contributed by the International Grains Council (IGC) www.igc.int
Summary of dry bulk freight markets
20 October 2017 Changes
6 months y/y
%
Baltic Dry Index (BDI)* 1 578 27 86
Sub-indices:
Capesize 3 145 58 92
Panamax 1 643 6 82
Supramax 1 126 25 63
Handysize 679 19 60
Source: Baltic Exchange, * 4 January 1985 = 1000
0
25
50
75
100
125
150
175
200
OSAJJMAMFJDN2016 2017
20 Oct 2016 = 100
50
75
100
125
150
175
200
OSAJJMAMFJDN2016 2017
Supramax Handysize Panamax
20 Oct 2016 = 100
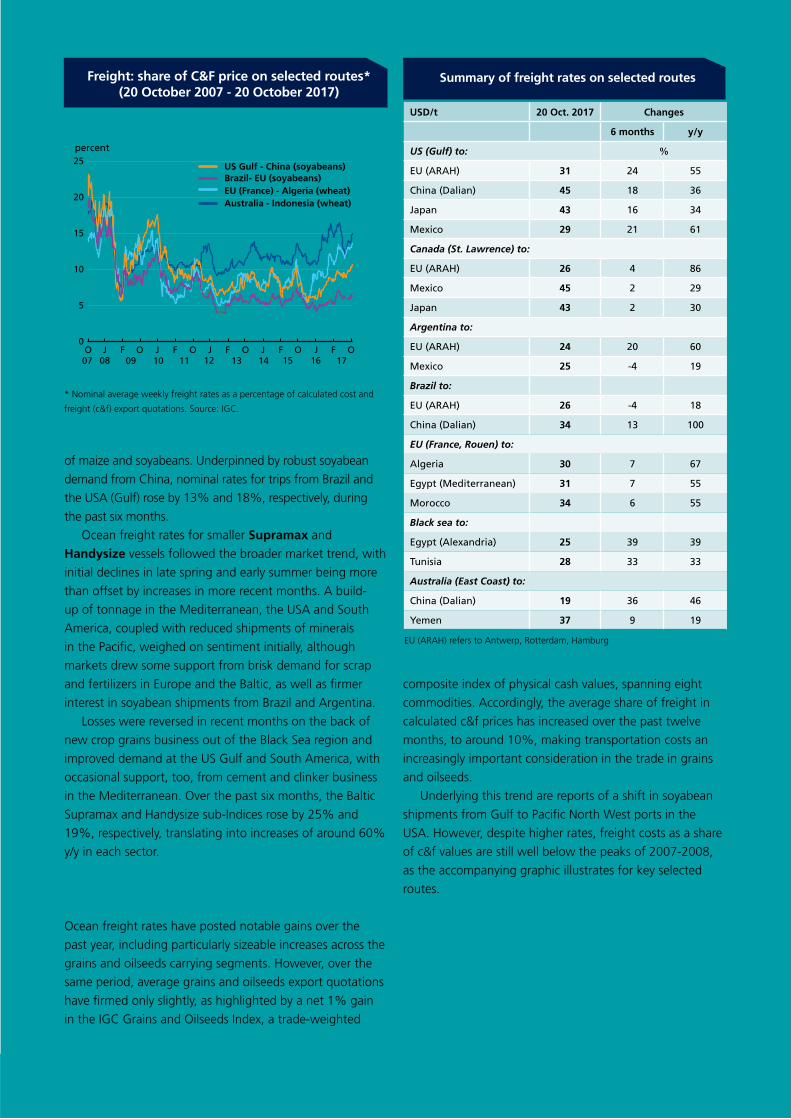
Ma
rke
t ind
icato
rs
138 139FOOD OUTLOOKNOVEMBER 2017
Freight: share of C&F price on selected routes* (20 October 2007 - 20 October 2017)
of maize and soyabeans. Underpinned by robust soyabean
demand from China, nominal rates for trips from Brazil and
the USA (Gulf) rose by 13% and 18%, respectively, during
the past six months.
Ocean freight rates for smaller Supramax and
Handysize vessels followed the broader market trend, with
initial declines in late spring and early summer being more
than offset by increases in more recent months. A build-
up of tonnage in the Mediterranean, the USA and South
America, coupled with reduced shipments of minerals
in the Pacific, weighed on sentiment initially, although
markets drew some support from brisk demand for scrap
and fertilizers in Europe and the Baltic, as well as firmer
interest in soyabean shipments from Brazil and Argentina.
Losses were reversed in recent months on the back of
new crop grains business out of the Black Sea region and
improved demand at the US Gulf and South America, with
occasional support, too, from cement and clinker business
in the Mediterranean. Over the past six months, the Baltic
Supramax and Handysize sub-Indices rose by 25% and
19%, respectively, translating into increases of around 60%
y/y in each sector.
Long-term dry bulk freight market developmentsOcean freight rates have posted notable gains over the
past year, including particularly sizeable increases across the
grains and oilseeds carrying segments. However, over the
same period, average grains and oilseeds export quotations
have firmed only slightly, as highlighted by a net 1% gain
in the IGC Grains and Oilseeds Index, a trade-weighted
Summary of freight rates on selected routes
USD/t 20 Oct. 2017 Changes
6 months y/y
US (Gulf) to: %
EU (ARAH) 31 24 55
China (Dalian) 45 18 36
Japan 43 16 34
Mexico 29 21 61
Canada (St. Lawrence) to:
EU (ARAH) 26 4 86
Mexico 45 2 29
Japan 43 2 30
Argentina to:
EU (ARAH) 24 20 60
Mexico 25 -4 19
Brazil to:
EU (ARAH) 26 -4 18
China (Dalian) 34 13 100
EU (France, Rouen) to:
Algeria 30 7 67
Egypt (Mediterranean) 31 7 55
Morocco 34 6 55
Black sea to:
Egypt (Alexandria) 25 39 39
Tunisia 28 33 33
Australia (East Coast) to:
China (Dalian) 19 36 46
Yemen 37 9 19
composite index of physical cash values, spanning eight
commodities. Accordingly, the average share of freight in
calculated c&f prices has increased over the past twelve
months, to around 10%, making transportation costs an
increasingly important consideration in the trade in grains
and oilseeds.
Underlying this trend are reports of a shift in soyabean
shipments from Gulf to Pacific North West ports in the
USA. However, despite higher rates, freight costs as a share
of c&f values are still well below the peaks of 2007-2008,
as the accompanying graphic illustrates for key selected
routes.
* Nominal average weekly freight rates as a percentage of calculated cost and
freight (c&f) export quotations. Source: IGC.
EU (ARAH) refers to Antwerp, Rotterdam, Hamburg
0
5
10
15
20
25
OFJOFJOFJOFJOFJO07
US Gulf - China (soyabeans)
08 09 10 11 12 13 14 15 16 17
EU (France) - Algeria (wheat)Australia - Indonesia (wheat)
Brazil- EU (soyabeans)
percent
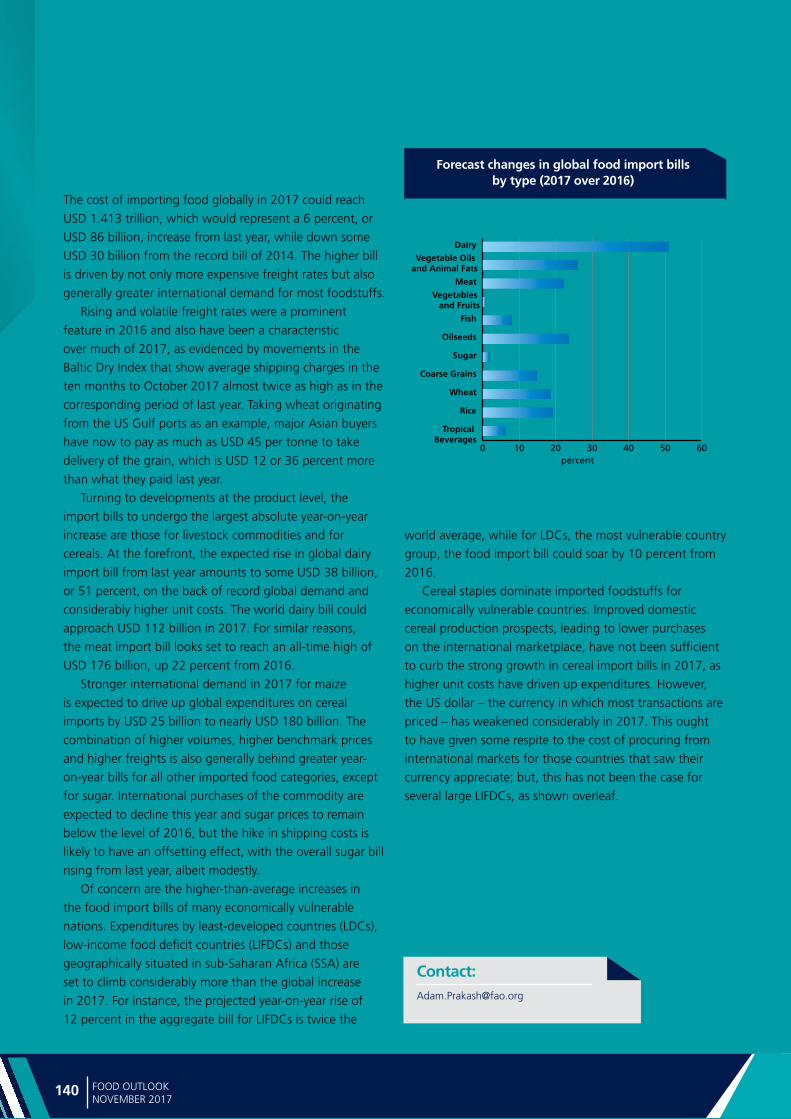
Ma
rke
t in
dic
ato
rs
140 141FOOD OUTLOOKNOVEMBER 2017
Food import bills
Forecast changes in global food import bills by type (2017 over 2016)
World food import bill in 2017 second highest on record The cost of importing food globally in 2017 could reach
USD 1.413 trillion, which would represent a 6 percent, or
USD 86 billion, increase from last year, while down some
USD 30 billion from the record bill of 2014. The higher bill
is driven by not only more expensive freight rates but also
generally greater international demand for most foodstuffs.
Rising and volatile freight rates were a prominent
feature in 2016 and also have been a characteristic
over much of 2017, as evidenced by movements in the
Baltic Dry Index that show average shipping charges in the
ten months to October 2017 almost twice as high as in the
corresponding period of last year. Taking wheat originating
from the US Gulf ports as an example, major Asian buyers
have now to pay as much as USD 45 per tonne to take
delivery of the grain, which is USD 12 or 36 percent more
than what they paid last year.
Turning to developments at the product level, the
import bills to undergo the largest absolute year-on-year
increase are those for livestock commodities and for
cereals. At the forefront, the expected rise in global dairy
import bill from last year amounts to some USD 38 billion,
or 51 percent, on the back of record global demand and
considerably higher unit costs. The world dairy bill could
approach USD 112 billion in 2017. For similar reasons,
the meat import bill looks set to reach an all-time high of
USD 176 billion, up 22 percent from 2016.
Stronger international demand in 2017 for maize
is expected to drive up global expenditures on cereal
imports by USD 25 billion to nearly USD 180 billion. The
combination of higher volumes, higher benchmark prices
and higher freights is also generally behind greater year-
on-year bills for all other imported food categories, except
for sugar. International purchases of the commodity are
expected to decline this year and sugar prices to remain
below the level of 2016, but the hike in shipping costs is
likely to have an offsetting effect, with the overall sugar bill
rising from last year, albeit modestly.
Of concern are the higher-than-average increases in
the food import bills of many economically vulnerable
nations. Expenditures by least-developed countries (LDCs),
low-income food deficit countries (LIFDCs) and those
geographically situated in sub-Saharan Africa (SSA) are
set to climb considerably more than the global increase
in 2017. For instance, the projected year-on-year rise of
12 percent in the aggregate bill for LIFDCs is twice the
world average, while for LDCs, the most vulnerable country
group, the food import bill could soar by 10 percent from
2016.
Cereal staples dominate imported foodstuffs for
economically vulnerable countries. Improved domestic
cereal production prospects, leading to lower purchases
on the international marketplace, have not been sufficient
to curb the strong growth in cereal import bills in 2017, as
higher unit costs have driven up expenditures. However,
the US dollar – the currency in which most transactions are
priced – has weakened considerably in 2017. This ought
to have given some respite to the cost of procuring from
international markets for those countries that saw their
currency appreciate; but, this has not been the case for
several large LIFDCs, as shown overleaf.
Contact:[email protected]
0 10 20 30 40 50 60percent
Tropical Beverages
Rice
Wheat
Coarse Grains
Sugar
Oilseeds
Fish
Vegetables and Fruits
Meat
Vegetable Oils and Animal Fats
Dairy
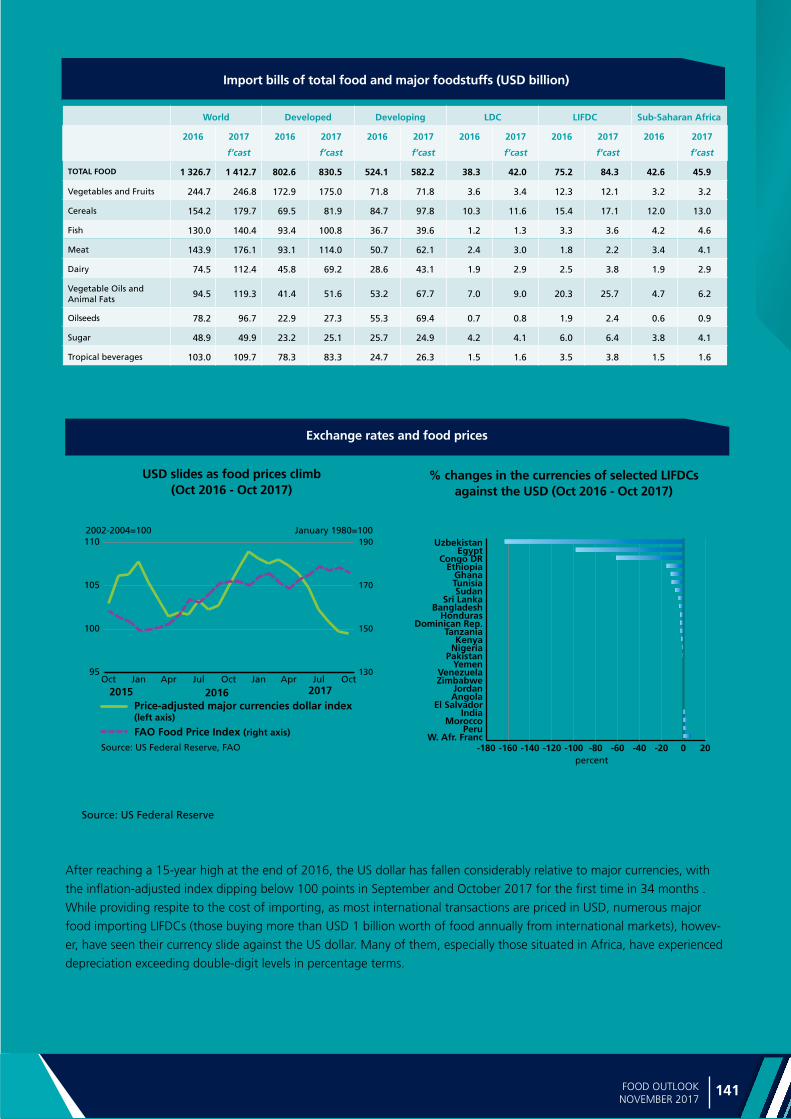
Ma
rke
t ind
icato
rs
140 141FOOD OUTLOOKNOVEMBER 2017
World Developed Developing LDC LIFDC Sub-Saharan Africa
2016 2017
f’cast
2016 2017
f’cast
2016 2017
f’cast
2016 2017
f’cast
2016 2017
f’cast
2016 2017
f’cast
TOTAL FOOD 1 326.7 1 412.7 802.6 830.5 524.1 582.2 38.3 42.0 75.2 84.3 42.6 45.9
Vegetables and Fruits 244.7 246.8 172.9 175.0 71.8 71.8 3.6 3.4 12.3 12.1 3.2 3.2
Cereals 154.2 179.7 69.5 81.9 84.7 97.8 10.3 11.6 15.4 17.1 12.0 13.0
Fish 130.0 140.4 93.4 100.8 36.7 39.6 1.2 1.3 3.3 3.6 4.2 4.6
Meat 143.9 176.1 93.1 114.0 50.7 62.1 2.4 3.0 1.8 2.2 3.4 4.1
Dairy 74.5 112.4 45.8 69.2 28.6 43.1 1.9 2.9 2.5 3.8 1.9 2.9
Vegetable Oils and Animal Fats 94.5 119.3 41.4 51.6 53.2 67.7 7.0 9.0 20.3 25.7 4.7 6.2
Oilseeds 78.2 96.7 22.9 27.3 55.3 69.4 0.7 0.8 1.9 2.4 0.6 0.9
Sugar 48.9 49.9 23.2 25.1 25.7 24.9 4.2 4.1 6.0 6.4 3.8 4.1
Tropical beverages 103.0 109.7 78.3 83.3 24.7 26.3 1.5 1.6 3.5 3.8 1.5 1.6
Import bills of total food and major foodstuffs (USD billion)
Exchange rates and food prices
% changes in the currencies of selected LIFDCs against the USD (Oct 2016 - Oct 2017)
USD slides as food prices climb (Oct 2016 - Oct 2017)
After reaching a 15-year high at the end of 2016, the US dollar has fallen considerably relative to major currencies, with
the inflation-adjusted index dipping below 100 points in September and October 2017 for the first time in 34 months .
While providing respite to the cost of importing, as most international transactions are priced in USD, numerous major
food importing LIFDCs (those buying more than USD 1 billion worth of food annually from international markets), howev-
er, have seen their currency slide against the US dollar. Many of them, especially those situated in Africa, have experienced
depreciation exceeding double-digit levels in percentage terms.
Source: US Federal Reserve
-180 -160 -140 -120 -100 -80 -60 -40 -20 0 20W. Afr. Franc
PeruMorocco
IndiaEl Salvador
AngolaJordan
ZimbabweVenezuela
YemenPakistanNigeriaKenya
TanzaniaDominican Rep.
HondurasBangladesh
Sri LankaSudan
TunisiaGhana
EthiopiaCongo DR
EgyptUzbekistan
percent
95
100
105
110
OctJulAprJanOctJulAprJanOct130
150
170
1902002-2004=100 January 1980=100
Price-adjusted major currencies dollar index (left axis)
FAO Food Price Index (right axis)
Source: US Federal Reserve, FAO
2016 20172015
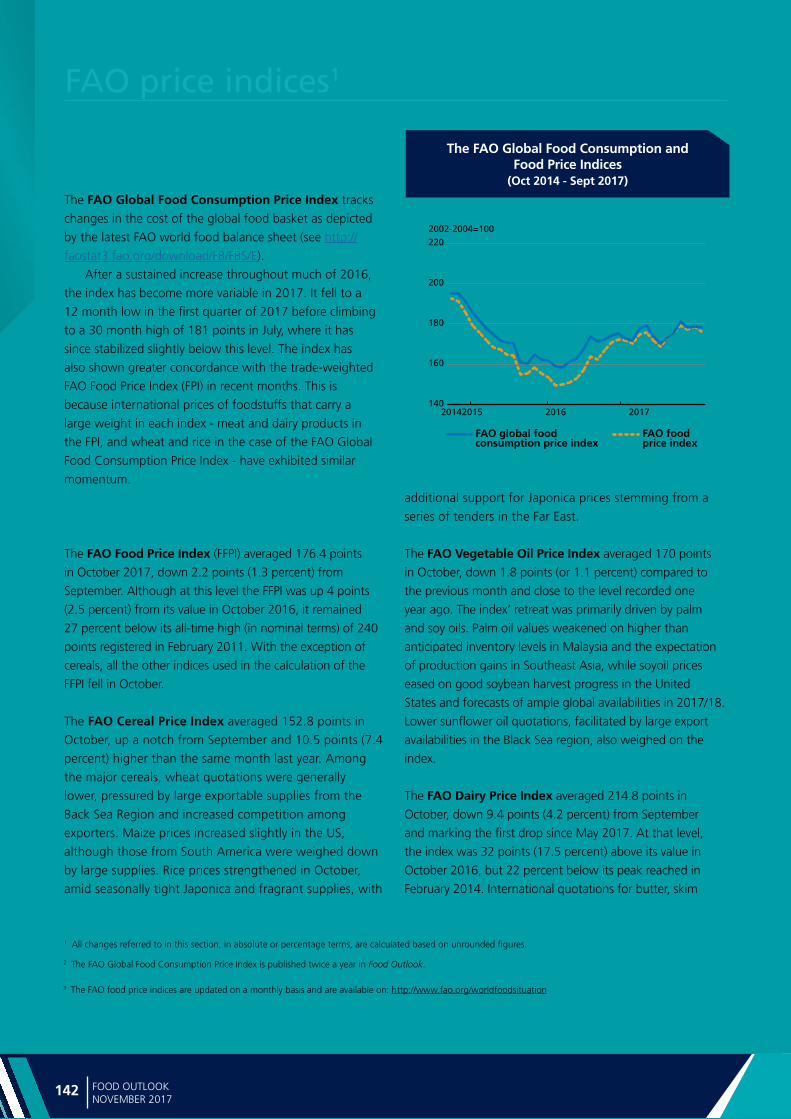
Ma
rke
t in
dic
ato
rs
142 143FOOD OUTLOOKNOVEMBER 2017
FAO price indices1
FAO Global Food Consumption Price Index higher but steady2
The FAO Global Food Consumption Price Index tracks
changes in the cost of the global food basket as depicted
by the latest FAO world food balance sheet (see http://
faostat3.fao.org/download/FB/FBS/E).
After a sustained increase throughout much of 2016,
the index has become more variable in 2017. It fell to a
12 month low in the first quarter of 2017 before climbing
to a 30 month high of 181 points in July, where it has
since stabilized slightly below this level. The index has
also shown greater concordance with the trade-weighted
FAO Food Price Index (FPI) in recent months. This is
because international prices of foodstuffs that carry a
large weight in each index - meat and dairy products in
the FPI, and wheat and rice in the case of the FAO Global
Food Consumption Price Index - have exhibited similar
momentum.
FAO Food Price Index edges down in October3
The FAO Food Price Index (FFPI) averaged 176.4 points
in October 2017, down 2.2 points (1.3 percent) from
September. Although at this level the FFPI was up 4 points
(2.5 percent) from its value in October 2016, it remained
27 percent below its all-time high (in nominal terms) of 240
points registered in February 2011. With the exception of
cereals, all the other indices used in the calculation of the
FFPI fell in October.
The FAO Cereal Price Index averaged 152.8 points in
October, up a notch from September and 10.5 points (7.4
percent) higher than the same month last year. Among
the major cereals, wheat quotations were generally
lower, pressured by large exportable supplies from the
Back Sea Region and increased competition among
exporters. Maize prices increased slightly in the US,
although those from South America were weighed down
by large supplies. Rice prices strengthened in October,
amid seasonally tight Japonica and fragrant supplies, with
1 All changes referred to in this section, in absolute or percentage terms, are calculated based on unrounded figures.
The FAO Global Food Consumption and Food Price Indices
(Oct 2014 - Sept 2017)
additional support for Japonica prices stemming from a
series of tenders in the Far East.
The FAO Vegetable Oil Price Index averaged 170 points
in October, down 1.8 points (or 1.1 percent) compared to
the previous month and close to the level recorded one
year ago. The index’ retreat was primarily driven by palm
and soy oils. Palm oil values weakened on higher than
anticipated inventory levels in Malaysia and the expectation
of production gains in Southeast Asia, while soyoil prices
eased on good soybean harvest progress in the United
States and forecasts of ample global availabilities in 2017/18.
Lower sunflower oil quotations, facilitated by large export
availabilities in the Black Sea region, also weighed on the
index.
The FAO Dairy Price Index averaged 214.8 points in
October, down 9.4 points (4.2 percent) from September
and marking the first drop since May 2017. At that level,
the index was 32 points (17.5 percent) above its value in
October 2016, but 22 percent below its peak reached in
February 2014. International quotations for butter, skim
3 The FAO food price indices are updated on a monthly basis and are available on: http://www.fao.org/worldfoodsituation
2 The FAO Global Food Consumption Price Index is published twice a year in Food Outlook.
140
160
180
200
220
2017201620152014
2002-2004=100
FAO global foodconsumption price index
FAO foodprice index
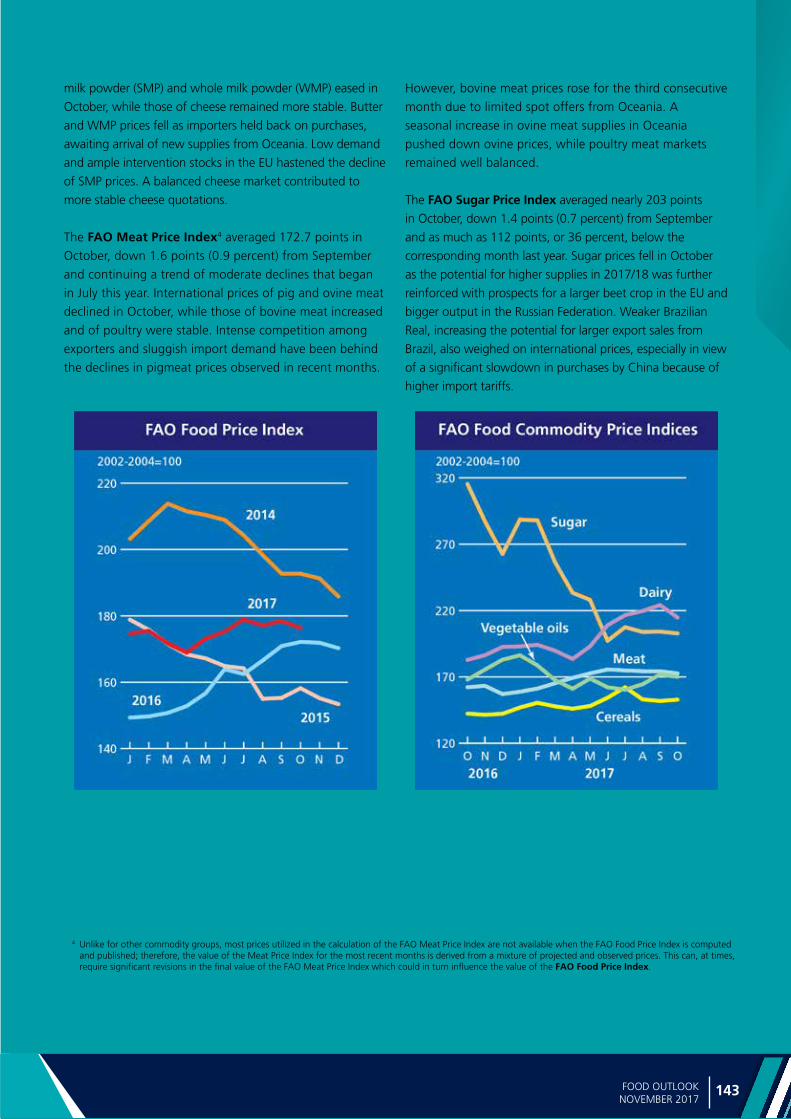
Ma
rke
t ind
icato
rs
142 143FOOD OUTLOOKNOVEMBER 2017
milk powder (SMP) and whole milk powder (WMP) eased in
October, while those of cheese remained more stable. Butter
and WMP prices fell as importers held back on purchases,
awaiting arrival of new supplies from Oceania. Low demand
and ample intervention stocks in the EU hastened the decline
of SMP prices. A balanced cheese market contributed to
more stable cheese quotations.
The FAO Meat Price Index4 averaged 172.7 points in
October, down 1.6 points (0.9 percent) from September
and continuing a trend of moderate declines that began
in July this year. International prices of pig and ovine meat
declined in October, while those of bovine meat increased
and of poultry were stable. Intense competition among
exporters and sluggish import demand have been behind
the declines in pigmeat prices observed in recent months.
However, bovine meat prices rose for the third consecutive
month due to limited spot offers from Oceania. A
seasonal increase in ovine meat supplies in Oceania
pushed down ovine prices, while poultry meat markets
remained well balanced.
The FAO Sugar Price Index averaged nearly 203 points
in October, down 1.4 points (0.7 percent) from September
and as much as 112 points, or 36 percent, below the
corresponding month last year. Sugar prices fell in October
as the potential for higher supplies in 2017/18 was further
reinforced with prospects for a larger beet crop in the EU and
bigger output in the Russian Federation. Weaker Brazilian
Real, increasing the potential for larger export sales from
Brazil, also weighed on international prices, especially in view
of a significant slowdown in purchases by China because of
higher import tariffs.
4 Unlike for other commodity groups, most prices utilized in the calculation of the FAO Meat Price Index are not available when the FAO Food Price Index is computed and published; therefore, the value of the Meat Price Index for the most recent months is derived from a mixture of projected and observed prices. This can, at times, require significant revisions in the final value of the FAO Meat Price Index which could in turn influence the value of the FAO Food Price Index.
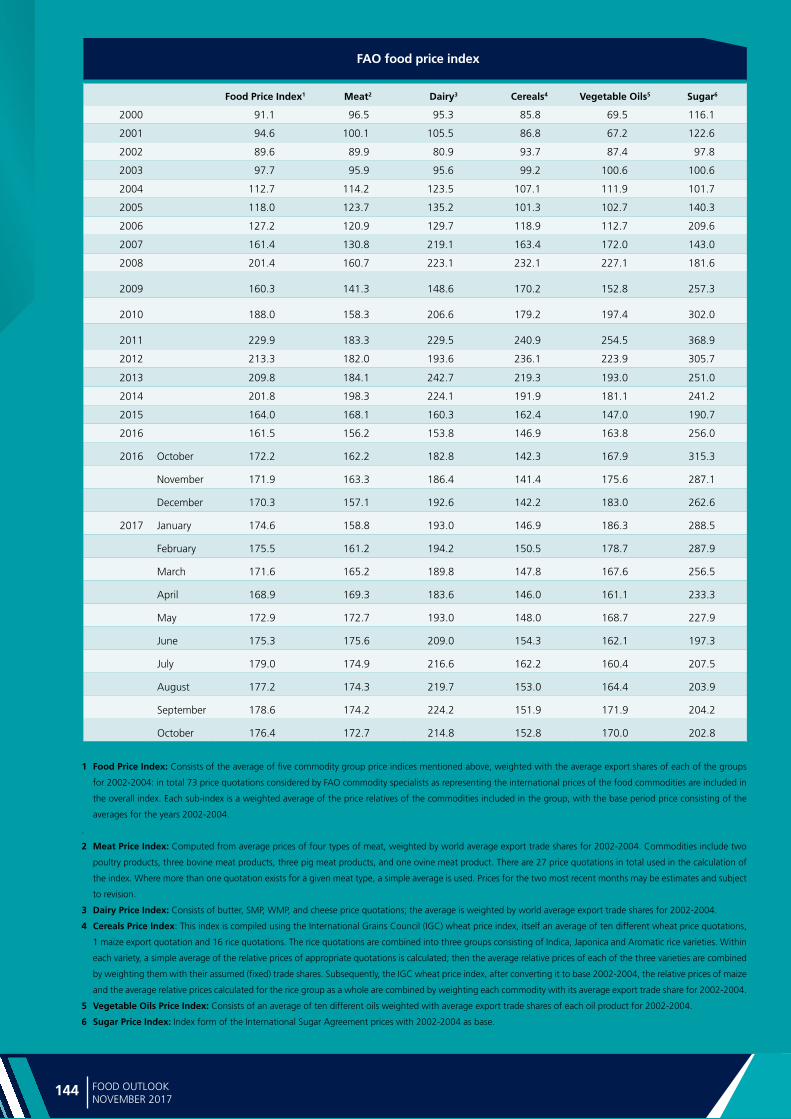
Ma
rke
t in
dic
ato
rs
144 PBFOOD OUTLOOKNOVEMBER 2017
Food Price Index1 Meat2 Dairy3 Cereals4 Vegetable Oils5 Sugar6
2000 91.1 96.5 95.3 85.8 69.5 116.1
2001 94.6 100.1 105.5 86.8 67.2 122.6
2002 89.6 89.9 80.9 93.7 87.4 97.8
2003 97.7 95.9 95.6 99.2 100.6 100.6
2004 112.7 114.2 123.5 107.1 111.9 101.7
2005 118.0 123.7 135.2 101.3 102.7 140.3
2006 127.2 120.9 129.7 118.9 112.7 209.6
2007 161.4 130.8 219.1 163.4 172.0 143.0
2008 201.4 160.7 223.1 232.1 227.1 181.6
2009 160.3 141.3 148.6 170.2 152.8 257.3
2010 188.0 158.3 206.6 179.2 197.4 302.0
2011 229.9 183.3 229.5 240.9 254.5 368.9
2012 213.3 182.0 193.6 236.1 223.9 305.7
2013 209.8 184.1 242.7 219.3 193.0 251.0
2014 201.8 198.3 224.1 191.9 181.1 241.2
2015 164.0 168.1 160.3 162.4 147.0 190.7
2016 161.5 156.2 153.8 146.9 163.8 256.0
2016 October 172.2 162.2 182.8 142.3 167.9 315.3
November 171.9 163.3 186.4 141.4 175.6 287.1
December 170.3 157.1 192.6 142.2 183.0 262.6
2017 January 174.6 158.8 193.0 146.9 186.3 288.5
February 175.5 161.2 194.2 150.5 178.7 287.9
March 171.6 165.2 189.8 147.8 167.6 256.5
April 168.9 169.3 183.6 146.0 161.1 233.3
May 172.9 172.7 193.0 148.0 168.7 227.9
June 175.3 175.6 209.0 154.3 162.1 197.3
July 179.0 174.9 216.6 162.2 160.4 207.5
August 177.2 174.3 219.7 153.0 164.4 203.9
September 178.6 174.2 224.2 151.9 171.9 204.2
October 176.4 172.7 214.8 152.8 170.0 202.8
FAO food price index
1 Food Price Index: Consists of the average of five commodity group price indices mentioned above, weighted with the average export shares of each of the groups
for 2002-2004: in total 73 price quotations considered by FAO commodity specialists as representing the international prices of the food commodities are included in
the overall index. Each sub-index is a weighted average of the price relatives of the commodities included in the group, with the base period price consisting of the
averages for the years 2002-2004.
.
2 Meat Price Index: Computed from average prices of four types of meat, weighted by world average export trade shares for 2002-2004. Commodities include two
poultry products, three bovine meat products, three pig meat products, and one ovine meat product. There are 27 price quotations in total used in the calculation of
the index. Where more than one quotation exists for a given meat type, a simple average is used. Prices for the two most recent months may be estimates and subject
to revision.
3 Dairy Price Index: Consists of butter, SMP, WMP, and cheese price quotations; the average is weighted by world average export trade shares for 2002-2004.
4 Cereals Price Index: This index is compiled using the International Grains Council (IGC) wheat price index, itself an average of ten different wheat price quotations,
1 maize export quotation and 16 rice quotations. The rice quotations are combined into three groups consisting of Indica, Japonica and Aromatic rice varieties. Within
each variety, a simple average of the relative prices of appropriate quotations is calculated; then the average relative prices of each of the three varieties are combined
by weighting them with their assumed (fixed) trade shares. Subsequently, the IGC wheat price index, after converting it to base 2002-2004, the relative prices of maize
and the average relative prices calculated for the rice group as a whole are combined by weighting each commodity with its average export trade share for 2002-2004.
5 Vegetable Oils Price Index: Consists of an average of ten different oils weighted with average export trade shares of each oil product for 2002-2004.
6 Sugar Price Index: Index form of the International Sugar Agreement prices with 2002-2004 as base.
New release!
FAO’s Tropical Fruits Market Review provides an overview of the current status and short-term outlook in the global supply and demand of tropical fruits, as well as an assessment of the emerging issues and challenges facing the
commodity group. It is published on an annual basis for the auspices of Members and Observers of the Sub-Group on Tropical Fruits of the Intergovernmental Group on Bananas and Tropical Fruits. While emphasis is on the four major tropical fruits – mango, pineapple, avocado and papaya, the Review also elaborates on market developments for processed products and minor tropical fruits. In addition, a detailed compilation of the latest statistics on tropical fruit production, imports, exports and prices are presented in the supplementary statistical annex.
The Market Review and its statistical annexes will be available at the FAO commodity website on tropical fruits:
http://www.fao.org/economic/est/est-commodities/tropical-fruits/en/

Food Outlook is published by the Trade and Markets Division of FAO under Global Information and Early Warning System (GIEWS). It is a
biannual publication focusing on developments affecting global food and feed markets. Each report provides comprehensive assessments and short term forecasts for production, utilization, trade, stocks and prices on a commodity by commodity basis and includes feature articles on topical issues. Food Outlook maintains a close synergy with another major GIEWS publication, Crop Prospects and Food Situation, especially with regard to the coverage of cereals. Food Outlook is available in English. The summary section is also available in Arabic, Chinese, French, Russian and Spanish.
Food Outlook and other GIEWS reports are available on the internet as part of the FAO world wide web (http://www.fao.org/) at the following URL address: http://www.fao.org/giews/. Other relevant studies on markets and global food situation can be found at http://www.fao.org/worldfoodsituation.
This report is based on information available up to late October 2017.
For enquiries or further information contact:
Abdolreza Abbassian
Trade and Markets Division
Food and Agriculture Organization of the United Nations
Viale delle Terme di Caracalla
00153 Rome - Italy
Telephone: 0039-06-5705-3264
Facsimile: 0039-06-5705-4495
E-mail: [email protected] or [email protected]
I8080EN/1/11.17
ISBN 978-92-5-130012-1
9 7 8 9 2 5 1 3 0 0 1 2 1