ISSN 0251-1959 Food O utlook · Food O utlook BIANNUAL REPORT ON GLOBAL FOOD MARKETS ISSN 0251-1959...
141
Food Outlook BIANNUAL REPORT ON GLOBAL FOOD MARKETS ISSN 0251-1959 October 2016
Transcript of ISSN 0251-1959 Food O utlook · Food O utlook BIANNUAL REPORT ON GLOBAL FOOD MARKETS ISSN 0251-1959...

Food Outlook B IANNUAL REPORT ON GLOBAL FOOD MARKETS
ISSN 0251-1959
October 2016

ACKNOWLEDGEMENTS
The designations employed and the presentation of material in this information product do not imply the expression of any opinion whatsoever on the part of the Food and Agriculture Organization of the United Nations (FAO) concerning the legal or development status of any country, territory, city or area or of its authorities, or concerning the delimitation of its frontiers or boundaries. The mention of specific companies or products of manufacturers, whether or not these have been patented, does not imply that these have been endorsed or recommended by FAO in preference to others of a similar nature that are not mentioned.
ISSN: 0251-1959 (print)ISSN 1560-8182 (Online)
© FAO 2016
FAO encourages the use, reproduction and dissemination of material in this information product. Except where otherwise indicated, material may be copied, downloaded and printed for private study, research and teaching purposes, or for use in non-commercial products or services, provided that appropriate acknowledgement of FAO as the source and copyright holder is given and that FAO’s endorsement of users’ views, products or services is not implied in any way.
All requests for translation and adaptation rights, and for resale and other commercial use rights should be made via www.fao.org/contact-us/licencerequest
or addressed to [email protected].
FAO information products are available on the FAO website (www.fao.org/publications) and can be purchased through [email protected]
Photo credits:©FAO/Pius EkpeiMorguefile
The Food Outlook report is a product of the FAO Trade and Markets Division. This report is prepared under the overall guidance of Boubaker Ben-Belhassen, Director, and Abdolreza Abbassian, Senior Economist. It is written by a team of economists, whose names and email contacts appear under their respective market summary contributions. The report benefited from research support by many staff, namely, Andrea Alesiani, David Bedford, Claudio Cerquiglini, Julie Claro, Grace Karumathy, Lavinia Lucarelli, David Mancini, Emanuele Marocco, Marco Milo and the fisheries statistical team.
Special thanks go to Claudio Cerquiglini for preparing the charts and statistical tables and to Valentina Banti for her administrative support. Additionally, the team is grateful to Concepción Calpe and Nancy Hart for their valuable inputs and editorial assistance.

World rice production is predicted to
expand in 2016 for the first time in
three years, reaching a new record.
In the absence of substantial sales,
good crop prospects in the Northern
Hemisphere weigh on international
prices, with early expectations pointing
to import demand remaining subdued
in 2017.
RICE
Global production to rebound in 2016,
largely on anticipation of a record
output in the United States. However,
world stocks could decline somewhat,
led by drawdowns in China, Brazil and
South Africa. Large export availabilities
are likely to keep international prices
under downward pressure.
COARSE GRAINS
Preliminary forecasts for 2016/17
point to a relatively balanced global
supply and demand situation for both
meals and oils. Global oil and meal
output is anticipated to rebound,
underpinned by a recovery in soybean
and palm oil production, while world
demand is expected to keep growing
at a steady pace.
OILCROPSCassava is set to resume its status as one
of the fastest expanding food crops,
with its production rebounding from
last year. The significant contraction
in international trade so far in 2016
has exposed the high vulnerability
of cassava non-food sectors to
developments in markets in which
cassava competes, especially maize.
CASSAVA
Overall world meat production
is predicted to remain at
320 million tonnes in 2016, with
growth in many countries likely to
be offset by a fall in output in China
and Australia. Global meat trade
is expected to recover, growing by
4.4 percent to 31.1 million tonnes.
MEAT
NAIROBI DECISION ON EXPORT COMPETITION
Record world production and ample
inventories keep international wheat
prices at multiple-year lows. Large
supplies of low quality wheat at
competitive prices boost usage of
wheat in feed rations. World trade in
wheat in 2016/17 is likely to remain
at record levels, with the Russian
Federation emerging as the world’s
largest wheat exporter.
WHEAT
Global fish production is forecast to
grow moderately in 2016, underpinned
by sustained gains in aquaculture.
After falling sharply in 2015 under
the influence of a strong US dollar,
the value of seafood trade is forecast
to rebound this year. A tightening of
supplies for major traded species and
firming import demand may keep
international seafood prices on the rise.
FISHERIESInternational prices of dairy products
have moved up since May, as ample
export supplies were reduced. World
milk production is expected to increase
in 2016, even though unfavourable
weather and reduced farmgate
returns could constrain output in
some countries.
DAIRY
rom a global perspective,
food markets are
expected to remain
generally well balanced
in 2016/17 amid large export
availabilities and relatively low and
more stable international prices,
especially for cereals. The world
food import bill is set to dip to a
six-year low, while still remaining
above the USD 1 trillion mark.
F
HIGHLIGHTS
Despite a general rise since the beginning of 2016, international food commodity prices have remained well below their peak values and are not projected to return to those high levels over the next decade (OECD/FAO 2016). In this context, the Decision
agreed at the 10th WTO Ministerial Conference, held in Nairobi in December 2015, to eliminate export subsidies can be important
as it prevents members from reverting to their use.


120
170
220
270
320
SAJJMAMFJDNOS
2015 2016
2002-2004=100
Dairy
Vegetable oils
Cereals
Sugar
Meat
CONTENTS1-9
88-121
122-132
74-87
68-73
11-67
Wheat 11Coarse grains 18Rice 26Cassava 34Oilcrops, oils and meals 40Meat and meat products 48Milk and milk products 54Fish and fishery products 60
Grains 75Rice 79Oilcrops 83Meat 86Dairy 87
Futures markets 123Ocean freight rates 126Food import bills 128The FAO price indices 130
Nairobi Decision on export competition 69
p69
Nairobi Decision on export competition
MARKET SUMMARIES
MARKET ASSESSMENTS
SPECIAL FEATURE
MAJOR POLICY DEVELOPMENTS
STATISTICAL TABLES
MARKET INDICATORS
FAO Food Commodity Price Indices
(Sep 2015 - Sep 2016)
©/E
nva
to
p130

Ma
rke
t su
mm
ari
es
4 FOOD OUTLOOKOCTOBER 2016
MAR
KET
SUM
MAR
IES

Ma
rke
t sum
ma
ries
1FOOD OUTLOOKOCTOBER 2016
A positive outlook for global cereal production in 2016,
together with abundant stocks, points to a generally
comfortable supply and demand balance in 2016/17.
In 2016, world cereal production is set to increase by
1.5 percent, or 38 million tonnes, to hit a new record of
2 569 million tonnes, topping by at least 5.5 million tonnes
the previous peak of 2014. The current FAO forecast is
3.4 million tonnes higher than projected in September,
with most of the upward revisions concerning wheat
and rice. World wheat production in 2016 is expected
to exceed the 2015 record by 1.2 percent, underpinned
by output increases in India, the Russian Federation and
the United States. Similarly, global rice production is
forecast to grow by 1.3 percent, to an all-time high, driven
by recoveries in Asia, as well as by gains in Africa and
North America. Global production of coarse grains is set
to rebound by 1.8 percent from last year’s reduced level,
mostly reflecting prospects for record maize crops in the
United States, Argentina and India.
Global cereal utilization in 2016/17 is projected to
expand by 1.6 percent to 2 560 million tonnes, with feed
usage, in particular, seen increasing by 2.7 percent in
2016/17, amid large supplies of maize and low quality
wheat. In spite of the projected year-on-year growth in
total cereal utilization, the rise in world cereal production in
2016 would still result in an increase in the level of global
cereal inventories. All would be in the form of wheat, as
ending inventories of coarse grains and rice are anticipated
to slide below their opening levels.
Although the world-stock-to-use ratios for wheat,
coarse grains and rice are all estimated to decline
somewhat in 2016/17, export availabilities are predicted
to remain ample. This is particularly the case for coarse
grains, which are likely to face a decline in import demand
in 2016/17.
CEREALS
Contact:[email protected]
CEREAL PRODUCTION, UTILIZATION AND STOCKS
WORLD CEREAL MARKET AT A GLANCE 1
2014/15 2015/16 estim.
2016/17 f’cast
Change: 2016/17
over 2015/16
million tonnes %
WORLD BALANCE
Production 2 563.3 2 530.7 2 569.0 1.5
Trade2 378.6 394.1 384.8 -2.4
Total utilization 2 496.4 2 520.1 2 560.2 1.6
Food 1 080.3 1 091.4 1 105.5 1.3
Feed 885.7 898.0 921.9 2.7
Other uses 530.4 530.7 532.9 0.4
Ending stocks3 654.5 655.5 659.9 0.7
SUPPLY AND DEMAND INDICATORS
Per caput food consumption:
World (kg/yr) 148.9 148.8 149.0 0.2
LIFDC4 (kg/yr) 146.8 146.2 146.6 0.3
World stock-to-use ratio (%) 26.0 25.6 25.2
Major exporters stock-to-disappearance ratio (%)
17.9 15.8 15.9
FAO CEREAL PRICE INDEX (2002-2004=100)
2014 2015 2016 Jan-Sep
Change: Jan-Sep 2016
over Jan-Sep 2015
%
192 162 149 -10.1
1 Rice in milled equivalent.2 Trade refers to exports based on a July/June marketing season for wheat and
coarse grains and on a January/December marketing season for rice.3 May not equal the difference between supply and utilization due to
differences in individual country marketing years.4 Low-Income Food-Deficit countries.
200
400
600
800
1700
2000
2300
2600
16/1714/1512/1310/1108/0906/07
Million tonnes Million tonnes
f’cast
Stocks (right axis)
Production (left axis) Utilization (left axis)

Ma
rke
t su
mm
ari
es
2 FOOD OUTLOOKOCTOBER 2016
The international wheat market in 2016/17 is likely to
witness another season of abundant supplies, amid
expectations of record production and rising stocks. At
742.4 million tonnes, FAO’s current forecast for global
wheat production in 2016 is 1.2 percent above the 2015
all-time high, with increases in India, the Russian Federation
and the United States accounting for most of the year-on-
year growth. This forecast is 1.6 million tonnes higher than
the projection reported in September, largely reflecting
improved crop prospects in Argentina and Australia.
The forecast for world wheat trade (including wheat
flour in wheat equivalent) in 2016/17 (July/June) has
been raised by 1.5 million tonnes since September, and
now stands at 165 million tonnes, similar to the 2015/16
record. On a regional basis, wheat imports in 2016/17 are
predicted to remain close to the previous season’s levels.
However, on the export side, an emerging feature is the
anticipated emergence of the Russian Federation as the
world largest wheat exporter, taking over from the EU
which is expected to occupy a distanced second place,
almost on par with the United States.
Total wheat utilization in 2016/17 is projected to
reach 730.5 million tonnes, almost 15 million tonnes, or
2 percent, above the 2015/16 estimate. At 498 million
tonnes, food consumption would continue to account for
the bulk of global wheat utilization. On the other hand,
the use of wheat in animal rations is forecast to increase
by 6.2 percent to 146 million tonnes, reflecting the ample
availabilities of low quality wheat at competitive prices.
World wheat stocks are forecast to increase further
in 2016/17 and reach 234 million tonnes, up 8.4 million
tonnes from their already elevated opening levels and the
highest level since 2001/02. As a result, the world wheat
stock-to-use ratio in 2016/17 would reach 31.7 percent,
well above the historic minimum of 22.7 percent registered
in 2007/08. Against this background, international wheat
prices are likely to remain stable and relatively low during
the 2016/17 season.
WHEAT
Contact:[email protected]@fao.org (Production)
WHEAT PRODUCTION, UTILIZATION AND STOCKS
WORLD WHEAT MARKET AT A GLANCE
1 Trade refers to exports based on a common July/June marketing season.2 May not equal the difference between supply (defined as production plus
carryover stocks) due to differences in individual country marketing years.3 Major exporters include Argentina, Australia, Canada, EU, Kazakhstan,
Russian Fed., Ukraine and the United States.4 Derived from the International Grains Council (IGC) wheat index.
2014/15 2015/16 estim.
2016/17 f’cast
Change: 2016/17
over 2015/16
million tonnes %
WORLD BALANCE
Production 730.5 733.8 742.4 1.2
Trade1 156.6 164.9 165.0 0.1
Total utilization 703.6 715.7 730.5 2.1
Food 486.7 493.2 498.2 1.0
Feed 133.4 137.2 145.7 6.2
Other uses 83.5 85.3 86.5 1.4
Ending stocks2 211.2 225.8 234.2 3.7
SUPPLY AND DEMAND INDICATORS
Per caput food consumption:
World (kg/yr) 67.1 67.2 67.2 -0.1
LIFDC (kg/yr) 47.4 47.6 47.5 -0.4
World stock-to-use ratio (%) 29.5 30.9 31.7
Major exporters stock-to-disappearance ratio3 (%)
16.7 16.6 17.4
FAO WHEAT PRICE INDEX4 (2002-2004=100)
2014 2015 2016 Jan-Sep
Change: Jan-Sep 2016
over Jan-Sep 2015
%
181 144 126 -14.4
100
140
180
220
260
550
600
650
700
750
16/1714/1512/1310/1108/0906/07
Million tonnes Million tonnes
f’cast
Stocks (right axis)
Production (left axis) Utilization (left axis)
Ma
rke
t sum
ma
ries
3FOOD OUTLOOKOCTOBER 2016
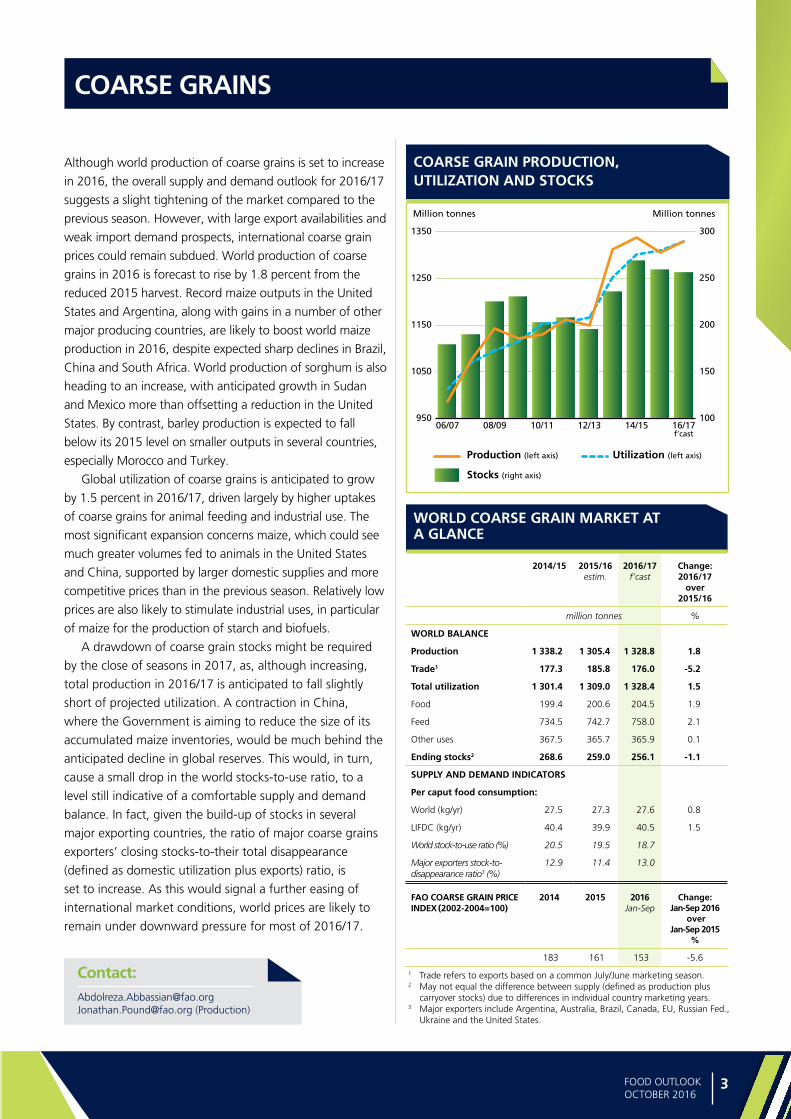
Although world production of coarse grains is set to increase
in 2016, the overall supply and demand outlook for 2016/17
suggests a slight tightening of the market compared to the
previous season. However, with large export availabilities and
weak import demand prospects, international coarse grain
prices could remain subdued. World production of coarse
grains in 2016 is forecast to rise by 1.8 percent from the
reduced 2015 harvest. Record maize outputs in the United
States and Argentina, along with gains in a number of other
major producing countries, are likely to boost world maize
production in 2016, despite expected sharp declines in Brazil,
China and South Africa. World production of sorghum is also
heading to an increase, with anticipated growth in Sudan
and Mexico more than offsetting a reduction in the United
States. By contrast, barley production is expected to fall
below its 2015 level on smaller outputs in several countries,
especially Morocco and Turkey.
Global utilization of coarse grains is anticipated to grow
by 1.5 percent in 2016/17, driven largely by higher uptakes
of coarse grains for animal feeding and industrial use. The
most significant expansion concerns maize, which could see
much greater volumes fed to animals in the United States
and China, supported by larger domestic supplies and more
competitive prices than in the previous season. Relatively low
prices are also likely to stimulate industrial uses, in particular
of maize for the production of starch and biofuels.
A drawdown of coarse grain stocks might be required
by the close of seasons in 2017, as, although increasing,
total production in 2016/17 is anticipated to fall slightly
short of projected utilization. A contraction in China,
where the Government is aiming to reduce the size of its
accumulated maize inventories, would be much behind the
anticipated decline in global reserves. This would, in turn,
cause a small drop in the world stocks-to-use ratio, to a
level still indicative of a comfortable supply and demand
balance. In fact, given the build-up of stocks in several
major exporting countries, the ratio of major coarse grains
exporters’ closing stocks-to-their total disappearance
(defined as domestic utilization plus exports) ratio, is
set to increase. As this would signal a further easing of
international market conditions, world prices are likely to
remain under downward pressure for most of 2016/17.
COARSE GRAINS
Contact:[email protected] [email protected] (Production)
COARSE GRAIN PRODUCTION, UTILIZATION AND STOCKS
1 Trade refers to exports based on a common July/June marketing season.2 May not equal the difference between supply (defined as production plus
carryover stocks) due to differences in individual country marketing years.3 Major exporters include Argentina, Australia, Brazil, Canada, EU, Russian Fed.,
Ukraine and the United States.
WORLD COARSE GRAIN MARKET AT A GLANCE
2014/15 2015/16 estim.
2016/17 f’cast
Change: 2016/17
over 2015/16
million tonnes %
WORLD BALANCE
Production 1 338.2 1 305.4 1 328.8 1.8
Trade1 177.3 185.8 176.0 -5.2
Total utilization 1 301.4 1 309.0 1 328.4 1.5
Food 199.4 200.6 204.5 1.9
Feed 734.5 742.7 758.0 2.1
Other uses 367.5 365.7 365.9 0.1
Ending stocks2 268.6 259.0 256.1 -1.1
SUPPLY AND DEMAND INDICATORS
Per caput food consumption:
World (kg/yr) 27.5 27.3 27.6 0.8
LIFDC (kg/yr) 40.4 39.9 40.5 1.5
World stock-to-use ratio (%) 20.5 19.5 18.7
Major exporters stock-to-disappearance ratio3 (%)
12.9 11.4 13.0
FAO COARSE GRAIN PRICE INDEX (2002-2004=100)
2014 2015 2016 Jan-Sep
Change: Jan-Sep 2016
over Jan-Sep 2015
%
183 161 153 -5.6
100
150
200
250
300
950
1050
1150
1250
1350
16/1714/1512/1310/1108/0906/07
Million tonnes Million tonnes
f’cast
Stocks (right axis)
Production (left axis) Utilization (left axis)

Ma
rke
t su
mm
ari
es
4 FOOD OUTLOOKOCTOBER 2016
The 2016 season is unfolding favorably in the Northern
Hemisphere, with abundant monsoon rains over Asia
more than compensating for El Niño-related setbacks
that occurred along or south of the Equator. As a
result, forecasts of world rice production in 2016 have
been upgraded to a record 497.8 million tonnes, up
6.3 million tonnes, or 1.3 percent, from the depressed
outcome of 2015. If confirmed, this would mark the first
year of global output growth since 2013. Much of the
expansion is forecast to stem from recoveries in Asia,
although sizeable gains are also foreseen in Africa and the
United States.
After a combination of tighter export availability and
subdued import demand depressed 2016 deliveries,
early prospects point to world rice trade stagnating at
43.8 million tonnes in 2017. On the import side, improved
local harvests may enable countries in the Far East and Latin
America and the Caribbean to reduce imports, with good
crops and depreciated currencies also tempering import
growth in Africa. As for exports, an output recovery could
help India boost its sales to international markets, primarily
at the expense of lower deliveries by Thailand, consolidating
India’s position as the world’s leading supplier of rice.
With expanding food use lifting total rice utilization
over projected production in 2016, global rice reserves at
the close of 2016/17 are anticipated to fall for the second
successive season, reaching 169.6 million tonnes. India
and Thailand are predicted to lead the 0.7 percent stock
draw-down, but the fall is expected to be mitigated by
accumulations elsewhere, especially in China (Mainland).
Thus, at 33.2 percent, the global stock-to-use ratio in
2016/17 would continue to surpass the 30 percent mark it
has consistently exceeded over the past five years.
A three-month upward trajectory in international prices
came to an end in August, when a lack of substantial
demand from traditional buyers, together with prospects
of larger availabilities as a result of imminent crop harvests,
began to weigh on quotations. This resulted in the
September value of the FAO All Rice Price Index falling to
190 points, its lowest since January 2008.
RICE
Contact:[email protected]@fao.org
RICE PRODUCTION, UTILIZATION AND STOCKS
WORLD RICE MARKET AT A GLANCE
2014/15 2015/16 estim.
2016/17 f’cast
Change: 2016/17
over 2015/16
million tonnes, milled equivalent %
WORLD BALANCE
Production 494.6 491.5 497.8 1.3
Trade 1 44.6 43.5 43.8 0.7
Total utilization 491.4 495.4 501.4 1.2
Food 394.2 397.7 402.7 1.3
Ending stocks2 174.7 170.7 169.6 -0.7
SUPPLY AND DEMAND INDICATORS
Per caput food consumption:
World (kg/yr) 54.3 54.1 54.2 0.2
LIFDC (kg/yr) 59.0 58.7 58.7 0.0
World stock-to-use ratio (%) 35.3 34.1 33.2
Major exporters stock-to-disappearance ratio3 (%)
24.2 19.3 17.3
FAO RICE PRICE INDEX (2002-2004=100)
2014 2015 2016 Jan-Sep
Change: Jan-Sep 2016
over Jan-Sep 2015
%
235 211 196 -8.7
1 Calendar year exports (second year shown).2 May not equal the difference between supply (defined as production plus
carryover stocks) due to differences in individual country marketing years.3 Major exporters include India, Pakistan, Thailand, the United States and
Viet Nam.
0
100
200
300
370
420
470
520
16/1714/1512/1310/1108/0906/07
Million tonnes, milled eq. Million tonnes, milled eq.
f’cast
Stocks (right axis)
Production (left axis) Utilization (left axis)

Ma
rke
t sum
ma
ries
5FOOD OUTLOOKOCTOBER 2016
World cassava production is forecast to recover in 2016,
due to the return of more normal weather conditions
as compared with last year, when El Niño marred yields
in most growing regions. The crop’s tolerance to erratic
weather conditions, however, spared cassava from
substantial output reductions, encouraging governments
to put cassava expansion high on their agendas, especially
in food insecure regions. Production prospects are also
positive in countries with dietary diversification programmes
or those aspiring to limit the imports of staples, particularly
wheat and rice.
The volume of world trade in cassava in 2016 is
expected to slump to a six-year low. International flows
of cassava, primarily confined to East and Southeast
Asia, are hugely contingent on industrial and feed
demand, particularly from China, the world’s leading
cassava importer, and on the competitiveness of supplies
in Thailand – the world’s leading exporter. With policy
change in China supporting the increased use of domestic
substitutes from the country’s stockpiles, principally
maize, international demand for cassava has plummeted,
accentuated by the relative thinness of cassava trade.
With China’s maize inventories overhanging the entire
regional market for cassava, the potential for cassava to
compete in markets beyond China is also uncertain, given
that international maize prices reached a multi-year low
in September of this year. Consequently, cassava product
quotations are being pressured considerably, and the
likelihood of a further significant price correction will need
to gather momentum if cassava sectors in the region are to
remain commercially viable and if they are to compete in
the international marketplace.
CASSAVA
Contact:[email protected]
WORLD PRODUCTION OF CASSAVA
WORLD CASSAVA MARKET AT A GLANCE
2014 2015 estim.
2016 f’cast
Change: 2016
million tonnes, fresh root eq. %
WORLD BALANCE
Production 278.7 281.1 288.4 2.6
Trade 37.2 39.3 28.2 -28.4
SUPPLY AND DEMAND INDICATORS
Per caput food consumption:
World (kg/year) 20.7 20.7 21.0 1.5
Developing (kg/year) 34.11 33.88 34.26 1.1
LDC (kg/year) 70.5 66.1 67.1 1.5
Sub-Saharan Africa (kg/year)
114.4 109.2 108.8 -0.4
Trade share of prod. (%) 13.3 14.0 9.8 -30.2
CASSAVA PRICES 1 (USD/tonne)
2014 2015 2016 Jan-Sep
Change:Jan-Sep 2016
overJan-Sep 2015
Chips to China (f.o.b. Bangkok)
228.1 215.7 178.3 -17.3
Starch (f.o.b. Bangkok) 428.8 430.5 361.0 -16.2
Thai domestic root prices 72.4 70.0 51.3 -26.7
1 Source: Thai Tapioca Trade Association
0
100
200
300
2016201520142013201220112010estim. f’cast
Africa
Asia
Latin America
Million tonnes

Ma
rke
t su
mm
ari
es
6 FOOD OUTLOOKOCTOBER 2016
After a tightening in market fundamentals in 2015/16,
preliminary forecasts for the 2016/17 season point to a
relatively balanced global supply and demand situation for
both meals/cakes and oils/fats.
In 2016/17, global oilseed production is forecast to
recover fully from last season’s fall, possibly climbing to a
new record. While the expansion would be led by soybeans,
the other oilseeds are also anticipated to post sizeable gains,
with the exception of rapeseed. Soybean growth would be
concentrated in the United States, where record-high yields
are set to boost output. In South America, production might
grow only moderately, as farmers are expected to reduce
soybean plantings in favour of competing crops. In China
and India, production could expand, reversing the downward
trend observed in recent years.
Growth in global palm oil output is forecast to resume, as
palms in Southeast Asia begin to recover from the effects of
adverse weather in 2015/16.
Based on current forecasts, world output and consumption
of oils and meals would reach record levels in 2016/17. The
current estimate for global meal uptake roughly matches
that for global meal output, suggesting that global meal
inventories would remain around last season’s level. By
contrast, global oil consumption is projected to outstrip
production by a small margin, therefore pointing to a modest
reduction of world oil reserves. While the global stock-to-use
ratios for both oils and meals are forecast to fall by a small
margin, the major exporters’ stock-to-disappearance ratios
could remain unchanged or even improve slightly.
International trade in oils/fats is forecast to grow at a faster
pace than last season, fueled by the anticipated recovery in
palm oil production in Indonesia and Malaysia. The outlook is
less buoyant for world meal trade, which could face slowing
growth, mainly reflecting subdued import demand by China.
Regarding prices, after gaining strength earlier this year,
international quotations for oils and meals entered, since
June, a phase of instability. In the coming months, prices are
expected to be much affected by developments impacting
soybeans in South America and palm oil in Southeast Asia.
OILCROPS
Contact:[email protected]
FAO MONTHLY INTERNATIONAL PRICE INDICES FOR OILSEEDS, VEGETABLE OILS AND MEALS/CAKES (2002-2004=100)
WORLD OILCROP AND PRODUCT MARKET AT A GLANCE
2014/15 2015/16 estim.
2016/17 f’cast
Change: 2016/17
over 2015/16
million tonnes %
TOTAL OILCROPS
Production 549 534.1 556.9 4.3
OILS AND FATS
Production 210.8 207.3 216.5 4.4
Supply 247.3 246.3 250.5 1.7
Utilization 206.2 211.2 217.3 2.9
Trade 114.3 115.8 119.4 3.1
Global stock-to-use ratio (%) 18.6 16.3 15.6
Major exporters stock-to-disappearance ratio (%)
10.7 9.7 10.0
MEALS AND CAKES
Production 141.1 137.9 143.9 4.4
Supply 162.6 164.1 168.1 2.4
Utilization 133.4 139.1 144.0 3.5
Trade 86.7 90.5 93.5 3.3
Global stock-to-use ratio (%) 18.7 16.0 15.5
Major exporters stock-to-disappearance ratio (%)
10.6 9.1 9.5
FAO PRICE INDICES (Jan/Dec) (2002-2004=100)
2014 2015 2016 Jan-Sep
Change: Jan-Sep 2016
overJan-Sep 2015
%
Oilseeds 184 149 153 1.3
Meals/cakes 243 179 171 -8.0
Vegetable oils 181 147 160 7.3
NOTE: Refer to footnote 1 on page 40 and to table 1 on page 43 for explanations regarding definitions and coverage.
100
150
200
250
300
20162015201420132012201120102009
Meals/cakesVegetable oils
Oilseeds

Ma
rke
t sum
ma
ries
7FOOD OUTLOOKOCTOBER 2016
World meat production is anticipated to stagnate in 2016,
rising by a meagre 0.2 percent to 319.8 million tonnes. While
output is expected to rise particularly in the United States, the
EU, Brazil, India, Mexico, Canada and the Russian Federation,
a down-turn in meat production – especially in China,
but also in Australia – would weigh on the overall trend.
Excluding the last two countries, aggregate meat production
of the rest of the world would rise by 1.4 percent.
Global meat trade is forecast to recover in 2016,
rising by 4.4 percent to 31.1 million tonnes. This would
represent a return to trend, after a fall in 2015. Based
on current expectations, trade in pigmeat is expected to
increase by 10.8 percent, poultry meat by 4.4 percent
and bovine meat by 0.3 percent, while ovine meat may
decrease by 2.8 percent. Increased meat imports are
expected particularly in China, but also in Japan, South
Africa, Chile, the Republic of Korea, Mexico, the EU, Iraq,
the Philippines, Viet Nam, the United Arab Emirates and
the Russian Federation. By contrast, growth in domestic
production may result in reduced imports by the United States
and Canada, with Angola also anticipated to buy less. The
expansion in world exports is projected to be led by Brazil
and the EU, followed by the United States and Canada, with
sales also rising for Belarus, Thailand, the Russian Federation,
Paraguay, Mexico and Ukraine. Meanwhile, exports by
Australia, China, Turkey, South Africa, New Zealand,
Argentina and India are likely to be curtailed.
After remaining at a low level during the first three
months of 2016, when it averaged 146 points, the FAO
Meat Price Index recorded sustained growth between April
and September, rising by 17.7 points, or 12.1 percent, to
163.5 points. Over the period January to September, the
index gained 12.6 percent, supported by a surge in the prices
of ovine meat, pigmeat and poultry meat, which, for the
group, rose by 18.7 percent, and a more moderate increase
of 4.3 percent for bovine meat. Limited supplies of pigmeat
in the European Union and sheep meat from Oceania lent
support to prices for these products, while firm international
demand, in particular from Asia, underpinned poultry meat
prices. Meanwhile, recovery in bovine meat production in
the United States reduced the country’s need for external
supplies, contributing to international prices increasing less
than for the other categories of meat.
MEAT AND MEAT PRODUCTS
Contact:[email protected]
FAO INTERNATIONAL MEAT PRICE INDEX (2002-2004 = 100)
WORLD MEAT MARKET AT A GLANCE
140
160
180
200
220
2014/15
2015/16
2013/14
SAJJMAMFJDNO
2014 2015estim.
2016f’cast
Change: 2016 over 2015
million tonnes %
WORLD BALANCE
Production 315.4 319.2 319.8 0.2
Bovine meat 68.0 67.6 67.8 0.3
Poultry meat 111.0 114.8 115.8 0.9
Pigmeat 116.9 117.2 116.5 -0.6
Ovine meat 13.9 14.0 14.1 0.6
Trade 30.7 29.8 31.1 4.4
Bovine meat 9.6 9.1 9.1 0.3
Poultry meat 12.7 12.2 12.7 4.4
Pigmeat 7.1 7.2 8.0 10.8
Ovine meat 1.0 1.0 0.9 -2.8
SUPPLY AND DEMAND INDICATORS
Per caput food consumption:
World (kg/year) 43.2 43.2 42.8 -1.0
Trade - share of prod. (%) 9.7 9.3 9.7 4.2
FAO MEAT PRICE INDEX(2002-2004=100)
2014 2015 2016 Jan-Sep
Change: Jan-Sep 2016
over Jan-Sep 2015
%
198 168 154 -10.6

Ma
rke
t su
mm
ari
es
8 FOOD OUTLOOKOCTOBER 2016
World milk production is forecast to grow by 1.1 percent
to 817 million tonnes in 2016, with output set to
expand in Asia and North and Central America, but to
stagnate in Europe and Africa and decline in Oceania and
South America. The removal of some excess export supplies
in the EU and anticipation of tighter milk availabilities
during the second half of the year caused international
dairy prices to rebound between May and September.
Trade in dairy products in 2016 is projected to be
almost unchanged, remaining at 72 million tonnes of milk
equivalent. This stands in marked contrast to an average
annual rate of increase of 6 percent for period 2009–2014.
In 2015, a drop in shipments to China and the embargo by
the Russian Federation on imports from specific countries
impinged on international dairy product trade. For 2016,
purchases by China and, to a lesser extent, the Russian
Federation are projected to recover somewhat, with growth
also foreseen for Brazil, the United States and Mexico.
However, this is forecast to be largely counterbalanced by
substantial reductions in imports by Venezuela and Algeria,
and also by the United Arab Emirates, Nigeria, Singapore,
Malaysia, Vietnam and Thailand. Overall, international trade
flows in cheese and butter are anticipated to expand, while
shipments of milk powders may fall.
Among exporters, the EU, New Zealand, Belarus and
Uruguay are forecast to increase their sales. However, this
is likely to be almost matched by a fall in shipments from
the United States, Brazil and Argentina, while exports
by Australia and Switzerland could be unchanged. Large
purchases of skimmed milk powder (SMP) to intervention
stocks so far this year are forecast to slow EU export
expansion. Despite increased milk production, overall dairy
sales by the United States are expected to fall, as export
opportunities are curtailed by the strength of the US dollar
and stiffer competition from other exporters.
MILK AND MILK PRODUCTS
Contact:[email protected]
FAO INTERNATIONAL DAIRY PRICE INDEX (2002-2004 = 100)
WORLD DAIRY MARKET AT A GLANCE
2014 2015estim.
2016f’cast
Change: 2016 over 2015
million tonnes, milk equiv. %
WORLD BALANCE
Total milk production 793.7 808.7 817.2 1.1
Total trade 72.0 72.1 72.3 0.4
SUPPLY AND DEMAND INDICATORS
Per caput food consumption:
World (kg/year) 109.2 110.0 109.9 -0.1
Trade - share of prod. (%) 9.1 8.9 8.9 -0.7
FAO DAIRY PRICE INDEX(2002-2004=100)
2014 2015 2016 Jan-Sep
Change: Jan-Sep 2016
over Jan-Sep 2015
%
224 160 143 -12.5
100
150
200
250
300
2014/15
2015/16
2013/14
SAJJMAMFJDNO

Ma
rke
t sum
ma
ries
9FOOD OUTLOOKOCTOBER 2016
After falling for much of 2015, international fish prices have
given signs of a recovery in the first five months of 2016,
while still remaining below their 2015 levels. According to
the FAO Fish Price Index, international fish prices averaged
2 percent lower in the first six months of 2016 compared
to the same period last year. The recent price strength,
which extended to all the major species except for shrimps,
generally reflected a tightening of supplies in some major
exporting countries, combined with a stronger import
demand.
Global fish production is forecast to grow by 1.8 percent
to 174.1 million tonnes in 2016, boosted by a 5 percent
expansion of aquaculture to 81.4 million tonnes, confirming
the sector as the main engine for fishery growth, which
compensated for a 1 percent contraction in wild fish output
to 92.7 million tonnes.
Consumer demand for fish remains strong, with more
people worldwide appreciating the health benefits of
regular fish consumption. Direct human consumption,
which accounts for more than 85 percent of all fish uses, is
projected to grow by 2.3 percent to 152.8 million tonnes in
2016. This would result in a slight increase in per capita fish
intake, from 20.3 kg in 2015 to 20.5 kg in 2016.
Although several exporters are likely to face supply
constraints associated with El Niño, diseases and fishing
quotas, the value of international fish trade may increase by
4 percent in 2016, recouping part of the losses registered
in 2015.
The recent FAO-UNCTAD-UNEP Joint-Statement¹,
endorsed by more than 90 countries, international
governmental organizations and active civil society
organizations, highlighted the importance of having an
international regulatory framework to streamline fishery
subsidies. Any future regulation in this area will have a
significant market-oriented impact on production patterns,
prices and trade flows.
FISH AND FISHERY PRODUCTS
Contact:[email protected]@fao.org
FAO FISH PRICE INDEX (2002-2004 = 100)
WORLD FISH MARKET AT A GLANCE
Source: FAO Fish Price Index: Norwegian Seafood Council (NSC)Totals may not add up due to rounding
80
105
130
155
180
201620142012201020082006200420022000
FAO total fish price index
Capture totalAquaculture Total
Source: Norwegian Seafood Council (NSC)
2014 2015estim.
2016f’cast
Change: 2016 over 2015
million tonnes %
WORLD BALANCE
Production 167.2 171.0 174.1 1.8
Capture fisheries 93.4 93.5 92.7 -0.9
Aquaculture 73.8 77.5 81.4 5.0
Trade value (exports USD billion)
148.3 134.1 140.0 4.4
Trade volume (live weight) 60.0 59.9 60.0 0.2
Total utilization 167.2 171.0 174.1 1.8
Food 146.3 149.4 152.8 2.3
Feed 15.8 16.5 16.2 -1.8
Other uses 5.1 5.1 5.1 0.0
SUPPLY AND DEMAND INDICATORS
Per caput food consumption:
Food fish (kg/yr) 20.1 20.3 20.5 1.1
From capture fisheries (kg/year) 10.0 9.8 9.6 -1.8
From aquaculture (kg/year) 10.1 10.5 10.9 3.9
FAO FISH PRICE INDEX
(2002-2004=100)2014 2015 2016
Jan-JunChange:
Jan-Jun 2016 over
Jan-Jun 2015 %
157 142 143 -1.6
1 Available at http://unctad.org/meetings/en/SessionalDocuments/U14ditc_d16_FishSub_Statement_en.pdf.

MAR
KET
ASSE
SSM
ENTS
MAR
KET
ASSE
SSM
ENTS
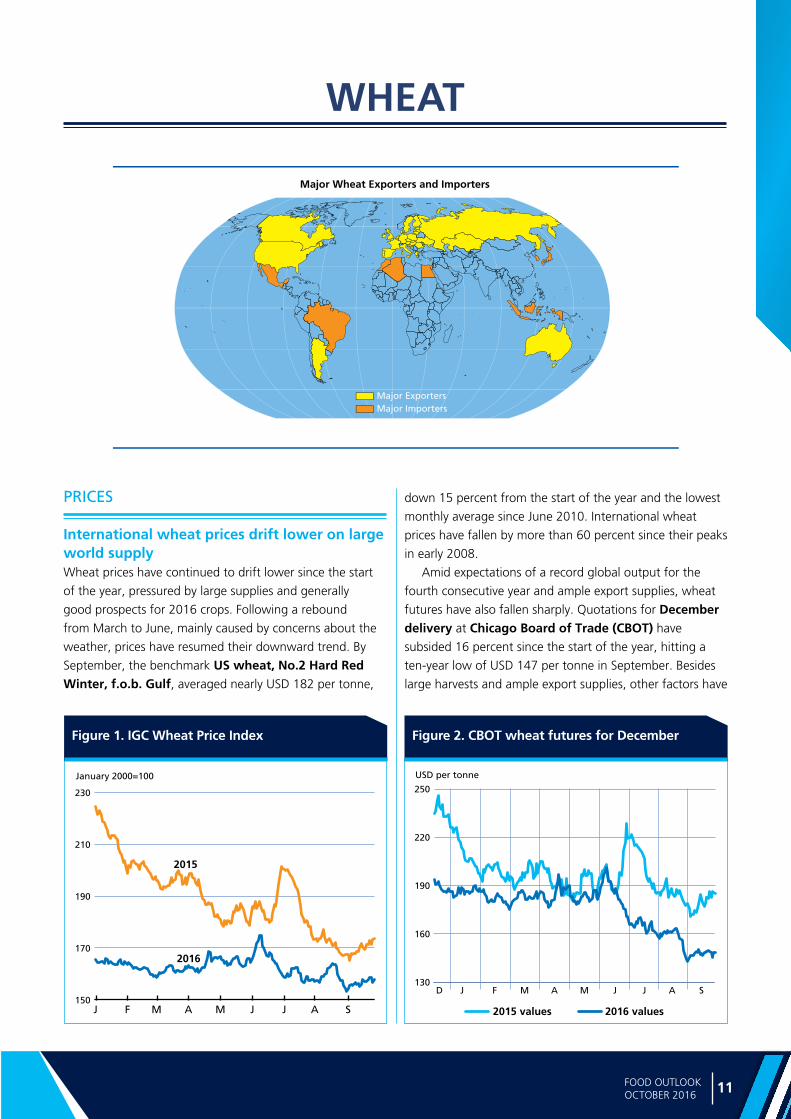
11FOOD OUTLOOKOCTOBER 2016
WH
EA
T
Figure 1. IGC Wheat Price Index Figure 2. CBOT wheat futures for December
Major Wheat Exporters and Importers
Major ExportersMajor Importers
WHEAT
150
170
190
210
230
SAJJMAMFJ
2015
2016
January 2000=100
130
160
190
220
250
USD per tonne
D J F M A M J J A S
2015 values 2016 values
PRICES
International wheat prices drift lower on large world supplyWheat prices have continued to drift lower since the start
of the year, pressured by large supplies and generally
good prospects for 2016 crops. Following a rebound
from March to June, mainly caused by concerns about the
weather, prices have resumed their downward trend. By
September, the benchmark US wheat, No.2 Hard Red Winter, f.o.b. Gulf, averaged nearly USD 182 per tonne,
down 15 percent from the start of the year and the lowest
monthly average since June 2010. International wheat
prices have fallen by more than 60 percent since their peaks
in early 2008.
Amid expectations of a record global output for the
fourth consecutive year and ample export supplies, wheat
futures have also fallen sharply. Quotations for December delivery at Chicago Board of Trade (CBOT) have
subsided 16 percent since the start of the year, hitting a
ten-year low of USD 147 per tonne in September. Besides
large harvests and ample export supplies, other factors have

Ma
rke
t a
sse
ssm
en
ts
12 FOOD OUTLOOKOCTOBER 2016
Table 1. World wheat market at a glance
Table 2. Wheat production: leading producers*
2014 2015 estim.
2016f”cast
Change:2016 over
2015
million tonnes %
European Union 157.1 160.5 144.0 -10.3
China (Mainland) 126.2 130.2 128.6 -1.2
India 95.9 86.5 93.5 8.1
Russian Federation 59.7 61.8 69.5 12.5
United States 55.1 55.8 63.2 13.1
Canada 29.4 27.6 30.5 10.5
Pakistan 26.0 25.1 25.5 1.6
Ukraine 24.1 26.5 25.6 -3.4
Australia 23.7 24.2 28.1 16.1
Turkey 19.0 22.6 20.5 -9.3
Kazakhstan 13.0 13.7 14.5 5.5
Argentina 13.9 11.3 15.0 32.7
Iran Islamic Rep. of 10.6 11.5 12.5 8.7
Egypt 9.3 9.0 9.0 0.0
Other countries 67.4 67.4 62.4 -7.4
World 730.5 733.8 742.4 1.2
* Countries listed according to their position in global production (average 2014-2016)
also exerted downward pressure on prices so far in the
season, including earlier interruptions in wheat deliveries
to Egypt, the world’s largest wheat importer, because of
uncertainties surrounding the official permissible tolerance
level of ergot – a common fungus found in grains – in
wheat shipments to the country. In recent weeks, larger
than projected supplies in the Black Sea region have also
weighed on export quotations. However, below-average
protein levels in winter wheat, caused by untimely rains,
in several major producing zones, have sustained export
prices of milling quality wheat. More detailed analysis of
the futures markets can be found in the Market Indicators
section of this report.
PRODUCTION
Another record wheat crop in 2016FAO’s current forecast for global wheat production in 2016
stands at 742.4 million tonnes, which is 8.5 million tonnes,
or 1.2 percent, above the 2015 estimate, with particularly
large increases anticipated in India, the Russian Federation
and the United States. This forecast is 1.6 million tonnes
higher than was projected in September, reflecting an
improved outlook for Argentina and Australia. Global
wheat production has been on the rise for four consecutive
years.
In the United States, better-than-expected yields from
the later harvested crop have offset an overall price-induced
reduction in plantings. As a result, official production
estimates were raised to 63.2 million tonnes, which is
7.3 million tonnes, or 13.1 percent, above the previous year
and an eight-year high. Canada is also expected to harvest
a larger crop of almost 30.5 million tonnes, up 11 percent
from 2015. The increase stems from a rebound in yields
that more than compensated for a reduction in the area
sown to the main spring wheat crop – a reduction partly
due to a shift of planting to pulses.
In Europe, harvesting of the 2016 wheat crop is nearly
complete. The latest indications for the EU point to a
contraction of production of almost 17 million tonnes to
144 million tonnes in 2016. Much of the reduction rests on
expectations of a lower output in France, where excessive
rains depressed yields. In the Russian Federation, weather
conditions have improved since the start of the season,
boosting yield prospects. As a result, wheat production
is now forecast at a record high of 69.5 million tonnes,
13 percent above the previous year. However, despite the
improved production, the quality of the crop is reportedly
poorer than in 2015. Dryness during the planting period
curtailed sowings in Ukraine, contributing to a 3 percent
decline in its 2016 production to 25.6 million tonnes.
1 Trade refers to exports based on a common July/June marketing season.2 May not equal the difference between supply (defined as production plus
carryover stocks) due to differences in individual country marketing years.3 Major exporters include Argentina, Australia, Canada, EU, Kazakhstan,
Russian Fed., Ukraine and the United States.4 Derived from the International Grains Council (IGC) wheat index.
2014/15 2015/16 estim.
2016/17 f’cast
Change: 2016/17
over 2015/16
million tonnes %
WORLD BALANCE
Production 730.5 733.8 742.4 1.2
Trade1 156.6 164.9 165.0 0.1
Total utilization 703.6 715.7 730.5 2.1
Food 486.7 493.2 498.2 1.0
Feed 133.4 137.2 145.7 6.2
Other uses 83.5 85.3 86.5 1.4
Ending stocks2 211.2 225.8 234.2 3.7
SUPPLY AND DEMAND INDICATORS
Per caput food consumption:
World (kg/yr) 67.1 67.2 67.2 -0.1
LIFDC (kg/yr) 47.4 47.6 47.5 -0.4
World stock-to-use ratio (%) 29.5 30.9 31.7
Major exporters stock-to-disappearance ratio3 (%)
16.7 16.6 17.4
FAO WHEAT PRICE INDEX4 (2002-2004=100)
2014 2015 2016 Jan-Sep
Change: Jan-Sep 2016
over Jan-Sep 2015
%
181 144 126 -14.4

13FOOD OUTLOOKOCTOBER 2016
WH
EA
T
Figure 3 . Major CIS producers
0
20
40
60
80
20162015201420132012
Russian Fed. Ukraine Kazakhstan
Million tonnes
estim. f’cast
In Asia, the bulk of the harvest is complete and the
regional 2016 output is expected to be above the 2015
level, at 322 million tonnes. Most of the increase reflects
prospects of a recovery in India, where record yields more
than compensated for a contraction in sowings prompted
by reduced water supplies for irrigation. According to
the latest official estimates, India’s output might reach
93.5 million tonnes, 8 percent above the reduced 2015
harvest. In Pakistan, production in 2016 is estimated
slightly above the bumper 2015 harvest, as weather-
improved yields largely counterbalanced a modest decrease
in plantings. Production in China is now foreseen to decline
by about 1 percent in 2016, to 128.6 million tonnes, in
contrast to a more buoyant outlook earlier in the season.
The downgrading of the production forecast follows a
period of poor weather, in the form of dry spells and
excessive rains, which resulted in lower expected yields. In
Turkey, dry conditions are expected to depress production
in 2016 by 2 million tonnes, while the persistent conflict in
Syria continues to severely undermine production in the
country. In North Africa, severe dry weather resulted in a
significant drop of wheat output in Algeria, but also in
Morocco, now estimated to have harvested a well-below
average crop of 2.7 million tonnes.
In the Southern Hemisphere, prospects for the 2016
wheat crop in Australia are favourable, due to adequate
soil moisture conditions for planting and subsequent rains
during July and August that benefited crop development.
Although the area planted is estimated to have changed
little compared to the previous year, better yield prospects
are expected to boost production by 16 percent, to
28 million tonnes. In South America, the aggregate 2016
wheat production is forecast to rise by almost 22 percent
to 25.2 million tonnes. Most of the growth is expected to
derive from a 33 percent increase in Argentina’s output,
forecast at 15 million tonnes, reflecting a price-driven
expansion in sowings. Brazil is also forecast to harvest a
larger crop in 2016, for analogous reasons.
TRADE
World wheat trade in 2016/17 hovering around record levels
FAO’s latest forecast for world wheat trade (including
wheat flour in wheat equivalent) in 2016/17 (July/June) has
been raised by 1.5 million tonnes since September, and
now stands at 165 million tonnes, almost unchanged from
the 2015/16 record estimate.
Total wheat imports by Asia are forecast at around
80 million tonnes, slightly above the previous season’s level
and nearly 1 million tonnes higher than had previously
been anticipated. Wheat purchases by Indonesia,
Asia’s largest wheat importer, are currently projected
at 10 million tonnes. Wheat imports by Indonesia have
doubled over the past ten years underpinned by a
growing demand for food as well as feed. Reacting to the
rapid increase in feed wheat imports since last year and
consistent with the country’s maize self-sufficiency policies,
the Government recently decided to suspend issuing import
certificates for feed quality wheat, a decision that may
result in reduced wheat imports by the country in 2016/17
than had been foreseen. In Japan, wheat imports are likely
to increase by 500 000 tonnes, reaching 6 million tonnes
in 2016/17, due to strong demand and despite a brief
suspension of imports from the United States following
reports of a possible presence of bioengineered wheat in
US shipments. Wheat imports by Thailand are expected
to reach 4.2 million tonnes, 1 million tonnes more than
earlier forecast. Thailand’s wheat imports have doubled
since 2012/13, following the Government’s decision to
waive import tariffs, which particularly boosted imports of
feed quality wheat. Purchases by Saudi Arabia are forecast
to increase by 500 000 tonnes to 3.8 million tonnes,
confirming the country’s total reliance on world markets
to meet its domestic needs following the termination,
in 2015/16, of wheat production and the purchase
programme. By contrast, deliveries to the Islamic Republic of Iran could decline by 1 million tonnes to a 4-year low of
2.2 million tonnes. Helped by large domestic supplies, the
government halted all state wheat import purchases as of
March 2016.
In Africa, aggregate wheat imports in 2016/17 are
anticipated to remain close to last year’s record level,

Ma
rke
t a
sse
ssm
en
ts
14 FOOD OUTLOOKOCTOBER 2016
Figure 4. Major wheat exporters
0
10
20
30
40
2016/172015/162014/152013/142012/13
Russian Fed. EU USA
Million tonnes
estim. f’cast
at just over 50 million tonnes. In North Africa, wheat
imports are forecast to remain steady at around 29 million
tonnes. Imports by Algeria and Egypt are likely to
decrease marginally, to 8 million tonnes and 12 million
tonnes, respectively. Following several months of slow
activity, Algeria has accelerated its wheat purchases in
the early months of the season. In Egypt, uncertainties
surrounding tolerance rules on wheat containing ergot
(a common fungus found in grains) slowed the pace of
wheat purchase by the country since the start of the year.
However, following the reinstating a 0.05 percent tolerance
level, announced on 21 September, the pace of wheat
deliveries to Egypt is expected to return to normal. Wheat
imports by drought-stricken Morocco are forecast to reach
5 million tonnes in 2016/17, 500 000 tonnes more than in
the previous season.
In sub-Saharan Africa, only Ethiopia is predicted to
cut wheat imports significantly in 2016/17. Although the
country is now anticipated to purchase 500 000 tonnes
less than in the previous season, much will depend on
whether the expectation of another above average wheat
production season materializes. Wheat shipments to
Nigeria, the sub-region’s largest importer, are forecast at
4.5 million tonnes, unchanged from 2015/16.
In Europe, imports in 2016/17 may total 9.2 million
tonnes, down marginally from the 2015/16 estimate.
Wheat imports by the EU are currently put at
6.5 million tonnes, down 100 000 tonnes from 2015/16,
but 500 000 tonnes more than last anticipated, due to
quality concerns and tighter supplies of milling wheat
following this year’s poor harvest in France, the EU’s
largest wheat producer and exporter. In Latin America
and the Caribbean, imports are forecast to be slightly
lower than in the previous season, mostly on expectation
of reduced purchases by Mexico. These are currently
forecast to reach 4.4 million tonnes, down 400 000 tonnes
from 2015/16 due to large domestic supplies. By contrast,
imports by Brazil could increase to 6 million tonnes (on
July/June basis).
Regarding exports, shipments from the EU are projected
to fall to a 4-year low of 25.5 million tonnes following
this year’s reduced production and less competitive prices
compared with other origins, in particular the Black Sea
region. By contrast, helped by a bumper crop, wheat
exports by the Russian Federation are set to increase
by at least 21 percent to 29.5 million tonnes, making the
country the world’s largest wheat exporter in 2016/17.
Because of large domestic supplies, the Russian Federation
decided in August to suspend the wheat export duty
until July 2018. Wheat shipments by Australia are seen
Table 4. Top 10 wheat exporters*
Table 3. Top 10 wheat importers*
2011/12-2015/16 average
2016/17f'cast
Change
million tonnes %
Russian Fed. 19.5 29.5 51.2
EU 27.1 25.5 -6.0
United States 26.3 25.0 -5.0
Canada 21.0 21.5 2.4
Australia 19.0 19.0 -0.2
Ukraine 10.2 14.0 37.4
Argentina 6.6 9.0 36.4
Kazakhstan 7.6 7.0 -8.4
Turkey 3.4 4.4 29.3
India 3.6 1.0 -72.5
2011/12-2015/16 average
2016/17f'cast
Change
million tonnes %
Egypt 10.8 12.0 11.3
Indonesia 7.7 10.0 30.6
Algeria 7.3 8.0 9.0
EU 5.7 6.5 14.6
Brazil 6.6 6.0 -9.3
Japan 5.9 6.0 1.8
China 5.4 5.5 1.7
Mexico 4.6 4.4 -4.7
Korea Rep. of 4.5 4.4 -1.8
Iran Islamic Rep. of 4.6 2.2 -52.0
* Exports are based on a common July/June marketing season* Imports are based on a common July/June marketing season

15FOOD OUTLOOKOCTOBER 2016
WH
EA
T
Figure 5. Wheat feed use
0
40
80
120
160
2016/172015/162014/152013/142012/13
Million tonnes
EU
Russian Fed.
China (Mainland)
USA
Rest of the World
estim. f’cast
to increase to 19 million tonnes, up 1 million tonnes
from the previous forecast. Exports by the United States
are projected to increase as a result of this year’s rise in
production and reach 25 million tonnes. The forecast
for wheat exports by Argentina has been raised by
500 000 tonnes to 9 million tonnes, reflecting improved
crop prospects. Kazakhstan’s wheat exports are set to
reach 7 million tonnes, up slightly from 2015/16 due to this
year’s increase in production. By contrast, wheat shipments
by Canada may drop slightly, to 21.5 million tonnes. A
more severe drop is anticipated in Ukraine, where sales
could fall by 3.4 million tonnes to 14 million tonnes,
because of a slightly reduced domestic production and,
more importantly, increased competition by Australia in
several Asian markets.
UTILIZATION
Global wheat utilization rising by 2 percent in 2016/17Total wheat utilization in 2016/17 is projected to reach
730.5 million tonnes, 1.5 million tonnes higher than was
anticipated earlier and almost 15 million tonnes, or about
2 percent, above the 2015/16 level. Total wheat use
for direct human consumption is currently projected
at around 498 million tonnes, 1 percent higher than in
2015/16. Most of the increase will be concentrated in
developing countries, which are forecast to consume
363 million tonnes of wheat as food. On a per capita
basis, wheat consumption in 2016/17 would remain
close to 67 kg per annum worldwide, with an average of
60 kg per capita in the developing countries and 96 kg
per capita in the developed countries. However, while
the year-on-year growth in food consumption of wheat
largely keeps pace with the world population growth,
feed use of wheat tends to follow a more dynamic trend,
very much influenced by its price competiveness vis-a-vis
coarse grains in feed rations. Given this season’s abundant
supplies of low quality wheat, total feed use of wheat at
the world level is forecast to rise to 146 million tonnes,
up 8.5 million tonnes, or 6.2 percent, from 2015/16. The
largest increases, in terms of volume, are projected for the
United States, up 5.3 million tonnes, and several countries
in Asia, especially China and Indonesia.
As for the other uses of wheat, the latest estimates by
the International Grains Council (IGC) put total industrial utilization of wheat in 2016/17 at 22 million tonnes,
slightly above last season. The biofuel sector is expected
to absorb some 5.8 million tonnes of wheat in 2016/17,
unchanged from 2015/16. However, the starch industry
would continue to account for the bulk of the industrial
usage of wheat, at 12.8 million tonnes, 3.9 percent higher
than 2015/16, driven by strong increases in the EU and, to
a lesser extent, Canada.
STOCKS
Global wheat inventories to reach their highest level since 2001/02Another year of record wheat production is likely to result
in a further accumulation of world inventories, which have
been rising steadily since 2013/14. World wheat stocks
are currently projected to reach 234 million tonnes by
the close of the marketing seasons ending in 2017, up
8.4 million tonnes from their already elevated opening
levels and the largest since 2001/02. This month’s stock
Figure 6. Wheat stocks and ratios
0
50
100
150
200
250
2016/172015/162014/152013/142012/130
7
14
21
28
35
Million tonnes Percent
Major Exporters Rest of the World
China(Mainland)
World Stock-to-use ratioStock-to-disappearance ratio of Major Exporters
estim. f’cast

Ma
rke
t a
sse
ssm
en
ts
16 FOOD OUTLOOKOCTOBER 2016
forecast is also 900 000 tonnes higher than the one
reported in September, with much of the month-to-month
revision reflecting upward adjustments to production
estimates of several countries in Asia, in particular China
and Pakistan.
Wheat inventories are projected to increase by a
significant 11.9 million tonnes in China, 3.2 million tonnes
in the United States and 1 million tonnes in India, as well
as by nearly 1 million tonnes in Australia and Ukraine.
By contrast, the tightening of supplies may require the EU
to drawdown stocks by 4 million tonnes and Morocco
by a 1.8-million tonnes. Likewise, Egypt, India, the
Islamic Republic of Iran, Iraq, the Syrian Arab Republic
and Turkey may end the season with smaller wheat
reserves.
Based on the latest forecasts for global utilization and
ending stock levels, the world wheat stock-to-use ratio is likely to hit its highest level since 2003/04 and rise to
31.7 percent in 2016/17. This would be well above the
historic minimum of 22.7 percent registered in 2007/08.
Moreover, given the build-up of inventories in several major
exporting countries, the ratio of major wheat exporters’ closing stocks-to-their total disappearance (defined
as domestic utilization plus exports), which is considered a
more robust indicator of supplies for international trade,
is also set to increase, from 16.6 percent in 2015/16 to
17.4 percent in 2016/17.


Ma
rke
t a
sse
ssm
en
ts
18 FOOD OUTLOOKOCTOBER 2016
Figure 2. CBOT maize December futuresFigure 1. Maize export price (US No. 2 yellow, Gulf)
Major Coarse Grain Exporters and Importers
Major ExportersMajor Importers
140
150
160
170
180
190
2014/15
2016/17
2015/16
USD per tonne
JMAMFJDNOSAJ
110
130
150
170
190
USD per tonne
D J F M A M J J A S
2015 values 2016 values
COARSE GRAINS*
PRICES
International prices below last year on large export supplies and weak import demandAfter a mixed start of the 2016/17 marketing year,
characterized by weather uncertainties, tight export
availabilities in South America, spill-overs from rising
prices of soybeans and currency fluctuations, export prices
of major coarse grains have witnessed a more definite
downturn since June. Several factors contributed to this
recent weakening, including the expectations of a record
maize crop in the United States, large export availabilities in
the Black Sea region and abundant world supplies of feed
wheat in a context of generally frail global import demand.
By September 2016, export prices from the US were well
below their levels at the start of the year and in September
last year. The benchmark US maize price (yellow, No. 2, f.o.b.) averaged USD 148 per tonne in September
* Coarse grains include maize, barley, sorghum, millet, rye, oats and NES (not elsewhere specified)
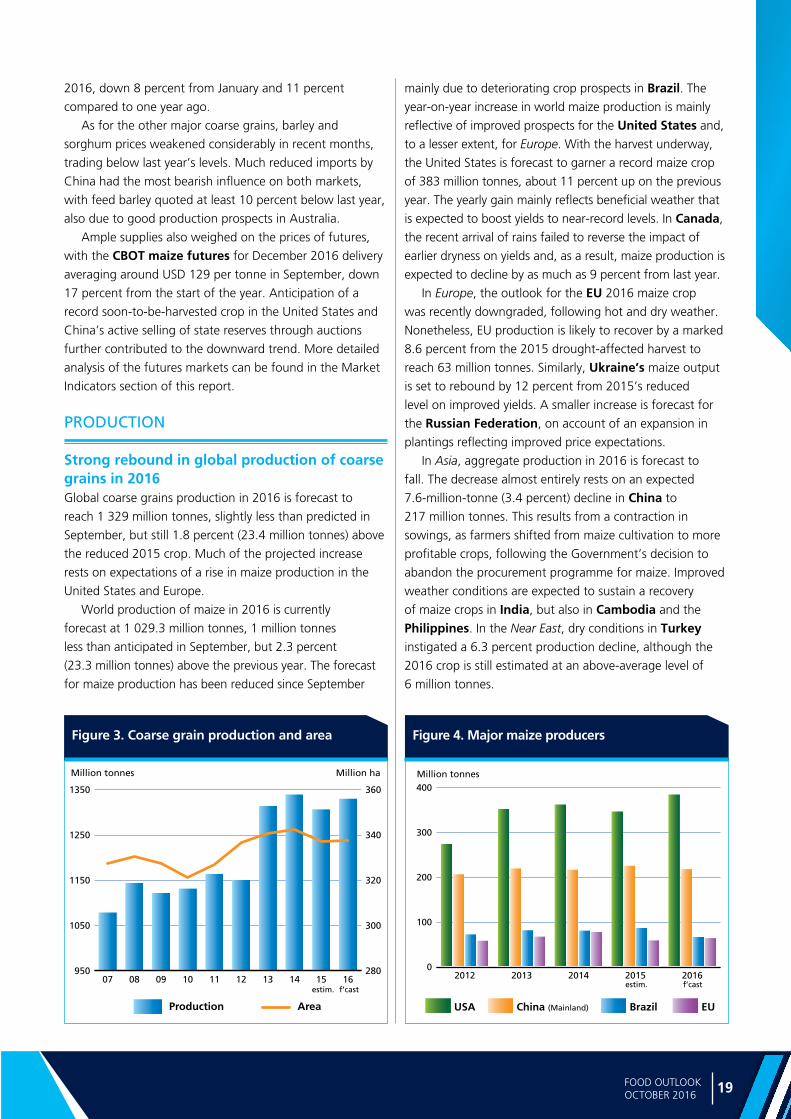
19FOOD OUTLOOKOCTOBER 2016
CO
AR
SE G
RA
INS
Figure 3. Coarse grain production and area Figure 4. Major maize producers
950
1050
1150
1250
1350
16151413121110090807280
300
320
340
360
Million tonnes Million ha
Production Area
estim. f’cast
0
100
200
300
400
20162015201420132012
USA China (Mainland) Brazil EU
Million tonnes
estim. f’cast
2016, down 8 percent from January and 11 percent
compared to one year ago.
As for the other major coarse grains, barley and
sorghum prices weakened considerably in recent months,
trading below last year’s levels. Much reduced imports by
China had the most bearish influence on both markets,
with feed barley quoted at least 10 percent below last year,
also due to good production prospects in Australia.
Ample supplies also weighed on the prices of futures,
with the CBOT maize futures for December 2016 delivery
averaging around USD 129 per tonne in September, down
17 percent from the start of the year. Anticipation of a
record soon-to-be-harvested crop in the United States and
China’s active selling of state reserves through auctions
further contributed to the downward trend. More detailed
analysis of the futures markets can be found in the Market
Indicators section of this report.
PRODUCTION
Strong rebound in global production of coarse grains in 2016Global coarse grains production in 2016 is forecast to
reach 1 329 million tonnes, slightly less than predicted in
September, but still 1.8 percent (23.4 million tonnes) above
the reduced 2015 crop. Much of the projected increase
rests on expectations of a rise in maize production in the
United States and Europe.
World production of maize in 2016 is currently
forecast at 1 029.3 million tonnes, 1 million tonnes
less than anticipated in September, but 2.3 percent
(23.3 million tonnes) above the previous year. The forecast
for maize production has been reduced since September
mainly due to deteriorating crop prospects in Brazil. The
year-on-year increase in world maize production is mainly
reflective of improved prospects for the United States and,
to a lesser extent, for Europe. With the harvest underway,
the United States is forecast to garner a record maize crop
of 383 million tonnes, about 11 percent up on the previous
year. The yearly gain mainly reflects beneficial weather that
is expected to boost yields to near-record levels. In Canada,
the recent arrival of rains failed to reverse the impact of
earlier dryness on yields and, as a result, maize production is
expected to decline by as much as 9 percent from last year.
In Europe, the outlook for the EU 2016 maize crop
was recently downgraded, following hot and dry weather.
Nonetheless, EU production is likely to recover by a marked
8.6 percent from the 2015 drought-affected harvest to
reach 63 million tonnes. Similarly, Ukraine’s maize output
is set to rebound by 12 percent from 2015’s reduced
level on improved yields. A smaller increase is forecast for
the Russian Federation, on account of an expansion in
plantings reflecting improved price expectations.
In Asia, aggregate production in 2016 is forecast to
fall. The decrease almost entirely rests on an expected
7.6-million-tonne (3.4 percent) decline in China to
217 million tonnes. This results from a contraction in
sowings, as farmers shifted from maize cultivation to more
profitable crops, following the Government’s decision to
abandon the procurement programme for maize. Improved
weather conditions are expected to sustain a recovery
of maize crops in India, but also in Cambodia and the
Philippines. In the Near East, dry conditions in Turkey
instigated a 6.3 percent production decline, although the
2016 crop is still estimated at an above-average level of
6 million tonnes.

Ma
rke
t a
sse
ssm
en
ts
20 FOOD OUTLOOKOCTOBER 2016
Table 1. World coarse grain market at a glance
Table 2. Coarse grain production: leading producers*
* Countries listed according to their position in global production (average 2014-2016)
2014 2015 estim.
2016f”cast
Change:2016 over
2015
million tonnes %
United States 377.6 367.2 401.7 9.4
China (Mainland) 225.2 234.5 227.3 -3.1
European Union 171.7 150.0 155.7 3.8
Brazil 82.9 88.3 67.7 -23.3
Argentina 39.9 42.4 47.3 11.7
India 43.1 38.1 43.7 14.7
Russian Federation 42.4 39.5 40.1 1.5
Ukraine 39.7 33.4 36.9 10.6
Mexico 31.8 30.8 32.5 5.7
Canada 22.1 25.7 24.8 -3.8
Nigeria 19.5 19.2 20.2 5.3
Indonesia 19.0 19.6 19.4 -1.1
Ethiopia 19.2 18.8 19.0 1.2
Turkey 12.9 15.1 13.4 -10.9
Australia 11.7 12.9 13.8 7.7
Other countries 179.6 170.0 165.3 -2.8
World 1338.2 1305.4 1328.8 1.8
In South America, maize production in Argentina is
forecast to increase by 6 million tonnes, putting the latest
estimate at 39.8 million tonnes, a record high. The increase
mainly stems from a larger planted area, as farmers
responded to more attractive maize prices, prompted by
the removal of export controls and a weaker currency.
By contrast, following continual downward revisions this
year, due to the adverse impact of dry weather, particularly
on the second season “de safrihna” maize crop, Brazil is predicted to harvest its smallest crop since 2011. The latest
estimate puts Brazil’s 2016 crop at 65.5 million tonnes,
23 percent down from the bumper output of the previous
year. In Central America and the Caribbean, aggregate
production is set to rise from the drought-reduced level of
2015. This is mainly on account of Mexico’s 2016 output,
which is forecast to increase to 25.7 million tonnes, as
improved weather conditions resulted in bumper yields
for the winter crop. Elsewhere in the subregion, higher
rainfall volumes this year are foreseen to result in moderate
production recoveries compared to the reduced 2015
crops.
In Africa, aggregate regional production is forecast
to decline in 2016, mostly reflecting steep reductions in
southern African countries that were affected by severe
drought conditions. The bulk of this decline is attributed
to South Africa, where the prolonged El Niño-induced
drought caused a near 4 million tonne cut in the 2016
harvest compared with the already below-average output
of the previous year. Maize outputs are also estimated to
have fallen sharply in neighbouring countries, similarly on
account of rainfall deficits, except in Zambia where the
maize harvest increased by 10 percent. Production gains
are anticipated in Ethiopia and Nigeria, where good rains
so far have favoured crop development.
Global production of barley in 2016 is forecast at
142.5 million tonnes, 3.3 percent (4.9 million tonnes) down
on the previous year. The decrease stems almost entirely
from lower crops in Morocco and Turkey resulting from
dry weather. The forecast for world sorghum production
stands at 64.5 million tonnes, 2.3 percent (1.4 million
tonnes) up on the previous year. Predominantly behind this
year’s improved crop are larger outputs in Ethiopia and the
Sudan, which helped compensate for near 3 million tonne
decrease in the United States.
TRADE
International trade in coarse grains to contract in 2016/17World trade in coarse grains in 2016/17 (July/June)
is set to fall to 176 million tonnes, down as much as
1 Trade refers to exports based on a common July/June marketing season.2 May not equal the difference between supply (defined as production plus
carryover stocks) due to differences in individual country marketing years.3 Major exporters include Argentina, Australia, Brazil, Canada, EU, Russian Fed.,
Ukraine and the United States.
2014/15 2015/16 estim.
2016/17 f’cast
Change: 2016/17
over 2015/16
million tonnes %
WORLD BALANCE
Production 1 338.2 1 305.4 1 328.8 1.8
Trade1 177.3 185.8 176.0 -5.2
Total utilization 1 301.4 1 309.0 1 328.4 1.5
Food 199.4 200.6 204.5 1.9
Feed 734.5 742.7 758.0 2.1
Other uses 367.5 365.7 365.9 0.1
Ending stocks2 268.6 259.0 256.1 -1.1
SUPPLY AND DEMAND INDICATORS
Per caput food consumption:
World (kg/yr) 27.5 27.3 27.6 0.8
LIFDC (kg/yr) 40.4 39.9 40.5 1.5
World stock-to-use ratio (%) 20.5 19.5 18.7
Major exporters stock-to-disappearance ratio3 (%)
12.9 11.4 13.0
FAO COARSE GRAIN PRICE INDEX (2002-2004=100)
2014 2015 2016 Jan-Sep
Change: Jan-Sep 2016
over Jan-Sep 2015
%
183 161 153 -5.6

21FOOD OUTLOOKOCTOBER 2016
CO
AR
SE G
RA
INS
5 percent (9.7 million tonnes) from the 2015/16 record
estimate. The contraction is predicted to concern all the
major coarse grains, with trade in maize falling by almost
3 percent (4.1 million tonnes) from the record 2015/16
level to 135.5 million tonnes; barley shrinking by 8 percent
(2.4 million tonnes) to 27 million tonnes; and sorghum by
29 percent (3.4 million tonnes) to 8.5 million tonnes. By
contrast, trade in millet is projected to surge by 29 percent
(200 000 tonnes) to 866 000 tonnes, while the volumes
of oats and rye trade are predicted to remain largely
unchanged from the 2015/16 levels, at 2 million tonnes
and 359 000 tonnes, respectively.
In Asia, total imports of coarse grains in 2016/17
are forecast to drop by as much as 12 percent
(11.9 million tonnes) to 90 million tonnes. Most of the
decrease reflects lower anticipated purchases of maize,
but also of barley and sorghum, by China. Total coarse
grain imports by the country in 2016/17 are forecast
at 11.3 million tonnes, a drop of 49 percent (nearly
11 million tonnes) from 2015/16. Recent policy measures
to halt the purchasing and stockpiling of maize by the
Government, combined with an increase in auctioning
from state reserves, have contributed to narrowing the
gap between domestic and world prices, thus making the
importation of all coarse grains less attractive. Imports by
the Islamic Republic of Iran are forecast to decline by
around 1 million tonnes, to 6.5 million tonnes, mostly on
reduced maize purchases for the first time in three years.
Total imports of coarse grains by Saudi Arabia are also set
to decrease, by 500 000 tonnes, to 13.2 million tonnes. As
a leading importer of the commodity, Saudi Arabia’s barley
imports in 2016/17 are forecast at 9.7 million tonnes,
300 000 tonnes below the estimated record volume
in 2015/16, but still 8.7 percent above the 5-year
average. A slight decrease in imports is projected for
the Republic of Korea, as some maize purchases could
be substituted with competitively priced feed wheat. By
contrast, deliveries of barley to Turkey are anticipated
to rise from 300 000 in 2015/16 to 800 000 tonnes in
2016/17, following this season’s sharp fall in domestic
production. Increased volumes of barley and sorghum
purchases may slightly raise coarse grain imports by Japan,
to 17.6 million tonnes, as maize imports are expected to
remain unchanged at around 15 million tonnes.
In Africa, total coarse grain imports are forecast to
rise to 30 million tonnes in 2016/17, some 11 percent
(3 million tonnes) more than in 2015/16, with most of
the increase concentrated in Morocco and South Africa,
which both face larger requirements following domestic
production shortfalls. In Morocco, purchases of barley are
forecast to nearly double in 2016/17 to 1.5 million tonnes,
because of a drop in production, with those of maize
also rising to meet the overall domestic feed demand.
In South Africa, normally a leading regional maize
exporter, maize imports in 2016/17 are likely to reach
3.5 million tonnes, exceeding the previous season’s high
level. Among other countries, maize purchases by Malawi and Zimbabwe are forecast to approach 650 000 and
955 000 tonnes, respectively, significantly above the
already high levels attained in 2015/16, because of falling
production in 2016 in both countries. Maize deliveries to
Egypt, Africa’s largest importer, are likely to remain close
to the 2015/16 estimate of 8.5 million tonnes.
Imports by countries in Latin America and the Caribbean
are forecast to hover around the 2015/16 level, with
decreases in several countries in Central America and
the Caribbean offsetting an increase in South America.
Among countries buying less coarse grains in 2016/17
is Mexico, due to higher domestic production. The
country is forecast to import 14.6 million tonnes, down
300 000 tonnes from 2015/16, but still some 26 percent
above the 5-year average. On the other hand, maize
imports by Brazil, normally a major maize exporter, are
seen to soar to 2 million tonnes, up 1.3 million tonnes from
2015/16. Brazil’s sharp decline in this year’s production,
combined with large exports earlier in the year, have led
to tight market conditions and high domestic prices, thus
necessitating large external supplies until the arrival of
the second harvest. Total imports in Europe are forecast
at around 14.1 million tonnes, down 1.4 million tonnes
from the 2015/16 estimated level. Most of the decrease is
expected to be concentrated in the EU, given the expected
recovery in this year’s maize production and large supplies
of low protein wheat.
As for exports, a sharp contraction in world trade,
such as the one projected for 2016/17, would have
normally resulted in big cuts in exports by major exporters.
However, an emerging feature this season is the tight
export availabilities in a number of exporting countries
(in particular Brazil and South Africa) due to their own
production shortfalls. As a result, other exporting countries
(such as Argentina and the United States) are expected
to be able to greatly increase their exports and even expand
their market shares despite shrinking world trade volume.
With maize supplies very much curtailed following the
poor 2016 production, shipments from Brazil are forecast
to decrease by as much as 17 million tonnes (47 percent)
to a five-year low of 19 million tonnes, while, at just
700 000 tonnes, maize exports from South Africa could fall
below last season’s below-average level. By contrast, large
supplies are anticipated to boost coarse grain sales from the
United States to a 9-year high of almost 61 million tonnes,

Ma
rke
t a
sse
ssm
en
ts
22 FOOD OUTLOOKOCTOBER 2016
Table 4. Top 10 maize exporters
Table 6. Top 5 sorghum exporters
Table 5. Top 5 sorghum importers
Table 3. Top 10 maize importers
2011/12-2015/16 average
2016/17f'cast
Change
million tonnes %
United States 39.8 54.0 35.6
Argentina 17.7 24.0 35.9
Brazil 23.0 19.0 -17.4
Ukraine 16.7 18.3 9.6
Russian Federation 3.2 4.5 41.6
Paraguay 2.6 2.6 -0.7
EU 2.7 2.5 -7.4
Serbia 1.7 2.0 15.4
India 3.1 0.8 -73.9
South Africa 1.8 0.7 -61.8
2011/12-2015/16 average
2016/17f'cast
Change
million tonnes %
United States 5.2 6.2 19.7
Australia 1.1 0.9 -16.5
Argentina 1.7 0.7 -57.6
Ethiopia 0.4 0.4 0.0
Ukraine 0.1 0.1 -57.9
2011/12-2015/16 average
2016/17f'cast
Change
million tonnes %
China 4.4 5.1 15.1
Japan 1.2 0.8 -34.8
Mexico 0.9 0.6 -40.3
Chile 0.3 0.3 -2.7
Colombia 0.4 0.3 -32.8
2011/12-2015/16 average
2016/17f'cast
Change
million tonnes %
Japan 14.9 15.0 0.8
Mexico 10.3 13.4 29.8
EU 11.0 12.0 9.4
Korea Rep. of 9.2 10.0 8.6
Egypt 7.3 8.5 15.8
Vietnam 4.0 7.7 94.1
China 8.5 6.1 -28.1
Iran Islamic Rep. of 5.1 5.0 -1.2
Colombia 4.1 4.6 11.6
Algeria 3.7 4.2 13.4
* Exports are based on a common July/June marketing season
* Exports are based on a common July/June marketing season*Imports are based on a common July/June marketing season
* Imports are based on a common July/June marketing season
Table 8. Top 10 barley exporters
Table 7. Top 10 barley importers
2011/12-2015/16 average
2016/17f'cast
Change
million tonnes %
EU 6.8 8.0 17.4
Australia 5.4 5.4 0.4
Russian Federation 3.6 4.5 26.6
Ukraine 3.2 4.2 31.1
Argentina 2.9 2.4 -16.7
Canada 1.4 1.3 -7.4
Kazakhstan 0.5 0.5 0.7
India 0.4 0.3 -20.4
United States 0.3 0.3 -0.2
Uruguay 0.1 0.1 0.0
2011/12-2015/16 average
2016/17f'cast
Change
million tonnes %
Saudi Arabia 8.9 9.7 8.7
China 4.9 4.6 -6.1
Iran Islamic Rep. of 1.4 1.5 5.5
Morocco 0.5 1.5 215.5
Japan 1.2 1.3 5.3
Lybia 0.5 1.0 85.0
Algeria 0.6 0.9 39.7
Jordan 0.8 0.8 -7.6
Tunisia 0.5 0.6 10.5
United States 0.4 0.5 2.6
* Exports are based on a common July/June marketing season*Imports are based on a common July/June marketing season

23FOOD OUTLOOKOCTOBER 2016
CO
AR
SE G
RA
INS
2008/09 2009/10 2010/11 2011/12 2012/13 2013/14 2014/15 2015/16* (estim.)
2016/17 (f’cast)
Thousand tonnes
Maize production 307 142 332 550 316 166 313 956 273 188 351 270 361 101 345 479 366 536
Ethanol use 93 396 116 616 127 538 127 005 117 886 130 155 132 085 132 085 133 990
Yearly change (%) 21 25 9.4 -0.4 -7.2 10.4 1.5 0.0 1.4
As % of production 30 35 40.3 40.5 43.2 37.1 36.6 38.2 36.6
Table 9. Maize use for ethanol (excluding non-fuel) in the United States
Source: WASDE-USDA. * 12 September 2016
of which 54 million tonnes in the form of maize, up
18 percent from 2015/16. Similarly, the 2016 record
production may boost Argentina’s maize shipments to an
all-time high of 24 million tonnes, 29 percent more than in
2015/16. Exports of coarse grains from the EU are projected
to contract, because of lower sales of barley. Indeed, in spite
of large supplies, total exports of barley (feed) from the EU
could decline to 8 million tonnes, 2.8 million tonnes less than
2015/16, reflecting ample availability of more competitively
priced barley from other export origins; Australia, the
Russian Federation and Ukraine, in particular.
UTILIZATION
Large supplies and lower prices driving up total utilization World total utilization of coarse grains in 2016/17 is
projected to reach 1 328 million tonnes, an increase of
1.5 percent (19.4 million tonnes) over 2015/16. The latest
forecast is 4.6 million tonnes higher than anticipated in
September, mainly due to upward revisions of feed usages
of barley, maize and sorghum in several countries.
World feed utilization of coarse grains in 2016/17
is forecast at 758 million tonnes, up 2.1 percent, or
15.3 million tonnes, from 2015/16. Maize use as
feed is likely to reach 592 million tonnes, 3.1 percent,
18 million tonnes, above the 2015/16 estimate. The
United States and China are likely to register the largest
increases in coarse grains feed usage in 2016/17. In the
United States, it is forecast to reach 149 million tonnes
(of which 143 million tonnes of maize), up 8.3 percent
(11.5 million tonnes) from 2015/16, underpinned by the
record 2016 production. In China, the elimination of
Government maize purchases and stockpiling is anticipated
to boost domestic feed as well as industrial uses of maize,
despite a reduction in this year’s production. China’s maize
feed use is currently projected at 151 million tonnes, up
3.8 percent (5.5 million tonnes) from 2015/16. By contrast,
feed use of maize could contract in the EU, mainly because
of large supplies of poor quality wheat. Declines are also
projected for Brazil and South Africa, due to poor domestic
production and high domestic prices.
Total industrial use of coarse grains is projected
to increase by 1.8 percent, to 310 million tonnes in
2016/17. Of these, 155 million tonnes are anticipated to
be consumed for biofuel production, up 1.5 percent from
the 2015/16 estimate; and 104 million tonnes for the
production of starch, 2.7 percent more than in 2015/16.
As with feed use, the largest expansions are predicted for
the United States and China, and especially with regard to
maize. The growth in overall industrial utilization of barley
and sorghum is likely to remain subdued.
World food consumption of coarse grains is
forecast to increase in 2016/17 by 1.9 percent, or
3.9 million tonnes, to 205 million tonnes. This would imply
a stable average per capita consumption level of around
27.6 kg per year. While their direct human consumption is
less significant globally than that of other cereals, coarse
grains are an important source of food in Latin America
and the Caribbean. They also constitute a main staple food
in Africa, with average per capita consumption at 73 kg per
year.
Figure 5. Coarse grain exports: major exporters
0 10 20 30 40 50 60 70
2015/16 estimate 2016/17 forecast
Million tonnes
USA
EU
Canada
Brazil
Ukraine
Argentina
Australia
RussianFederation

Ma
rke
t a
sse
ssm
en
ts
24 FOOD OUTLOOKOCTOBER 2016
Figure 6. Coarse grain utilization
0
350
700
1050
1400
2016/172015/162014/152013/142012/13
Million tonnes
Feed use
Other uses
Food use
estim. f’cast
STOCKS
Small decline projected for world inventories of coarse grains FAO’s latest forecast of world stocks of coarse grains by
the close of seasons in 2017 stands at 256 million tonnes,
a decrease of 1.1 percent (2.9 million tonnes) from their
relatively high opening level and 8.5 million tonnes lower
than was reported in September. This month’s downscaling
largely reflects lower estimates for maize ending stocks and,
to a lesser extent, barley inventories. Based on the latest
forecasts, the world stocks-to-use ratio for coarse grains
in 2016/17 is estimated to decline slightly from the previous
season to 18.8 percent, still well above the historical low
of 15.4 percent registered in 2003/04. The largest year-
on year drawdown is forecast for China, where, with this
year’s anticipated decline in maize production and higher
domestic use, coarse grain stocks could fall by as much as
13.2 million tonnes, or 12.4 percent.
By contrast, the ratio of major exporters’ closing stocks to their total disappearance (defined as domestic
utilization plus exports), considered a better indicator
of global availabilities for trade, is set to increase from
11.4 percent in 2015/16 to 13.0 percent in 2016/17. The
reason for the higher value of the ratio is the expectation
of a surge in the end-of-season inventories mostly in
the United States, the world’s leading maize exporter.
On the back of this year’s record maize crop, coarse
grain stocks in the United States are forecast to rise by
some 17 million tonnes to nearly 65 million tonnes, or
as much as a quarter of the world total. By contrast,
inventories in several other exporters are likely to decline,
especially in Brazil, where this year’s cut in production
might curb end-of-season maize stocks by half, to around
3.5 million tonnes.
Figure 7. Coarse grain stocks and ratios
0
100
200
300
2016/172015/162014/152013/142012/137
12
17
22
Million tonnes Percent
Major Exporters Rest of the World
China(Mainland)
World Stock-to-use ratioStock-to-disappearance ratio of Major Exporters
estim. f’cast

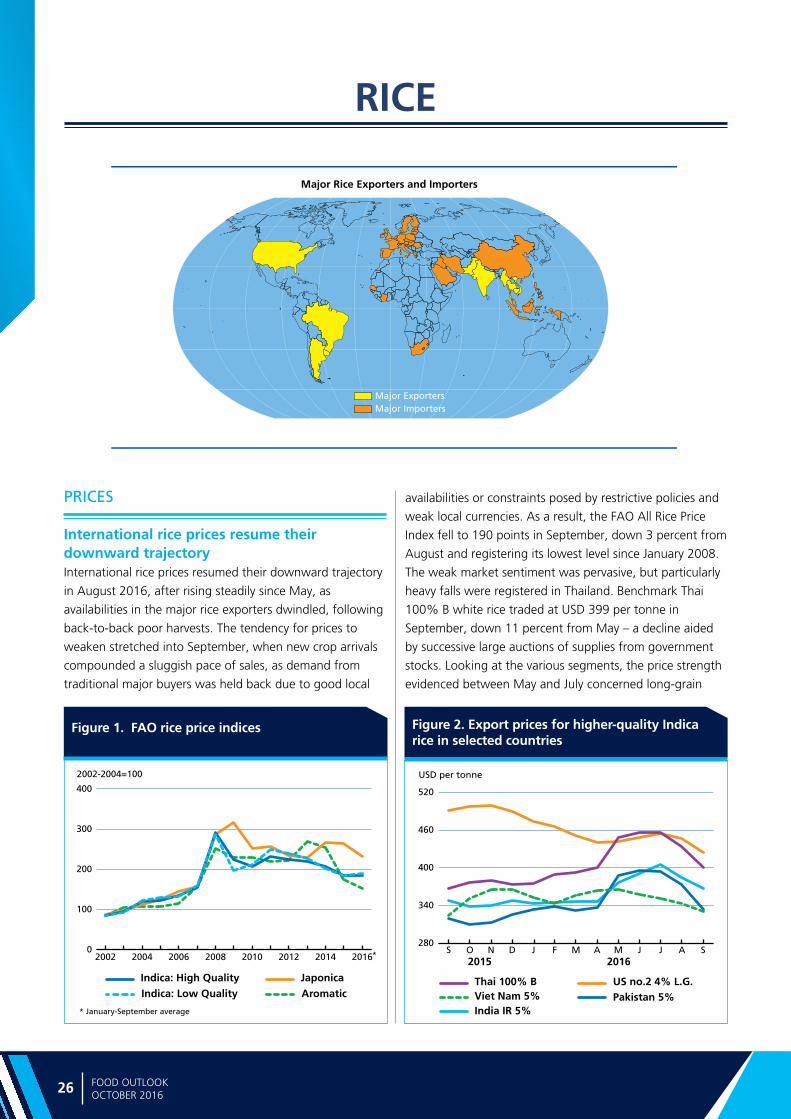
Ma
rke
t a
sse
ssm
en
ts
26 FOOD OUTLOOKOCTOBER 2016
Figure 1. FAO rice price indices
Major Rice Exporters and Importers
Major ExportersMajor Importers
RICE
Figure 2. Export prices for higher-quality Indicarice in selected countries
280
340
400
460
520
SAJJMAMFJDNOS
USD per tonne
Thai 100% B
2015 2016
US no.2 4% L.G.Pakistan 5%Viet Nam 5%
India IR 5%
PRICES
International rice prices resume their downward trajectoryInternational rice prices resumed their downward trajectory
in August 2016, after rising steadily since May, as
availabilities in the major rice exporters dwindled, following
back-to-back poor harvests. The tendency for prices to
weaken stretched into September, when new crop arrivals
compounded a sluggish pace of sales, as demand from
traditional major buyers was held back due to good local
availabilities or constraints posed by restrictive policies and
weak local currencies. As a result, the FAO All Rice Price
Index fell to 190 points in September, down 3 percent from
August and registering its lowest level since January 2008.
The weak market sentiment was pervasive, but particularly
heavy falls were registered in Thailand. Benchmark Thai
100% B white rice traded at USD 399 per tonne in
September, down 11 percent from May – a decline aided
by successive large auctions of supplies from government
stocks. Looking at the various segments, the price strength
evidenced between May and July concerned long-grain
0
100
200
300
400
20162014201220102008200620042002 *
* January-September average
2002-2004=100
Indica: High Quality
Indica: Low Quality
Japonica
Aromatic

27FOOD OUTLOOKOCTOBER 2016
RIC
E
Figure 3. Global paddy production and area
550
600
650
700
750
800
16151413121110090807140
145
150
155
160
165
Million tonnes Million ha
Production Area
estim. f’cast
Figure 4. India production and area
varieties, keeping the January–September averages of the
Indica sub-indices close to their corresponding 2015 levels.
Amid more adequate availabilities, lackluster demand
tended to weigh more heavily on quotations of medium/
short grain rice and of fragrant varieties, resulting in
the January–September averages of the Japonica and
Aromatica indices falling 14 and 17 percent below their
respective 2015 levels.
PRODUCTION
Production to hit a new record, as abundant rains boost output prospects in AsiaAfter a difficult start to the 2016 season, which saw
numerous producing countries along or south of the
Equator negatively impacted by the lingering influence of
El Niño, the return to El Niño/La Niña-neutral conditions
in May ensured a more normal climatic unfolding of the
season in the Northern Hemisphere. This was particularly
the case in Asia, where main crops, now at the harvest
stage, benefitted from plentiful monsoon rains. As a result,
world rice production in 2016 is now forecast to reach a
record of 497.8 million tonnes, up 1.9 million tonnes from
September expectations and 6.3 million tonnes over the
2015 depressed outcome. If confirmed, this would mark
the first year of global output expansion since 2013, an
achievement that would come on account of a 1.4 percent
expansion in plantings to 163.1 million hectares and a
robust average global yield of 4.6 tonnes of paddy per
hectare.
Much of the global production increase anticipated
for 2016 is expected to be concentrated in Asia, where
aggregate output is seen reaching 450.1 million tonnes.
The 1.3 percent growth in the region’s crop would be
spearheaded by a 3 percent output recovery in India to 107.7 million tonnes. An overall normal pattern of
the monsoon permitted main-crop plantings in India to
rise 1.0 million hectares over year-earlier levels by mid-
September and has boosted yield prospects and water
availabilities for the successive irrigated Rabi crop. In China (Mainland), producers have continued to favor rice over
other crops due to the safety provided by sizeable state
acquisitions at support prices. Although some flooding
has occurred, the resulting area expansion should ensure
that production in the country exceeds the 2015 record
by 0.4 percent, reaching 143.2 million tonnes. Improved
growing conditions should also give way to large absolute
gains in the Philippines and Thailand, after crops in
both countries were constrained by prolonged drought
conditions last year. However, in the case of Thailand,
production is forecast to stage a partial recovery to
20 million tonnes, given setbacks associated with short
water supplies early in the season, coupled with sustained
official efforts to encourage producers to shift to alternative
crops. The Islamic Republic of Iran, the Lao People’s Democratic Republic, Myanmar and Nepal are similarly
likely to close the season with larger crops, while adverse
weather undermined output in Indonesia, Malaysia,
Sri Lanka, Timor Leste and Viet Nam. The anticipated
output fall in Bangladesh is instead linked to a substitution
of more profitable crops for rice, with planting cuts in the Republic of Korea also promoted by the state in order to
reduce surplus output.
The production outlook for Africa remains positive,
pointing to a 4 percent expansion from 2015 to
19.6 million tonnes. The anticipated growth mirrors
0
50
100
150
200
1615141312111009080710
20
30
40
50
Million tonnes Million ha
Kharif Rabi Area
estim. f’cast

Ma
rke
t a
sse
ssm
en
ts
28 FOOD OUTLOOKOCTOBER 2016
Table 1. World rice market at a glance
Table 2. Rice Production: leading producers *
2014 2015 estim.
2016f.cast
Change:2016 over
2015
million tonnes, milled equivalent %
China (Mainland) 141.5 142.7 143.2 0.4
India 105.5 104.3 107.7 3.2
Indonesia 44.4 45.8 45.1 -1.5
Bangladesh 34.5 35.0 34.8 -0.4
Viet Nam 29.2 29.4 28.9 -1.6
Thailand 22.0 19.0 20.1 5.6
Myanmar 16.9 16.5 16.8 1.9
Philippines 12.4 11.4 12.2 7.0
Brazil 8.2 8.5 7.2 -14.8
Japan 7.8 7.6 7.7 1.1
United States 7.1 6.1 7.5 23.3
Pakistan 7.0 6.8 6.9 0.9
Cambodia 5.6 5.6 5.7 1.8
Korea Rep. of 4.2 4.3 4.2 -2.9
Egypt 4.3 4.1 4.3 6.8
World 494.6 491.5 497.8 1.3
* Countries listed according to their position in global production (average 2014-2016).
expectations of a 7 percent annual upturn in Egypt to
4.3 million tonnes, where attractive prices and a shift away
from cotton cultivation have boosted rice plantings, but
also of headway in West African countries such as Chad,
Mali, Nigeria and Senegal. Indeed, despite some flooding
problems, main crops through much of West Africa
have benefitted from abundant rains this season, with
the rice sector continuing to draw support under import
substitution programmes. In Nigeria, for instance, officials
have reaffirmed their commitment to attain self-sufficiency
in rice by 2018 under the “Green Alternative” roadmap,
with credit assistance to purchase basic inputs already
channeled to producers under the Anchor Borrowers’
Programme. Similarly, authorities in Senegal have renewed
efforts to enhance the marketing of local crops, attaining
commitments from importers to absorb almost 10 percent
of the forecast output this year. Elsewhere in the
continent, while generally conducive weather is expected
to boost crops in the United Republic of Tanzania,
El Niño-induced drought constrained output in Malawi, Mozambique and Zambia. Poor weather in southern
regions similarly kept production in Madagascar at below
average levels for a third successive season.
In Latin America and the Caribbean, where the bulk
of crops has already been collected, 2016 production is
expected to decline by 7 percent year-on-year to a six-
year low of 17.7 million tonnes, as crops in numerous
South American countries were beset by drought and/or
flooding problems under the El Niño weather anomaly.
These were compounded by cuts to area planted stemming
from prospects of reduced margins, depressing output in
Argentina, Bolivia, Brazil, Guyana, Paraguay, Uruguay and Venezuela. This contrasts with expectations of
recoveries in Cuba, Costa Rica, Mexico and Nicaragua, and of record outturns in Chile, Peru and, especially,
Colombia. In the latter, attractive prices fostered a surge in
plantings, likely boosting output by 20 percent this season
to a record of 1.7 million tonnes.
In North America, the USDA’s latest assessment puts
rice production in the United States at 7.5 million tonnes,
200 000 tonnes less than previously envisaged. The less
buoyant outlook mirrors the impact of extensive flooding
during August, especially in Louisiana and Arkansas,
which hampered harvest operations, reduced yields
and undermined the quality of crops that had still to be
collected. However, these barely dented the outlook for a
season that had been, otherwise, characterized by generally
conducive weather and a strong rebound in plantings.
As a result, the United States is set to harvest its second
largest crop on record and 23 percent more than in 2015.
In Europe, larger plantings and favourable yield outturns
2014/15 2015/16 estim.
2016/17 f’cast
Change: 2016/17
over 2015/16
million tonnes, milled equivalent %
WORLD BALANCE
Production 494.6 491.5 497.8 1.3
Trade 1 44.6 43.5 43.8 0.7
Total utilization 491.4 495.4 501.4 1.2
Food 394.2 397.7 402.7 1.3
Ending stocks2 174.7 170.7 169.6 -0.7
SUPPLY AND DEMAND INDICATORS
Per caput food consumption:
World (kg/yr) 54.3 54.1 54.2 0.2
LIFDC (kg/yr) 59.0 58.7 58.7 0.0
World stock-to-use ratio (%) 35.3 34.1 33.2
Major exporters stock-to-disappearance ratio3 (%)
24.2 19.3 17.3
FAO RICE PRICE INDEX (2002-2004=100)
2014 2015 2016 Jan-Sep
Change: Jan-Sep 2016
over Jan-Sep 2015
%
235 211 196 -8.7
1 Calendar year exports (second year shown).2 May not equal the difference between supply (defined as production plus
carryover stocks) due to differences in individual country marketing years.3 Major exporters include India, Pakistan, Thailand, the United States and
Viet Nam.

29FOOD OUTLOOKOCTOBER 2016
RIC
E
Figure 7. World rice trade and FAO all rice price index
0
10
20
30
40
50
171615141312111009080
60
120
180
240
300
* January-September average for 2016
Million tonnes, milled eq. 2002-2004=100
Exports FAO All RicePrice Index*
f’castf’cast
in the European Union and the Russian Federation are
foreseen to boost output in Europe to 2.6 million tonnes.
Yet, the season proved far less auspicious in Oceania,
where Australia’s production slumped to 167 000 tonnes,
64 percent below the already reduced 2015 outcome, as
limited and costly water supplies for irrigation constrained
plantings.
TRADE
Subdued demand from the Far East to stall trade recovery in 2017Largely based on current expectations of 2016 crops,
much of which will be consumed in the course of
next year, FAO forecasts world trade in rice to amount
to 43.8 million tonnes in 2017. This is marginally
(300 000 tonnes) above the 2016 depressed figure,
marking the third successive year of declining or stagnating
trade growth. Underlying the downcast outlook are
prospects of continued subdued demand in Asia, especially
in the Far East, where improved local harvests may
enable traditional importers such as Indonesia and the
Philippines to cut imports, while rather ample inventories
may keep Bangladesh and Sri Lanka’s purchases at
reduced levels. In the case of China (Mainland), the
largest single global destination of rice, 2017 purchases
are put at 6.3 million tonnes, unchanged from 2016
expectations. Although the wide gaps between Chinese
quotations and those of near-by suppliers should continue
to keep Chinese imports large, prospects of deliveries to
country gaining further ground next year are tempered
by ongoing government efforts to slow the influx of rice
through borders with Viet Nam and Myanmar.
Import demand is anticipated to be firmer in the Near
East, under expectations that countries such as Iraq, Saudi Arabia, Turkey and the United Arab Emirates will need
to replenish stockpiles drawn thin in the course of 2016.
Purchases by the Islamic Republic of Iran are also forecast
to edge up to 1.1 million tonnes next year, while remaining
below their 2012 and 2014 levels, due to a good crop and
the intermittent imposition of import restrictions.
Deliveries to African countries are seen in the order
of 14.2 million tonnes in 2017, up 4 percent from the
2016 depressed level, but below the heights registered
in 2014. Indeed, many of the factors that have tended
to curtail deliveries to the region over the past two years,
namely good local harvests and weak local currencies,
are expected to continue into 2017. This is even if more
attractive international offerings could provide some scope
for countries to meet their fast-expanding domestic needs
by stepping-up imports. Within the region, Burkina Faso,
Figure 5. Rice imports by region
0
6
12
18
17161514131211100908
Near East Asia Far East
Latin America
Million tonnes, milled eq.
Others
Africa
f’castf’cast
Figure 6. Rice exports by the major exporters
0
4
8
12
2016 forecast
2017 forecast
Million tonnes, milled eq.
India PakistanThailand USAViet Nam Others

Ma
rke
t a
sse
ssm
en
ts
30 FOOD OUTLOOKOCTOBER 2016
Cameroon, Mauritania, Niger and South Africa could
all purchase more rice, with year-on-year growth in Ghana
also facilitated by the recent rescinding of a three-year
old ban on overland deliveries. By contrast, good seasonal
turnouts are expected to permit Senegal and Cote d’Ivoire to reduce imports by 4 percent each, arriving
at 1.1 and 1.3 million tonnes, respectively. On the other
hand, purchases by Nigeria may remain limited, at around
2.5 million tonnes, should the prevailing weakness of the
Naira persist along with current restrictions that prevent
rice traders’ access to official currency markets.
After reaching an all-time high in 2016, aggregate
deliveries to Latin America and the Caribbean in 2017
are expected to subside by 6 percent year-on-year to
4.0 million tonnes. Within the region, output recoveries
may lead Cuba and Brazil to cut imports, with easing
inflationary pressure following an excellent harvest also
enabling Colombia to reduce purchases relative to the
record of 300 000 tonnes forecast for 2016. Elsewhere,
strong domestic demand for Indica and fragrant varieties
could extend the upward streak in imports by the
European Union for another year, with deliveries to
the United States also expected to rise by 1 percent to
775 000 tonnes.
On the export side, anticipation of international demand
remaining tepid for a third successive year raises prospects
of competition for markets intensifying in 2017. At country
level, improved availabilities from a good harvest in India
are forecast to raise the country’s shipments by 7 percent
to 10.7 million tonnes, thus consolidating its position as
the world’s leading supplier of rice for the sixth straight
year. The resurgence of Indian exports would mainly come
to the detriment of Thailand, which could see its 2017
shipments contract by 4 percent to 9.5 million tonnes.
The reduction comes amid expectations of only a partial
output recovery in the country, although official efforts to
dispose of the 8.4 million tonnes of rice still held in Thai
public granaries by next year could cushion the country’s
export fall. Prospects are similarly subdued for Viet Nam,
which, in the absence of a major boost to fragrant and
glutinous sales, may see faltering demand for white rice
from traditional Asian outlets keep its shipments close to
the six-year low expected for 2016, at 7.6 million tonnes.
Among other exporters, lower export quotations due to a
bumper crop are anticipated to raise shipments by United States by 6 percent year-on-year to a seven-year high of
3.7 million tonnes. Australia, Cambodia and Pakistan
could similarly count on sufficient availabilities to step up
shipments in 2017, while consignments are expected to
decline for Argentina, Brazil, Uruguay and Paraguay. In
the case of Egypt, an anticipated contraction is linked to
the continuance of the ban on milled rice exports and the
recent inclusion of broken shipments in the ban.
UTILIZATION
Per capita food intake to rise slightly in 2016/17Total rice utilization is forecast to reach
501.4 million tonnes in 2016/17, up 1.2 percent year-
on-year. The expansion is anticipated to be sustained
by a 1.3 percent increase in world food use to
402.7 million tonnes, accounting for 80 percent of total
projected use. Volumes destined to animal feed are also
seen edging up to 18.3 million tonnes, amid expectations
that Japan, the Republic of Korea and Thailand would
continue encouraging rice use in the livestock sector to
dispose of surplus produce. Other uses (including seeds,
post-harvest losses and non-food industrial uses) are
expected to absorb 80.4 million tonnes over the year.
Based on these tendencies, world food use would stage a
modest recovery on a per capita basis, rising from 54.1 kg
in 2015/16 to 54.2 kg per person this season. This would
reflect expectations of a 0.1 kg gain in Asia to some
78.4 kg and in Africa to 24.9 kg per person. Nonetheless,
much will still depend on domestic quotations. During
the third quarter of 2016, retail and wholesale rice prices
remained above their year-earlier levels in various Asian
countries, mirroring production shortfalls incurred in
2015/16 due to unfavourable weather. Larger price gains
have been registered in southern Africa and South America,
amid a combination of weak local currencies and output
shortfalls.
STOCKS
Despite sustained reductions in the major exporters, world rice stocks in 2016/17 sufficient to cover four months of global domestic use In line with the improved production outlook, forecasts of
world rice inventories at the close of 2016/17 have been
raised to 169.6 million tonnes. This level would stand
0.7 percent, or 1.1 million tonnes, short of the 2015/16
estimate, while still suggesting a comfortable level of
global supplies, with world reserves sufficient to cover 4
months of projected global use. This would keep the world
stocks-to-use ratio in 2016/17 at 33.2 percent, over the
30 percent mark it has consistently exceeded over the past
five years.
From a regional perspective, much of the forecast
stock reduction is expected to take place in Asia, with

31FOOD OUTLOOKOCTOBER 2016
RIC
E
Figure 8. Stocks held by the five major rice exporters and stock-to-disappearance ratio
0
20
40
60
16/1714/1512/1310/1108/0906/070
10
20
30
Million tonnes, milled eq. Percent
f’cast
Closing Stocks
Stock-to-disappearance ratio
India and Thailand once again driving the fall by cutting
reserves to 16.5 and 8.2 million tonnes, respectively.
In both cases, drawdowns come amid expectations of
sustained government efforts to trim the size of their
reserves. Although reductions are also expected to
concern a few rice importers within the region, such as
Bangladesh, Indonesia, Sri Lanka and Saudi Arabia, in most cases declines would occur from hefty reserves
amassed the previous year through good harvests or large
imports. Moreover, cuts would be more than outweighed
by accumulations in other countries, especially in China (Mainland). Reflecting a combination of steady output
gains and sizeable imports, 2016/17 carry-overs in China
are predicted to expand by 4 percent year-on-year to
a high of 101.5 million tonnes. Improved harvests may
similarly enable Cambodia, Nepal and the Philippines
to replenish their reserves. On the other hand, gains in
the Republic of Korea are linked to long-term dietary
shifts away from rice consumption and in Viet Nam to a
poor export performance. Elsewhere, poor harvest results
are envisaged to entail carry-over cuts in Argentina,
Australia and Madagascar. However, the steepest fall
is forecast to take place in Brazil, where a poor harvest
and still sizeable exports are expected to reduce the
country’s reserves by as much as 67 percent, year-on-year,
to a low of 215 000 tonnes. By contrast, Colombia, the
European Union and the United States are all expected
to accumulate more rice, with the United States closing the
season with 1.9 million tonnes in stock, the highest volume
in over three decades.
Seen from a trade angle, the predicted drawdown in
Indian and Thai inventories would lower aggregate reserves
of the major rice exporters – India, Pakistan, Thailand, the
United States and Viet Nam – by 11 percent year-on-year
to 30.4 million tonnes in 2016/17. This would result in
the group’s stock-to-disappearance ratio falling from an
estimated 19.3 percent.

Ma
rke
t a
sse
ssm
en
ts
32 FOOD OUTLOOKOCTOBER 2016
ASIA
Mon
thU
SD/K
g3
mon
ths
earli
er1
year
ear
lier
2 ye
ars
earli
er
Bang
lade
sh: D
haka
(coa
rse)
Aug-
160.
43
27
%9%
-7%
Cam
bodi
a: P
hnom
Pen
h (m
ix)*
Aug-
160.
41
3%
6%6%
Chin
a: 5
0 Ci
ty A
vg. (
japo
nica
seco
nd q
ualit
y)Au
g-16
0.94
0%2%
5%
Indi
a: D
elhi
Au
g-16
0.47
13%
4%6%
Indo
nesia
: Ntl.
Avg
. (m
ediu
m q
ualit
y)Au
g-16
0.80
0%4%
17%
Japa
n: K
u-ar
ea o
f Tok
yo (n
on-g
lutin
ous)
Ju
n-16
4.45
1%5%
-5%
Repu
blic
of K
orea
: Ntl.
Avg
. Se
p-16
1.76
0%-1
2%-1
2%
Lao
PDR:
Vie
ntia
ne (g
lutin
ous f
irst q
ualit
y)Ju
l-16
1.02
0%7%
7%
Mon
golia
: Ula
anba
atar
Ju
l-16
1.21
0%6%
8%
Mya
nmar
: Yan
gon
(Em
ata,
Man
awth
ukha
FQ
)*Au
g-16
0.44
4%6%
36%
Occ
upie
d Pa
lest
inia
n Te
rrito
ry: W
est B
ank
(sho
rt g
rain
)Au
g-16
1.95
1%0%
7%
Paki
stan
: Kar
achi
(irr
i) Au
g-16
0.41
1%-2
%-2
9%
Phili
ppin
es: N
tl. A
vg. (
wel
l-mill
ed)
Aug-
160.
89
2%
1%-4
%
Saud
i Ara
bia:
Ntl.
Avg
. (B
asm
ati,
Whi
te In
dian
)Ju
l-16
2.16
-1%
-10%
-9%
Sri L
anka
: Col
ombo
(whi
te)
Aug-
160.
47
0%
7%-4
%
Thai
land
: Ban
gkok
(5%
bro
ken)
*Au
g-16
0.38
-4%
10%
3%
Viet
Nam
: Don
g Th
ap (2
5% b
roke
n)*
Aug-
160.
32
-2
%6%
-12%
WES
TERN
AFR
ICA
Beni
n: C
oton
ou (i
mpo
rted
)Ju
l-16
0.89
0%0%
0%
Burk
ina
Faso
: Oua
gado
ugou
(im
port
ed)*
Aug-
160.
59
0%
0%6%
Chad
: N
'Dja
men
a (im
port
ed)
Jul-1
60.
82
-4
%-2
%-2
%
Mal
i: Ba
mak
o*
Aug-
160.
63
6%
-5%
6%
Nig
er: N
iam
ey (i
mpo
rted
)*Au
g-16
0.68
5%5%
11%
Sene
gal:
Daka
r (im
port
ed)
Jun-
160.
59
0%
--9
%
Togo
: Lom
é (im
port
ed)
Aug-
160.
67
-8
%-4
%-2
7%
EAST
ERN
AFR
ICA
Som
alia
: Mog
adish
u (im
port
ed)
Aug-
160.
48
-4
%-4
%-1
2%
Uga
nda:
Kam
pala
* Au
g-16
0.81
-16%
-3%
0%
Uni
ted
Rep.
of T
anza
nia:
Dar
es S
alaa
m*
Aug-
160.
86
-3
%-
38%
/1 Q
uota
tions
in th
e m
onth
spec
ified
in th
e th
ird c
olum
n w
ere
com
pare
d to
thei
r lev
els i
n th
e pr
eced
ing
thre
e, tw
elve
and
twen
ty-fo
ur m
onth
s. P
rice
com
paris
ons w
ere
mad
e in
nom
inal
loca
l cur
renc
y un
its.
* W
hole
sale
pric
es.
So
urce
s: F
AO/G
IEW
S G
IEW
S Fo
od P
rice
Data
and
Ana
lysis
Too
l; K
orea
Agr
icul
tura
l Mar
ketin
g In
form
atio
n Se
rvic
e (K
AMIS
); Ja
pan
Min
istry
of A
gric
ultu
re, F
ores
try
and
Fish
erie
s; U
.S. B
urea
u of
Lab
or S
tatis
tics (
BLS)
; Ass
ocia
zion
e In
dust
rie R
isier
e Ita
liane
(AIR
I).
Plea
se n
ote
that
pric
es sh
own
are
com
para
ble
over
tim
e, b
ut n
ot a
cros
s cou
ntrie
s, a
s the
y m
ay re
fer t
o di
ffere
nt st
ages
of t
he m
arke
ting
chai
n (e
.g. r
etai
l ver
sus w
hole
sale
pric
es),
diffe
rent
rice
type
s (e.
g. a
rom
atic
ver
sus n
on-a
rom
atic
) or d
iffer
ent q
ualit
ies o
f
rice
(e.g
fully
bro
ken
vers
us 5
% b
roke
ns).
Late
st q
uota
tion
avai
labl
e co
mpa
red
to: /1
mon
thly
pric
e tr
end
Hist
oric
alLa
test
ava
ilabl
e:
2016
20
15
2014
20
13
2009
20
08
2012
20
11
2007
2010
100
-100
00
-100
100
-100
100
0
2016
20
15
2014
20
13
2009
20
08
2012
20
11
2007
2010
100
-100
00
-100
100
-100
100
0
2016
20
15
2014
20
13
2009
20
08
2012
20
11
2007
2010
100
-100
00
-100
100
-100
100
0
Tab
le 3
. M
on
thly
ret
ail p
rice
s o
f ri
ce in
sel
ecte
d m
arke
ts

33FOOD OUTLOOKOCTOBER 2016
RIC
E
SOU
THER
N A
FRIC
AM
onth
USD
/Kg
3 m
onth
s ea
rlier
1 ye
ar e
arlie
r2
year
s ea
rlier
Ango
la: L
uand
a Ju
l-16
3.71
26%
81%
90%
Mad
agas
car:
Ntl.
Avg
. (lo
cal)
Aug-
160.
48
-
-24
%
Mal
awi:
Lilo
ngw
e Ju
l-16
1.04
0%65
%81
%
Nam
ibia
: Win
dhoe
k Au
g-16
1.31
-1%
15%
21%
Swaz
iland
: Ntl.
Avg
. Ju
l-16
0.71
-18%
4%4%
Zim
babw
e: H
arar
e Ju
l-16
1.17
-1%
-16%
-16%
CEN
TRAL
AM
ERIC
A AN
D T
HE
CARI
BBEA
N
Cost
a Ri
ca: N
tl. A
vg. (
first
qua
lity)
Au
g-16
1.34
0%-1
%-4
%
Dom
inic
an R
ep: S
anto
Dom
ingo
(firs
t qua
lity)
Se
p-16
1.02
1%3%
4%
El S
alva
dor:
San
Salv
ador
Au
g-16
0.97
0%-5
%-1
6%
Gua
tem
ala:
Gua
tem
ala
City
(sec
ond
qual
ity)*
Sep-
160.
74
0%
-4%
-16%
Hai
ti: P
ort-
au-P
rince
(im
port
ed)
Sep-
160.
73
0%
3%4%
Hon
dura
s: S
an P
edro
Sul
a (s
econ
d qu
ality
)*Se
p-16
0.73
-1%
-1%
-7%
Mex
ico:
Mex
ico
City
(sin
aloa
)*Se
p-16
0.70
4%3%
15%
Nic
arag
ua: M
anag
ua (o
rient
al) (
first
qua
lity)
*Se
p-16
0.93
0%2%
3%
Pana
ma:
Pan
ama
City
(firs
t qua
lity)
*Se
p-16
0.87
0%-1
%3%
SOU
TH A
MER
ICA
Boliv
ia: L
a Pa
z (g
rano
de
oro)
*Au
g-16
0.99
7%7%
-17%
Braz
il: S
ão P
aulo
Ju
l-16
0.99
8%24
%31
%
Colo
mbi
a: N
tl. A
vg (f
irst q
ualit
y)Au
g-16
1.12
-2%
9%35
%
Ecua
dor:
Qui
to (l
ong
grai
n)*
Aug-
161.
27
2%
9%15
%
Para
guay
: Asu
nció
n*
Aug-
160.
72
0%
14%
7%
Peru
: Lim
a (c
orrie
nte)
*Au
g-16
0.62
2%2%
2%
Uru
guay
: Ntl.
Avg
. (gr
ade
1)*
Aug-
161.
07
0%
20%
24%
NO
RTH
AM
ERIC
A
Uni
ted
Stat
es: C
ity A
vg. (
long
gra
in, u
ncoo
ked)
Ju
l-16
1.63
5%10
%-2
%
EURO
PE
Italy
: Mila
n (a
rbor
io v
olan
o)*
Sep-
161.
59
-8
%-1
6%12
%
mon
thly
pric
e tr
end
Hist
oric
al
/1 Q
uota
tions
in th
e m
onth
spec
ified
in th
e th
ird c
olum
n w
ere
com
pare
d to
thei
r lev
els i
n th
e pr
eced
ing
thre
e, tw
elve
and
twen
ty-fo
ur m
onth
s. P
rice
com
paris
ons w
ere
mad
e in
nom
inal
loca
l cur
renc
y un
its.
* W
hole
sale
pric
es.
So
urce
s: F
AO/G
IEW
S G
IEW
S Fo
od P
rice
Data
and
Ana
lysis
Too
l; K
orea
Agr
icul
tura
l Mar
ketin
g In
form
atio
n Se
rvic
e (K
AMIS
); Ja
pan
Min
istry
of A
gric
ultu
re, F
ores
try
and
Fish
erie
s; U
.S. B
urea
u of
Lab
or S
tatis
tics (
BLS)
; Ass
ocia
zion
e In
dust
rie R
isier
e Ita
liane
(AIR
I).
Plea
se n
ote
that
pric
es sh
own
are
com
para
ble
over
tim
e, b
ut n
ot a
cros
s cou
ntrie
s, a
s the
y m
ay re
fer t
o di
ffere
nt st
ages
of t
he m
arke
ting
chai
n (e
.g. r
etai
l ver
sus w
hole
sale
pric
es),
diffe
rent
rice
type
s (e.
g. a
rom
atic
ver
sus n
on-a
rom
atic
) or d
iffer
ent q
ualit
ies o
f
rice
(e.g
fully
bro
ken
vers
us 5
% b
roke
ns).
Late
st a
vaila
ble:
Late
st q
uota
tion
avai
labl
e co
mpa
red
to: /1
2016
20
15
2014
20
13
2009
20
08
2012
20
11
2007
2010
100
-100
00
-100
100
-100
100
0
2016
20
15
2014
20
13
2009
20
08
2012
20
11
2007
2010
100
-100
00
-100
100
-100
100
0
2016
20
15
2014
20
13
2009
20
08
2012
20
11
2007
2010
100
-100
00
-100
100
-100
100
0
2016
20
15
2014
20
13
2009
20
08
2012
20
11
2007
2010
100
-100
00
-100
100
-100
100
0
2016
20
15
2014
20
13
2009
20
08
2012
20
11
2007
2010
100
-100
00
-100
100
-100
100
0
Tab
le 3
. Mo
nth
ly r
etai
l pri
ces
of
rice
in s
elec
ted
mar
kets
(C
on
t’d
)

Ma
rke
t a
sse
ssm
en
ts
34 FOOD OUTLOOKOCTOBER 2016
Major Cassava Exporters and Importers
Major ExportersMajor Importers
Table 1. World cassava market at a glance
CASSAVA
2014 2015 estim.
2016 f’cast
Change: 2016
million tonnes, fresh root eq. %
WORLD BALANCE
Production 278.7 281.1 288.4 2.6
Trade 37.2 39.3 28.2 -28.4
SUPPLY AND DEMAND INDICATORS
Per caput food consumption:
World (kg/year) 20.7 20.7 21.0 1.5
Developing (kg/year) 34.11 33.88 34.26 1.1
LDC (kg/year) 70.5 66.1 67.1 1.5
Sub-Saharan Africa (kg/year)
114.4 109.2 108.8 -0.4
Trade share of prod. (%) 13.3 14.0 9.8 -30.2
CASSAVA PRICES 1 (USD/tonne)
2014 2015 2016 Jan-Sep
Change:Jan-Sep 2016
overJan-Sep 2015
Chips to China (f.o.b. Bangkok)
228.1 215.7 178.3 -17.3
Starch (f.o.b. Bangkok) 428.8 430.5 361.0 -16.2
Thai domestic root prices 72.4 70.0 51.3 -26.7
1 Source: Thai Tapioca Trade Association
PRICES
International quotations of cassava in sharp decline Monthly reference prices of internationally traded cassava,
a market that is mostly confined to East and Southeast
Asia, have fallen markedly in the past 12 months, despite
a rally in the second quarter of 2016. In September 2016,
Thai chips (f.o.b. Bangkok) were being quoted at an
average USD 180 per tonne, around 20 percent lower than
in the corresponding month of last year, with Thai flour and
starch quotations (Super High Grade, f.o.b. Bangkok) losing
over 25 percent of their value – or around USD 100 – over
this period, dropping to an average USD 325 per tonne
in September 2016. Thai domestic root prices, the raw
material that underpins these quotations, have undergone
even more profound falls, losing more than a third of their
value over the past 12 months.
The decline of world import demand, which was
exacerbated in recent months by policy changes in
China – the major destination for internationally traded
cassava products – has largely triggered the plummeting of
quotations. In June of this year, China began to implement
measures to lower its accumulated stockpiles of maize, with
the state grain reserves body auctioning 2 million tonnes
of the commodity, deemed unfit for human consumption,
to its feed and industrial sectors. As imported cassava
competes directly with maize in these sectors, China’s stock
release had a dramatic effect on world cassava quotations,
especially given the thinness of the international market for
cassava. The removal of minimum support prices for maize
in China has also made domestic maize more competitive
with imported substitutes, further pressurizing cassava
quotations.

35FOOD OUTLOOKOCTOBER 2016
CA
SSAV
A
2013 2014* 2015** 2016**
(000 tonnes)
World 263 177 278 667 281 050 288 427
Africa 144 180 156 384 153 451 157 056
Nigeria 47 407 54 832 57 000 57 855
Congo, Democratic Rep. of 16 500 16 817 15 300 15 200
Ghana 15 990 16 524 17 213 17 957
Angola 16 412 7 639 7 727 7 788
Mozambique 4 303 12 700 8 103 9 100
Tanzania, United Republic of 4 755 5 923 5 500 5 610
Uganda 2 979 2 812 2 587 2 400
Malawi 4 814 5 143 5 000 5 000
Benin 3 910 4 067 3 421 3 738
Cameroon 4 596 4 836 5 000 5 170
Rwanda 2 948 3 117 3 000 3 060
Madagascar 3 115 3 033 2 750 3 000
Côte d'Ivoire 2 436 4 239 5 087 5 189
Other Africa 14 015 14 703 15 764 15 989
Latin America 30 538 32 698 31 914 31 576
Brazil 21 484 23 242 22 784 22 410
Paraguay 2 800 3 000 3 000 3 114
Colombia 2 491 2 635 2 510 2 540
Other Latin America 3 763 3 821 3 620 3 512
Asia 88 276 89 379 95 469 99 579
Thailand 30 228 30 022 32 358 31 807
Indonesia 23 937 23 436 22 906 26 749
Viet Nam 9 758 10 210 10 674 10 201
India 7 237 8 139 8 000 7 840
China, mainland 4 585 4 593 4 500 4 548
Cambodia 8 000 7 933 11 944 13 222
Philippines 2 362 2 540 2 714 2 858
Other Asia 2 171 2 504 2 373 2 354
Oceania 261 283 292 292
* Estimate** Forecast
Table 2. World cassava productionFigure 1. International cassava prices (Oct 2013 - Sept 2016)
Figure 2. Maize and cassava chip prices (Oct 2013 - Sept 2016)
Figure 3. Thai root producer prices (Oct 2013 - Sept 2016)
100
200
300
400
500
2016201520142013
USD per tonne
Flour/Starch(Super High Grade f.o.b. Bangkok)
Chips to China(f.o.b. Bangkok)
130
160
190
220
250
2016201520142013
USD per tonne
Chips to China (f.o.b Bangkok)
Maize (US No. 2, Yellow)
30
50
70
90
2016201520142013
USD per tonne

Ma
rke
t a
sse
ssm
en
ts
36 FOOD OUTLOOKOCTOBER 2016
PRODUCTION
Global cassava production to rise in 2016World cassava production is tentatively forecast to
reach 288 million tonnes in 2016, 3 percent, or over
8 million tonnes, more than last year, restoring cassava’s
status as one of the world fastest expanding staple crops.
The anticipated output recovery rests on a return to more
normal weather conditions compared with last year, when
El Niño marred yields in most growing regions. In fact,
the crop’s tolerance to erratic weather conditions spared
cassava from further substantial output reductions in 2015.
Forecasting cassava production is difficult, due to a
widespread lack of data on harvest expectations and
negligible information on planting intentions. Even in
countries where the crop is known to play a critical role
in food security and rural development, or where its trade
carries importance, little effort is made to regularly survey
the crop, as is done for other staple crops. This holds
especially true in sub-Saharan Africa (SSA), the world’s
largest cassava growing region. Nevertheless, with rising
demand for the staple and with food security and the
rural economy high on the policy agendas of the region,
2016 cassava production in SSA could rebound to a record
157 million tonnes after having undergone an estimated
2 percent contraction last year.
The crop is the object of many expansion programmes
in the region, as commercialization of cassava remains a
key objective of many West African governments. Nigeria,
the regional production and world leader, is projected to
harvest around 58 million tonnes, almost 1 million tonnes
more than in 2015. Under its 2016–2020 Agriculture
Promotion Policy, the country will continue to provide
preferential loans to producers and grants to processors for
the expanded uptake of domestic cassava and to sustain
the continued propagation of improved varieties. Nigeria
also encourages the processing of cassava into flour as
a substitute for wheat in bread, which would enable the
country to limit its high dependency on imported wheat.
Indeed, with consumer purchasing power being negatively
affected by high inflation and a falling currency, many
have turned to cassava as a more affordable staple than
imported rice, providing a further stimulus to national
cassava output in 2016.
Supported by favourable growing conditions and a
conducive policy environment, cassava production in
Ghana, the region’s second largest cassava producer,
could rise by 4 percent to a record 18 million tonnes in
2016. Current year prospects also remain positive in other
important producing countries in West Africa, especially
Côte d’Ivoire, Cameroon, Benin, Sierra Leone and
Benin, where either all-time high or exceptional harvests
are anticipated.
In central, eastern and southern African countries,
cassava production is expected to recover from the
drought-afflicted levels of 2015. Cassava’s tolerance
to erratic weather conditions spared output in these
subregions from considerable disruption last year and has
even put cassava expansion high on the agendas of many
governments. Positive cassava outcomes are anticipated in
Angola, Madagascar, Mozambique, United Republic of Tanzania and Rwanda. By contrast, conflict and floods
reported in the Democratic People’s Republic of Congo
are likely to have curtailed production in 2016.
In Asia, the regional 2016 cassava production is
forecast to increase by around 4 percent to a record
100 million tonnes. The industrial utilization of cassava
in the alcohol, ethanol, starch and animal feed sectors,
and their lucrative export markets, have underpinned a
sustained expansion of the crop in the region, particularly
in Southeast Asia. However, weather disruptions, including
dryness from El Niño, have affected cassava yields and
stymied the prospect of a much larger 2016 regional
harvest.
In Thailand, Asia’s largest producer, the 2016 season
has concluded, and official reports point to a small
decline in production from the record crop of last year.
Despite higher cassava plantings, a drought-induced drop
in yields is behind the 2 percent fall in 2016 output. In
China, crop production is forecast to remain at around
last year’s level. The country largely sources its cassava
needs in processed form (mainly dry chips and flour) from
Thailand and neighbouring countries, namely Cambodia,
Lao People’s Democratic Republic and Viet Nam, where
Figure 4. World production of cassava
0
100
200
300
2016201520142013201220112010estim. f’cast
Africa
Asia
Latin America
Million tonnes

37FOOD OUTLOOKOCTOBER 2016
CA
SSAV
A
it has engaged in efforts to ensure long-term supplies.
Of all these countries, only Cambodia’s production is
expected to increase in 2016. The country is anticipated
to gather a record crop of some 13 million tonnes, over
1 million tonnes more than in 2015. Buoyed by rising
regional demand in recent years, the expansion of cassava
cultivation in Cambodia has been remarkable, increasing
three-fold in the space of six years.
In contrast, in Indonesia and the Philippines, cassava is
more important for food security than for industry. Dietary
diversification programmes in the two countries have
targeted cassava as a substitute for rice. Record cassava
harvests are foreseen in both countries in 2016, boosted
by higher plantings and above average yields. In Indonesia,
27 million tonnes could be gathered, some 17 percent
more than last year, while in the Philippines, output is
expected to reach 2.9 million tonnes, some 5 percent more
than in 2015.
In South Asia, cassava plays a role in food security in
India, particularly in the major growing states of Kerala
(consumption of fresh roots) and Tamil Naidu (starch for
food manufacturing). Combined, the two states account
for 98 percent of national output. Production by the
country in 2016 is expected to fall by 2 percent from last
year, to 7.8 million tonnes. Cassava output is on a gradual
decline in India, as farmers are opting to cultivate more
remunerative crops, such as rubber, black pepper and
coffee.
The cassava production outlook for Latin America and
the Caribbean points to a successive year of contraction
in 2016. In Brazil, the region’s leading producer, and also
in Paraguay, low prices at the beginning of the season
resulted in a decline of plantings, bringing about a slight
decrease in cassava output in both countries. Concerning
the region’s other sizable producing countries, production
is expected to remain stable in Colombia and Peru.
UTILIZATION
Rising demand for processed cassavaCassava is utilized in a multitude of ways. Food constitutes
the major end use of the crop, but local and regional
markets for animal feed, industrial use and energy feature
prominently. Assessing the levels of uptake by different
markets is virtually impossible, as again, little concerted
effort is made at the country level to assess utilization. On
the other hand, because cassava roots are highly perishable
once harvested, they are almost utilized entirely within the
crop year, making market assessments somewhat easier.
Cassava is mainly utilized as a foodstuff. As a staple,
the root crop has little importance in the global diet
(typically 21 kg per capita per year in fresh root equivalent)
owing to its perishability and bulkiness which preclude
its widespread trade. However, cassava has major dietary
significance in areas where it is grown. This is particularly
evident in sub-Saharan Africa, where cassava is an
important dietary staple in root form, but also in processed
form. Indeed, fermented and non-fermented granulated
and flour-based cassava products are increasingly popular
in the region. Many countries in sub-Saharan Africa have
launched value addition initiatives in the cassava food
chain, promoting cassava to support the rural economy
and help meet rising dietary needs. Since non-food markets
for cassava are of little significance in sub-Saharan Africa,
production levels effectively translate into levels of food
availability in the region. As a result, the per capita food
availability is estimated at approximately 109 kg in fresh
root equivalent in 2016, which is marginally down from
last year. This comes in spite of a sizeable increase in
production, as population growth has outpaced that of
output, resulting in the fall in per capita availability in 2016.
Cassava also features prominently in diets in Latin
America and the Caribbean, especially in Brazil, where the
blending of cassava flour with wheat flour is mandatory.
Likewise, in south Asia (India) and Southeast Asia (Indonesia
and Philippines) cassava is widely consumed as food.
However, as non-food markets for cassava are also well
established in these regions, it is difficult to assess precise
changes in its direct human consumption.
Demand for cassava as a raw material in the energy
sector, particularly in East and Southeast Asia, has stalled. Low
gasoline prices have generally put ethanol at a competitive
disadvantage and, where mandatory blending rates are
in force, competition among agricultural feedstocks for
energy conversion is fierce. For instance, in China, the rising
availability of lower priced maize has substantially lowered the
uptake of cassava by the energy sector. In Viet Nam, relatively
high cassava root prices have resulted in the closure of two
of the country’s three cassava-based biofuel plants, despite
the presence of a national mandate requiring blending rates
of 5 percent. On the other hand, in Thailand, shortfalls in the
availability of molasses derived from sugarcane could lead to
expanded use of cassava in ethanol production.
Based on analysis in countries that have established
markets for cassava feedstuffs, the use of cassava globally as
an animal feed could also fall in 2016, where it is in direct
competition with other feeding stuffs, particularly maize,
and where annual supplies of cassava are expected to fall,
such as in Brazil. Thailand could again be an exception to this
trend, as the slump in international demand for its cassava
products may foster a diversion of supplies to its domestic
feed sector.

Ma
rke
t a
sse
ssm
en
ts
38 FOOD OUTLOOKOCTOBER 2016
Figure 5. World trade in cassava products (chip and pellet equivalent)
0
6
12
18
24
2016201520142013201220112010estim. f’cast
Flour and Starch
Chips and Pellets
Million tonnes
2012 2013 2014 2015 2016
000 tonnes
Total 15 303 17 638 18 600 19 664 14 082
Flour and Starch 7 029 7 391 8 588 8 405 6 900
Thailand 6 163 6 686 7 919 7 657 6 330
Viet Nam 500 355 337 432 320
Others 367 350 333 316 250
Chips and Pellets 8 273 10 247 10 012 11 259 7 182
Thailand 4 853 6 006 6 927 7 458 4 402
Viet Nam 2 386 2 700 2 565 3 081 2 280
Cambodia 722 361 350 420 300
Nigeria 20 150 100
Others 200 180 150 150 100
2012 2013 2014 2015 2016
000 tonnes
Total 11.016 12.692 14.845 15.115 10.732
Flour and Starch
Total 6.163 6.686 7.919 7.657 6.330
Japan 843 872 916 851 1.074
China 1.577 2.774 3.513 3.052 2.159
Chinese Provence of Taiwan
555 628 665 610 609
Indonesia 1.482 647 888 1.256 726
Malaysia 575 436 525 586 353
Others 1.131 1.329 1.412 1.302 1.410
Chips and Pellets
Total 4.853 6.006 6.927 7.458 4.402
China 4.772 5.930 6.918 7.431 4.383
Others 174 77 9 27 53
Table 3. World exports of cassava (Product weight of chips and pellets)
Table 4. Thai trade in cassava (Product weight of chips and pellets)
Source: Thai Tapioca Trade Association (TTTA), FAO
TRADE
Sharp contraction in cassava product trade in 2016The volume of world trade in cassava is expected to fall to
14 million tonnes (chip and pellet weight equivalent), some
5.5 million tonnes, or 28 percent, below last year’s volume,
reaching a six-year low.
Mostly confined to East and Southeast Asia,
international flows of cassava are hugely contingent on
industrial and feed demand for the product, particularly
from China, and on the competitiveness of Thai
exports. The importance of the two countries in shaping
international trade is noteworthy, with China typically
accounting for over 70 percent of world imports, and
Thailand for around 80 percent of world exports. With
policy change in China supporting the increased use
of domestic substitutes, principally maize, international
demand for cassava products has plummeted. Based on the
annual pace of shipments to date, Thai exports of chips,
virtually all of which are procured by China, are expected
to decline by 40 percent to 4.4 million tonnes, while Thai
deliveries of cassava starch could fall by around 17 percent
to 6.3 million tonnes. The sharp drop in Thai exports, which
could be well over 4 million tonnes (chip and pellet weight
equivalent), is mostly due to China directing its maize
surpluses towards ethanol distilleries and animal feeding,
thereby negating demand for the cassava-based products.
Thai exporters have expressed an unwillingness to reduce
their asking prices at the expense of stalling trade.
Exports of cassava products from Viet Nam – the other
important supplier in the region – are also expected to fare
negatively in 2016, with shipments that mostly comprise
chips destined for China foreseen down by 20 percent from
last year. Similarly, Cambodia could see cassava deliveries
down this year. Again, export quotations from these
sources remain stubbornly high despite faltering regional
demand.
As for buyers other than China, purchases are mostly
for cassava starch of Thai origin with very little international
demand for chips and pellets. Concerning starch trade
flows, smaller import volumes are anticipated by Indonesia
and Malaysia in 2016, while Japan is expected to purchase
a record volume of over 1 million tonnes of the product,
some 26 percent more than in 2015.
Prospects for an international cassava market
expanding beyond Asia remain largely elusive, with no
sign of re-emerging demand for substantial cassava
volumes in Europe, or of significant exports from the
major producing regions of Africa or Latin America and
the Caribbean.

39FOOD OUTLOOKOCTOBER 2016
CA
SSAV
A
OUTLOOK
Cassava at the cross roads?Growth prospects for world cassava sectors appear
delimited along the lines of geography that characterize the
role of cassava in the agricultural economy. For instance,
as cassava is principally a food crop in Africa, the sector is
providing a strong stimulus for rural development, poverty
alleviation, economic growth and, ultimately, food security.
There is also wider recognition of cassava as a choice crop
in the context of climate change adaptation strategies,
particularly in eastern and southern African countries
that have recently endured long periods of drought.
These considerations are providing cassava sectors in the
continent with a more assured long-term footing and are,
by and large, behind an annual average production growth
rate that has outpaced population growth for the past
decade.
By contrast, cassava sectors in Asia are strongly
susceptible to developments in China, the principal
destination for cassava products. In fact, almost all cassava
sectors in Southeast Asia have been geared to meet China’s
high import demand, expanding in tandem with regional
trade growth. However, with highly competitive industrial
and feed procurement, China has demonstrated in the
past few months its willingness to turn to other substitutes.
Helped by a policy shift, China’s industrial and feed sectors
began using maize released from the nation’s accumulated
stockpiles, instead of imported cassava. The move is
expected to result in a substantial cut in overall cassava
shipments to China in 2016, and will likely do so again in
2017 with the prospect of more maize being released from
its inventories. Given the thinness of international cassava
trade, even small releases from China’s maize stocks can
bring about serious ramifications to the international
market for cassava, as witnessed in June of this year.
The potential for cassava to compete in markets beyond
China is also uncertain, given that international maize
prices have fallen to multi-year lows. Consequently, cassava
product quotations are being considerably pressured,
and the likelihood of a further significant price correction
must gather momentum if cassava sectors are to remain
commercially viable and if they are to compete in the
international marketplace.
Already in Thailand, the world’s leading supplier,
where international export quotations are by and large
determined, the price gap between cassava roots and
cassava products has widened exceptionally, with prices
of the raw material falling to a seven-year low. With
China’s maize inventories overhanging the entire regional
market for cassava, the Government of Thailand recently
announced the release of some 350 000 tonnes of
processed cassava from official stocks, a move which ought
to lessen, in part, the strength of cassava product prices.
But with such low root prices prevailing at the onset of the
new season, cassava plantings are likely to be impacted,
which could result in a much reduced crop in 2017.

Ma
rke
t a
sse
ssm
en
ts
40 FOOD OUTLOOKOCTOBER 2016
Major Oilseed Exporters and Importers
Major ExportersMajor Importers
Figure 1. FAO monthly international price indices for oilseeds, vegetable oils and meals/cakes (2002-2004=100)
100
150
200
250
300
20162015201420132012201120102009
Meals/cakesVegetable oils
Oilseeds
OILCROPS, OILS AND MEALS 1
1 Almost the entire volume of oilcrops harvested worldwide is crushed to obtain oils and fats for human nutrition or industrial purposes, and to obtain cakes and meals that are used as feed ingredients. Therefore, rather than referring to oilseeds, the analysis of the market situation is mainly undertaken in terms of oils/fats and cakes/meals. Production data for oils and meals are derived from domestic production of the relevant oilseeds in a specific year, i.e. they do not reflect the outcome of actual oilseed crushing in a given country and period. Regarding oilseed trade, situations where oilseeds are produced in one country but crushed in another one are reflected in national oil/meal consumption figures. It is important to note that data on trade in oils (meals) refer to the sum of trade in oils (meals) plus the oil (meal) equivalent of oilseeds traded. Similarly, stock figures for oils (meals) refer to the sum of oil (meal) stocks plus the oil (meal) equivalent of oilseed inventories.
PRICES2
After gaining strength earlier this year, international prices for oilseeds, oils and meals have entered a phase of instability Overall, the 2015/16 (October/September) season saw a
tightening in market fundamentals of the oilcrops complex,
particularly in the oils/fats segment. Consequently,
international prices of both oilseeds and oilseed products
trended upward during 2015/16, as reflected by FAO’s
monthly price indices for oilseeds, oils and meals. Regarding
oilseeds and oils, the prolonged decline in the respective
price indices came to a halt towards the end of 2015, and
values started firming from February 2016 onward. In the
case of meals, the rebound in the FAO meal price index
began in April 2016.
2 For details on prices and corresponding indices, see Statistical appendix Table 23
For oilseeds and meals, the recovery in international
prices primarily reflects developments in the soybean
market, notably deteriorating crop prospects in South
America, combined with firm global import demand.
Interestingly, since July 2016, world prices for oilseed and
meals have lost some of their strength, as markets started
to be influenced by the production outlook for 2016/17,
with brighter than originally anticipated soybean crop
prospects in the United States.

41FOOD OUTLOOKOCTOBER 2016
OILC
RO
PS, O
ILS AN
D M
EA
LS
Figure 5. CBOT soybean futures for MarchFigure 2. FAO monthly price index for oilseeds (2002-2004=100)
Figure 3. FAO monthly price index for vegetable oils (2002-2004=100)
Figure 4. FAO monthly price index for oilmeals/cakes (2002-2004=100)
130
160
190
220
2014/15
2015/16
2013/14
SAJJMAMFJDNO
130
160
190
220
2015/16
2014/15
2013/14
SAJJMAMFJDNO
130
180
230
280
2014/15
2015/16
2013/14
SAJJMAMFJDNO
300
350
400
450
500
USD per tonne
M A M J J A S
2015 values 2016 values 2017 values
In the oils/fats market, price developments have been
dominated by palm oil, the world’s most consumed oil. The
concurrence of poor palm oil production in Southeast Asia
with robust global import demand for the oil drove a
rebound in international oils/fats quotations in early
2016. More recently, world oil/fats prices exhibited some
instability, mainly reflecting trade uncertainties regarding
the level of global palm oil export availabilities.
Preliminary forecasts for 2016/17 point to a broadly
balanced global supply and demand situation in both the
meal and the oils markets – which, if confirmed, would
provide limited scope for marked upward or downward
movements in prices. Relatively stable Chicago Board of
Trade futures prices for soybeans since the second half of
July 2016 tend to confirm this picture. However, prices
could be volatile over the coming months, influenced
by changes in the production forecasts for soybeans in
South America and palm oil in Southeast Asia, as well as
uncertainties regarding the development of global oil and
meal demand.
OILSEEDS
2016/17 production poised to set a new record After contracting by about 3 percent in 2015/16, global
oilseed production is forecast to climb to an all-time high
in 2016/17. The anticipated year-on-year rise of 4 percent
would be led by soybean, although sizeable increases
are also likely for sunflowerseed, groundnut, cottonseed,
palmkernel and copra. Rapeseed, would stand out as an
exception, as its output is forecast to drop for the second
consecutive year.
Global 2016/17 soybean production – currently pegged
at 330 million tonnes – is expected to fully recover from

Ma
rke
t a
sse
ssm
en
ts
42 FOOD OUTLOOKOCTOBER 2016
Note: The split years bring together northern hemisphere annual crops harvested in the latter part of the first year shown, with southern hemisphere annual crops harvested in the early part of the second year shown. For tree crops, which areproduced throughout the year, calendar year production for the second year shown is used.
2014/15 2015/16estim.
2016/17 f’cast
Change 2016/17
over 2015/16
million tonnes %
Soybeans 320.0 314.4 329.5 4.8
Rapeseed 71.4 69.9 67.4 -3.5
Cottonseed 45.4 38.2 40.3 5.4
Groundnuts (unshelled) 38.1 37.6 40.5 7.7
Sunflower seed 41.1 42.2 45.9 8.7
Palm kernels 15.4 14.7 15.8 7.5
Copra 5.8 5.4 5.8 8.2
Total 537.0 522.5 545.3 4.4
Table 1. World production of major oilcrops
last season’s drop, and possibly rise above the 2014/15
record. At the global level, the expansion would be driven
almost entirely by record-high yields, given only marginal
gains in area harvested. In the Northern Hemisphere, where
harvesting is now underway, output reductions in Canada
and Ukraine should be more than offset by large increases
in the United States, China and India. In the United States, the world’s leading soybean producer, latest
estimates point to a 7 percent (7.4 million tonnes) rise in
production, underpinned by favourable growing conditions
which boosted average yields to an unprecedented
3.4 tonnes per hectare. India’s output is anticipated to
expand by 34 percent above last year’s 4-year low, thanks
to beneficial rainfalls. In China, where gradual cuts in
sown area have caused production to trend downward
since 2011/12, increased support payments for soybeans
(introduced to promote soy production at the expense
of maize) resulted in a marked expansion in plantings
and output. On the other hand, Canada’s production
should drop on unfavourable weather conditions, while in
Ukraine production is expected to fall on lower plantings.
In South America, where sowing of the 2016/17 crop
has just started, production is projected to recover from
last season’s drop, on expectations of a return to normal
weather conditions and a modest increase in area planted.
Brazil is expected to drive the region’s recovery, largely
thanks to anticipated improvements in yields. With regard
to area sown, better return prospects for competing crops,
notably maize, and high production costs are expected to
curb Brazil’s annual growth in soy plantings to less than
2 percent – well below the 5-year average of 6–7 percent.
While a similar growth pattern is forecast for Paraguay
and Uruguay, output could tumble to a 3-year low in
Argentina, as soy plantings are expected to shrink in the
wake of export policy changes that favour crops other than
soybeans, but also because of pressing crop rotation needs.
World rapeseed production is forecast to contract by
a further 3–4 percent in 2016/17, reflecting poor harvest
prospects in all key producing countries, except India and
Australia. While crops in the EU suffered from adverse
weather, outputs in Canada, China and Ukraine were
affected by declines in area planted. By contrast, India is set to harvest a large crop, thanks to higher plantings and
adequate rainfall, while, in Australia, production could
receive a boost from improved yields.
World sunflowerseed production is set to grow for
the second year in succession, possibly reaching an
all-time high, underpinned by record plantings. While
larger sowings should drive growth in CIS countries and
Argentina, favourable growing conditions are expected to
bolster output in the EU. Also global groundnut production
could reach a record-high, following a strong rebound in
plantings and yield improvements. Plantings have been
stepped up in the world’s two leading producers, China
and India, and near-record yields are expected in the
United States and Argentina. As to cottonseed, global
output could partially recover from last season’s drop,
primarily reflecting better yields. Upturns are expected
in the United States, India, Pakistan and Australia,
whereas China’s production could continue to fall. Global
palmkernel and copra outputs are set to recover, with
improvements concentrated in Southeast Asia.
OILS AND FATS3
Global oils/fats production to resume growing in 2016/17The above positive crop projections translate into a
4–5 percent expansion in global oils/fats production in
2016/17 – in contrast to last season’s exceptional drop.
Global output is tentatively pegged at 217 million tonnes,
marking a historic record. Output growth would be led by
palm oil, followed by soybean, sunflowerseed, groundnut
and palmkernel oil, while production of rapeseed oil could
drop for the third consecutive year. Palm oil production,
which experienced unprecedented losses in 2016 due
to El Niño, is expected to rebound next year, as palms
in Malaysia and Indonesia begin to recover from the
protracted effects of poor rainfall in late 2015 and early
2016. Next year’s palm oil production is tentatively pegged
3 This section refers to oils from all origins, which – in addition to products derived from the oil crops discussed under the section on oilseeds – include palm oil, marine oils as well as animal fats.

43FOOD OUTLOOKOCTOBER 2016
OILC
RO
PS, O
ILS AN
D M
EA
LS
Note: Refer to footnote 1 on page 40 for overall definitions and methodology.1 Includes oils and fats of vegetable, animal and marine origin.2 Production plus opening stocks.3 Residual of the balance.4 Trade data refer to exports based on a common October/September
marketing season.5 Major exporters include Argentina, Brazil, Canada, Indonesia, Malaysia,
Ukraine and the United States.6 All meal figures are expressed in protein equivalent; meals include all meals
and cakes derived from oilcrops as well as meals of marine and animal origin.7 Major exporters include Argentina, Brazil, Canada, India, Indonesia, Malaysia,
Paraguay, the Russian Federation, Ukraine, Uruguay and the United States.
Table 2. World oilcrops and product market ata glance
2014/15 2015/16 estim.
2016/17 f’cast
Change: 2016/17
over 2015/16
million tonnes %
TOTAL OILCROPS
Production 549 534.1 556.9 4.3
OILS AND FATS 1
Production 210.8 207.3 216.5 4.4
Supply 2 247.3 246.3 250.5 1.7
Utilization 3 206.2 211.2 217.3 2.9
Trade 4 114.3 115.8 119.4 3.1
Global stock-to-use ratio (%) 18.6 16.3 15.6
Major exporters stock-to-disappearance ratio (%) 5
10.7 9.7 10.0
MEALS AND CAKES 6
Production 141.1 137.9 143.9 4.4
Supply 2 162.6 164.1 168.1 2.4
Utilization 3 133.4 139.1 144.0 3.5
Trade 4 86.7 90.5 93.5 3.3
Global stock-to-use ratio (%) 18.7 16.0 15.5
Major exporters stock-to-disappearance ratio (%) 7
10.6 9.1 9.5
FAO PRICE INDICES (Oct/Sept) (2002-2004=100)
2013/14 2014/15 2015/16 Change: 2015/16
over2014/15
%
Oilseeds 194 155 151 -2.5
Oilmeals/cakes 253 194 168 -13.4
Vegetable oils 189 153 155 1.7
at 35.1 million tonnes in Indonesia and 20.5 million tonnes
in Malaysia. Further expansion of the mature oil palm area
should contribute to the portended growth, especially in
Indonesia.
Global 2016/17 oils/fats supplies, which comprise
2016/17 production and 2015/16 carry-over stocks, are
currently forecast at 251 million tonnes, which entails
a modest year-on-year improvement. Last season’s
conspicuous drop in global inventories would weigh on
supply growth in 2016/17. Domestic availabilities could
resume growing in several important producing countries,
notably Australia, Brazil, India, Indonesia, Malaysia, the
Russian Federation, Ukraine and the United States. On
the other hand, domestic supply contractions are expected
in Argentina, Canada, China and the EU, mostly
reflecting both low crop outturns and reduced carry-in
stocks.
Global oils/fats utilization set to expand further World consumption of oils/fats in 2016/17 is tentatively
pegged at 217 million tonnes, implying a more dynamic
growth of 3 percent compared to last year’s.
With regard to individual oils, soy and palm oils should
experience a brisk consumption growth, supported by
adequate supplies and price discounts relative to other
vegetable oils. A sizeable expansion is also forecast for
sunflowerseed oil, given the prospective pronounced gain
in production. Conversely, the consumption of rapeseed
oil could undergo a marked drop.
While population and economic growth remain the
key drivers behind the rising uptake of oils/fats for food
and traditional industrial uses, protracted slow economic
growth in several countries, together with firmer
international oils/fats prices, could temper the expansion
of oils/fats consumption in 2016/17. Furthermore,
growing demand by the biodiesel industry continues
to play a limited role. During 2016/17, a pronounced
acceleration in global oils/fats uptake by the biodiesel
industry seems unlikely. While mandatory blending rates
may be raised in a number of countries, uncertainties
remain regarding the extent to which national targets
for biodiesel are being met. Moreover, persistently weak
world prices for crude mineral oil continue to discourage
discretionary blending of diesel with biodiesel.
Developing nations in Asia are expected to continue
driving growth in global oils/fats uptake. Steady
expansion is forecast for India and several other Asian
countries. By contrast, in China, growth could falter
on a possible slowdown in national economic growth.
Also in Malaysia and Indonesia, consumption may
grow less than last year, considering that demand
from the biodiesel industry could expand at a slower
pace. Elsewhere, bumper supplies should support
higher consumption in the United States, Brazil and
Argentina, where oil uptake could be fuelled in part
by fresh demand from the biodiesel sector. In other
developed countries, utilization growth rates are expected
to linger around 1 percent, except in the EU, where the
anticipated contraction in rapeseed oil availabilities could
notch down consumption.

Ma
rke
t a
sse
ssm
en
ts
44 FOOD OUTLOOKOCTOBER 2016
Figure 7. World stocks and ratios of oils/fats (including the oil contained in seeds stored)
0
10
20
30
40
2016/172015/162014/152013/142012/138
11
14
17
20
Million tonnes Percent
Major Exporters Rest of the World
World Stock-to-use ratioStock-to-disappearance ratio of Major Exporters
estim. f’cast
Figure 6. Global production and utilizationof oils/fats
-6
-3
0
3
6
180
190
200
210
220
2016/172015/162014/152013/142012/13
Million tonnes Million tonnes
estim. f’cast
Balance (production minus utilization, right axis)
Production (left axis) Utilization (left axis)
Figure 8. Oil/fat imports by region or major country (including the oil contained in seed imports)
0
10
20
30
40
50
2016/172014/152012/132010/112008/09
Latin America
Asia excl. China (total) Europe
China (total)
Million tonnes
United States & Canada Africa
f’cast
Global oils/fats inventories unlikely to recover in 2016/17 A shortfall of global oils/fats production relative to
consumption could be witnessed again in 2016/17.
However, the gap between demand and production
is currently estimated at less than 1 million tonnes –
compared with last season’s 4 million tonne difference.
Consequently, an additional, modest contraction in global
inventories cannot be excluded. Currently, global oils/
fats stocks (including the oil contained in stored oilseeds)
are forecast to contract by about 0.6 million tonnes or
1.6 percent in 2016/17. Commodity-wise, soybean and
rapeseed oil reserves may record conspicuous drops,
which would be partly offset by stock replenishments in
palm, sunflowerseed and groundnut oil. At country level,
significant stock drawdowns are anticipated in China
and Argentina. In China, the drawdown would concern
government stockpiles of rapeseed oil. On the other hand,
Indonesia and Malaysia are expected to replenish their
palm oil stocks, while, in the United States, a further
accumulation in soybeans/soybean oil reserves is expected.
While the above forecasts would lead to a further,
moderate drop in the global stock-to-use ratio for oils/fats
in 2016/17, the stock-to-disappearance ratio for the major
exporting countries4 could actually inch up.
Growth in oils/fats trade to accelerate in 2016/17Global trade in oils/fats – including the oil contained in traded
oilseeds – is forecast to reach 119 million tonnes in 2016/17,
expanding at least twice as fast as last season, when a
contraction in palm oil transactions weighed on global trade.
Sustained by production gains in major exporting
countries and a trimming in prices, trade in palm oil, the
world’s most widely shipped oil, is expected to recover
fully, driving global trade growth in 2016/17. More
competitive prices should allow palm oil to gain back the
market share it lost to other oils (notably soybean oil) last
season. As to other oils/fats, only sunflower oil trade should
post a sizeable increase, facilitated by record supplies.
Transactions in soybean oil, the world’s second most traded
oil, are projected to remain flat, while rapeseed oil trade
may contract.
4 Argentina, Brazil, Canada, Indonesia, Malaysia, Ukraine and the United States. Disappearance is defined as domestic utilization plus exports.

45FOOD OUTLOOKOCTOBER 2016
Figure 9. Oil/fat exports by major exporters (including the oil contained in seed exports)
0
10
20
30
2015/16 estimate
2016/17 forecast
Million tonnes
USAIndonesiaCanada MalaysiaArgentina Brazil
OILC
RO
PS, O
ILS AN
D M
EA
LS
On the import side, India’s purchases are projected
to grow at a below average rate, provided the country’s
bumper crops are confirmed. In China, import growth
could be limited to 2–3 percent, due to subdued
consumption, and also because the country can rely on
large inventories to satisfy domestic demand. Sustained
import growth is expected in other countries in Asia as
well as in Africa. Net purchases by the EU and other
developed countries are forecast to increase marginally,
reflecting stagnation or only minimal growth in domestic
consumption.
Global export growth would rest strongly on a marked
rebound of palm oil shipments from Malaysia and
Indonesia, although sizeable increases in oils/fats sales are
also expected for Ukraine, the Russian Federation, Brazil and Australia – all facilitated by marked year-on-year gains
in domestic output. By contrast, in Canada, the prospective
fall in domestic output is likely to prompt a contraction in
exports. A cut in net exports may also occur in Argentina,
where foreign sales could be trimmed to satisfy additional
domestic demand from biodiesel producers. Shipments
from the United States, which surged to unprecedented
levels in the last two seasons, are anticipated to remain flat
in 2016/17.
MEALS AND CAKES5
Global meal production set to recover in 2016/17Based on current crop forecast, in 2016/17, global meal
production could more than recover from last season’s
setback. Growing by over 4 percent, output is pegged at
an unprecedented 144 million tonnes (expressed in protein
equivalent). The recovery primarily concerns soybean meal,
which, along with higher sunflower, cotton, groundnut
palmkernel and fish meal production, would outweigh a
drop in rape meal output.
Global oilmeal supplies, which also include 2015/16
carry-out stocks, are projected to expand by 2–3 percent,
i.e. less than global production, because of a marked
contraction in inventories last season. In the United States,
fuelled by bumper crops and large carry-in stocks, domestic
availabilities could expand further. Conspicuous supply
increases are also forecast for Brazil and India. By contrast,
sizeable contractions could occur in Argentina, Canada,
China and the EU, owing to both modest crop outturns
and reduced opening stocks. In China, the world’s top
consumer, domestic supplies could drop to a four-year low.
Aggregate availability of the United States, Argentina and
Brazil – the world’s three dominant meal suppliers – could
swell to 105 million tonnes (in protein equivalent).
Meal consumption to rise further in 2016/17, albeit at a reduced pace Pegged at a record 144 million tonnes (expressed in protein
equivalent), global meal/cake consumption would continue
to expand in 2016/17, albeit at a below average rate.
Growing uptake by the livestock sector arising from further
economic growth in several countries should continue to
support meal consumption However, similar to last season,
the availability of bumper feed grain supplies worldwide
is expected to weigh on meal utilization growth. As in
previous years, much of this growth would be on account
of soybean meal, although consumption of sunflowerseed
meal could also rise conspicuously. By contrast, rapeseed
meal uptake could drop to a 3-year low.
Developing countries in Asia should remain the main
engine of overall consumption growth. However, in
China, the world’s largest meal consumer, the economic
slowdown could trim the expansion in poultry and pig-meat
production and, with it, demand for meals. In addition,
ample supplies of attractively priced feed grains will weigh
on domestic meal demand. In other Asian countries,
consumption is anticipated to rise at about average rates,
including in India, Indonesia, Pakistan, the Philippines,
Turkey and Vietnam. Elsewhere, the current forecasts
5 This section refers to meals from all origins. In addition to products derived from the oil crops discussed under the section on oilseeds, this also includes fish meal and meals of animal origin.

Ma
rke
t a
sse
ssm
en
ts
46 FOOD OUTLOOKOCTOBER 2016
Figure 11. World stocks and ratios of meals/cakes (in protein equivalent and including the meal contained in seeds stored)
0
10
20
30
2016/172015/162014/152013/142012/135
10
15
20
Million tonnes Percent
Major Exporters Rest of the World
World Stock-to-use ratioStock-to-disappearance ratio of Major Exporters
estim. f’cast
point to a further expansion in demand in Argentina,
while only moderate increases are expected in the
United States and Brazil. In the EU, the world’s second
largest consumer, meal uptake could stall at last season’s
level, due to both reduced meal supplies and burgeoning
feed grain availabilities.
Global meal inventories to remain unchangedBased on current forecasts, in 2016/17, global meal output
would basically match consumption – as opposed to last
season, when production fell short of demand, triggering a
drawdown in world inventories. Consequently, in 2016/17,
global oilmeal stocks (including the meal contained in
stored seeds) are expected to remain virtually unchanged,
including stable reserves of soymeal, the world’s dominant
oilmeal. Regarding the other meals, replenishments in
sunflower, groundnut and cottonseed meal should offset a
drop in rape meal inventories.
In China, Argentina and the EU, sizeable stock
reductions are expected to make up for poor domestic
supplies as well as, in the case of Argentina, to support
higher exports. The largest drawdowns concern China,
consistent with government efforts to curb state stockpiles,
and Argentina, where reserves have reached burdensome
levels. The above reductions should be offset by additional
replenishments in the United States, where, boosted
by bumper crops, carry-out stocks are projected to climb
to a 10-year high. Healthy domestic supplies should
also facilitate stock replenishments in India, Brazil and
Australia.
Based on the above forecasts, the global stock-to-use
ratio for meals/cakes would drop somewhat compared with
last season’s level, whereas the stock-to-disappearance
ratio for the major exporting countries6 would show a slight
improvement.
Expansion in global meal trade may slow down furtherInternational meal trade (including the meal contained
in traded oilseeds) is forecast to grow only moderately in
2016/17. Thanks to ample supplies and competitive prices,
soybean meal should continue to drive expansion, aided by
sunflower meal. Moderate rises are also expected for the
other meals, except rapeseed meal, which could tumble to
a 4-year low in transactions.
With regard to imports, Asian countries would continue
to dominate demand. However, in China, the world’s top
importer, purchases are forecast to rise by only 2 percent –
the lowest rate in four years. The slowdown would stem
from the anticipated rebound in domestic soy production,
continued sales from state stockpiles, and faltering growth
in local meal demand. In other countries in Asia, robust
growth in import demand is expected to continue. As to
developed countries, in the EU, the world’s second largest
buyer, the anticipated tightening in domestic supplies of
rapeseed meal could propel overseas purchases upwards.
Export growth is expected to concentrate in South
America (provided the current soybean production forecasts
materialize), as well as the United States and India. South
America’s export expansion would be led by Brazil, the
6 Argentina, Brazil, Canada, India, Indonesia, Malaysia, Paraguay, Russian Federation, Ukraine, Uruguay and the United States. Disappearance is defined as domestic utilization plus exports.
Figure 10. Global production and utilization of meals/cakes (in protein equivalent)
-5
0
5
10
115
125
135
145
2016/172015/162014/152013/142012/13
Million tonnes Million tonnes
estim. f’cast
Balance (production minus utilization, right axis)
Production (left axis) Utilization (left axis)

47FOOD OUTLOOKOCTOBER 2016
Figure 12. Meal/cake imports by region or major country (in protein equivalent and including the meal contained in seed imports)
0
8
16
24
32
2016/172014/152012/132010/112008/09
Latin America Asia excl. China (total) Europe
China (total)
Million tonnes
United States & Canada Africa
f’cast
OILC
RO
PS, O
ILS AN
D M
EA
LS
Figure 13. Meal/cake exports by major exporters (in protein equivalent and including the meal contained in seed exports)
0
10
20
30
2015/16 estimate
2016/17 forecast
Million tonnes
USACanada India ParaguayArgentina Brazil
world’s top exporter, along with smaller increases in
Argentina and Paraguay. Brazil’s sales could rise by
1.7 million tonnes (in product weight and including the
meal contained in soybean shipments), which would be
well below last year’s increase. Although domestic supplies
would support larger sales, the recent strengthening of
the Real vis-à-vis the US dollar has made Brazil’s exports
less competitive. In Argentina, the rise in deliveries would
have to rely on the release of old-crop inventories, given
the prospective stagnation of domestic production. Sales by
the United States, the world’s second largest supplier, are
projected to expand by a further 1.7 million tonnes, facilitated
by bumper crops. In India, which saw its exports tumble over
the last three years, better crops should support a rebound in
shipments, allowing the country to regain, at least in part, its
position as a supplier to the Asian meal market.
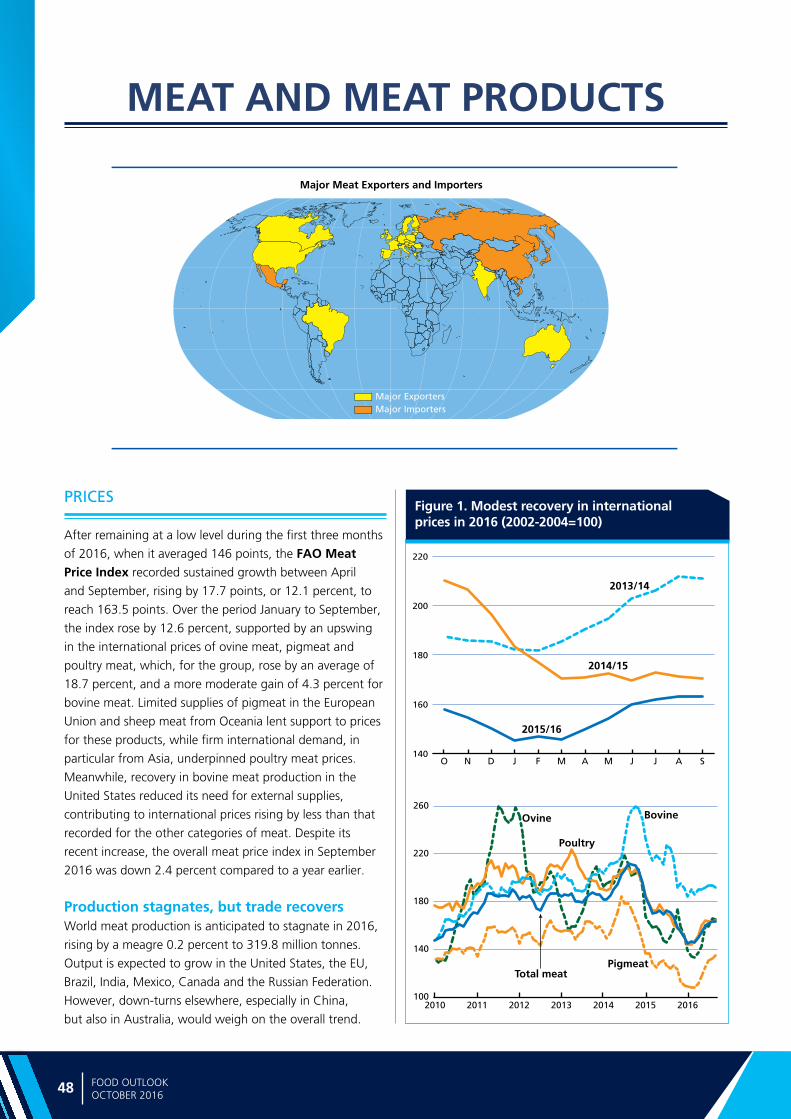
Ma
rke
t a
sse
ssm
en
ts
48 FOOD OUTLOOKOCTOBER 2016
Figure 1. Modest recovery in international prices in 2016 (2002-2004=100)
Major Meat Exporters and Importers
Major ExportersMajor Importers
MEAT AND MEAT PRODUCTS
100
140
180
220
260
2016201520142013201220112010
Bovine
Poultry
Ovine
Total meatPigmeat
140
160
180
200
220
SAJJMAMFJDNO
2014/15
2015/16
2013/14
PRICES
After remaining at a low level during the first three months
of 2016, when it averaged 146 points, the FAO Meat Price Index recorded sustained growth between April
and September, rising by 17.7 points, or 12.1 percent, to
reach 163.5 points. Over the period January to September,
the index rose by 12.6 percent, supported by an upswing
in the international prices of ovine meat, pigmeat and
poultry meat, which, for the group, rose by an average of
18.7 percent, and a more moderate gain of 4.3 percent for
bovine meat. Limited supplies of pigmeat in the European
Union and sheep meat from Oceania lent support to prices
for these products, while firm international demand, in
particular from Asia, underpinned poultry meat prices.
Meanwhile, recovery in bovine meat production in the
United States reduced its need for external supplies,
contributing to international prices rising by less than that
recorded for the other categories of meat. Despite its
recent increase, the overall meat price index in September
2016 was down 2.4 percent compared to a year earlier.
Production stagnates, but trade recoversWorld meat production is anticipated to stagnate in 2016,
rising by a meagre 0.2 percent to 319.8 million tonnes.
Output is expected to grow in the United States, the EU,
Brazil, India, Mexico, Canada and the Russian Federation.
However, down-turns elsewhere, especially in China,
but also in Australia, would weigh on the overall trend.

49FOOD OUTLOOKOCTOBER 2016
ME
AT
AN
D M
EA
T P
RO
DU
CT
S
Table 1. World meat market at a glance
2014 2015estim.
2016f’cast
Change: 2016 over 2015
million tonnes %
WORLD BALANCE
Production 315.4 319.2 319.8 0.2
Bovine meat 68.0 67.6 67.8 0.3
Poultry meat 111.0 114.8 115.8 0.9
Pigmeat 116.9 117.2 116.5 -0.6
Ovine meat 13.9 14.0 14.1 0.6
Trade 30.7 29.8 31.1 4.4
Bovine meat 9.6 9.1 9.1 0.3
Poultry meat 12.7 12.2 12.7 4.4
Pigmeat 7.1 7.2 8.0 10.8
Ovine meat 1.0 1.0 0.9 -2.8
SUPPLY AND DEMAND INDICATORS
Per caput food consumption:
World (kg/year) 43.2 43.2 42.8 -1.0
Trade - share of prod. (%) 9.7 9.3 9.7 4.2
FAO MEAT PRICE INDEX(2002-2004=100)
2014 2015 2016 Jan-Sept
Change: Jan-Sep 2016
over Jan-Sep 2015
%
198 168 154 -10.6
Excluding these two countries, aggregate meat production
of the rest of the world would rise by 1.4 percent.
Among the various sectors, production is forecast to grow
marginally in the case of poultry, ovine and bovine meat,
while it could fall slightly for pigmeat.
After a dip in 2015, global meat trade is forecast to
recover by 4.4 percent in 2016, to 31.1 million tonnes.
Based on current expectations, trade in pigmeat is set to
increase by 10.8 percent, poultry meat by 4.4 percent
and bovine meat by 0.3 percent, while ovine meat may
decrease by 2.8 percent from last year.
Increased meat imports are expected particularly in
China, but also in Japan, South Africa, Chile, the Republic
of Korea, Mexico, the EU, Iraq, the Philippines, Viet Nam,
the United Arab Emirates and the Russian Federation by
contrast, growth in domestic production may result in
reduced purchases by the United States and Canada, with
Angola also anticipated to buy less. The expansion in world
exports is projected to be led by Brazil and the EU, followed
by the United States and Canada, with sales also rising for
Belarus, Thailand, the Russian Federation, Paraguay, Mexico
and Ukraine. Meanwhile, exports by Australia, China,
Turkey, South Africa, New Zealand, Argentina and India are
likely to be curtailed.
BOVINE MEAT
Production: little growth Bovine meat production in 2016 is forecast to grow by
0.3 percent, to 67.8 million tonnes. Substantial output
increases are anticipated in the United States and
the European Union, while a sizable drop is foreseen
for Australia, with declines also expected for Brazil, Argentina, the Russian Federation and New Zealand.
In Latin America and the Caribbean, mixed weather,
stemming from El Niño, brought exceptionally dry
conditions to some parts of the region, while others
experienced excessive rainfall and flooding. Brazil experienced widespread dry conditions during the first part
of the year, which adversely affected pasture conditions
and caused a substantial rise in feed costs. Yet, favourable
international demand encouraged producers to expand
herds, even though domestic demand remained subdued.
As a consequence, Brazil’s bovine meat production may
fall by 1.5 percent to 9.3 million tonnes. In neighbouring
Paraguay, productivity increases are expected to boost
growth, spurred by international demand. In Argentina,
a 2.2 percent drop in output to 2.7 million tonnes is
predicted, as more calves and cows are retained to facilitate
herd expansion. The lifting of the export restrictions is
anticipated to result in the longer retention of cattle to
attain heavier slaughter weights preferred by international
markets, rather than the lighter animals favoured by
domestic consumers. Meanwhile, in Chile, Colombia and
Ecuador, chronic dry-to-drought conditions experienced at
the start of the year are anticipated to cause output to fall.
In Mexico, production is expected to be slightly up on last
year, as heavier carcass weights should more than offset a
decline in cattle slaughtered.
In Asia, subdued international demand for buffalo
meat is forecast to slow growth in bovine meat production
in India, which exports approximately 70 percent of its
output. In China, stable prices are attracting investment
in bovine meat production and a limited increase in
output could occur. Elsewhere, output is forecast to
drop in the Republic of Korea, where improved prices
have encouraged herd rebuilding, while some small-scale
producers have left the industry. Output could also fall
in Japan, due to continued herd reduction and farmers
retiring. In Africa, some parts of the continent, including
Burundi, Kenya, Rwanda, Tanzania and Uganda, received abundant rain which led to pasture recovery and
replenishment of water resources, auguring well for bovine
meat production in 2016. Meanwhile, in southern Africa,
many areas experienced dry-to-drought conditions in 2015,
which persisted into 2016, negatively affecting pastures

Ma
rke
t a
sse
ssm
en
ts
50 FOOD OUTLOOKOCTOBER 2016
Figure 2. Bovine meat exports: Brazil major markets
0
100
200
300Jan-Aug 2013Jan-Aug 2014
Jan-Aug 2015
Jan-Aug 2016
Thousand tonnes, cwe
China RussianFed.
Egypt IranEU
and feed availability. As a consequence, the sector’s growth
may be constrained in this subregion.
In North America, bovine meat production in the
United States is forecast to rise by almost 5 percent, as a
result of larger numbers of cattle slaughtered and heavier
slaughter weights. Output, foreseen at 11.3 million tonnes,
would be the highest in three years. The long-term herd
decline in Canada, evident since 1992, may have come to
an end, with expansion in cattle numbers forecast in 2016.
Despite lower slaughter numbers, increased carcass weights
could maintain the country’s bovine meat production at
some 1.1 million tonnes.
In Australia, following three years of dry weather,
improved rainfall in many parts of the country have
improved pasture conditions and encouraged stock
retention. However, a further fall in the size of the national
herd is expected, due to the high level of cow slaughter
in the preceding two years, thus constraining recovery.
Concomitant on herd rebuilding, bovine meat production
in Australia could fall to 2.0 million tonnes, a 15 percent
decline from 2015. Likewise, output in New Zealand
may slide by 5.8 percent to 650 000 tonnes, as high
international bovine meat prices and sharply lower milk
pay-outs prompted farmers to reduce both beef and dairy
herds in 2015, resulting in a smaller calf crop.
In the Russian Federation, 2016 bovine meat output
may drop by 3.3 percent to 1.55 million tonnes, as a
result of herd reduction stemming from poor profitability
discouraging investment. In the European Union,
production could rise by 2.2 percent, owing to an increase
in dairy cow culling in many member countries in response
to low milk prices.
Trade: steadySubsequent to a decline of 5 percent in 2015, world trade
in bovine meat in 2016 is anticipated to remain at around
9.1 million tonnes. For exports, growth in the Americas,
notably Brazil, Paraguay, Canada, the United States and
Mexico, and in Europe, namely Belarus and the European Union, is projected to be counterbalanced by significantly
reduced sales by Australia and diminished shipments by
South Africa, India and New Zealand. Brazil is forecast
to regain its position as the world’s principal bovine meat
exporter, superseding India, which held the spot in 2014
and 2015. Brazil’s deliveries could increase by 12.5 percent
to 1.8 million tonnes, assisted by depressed domestic
consumption. Shipments by Brazil surged during the first
eight months of 2016, partly due to China lifting of a two-
and-a-half year embargo, imposed after a case of atypical
bovine spongiform encephalopathy (BSE) in Brazil. On the
other hand, deliveries by Australia are forecast to drop
by over 15 percent, due to a reduction in cattle numbers
and the commencement of herd rebuilding. After falling
by 13 percent in 2015, India’s bovine meat exports are
expected to remain around 1.7 million tonnes in 2016 –
between January and May, exports to Vietnam and Egypt grew substantially, while augmented competition from
suppliers in South America caused sales to Thailand, in
particular, but also other to countries in Southeast Asia and
in the Middle East to fall.
Among bovine meat importers, a number of countries
in Asia are forecast to step up their purchases in 2016,
especially China, the Republic of Korea and Vietnam,
but also Chile, the Islamic Republic of Iran, the
European Union and Egypt. The increases are anticipated
to be almost matched by a steep fall in deliveries to the
United States, plus more contained declines in sales to
the Russian Federation, Angola, Japan and Canada.
After tepid growth in 2015, China’s imports are forecast
to soar by over 15 percent to 1.4 million tonnes, with most
of the supplies originating from South America, especially
Brazil, but also Uruguay. Brazil is also forecast to be
the main beneficiary of expanded imports by the Islamic
Republic of Iran and Chile, while the Republic of Korea and Vietnam, respectively, are predicted to source their
augmented purchases mainly from the United States
and India. Imports by the United States are forecast to
drop significantly, by 13 percent to 1.2 million tonnes, as
domestic bovine meat production is set to recover. Bovine
meat purchases by the Russian Federation are anticipated
to drop by 7.8 percent to 470 000 tonnes.

51FOOD OUTLOOKOCTOBER 2016
ME
AT
AN
D M
EA
T P
RO
DU
CT
S
Figure 3. Feed/price relationship relatively favourable for pigmeat and poultry producers
0.4
0.6
0.8
1.0
1.2
130
180
230
280
330
2016201520142013201220112010
2002-2004=100 Ratio
Feed price index (left axis)
Pigmeat/feed index (right axis)
Poultry/feed index (right axis)
Figure 4. Pigmeat: Major importers
PIGMEAT
Production: stagnatesWorld production of pigmeat is forecast to decrease
marginally in 2016, by 0.6 percent to 116.5 million
tonnes, thus registering a second year of stagnation. As
in 2015, contraction in output in China, which accounts
for almost half of the world’s total, is the main reason for
the slowdown, as low profitability and new environmental
regulations caused farmers to reduce breeding sows for
a second year in succession. China’s 2016 production
is posited at 54 million tonnes, down 2.5 percent from
2015. Elsewhere in Asia, modest production growth
is forecast for Viet Nam and the Republic of Korea,
but also for Japan and the Philippines where the
industry is recovering from outbreaks of porcine endemic
diarrhoea (PED), which reduced piglet numbers in the
previous two years. Recovery from the effects of PED
has been faster in the United States, where a second
year of growth is anticipated, with production potentially
increasing by 1.9 percent to a record 11.3 million tonnes.
Output in Mexico also continues to recover, following
a PED outbreak in 2014, and may rise in 2016 by
almost 5 percent to 1.4 million tonnes. Elsewhere in
the Americas, international demand is forecast to result
in boosted production in Brazil and Canada. In the
Russian Federation, the pace of progression in pigmeat
production could slacken, as a result of low domestic prices
and competition from imports. Meanwhile, output in the
European Union is likely to be essentially unchanged, at
23.4 million tonnes, consequent to a decline in breeding
sow numbers, brought about by low prices in 2015 and the
first half of 2016.
Trade: surgesTrade in pigmeat is set to record exceptional growth in 2016,
increasing by as much as 10 percent to reach a historical high
of 8 million tonnes. A surge of imports by China is projected
to be the main engine of growth. The country, which is set
to confirm its status as the main market for pigmeat for the
second year, could see its purchases increase by more than
30 percent, attendant on reduced domestic production.
Notably larger imports are also anticipated for the Russian Federation and Japan, in addition to Viet Nam, Mexico,
Chile and the United States.
The buoyant world import demand is expected to result in
increased exports mainly for the European Union, followed
by Brazil and Canada, while sales by the United States could remain similar to last year. The European Union may see an upswing in sales of over 20 percent, surpassing
the vibrant growth experienced in 2015. European Union
exporters have adjusted to the 2014 Russian Federation
embargo by seeking alternative markets, particularly in Asia
and especially in China. Half-year shipments by the European
Union to China rose by almost 160 percent, with substantial
expansion also seen in sales to Japan, the United States
and the Philippines. Brazil is anticipated to see its exports
increase by around 25 percent, based on greater trade
with Asia, especially China (Hong Kong, SAR), but also with
neighbouring Chile, Argentina and Uruguay. Similarly, half-
year data for Canada show a swell in sales to China, which
rose by over 150 percent, leading to exports to practically all
other destinations falling during the period. An analogous
situation occurred in the United States, where half-year
exports to China more than doubled, causing sales to a
number of its major markets to drop.
0
500
1000
1500
2000
201620152014201320122011
China MexicoRussian Fed.
JapanUSA Korea Rep.
f’cast
Thousand tonnes, cwe

Ma
rke
t a
sse
ssm
en
ts
52 FOOD OUTLOOKOCTOBER 2016
600
900
1200
1500
201620152014201320122011
Thailand
EU
f’cast
Thousand tonnes, cwe
3000
3500
4000
4500
5000
201620152014201320122011
United States
Brazil
f’cast
Thousand tonnes, cwe
Figure 5. Poultry meat exports: Brazil confirms its lead
POULTRY MEAT
Production: modest expansionModest growth is foreseen for poultry meat production in
2016, with global output forecast to rise by 0.9 percent to
115.8 million tonnes. Substantial expansion is anticipated
in the United States and Brazil, as well as increased
production in the European Union, India, Mexico and Argentina – along with most other countries.
Rising consumer demand and favourable feed costs
have provided the basis for increased production. At the
same time, output in China may experience a reduction
of around 5 percent, because of lacklustre consumer
demand, and may also fall in South Africa, where the
domestic poultry industry has faced increased competition
from imports. Production of poultry meat in the Russian Federation and Turkey is foreseen to be little changed,
as subdued domestic demand, reduced profitability and
limited export possibilities combine to restrain industry
expansion.
Trade: recoveryTrade in poultry meat in 2016 is forecast to grow by
4.4 percent to 12.7 million tonnes. Buoyant international
demand contributed to higher prices for poultry meat,
registering an overall increase of 14.2 percent for the
year to September, although it remains the lowest priced
category of meat in the FAO Price Index. Affordability and
rising domestic consumption have been important factors
in stimulating imports in a number of markets, including
South Africa, Japan and Iraq. The same factors should
stimulate increased imports in by the European Union,
the Philippines, the United Arab Emirates, China, Mexico, Chile and Saudi Arabia. In Viet Nam, growth
in the domestic poultry industry and falling domestic prices
may curb the country’s imports. Likewise, purchases by
the Russian Federation are expected to be constrained
by the expansion of domestic production, but also by
the continuation of the country-specific trade embargo.
Reduced imports are also projected for Angola, Benin, Canada and Cuba.
Brazil is forecast to be the major beneficiary of
increased international demand for poultry meat, with
its trade forecast to expand by 6.5 percent to a record
4.6 million tonnes. Half-year shipments from Brazil showed
a substantial rise in sales to China, which jumped by
over 40 percent year-on-year, as well as to Egypt, Iraq,
Japan and the United Arab Emirates, among others.
United States’s exports are also set to recover somewhat,
rising by 3 percent to 3.6 million tonnes, notwithstanding
the continuation of the Russian Federation’s embargo and,
more importantly, trade restrictions related to the highly
pathogenic avian influenza virus (HPAI), widely applied in
2015 and prolonged by several countries into 2016 (as
of September). Export growth is also projected for the
European Union, Thailand and Ukraine. Elsewhere,
shipments by Turkey, Argentina and China may decline.
OVINE MEAT
Production: continued modest growth Production of ovine meat has grown little in the last few
years, a trend likely to continue in 2016, with output
forecast to increase by 0.6 percent to 14.1 million tonnes.
Developing countries account for over 80 percent of
the total, with the largest producers in this grouping
being China, India, Nigeria and Pakistan. Generally
satisfactory pasture conditions have set the basis for
some output expansion in many of the major producing
areas. In the European Union, herd expansion could
boost sheep meat production by 2.1 percent in 2016.
Meanwhile, in Oceania, dry weather and drought-imposed

53FOOD OUTLOOKOCTOBER 2016
ME
AT
AN
D M
EA
T P
RO
DU
CT
S
herd reduction, and subsequent rebuilding, are projected
to constrain output in Australia and New Zealand. World trade in ovine meat is forecast to contract
by 2.8 percent in 2016, to 937 000 tonnes, principally
reflecting reduced shipments by New Zealand and
Australia. New Zealand is projected to record a 5 percent
fall in exports, while Australia could experience a
1.8 percent drop. Limited world export availabilities are
forecast to result in a second year of reduced import flows
into China, the main market for ovine meat, although
some other destinations may register some increase,
including the United Arab Emirates, the United States, Malaysia and the European Union.

Ma
rke
t a
sse
ssm
en
ts
54 FOOD OUTLOOKOCTOBER 2016
Figure 1. International prices surge mid-year
Major Dairy Exporters and Importers
Major ExportersMajor Importers
MILK AND MILK PRODUCTS
100
150
200
250
300
SAJJMAMFJDNO
2014/15
2015/16
2013/14
80
180
280
380
201620152014201320122011
Butter
Cheese
WMPSMP
Dairy price index
PRICES
International prices rise on anticipated tight supply After falling almost continually since the beginning of
2014, international dairy prices surged mid-year, as the
initiation of a declining trend in EU milk output and an
unexceptional opening to the dairy year in Oceania pointed
to tighter export supply prospects than had
been anticipated.
The FAO Dairy Price Index averaged 176 points in
September, up 21.4 points (13.8 percent) from August.
International prices rose for all the dairy commodities that
compose the Index, particularly for cheese, whole milk
powder (WMP) and butter. Skimmed milk powder (SMP)
quotations were muted, as large EU intervention stocks
were seen as a potential future source of supply. Compared
with September 2015, the Index averaged 33.7 points
higher (23.7 percent), all constituent commodities rose,
viz: WMP by 31.8 percent to 2 831, SMP by 22.3 percent
to 2 248, butter by 36.2 percent to 3 926 and cheese by
16.8 percent to 3 504 per tonne.
PRODUCTION
Most growth to come from AsiaWorld milk production is forecast to grow by 1.1 percent in
2016 to 817 million tonnes. Output is set to expand in Asia
and North and Central America, but stagnate in Europe
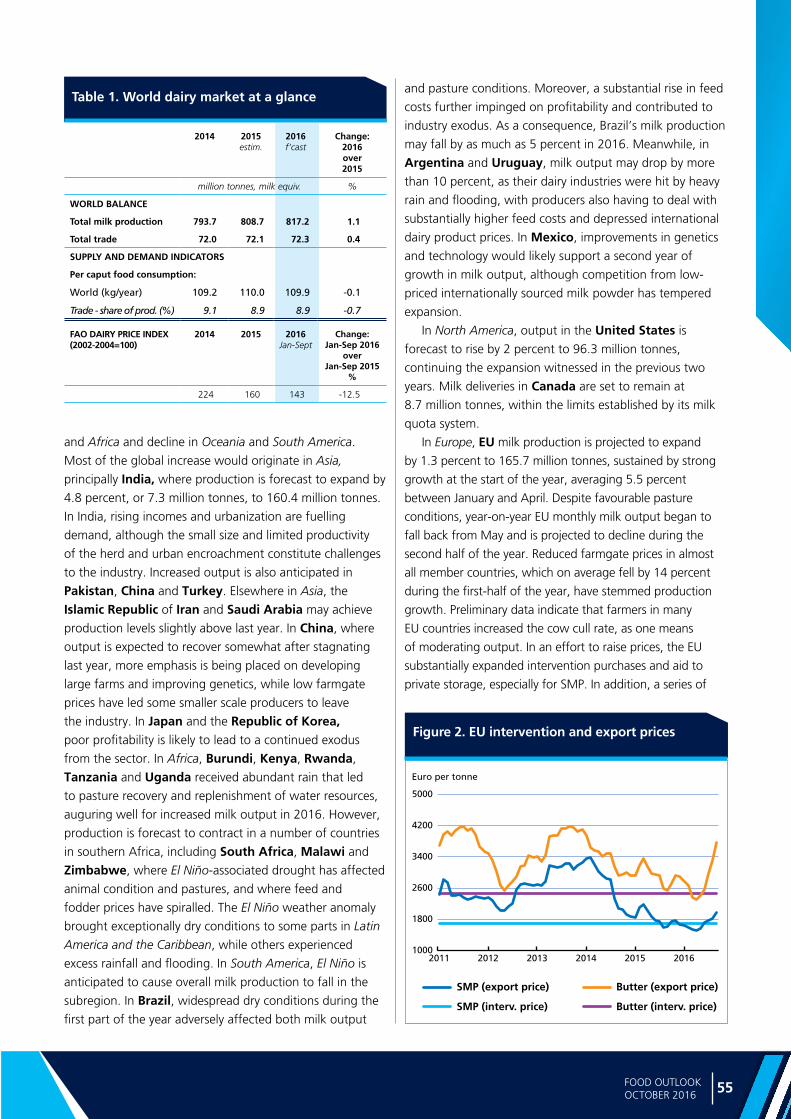
55FOOD OUTLOOKOCTOBER 2016
MILK
AN
D M
ILK P
RO
DU
CT
S
Table 1. World dairy market at a glance
Figure 2. EU intervention and export prices
1000
1800
2600
3400
4200
5000
201620152014201320122011
SMP (interv. price)
SMP (export price) Butter (export price)
Butter (interv. price)
Euro per tonne
and Africa and decline in Oceania and South America.
Most of the global increase would originate in Asia,
principally India, where production is forecast to expand by
4.8 percent, or 7.3 million tonnes, to 160.4 million tonnes.
In India, rising incomes and urbanization are fuelling
demand, although the small size and limited productivity
of the herd and urban encroachment constitute challenges
to the industry. Increased output is also anticipated in
Pakistan, China and Turkey. Elsewhere in Asia, the
Islamic Republic of Iran and Saudi Arabia may achieve
production levels slightly above last year. In China, where
output is expected to recover somewhat after stagnating
last year, more emphasis is being placed on developing
large farms and improving genetics, while low farmgate
prices have led some smaller scale producers to leave
the industry. In Japan and the Republic of Korea, poor profitability is likely to lead to a continued exodus
from the sector. In Africa, Burundi, Kenya, Rwanda,
Tanzania and Uganda received abundant rain that led
to pasture recovery and replenishment of water resources,
auguring well for increased milk output in 2016. However,
production is forecast to contract in a number of countries
in southern Africa, including South Africa, Malawi and
Zimbabwe, where El Niño-associated drought has affected
animal condition and pastures, and where feed and
fodder prices have spiralled. The El Niño weather anomaly
brought exceptionally dry conditions to some parts in Latin
America and the Caribbean, while others experienced
excess rainfall and flooding. In South America, El Niño is
anticipated to cause overall milk production to fall in the
subregion. In Brazil, widespread dry conditions during the
first part of the year adversely affected both milk output
and pasture conditions. Moreover, a substantial rise in feed
costs further impinged on profitability and contributed to
industry exodus. As a consequence, Brazil’s milk production
may fall by as much as 5 percent in 2016. Meanwhile, in
Argentina and Uruguay, milk output may drop by more
than 10 percent, as their dairy industries were hit by heavy
rain and flooding, with producers also having to deal with
substantially higher feed costs and depressed international
dairy product prices. In Mexico, improvements in genetics
and technology would likely support a second year of
growth in milk output, although competition from low-
priced internationally sourced milk powder has tempered
expansion.
In North America, output in the United States is
forecast to rise by 2 percent to 96.3 million tonnes,
continuing the expansion witnessed in the previous two
years. Milk deliveries in Canada are set to remain at
8.7 million tonnes, within the limits established by its milk
quota system.
In Europe, EU milk production is projected to expand
by 1.3 percent to 165.7 million tonnes, sustained by strong
growth at the start of the year, averaging 5.5 percent
between January and April. Despite favourable pasture
conditions, year-on-year EU monthly milk output began to
fall back from May and is projected to decline during the
second half of the year. Reduced farmgate prices in almost
all member countries, which on average fell by 14 percent
during the first-half of the year, have stemmed production
growth. Preliminary data indicate that farmers in many
EU countries increased the cow cull rate, as one means
of moderating output. In an effort to raise prices, the EU
substantially expanded intervention purchases and aid to
private storage, especially for SMP. In addition, a series of
2014 2015estim.
2016f’cast
Change: 2016 over 2015
million tonnes, milk equiv. %
WORLD BALANCE
Total milk production 793.7 808.7 817.2 1.1
Total trade 72.0 72.1 72.3 0.4
SUPPLY AND DEMAND INDICATORS
Per caput food consumption:
World (kg/year) 109.2 110.0 109.9 -0.1
Trade - share of prod. (%) 9.1 8.9 8.9 -0.7
FAO DAIRY PRICE INDEX(2002-2004=100)
2014 2015 2016 Jan-Sept
Change: Jan-Sep 2016
over Jan-Sep 2015
%
224 160 143 -12.5

Ma
rke
t a
sse
ssm
en
ts
56 FOOD OUTLOOKOCTOBER 2016
Figure 3. General alignment of feed and dairy price movement
Average
2012-14
2015
prelim.
2016
f'cast
Change
2016 over
2015
thousand tonnes (product
weight)
%
WHOLE MILK POWDER
World 2 486 2 561 2 518 -1.7
New Zealand 1 326 1 380 1 350 -2.2
European Union* 383 392 395 0.9
Argentina 176 138 128 -7.4
Uruguay 65 97 117 20.1
SKIM MILK POWDER
World 1 952 2 215 2 177 -1.7
European Union* 524 684 645 -5.7
United States 518 560 544 -2.8
New Zealand 388 411 440 7.0
Australia 150 201 188 -6.0
BUTTER
World 933 950 1 006 5.8
New Zealand 478 500 515 3.0
European Union* 134 185 230 24.0
Belarus 73 88 94 7.0
Australia 49 34 32 -5.0
United States 72 26 25 -2.0
CHEESE
World 2 376 2 379 2 477 4.1
European Union* 758 719 795 10.6
New Zealand 287 327 350 7.1
United States 317 318 275 -13.5
Belarus 147 178 205 15.4
Australia 159 171 172 0.7
Saudi Arabia 125 126 130 3.4
Table 2. Trade in dairy products: Principal exporting countries
* Excluding trade between the EU member countries. From 2013: EU-28
110
160
210
260
310
201620152014201320122011
Dairy price index Feed price index
exceptional market measures and financial and promotion
support were approved, including the possibility of voluntary
agreements between farmers to limit milk deliveries for a
six-month period, beginning 13 April 2016. Milk production
in the Russian Federation is predicted to fall by 1.5 percent
this year. Poor profitability has caused a contraction in the
country’s dairy herd, especially in the small farm sector,
although this had been offset to some degree by productivity
increases in the commercial farm sector. In neighbouring
Belarus, milk production is expected to be stimulated by
growing sales to the Russian Federation.
In Oceania, New Zealand’s dependence on the export
market has left it particularly exposed to low international
dairy product prices. This situation has acted as a disincentive
for farmers to raise output via herd expansion or feeding
supplements. New Zealand’s milk production for the 2015/16
dairy year decreased 1.6 percent to 21.6 million tonnes, as
farmers culled less productive cows. Should it persist, the
recent upward shift in international dairy product prices
would take some time to filter through to production.
Therefore, for the moment, New Zealand’s 2016/17 output
is posited as unchanged. In Australia, reduced farmgate
returns for milk and favourable prices for culled cows curbed
2015/2016 production by 1.4 percent to 10.3 million tonnes.
Continuation of the same factors during the 2016/2017 dairy
year, combined with prevalent dry conditions in the major
dairy producing regions during the first half of the calendar
year, is anticipated to further constrain production.
TRADE
Stable overall Global trade in dairy products is projected to be almost
unchanged in 2016, remaining at 72.3 million tonnes of
milk equivalent. The absence of growth this year stands
in marked contrast to an average annual rate of increase
of 6 percent for period 2009–2014. In 2015, a drop in
shipments to China and the embargo by the Russian
Federation on imports from specific countries impinged on
international demand. For 2016, imports by China and,
to a lesser extent, the Russian Federation are projected
to recover somewhat, with growth also foreseen for
Brazil, the United States, and Mexico. However, this is
forecast to be largely counterbalanced by substantial falls
in purchases by Venezuela and Algeria, with declines
also likely for the United Arab Emirates, Nigeria,
Singapore, Malaysia, Vietnam and Thailand, among
others. Within the overall international market for dairy
products, trade flows in cheese and butter are anticipated
to expand, while shipments of milk powders are projected
to wane.

57FOOD OUTLOOKOCTOBER 2016
MILK
AN
D M
ILK P
RO
DU
CT
S
0
400
800
1200
1600
201620152014201320122011
New ZealandArgentina Uruguay
EU
f’cast
Thousand tonnes
0
200
400
600
800
201620152014201320122011
EU USANew ZealandBelarus Australia
f’cast
Thousand tonnes
Figure 4. WMP: Major exporters Figure 5. SMP: Major exporters
The EU, New Zealand and Belarus are the principal
exporting countries expected to see sales rise. Meanwhile,
falls in shipments by the United States, Brazil and
Argentina would largely counterbalance increases
elsewhere. In the case of the EU, large purchases of SMP
to intervention stocks for the year so far are forecast to
dampen trade growth, with total exports possibly rising by
2.1 percent, compared with increases of 13 and 6 percent
in 2014 and 2015, respectively. On the other hand, sales by
Belarus are projected to record a second year of growth due
to a rise in trade with the Russian Federation. Despite rising
milk production, overall dairy sales by the United States are
expected to fall by as much as 4 percent due to the strength
of the US dollar and increased international competition
limiting export opportunities. In Brazil, drought-reduced milk
output is forecast to curtail exports.
Whole milk powder – second year of declineWorld trade in WMP is projected to decline for the
second consecutive year in 2016, by 1.7 percent to
2 518 000 tonnes. Imports by Venezuela and Nigeria
may fall sharply, with reductions also foreseen for Algeria,
the United Arab Emirates, Viet Nam and Malaysia,
although deliveries to China and Brazil are anticipated to
substantially increase. A recovery in demand by China could
push its imports to 540 000 tonnes, almost 20 percent up
on 2015, while difficulty in financing imports may curtail
Venezuela’s purchases by as much as 40 percent and those
of Nigeria by one third.
Among the main exporting countries, January/July data
for New Zealand, which accounts for just over half of
world exports, showed total sales down 4 percent, despite
a large increase in shipments to China. Since seeing its sales
of WMP to China fall off sharply in 2015, and experiencing
difficulty in disposing of excess supplies as a consequence,
New Zealand has reoriented its product mix in order to be less
dependent on a single product or market, raising output of
cheese in particular. Elsewhere, a combination of reduced milk
production in Brazil and Argentina and curtailed imports by
Venezuela, the main market for WMP for both countries, is
forecast to stem sales. In general, other principal exporters are
expected to maintain levels of trade similar to last year. The
outlook is more positive for Uruguay, which saw January/July
exports leap by 70 percent, driven by increased sales to Brazil.
Skim milk powder – decline forecastTrade in SMP is predicted to decrease in 2016, ceding
1.7 percent to 2 177 000 tonnes, which would bring a halt
to an eight-year run of annual growth. The principal reason
behind this change in trend stems from the temporary
removal of supplies from the market via unusually large
purchases to intervention stocks in the EU. The opening of
EU intervention purchases of SMP at the start of the year,
combined with storage financed under the Private Storage
Aid scheme, meant that approximately 400 000 tonnes of
product, equivalent to 25 percent of EU’s production and to
60 percent of the level of its exports in 2015, were removed
from the market during the first eight months of the year. The
reduced pressure to dispose of excess supplies externally was
instrumental in half-year EU SMP exports falling by 14 percent,
year-on-year. Exports by the United States are also expected
to be down. Meanwhile, New Zealand, which has placed
greater emphasis on SMP production, could see overall sales
rise, sustained by increased shipments to Southeast Asia.
Since 2014, global import demand for SMP has remained
relatively stable. This situation is expected to continue in 2016,

Ma
rke
t a
sse
ssm
en
ts
58 FOOD OUTLOOKOCTOBER 2016
0
50
100
150
200
250Aug 2013-June 2014
Aug 2014-June 2015
Aug 2015-June 2016
Thousand tonnes
USA SwitzerlandRussianFed.
Japan KoreaRep.
SaudiArabia
Figure 7. Cheese exports: EU major marketsFigure 6. Butter exports: EU major markets
with many of the main importing countries maintaining similar
levels of purchases to last year. Some growth in imports
is expected for the Philippines, Mexico, China and the
Russian Federation, while those of Malaysia, Singapore, Thailand, Algeria and Japan may be reduced somewhat.
Butter – trade rebounds Trade in butter is forecast to rebound, after falling in 2015.
Reflecting the strengthening of demand, international
quotations for butter rose 44 percent between May
and September. The main sources of augmented
purchases are projected to be the Russian Federation,
the United States, China, Mexico, Australia and
Saudi Arabia, while those by the United Arab Emirates,
Singapore, the European Union and Egypt may fall.
Among exporting countries, the EU is projected to
benefit most from the rise in world demand. In the EU, both
production growth and a favourable rate of exchange are
likely to underpin a rise in external sales. Comparing the first
six months of 2016 with the same period in 2015, EU’s butter
exports rose by 33 percent. In particular, sales to China grew,
with deliveries to the Middle East, North Africa and North
America also strong. Elsewhere, the other principal exporting
countries are expected to see sales comparable with last year.
In the case of New Zealand, shipments of butter are likely to
stay around the 515 000 tonnes mark. The first seven months
of the year saw New Zealand’s sales to the Islamic Republic of
Iran and Mexico rise substantially, while those to the United
Arab Emirates, Azerbaijan and the United States fell.
Cheese - strong growthTrade in cheese is forecast to increase by 4.1 percent
to 2 477 000 tonnes, ending five years of limited-to-
negative growth. The principal countries anticipated to
import more are the Russian Federation, China and the
United States. Among the major exporters, increased
shipments are forecast for the EU, Belarus, New Zealand and Argentina, with sales by Saudi Arabia, Australia,
Nicaragua and the Islamic Republic of Iran being
little changed and those of the United States and
Egypt falling. Exports by the EU could rise by as much
as 10 percent to almost 800 000 tonnes, which would
represent both a record and the first annual increase since
the Russian Federation embargo was imposed in 2014.
Because of the prior importance of the Russian Federation,
which absorbed a third of EU exports before the ban was
introduced, the EU has had to focus on other markets –
mainly the United States, Japan, the Republic of Korea,
Saudi Arabia, Egypt and Algeria. Meanwhile, as the
pre-2014 traditional suppliers continue to be subject to
the embargo, Belarus still has considerable opportunities
for export to the Russian Federation and, consequently,
its shipments are projected to rise by 15 percent in 2016,
to reach 205 000 tonnes. The sharp fall in WMP imports
by China in 2015 caused New Zealand to focus more on
cheese as an alternative use for milk. As a consequence,
its cheese exports rose by 18 percent in 2015 and further
growth is anticipated in 2016, with shipments forecast
to reach 350 000 tonnes. New Zealand’s sales of cheese
have expanded in particular to China, the United States,
Australia and the EU. In the United States, continued strong
domestic demand for dairy products in general, a strong
US Dollar and increased competition from other suppliers
are anticipated to lead to a second year of diminished
cheese exports, which could fall by a similar margin as in
2015, or almost 15 percent, to 275 000 tonnes.
0
5
10
15
20
25
Jan-June 2013Jan-June 2014
Jan-June 2015
Jan-June 2016
Thousand tonnes, product weight
ChinaRussianFed.
SaudiArabia
Egypt USA


Ma
rke
t a
sse
ssm
en
ts
60 FOOD OUTLOOKOCTOBER 2016
Major Exporters and Importers of Fish and Fishery Products
Major ExportersMajor Importers
Figure 1. The FAO Fish Price Index(2002-2004=100)
80
105
130
155
180
201620142012201020082006200420022000
FAO total fish price index
Capture totalAquaculture Total
FISH AND FISHERY PRODUCTS
Source: Norwegian Seafood Council (NSC)
GLOBAL FISH ECONOMY
Global fish production in 2016 is forecast to expand
by 1.8 percent, to 174.1 million tonnes, well below
the ten year-trend of 2.3 percent. The relatively modest
world growth reflects a number of setbacks, including
diseases, and regulatory constraints. Under current
expectations, the increase in global seafood production
would stem from a 5 percent expansion of aquaculture
to 81.4 million tonnes, confirming the sector as the main
engine for fishery growth, which would compensate
for a 0.9 percent contraction in wild fish output to
92.7 million tonnes.
Across different species, shrimp production continues
on a downward trend in some major Asian producing
countries, constrained by a recurrence of parasites,
bacterial, fungal and viral diseases. Nonetheless, the world
production outlook for 2016 is positive overall, thanks to
gains in Ecuador, Indonesia and Thailand. Fresh cod faces
an upward price trend, and Asian developing countries
are expanding their role of important global whitefish
processors. Tuna supply is facing constraints associated
with seasonal fishing bans and the imposition of import
restrictions.
Developing countries continue to play a significant
role in the international supply of fish. Among developed
nations, Norway, one of the world’s largest producers,
continues to enjoy an increased positive performance due
to upward trends of salmon and cod prices. Among the
world’s major importers, the US, the European Union and
Japan are all expected to see marginal declines in total
import value. The overall outlook for the value of seafood
trade in 2016 continues to be positive, mainly thanks to
rising price prospects.
After the sharp declines registered in the second
half of 2015, international seafood prices have shown a
tendency to recover over the first months of 2016, while
still remaining below their corresponding levels in 2015.
According to the FAO Fish Price Index, fish prices averaged
2 percent lower in the first six months of 2016 compared to
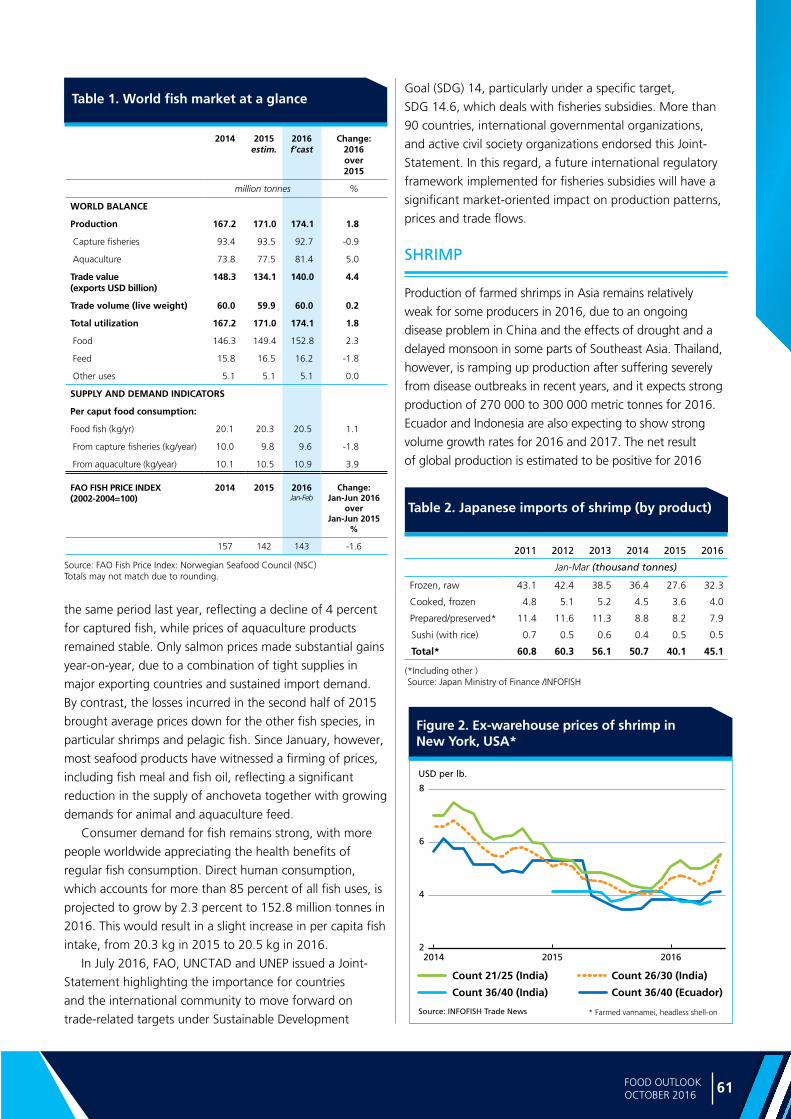
61FOOD OUTLOOKOCTOBER 2016
FISH A
ND
FISHE
RY
PR
OD
UC
TS
Table 1. World fish market at a glance
Source: FAO Fish Price Index: Norwegian Seafood Council (NSC)Totals may not match due to rounding.
Figure 2. Ex-warehouse prices of shrimp in New York, USA*
2
4
6
8
201620152014
USD per lb.
Count 26/30 (India)Count 21/25 (India)
Source: INFOFISH Trade News
Count 36/40 (Ecuador)Count 36/40 (India)
the same period last year, reflecting a decline of 4 percent
for captured fish, while prices of aquaculture products
remained stable. Only salmon prices made substantial gains
year-on-year, due to a combination of tight supplies in
major exporting countries and sustained import demand.
By contrast, the losses incurred in the second half of 2015
brought average prices down for the other fish species, in
particular shrimps and pelagic fish. Since January, however,
most seafood products have witnessed a firming of prices,
including fish meal and fish oil, reflecting a significant
reduction in the supply of anchoveta together with growing
demands for animal and aquaculture feed.
Consumer demand for fish remains strong, with more
people worldwide appreciating the health benefits of
regular fish consumption. Direct human consumption,
which accounts for more than 85 percent of all fish uses, is
projected to grow by 2.3 percent to 152.8 million tonnes in
2016. This would result in a slight increase in per capita fish
intake, from 20.3 kg in 2015 to 20.5 kg in 2016.
In July 2016, FAO, UNCTAD and UNEP issued a Joint-
Statement highlighting the importance for countries
and the international community to move forward on
trade-related targets under Sustainable Development
Goal (SDG) 14, particularly under a specific target,
SDG 14.6, which deals with fisheries subsidies. More than
90 countries, international governmental organizations,
and active civil society organizations endorsed this Joint-
Statement. In this regard, a future international regulatory
framework implemented for fisheries subsidies will have a
significant market-oriented impact on production patterns,
prices and trade flows.
SHRIMP
Production of farmed shrimps in Asia remains relatively
weak for some producers in 2016, due to an ongoing
disease problem in China and the effects of drought and a
delayed monsoon in some parts of Southeast Asia. Thailand,
however, is ramping up production after suffering severely
from disease outbreaks in recent years, and it expects strong
production of 270 000 to 300 000 metric tonnes for 2016.
Ecuador and Indonesia are also expecting to show strong
volume growth rates for 2016 and 2017. The net result
of global production is estimated to be positive for 2016
2014 2015estim.
2016f’cast
Change: 2016 over 2015
million tonnes %
WORLD BALANCE
Production 167.2 171.0 174.1 1.8
Capture fisheries 93.4 93.5 92.7 -0.9
Aquaculture 73.8 77.5 81.4 5.0
Trade value (exports USD billion)
148.3 134.1 140.0 4.4
Trade volume (live weight) 60.0 59.9 60.0 0.2
Total utilization 167.2 171.0 174.1 1.8
Food 146.3 149.4 152.8 2.3
Feed 15.8 16.5 16.2 -1.8
Other uses 5.1 5.1 5.1 0.0
SUPPLY AND DEMAND INDICATORS
Per caput food consumption:
Food fish (kg/yr) 20.1 20.3 20.5 1.1
From capture fisheries (kg/year) 10.0 9.8 9.6 -1.8
From aquaculture (kg/year) 10.1 10.5 10.9 3.9
FAO FISH PRICE INDEX
(2002-2004=100)2014 2015 2016
Jan-FebChange:
Jan-Jun 2016 over
Jan-Jun 2015 %
157 142 143 -1.6 2011 2012 2013 2014 2015 2016
Jan-Mar (thousand tonnes)
Frozen, raw 43.1 42.4 38.5 36.4 27.6 32.3
Cooked, frozen 4.8 5.1 5.2 4.5 3.6 4.0
Prepared/preserved* 11.4 11.6 11.3 8.8 8.2 7.9
Sushi (with rice) 0.7 0.5 0.6 0.4 0.5 0.5
Total* 60.8 60.3 56.1 50.7 40.1 45.1
(*Including other ) Source: Japan Ministry of Finance /INFOFISH
Table 2. Japanese imports of shrimp (by product)
* Farmed vannamei, headless shell-on

Ma
rke
t a
sse
ssm
en
ts
62 FOOD OUTLOOKOCTOBER 2016
2012 2013 2014 2015 2016
Jan-Jun (thousand tonnes)
USA 46.3 54.9 52.4 41.0 44.5
Egypt 27.1 15.7 19.6 31.9 37.8
Australia 19.5 20.0 21.8 20.5 19.2
Japan 16.4 17.2 16.0 16.9 17.1
Canada 15.0 16.4 15.2 13.9 14.9
Saudi Arabia 15.4 11.9 14.6 16.8 14.0
Libya 20.7 17.7 22.3 12.4 8.6
UAE 6.3 6.5 6.4 7.7 8.2
Argentina 3.4 3.6 2.8 3.3 6.7
UK 5.2 8.5 5.9 6.8 6.3
Peru 0.7 2.3 4.0 5.6 5.3
Chile 2.9 5.1 7.6 5.4 5.1
Jordan 2.2 3.0 5.4 3.6 5.1
Israel 1.3 2.5 4.1 4.3 5.0
PN Guinea 4.4 3.1 5.9 5.6 4.2
Lebanon 2.5 2.4 2.7 2.2 3.4
Yemen 5.6 5.4 4.4 3.5 3.1
Tunesia 6.4 5.9 3.4 1.6 3.1
Others 66.5 79.9 79.7 78.0 59.7
Total 267.8 282.0 294.2 281.0 271.3
Source: Thai Customs
Table 3. Thai exports of canned/processed tuna
and 2017, but increased regional demand, particularly
from China, is absorbing supplies previously channelled
to traditional developed markets. Overall, China will likely
continue to influence the global market and international
prices if its domestic production does not improve. In the
near term, the market will also be determined by the supply
situation in India, where the 2016 production forecast is
not promising. However, on a global scale, the direction of
future price trends largely depends on the extent to which
demand growth in regional markets in Asia offsets global
supply increases.
TUNA
Canned tuna production in Ecuador, the largest supplier
to the European market, was lower in May following a
mid-April earthquake that slowed cannery operations
and impacted the port infrastructure at Manta, making it
impossible to land raw material. Combined with a scarcity
of tuna arrivals from the Eastern Pacific, this situation
pushed prices upwards in early 2016, but they have since
stabilized. Starting from 1 July, purse seine operations in
the Western and Central Pacific were subjected to the
seasonal three-month ban on fish aggregating devices
(FADs), which, combined with positive demand for tuna from
processors, is likely to keep prices stable or lead to further
increases for the remainder of 2016. The most significant
Figure 3. Prices of frozen skipjack tuna for canning in Thailand*
0
1000
2000
3000
20162015201420132012
(4 lb./pc and up, CFR Bangkok, origin: Western Pacific)
USD per tonne
Source: INFOFISH Trade News *
trade-related news for the tuna sector in the future is the
European Commission’s formal notice (yellow card) issued
to Thailand in April 2016 for not taking sufficient measures
in the international fight against IUU fishing. In April, the EU
stated that it had given Thailand six months to implement a
corrective action plan. Should the situation not improve, the
EU could resort to banning fisheries imports from Thailand.
Last year, the EU imported USD 184 million worth of canned
tuna from the country, so if the ban goes into effect, there
could be serious repercussions to Thailand, but also the EU,
which would have to seek new sources of supply.
GROUNDFISH
For the remainder of 2016, a stable supply situation is
expected for the majority of groundfish species. Relatively
high prices for cod are forecast to continue, while haddock
prices are giving sign of recovering. Cuts in Barents Sea
quotas for both species have been recommended by the
International Council for the Exploration of the Sea (ICES)
in 2017, which may result in tighter supplies and firmer
prices. Pacific cod quotations are also on the rise, and can
be expected to benefit from the same market conditions.
Meanwhile, the Barents Sea saithe quota is likely to be
raised next year. As for surimi, the processed paste made
from fish, including cod and haddock, and transformed
into an imitation of crab pulp, there is a danger of
overproduction, particularly considering the long-term
trend that is seeing consumers move away from processed
seafood. Sustainability remains an important concern
for the groundfish sector, with an increasing number of
fisheries in the US and Europe seeking certification by the
Marine Stewardship Council (MSC).

63FOOD OUTLOOKOCTOBER 2016
FISH A
ND
FISHE
RY
PR
OD
UC
TS
Figure 4. Groundfish production* by main species (2014)
Source: FAO
Alaska pollock39%
Cod23%
Hake15%
Whiting15%
Saithe4%
Haddock 4%
* Aquaculture+ capture
Figure 5. Export prices of cod in Norway*
0
25
50
75
100
201620152014201320122011
NOK per kg.
Fresh codFrozen cod whole
* Average export prices, FOB NorwaySource: Norway Seafood Council
Fresh cod filletsFrozen cod fillets
Source: NMFS
Table 4. US imports of fresh and frozen pangasius fillets
2012 2013 2014 2015 2016
Jan-June (thousand tonnes)
Viet Nam 47.2 48.9 45.1 54.8 64.3
China 2.4 3.6 4.2 3.3 2.5
Thailand 0.0 0.0 0.0 0.0 0.0
Others 0.1 0.0 0.0 0.1 0.3
Total 49.7 52.5 49.3 58.2 67.1
CEPHALOPODS
The 2016 squid season off South America has been a
significant disappointment for the sector thus far. Landings
are dramatically down, with the drop generally attributed
to the strong El Niño in 2015 and 2016. Catches have been
so poor that the authorities are considering at least partial
reimbursement of licence fees. As a result of the tightening
supply, squid prices are up by more than 30 percent. In
contrast, there seems to be reason for a more optimistic
view of cephalopod supply in the longer term, as recent
research has shown that global cephalopod populations
are growing. In the more immediate future, scientists are
expecting the current El Niño to taper off and temperature
conditions to return to normal in the next 6 to 12 months,
which should bring about an improvement in landings
in the affected regions over the next year. Squid prices,
however, can be expected to remain high for some time
with sustained strong demand, while the need to make up
a shortfall in supplies of Illex and Loligo squid may stimulate
demand for alternative species.
PANGASIUS
The current low international prices of pangasius will
continue to encourage imports throughout 2016,
particularly in the important US market. For the world’s
number one producer, Viet Nam, lower prices have led the
Viet Nam Association of Seafood Exporters and Producers
(VASEP) to forecast a 5 percent reduction in total export
value for 2016. Growing import demand for farmed
pangasius is expected to support growth in producing
countries other than Viet Nam and prevent prices from
dropping further. In fact, it is likely that increasing feed
costs will necessitate a price hike in the medium term.
TILAPIA
Despite the weakening of major markets such as the
US and production problems in China, the outlook for
Figure 6. Prices of tilapia in the USA
1
2
3
4
5
20162015201420132012
Chilled tilapia fillets (primary wholesale, NY, USA, origin: Costa Rica)
Frozen tilapia fillets (3-5 oz/lb, EXW NY, USA, origin: China)
USD per lb.
Source: INFOFISH Trade News
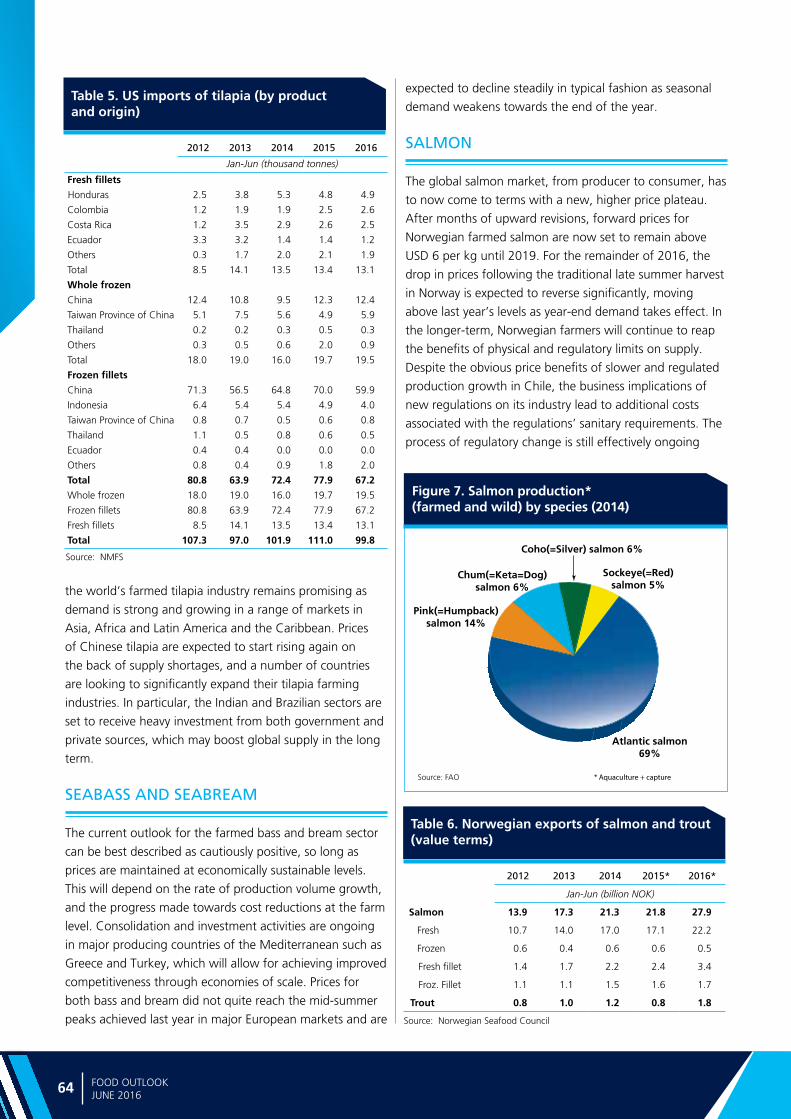
Ma
rke
t a
sse
ssm
en
ts
64 FOOD OUTLOOKJUNE 2016
Source: NMFS
Table 5. US imports of tilapia (by product and origin)
2012 2013 2014 2015 2016
Jan-Jun (thousand tonnes)
Fresh fillets
Honduras 2.5 3.8 5.3 4.8 4.9
Colombia 1.2 1.9 1.9 2.5 2.6
Costa Rica 1.2 3.5 2.9 2.6 2.5
Ecuador 3.3 3.2 1.4 1.4 1.2
Others 0.3 1.7 2.0 2.1 1.9
Total 8.5 14.1 13.5 13.4 13.1
Whole frozen
China 12.4 10.8 9.5 12.3 12.4
Taiwan Province of China 5.1 7.5 5.6 4.9 5.9
Thailand 0.2 0.2 0.3 0.5 0.3
Others 0.3 0.5 0.6 2.0 0.9
Total 18.0 19.0 16.0 19.7 19.5
Frozen fillets
China 71.3 56.5 64.8 70.0 59.9
Indonesia 6.4 5.4 5.4 4.9 4.0
Taiwan Province of China 0.8 0.7 0.5 0.6 0.8
Thailand 1.1 0.5 0.8 0.6 0.5
Ecuador 0.4 0.4 0.0 0.0 0.0
Others 0.8 0.4 0.9 1.8 2.0
Total 80.8 63.9 72.4 77.9 67.2
Whole frozen 18.0 19.0 16.0 19.7 19.5
Frozen fillets 80.8 63.9 72.4 77.9 67.2
Fresh fillets 8.5 14.1 13.5 13.4 13.1
Total 107.3 97.0 101.9 111.0 99.8
the world’s farmed tilapia industry remains promising as
demand is strong and growing in a range of markets in
Asia, Africa and Latin America and the Caribbean. Prices
of Chinese tilapia are expected to start rising again on
the back of supply shortages, and a number of countries
are looking to significantly expand their tilapia farming
industries. In particular, the Indian and Brazilian sectors are
set to receive heavy investment from both government and
private sources, which may boost global supply in the long
term.
SEABASS AND SEABREAM
The current outlook for the farmed bass and bream sector
can be best described as cautiously positive, so long as
prices are maintained at economically sustainable levels.
This will depend on the rate of production volume growth,
and the progress made towards cost reductions at the farm
level. Consolidation and investment activities are ongoing
in major producing countries of the Mediterranean such as
Greece and Turkey, which will allow for achieving improved
competitiveness through economies of scale. Prices for
both bass and bream did not quite reach the mid-summer
peaks achieved last year in major European markets and are Source: Norwegian Seafood Council
Table 6. Norwegian exports of salmon and trout (value terms)
2012 2013 2014 2015* 2016*
Jan-Jun (billion NOK)
Salmon 13.9 17.3 21.3 21.8 27.9
Fresh 10.7 14.0 17.0 17.1 22.2
Frozen 0.6 0.4 0.6 0.6 0.5
Fresh fillet 1.4 1.7 2.2 2.4 3.4
Froz. Fillet 1.1 1.1 1.5 1.6 1.7
Trout 0.8 1.0 1.2 0.8 1.8
Figure 7. Salmon production* (farmed and wild) by species (2014)
Atlantic salmon69%
Pink(=Humpback)salmon 14%
Chum(=Keta=Dog)salmon 6%
Coho(=Silver) salmon 6%
Sockeye(=Red)salmon 5%
* Aquaculture + captureSource: FAO
expected to decline steadily in typical fashion as seasonal
demand weakens towards the end of the year.
SALMON
The global salmon market, from producer to consumer, has
to now come to terms with a new, higher price plateau.
After months of upward revisions, forward prices for
Norwegian farmed salmon are now set to remain above
USD 6 per kg until 2019. For the remainder of 2016, the
drop in prices following the traditional late summer harvest
in Norway is expected to reverse significantly, moving
above last year’s levels as year-end demand takes effect. In
the longer-term, Norwegian farmers will continue to reap
the benefits of physical and regulatory limits on supply.
Despite the obvious price benefits of slower and regulated
production growth in Chile, the business implications of
new regulations on its industry lead to additional costs
associated with the regulations’ sanitary requirements. The
process of regulatory change is still effectively ongoing
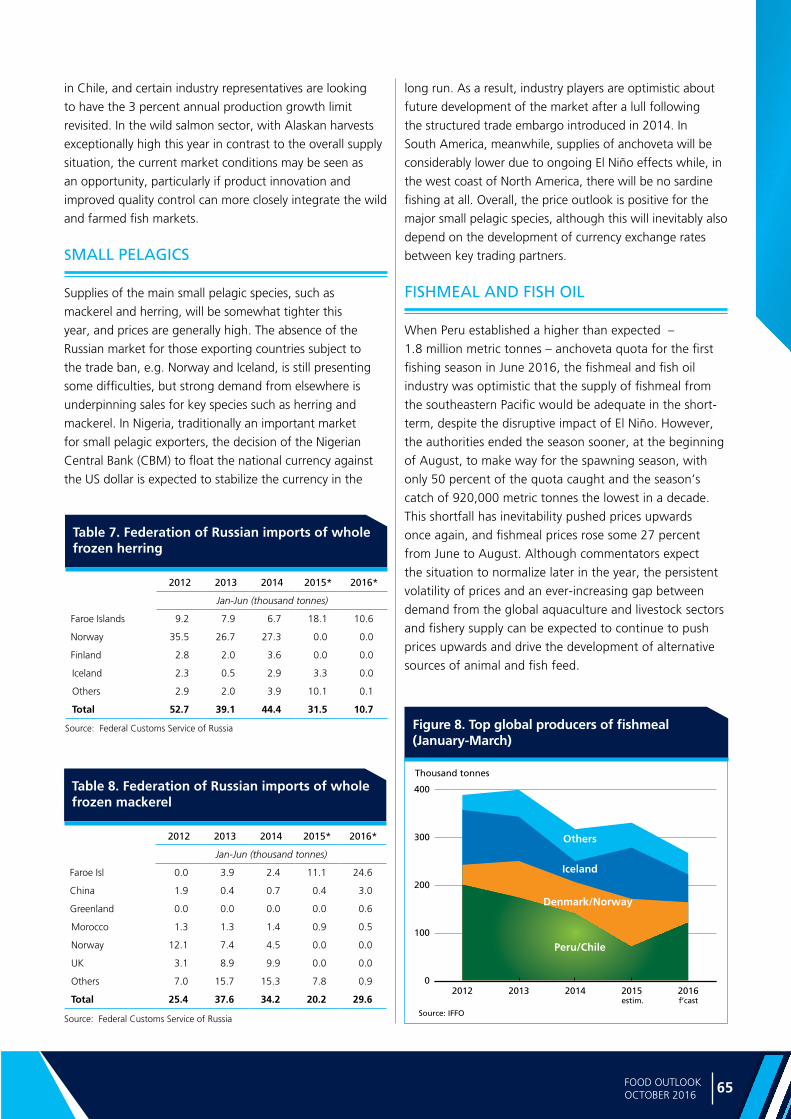
65FOOD OUTLOOKOCTOBER 2016
Source: Federal Customs Service of Russia
Table 8. Federation of Russian imports of whole frozen mackerel
2012 2013 2014 2015* 2016*
Jan-Jun (thousand tonnes)
Faroe Isl 0.0 3.9 2.4 11.1 24.6
China 1.9 0.4 0.7 0.4 3.0
Greenland 0.0 0.0 0.0 0.0 0.6
Morocco 1.3 1.3 1.4 0.9 0.5
Norway 12.1 7.4 4.5 0.0 0.0
UK 3.1 8.9 9.9 0.0 0.0
Others 7.0 15.7 15.3 7.8 0.9
Total 25.4 37.6 34.2 20.2 29.6
FISH A
ND
FISHE
RY
PR
OD
UC
TS
in Chile, and certain industry representatives are looking
to have the 3 percent annual production growth limit
revisited. In the wild salmon sector, with Alaskan harvests
exceptionally high this year in contrast to the overall supply
situation, the current market conditions may be seen as
an opportunity, particularly if product innovation and
improved quality control can more closely integrate the wild
and farmed fish markets.
SMALL PELAGICS
Supplies of the main small pelagic species, such as
mackerel and herring, will be somewhat tighter this
year, and prices are generally high. The absence of the
Russian market for those exporting countries subject to
the trade ban, e.g. Norway and Iceland, is still presenting
some difficulties, but strong demand from elsewhere is
underpinning sales for key species such as herring and
mackerel. In Nigeria, traditionally an important market
for small pelagic exporters, the decision of the Nigerian
Central Bank (CBM) to float the national currency against
the US dollar is expected to stabilize the currency in the
Source: Federal Customs Service of Russia
Table 7. Federation of Russian imports of whole frozen herring
2012 2013 2014 2015* 2016*
Jan-Jun (thousand tonnes)
Faroe Islands 9.2 7.9 6.7 18.1 10.6
Norway 35.5 26.7 27.3 0.0 0.0
Finland 2.8 2.0 3.6 0.0 0.0
Iceland 2.3 0.5 2.9 3.3 0.0
Others 2.9 2.0 3.9 10.1 0.1
Total 52.7 39.1 44.4 31.5 10.7
long run. As a result, industry players are optimistic about
future development of the market after a lull following
the structured trade embargo introduced in 2014. In
South America, meanwhile, supplies of anchoveta will be
considerably lower due to ongoing El Niño effects while, in
the west coast of North America, there will be no sardine
fishing at all. Overall, the price outlook is positive for the
major small pelagic species, although this will inevitably also
depend on the development of currency exchange rates
between key trading partners.
FISHMEAL AND FISH OIL
When Peru established a higher than expected –
1.8 million metric tonnes – anchoveta quota for the first
fishing season in June 2016, the fishmeal and fish oil
industry was optimistic that the supply of fishmeal from
the southeastern Pacific would be adequate in the short-
term, despite the disruptive impact of El Niño. However,
the authorities ended the season sooner, at the beginning
of August, to make way for the spawning season, with
only 50 percent of the quota caught and the season’s
catch of 920,000 metric tonnes the lowest in a decade.
This shortfall has inevitability pushed prices upwards
once again, and fishmeal prices rose some 27 percent
from June to August. Although commentators expect
the situation to normalize later in the year, the persistent
volatility of prices and an ever-increasing gap between
demand from the global aquaculture and livestock sectors
and fishery supply can be expected to continue to push
prices upwards and drive the development of alternative
sources of animal and fish feed.
Figure 8. Top global producers of fishmeal(January-March)
0
100
200
300
400
20162015201420132012estim.
Source: IFFO
f’cast
Peru/Chile
Denmark/Norway
Iceland
Others
Thousand tonnes
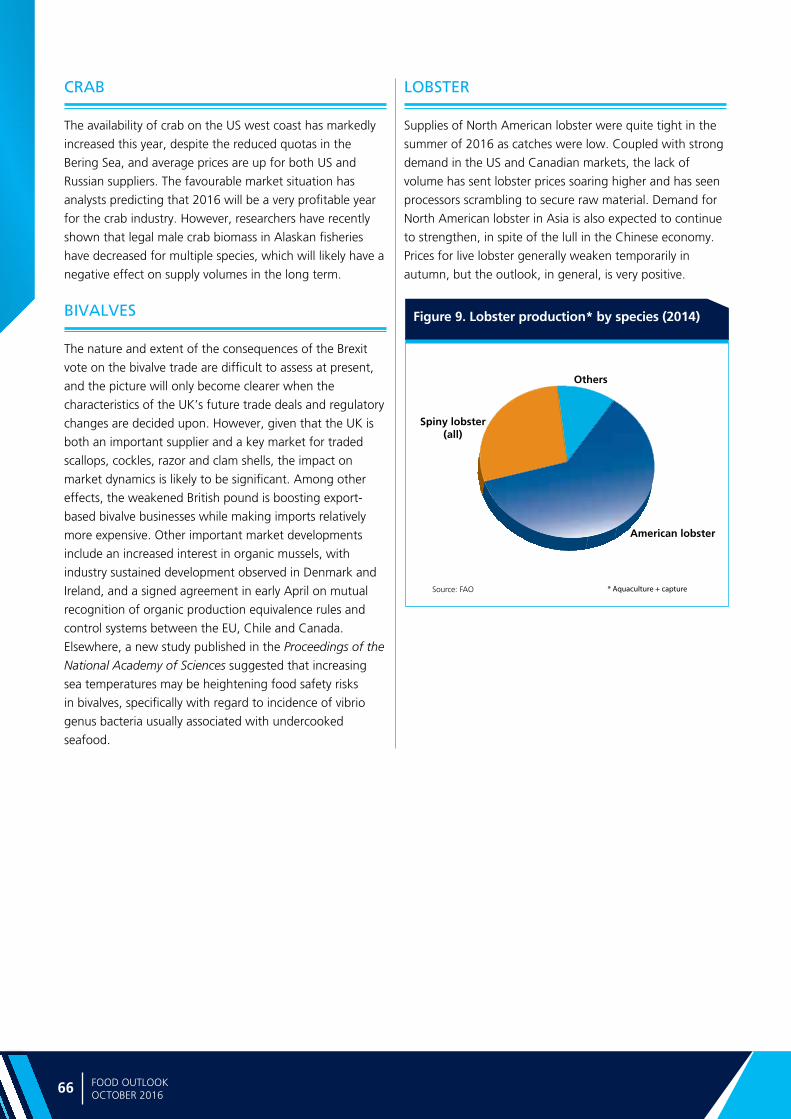
Ma
rke
t a
sse
ssm
en
ts
66 FOOD OUTLOOKOCTOBER 2016
CRAB
The availability of crab on the US west coast has markedly
increased this year, despite the reduced quotas in the
Bering Sea, and average prices are up for both US and
Russian suppliers. The favourable market situation has
analysts predicting that 2016 will be a very profitable year
for the crab industry. However, researchers have recently
shown that legal male crab biomass in Alaskan fisheries
have decreased for multiple species, which will likely have a
negative effect on supply volumes in the long term.
BIVALVES
The nature and extent of the consequences of the Brexit
vote on the bivalve trade are difficult to assess at present,
and the picture will only become clearer when the
characteristics of the UK’s future trade deals and regulatory
changes are decided upon. However, given that the UK is
both an important supplier and a key market for traded
scallops, cockles, razor and clam shells, the impact on
market dynamics is likely to be significant. Among other
effects, the weakened British pound is boosting export-
based bivalve businesses while making imports relatively
more expensive. Other important market developments
include an increased interest in organic mussels, with
industry sustained development observed in Denmark and
Ireland, and a signed agreement in early April on mutual
recognition of organic production equivalence rules and
control systems between the EU, Chile and Canada.
Elsewhere, a new study published in the Proceedings of the
National Academy of Sciences suggested that increasing
sea temperatures may be heightening food safety risks
in bivalves, specifically with regard to incidence of vibrio
genus bacteria usually associated with undercooked
seafood.
Figure 9. Lobster production* by species (2014)
LOBSTER
Supplies of North American lobster were quite tight in the
summer of 2016 as catches were low. Coupled with strong
demand in the US and Canadian markets, the lack of
volume has sent lobster prices soaring higher and has seen
processors scrambling to secure raw material. Demand for
North American lobster in Asia is also expected to continue
to strengthen, in spite of the lull in the Chinese economy.
Prices for live lobster generally weaken temporarily in
autumn, but the outlook, in general, is very positive.
American lobster
Others
* Aquaculture + capture
Spiny lobster(all)
Source: FAO


SPEC
IAL
FEAT
URES

Spe
cial fe
atu
res
69FOOD OUTLOOKOCTOBER 2016
NAIROBI DECISION ON EXPORT COMPETITION (Tenth WTO Ministerial Conference, Nairobi, December 2015)
Contributed by:
Georgios Mermigkas [email protected]
Ekaterina Krivonos [email protected]
Food price indices Peak values September 2016
Change: Sep 2016 over peak
values
%
FAO Food Price Index Feb-11 240 171 -29
Cereals Jun-08 268 141 -47
Oils Feb-11 287 172 -40
Sugar Jan-11 420 305 -27
Meat Aug-14 212 164 -23
Dairy Feb-14 275 176 -36
Table 2. Food prices remain well below their peaks
Source: FAO
Food price indices January 2016
September 2016
Change: Sep 2016
over Jan 2016
%
FAO Food Price Index 149 171 15
Cereals 149 141 -5
Oils 139 172 24
Sugar 199 305 53
Meat 145 164 13
Dairy 145 176 21
Table 1. Food prices are generally up since the start of 2016
Source: FAO
ELIMINATION OF EXPORT SUBSIDIES UNDER THE LATEST WTO RULE WILL BE A CRITICAL FACTOR IN THE PERIOD OF LOW PRICES
Despite a general rise since the beginning of 2016,
international food commodity prices have remained
well below their peak values and are not projected to
return to those high levels over the next decade (OECD/
FAO 2016). In this context, the Decision1 agreed at the
10th WTO Ministerial Conference, held in Nairobi in
December 2015, to eliminate export subsidies can be
important as it prevents members from reverting to their
use.
Export subsidies, which were mostly used by OECD
countries in the past, are considered a highly market-
distorting instrument of agricultural support, with negative
implications for trading partners and world markets.
While providing incentives to domestic producers, export
subsidies tend to supress world prices, by boosting supplies
of exportable products, thus affecting the competitiveness
of those countries that are not able to provide similar
support. Historically, while agricultural export subsidies in
developed countries could be said to have benefited net
food-importing developing countries, they have placed a
severe constraint on the ability of farmers in developing
countries to compete in world and domestic markets. For
these reasons, export subsidies have always been the core
of the WTO negotiations on export competition.
1 WT/MIN(15)/45, available online: https://www.wto.org/english/thewto_e/minist_e/mc10_e/l980_e.htm
NAIROBI DECISION ON EXPORT COMPETITION
The Nairobi WTO Ministerial Conference (MC10) reached a
Decision on export competition covering all four elements
of the agriculture negotiations on export competition,
namely: export subsidies; export credits, guarantees
& insurance programmes; agricultural exporting state
trading enterprises (STEs); and international food aid.
The agreement to eliminate export subsidies is the most
significant element of the Decision, as this instrument has
always been at the heart of the WTO negotiations due to
its significant trade distorting character and its extensive
use in the previous decades.
At the time of the Nairobi Ministerial Conference,
18 out of the 162 WTO members2 had export subsidy
entitlements and, thus, were officially permitted to
subsidize their agricultural exports within the limits
specified in their respective schedules. However, the
original schedules did not contain deadlines for their
2 The EU counted as one. Following the accession of Liberia and Afghanistan in July 2016, the WTO currently has 164 members.

Spe
cia
l fe
atu
res
70 FOOD OUTLOOKOCTOBER 2016
use, a shortcoming purposely addressed by the Nairobi
Decision.
The Decision establishes that developed country
members eliminate their remaining, at the time of the
Nairobi Ministerial Conference, export subsidy entitlements
immediately on the adoption of the Decision. However, it
contains a special provision (footnote 4 of the Decision)
extending the termination period for the use of export
subsidies by developed country members to the end
of 2020, provided that they accept to eliminate, as of
1 January 2016, all export subsidies on products destined
to Least Developed Countries (LDCs). Nevertheless, this
extended deadline only applies to processed products,
dairy products and pigmeat, and only if these were notified
as having benefited from export subsidies in one of the
three most recent notifications reviewed by the WTO
Committee on Agriculture. An additional obligation related
to this derogation is that no export subsidies should be applied either to new markets or to new products. The Decision also includes a provision for the EU, in the
case of sugar, which endorsed the earlier relevant WTO
Dispute Settlement rulings3 maintaining the EU’s sugar
export subsidy quantity entitlement4 until the end of
September 2017.
3 DS265, DS266 and DS283
4 The export subsidies reduction commitments are expressed in terms of both the volume of subsidized exports and the budgetary outlays of these exports.
Developed members
Country Product End date
Australia All products Immediately
CanadaDairy products, processed products End of 2020
All other products Immediately
European Union
Pork meat, processed products End of 2020
Sugar September 2017
All other products Immediately
Iceland All products Immediately
NorwayPork meat, dairy products, processed products End of 2020
All other products Beginning of 2016
SwitzerlandProcessed products End of 2020
All other products Immediately
United States All products Immediately
Developing members*
BrazilCotton End of 2016
All other products End of 2018
ColombiaCotton End of 2016
All other products End of 2018
Indonesia All products End of 2018
Israel
Cotton End of 2016
Fruits and vegetables End of 2022
All other products End of 2018
Mexico All other products End of 2018
South AfricaCotton End of 2016
All other products End of 2018
Turkey**19 products End of 2022
All other products End of 2018
Uruguay All products End of 2018
Venezuela**50 products End of 2022
All other products End of 2018
Table 3. Export subsidies end date per product as per the Nairobi Decision
* New Zealand and Panama have not been included in the list, as they already set their entitlements to zero in 2000 and 2003 respectively.
** Turkey and Venezuela have not submitted their relevant notifications since 2003 and 1998 respectively, so the list of notified products is longer than the ones of
the rest of the membership. That said, it does not mean that these two members have made use of the tool during recent years.

Spe
cial fe
atu
res
71FOOD OUTLOOKOCTOBER 2016
Consistent with the WTO differential treatment
principle, the Decision does not call for the immediate
elimination of export subsidy entitlements by developing
country members. Instead, it allows them to retain such
entitlements until the end of 2018 (or end of 2016 in
the case of cotton). Like for developed country members,
there is a special provision (footnote 5 of the Decision) that
extends the date for the elimination of export subsidies by
developing countries, in their case up to 2022, for those
products that were notified as having benefited from export
subsidies in one of the three most recent notifications
reviewed by the WTO Committee on Agriculture. Unlike for
developed countries, there is no particular restriction on the
nature of such products.
The 18 WTO members with export subsidy entitlements
prior to the Nairobi Decision include eight developed
countries (Australia, Canada, European Union, Iceland,
New Zealand, Norway, Switzerland and the United States)
and 10 developing countries (Brazil, Colombia, Indonesia,
Israel, Mexico, Panama, South Africa, Turkey, Uruguay
and Venezuela)5. Using the information provided by the
members in their three latest notifications examined by
the WTO Committee on Agriculture before the adoption
of the Nairobi Decision, table 3 shows the newly agreed
end dates for the complete phasing out of export subsidy
entitlements:
5 The notions of developed and developing countries relate to the applicability of the Agreement on Agriculture Special and Differentiated Treatment provisions in favour of developing members. It may be noted that there is no WTO definition for “developed” and “developing” countries. Members announce for themselves whether they are “developed” or “developing” countries.
Another integral element of the Decision is the extended
2023 deadline agreed on the use of Article 9.4 of the
Agreement on Agriculture, which allows developing
countries to resort to export subsidies to cover or reduce
the costs of marketing and transportation. LDCs and
Net Food-Importing Developing Countries (NFIDCs) are
granted seven more years, until the end of 2030, to phase
out this type of support. The value of this extra flexibility
is, however, limited, as these two country groups, and in
particular the LDCs, are unlikely to have the resources or
opportunity to use export subsidies.
TRENDS IN THE USE OF EXPORT SUBSIDIES
Of the 18 WTO members allowed to use export subsidies
prior to the Nairobi Decision, only a handful of them
actually did, most notably Canada, the EU, Norway and
Switzerland. The EU had the largest scheduled entitlements
and was the biggest user of the instrument in the past. As
Table 4 shows, the use of export subsidies at the global
level has declined significantly since 2005. In part, this
could be explained by the steep increases in agricultural
commodity prices witnessed since 2006, which considerably
diminished the need to provide incentives for sustaining
or boosting exports. However, the extensive reforms of
the Common Agricultural Policy (CAP) of the EU, most
notably the move away from using market price support
for farm products, probably played an even greater role.
These reforms resulted in reduced food stocks and smaller
exportable surpluses. In accordance with the 2014-2020
CAP, export subsidies were last used by the EU in 2013.
EU Canada Norway Switzerland Other Total export subsidies entitlementof all WTO members
2000 2 546 0 45 188 151 10 703
2001 2 303 0 32 132 149 10 342
2002 2 949 0 33 136 169 10 611
2003 3 343 62 45 153 190 12 060
2004 3 269 72 55 147 101 12 880
2005 2 388 83 51 114 4 12 123
2006 1 834 88 53 109 4 12 866
2007 1 163 84 41 85 0 13 602
2008 660 84 37 96 19 14 402
2009 523 79 40 111 4 13 755
2010 230 86 45 73 2 13 324
2011 187 89 40 86 2 13 955
2012 76 101 40 69 1 13 074
2013 0 82 45 76 1 13 403
Table 4. Notified export subsidies by WTO member (USD million)
Source: Calculations based on information from the WTO Secretariat compiling WTO Members’ notifications. Exchange rates from the IMF’s international financial statistics

Spe
cia
l fe
atu
res
72 FOOD OUTLOOKOCTOBER 2016
While the EU regulations allow for “exceptional
measures” that can be activated in an event of a crisis to
address threats of market disturbances, in recent years
these did not include export subsidies, even when there
were concerns about European exports. For instance, the
EU introduced a series of measures to support farmers
in 2014 and 2015 in response to the import restrictions
imposed by the Russian Federation in August 2014, and
an additional package of measures to counter both the
declining agricultural prices for some products and the
extension of the Russian import ban in March 20166.
6 The package includes supporting the fixed intervention price for skimmed milk powder and butter and financial instruments for investments to improve competitiveness or introduce structural adjustments. http://europa.eu/rapid/
However, neither of these packages included export
subsidies. To address market oversupply of dairy, which
was one of the most affected sectors, the EU approved
intervention buying-in of butter, skimmed milk powder
and certain types of cheese, but did not make recourse to
export subsidies to stimulate shipments to other markets.
While the EU is responsible for much of the reduction
in export subsidies at the global level, the total use of
the instrument notified by other WTO members, namely
Canada, Norway and Switzerland, has remained largely
unchanged over the last few years, averaging slightly above
USD 200 million per year. However, the trend is not the
same in the three countries. For instance, Canada only
started providing export subsidies in 2003, while Norway
maintained their level throughout the entire 2000-2013
period and Switzerland reduced them to less than half of
their level in the early 2000s.
The main product categories subject to export subsidies
by the WTO developed country members during the
2008-2013 period were the processed (or “incorporated”)
products, dairy products (primarily skim milk powder and
cheese) and pigmeat (Table 5). The EU also funded exports
of poultry and bovine meats. In addition, the EU notified
1.35 million tonnes of sugar as quantities that benefited
from export subsidies in 2013 (Diaz-Bonilla and Hepburn,
2016). Not surprisingly, the above products are those that
were agreed in Nairobi as eligible for longer phasing-out
dates by developed country members.
press-release_IP-16-806_en.htm
Figure 1. Notified export subsidies by WTO member
Source:Calculations based on information from the WTO Secretariat compiling WTO Members' notifications. Exchange rates from the IMF’s international financial statistics
2008 2009 2010 2011 2012 2013 2014
Incorporated products 224.3 152.6 112.1 122.2 95.6 98.3 99.1
Skim milk powder (SMP) 74.2 72.1 30.2 31.5 31.2 30.1 28.0
Cheese 77.3 67.2 36.7 39.5 38.2 37.5 27.7
Other milk products 167.8 157.8 21.8 22.7 22.5 17.5 17.8
Pigmeat 58.9 28.4 37.1 31.3 10.4 14.3 8.0
Fruits and vegetables 16.0 17.5 1.6 2.0 0.7 1.1 1.8
Live animals 5.1 6.3 0.1 0.1 0.1 0.1 0.1
Bovine meat 42.8 42.4 88.1 42.8 2.3 0.0 0.0
Butter and butter oil 95.0 69.1 2.6 0.1 10.4 1.5 0.0
Poultry meat 129.2 137.3 98.8 108.0 71.1 0.0 0.0
Eggs 5.9 5.4 7.3 4.4 3.0 2.8 0.0
Table 5. Main product categories receiving export subsidies (USD million)
Source: Calculations based on information from the WTO Secretariat compiling WTO Members' notifications. Exchange rates from the IMF’s international financial statistics
0
1000
2000
3000
4000
1312111009080706050403020100
USD million
EU
Others
Canada, Norway and Switzerland

Spe
cial fe
atu
res
73FOOD OUTLOOKOCTOBER 2016
SIGNIFICANCE OF THE DECISION FOR AGRICULTURAL COMMODITY MARKETS
Given that the use of export subsidies has already declined
substantially over the last decade, the Nairobi Decision is
not expected to result in a substantial additional reduction
in the amount of export subsidies worldwide, at least
until the expiration of the derogation for developed and
developing countries.
Nonetheless, the Decision plays an important role in
preventing an expansion in the use of export subsidies to
stimulate exports and, by setting clear deadlines for their
elimination, in reducing market uncertainty. However, given
the current climate of relatively low international prices,
which coincides with a period when some middle-income
countries are expanding their budgets for agricultural
support, export subsidies could again become an attractive
option for the countries holding entitlements for their use.
A number of emerging economies provide support to
promote agricultural production. In fact, the level of farm
support, as measured by OECD’s Producer Support Estimate
(PSE), has been growing in some of the emerging economies,
reaching the level of support in OECD countries, raising
concerns over its possible effects on other, less developed,
trading partners (OECD, 2016). In the case of over production
and surplus availability, the Nairobi Decision would preclude
them from using export subsidies. In this context, the
extension of Article 9.4 allowing developing countries to
cover or subsidize the costs of marketing and transportation is
a notable element of the Decision, considering the increasing
significance of some developing countries as exporters of
agricultural commodities. Although the WTO Agreement on
Agriculture foresaw that Article 9.4 would only apply until
2004, several WTO developing country members continued
to subsidize marketing and transport costs after this date
(Diaz-Bonilla and Hepburn, 2016), giving rise to considerable
discussions in the WTO Committee on Agriculture regarding
their compliance with WTO rules. The Nairobi Decision seems
to cover transportation and marketing subsidies granted from
2004 to 2015, and not only those that will be granted after
the endorsement of the Decision.7
Abrupt currency fluctuations can also create conditions
to use export subsidies. For example, the strong
appreciation of the Swiss franc against the Euro in 2015
triggered Switzerland’s policy response in the form of an
export subsidy to processed products. But consistent with
the Nairobi Decision, the Swiss Government has recently
initiated the process to replace, by 2020, the export
7 Paragraph 8 of the Decision reads as following: “Developing country Members shall continue to benefit from the provisions of Article 9.4 of the Agreement on Agriculture until the end of 2023 … …”
subsidies scheme on processed products (the so-called “loi
chocolatière”) with a series of measures to support value-
addition in the production of foodstuffs and to strengthen
the competitiveness of the agribusiness sector.8
CONCLUSIONS
While entitled WTO members, in particular the EU, have
limited the use of export subsidies for agricultural products
in recent years, the 2015 Nairobi Decision is important, as
it confirms the commitment of members to refrain from
using them and sets clear deadlines for their elimination.
Thus, although the Decision may not result in a noticeable
reduction in their use, given their already low levels, it
will considerably diminish market uncertainties about a
possible recourse to the instrument in the future. This is
particularly critical considering the likely continuing long-
term downward trend in real agricultural prices, which, in
absence of this Decision, could induce some countries to
use export subsidies. Also notable, as mentioned above, is
the provision in the Decision allowing developing country
members to subsidize transport and marketing costs until
established dates, in particular given the growing role of
some emerging economies as exporters of agricultural
products.
REFERENCE LIST
Diaz-Bonilla, Eugenio & Hepburn, Jonathan. 2016. Export competition issues after Nairobi. In “Evaluating
Nairobi: What does the outcome mean for trade in
food and farm goods?” International Centre for Trade
and Sustainable Development, Geneva, Switzerland.
http://www.ictsd.org/sites/default/files/research/
Evaluating%20Nairobi%20-%20What%20Does%20
the%20Outcome%20Mean%20for%20Trade%20
in%20Food%20and%20Farm%20Goods.pdf
OECD/FAO (2016). OECD-FAO Agricultural Outlook 2016-2025, OECD Publishing, Paris. http://dx.doi.
org/10.1787/agr_outlook-2016-en
OECD (2016), Agricultural Policy Monitoring and Evaluation 2016, OECD Publishing, Paris.
WTO (2015). MC10 Ministerial Decision; 19 December
2015; WT/MIN(15)/45 — WT/L/980, https://www.wto.
org/ english/thewto_e/minist_e/mc10_e/l980_e.htm
8 https://www.seco.admin.ch/seco/fr/home/seco/nsb-news.msg-id-62445.html
74 75
MA
JOR
POLI
CY
DEV
ELO
PMEN
TS
MAR
KET
POLIC
Y
DEVE
LOPM
ENTS

Ma
jor p
olicy d
eve
lop
me
nts
74 75FOOD OUTLOOKOCTOBER 2016
GRA
INS:
M
AJO
R PO
LICY
DEV
ELO
PMEN
TS M
ID-M
AY
TO
MID
-SEP
TEM
BER
2016
*
CO
UN
TRY
PRO
DU
CT
DA
TEPO
LIC
Y C
ATE
GO
RY
/INST
RU
MEN
TD
ESC
RIP
TIO
N
Arg
enti
na
Gra
ins
Jun
-16
Tran
spo
rt m
easu
res
Incr
ease
d t
ran
spo
rt p
rice
s fo
r ce
real
s, o
ilsee
ds
and
res
pec
tive
su
b p
rod
uct
s b
y 23
.25
per
cen
t, d
ue
to
incr
ease
d o
per
atin
g c
ost
s, e
spec
ially
fo
r fu
el.
Au
stra
liaW
hea
tJu
n-1
6Em
erg
ency
per
mit
Issu
ed a
n e
mer
gen
cy p
erm
it t
o a
uth
ori
ze t
he
use
of
AG
VET
ch
emic
als
pro
du
cts
for
con
tro
l of
the
Ru
ssia
n w
hea
t ap
hid
(p
est)
wh
ich
has
sp
read
fro
m S
ou
th A
ust
ralia
into
wes
tern
Vic
tori
a.
Mai
zeJu
n-1
6Im
po
rt p
olic
yR
evo
ked
imp
ort
per
mit
fo
r m
aize
gri
ts g
row
n a
nd
pro
du
ced
in N
ew Z
eala
nd
fo
r in
du
stri
al p
roce
ssin
g.
Aze
rbai
jan
Wh
eat
Jun
-16
Go
vern
men
t p
rocu
rem
ent
Exte
nd
ed t
he
term
of
hig
h q
ual
ity
wh
eat
pro
cure
men
t to
1 N
ove
mb
er 2
016.
In a
dd
itio
n, t
he
pri
ce o
f h
igh
qu
alit
y w
hea
t p
aid
to
loca
l far
mer
s w
as r
aise
d f
rom
AZN
250
(U
SD 4
07.5
) to
AZN
270
(U
SD 4
40)
per
to
nn
e.
Sep
-16
Incr
ease
d t
he
pri
ce o
f h
igh
qu
alit
y w
hea
t p
aid
to
loca
l far
mer
s fr
om
AZN
270
(U
SD 4
40)
to A
ZN 2
80
(USD
458
) p
er t
on
ne.
Ban
gla
des
hW
hea
tJu
n-1
6G
ove
rnm
ent
pro
cure
men
tSu
spen
ded
Op
en M
arke
t Sa
le P
rog
ram
me.
Bra
zil
Mai
ze
May
-16
Go
vern
men
t p
rocu
rem
ent
Incr
ease
d t
he
min
imu
m s
up
po
rt p
rice
fo
r th
e 20
16 w
hea
t cr
op
. In
th
e So
uth
Reg
ion
, wh
ich
is t
he
cou
ntr
y’s
mai
n p
rod
uci
ng
are
a, t
he
pri
ce w
as r
aise
d b
y 10
.5 p
erce
nt
to B
RL
38.6
5 p
er 6
0 kg
bag
(U
SD
186
per
to
nn
e).
Jun
-16
Sto
ck r
elea
seA
uct
ion
ed 5
00 0
00 t
on
nes
of
mai
ze f
rom
pu
blic
sto
cks
to m
eet
do
mes
tic
feed
dem
and
by
pig
an
d
po
ult
ry f
arm
ers.
Jul-
16Pr
ice
sup
po
rtIn
crea
sed
th
e 20
16/2
017
mai
ze m
inim
um
su
pp
ort
pri
ce b
y 22
per
cen
t, t
o B
RL
16.5
0 p
er 5
0 kg
bag
(U
SD
99 p
er t
on
ne)
.
Jul-
16G
ove
rnm
ent
pro
cure
men
tIn
crea
sed
th
e m
aize
pro
cure
men
t lim
it p
er b
enefi
ciar
y/m
on
th, u
nd
er t
he
Pro
gra
mm
e D
esk
Sale
s (P
rog
ram
a V
end
a B
alca
o),
fro
m 6
to
14
ton
nes
in t
he
Mid
wes
t, S
ou
thea
st a
nd
So
uth
ern
reg
ion
s, a
nd
fr
om
6 t
o 1
0 to
nn
es in
th
e N
ort
h a
nd
No
rth
east
.
Sep
-16
Sto
ck r
elea
seA
uct
ion
ed a
dd
itio
nal
50
000
ton
nes
of
mai
ze f
rom
its
stat
e re
serv
es.
Can
ada
Wh
eat
Jul-
16Pr
od
uct
ion
Intr
od
uce
d, f
rom
1 A
ug
ust
201
6, t
wo
new
wh
eat
clas
ses
and
elim
inat
ed t
hre
e, t
o m
ain
tain
th
e q
ual
ity
and
imp
rove
th
e co
nsi
sten
cy o
f th
e C
anad
ian
wh
eat
clas
ses
syst
em. T
he
new
cla
sses
are
Can
adia
n
No
rth
ern
Har
d R
ed (
NH
R)
and
Can
ada
Wes
tern
Sp
ecia
l Pu
rpo
se (
CW
SP);
th
e el
imin
ated
cla
sses
are
C
anad
a W
este
rn In
teri
m W
hea
t (C
WIW
), C
anad
a W
este
rn G
ener
al P
urp
ose
(C
WG
P) a
nd
Can
ada
Wes
tern
Fe
ed (
CW
F).
Gra
ins
Au
g-1
6Tr
ansp
ort
mea
sure
sEx
ten
ded
th
e Fa
ir R
ail f
or
Gra
in F
arm
ers
Act
(B
ill C
-30)
un
til 1
Au
gu
st 2
017.
Th
e re
leva
nt
pro
visi
on
s,
inte
r al
ia, g
ran
t th
e g
ove
rnm
ent
the
rig
ht
to s
et t
he
volu
me
of
gra
ins
to b
e tr
ansp
ort
ed b
y ra
ilway
co
mp
anie
s an
d t
o im
po
se fi
nes
on
un
der
per
form
ers.
Ch
ina
Wh
eat
May
-16
Foo
d s
ecu
rity
Esta
blis
hed
a c
ou
nci
l of
exp
erts
on
nat
ion
al f
oo
d s
ecu
rity
to
see
k ex
per
t ad
vice
on
way
s to
red
uce
th
e co
un
try’
s la
rge
gra
in s
urp
luse
s.
Mai
zeJu
n-1
6G
ove
rnm
ent
pro
cure
men
tC
ance
lled
pu
rch
ases
of
mai
ze f
or
tem
po
rary
sto
rag
e.
Wh
eat
Jun
-16
Go
vern
men
t p
rocu
rem
ent
Imp
lem
ente
d m
inim
um
su
pp
ort
pri
ce o
f Yu
an 2
360
(U
SD 3
55)
per
to
nn
e in
maj
or
wh
eat
pro
du
cin
g
pro
vin
ces
of
Heb
ei a
nd
Sh
and
on
g f
rom
30
Jun
e 20
16.
Mai
ze
Au
g-1
6Pr
od
uct
ion
su
bsi
die
sA
nn
ou
nce
d t
he
rele
ase
of
the
firs
t ro
un
d o
f su
bsi
die
s fo
r m
aize
far
mer
s in
fo
ur
pro
vin
ces,
am
ou
nti
ng
to
ap
pro
xim
atel
y U
SD 4
.51
bill
ion
fo
r 20
17.
Au
g-1
6Pr
od
uct
ion
su
pp
ort
An
no
un
ced
, th
rou
gh
its
late
st 5
-yea
r Pl
an f
or
Scie
nce
an
d T
ech
no
log
y, r
enew
ed e
ffo
rts
to in
crea
se t
he
effi
cien
cy o
f p
rod
uct
ion
by
allo
win
g f
arm
ers
to g
row
GM
O c
rop
s o
f so
ybea
ns
and
mai
ze.
Au
g-1
6Ex
po
rt t
arif
fA
gre
ed t
o r
ein
tro
du
ce t
he
valu
e-ad
ded
tax
(V
AT)
on
exp
ort
s o
f m
aize
pro
cess
ed p
rod
uct
s, s
uch
as
star
ch
and
alc
oh
ol.
The
VA
T is
set
at
13 p
erce
nt
and
will
be
effe
ctiv
e fr
om
Sep
tem
ber
201
6.
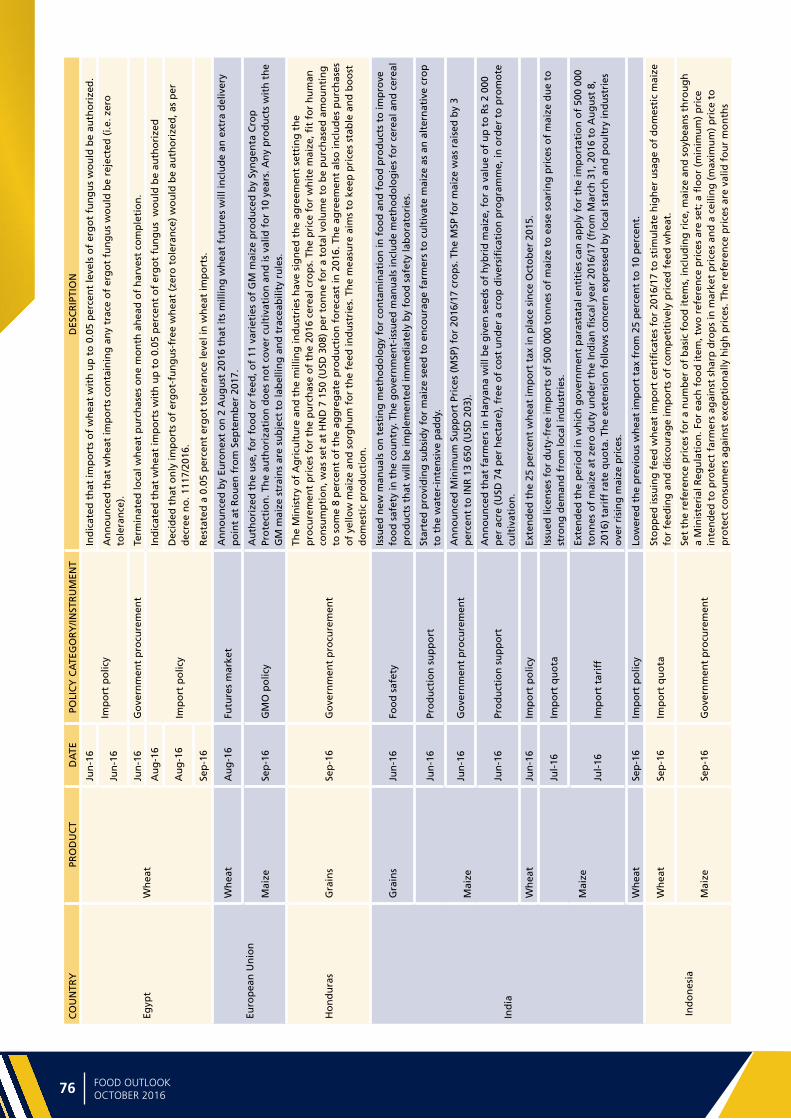
Ma
jor
po
licy
de
velo
pm
en
ts
76 77FOOD OUTLOOKOCTOBER 2016
CO
UN
TRY
PRO
DU
CT
DA
TEPO
LIC
Y C
ATE
GO
RY
/INST
RU
MEN
TD
ESC
RIP
TIO
N
Egyp
tW
hea
t
Jun
-16
Imp
ort
po
licy
Ind
icat
ed t
hat
imp
ort
s o
f w
hea
t w
ith
up
to
0.0
5 p
erce
nt
leve
ls o
f er
go
t fu
ng
us
wo
uld
be
auth
ori
zed
.
Jun
-16
An
no
un
ced
th
at w
hea
t im
po
rts
con
tain
ing
an
y tr
ace
of
erg
ot
fun
gu
s w
ou
ld b
e re
ject
ed (
i.e. z
ero
to
lera
nce
).
Jun
-16
Go
vern
men
t p
rocu
rem
ent
Term
inat
ed lo
cal w
hea
t p
urc
has
es o
ne
mo
nth
ah
ead
of
har
vest
co
mp
leti
on
.
Au
g-1
6
Imp
ort
po
licy
Ind
icat
ed t
hat
wh
eat
imp
ort
s w
ith
up
to
0.0
5 p
erce
nt
of
erg
ot
fun
gu
s w
ou
ld b
e au
tho
rize
d
Au
g-1
6D
ecid
ed t
hat
on
ly im
po
rts
of
erg
ot-
fun
gu
s-fr
ee w
hea
t (z
ero
to
lera
nce
) w
ou
ld b
e au
tho
rize
d, a
s p
er
dec
ree
no
. 111
7/20
16.
Sep
-16
Res
tate
d a
0.0
5 p
erce
nt
erg
ot
tole
ran
ce le
vel i
n w
hea
t im
po
rts.
Euro
pea
n U
nio
n
Wh
eat
Au
g-1
6Fu
ture
s m
arke
tA
nn
ou
nce
d b
y Eu
ron
ext
on
2 A
ug
ust
201
6 th
at it
s m
illin
g w
hea
t fu
ture
s w
ill in
clu
de
an e
xtra
del
iver
y p
oin
t at
Ro
uen
fro
m S
epte
mb
er 2
017.
Mai
zeSe
p-1
6G
MO
po
licy
Au
tho
rize
d t
he
use
, fo
r fo
od
or
feed
, of
11 v
arie
ties
of
GM
mai
ze p
rod
uce
d b
y Sy
ng
enta
Cro
p
Pro
tect
ion
. Th
e au
tho
riza
tio
n d
oes
no
t co
ver
cult
ivat
ion
an
d is
val
id f
or
10 y
ears
. An
y p
rod
uct
s w
ith
th
e G
M m
aize
str
ain
s ar
e su
bje
ct t
o la
bel
ling
an
d t
race
abili
ty r
ule
s.
Ho
nd
ura
sG
rain
sSe
p-1
6G
ove
rnm
ent
pro
cure
men
t
The
Min
istr
y o
f A
gri
cult
ure
an
d t
he
mill
ing
ind
ust
ries
hav
e si
gn
ed t
he
agre
emen
t se
ttin
g t
he
pro
cure
men
t p
rice
s fo
r th
e p
urc
has
e o
f th
e 20
16 c
erea
l cro
ps.
Th
e p
rice
fo
r w
hit
e m
aize
, fit
for
hu
man
co
nsu
mp
tio
n, w
as s
et a
t H
ND
7 1
50 (
USD
308
) p
er t
on
ne
for
a to
tal v
olu
me
to b
e p
urc
has
ed a
mo
un
tin
g
to s
om
e 8
per
cen
t o
f th
e ag
gre
gat
e p
rod
uct
ion
fo
reca
st in
201
6. T
he
agre
emen
t al
so in
clu
des
pu
rch
ases
o
f ye
llow
mai
ze a
nd
so
rgh
um
fo
r th
e fe
ed in
du
stri
es. T
he
mea
sure
aim
s to
kee
p p
rice
s st
able
an
d b
oo
st
do
mes
tic
pro
du
ctio
n.
Ind
ia
Gra
ins
Jun
-16
Foo
d s
afet
yIs
sued
new
man
ual
s o
n t
esti
ng
met
ho
do
log
y fo
r co
nta
min
atio
n in
fo
od
an
d f
oo
d p
rod
uct
s to
imp
rove
fo
od
saf
ety
in t
he
cou
ntr
y. T
he
go
vern
men
t-is
sued
man
ual
s in
clu
de
met
ho
do
log
ies
for
cere
al a
nd
cer
eal
pro
du
cts
that
will
be
imp
lem
ente
d im
med
iate
ly b
y fo
od
saf
ety
lab
ora
tori
es.
Mai
ze
Jun
-16
Pro
du
ctio
n s
up
po
rtSt
arte
d p
rovi
din
g s
ub
sid
y fo
r m
aize
see
d t
o e
nco
ura
ge
farm
ers
to c
ult
ivat
e m
aize
as
an a
lter
nat
ive
cro
p
to t
he
wat
er-i
nte
nsi
ve p
add
y.
Jun
-16
Go
vern
men
t p
rocu
rem
ent
An
no
un
ced
Min
imu
m S
up
po
rt P
rice
s (M
SP)
for
2016
/17
cro
ps.
Th
e M
SP f
or
mai
ze w
as r
aise
d b
y 3
per
cen
t to
INR
13
650
(USD
203
).
Jun
-16
Pro
du
ctio
n s
up
po
rtA
nn
ou
nce
d t
hat
far
mer
s in
Har
yan
a w
ill b
e g
iven
see
ds
of
hyb
rid
mai
ze, f
or
a va
lue
of
up
to
Rs
2 00
0 p
er a
cre
(USD
74
per
hec
tare
), f
ree
of
cost
un
der
a c
rop
div
ersi
fica
tio
n p
rog
ram
me,
in o
rder
to
pro
mo
te
cult
ivat
ion
.
Wh
eat
Jun
-16
Imp
ort
po
licy
Exte
nd
ed t
he
25 p
erce
nt
wh
eat
imp
ort
tax
in p
lace
sin
ce O
cto
ber
201
5.
Mai
ze
Jul-
16Im
po
rt q
uo
taIs
sued
lice
nse
s fo
r d
uty
-fre
e im
po
rts
of
500
000
ton
nes
of
mai
ze t
o e
ase
soar
ing
pri
ces
of
mai
ze d
ue
to
stro
ng
dem
and
fro
m lo
cal i
nd
ust
ries
.
Jul-
16Im
po
rt t
arif
f
Exte
nd
ed t
he
per
iod
in w
hic
h g
ove
rnm
ent
par
asta
tal e
nti
ties
can
ap
ply
fo
r th
e im
po
rtat
ion
of
500
000
ton
nes
of
mai
ze a
t ze
ro d
uty
un
der
th
e In
dia
n fi
scal
yea
r 20
16/1
7 (f
rom
Mar
ch 3
1, 2
016
to A
ug
ust
8,
2016
) ta
riff
rat
e q
uo
ta. T
he
exte
nsi
on
fo
llow
s co
nce
rn e
xpre
ssed
by
loca
l sta
rch
an
d p
ou
ltry
ind
ust
ries
o
ver
risi
ng
mai
ze p
rice
s.
Wh
eat
Sep
-16
Imp
ort
po
licy
Low
ered
th
e p
revi
ou
s w
hea
t im
po
rt t
ax f
rom
25
per
cen
t to
10
per
cen
t.
Ind
on
esia
Wh
eat
Sep
-16
Imp
ort
qu
ota
Sto
pp
ed is
suin
g f
eed
wh
eat
imp
ort
cer
tifi
cate
s fo
r 20
16/1
7 to
sti
mu
late
hig
her
usa
ge
of
do
mes
tic
mai
ze
for
feed
ing
an
d d
isco
ura
ge
imp
ort
s o
f co
mp
etit
ivel
y p
rice
d f
eed
wh
eat.
Mai
zeSe
p-1
6G
ove
rnm
ent
pro
cure
men
t
Set
the
refe
ren
ce p
rice
s fo
r a
nu
mb
er o
f b
asic
fo
od
item
s, in
clu
din
g r
ice,
mai
ze a
nd
so
ybea
ns
thro
ug
h
a M
inis
teri
al R
egu
lati
on
. Fo
r ea
ch f
oo
d it
em, t
wo
ref
eren
ce p
rice
s ar
e se
t; a
flo
or
(min
imu
m)
pri
ce
inte
nd
ed t
o p
rote
ct f
arm
ers
agai
nst
sh
arp
dro
ps
in m
arke
t p
rice
s an
d a
cei
ling
(m
axim
um
) p
rice
to
p
rote
ct c
on
sum
ers
agai
nst
exc
epti
on
ally
hig
h p
rice
s. T
he
refe
ren
ce p
rice
s ar
e va
lid f
ou
r m
on
ths

Ma
jor p
olicy d
eve
lop
me
nts
76 77FOOD OUTLOOKOCTOBER 2016
CO
UN
TRY
PRO
DU
CT
DA
TEPO
LIC
Y C
ATE
GO
RY
/INST
RU
MEN
TD
ESC
RIP
TIO
N
Jap
anW
hea
tJu
l-16
Imp
ort
ban
Tem
po
rari
ly s
usp
end
ed n
ew im
po
rts
of
Wes
tern
Wh
ite
Wh
eat
follo
win
g r
epo
rts
that
th
e A
nim
al a
nd
Pl
ant
Hea
lth
Insp
ecti
on
Ser
vice
(A
PHIS
) o
f th
e U
.S. D
epar
tmen
t o
f A
gri
cult
ure
(U
SDA
) w
as in
vest
igat
ing
22
bio
eng
inee
red
wh
eat
pla
nts
fo
un
d in
a fi
eld
in W
ash
ing
ton
Sta
te.
Sep
-16
End
ed t
he
tem
po
rary
su
spen
sio
n o
f w
hit
e w
hea
t im
po
rts
of
US
Wes
tern
Wh
ite
wh
eat.
Leb
ano
nW
hea
tJu
l-16
Imp
ort
po
licy
Intr
od
uce
d m
ore
str
ing
ent
con
tro
ls o
n s
hip
pin
g a
nd
sto
rag
e fa
cilit
ies,
fo
llow
ing
th
e Pu
blic
Hea
lth
M
inis
try’
s d
isco
very
of
carc
ino
gen
in w
hea
t im
po
rt s
amp
les.
Leso
tho
Mai
zeM
ay-1
6Fo
od
An
no
un
ced
it w
ill s
ub
sid
ize
con
sum
er p
rice
s o
f m
aize
mea
l, b
ean
s an
d p
uls
es, s
o a
s to
cu
t co
nsu
mer
re
tail
pri
ces
by
30 p
erce
nt
for
on
e ye
ar, s
tart
ing
fro
m 1
Ju
ne
2016
. Th
e g
ove
rnm
ent
has
allo
cate
d o
ver
1 m
illio
n r
and
(U
SD 7
0 74
7) f
or
the
sub
sid
ies,
wit
h t
he
aim
of
easi
ng
acc
ess
to b
asic
fo
od
co
mm
od
itie
s.
Kaz
akh
stan
Gra
ins
Jul-
16Pr
od
uct
ion
su
pp
ort
Rei
nst
itu
ted
per
hec
tare
cro
p s
ub
sid
ies
by
the
Min
istr
y o
f A
gri
cult
ure
, wh
ich
had
bee
n r
epla
ced
in
Jan
uar
y 20
16 b
y in
vest
men
t su
bsi
die
s.
Wh
eat
Au
g-1
6B
ilate
ral a
gre
emen
tIn
crea
sed
th
e lis
t o
f ex
po
rted
ag
ricu
ltu
ral p
rod
uct
s to
Ch
ina,
wh
ich
incl
ud
es w
hea
t an
d o
ther
typ
es o
f ce
real
s. K
azak
hst
an a
ims
to in
crea
se t
he
qu
ota
s fo
r th
e su
pp
ly o
f w
hea
t to
Ch
ina
fro
m 6
0 00
0 to
nn
es t
o
400
000
ton
nes
per
yea
r.
Gra
ins
Sep
-16
Pro
cure
men
t p
rice
An
no
un
ced
th
e n
ew p
rocu
rem
ent
pri
ces
for
2016
gra
ins.
Wh
eat
3rd
gra
de
will
be
pro
cure
d a
t a
pri
ce
ran
gin
g f
rom
KZT
41
000
(USD
120
) to
KZT
50
000
(USD
146
), w
hile
in 2
015
it w
as p
urc
has
ed a
t K
ZT 4
1 00
0 (U
SD 1
20)
per
to
nn
e. P
rice
fo
r w
hea
t 4t
h g
rad
e w
ill r
ang
e fr
om
KZT
34
000
(USD
99)
to
KZT
36
000
(USD
105
) p
er t
on
ne,
ag
ain
st K
ZT 3
1 00
0 (U
SD 9
1) p
er t
on
ne
in 2
015,
wh
ile t
he
pri
ce f
or
bar
ley
2nd
g
rad
e re
mai
ned
un
chan
ged
fro
m la
st y
ear
at K
ZT 2
5 00
0 (U
SD 7
3). A
ll p
rice
s ar
e in
clu
sive
of
VA
T.
Mo
rocc
oW
hea
tJu
n-1
6Im
po
rt d
uty
Rai
sed
so
ft w
hea
t im
po
rt c
ust
om
du
ty f
rom
30
per
cen
t to
65
per
cen
t. T
he
mea
sure
aim
s to
sta
bili
ze
do
mes
tic
pri
ces
at D
irh
am 2
800
– 2
850
(U
SD 2
90.8
5 –
USD
296
.04)
.
Nig
eria
Mai
zeM
ay-1
6Pr
od
uct
ion
su
pp
ort
An
no
un
ced
th
e Fe
der
al M
inis
try
of
Ag
ricu
ltu
re a
nd
Ru
ral D
evel
op
men
t (F
MA
RD
) w
ill d
istr
ibu
te 7
500
to
nn
es o
f m
aize
to
po
ult
ry f
arm
ers
acro
ss t
he
cou
ntr
y.
Paki
stan
Wh
eat
Au
g-1
6Im
po
rt t
arif
fIn
crea
sed
reg
ula
tory
du
ty o
n w
hea
t im
po
rts
fro
m 4
0 p
erce
nt
to 6
0 p
erce
nt.
Th
e d
uty
was
alr
ead
y in
crea
sed
in J
un
e 20
15 f
rom
its
pre
vio
us
leve
l of
25 p
erce
nt.
Th
e m
easu
re a
ims
to d
isco
ura
ge
wh
eat
imp
ort
s an
d p
rote
ct lo
cal f
arm
ers
fro
m lo
wer
wh
eat
pri
ces
in in
tern
atio
nal
mar
kets
.
Wh
eat
Sep
-16
Go
vern
men
t p
rocu
rem
ent
The
Paki
stan
Flo
ur
Mill
s A
sso
ciat
ion
(PF
MA
) in
crea
sed
flo
ur
pri
ce b
y R
s20
per
20
kg b
ag (
USD
0.7
6 p
er
ton
ne)
.
Ru
ssia
n F
ed.
Feed
ing
red
ien
tsA
ug
-16
Imp
ort
ban
Intr
od
uce
d t
emp
ora
ry r
estr
icti
on
s o
n im
po
rts
of
fora
ges
an
d f
eed
ad
dit
ives
fro
m U
krai
ne.
Gra
ins
Au
g-1
6G
ove
rnm
ent
mar
ket
inte
rven
tio
nC
om
men
ced
sta
te p
urc
has
ing
inte
rven
tio
ns
for
2016
gra
in c
rop
s, in
clu
din
g w
hea
t, r
ye, b
arle
y an
d
mai
ze.
Go
vern
men
t p
lan
s to
pu
rch
ase
up
to
1 m
illio
n t
on
nes
of
gra
ins
by
the
end
of
2016
, an
d u
p t
o 2
m
illio
n t
on
nes
in t
he
2016
/17
mar
keti
ng
yea
r (J
uly
/Ju
ne)
.
Wh
eat
Au
g-1
6
Exp
ort
du
ty
Ab
olis
hed
th
e ex
po
rt d
uty
on
wh
eat
un
til J
uly
201
8.
Sep
-16
Offi
cial
y m
ade
pu
blic
th
e d
ecis
ion
to
ab
olis
h t
he
exp
ort
du
ties
on
wh
eat:
res
olu
tio
n #
966
dd
. Se
pte
mb
er 2
6, 2
016.
Acc
ord
ing
to
th
e si
gn
ed r
eso
luti
on
, th
e ze
ro r
ate
for
the
exp
ort
du
ty o
n g
rain
has
b
een
set
un
til J
uly
201
8.
Sou
th A
fric
aW
hea
tA
ug
-16
Imp
ort
du
tyR
aise
d im
po
rt d
uty
on
wh
eat
by
30 p
erce
nt
fro
m R
1 2
24.4
1 (U
SD 8
2) p
er t
on
ne
to R
1 5
19.4
0 (U
SD
102.
6) p
er t
on
ne.

Ma
jor
po
licy
de
velo
pm
en
ts
78 79FOOD OUTLOOKOCTOBER 2016
CO
UN
TRY
PRO
DU
CT
DA
TEPO
LIC
Y C
ATE
GO
RY
/INST
RU
MEN
TD
ESC
RIP
TIO
N
Ko
rea,
Rep
. of
Wh
eat
Jul-
16
Imp
ort
ban
Susp
end
ed, t
emp
ora
rily
, new
pu
rch
ases
of
Wes
tern
Wh
ite
Wh
eat
follo
win
g r
epo
rts
that
th
e U
.S.
Dep
artm
ent
of
Ag
ricu
ltu
re (
USD
A)
An
imal
an
d P
lan
t H
ealt
h In
spec
tio
n S
ervi
ce (
APH
IS)
was
inve
stig
atin
g
22 b
ioen
gin
eere
d w
hea
t p
lan
ts f
ou
nd
in a
fiel
d in
Was
hin
gto
n S
tate
.
Au
g-1
6En
ded
th
e te
mp
ora
ry im
po
rt b
an o
n w
hea
t an
d fl
ou
r fr
om
Was
hin
gto
n S
tate
aft
er t
esti
ng
of
wh
eat
imp
ort
s fr
om
th
e U
nit
ed S
tate
s d
id n
ot
det
ect
any
gen
etic
ally
mo
difi
ed w
hea
t.
Syri
aW
hea
tJu
n-1
6G
ove
rnm
ent
pro
cure
men
tR
aise
d d
om
esti
c w
hea
t p
rice
by
67 p
erce
nt,
to
SY
P 10
0 p
er k
g (
USD
455
per
to
nn
e).
Ukr
ain
e
Wh
eat
Au
g-1
6B
ilate
ral a
gre
emen
tSi
gn
ed a
n a
gri
cult
ure
co
op
erat
ion
ag
reem
ent
wit
h In
do
nes
ia, t
o in
vest
in w
hea
t p
rod
uct
ion
in
Ind
on
esia
.
Bar
ley,
mai
zeA
ug
-16
Exp
ort
ban
Ban
ned
exp
ort
of
pro
du
cts
fro
m f
arm
ers
wh
ose
cro
ps
had
bee
n f
ou
nd
to
be
infe
cted
by
the
Stat
e Se
rvic
e fo
r Fo
od
Saf
ety
and
Pro
tect
ion
of
Co
nsu
mer
s o
f U
krai
ne.
Th
e m
ove
fo
llow
s th
e d
etec
tio
n o
f p
ests
, dis
ease
-cau
sin
g o
rgan
ism
s an
d n
emat
od
es in
bar
ley,
so
ybea
n a
nd
mai
ze g
row
n b
y so
me
farm
ers,
w
hic
h v
iola
tes
ph
yto
san
itar
y re
qu
irem
ents
fo
r ex
po
rts
fro
m U
krai
ne
to C
hin
a.
Ven
ezu
ela
Wh
eat
Au
g-1
6G
ove
rnm
ent
mar
ket
inte
rven
tio
nA
nn
ou
nce
d t
hat
24
stat
e-ru
n c
om
pan
ies
will
dis
trib
ute
219
000
to
nn
es o
f im
po
rted
wh
eat
to e
nsu
re
suffi
cien
t su
pp
lies
for
the
pro
du
ctio
n o
f b
read
.
Vie
tnam
Mai
zeSe
p-1
6Pr
od
uct
ion
su
pp
ort
An
no
un
ced
th
at t
he
go
vern
men
t w
ill p
rovi
de
VN
D 3
mill
ion
(U
SD 1
34.5
) fo
r ev
ery
hec
tare
of
lan
d
swit
ched
fro
m r
ice
to m
aize
cu
ltiv
atio
n, i
n o
rder
to
red
uce
mai
ze im
po
rts
and
incr
ease
do
mes
tic
mai
ze
pro
du
ctio
n.
Zam
bia
Mai
ze
Jun
-16
Exp
ort
po
licy
An
no
un
ced
th
at m
aize
exp
ort
s o
f th
e n
ew 2
016
cro
p w
ill o
nly
be
auth
ori
zed
fro
m t
he
end
of
Sep
tem
ber
(m
arke
tin
g y
ear
star
ted
in M
ay)
in o
rder
to
en
sure
do
mes
tic
nee
ds
are
met
.
Jul-
16G
ove
rnm
ent
pro
cure
men
t
Incr
ease
d t
he
mai
ze p
urc
has
ing
pri
ce b
y 13
per
cen
t, f
rom
MW
K 7
5 p
er 5
0 kg
bag
(U
SD 2
per
to
nn
e), s
et
in M
ay, t
o M
WK
85
per
50
kg b
ag (
USD
2.4
per
to
nn
e) f
or
the
2016
/17
mar
keti
ng
yea
r (M
ay/A
pri
l). T
he
adju
stm
ent
was
mad
e to
bet
ter
refl
ect
hig
her
mai
ze in
pu
t p
rice
s, w
hic
h f
arm
ers
hav
e fa
ced
sin
ce t
he
2015
dep
reci
atio
n o
f th
e lo
cal c
urr
ency
.
* A
col
lect
ion
of m
ajor
gra
in p
olic
y de
velo
pmen
ts s
tart
ing
in J
uly
2010
is a
vaila
ble
at: h
ttp:
//ww
w.f
ao.o
rg/e
cono
mic
/est
/est
-com
mod
ities
/com
mod
ity-p
olic
y-ar
chiv
e/en
/?gr
oupA
ND
com
mod
ity=
grai
ns

Ma
jor p
olicy d
eve
lop
me
nts
78 79FOOD OUTLOOKOCTOBER 2016
RICE
: M
AJO
R PO
LICY
DEV
ELO
PMEN
TS M
ID-M
AY
TO
MID
-SEP
TEM
BER
2016
*
CO
UN
TRY
DA
TEPO
LIC
Y C
ATE
GO
RY
/INST
RU
MEN
TD
ESC
RIP
TIO
N
Ban
gla
des
h
Jun
-16
Foo
d s
ub
sid
ies
Set
a ta
rget
to
rai
se f
oo
dg
rain
dis
trib
uti
on
by
7 p
erce
nt
to 2
.97
mill
ion
to
nn
es, a
s p
art
of
its
2016
/201
7 b
ud
get
ary
allo
cati
on
s.
Ou
t o
f th
is v
olu
me,
2.0
mill
ion
to
nn
es w
ou
ld b
e in
th
e fo
rm o
f ri
ce, u
p f
rom
a r
evis
ed t
arg
et o
f 1.
6 m
illio
n t
on
nes
fo
r 20
15/2
016.
Jun
-16
Bu
dg
etar
y al
loca
tio
ns,
pro
du
ctio
n
sup
po
rt, G
ove
rnm
ent
pro
cure
men
t
Kep
t al
lotm
ents
fo
r ag
ricu
ltu
ral s
ub
sid
ies
un
chan
ged
at
BD
T 90
bill
ion
(U
SD 1
.1 b
illio
n),
as
par
t o
f it
s 20
16/2
017
bu
dg
etar
y al
loca
tio
ns.
Offi
cial
s w
ill s
eek
to f
acili
tate
cre
dit
, ext
ensi
on
ser
vice
s, r
esea
rch
, pro
du
ctio
n a
nd
dis
trib
uti
on
of
hig
h y
ield
ing
see
ds,
as
wel
l as
pro
mo
te t
he
use
of
org
anic
fer
tiliz
ers
in o
rder
to
su
stai
n p
rod
uct
ivit
y im
pro
vem
ent.
In a
dd
itio
n, t
he
go
vern
men
t w
ou
ld a
im t
o r
aise
do
mes
tic
pro
cure
men
t o
f ri
ce in
201
6/20
17 t
o 1
.85
mill
ion
to
nn
es, u
p f
rom
1.4
3 m
illio
n t
on
nes
fo
r 20
15/1
6.
Jun
-16
Imp
ort
tar
iff
Set
the
go
vern
men
t im
po
rt t
arg
et f
or
the
2016
/201
7 fi
scal
yea
r at
zer
o, a
s p
art
of
its
2016
/201
7 b
ud
get
ary
allo
cati
on
s. In
ad
dit
ion
, im
po
rt d
uti
es o
n h
usk
ed, s
emi/w
ho
lly m
illed
an
d b
roke
n r
ice
wer
e ra
ised
fro
m 2
0 to
25
per
cen
t.
Au
g-1
6G
ove
rnm
ent
pro
cure
men
t,
pu
rch
asin
g p
rice
s
Exte
nd
ed t
he
2016
Bo
ro p
rocu
rem
ent
targ
et b
y an
ad
dit
ion
al 2
50 0
00 t
on
nes
, to
a t
ota
l of
700
000
ton
nes
of
pad
dy
and
850
000
to
nn
es o
f m
illed
ric
e. S
up
plie
s ar
e to
be
pu
rch
ased
by
30 S
epte
mb
er 2
016,
at
a p
rice
of
BD
T 23
per
kg
(U
SD 2
87 p
er t
on
ne)
fo
r p
add
y an
d B
DT
32 p
er k
g (
USD
400
per
to
nn
e) f
or
rice
.
Sep
-16
Foo
d s
ub
sid
ies
Lau
nch
ed t
he
“Fo
od
-fri
end
ly P
rog
ram
me”
, un
der
wh
ich
th
e g
ove
rnm
ent
will
pro
vid
e 5.
0 m
illio
n u
ltra
-po
or
fam
ilies
wit
h 3
0 kg
o
f ri
ce p
er m
on
th f
or
a p
erio
d o
f fi
ve m
on
ths
(Sep
tem
ber
-No
vem
ber
an
d M
arch
-Ap
ril)
, at
a su
bsi
diz
ed p
rice
of
BD
T 10
(U
SD 0
.1)
per
kg
.
Bra
zil
Jul-
16M
inim
um
su
pp
ort
pri
ces
Ad
just
ed m
inim
um
su
pp
ort
pri
ces
(MSP
s) f
or
the
2017
/18
seas
on
(20
16/1
7 fo
r B
razi
l) t
o b
e ef
fect
ive
fro
m F
ebru
ary
2017
to
Ja
nu
ary
2018
. In
th
e ca
se o
f fi
ne
lon
g g
rain
pad
dy,
th
ese
wer
e ra
ised
by
18 p
erce
nt
to B
RL
699.
4 (U
SD 2
11)
per
to
nn
e fo
r th
e So
uth
reg
ion
(ex
cep
t Pa
ran
á) a
nd
by
18 p
erce
nt
to B
RL
699.
5 (U
SD 2
11)
for
all o
ther
reg
ion
s. T
he
MSP
s fo
r lo
ng
-gra
in p
add
y w
ere
left
un
chan
ged
at
BR
L 37
8 (U
SD 1
14)
per
to
nn
e fo
r th
e So
uth
reg
ion
(ex
cep
t Pa
ran
á) a
nd
at
BR
L 40
7.5
(USD
123
) p
er t
on
ne
for
the
Sou
thea
st, N
ort
her
n, N
ort
hea
st, a
nd
Cen
tre
Wes
t re
gio
ns
and
th
e st
ate
of
Para
ná.
Sep
-16
Sto
ck r
elea
seSo
ld 2
2 70
0 to
nn
es o
f p
add
y fr
om
sta
te r
eser
ves,
ou
t o
f a
tota
l of
52 9
00 t
on
nes
off
ered
th
rou
gh
fo
ur
auct
ion
s h
eld
in
Sep
tem
ber
201
6.
Cam
bo
dia
Jun
-16
Exp
ort
pro
mo
tio
n, c
red
itA
gre
ed t
o e
xten
d U
SD 2
0–30
bill
ion
wo
rth
of
cred
it t
o h
elp
tra
der
s p
urc
has
e, p
roce
ss a
nd
sto
re p
add
y fo
r ex
po
rt, a
cco
rdin
g t
o
pre
ss r
epo
rts.
Ad
dit
ion
al a
ssis
tan
ce m
easu
res
to t
he
sect
or
wo
uld
rep
ort
edly
incl
ud
e in
crea
sed
bo
rder
su
rvei
llan
ce t
o a
vert
th
e in
flo
w o
f ri
ce a
cro
ss b
ord
ers.
Co
lom
bia
Au
g-1
6Su
pp
ort
pri
ces,
war
eho
use
rec
eip
ts
pro
gra
mm
e, im
po
rt q
uo
ta
Dec
ided
th
at t
he
sto
rag
e in
cen
tive
pro
gra
mm
e w
ou
ld c
ove
r 50
0 00
0 to
nn
es o
f p
add
y h
arve
sted
in t
he
seco
nd
hal
f o
f 20
16. T
he
sch
eme
wo
uld
be
exec
ute
d in
tw
o p
has
es: t
he
firs
t co
veri
ng
up
to
173
000
to
nn
es o
f p
add
y, s
tart
ing
fro
m A
ug
ust
201
6; w
hile
th
e re
mai
nin
g v
olu
me
wo
uld
be
cove
red
su
cces
sive
ly d
epen
din
g o
n a
vaila
ble
fin
anci
al r
eso
urc
es. T
he
pro
gra
mm
e w
ill p
rovi
de
CO
P 28
890
(U
SD 9
.7)
to c
ove
r th
e co
st o
f st
ori
ng
a t
on
ne
of
pad
dy
per
mo
nth
, on
co
nd
itio
n t
hat
th
ese
sup
plie
s b
e p
urc
has
ed a
t re
fere
nce
pri
ces
ran
gin
g f
rom
a m
inim
um
of
CO
P 12
7 00
0 to
a m
axim
um
of
CO
P 15
7 00
0 p
er 1
25 k
g o
f p
add
y (U
SD 3
42-4
22 p
er
ton
ne)
, dep
end
ing
on
th
e va
rio
us
pro
du
cin
g r
egio
ns.
Pu
rch
ases
co
nd
uct
ed u
nd
er t
he
pro
gra
mm
e w
ou
ld a
lso
ser
ve t
o d
eter
min
e p
ote
nti
al r
ice
imp
ort
req
uir
emen
ts a
nd
th
eir
allo
cati
on
am
on
g it
s p
arti
cip
ants
in 2
017
and
201
8.
Co
sta
Ric
aSe
p-1
6C
on
sum
er p
rice
sA
men
ded
cei
ling
/flo
or
pri
ces
of
vari
ou
s ri
ce q
ual
itie
s co
nsu
med
in t
he
cou
ntr
y, e
ffec
tive
6 S
epte
mb
er 2
016.
Acc
ord
ing
to
th
e d
ecis
ion
, th
e p
rice
ban
d o
f th
e w
idel
y co
nsu
med
80–
20 r
ice
wo
uld
be
rep
lace
d b
y fi
xed
ret
ail p
rice
of
CR
C 6
21 (
USD
1.1
) p
er k
g,
rep
rese
nti
ng
a 1
.6 p
erce
nt
red
uct
ion
fro
m t
he
pre
vio
usl
y ap
plic
able
min
imu
m p
rice
.
Ecu
ado
rM
ay-1
6Pr
od
uct
ion
su
pp
ort
, su
pp
ort
pri
ces
Set
pad
dy
pro
du
cer
pri
ces
for
the
2016
sea
son
at
USD
35.
5 p
er 2
00 p
ou
nd
s (U
SD 3
91 p
er t
on
ne)
, up
3 p
erce
nt
fro
m le
vels
ap
plic
able
sin
ce A
pri
l 201
3.
Egyp
t
May
-16
Imp
ort
qu
ota
An
no
un
ced
th
at t
he
Gen
eral
Au
tho
rity
fo
r Su
pp
ly C
om
mo
dit
ies
(GA
SC)
wo
uld
imp
ort
80
000
ton
nes
of
rice
fo
r im
med
iate
d
eliv
ery,
th
rou
gh
dir
ect
con
trac
ts w
ith
su
pp
liers
. Th
e vo
lum
e w
ou
ld s
erve
to
en
sure
su
ffici
ent
loca
l ava
ilab
iliti
es d
uri
ng
R
amad
an.
Au
g-1
6G
ove
rnm
ent
pro
cure
men
tA
nn
ou
nce
d t
hat
it w
ou
ld t
arg
et t
o a
bso
rb 2
.0 m
illio
n t
on
nes
of
do
mes
tic
pad
dy,
un
der
its
2016
pro
cure
men
t ca
mp
aig
n. T
he
dri
ve w
ou
ld o
ffer
far
mer
s EG
P 2
300–
2 40
0 (U
SD 2
59–2
70)
per
to
nn
e o
f p
add
y so
ld.
Au
g-1
6Ex
po
rt b
anD
ecid
ed t
hat
th
e b
an o
n m
illed
ric
e ex
po
rts
wo
uld
rem
ain
in p
lace
an
d t
hat
it w
ou
ld b
e ex
ten
ded
to
all
form
s o
f ri
ce, i
n o
rder
to
en
sure
su
ffici
ent
loca
l ava
ilab
iliti
es a
nd
sta
ble
pri
ces.
Fu
lly b
roke
n r
ice
had
bee
n p
revi
ou
sly
exem
pte
d f
rom
exp
ort
res
tric
tio
ns.
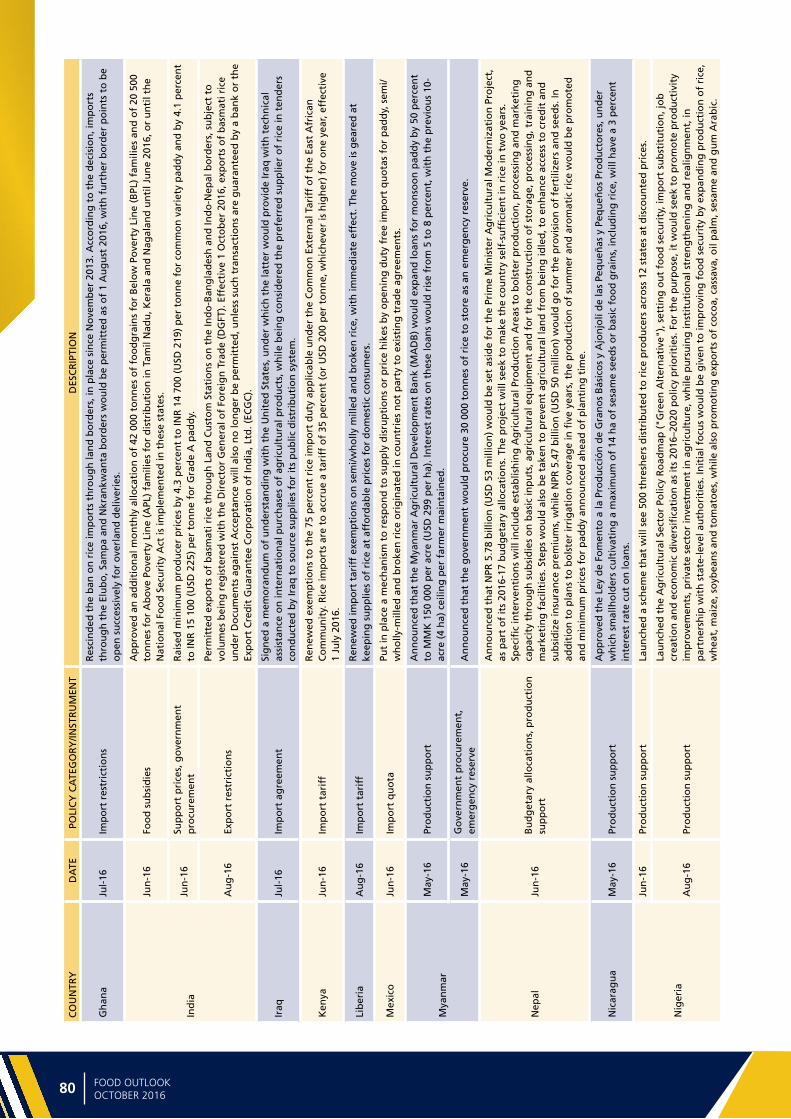
Ma
jor
po
licy
de
velo
pm
en
ts
80 81FOOD OUTLOOKOCTOBER 2016
CO
UN
TRY
DA
TEPO
LIC
Y C
ATE
GO
RY
/INST
RU
MEN
TD
ESC
RIP
TIO
N
Gh
ana
Jul-
16Im
po
rt r
estr
icti
on
sR
esci
nd
ed t
he
ban
on
ric
e im
po
rts
thro
ug
h la
nd
bo
rder
s, in
pla
ce s
ince
No
vem
ber
201
3. A
cco
rdin
g t
o t
he
dec
isio
n, i
mp
ort
s th
rou
gh
th
e El
ub
o, S
amp
a an
d N
kran
kwan
ta b
ord
ers
wo
uld
be
per
mit
ted
as
of
1 A
ug
ust
201
6, w
ith
fu
rth
er b
ord
er p
oin
ts t
o b
e o
pen
su
cces
sive
ly f
or
ove
rlan
d d
eliv
erie
s.
Ind
ia
Jun
-16
Foo
d s
ub
sid
ies
Ap
pro
ved
an
ad
dit
ion
al m
on
thly
allo
cati
on
of
42 0
00 t
on
nes
of
foo
dg
rain
s fo
r B
elo
w P
ove
rty
Lin
e (B
PL)
fam
ilies
an
d o
f 20
500
to
nn
es f
or
Ab
ove
Po
vert
y Li
ne
(APL
) fa
mili
es f
or
dis
trib
uti
on
in T
amil
Nad
u, K
eral
a an
d N
agal
and
un
til J
un
e 20
16, o
r u
nti
l th
e N
atio
nal
Fo
od
Sec
uri
ty A
ct is
imp
lem
ente
d in
th
ese
stat
es.
Jun
-16
Sup
po
rt p
rice
s, g
ove
rnm
ent
pro
cure
men
tR
aise
d m
inim
um
pro
du
cer
pri
ces
by
4.3
per
cen
t to
INR
14
700
(USD
219
) p
er t
on
ne
for
com
mo
n v
arie
ty p
add
y an
d b
y 4.
1 p
erce
nt
to IN
R 1
5 10
0 (U
SD 2
25)
per
to
nn
e fo
r G
rad
e A
pad
dy.
Au
g-1
6Ex
po
rt r
estr
icti
on
s
Perm
itte
d e
xpo
rts
of
bas
mat
i ric
e th
rou
gh
Lan
d C
ust
om
Sta
tio
ns
on
th
e In
do
-Ban
gla
des
h a
nd
Ind
o-N
epal
bo
rder
s, s
ub
ject
to
vo
lum
es b
ein
g r
egis
tere
d w
ith
th
e D
irec
tor
Gen
eral
of
Fore
ign
Tra
de
(DG
FT).
Eff
ecti
ve 1
Oct
ob
er 2
016,
exp
ort
s o
f b
asm
ati r
ice
un
der
Do
cum
ents
ag
ain
st A
ccep
tan
ce w
ill a
lso
no
lon
ger
be
per
mit
ted
, un
less
su
ch t
ran
sact
ion
s ar
e g
uar
ante
ed b
y a
ban
k o
r th
e Ex
po
rt C
red
it G
uar
ante
e C
orp
ora
tio
n o
f In
dia
, Ltd
. (EC
GC
).
Iraq
Jul-
16Im
po
rt a
gre
emen
tSi
gn
ed a
mem
ora
nd
um
of
un
der
stan
din
g w
ith
th
e U
nit
ed S
tate
s, u
nd
er w
hic
h t
he
latt
er w
ou
ld p
rovi
de
Iraq
wit
h t
ech
nic
al
assi
stan
ce o
n in
tern
atio
nal
pu
rch
ases
of
agri
cult
ura
l pro
du
cts,
wh
ile b
ein
g c
on
sid
ered
th
e p
refe
rred
su
pp
lier
of
rice
in t
end
ers
con
du
cted
by
Iraq
to
so
urc
e su
pp
lies
for
its
pu
blic
dis
trib
uti
on
sys
tem
.
Ken
yaJu
n-1
6Im
po
rt t
arif
fR
enew
ed e
xem
pti
on
s to
th
e 75
per
cen
t ri
ce im
po
rt d
uty
ap
plic
able
un
der
th
e C
om
mo
n E
xter
nal
Tar
iff
of
the
East
Afr
ican
C
om
mu
nit
y. R
ice
imp
ort
s ar
e to
acc
rue
a ta
riff
of
35 p
erce
nt
(or
USD
200
per
to
nn
e, w
hic
hev
er is
hig
her
) fo
r o
ne
year
, eff
ecti
ve
1 Ju
ly 2
016.
Lib
eria
Au
g-1
6Im
po
rt t
arif
fR
enew
ed im
po
rt t
arif
f ex
emp
tio
ns
on
sem
i/wh
olly
mill
ed a
nd
bro
ken
ric
e, w
ith
imm
edia
te e
ffec
t. T
he
mo
ve is
gea
red
at
keep
ing
su
pp
lies
of
rice
at
affo
rdab
le p
rice
s fo
r d
om
esti
c co
nsu
mer
s.
Mex
ico
Jun
-16
Imp
ort
qu
ota
Put
in p
lace
a m
ech
anis
m t
o r
esp
on
d t
o s
up
ply
dis
rup
tio
ns
or
pri
ce h
ikes
by
op
enin
g d
uty
fre
e im
po
rt q
uo
tas
for
pad
dy,
sem
i/w
ho
lly-m
illed
an
d b
roke
n r
ice
ori
gin
ated
in c
ou
ntr
ies
no
t p
arty
to
exi
stin
g t
rad
e ag
reem
ents
.
Mya
nm
ar
May
-16
Pro
du
ctio
n s
up
po
rtA
nn
ou
nce
d t
hat
th
e M
yan
mar
Ag
ricu
ltu
ral D
evel
op
men
t B
ank
(MA
DB
) w
ou
ld e
xpan
d lo
ans
for
mo
nso
on
pad
dy
by
50 p
erce
nt
to M
MK
150
000
per
acr
e (U
SD 2
99 p
er h
a). I
nte
rest
rat
es o
n t
hes
e lo
ans
wo
uld
ris
e fr
om
5 t
o 8
per
cen
t, w
ith
th
e p
revi
ou
s 10
-ac
re (
4 h
a) c
eilin
g p
er f
arm
er m
ain
tain
ed.
May
-16
Go
vern
men
t p
rocu
rem
ent,
em
erg
ency
res
erve
An
no
un
ced
th
at t
he
go
vern
men
t w
ou
ld p
rocu
re 3
0 00
0 to
nn
es o
f ri
ce t
o s
tore
as
an e
mer
gen
cy r
eser
ve.
Nep
alJu
n-1
6B
ud
get
ary
allo
cati
on
s, p
rod
uct
ion
su
pp
ort
An
no
un
ced
th
at N
PR 5
.78
bill
ion
(U
SD 5
3 m
illio
n)
wo
uld
be
set
asid
e fo
r th
e Pr
ime
Min
iste
r A
gri
cult
ura
l Mo
der
niz
atio
n P
roje
ct,
as p
art
of
its
2016
-17
bu
dg
etar
y al
loca
tio
ns.
Th
e p
roje
ct w
ill s
eek
to m
ake
the
cou
ntr
y se
lf-s
uffi
cien
t in
ric
e in
tw
o y
ears
. Sp
ecifi
c in
terv
enti
on
s w
ill in
clu
de
esta
blis
hin
g A
gri
cult
ura
l Pro
du
ctio
n A
reas
to
bo
lste
r p
rod
uct
ion
, pro
cess
ing
an
d m
arke
tin
g
cap
acit
y th
rou
gh
su
bsi
die
s o
n b
asic
inp
uts
, ag
ricu
ltu
ral e
qu
ipm
ent
and
fo
r th
e co
nst
ruct
ion
of
sto
rag
e, p
roce
ssin
g, t
rain
ing
an
d
mar
keti
ng
fac
iliti
es. S
tep
s w
ou
ld a
lso
be
take
n t
o p
reve
nt
agri
cult
ura
l lan
d f
rom
bei
ng
idle
d, t
o e
nh
ance
acc
ess
to c
red
it a
nd
su
bsi
diz
e in
sura
nce
pre
miu
ms,
wh
ile N
PR 5
.47
bill
ion
(U
SD 5
0 m
illio
n)
wo
uld
go
fo
r th
e p
rovi
sio
n o
f fe
rtili
zers
an
d s
eed
s. In
ad
dit
ion
to
pla
ns
to b
ols
ter
irri
gat
ion
co
vera
ge
in fi
ve y
ears
, th
e p
rod
uct
ion
of
sum
mer
an
d a
rom
atic
ric
e w
ou
ld b
e p
rom
ote
d
and
min
imu
m p
rice
s fo
r p
add
y an
no
un
ced
ah
ead
of
pla
nti
ng
tim
e.
Nic
arag
ua
May
-16
Pro
du
ctio
n s
up
po
rtA
pp
rove
d t
he
Ley
de
Fom
ento
a la
Pro
du
cció
n d
e G
ran
os
Bás
ico
s y
Ajo
njo
lí d
e la
s Pe
qu
eñas
y P
equ
eño
s Pr
od
uct
ore
s, u
nd
er
wh
ich
sm
allh
old
ers
cult
ivat
ing
a m
axim
um
of
14 h
a o
f se
sam
e se
eds
or
bas
ic f
oo
d g
rain
s, in
clu
din
g r
ice,
will
hav
e a
3 p
erce
nt
inte
rest
rat
e cu
t o
n lo
ans.
Nig
eria
Jun
-16
Pro
du
ctio
n s
up
po
rtLa
un
ched
a s
chem
e th
at w
ill s
ee 5
00 t
hre
sher
s d
istr
ibu
ted
to
ric
e p
rod
uce
rs a
cro
ss 1
2 st
ates
at
dis
cou
nte
d p
rice
s.
Au
g-1
6Pr
od
uct
ion
su
pp
ort
Lau
nch
ed t
he
Ag
ricu
ltu
ral S
ecto
r Po
licy
Ro
adm
ap (
"Gre
en A
lter
nat
ive"
), s
etti
ng
ou
t fo
od
sec
uri
ty, i
mp
ort
su
bst
itu
tio
n, j
ob
cr
eati
on
an
d e
con
om
ic d
iver
sifi
cati
on
as
its
2016
–202
0 p
olic
y p
rio
riti
es. F
or
the
pu
rpo
se, i
t w
ou
ld s
eek
to p
rom
ote
pro
du
ctiv
ity
imp
rove
men
ts, p
riva
te s
ecto
r in
vest
men
t in
ag
ricu
ltu
re, w
hile
pu
rsu
ing
inst
itu
tio
nal
str
eng
then
ing
an
d r
ealig
nm
ent,
in
par
tner
ship
wit
h s
tate
-lev
el a
uth
ori
ties
. In
itia
l fo
cus
wo
uld
be
giv
en t
o im
pro
vin
g f
oo
d s
ecu
rity
by
exp
and
ing
pro
du
ctio
n o
f ri
ce,
wh
eat,
mai
ze, s
oyb
ean
s an
d t
om
ato
es, w
hile
als
o p
rom
oti
ng
exp
ort
s o
f co
coa,
cas
sava
, oil
pal
m, s
esam
e an
d g
um
Ara
bic
.

Ma
jor p
olicy d
eve
lop
me
nts
80 81FOOD OUTLOOKOCTOBER 2016
CO
UN
TRY
DA
TEPO
LIC
Y C
ATE
GO
RY
/INST
RU
MEN
TD
ESC
RIP
TIO
N
Paki
stan
Jun
-16
Pro
du
ctio
n s
up
po
rt
An
no
un
ced
th
at it
wo
uld
ext
end
fisc
al c
on
cess
ion
s ap
pro
ved
un
der
last
yea
r's
bu
dg
et f
or
ano
ther
yea
r, as
par
t o
f it
s 20
16/2
017
bu
dg
etar
y al
loca
tio
ns.
Th
e ta
rget
on
ag
ricu
ltu
ral c
red
it d
isb
urs
emen
ts w
as r
aise
d t
o P
KR
700
bill
ion
(U
SD 6
.6 b
illio
n),
wit
h a
PK
R
1 b
illio
n (
USD
9.5
mill
ion
) se
t as
ide
for
the
cred
it g
uar
ante
e sc
hem
e. S
tep
s to
low
er t
he
mar
k-u
ps
on
loan
s b
y 2
per
cen
t w
ere
also
an
no
un
ced
. In
ad
dit
ion
, pri
ces
of
ure
a an
d d
iam
mo
niu
m p
ho
sph
ate
wo
uld
be
cut
furt
her
, pes
tici
des
exe
mp
ted
fro
m s
ales
ta
xes,
an
d e
lect
rici
ty c
har
ges
on
ag
ricu
ltu
ral t
ub
e w
ells
low
ered
by
40 p
erce
nt,
eff
ecti
ve f
rom
1 J
uly
201
6.
Pan
ama
Jun
-16
Imp
ort
qu
ota
Ap
pro
ved
an
imp
ort
qu
ota
of
45 3
60 t
on
nes
of
pad
dy
for
2016
, lia
ble
fo
r a
3 p
erce
nt
imp
ort
tar
iff.
Phili
pp
ines
Jun
-16
Pro
du
ctio
n s
up
po
rtA
nn
ou
nce
d t
hat
it w
ou
ld s
eek
to b
rin
g a
n a
dd
itio
nal
1.0
mill
ion
hec
tare
s u
nd
er p
add
y cu
ltiv
atio
n, i
n a
n e
ffo
rt t
o r
each
sel
f-su
ffici
ency
in r
ice.
Incr
ease
d f
ocu
s w
ou
ld a
lso
be
pla
ced
on
bo
lste
rin
g s
mal
l-sc
ale,
co
mm
un
al ir
rig
atio
n, t
o lo
wer
pro
du
ctio
n
cost
s an
d r
aise
yie
lds,
incl
ud
ing
by
pro
mo
tin
g t
he
cult
ivat
ion
of
hyb
rid
var
ieti
es.
Au
g-1
6Im
po
rt q
uo
taH
eld
a t
end
er t
o im
po
rt 2
50 0
00 t
on
nes
of
25%
bro
ken
ric
e, o
n a
go
vern
men
t-to
-go
vern
men
t b
asis
, in
ord
er t
o r
efu
rbis
h
sto
ckp
iles
and
co
mp
ensa
te f
or
ou
tpu
t lo
sses
ass
oci
ated
wit
h t
he
El N
iño
wea
ther
an
om
aly.
Of
this
vo
lum
e, 1
50 0
00 t
on
nes
wer
e aw
ard
ed t
o V
iet
Nam
, wit
h T
hai
lan
d s
up
ply
ing
th
e b
alan
ce.
Sep
-16
Imp
ort
qu
ota
Op
ened
ap
plic
atio
ns
to t
he
pri
vate
sec
tor
to im
po
rt 8
05 2
00 t
on
nes
of
rice
un
der
Min
imu
m A
cces
s V
olu
me
(MA
V)
cou
ntr
y-sp
ecifi
c an
d o
mn
ibu
s q
uo
tas.
Imp
ort
ed v
olu
mes
are
to
co
mp
rise
sp
ecia
lty
rice
an
d/o
r w
ell-
mill
ed r
ice
wit
h le
ss t
han
25%
b
roke
ns.
Th
ey w
ill b
e lia
ble
to
a 3
5 p
erce
nt
imp
ort
du
ty a
nd
are
to
arr
ive
in t
he
cou
ntr
y n
o la
ter
than
28
Feb
ruar
y 20
17.
Rep
ub
lic o
f K
ore
aSe
p-1
6G
ove
rnm
ent
pro
cure
men
t
An
no
un
ced
th
at t
he
go
vern
men
t w
ou
ld p
urc
has
e 39
0 00
0 to
nn
es o
f ri
ce f
rom
th
e 20
16 h
arve
st t
o s
tab
ilize
loca
l qu
ota
tio
ns.
Pa
ymen
t fo
r th
ese
pu
rch
ases
wo
uld
be
issu
ed in
ad
van
ce, w
ith
th
e vo
lum
e co
mp
risi
ng
360
000
to
nn
es o
f ri
ce, a
s p
art
of
the
Pub
lic R
ice
Sto
ckh
old
ing
Pro
gra
mm
e, a
nd
30
000
ton
nes
as
the
cou
ntr
y's
con
trib
uti
on
to
th
e A
SEA
N P
lus
Thre
e Em
erg
ency
Ric
e R
eser
ve (
APT
ERR
). A
dd
itio
nal
su
pp
ort
mea
sure
s w
ou
ld in
clu
de
loan
s to
aid
pro
cess
ors
’ pu
rch
ase
of
loca
l su
pp
lies,
an
d s
tep
s to
en
cou
rag
e g
reat
er e
xpo
rt a
nd
use
of
rice
fo
r n
on
-fo
od
pu
rpo
ses.
Rw
and
aJu
n-1
6Im
po
rt t
arif
fR
enew
ed e
xem
pti
on
s to
th
e 75
per
cen
t ri
ce im
po
rt d
uty
ap
plic
able
un
der
th
e C
om
mo
n E
xter
nal
Tar
iff
of
the
East
Afr
ican
C
om
mu
nit
y. A
cco
rdin
gly
, ric
e im
po
rts
will
co
nti
nu
e to
acc
rue
a ta
riff
of
45 p
erce
nt
(or
USD
345
per
to
nn
e, w
hic
hev
er is
hig
her
) fo
r a
per
iod
of
on
e ye
ar, e
ffec
tive
1 J
uly
201
6.
Sen
egal
Au
g-1
6Pr
od
uct
ion
su
pp
ort
Ove
rsaw
th
e si
gn
ing
of
a m
emo
ran
du
m o
f u
nd
erst
and
ing
bet
wee
n s
ecto
r re
pre
sen
tati
ves
un
der
wh
ich
imp
ort
ers
com
mit
ted
to
pu
rch
ase
50 0
00 t
on
nes
of
rice
fro
m t
he
2016
sea
son
har
vest
an
d 1
500
to
nn
es c
urr
entl
y st
ore
d b
y m
iller
s. U
nd
er t
he
acco
rd,
imp
ort
ers
wo
uld
pay
XO
F 24
0 00
0–24
5 00
0 (U
SD 4
07–4
15)
per
to
nn
e o
f 10
0% b
roke
n r
ice
and
XO
F 27
5 00
0–28
0 00
0 (U
SD 4
66–
475)
per
to
nn
e o
f w
ho
le-g
rain
s.
Sri L
anka
Au
g-1
6G
ove
rnm
ent
pro
cure
men
t
Dec
ided
to
pu
rch
ase
120
000
ton
nes
of
pad
dy
fro
m t
he
2016
Yal
a h
arve
st, a
lloca
tin
g L
KR
4 b
illio
n (
USD
27
mill
ion
) fo
r th
e p
urp
ose
. Un
der
th
e p
rocu
rem
ent
dri
ve, t
he
Pad
dy
Mar
keti
ng
Bo
ard
will
off
er f
arm
ers
LKR
50
per
kg
of
Kee
ri S
amb
a p
urc
has
ed
(USD
337
per
to
nn
e), L
KR
41
per
kg
(U
SD 2
76 p
er t
on
ne)
of
Sam
ba
pad
dy
and
LK
R 3
8 p
er k
g (
USD
256
per
to
nn
e) in
th
e ca
se o
f N
adu
pad
dy.
Taiw
an p
rovi
nce
of
Ch
ina
Jun
-16
Pro
du
ctio
n s
up
po
rt
An
no
un
ced
th
at it
wo
uld
imp
lem
ent
a p
ilot
pro
ject
in s
ix t
ow
nsh
ips
in o
rder
to
en
cou
rag
e en
viro
nm
ent-
frie
nd
ly, h
igh
-qu
alit
y ri
ce p
rod
uct
ion
. Un
der
th
e in
itia
tive
, qu
alifi
ed f
arm
ers
wo
uld
rec
eive
a d
irec
t p
aym
ent
of
NTD
10
000
(USD
315
) p
er h
ecta
re, a
s an
alt
ern
ativ
e to
th
e p
rice
s g
uar
ante
ed u
nd
er t
he
stat
e's
pu
rch
asin
g p
rog
ram
mes
. Th
e o
utl
ay w
ou
ld b
e is
sued
fo
r th
e se
con
d
cro
p o
f 20
16, t
o f
arm
ers
po
sses
sin
g a
lan
d le
ase
con
trac
t o
r o
ther
far
min
g a
rran
gem
ents
an
d w
ho
hav
e cu
ltiv
ated
th
e se
con
d
cro
p in
th
e p
rece
din
g t
hre
e ye
ars.

Ma
jor
po
licy
de
velo
pm
en
ts
82 83FOOD OUTLOOKOCTOBER 2016
CO
UN
TRY
DA
TEPO
LIC
Y C
ATE
GO
RY
/INST
RU
MEN
TD
ESC
RIP
TIO
N
Thai
lan
d
May
16
to
Au
g 1
6St
ock
rel
ease
Sold
3.0
mill
ion
to
nn
es o
f ri
ce f
rom
go
vern
men
t st
ock
pile
s th
rou
gh
sev
en a
uct
ion
s h
eld
bet
wee
n M
ay a
nd
Au
gu
st. T
he
latt
er
off
ered
a c
om
bin
ed 8
.3 m
illio
n t
on
nes
of
rice
fo
r d
om
esti
c u
se a
nd
exp
ort
.
Jun
-16
Pro
du
ctio
n s
up
po
rtA
pp
rove
d a
bu
dg
et o
f TH
B 6
.8 b
illio
n (
USD
194
mill
ion
) to
imp
lem
ent
an o
n-f
arm
mo
rtg
agin
g p
rog
ram
me
for
frag
ran
t an
d
glu
tin
ou
s p
add
y fr
om
no
rth
ern
an
d n
ort
hea
ster
n p
rovi
nce
s. T
he
sch
eme
will
be
run
bet
wee
n M
ay a
nd
Dec
emb
er 2
016,
als
o
pro
vid
ing
tra
der
s an
d p
roce
sso
rs w
ith
an
inte
rest
rat
e cu
t to
en
cou
rag
e th
em t
o s
tore
pad
dy
for
up
to
six
mo
nth
s.
Jun
-16
Pro
du
ctio
n s
up
po
rt
Ap
pro
ved
a b
ud
get
of
THB
45.
6 b
illio
n (
USD
1.3
bill
ion
) to
ass
ist
rice
far
mer
s af
fect
ed b
y d
rou
gh
t. T
he
init
iati
ve w
ill p
rovi
de
3.7
mill
ion
ric
e-fa
rmin
g h
ou
seh
old
s w
ith
an
ou
tlay
of
THB
100
0 p
er r
ai (
USD
179
per
hec
tare
) fo
r u
p t
o 1
0 ra
i (1.
6 h
ecta
res)
, in
ad
dit
ion
to
ext
end
ing
deb
t re
pay
men
t p
erio
ds
for
two
yea
rs a
nd
low
erin
g in
tere
st r
ates
on
loan
s p
rovi
ded
by
the
Ban
k o
f A
gri
cult
ure
an
d A
gri
cult
ura
l Co
op
erat
ives
(B
AA
C).
A s
epar
ate
THB
60
per
rai
(U
SD 1
1 p
er h
ecta
re)
will
be
exte
nd
ed t
o p
rod
uce
rs
avai
ling
th
emse
lves
of
cro
p in
sura
nce
.
Jul-
16Ex
po
rt p
rom
oti
on
An
no
un
ced
th
at it
wo
uld
tak
e st
eps
to s
trea
mlin
e ex
po
rt p
roce
du
res
of
stra
teg
ic p
rod
uct
s, in
clu
din
g r
ice.
Th
e in
itia
tive
tar
get
s to
cu
t th
e ti
me
req
uir
ed t
o e
xpo
rt t
hes
e co
mm
od
itie
s b
y 20
day
s an
d t
o c
ut
the
cost
s in
curr
ed b
y tr
ader
s b
y 60
per
cen
t, b
y re
du
cin
g t
he
nu
mb
er o
f en
titi
es in
volv
ed in
pro
ced
ure
s an
d e
nco
ura
gin
g t
he
ado
pti
on
of
elec
tro
nic
pla
tfo
rms.
Sep
-16
Sto
ck r
elea
seA
nn
ou
nce
d t
hat
it w
ou
ld s
usp
end
th
e re
leas
e o
f su
pp
lies
fro
m g
ove
rnm
ent
rese
rves
in o
rder
to
avo
id d
ow
nw
ard
pre
ssu
re o
n
loca
l qu
ota
tio
ns
at h
arve
st t
ime.
Ug
and
aJu
n-1
6Im
po
rt t
arif
f
Low
ered
imp
ort
du
ties
ap
plic
able
un
der
th
e C
om
mo
n E
xter
nal
Tar
iff
of
the
East
Afr
ican
Co
mm
un
ity.
Acc
ord
ing
to
th
e d
ecis
ion
, im
po
rts
of
pad
dy
and
hu
sked
ric
e w
ill b
e lia
ble
to
a 7
5 p
erce
nt
imp
ort
du
ty (
or
USD
250
per
to
nn
e, w
hic
hev
er is
hig
her
), a
s o
pp
ose
d t
o t
he
75 p
erce
nt
rate
or
(USD
345
per
to
nn
e, w
hic
hev
er is
hig
her
), n
orm
ally
ap
plic
able
. Th
e m
easu
re w
ill b
e ef
fect
ive
for
on
e ye
ar, s
tart
ing
on
1 J
uly
201
6.
* T
he f
ull c
olle
ctio
n st
artin
g in
Jan
uary
201
1 is
ava
ilabl
e at
: htt
p://w
ww
.fao
.org
/eco
nom
ic/e
st/e
st c
omm
oditi
es/c
omm
odity
pol
icy
arch
ive/
en/?
grou
pAN
Dco
mm
odity
=ric
e

Ma
jor p
olicy d
eve
lop
me
nts
82 83FOOD OUTLOOKOCTOBER 2016
OIL
CRO
PS:
MA
JOR
POLI
CY D
EVEL
OPM
ENTS
MID
-MA
Y T
O M
ID-S
EPTE
MBE
R 20
16*
CO
UN
TRY
PRO
DU
CT
DA
TEPO
LIC
Y C
ATE
GO
RY
/INST
RU
MEN
TD
ESC
RIP
TIO
N
Arg
enti
na
Soyb
ean
sJu
n-1
6Se
ed m
arke
t re
gu
lati
on
Entr
ust
ed a
sta
te a
gen
cy w
ith
th
e te
stin
g o
f so
ybea
ns
and
oth
er s
eed
fo
r th
e p
rese
nce
of
GM
tra
its,
w
ith
a v
iew
to
en
able
pri
vate
co
mp
anie
s to
co
nsi
sten
tly
colle
ct r
oya
lty
pay
men
ts.
Bio
die
sel
Jul-
16B
ilate
ral t
rad
e d
isp
ute
Ap
pea
led
th
e fi
nd
ing
s o
f th
e W
TO d
isp
ute
pan
el r
egar
din
g t
he
anti
-du
mp
ing
mea
sure
s ta
ken
by
the
Euro
pea
n U
nio
n a
gai
nst
bio
die
sel i
mp
ort
s fr
om
Arg
enti
na.
Bio
die
sel
May
-16
to
Au
g-1
6Ex
po
rt p
olic
yA
dju
sted
per
iod
ical
ly t
he
leve
l of
exp
ort
tax
es f
or
bio
die
sel,
wit
h a
vie
w t
o s
tim
ula
te d
om
esti
c b
iod
iese
l co
nsu
mp
tio
n, w
hile
als
o m
ain
tain
ing
ad
equ
ate
ince
nti
ves
for
bio
die
sel e
xpo
rter
s.
Au
stra
liaB
iod
iese
lJu
l-16
Ren
ewab
le e
ner
gy
po
licy
Rel
ease
d f
un
ds
to p
rom
ote
th
e p
rod
uct
ion
an
d u
se o
f b
iofu
els
as p
art
of
the
go
vern
men
t’s
10-y
ear
bio
fuel
s ro
adm
ap.
Bra
zil
Ara
ble
cro
ps
Jun
-16
Ag
ricu
ltu
ral p
olic
yR
enew
ed a
nd
rai
sed
fu
nd
ing
fo
r ag
ricu
ltu
ral s
up
po
rt p
rog
ram
mes
in 2
016/
17, f
ocu
sin
g o
n s
easo
nal
lo
ans
for
pro
du
ctio
n a
nd
mar
keti
ng
op
erat
ion
s.
Can
ada
Veg
etab
le o
il d
eriv
ativ
esJu
n-1
6M
arke
t re
gu
lati
on
Req
ues
ted
ind
ust
ry s
take
ho
lder
s to
pro
vid
e d
ata
on
th
e p
rese
nce
of
par
tial
ly h
ydro
gen
ated
oils
in
do
mes
tic
or
imp
ort
ed f
oo
ds,
wit
h a
vie
w t
o e
ven
tual
ly e
limin
ate
ind
ust
rial
ly p
rod
uce
d t
ran
s fa
ts in
p
roce
ssed
fo
od
s.
Oils
eed
s, o
ils, m
eals
Jul-
16Fr
ee t
rad
e ag
reem
ent
Co
mp
lete
d n
ego
tiat
ion
s o
f fr
ee t
rad
e ag
reem
ent
wit
h U
krai
ne,
gra
nti
ng
imm
edia
te d
uty
fre
e ac
cess
fo
r o
ilsee
d, o
il an
d m
eal i
mp
ort
s fr
om
Ukr
ain
e.
Ch
ileSa
tura
ted
fat
Jun
-16
Foo
d s
tan
dar
ds
/ hea
lth
po
licy
Intr
od
uce
d le
gis
lati
on
to
reg
ula
te la
bel
ling
of
the
nu
trit
ion
al c
om
po
siti
on
of
foo
d p
rod
uct
s, n
ota
bly
th
e co
nte
nt
of
satu
rate
d f
at, s
od
ium
, su
gar
an
d c
alo
ries
.
Ch
ina
Soyb
ean
sJu
n-1
6A
gri
cult
ura
l po
licy
Rel
ease
d a
5-y
ear
pla
n p
rom
oti
ng
th
e ex
pan
sio
n o
f so
ybea
n c
ult
ivat
ion
, in
clu
din
g in
cen
tive
s to
en
cou
rag
e fa
rmer
s to
red
uce
mai
ze p
lan
tin
gs
in f
avo
ur
of
soyb
ean
s.
Soyb
ean
Jun
-16
Pub
lic p
rocu
rem
ent
/ sta
te r
eser
ves
Res
um
ed s
oyb
ean
sal
es f
rom
sta
te r
eser
ves
via
wee
kly
auct
ion
s, in
a b
id t
o e
ase
tig
ht
do
mes
tic
sup
plie
s.
Rap
esee
dA
ug
-16
Imp
ort
res
tric
tio
ns
Del
ayed
th
e im
ple
men
tati
on
of
stri
ng
ent
rule
s o
n r
apes
eed
imp
ort
s fr
om
Can
ada
mea
nt
to r
edu
ce t
he
risk
of
bla
ckle
g d
isea
se s
pre
adin
g t
o C
hin
a.
Soyb
ean
Au
g-1
6G
MO
po
licy
Rel
ease
d a
5-y
ear
pla
n p
rom
oti
ng
th
e lo
cal d
evel
op
men
t o
f G
M c
rop
var
ieti
es, i
ncl
ud
ing
her
bic
ide-
resi
stan
t so
ybea
n
Soyb
ean
sSe
p-1
6Pr
od
uct
ion
su
pp
ort
Intr
od
uce
d s
ub
sid
ies
for
farm
ers
in H
eilo
ng
jian
g p
rovi
nce
wh
o p
lan
t so
ybea
ns
follo
win
g a
mai
ze c
rop
, in
a b
id t
o p
rom
ote
hea
lth
y cr
op
ro
tati
on
pra
ctic
es.
Co
lom
bia
Palm
oil
Jul-
16En
viro
nm
enta
l po
licy
Ord
ered
a p
alm
oil
com
pan
y to
su
spen
d o
per
atio
ns
du
e to
alle
ged
vio
lati
on
s o
f en
viro
nm
enta
l re
gu
lati
on
s.
Euro
pea
n U
nio
n
Veg
etab
le o
il d
eriv
ativ
esJu
n-1
6H
ealt
h p
olic
yIs
sued
war
nin
g c
on
cern
ing
th
ree
toxi
c su
bst
ance
s th
at f
orm
in f
oo
d p
roce
ssin
g w
hen
veg
etab
le o
ils a
re
refi
ned
at
hig
h t
emp
erat
ure
s.
Ara
ble
cro
ps
Jul-
16En
viro
nm
enta
l / h
ealt
h p
olic
yEx
ten
ded
th
e lic
ense
ap
pro
val f
or
gly
ph
osa
te (
a ch
emic
al f
ou
nd
in h
erb
icid
es u
sed
on
oilc
rop
s an
d
gra
ins
wo
rld
wid
e) f
or
a lim
ited
per
iod
of
18 m
on
ths,
an
d r
equ
este
d t
he
agro
-ch
emic
al in
du
stry
to
p
rovi
de
add
itio
nal
sci
enti
fic
evid
ence
on
th
e ch
emic
al’s
saf
ety.
Soyb
ean
sJu
l-16
GM
O p
olic
yA
uth
ori
zed
th
ree
new
GM
so
ybea
n v
arie
ties
fo
r im
po
rtat
ion
an
d p
roce
ssin
g f
or
foo
d a
nd
fee
d u
se, b
ut
no
t cu
ltiv
atio
n.
Oliv
e tr
ees
Jul-
16D
isea
se c
on
tro
lO
pen
ed a
sec
on
d in
frin
gem
ent
pro
ced
ure
ag
ain
st It
aly
ove
r al
leg
ed d
elay
s in
ap
ply
ing
mea
sure
s ag
ain
st
the
spre
ad o
f th
e xy
lella
fas
tid
iosa
bac
teri
um
in A
pu
lia.
Co
mp
ou
nd
fee
d (
incl
. o
ilmea
ls)
Jul-
16M
arke
t re
gu
lati
on
End
ors
ed a
co
de
of
go
od
lab
ellin
g p
ract
ices
fo
r co
mp
ou
nd
fee
d. T
he
cod
e w
as d
evel
op
ed jo
intl
y b
y th
e EU
fee
d in
du
stry
an
d f
arm
er a
sso
ciat
ion
s, w
ith
a v
iew
to
har
mo
niz
e p
ract
ices
acr
oss
EU
Mem
ber
Sta
tes.
Bio
die
sel
Jul-
16B
ilate
ral t
rad
e d
isp
ute
Ap
pea
led
th
e fi
nd
ing
s o
f th
e W
TO d
isp
ute
pan
el r
egar
din
g t
he
anti
-du
mp
ing
mea
sure
s ta
ken
by
the
EU
agai
nst
bio
die
sel i
mp
ort
s fr
om
Arg
enti
na.

Ma
jor
po
licy
de
velo
pm
en
ts
84 85FOOD OUTLOOKOCTOBER 2016
CO
UN
TRY
PRO
DU
CT
DA
TEPO
LIC
Y C
ATE
GO
RY
/INST
RU
MEN
TD
ESC
RIP
TIO
N
Gh
ana
Oil
Palm
Sep
-16
Sect
or
dev
elo
pm
ent
sup
po
rtA
pp
rove
d c
reat
ion
of
the
Oil
Palm
Dev
elo
pm
ent
Bo
ard
to
reg
ula
te t
he
oil
pal
m s
ecto
r an
d p
rom
ote
d
om
esti
c p
rod
uct
ion
.
Ind
ia
Palm
oil
Jun
-16
Pro
du
ctio
n s
up
po
rtIn
tro
du
ced
a m
arke
t in
terv
enti
on
sch
eme
for
pal
m o
il, a
s p
art
of
effo
rts
to e
nh
ance
do
mes
tic
oilc
rop
p
rod
uct
ion
an
d r
edu
ce t
he
cou
ntr
y’s
dep
end
ence
on
veg
etab
le o
il im
po
rts.
Co
pra
Jun
-16
Pub
lic p
rocu
rem
ent
/ pro
du
ctio
n
sup
po
rtR
ein
stat
ed c
op
ra p
rocu
rem
ent
in T
amil
Nad
u s
tate
, wit
h a
vie
w t
o p
rote
ct lo
w-i
nco
me
farm
ers
fro
m a
d
rop
in m
arke
t p
rice
s.
Co
con
ut
oil
Jun
-16
Sect
or
dev
elo
pm
ent
sup
po
rtEx
ten
ded
fin
anci
al a
ssis
tan
ce t
o f
arm
ers
in T
amil
Nad
u s
tate
aim
ed a
t re
pla
cin
g s
enile
, dis
ease
-in
fect
ed
and
un
pro
du
ctiv
e p
alm
s, a
nd
at
reju
ven
atin
g e
xist
ing
tre
es t
hro
ug
h in
teg
rate
d m
anag
emen
t p
ract
ices
.
Oils
an
d f
ats
Jun
-16
Foo
d s
tan
dar
ds
Rel
ease
d n
ew m
anu
als
on
tes
tin
g m
eth
od
olo
gie
s an
d a
nal
yses
fo
r va
rio
us
foo
d p
rod
uct
s, in
clu
din
g o
ils
and
fat
s.
Gro
un
dn
uts
, so
ybea
ns,
su
nfl
ow
erse
ed,
nig
erse
ed,
sesa
mu
mJu
l-16
Pro
du
ctio
n s
up
po
rtR
aise
d m
inim
um
su
pp
ort
pri
ce f
or
gro
un
dn
uts
, so
ybea
ns,
su
nfl
ow
erse
ed, n
iger
seed
an
d s
esam
um
.
Edib
le o
ilsJu
l-16
Mar
ket
po
licy
Invi
ted
all
stat
es t
o r
emo
ve lo
cal t
axes
levi
ed o
n e
ssen
tial
fo
od
item
s, in
clu
din
g e
dib
le o
ils, w
ith
a v
iew
to
en
sure
ad
equ
ate
sup
plie
s o
f es
sen
tial
fo
od
item
s at
pri
ces
affo
rdab
le t
o c
on
sum
ers.
Co
con
ut
oil
Jul-
16M
arke
t p
olic
y / h
ealt
h p
olic
yIn
tro
du
ced
, in
Ker
ala
stat
e, a
5 p
erce
nt
levy
on
co
con
ut
oil
sale
s an
d a
14.
5 p
erce
nt
“fat
tax
” ap
plie
d t
o
foo
d it
ems
sold
th
rou
gh
bra
nd
ed o
utl
ets.
Oliv
e tr
ees
Jul-
16Se
cto
r d
evel
op
men
t su
pp
ort
Set
up
, in
Raj
asth
an s
tate
, an
oliv
e o
il ex
trac
tio
n p
lan
t an
d s
up
po
rted
th
e p
lan
tin
g o
f o
live
sap
ling
s,
wit
h a
vie
w t
o p
rom
ote
loca
l pro
du
ctio
n a
nd
red
uce
th
e co
un
try’
s d
epen
den
ce o
n v
eget
able
oil
imp
ort
s.
Oils
an
d f
ats
Au
g-1
6Fo
od
saf
ety
po
licy
Post
po
ned
th
e en
forc
emen
t d
ate
for
max
imu
m li
mit
s o
f tr
ans
fatt
y ac
id le
vels
in e
dib
le f
ats,
oils
an
d f
at
emu
lsio
ns
to F
ebru
ary
2017
.
Co
con
ut
pal
mA
ug
-16
Sect
or
dev
elo
pm
ent
sup
po
rtA
lloca
ted
fu
nd
s to
pro
mo
te im
pro
ved
pro
cess
ing
met
ho
ds,
pro
du
ct d
iver
sifi
cati
on
an
d v
alu
e ad
dit
ion
in
the
coco
nu
t se
cto
r.
Mu
star
dse
edA
ug
-16
GM
O p
olic
y Is
sued
a f
avo
ura
ble
ass
essm
ent
of
GM
mu
star
dse
ed, b
ased
on
saf
ety
test
s an
d c
hec
ks o
n p
ote
nti
al r
isks
to
hea
lth
an
d e
colo
gy.
Co
pra
Sep
-16
Mar
ket
sup
po
rtSe
t u
p c
op
ra p
rocu
rem
ent
cen
tres
acr
oss
Kar
nat
aka
stat
e in
an
eff
ort
to
su
pp
ort
gro
wer
s af
fect
ed b
y p
rice
dro
ps.
Ind
on
esia
Oil
pal
mM
ay-1
6Pr
od
uct
ion
su
pp
ort
Rel
ease
d f
un
ds
to s
up
po
rt s
mal
lho
lder
oil
pal
m r
epla
nti
ng
, wit
h a
vie
w t
o r
aise
yie
ld le
vels
.
Palm
oil
May
-16
to
Sep
- 16
Exp
ort
po
licy
Left
in p
lace
a s
lidin
g e
xpo
rt t
ax r
egim
e fo
r p
alm
oil
use
d t
o p
rote
ct t
he
inte
rest
s o
f d
om
esti
c p
rod
uce
rs
and
co
nsu
mer
s.
Kir
ibat
iC
oco
nu
t o
ilJu
n-1
6R
enew
able
en
erg
y p
olic
yPr
om
ote
d u
se o
f co
con
ut
oil
in p
ow
er g
ener
atio
n, w
ith
a v
iew
to
cu
rb d
epen
den
ce o
n f
uel
imp
ort
s.
Mal
aysi
a
Bio
die
sel
Jul-
16R
enew
able
en
erg
y p
olic
yD
elay
ed t
he
shif
t –
fro
m 7
to
10
per
cen
t –
of
man
dat
ory
ble
nd
ing
of
pal
m o
il-b
ased
bio
die
sel i
nto
tr
ansp
ort
atio
n f
uel
, wit
ho
ut
pro
vid
ing
a fi
rm im
ple
men
tati
on
dat
e.
Palm
oil
May
-16
to
Sep
- 16
Exp
ort
po
licy
Left
in p
lace
a s
lidin
g e
xpo
rt t
ax r
egim
e fo
r p
alm
oil
use
d t
o p
rote
ct t
he
inte
rest
s o
f d
om
esti
c p
rod
uce
rs
and
co
nsu
mer
s.
Mya
nm
arSe
lect
ed o
ilsee
ds/
edib
le o
ilsA
ug
-16
Exp
ort
po
licy
Rel
axed
exp
ort
res
tric
tio
ns
on
a n
um
ber
of
agri
-bas
ed p
rod
uct
s, in
clu
din
g s
esam
e o
il, m
ust
ard
see
d/o
il,
sun
flo
wer
see
d/o
il, a
nd
by-
pro
du
cts
of
edib
le o
il ex
trac
tio
n, w
ith
a v
iew
to
allo
w t
he
do
mes
tic
ind
ust
ry
to t
ap n
ew e
xpo
rt o
pp
ort
un
itie
s.
Nep
alB
iod
iese
lJu
l-16
Ren
ewab
le e
ner
gy
po
licy
Esta
blis
hed
a c
om
mit
tee
to e
xam
ine
the
po
ssib
ility
of
pro
du
cin
g b
iod
iese
l fro
m ja
tro
ph
a, w
ith
a v
iew
to
re
du
ce t
he
cou
ntr
y's
dep
end
ence
on
imp
ort
ed f
oss
il fu
els.

Ma
jor p
olicy d
eve
lop
me
nts
84 85FOOD OUTLOOKOCTOBER 2016
* A
col
lect
ion
of m
ajor
pol
icy
deve
lopm
ents
sta
rtin
g in
Jan
uary
201
1 is
ava
ilabl
e at
: ht
tp://
ww
w.f
ao.o
rg/e
cono
mic
/est
/est
-com
mod
ities
/com
mod
ity-p
olic
y-ar
chiv
e/en
/?gr
oupA
ND
com
mod
ity=
Oils
eeds
,%20
oils
%20
and%
20m
eals
CO
UN
TRY
PRO
DU
CT
DA
TEPO
LIC
Y C
ATE
GO
RY
/INST
RU
MEN
TD
ESC
RIP
TIO
N
Phili
pp
ines
Bio
die
sel
May
-16
Ren
ewab
le e
ner
gy
po
licy
Rev
ised
th
e co
un
try'
s sp
ecifi
cati
on
s fo
r co
con
ut
oil-
bas
ed b
iod
iese
l, ra
isin
g t
he
req
uir
ed q
ual
ity
stan
dar
d.
GM
O c
rop
s an
d
der
ived
pro
du
cts
Jun
-16
GM
O p
olic
yR
ever
sed
– f
ollo
win
g t
he
refo
rm o
f th
e co
un
try’
s re
gu
lato
ry p
roce
ss f
or
GM
Os
– an
ear
lier
dec
isio
n t
o
susp
end
th
e te
stin
g, c
on
tain
ed u
se, i
mp
ort
atio
n a
nd
mar
keti
ng
of
GM
cro
ps
and
der
ived
pro
du
cts.
Ru
ssia
n F
eder
atio
n
GM
O c
rop
sJu
l-16
GM
O p
olic
yPr
oh
ibit
ed c
ult
ivat
ion
of
GM
cro
ps
in t
he
cou
ntr
y an
d s
tren
gth
ened
sta
te c
on
tro
l ove
r im
po
rtat
ion
an
d
pro
cess
ing
of
GM
org
anis
ms.
Palm
oil
Au
g-1
6Tr
ade
dis
pu
te s
ettl
emen
tR
ecei
ved
ru
ling
fro
m W
TO d
isp
ute
set
tlem
ent
pan
el e
stab
lish
ing
th
at im
po
rt d
uti
es a
pp
lied
on
sel
ecte
d
pro
du
cts
imp
ort
ed f
rom
th
e EU
– in
clu
din
g p
alm
oil
and
its
frac
tio
ns
– vi
ola
ted
WTO
ru
les.
Sun
flo
wer
seed
Sep
-16
Exp
ort
po
licy
Low
ered
th
e co
un
try’
s d
uty
on
su
nfl
ow
erse
ed e
xpo
rts
ou
tsid
e th
e Eu
rasi
an E
con
om
ic U
nio
n.
Palm
oil
Jul-
16H
ealt
h p
olic
yD
rop
ped
pla
ns
to in
tro
du
ce s
pec
ific
safe
ty s
tan
dar
ds
for
tro
pic
al o
ils, i
n p
arti
cula
r p
alm
oil,
cit
ing
lack
o
f sc
ien
tifi
c ev
iden
ce a
bo
ut
alle
ged
hu
man
hea
lth
haz
ard
s.
Sri L
anka
Edib
le o
ilsM
ay-1
6Im
po
rt p
olic
yR
aise
d im
po
rt le
vies
fo
r cr
ud
e an
d r
efin
ed v
eget
able
oils
.
Thai
lan
d
Bio
die
sel
Jun
-16
Ren
ewab
le e
ner
gy
po
licy
Sig
ned
Mo
U w
ith
pri
vate
en
erg
y an
d lo
gis
tics
co
mp
anie
s to
use
B20
(tr
ansp
ort
atio
n d
iese
l co
nta
inin
g 2
0 p
erce
nt
pal
m o
il-b
ased
bio
die
sel)
fo
r th
eir
hea
vy v
ehic
les.
Bio
die
sel
Jul-
16 t
o
Au
g-1
6B
iod
iese
l po
licie
sR
edu
ced
, tem
po
rari
ly, t
he
man
dat
ory
ble
nd
ing
of
tran
spo
rtat
ion
die
sel w
ith
pal
m o
il-b
ased
bio
die
sel
fro
m 7
to
3 p
erce
nt,
in a
bid
to
en
d a
tem
po
rary
sh
ort
age
in d
om
esti
c co
oki
ng
oil
sup
plie
s.
Ug
and
aA
ll ag
ricu
ltu
ral g
oo
ds
Au
g-1
6A
gri
cult
ura
l po
licy
Lau
nch
ed a
su
bsi
diz
ed c
rop
insu
ran
ce s
chem
e, in
an
eff
ort
to
imp
rove
far
mer
s’ a
cces
s to
cre
dit
an
d
incr
ease
ho
use
ho
ld f
oo
d s
ecu
rity
.
Ukr
ain
eO
ilsee
ds,
oils
, mea
lsJu
l-16
Free
tra
de
agre
emen
tC
om
ple
ted
neg
oti
atio
ns
of
a fr
ee t
rad
e ag
reem
ent
wit
h C
anad
a, g
ain
ing
imm
edia
te d
uty
fre
e ac
cess
fo
r ex
po
rts
of
sun
flo
wer
oil,
rap
esee
d a
nd
so
ybea
ns
pro
du
cts
to C
anad
a.
Un
ited
Kin
gd
om
Soyb
ean
Jun
-16
Bila
tera
l co
op
erat
ion
Lau
nch
ed a
fu
nd
ing
sch
eme
to s
up
po
rt t
he
dev
elo
pm
ent
and
imp
rove
men
t o
f re
gio
nal
so
ybea
n v
alu
e ch
ain
s an
d r
egio
nal
tra
de
flo
ws
in E
ast
and
So
uth
ern
Afr
ica.
Un
ited
Sta
tes
Bio
die
sel
Jun
-16
Ren
ewab
le e
ner
gy
po
licy
Exte
nd
ed t
hro
ug
h 2
024
the
bio
die
sel p
rod
uct
ion
cre
dit
in p
lace
in Io
wa
stat
e.
GM
cro
ps
Jul-
16G
MO
lab
ellin
gPa
ssed
new
bill
reg
ula
tin
g m
and
ato
ry la
bel
ling
of
foo
d p
rod
uct
s co
nta
inin
g G
MO
s. T
he
new
bill
o
verr
ides
mo
re s
trin
gen
t m
easu
res
rece
ntl
y p
asse
d (
or
con
sid
ered
) in
ind
ivid
ual
sta
tes.
GM
pro
du
cts
Au
g-1
6G
MO
po
licy
Issu
ed a
sta
tem
ent
auth
ori
zin
g c
om
pan
ies
to m
ake
lab
ellin
g c
laim
s th
at n
o G
M in
gre
die
nts
wer
e u
sed
in
mea
t, p
ou
ltry
an
d e
gg
pro
du
cts.
Van
uat
uC
oco
nu
tJu
l-16
Sect
or
dev
elo
pm
ent
sup
po
rtLa
un
ched
a 9
-yea
r p
lan
aim
ed a
t re
vivi
ng
th
e co
un
try’
s co
con
ut
ind
ust
ry a
fter
th
e d
evas
tati
on
cau
sed
by
Cyc
lon
e Pa
m la
st y
ear.
Vie
tnam
Veg
etab
le o
ils
May
-16
Imp
ort
po
licy
Low
ered
imp
ort
tax
on
veg
etab
le o
il tr
ansa
ctio
ns
intr
od
uce
d a
s a
tem
po
rary
saf
egu
ard
mea
sure
, an
d
ann
ou
nce
d t
hat
th
e ta
x w
ou
ld b
e p
has
ed o
ut
by
May
201
7.
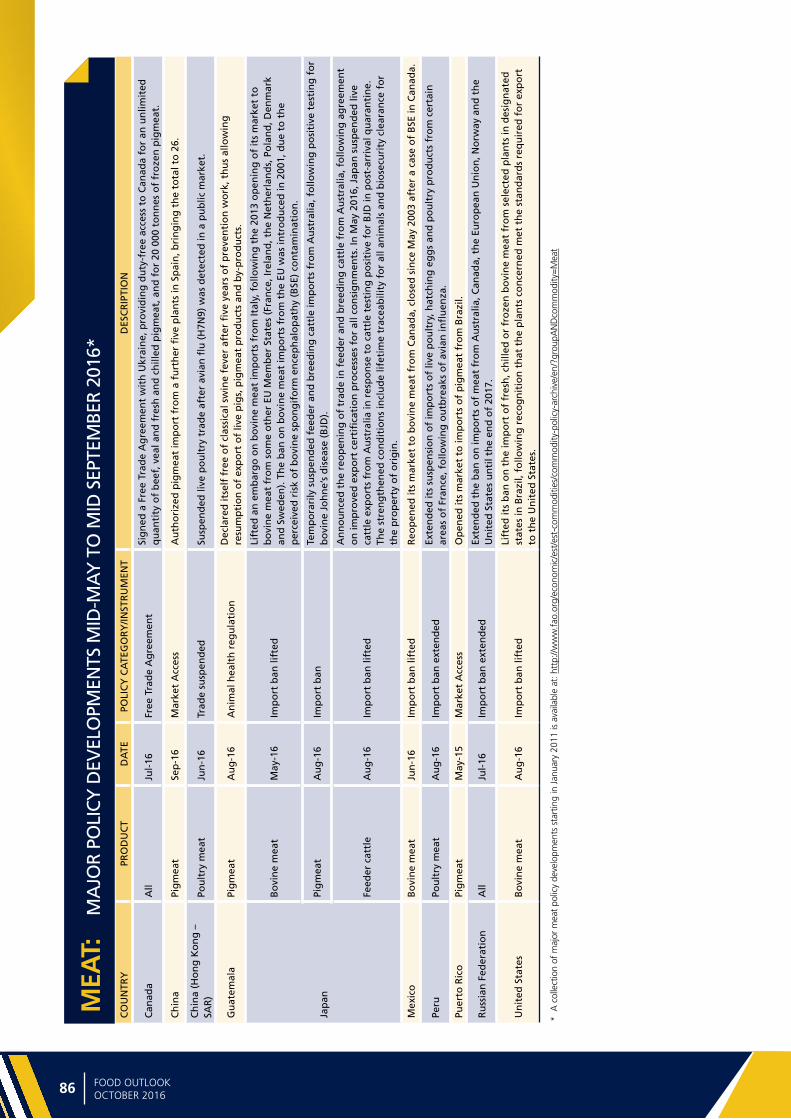
Ma
jor
po
licy
de
velo
pm
en
ts
86 87FOOD OUTLOOKOCTOBER 2016
MEA
T:
MA
JOR
POLI
CY D
EVEL
OPM
ENTS
MID
-MA
Y T
O M
ID S
EPTE
MBE
R 20
16*
CO
UN
TRY
PRO
DU
CT
DA
TEPO
LIC
Y C
ATE
GO
RY
/INST
RU
MEN
TD
ESC
RIP
TIO
N
Can
ada
All
Jul-
16Fr
ee T
rad
e A
gre
emen
tSi
gn
ed a
Fre
e Tr
ade
Ag
reem
ent
wit
h U
krai
ne,
pro
vid
ing
du
ty-f
ree
acce
ss t
o C
anad
a fo
r an
un
limit
ed
qu
anti
ty o
f b
eef,
vea
l an
d f
resh
an
d c
hill
ed p
igm
eat,
an
d f
or
20 0
00 t
on
nes
of
fro
zen
pig
mea
t.
Ch
ina
Pig
mea
tSe
p-1
6M
arke
t A
cces
sA
uth
ori
zed
pig
mea
t im
po
rt f
rom
a f
urt
her
five
pla
nts
in S
pai
n, b
rin
gin
g t
he
tota
l to
26.
Ch
ina
(Ho
ng
Ko
ng
–
SAR
)Po
ult
ry m
eat
Jun
-16
Trad
e su
spen
ded
Susp
end
ed li
ve p
ou
ltry
tra
de
afte
r av
ian
flu
(H
7N9)
was
det
ecte
d in
a p
ub
lic m
arke
t.
Gu
atem
ala
Pig
mea
tA
ug
-16
An
imal
hea
lth
reg
ula
tio
nD
ecla
red
itse
lf f
ree
of
clas
sica
l sw
ine
feve
r af
ter
five
yea
rs o
f p
reve
nti
on
wo
rk, t
hu
s al
low
ing
re
sum
pti
on
of
exp
ort
of
live
pig
s, p
igm
eat
pro
du
cts
and
by-
pro
du
cts.
Jap
an
Bo
vin
e m
eat
May
-16
Imp
ort
ban
lift
ed
Lift
ed a
n e
mb
arg
o o
n b
ovi
ne
mea
t im
po
rts
fro
m It
aly,
fo
llow
ing
th
e 20
13 o
pen
ing
of
its
mar
ket
to
bo
vin
e m
eat
fro
m s
om
e o
ther
EU
Mem
ber
Sta
tes
(Fra
nce
, Ire
lan
d, t
he
Net
her
lan
ds,
Po
lan
d, D
enm
ark
and
Sw
eden
). T
he
ban
on
bo
vin
e m
eat
imp
ort
s fr
om
th
e EU
was
intr
od
uce
d in
200
1, d
ue
to t
he
per
ceiv
ed r
isk
of
bo
vin
e sp
on
gif
orm
en
cep
hal
op
ath
y (B
SE)
con
tam
inat
ion
.
Pig
mea
tA
ug
-16
Imp
ort
ban
Te
mp
ora
rily
su
spen
ded
fee
der
an
d b
reed
ing
cat
tle
imp
ort
s fr
om
Au
stra
lia, f
ollo
win
g p
osi
tive
tes
tin
g f
or
bo
vin
e Jo
hn
e’s
dis
ease
(B
JD).
Feed
er c
attl
eA
ug
-16
Imp
ort
ban
lift
ed
An
no
un
ced
th
e re
op
enin
g o
f tr
ade
in f
eed
er a
nd
bre
edin
g c
attl
e fr
om
Au
stra
lia, f
ollo
win
g a
gre
emen
t o
n im
pro
ved
exp
ort
cer
tifi
cati
on
pro
cess
es f
or
all c
on
sig
nm
ents
. In
May
201
6, J
apan
su
spen
ded
live
ca
ttle
exp
ort
s fr
om
Au
stra
lia in
res
po
nse
to
cat
tle
test
ing
po
siti
ve f
or
BJD
in p
ost
-arr
ival
qu
aran
tin
e.
The
stre
ng
then
ed c
on
dit
ion
s in
clu
de
lifet
ime
trac
eab
ility
fo
r al
l an
imal
s an
d b
iose
curi
ty c
lear
ance
fo
r th
e p
rop
erty
of
ori
gin
.
Mex
ico
Bo
vin
e m
eat
Jun
-16
Imp
ort
ban
lift
ed
Reo
pen
ed it
s m
arke
t to
bo
vin
e m
eat
fro
m C
anad
a, c
lose
d s
ince
May
200
3 af
ter
a ca
se o
f B
SE in
Can
ada.
Peru
Pou
ltry
mea
tA
ug
-16
Imp
ort
ban
ext
end
edEx
ten
ded
its
susp
ensi
on
of
imp
ort
s o
f liv
e p
ou
ltry
, hat
chin
g e
gg
s an
d p
ou
ltry
pro
du
cts
fro
m c
erta
in
area
s o
f Fr
ance
, fo
llow
ing
ou
tbre
aks
of
avia
n in
flu
enza
.
Puer
to R
ico
Pig
mea
tM
ay-1
5M
arke
t A
cces
sO
pen
ed it
s m
arke
t to
imp
ort
s o
f p
igm
eat
fro
m B
razi
l.
Ru
ssia
n F
eder
atio
nA
llJu
l-16
Imp
ort
ban
ext
end
edEx
ten
ded
th
e b
an o
n im
po
rts
of
mea
t fr
om
Au
stra
lia, C
anad
a, t
he
Euro
pea
n U
nio
n, N
orw
ay a
nd
th
e U
nit
ed S
tate
s u
nti
l th
e en
d o
f 20
17.
Un
ited
Sta
tes
Bo
vin
e m
eat
Au
g-1
6Im
po
rt b
an li
fted
Lift
ed it
s b
an o
n t
he
imp
ort
of
fres
h, c
hill
ed o
r fr
oze
n b
ovi
ne
mea
t fr
om
sel
ecte
d p
lan
ts in
des
ign
ated
st
ates
in B
razi
l, fo
llow
ing
rec
og
nit
ion
th
at t
he
pla
nts
co
nce
rned
met
th
e st
and
ard
s re
qu
ired
fo
r ex
po
rt
to t
he
Un
ited
Sta
tes.
* A
col
lect
ion
of m
ajor
mea
t po
licy
deve
lopm
ents
sta
rtin
g in
Jan
uary
201
1 is
ava
ilabl
e at
: htt
p://w
ww
.fao
.org
/eco
nom
ic/e
st/e
st-c
omm
oditi
es/c
omm
odity
-pol
icy-
arch
ive/
en/?
grou
pAN
Dco
mm
odity
=M
eat

Ma
jor p
olicy d
eve
lop
me
nts
86 87FOOD OUTLOOKOCTOBER 2016
DA
IRY:
M
AJO
R PO
LICY
DEV
ELO
PMEN
TS M
ID-M
AY
TO
MID
-SEP
TEM
BER
2016
*
CO
UN
TRY
PRO
DU
CT
DA
TEPO
LIC
Y C
ATE
GO
RY
/INST
RU
MEN
TD
ESC
RIP
TIO
N
Euro
pea
n U
nio
nD
airy
pro
du
cts
Jun
-16
Stat
e M
arke
t in
terv
enti
on
Pro
lon
ged
th
e in
terv
enti
on
per
iod
fo
r p
urc
has
ing
ski
mm
ed m
ilk p
ow
der
(SM
P) a
nd
incr
ease
d t
he
ceili
ng
to
350
000
to
nn
es –
fo
r ac
qu
isit
ion
at
a fi
xed
pri
ce o
f 16
9.8
EUR
/100
kg
.
Allo
cate
d E
UR
420
mill
ion
fo
r ta
rget
ed a
id t
o t
he
lives
tock
sec
tor,
wit
h t
he
op
tio
n o
f 10
0 p
erce
nt
top
-u
p u
sin
g n
atio
nal
fu
nd
s. E
nd
ors
ed t
he
po
ssib
ility
of
volu
nta
ry a
gre
emen
ts b
etw
een
far
mer
s to
lim
it
milk
su
pp
ly f
or
a 6-
mo
nth
per
iod
, sta
rtin
g f
rom
13
Ap
ril 2
016
(bas
ed o
n A
rtic
le 2
22 o
f th
e C
om
mo
n
Mar
ket
Org
aniz
atio
n).
In
crea
sed
fu
nd
s fo
r fo
od
pro
mo
tio
n p
rog
ram
mes
, in
clu
din
g t
he
pro
visi
on
of
milk
to
sch
oo
l ch
ildre
n in
Syr
ia.
Ind
iaD
airy
pro
du
cts
Jun
-16
Imp
ort
ban
ext
end
edEx
ten
ded
th
e b
an o
n im
po
rt o
f m
ilk a
nd
milk
pro
du
cts
fro
m C
hin
a fo
r a
furt
her
yea
r u
nti
l Ju
ne
2017
.
Jord
anD
airy
pro
du
cts
Jun
-15
Pro
du
ct s
pec
ifica
tio
nB
ann
ed t
he
use
of
par
tial
ly h
ydro
gen
ated
oils
in d
airy
pro
du
cts.
By
the
end
of
2016
, do
mes
tic
pro
du
ctio
n a
nd
imp
ort
s o
f th
ese
pro
du
cts
will
be
elim
inat
ed.
Ru
ssia
n F
eder
atio
nD
airy
pro
du
cts
Jul-
16Im
po
rt b
an e
xten
ded
Sig
ned
a d
ecre
e to
ext
end
th
e b
an o
n v
ario
us
agri
-fo
od
imp
ort
s, in
clu
din
g c
hee
se, m
ilk a
nd
mo
st t
ypes
o
f d
airy
pro
du
cts
ori
gin
atin
g in
Au
stra
lia, C
anad
a, t
he
Euro
pea
n U
nio
n, N
orw
ay a
nd
th
e U
nit
ed S
tate
s.
Turk
eyD
airy
pro
du
cts
Jul-
16St
ate
Mar
ket
inte
rven
tio
nPl
ann
ed t
o g
ran
t 11
.6 b
illio
n T
L ($
3.87
bill
ion
) in
ag
ricu
ltu
ral s
ub
sid
ies
in 2
016
to li
vest
ock
pro
du
cers
, in
clu
din
g d
airy
far
mer
s.
Un
ited
Sta
tes
Ch
eese
Au
g-1
6St
ate
Mar
ket
Inte
rven
tio
nA
nn
ou
nce
d p
lan
s to
pu
rch
ase
app
roxi
mat
ely
5 00
0 to
nn
es o
f ch
eese
fro
m p
riva
te in
ven
tori
es f
or
dis
trib
uti
on
to
fo
od
ban
ks a
nd
ch
arit
able
org
aniz
atio
ns,
wit
h t
he
aim
of
sup
po
rtin
g d
airy
pro
du
ct
pri
ces.
* A
col
lect
ion
of m
ajor
dai
ry p
olic
y de
velo
pmen
ts s
tart
ing
in J
anua
ry 2
012
is a
vaila
ble
at: h
ttp:
//ww
w.f
ao.o
rg/e
cono
mic
/est
/est
-com
mod
ities
/com
mod
ity-p
olic
y-ar
chiv
e/en
/?gr
oupA
ND
com
mod
ity=
Milk
,%20
Dai
ry%
20pr
oduc
ts

Sta
tist
ica
l a
pp
en
dix
88 89FOOD OUTLOOKOCTOBER 2016
Appendix Table 1 (a) & (b) Cereal statistics 90-91
Appendix Table 2 (a) & (b) Wheat statistics 92-93
Appendix Table 3 (a) & (b) Coarse grains statistics 94-95
Appendix Table 4 (a) & (b) Maize statistics 96-97
Appendix Table 5 (a) & (b) Barley statistics 98-99
Appendix Table 6 (a) & (b) Sorghum statistics 100-101
Appendix Table 7 (a) & (b) Other Coarse grains statistics 100-101
Appendix Table 8 (a) & (b) Rice statistics 102-103
Appendix Table 9 Cereal supply and utilization in main exporting countries 104
Appendix Table 10 Total oilcrops statistics 105
Appendix Table 11 Total oils and fats statistics 106
Appendix Table 12 Total meals and cakes statistics 107
Appendix Table 13 Total meat statistics 108
Appendix Table 14 Bovine meat statistics 109
Appendix Table 15 Ovine meat statistics 110
Appendix Table 16 Pigmeat statistics 111
Appendix Table 17 Poultry meat statistics 112
Appendix Table 18 Milk and milk products statistics 113
Appendix Table 19 Fish and fishery products statistics 114
Appendix Table 20 Selected international prices for wheat and coarse grains 115
Appendix Table 21 Wheat and maize futures prices 115
Appendix Table 22 Selected international prices for rice and price indices 116
Appendix Table 23 Selected international prices for oilcrop products and price indices 117
Appendix Table 24 Selected international prices for milk products and dairy price indices 118
Appendix Table 25 Selected international meat prices 119
Appendix Table 26 Selected international meat prices and FAO meat price index 120
Appendix Table 27 Fish price indices 121
Appendix Table 28 Selected international commodity prices 121
Statistical appendix tables

Statistica
l ap
pe
nd
ix
88 89FOOD OUTLOOKOCTOBER 2016
General• FAO estimates and forecasts are
based on official and unofficial
sources.
• Unless otherwise stated, all charts
and tables refer to FAO data as
source.
• Estimates of world imports and
exports may not always match, mainly
because shipments and deliveries
do not necessarily occur in the same
marketing year.
• Tonnes refer to metric tonnes.
• All totals are computed from
unrounded data.
• Regional totals may include estimates
for countries not listed. The countries
shown in the tables were chosen
based on their importance of either
production or trade in each region.
The totals shown for Central America
include countries in the Caribbean.
• Estimates for China also include those
for the Taiwan Province, Hong Kong
SAR and Macao SAR, unless otherwise
stated.
• Up to 2012/13, the European
Union includes 27 member states.
From 2013/14, the European Union
includes 28 member states.
• ‘-‘ means nil or negligible.
• Cereals include wheat, rice and
coarse grains. Coarse grains include
maize, barley, sorghum, millet,
rye, oats and NES (not elsewhere
specified).
Production• Cereals: Data refer to the calendar
year in which the whole harvest or
bulk of harvest takes place.
Utilization• Cereals: Data are on individual
country’s marketing year basis.
Trade• Trade between European Union
member states is excluded, unless
otherwise stated.
• Wheat: Trade data include wheat
flour in wheat grain equivalent. The
time reference period is July/June,
unless otherwise stated.
• Coarse grains: The time reference
period is July/June, unless otherwise
stated.
• Rice, dairy and meat products:
The time reference period is January/
December.
• Oilseeds, oils and fats and meals:
The time reference period is October/
September, unless otherwise stated.
Stocks• Cereals: Data refer to carry-overs at
the close of national crop seasons
ending in the year shown.
Price indices• The FAO price indices are calculated
using the Laspeyres formula; the weights used are based on the average export value of each commodity for the 2002-2004
period.
COUNTRY CLASSIFICATION
In the presentation of statistical
material, countries are subdivided
according to geographical location as
well as into the following two main
economic groupings: “developed
countries” (including the developed
market economies and the transition
markets) and “developing countries”
(including the developing market
economies and the Asia centrally
planned countries). The designation
“Developed” and “Developing”
economies is intended for statistical
convenience and does not necessarily
express a judgement about the stage
reached by a particular country or area
in the development process.
References are also made to special
country groupings: Low-Income
Food-Deficit Countries (LIFDCs),
Least Developed Countries (LDCs).
The LIFDCs include 54 countries that
are net importers of basic foodstuffs
with per caput income below the
level used by the World Bank to
determine eligibility for International
Development Aid (IDA) assistance
(i.e. USD 1 945 in 2011). The LDCs
group currently includes 48 countries
with low income as well as weak
human resources and low level of
economic diversification. The list is
reviewed every three years by the
Economic and Social Council of the
United Nations.
DISCLAIMER
The designations employed and
the presentation of material in
this publication do not imply the
expression of any opinion whatsoever
on the part of the Food and
Agriculture Organization of the United
Nations concerning the legal status
of any country, territory, city or area
or of its authorities, or concerning
the delimitation of its frontiers or
boundaries.
NOTES

Sta
tist
ica
l a
pp
en
dix
90 91FOOD OUTLOOKOCTOBER 2016
APPENDIX TABLE 1(A): CEREAL STATISTICSTable A1_a – Cereal statistics
,1,2,3,4,5,*,1,> Production Imports Exports
2012-2014 2015 2016
12/13-14/15 2015/16 2016/17
12/13-14/15 2015/16 2016/17
average average average estim. f’cast estim. f’cast estim. f’cast
(. . . . . . . . . . . . . . . . . . . . . . . . . . . . . . . . . . . . . . . . million tonnes . . . . . . . . . . . . . . . . . . . . . . . . . . . . . . . . . . . . . . .)
ASIA 1 105.0 1 118.1 1 125.8 178.8 203.3 191.6 61.2 55.0 55.7 Bangladesh 37.8 39.0 38.9 3.9 5.3 5.4 - - - China 487.1 508.5 500.4 29.2 38.9 28.3 0.9 0.8 0.8 India 242.6 228.9 244.8 0.1 0.6 1.3 20.5 12.0 13.0 Indonesia 63.1 65.4 64.5 11.5 14.1 13.6 0.1 0.4 0.4 Iran, Islamic Republic of 15.4 17.2 18.3 13.8 11.9 9.8 - 0.2 0.2 Iraq 4.4 4.3 4.2 4.8 4.2 4.4 - - - Japan 8.9 8.8 8.9 24.2 23.4 24.3 0.3 0.2 0.2 Kazakhstan 15.5 17.8 18.7 0.3 0.2 0.2 7.4 7.6 7.7 Korea, Republic of 4.4 4.6 4.5 14.3 15.0 14.9 0.1 0.1 0.1 Myanmar 18.6 18.4 18.8 0.3 0.4 0.3 1.9 2.2 2.1 Pakistan 36.3 37.4 37.9 0.5 0.4 0.4 4.7 5.0 5.4 Philippines 19.7 18.4 19.7 5.9 6.6 6.7 - - - Saudi Arabia 1.0 0.4 0.4 15.8 18.4 18.6 - - - Thailand 28.8 23.8 24.9 2.9 5.1 4.6 9.6 10.3 9.7 Turkey 34.2 38.2 34.5 6.8 6.0 7.6 3.2 4.8 4.5 Viet Nam 33.8 34.7 34.1 6.3 11.2 10.9 8.4 7.6 7.7
AFRICA 166.0 168.2 160.0 78.6 91.4 94.5 9.8 8.6 7.4 Algeria 4.4 4.1 3.4 11.7 13.6 13.2 - - - Egypt 20.4 19.9 20.2 17.4 20.9 20.6 0.4 0.4 0.4 Ethiopia 21.6 23.1 23.3 1.3 2.8 2.3 2.2 2.5 2.1 Morocco 7.4 11.7 3.5 6.4 7.4 8.8 0.2 0.2 0.1 Nigeria 21.0 22.1 23.3 7.5 7.0 7.2 0.7 0.7 0.7 South Africa 15.8 12.6 9.9 2.8 5.7 6.9 2.3 1.0 0.8 Sudan 5.3 3.4 6.6 2.8 2.8 2.9 0.2 - -
CENTRAL AMERICA 41.0 40.3 43.2 25.9 32.2 31.0 1.7 2.1 1.9 Mexico 34.5 34.6 36.5 15.1 20.3 19.7 1.5 1.9 1.7
SOUTH AMERICA 169.7 186.1 171.1 28.6 28.7 30.1 59.3 76.4 63.6 Argentina 48.8 54.7 63.3 0.1 0.1 0.1 27.1 31.2 36.6 Brazil 93.7 102.2 81.1 8.6 8.2 9.3 25.6 37.7 20.8 Chile 3.5 3.8 3.7 2.5 2.7 2.8 0.1 0.1 0.1 Colombia 2.9 3.0 3.3 6.6 7.6 7.0 0.1 0.1 0.1 Peru 4.2 4.4 4.3 4.5 4.8 4.8 - - - Venezuela 3.1 2.5 2.5 4.6 3.8 4.7 - 0.1 0.1
NORTH AMERICA 464.8 482.5 527.6 10.3 9.5 10.0 99.5 107.0 115.0 Canada 56.5 53.3 55.2 1.6 2.3 2.3 26.6 26.7 25.8 United States of America 408.2 429.2 472.3 8.8 7.2 7.8 72.8 80.3 89.2
EUROPE 474.2 497.1 498.3 23.7 27.3 25.8 96.3 123.0 115.5 European Union 305.0 312.2 301.5 19.0 22.5 21.1 39.0 46.9 36.6 Russian Federation 87.1 102.1 110.4 1.1 1.1 0.9 24.0 33.6 38.8 Serbia 8.4 8.3 8.3 0.1 0.1 0.1 2.3 2.5 2.8 Ukraine 57.5 59.9 62.6 0.2 0.2 0.2 30.2 39.2 36.6
OCEANIA 37.7 38.4 43.0 1.6 1.7 1.8 25.8 22.0 25.7 Australia 36.8 37.5 42.1 0.2 0.2 0.2 25.8 22.0 25.7
WORLD 2 458.4 2 530.7 2 569.0 347.6 394.1 384.8 353.6 394.1 384.8 Developing countries 1 426.1 1 457.6 1 446.4 274.7 315.7 305.7 121.1 132.2 119.0 Developed countries 1 032.3 1 073.1 1 122.6 72.8 78.4 79.1 232.4 261.8 265.8 LIFDCs 426.1 413.8 432.9 51.3 57.6 58.5 27.2 18.6 19.2 LDCs 164.2 165.0 168.6 30.0 34.4 34.7 9.4 9.6 8.9

Statistica
l ap
pe
nd
ix
90 91FOOD OUTLOOKOCTOBER 2016
APPENDIX TABLE 1(B): CEREAL STATISTICSTable A1_b – Cereal statistics
,1,2,3,4,5,*,1,> Total Utilization Stocks ending in Per caput food use
12/13-14/15 2015/16 2016/17
2013-2015 2016 2017
12/13-14/15 2015/16 2016/17
average average average estim. f’cast estim. f’cast estim. f’cast
(. . . . . . . . . . . . . . . . . . . . . . . . . . million tonnes . . . . . . . . . . . . . . . . . . . . .) (. . . . . . . . . . Kg/year . . . . . . .)
ASIA 1 200.0 1 256.7 1 270.7 394.0 424.5 417.2 157.3 157.4 157.7 Bangladesh 41.6 44.1 44.5 8.1 9.2 9.0 207.2 209.7 210.4 China 495.7 521.8 525.6 237.5 280.3 282.7 150.6 150.7 150.7 India 221.5 227.0 235.3 52.5 42.9 40.7 148.0 147.5 148.4 Indonesia 74.3 78.9 79.0 10.7 9.5 9.1 188.4 190.1 190.3 Iran, Islamic Republic of 27.5 29.0 29.2 4.6 6.4 5.1 201.7 201.3 202.0 Iraq 9.0 9.2 9.2 2.3 1.7 1.1 197.0 193.0 190.4 Japan 33.0 32.3 32.8 5.7 5.0 5.0 103.7 102.8 101.8 Kazakhstan 10.3 10.7 10.8 3.0 2.1 2.6 159.0 158.1 158.0 Korea, Republic of 18.6 19.0 19.2 3.7 4.5 4.8 131.4 127.4 125.2 Myanmar 17.3 17.0 17.1 3.0 2.4 2.3 209.6 209.3 209.3 Pakistan 32.4 33.8 33.5 5.0 5.0 4.5 147.8 148.3 148.1 Philippines 25.1 25.5 26.9 3.4 3.7 3.6 158.6 157.8 158.4 Saudi Arabia 16.0 19.1 18.7 6.0 6.8 6.9 144.7 147.8 148.3 Thailand 21.2 23.4 22.5 18.9 12.8 10.3 119.2 121.6 122.0 Turkey 37.6 39.2 39.5 5.2 5.6 3.9 238.3 238.3 238.8 Viet Nam 32.0 37.2 37.5 4.3 4.7 4.6 179.0 179.5 180.0
AFRICA 232.1 246.6 250.2 41.4 48.1 42.6 147.8 147.9 147.9 Algeria 15.3 16.9 17.1 4.8 6.3 5.8 231.8 231.2 231.0 Egypt 37.8 39.9 40.5 6.0 6.6 6.5 275.2 274.9 274.7 Ethiopia 20.5 22.1 22.9 2.1 2.8 2.8 168.8 171.8 172.7 Morocco 13.5 15.4 14.7 4.7 8.7 6.1 254.3 256.8 256.5 Nigeria 27.7 29.0 29.7 1.6 1.3 1.3 120.3 117.8 119.4 South Africa 16.0 16.6 16.4 2.5 3.3 2.4 168.5 167.4 167.9 Sudan 7.6 7.2 8.4 1.2 1.4 2.0 171.5 164.0 174.1
CENTRAL AMERICA 65.0 69.5 72.8 6.4 7.7 7.5 157.3 158.2 159.2 Mexico 48.1 52.1 54.9 3.2 3.9 3.6 184.0 185.3 184.2
SOUTH AMERICA 135.5 146.0 143.8 26.6 29.4 23.9 119.1 117.9 117.6 Argentina 20.5 26.0 26.9 6.1 7.9 7.9 134.0 134.8 134.7 Brazil 75.1 78.4 75.0 11.1 9.8 4.7 112.6 110.2 110.1 Chile 6.1 6.8 6.9 0.8 0.9 0.7 150.4 150.2 150.3 Colombia 9.6 10.3 10.4 0.8 0.9 1.1 99.7 102.7 103.6 Peru 8.2 8.5 8.7 1.5 1.5 1.6 148.8 149.9 150.1 Venezuela 7.5 7.0 7.2 1.2 0.7 0.6 134.6 125.7 125.2
NORTH AMERICA 365.2 377.7 397.9 66.1 84.2 104.9 109.0 109.1 109.7 Canada 29.1 29.7 30.4 11.3 8.4 8.3 96.2 96.5 97.1 United States of America 336.1 348.1 367.5 54.9 75.7 96.6 110.4 110.5 111.1
EUROPE 402.4 407.6 407.7 50.1 54.2 54.9 136.1 135.9 135.8 European Union 283.7 289.6 289.3 30.0 34.1 30.6 136.6 136.1 135.9 Russian Federation 66.4 69.5 69.9 7.8 9.3 12.0 127.0 128.2 128.3 Serbia 6.3 5.9 5.7 0.7 0.7 0.6 161.1 163.4 163.6 Ukraine 27.5 25.1 25.5 7.3 5.3 6.0 156.4 154.6 154.8
OCEANIA 15.4 16.0 17.1 6.8 7.5 8.9 91.1 91.2 91.0 Australia 13.1 13.6 14.7 6.3 6.9 8.3 98.6 99.0 99.2
WORLD 2 415.7 2 520.1 2 560.2 591.4 655.5 659.9 148.7 148.8 149.0 Developing countries 1 549.1 1 634.4 1 652.6 451.4 491.9 473.4 153.6 153.6 153.8 Developed countries 866.6 885.7 907.7 140.0 163.6 186.5 128.5 128.3 128.4 LIFDCs 448.0 463.2 474.8 90.5 81.8 77.7 146.4 146.2 146.6 LDCs 183.0 191.5 194.8 35.1 35.8 34.2 152.9 153.6 153.5

Sta
tist
ica
l a
pp
en
dix
92 93FOOD OUTLOOKOCTOBER 2016
APPENDIX TABLE 2(A): WHEAT STATISTICSTable A2_a – Wheat statistics
,1,2,3,4,5,*,1,> Production Imports Exports
2012-2014 2015 2016
12/13-14/15 2015/16 2016/17
12/13-14/15 2015/16 2016/17
average average average estim. f’cast estim. f’cast estim. f’cast
(. . . . . . . . . . . . . . . . . . . . . . . . . . . . . . . . . . . . . . . . million tonnes . . . . . . . . . . . . . . . . . . . . . . . . . . . . . . . . . . . . . . .)
ASIA 313.0 317.1 321.8 73.1 79.7 80.1 18.9 15.6 16.1 Bangladesh 1.2 1.4 1.4 2.8 4.4 4.4 - - - China 123.0 130.2 128.6 5.7 5.3 5.5 0.4 0.2 0.3 of which Taiwan Prov.
- - - 1.4 1.4 1.5 - - -
India 94.7 86.5 93.5 0.1 0.4 1.0 5.2 0.8 1.0 Indonesia - - - 7.4 9.7 10.0 0.1 0.1 0.1 Iran, Islamic Republic of 9.6 11.5 12.5 5.8 3.3 2.2 - 0.2 0.2 Iraq 3.1 3.2 3.0 3.4 3.0 3.0 - - - Japan 0.8 1.0 1.0 6.0 5.5 6.0 0.2 0.2 0.2 Kazakhstan 12.3 13.7 14.5 0.2 0.1 0.1 6.9 6.9 7.0 Korea, Republic of - - - 4.4 4.3 4.4 0.1 0.1 0.1 Pakistan 24.6 25.1 25.5 0.4 0.1 0.1 0.7 0.6 0.9 Philippines - - - 4.0 4.7 4.9 - - - Saudi Arabia 0.6 - - 3.0 3.3 3.8 - - - Thailand - - - 2.4 4.7 4.2 - - - Turkey 20.4 22.6 20.5 4.6 4.0 5.0 3.1 4.6 4.4
AFRICA 26.1 28.1 22.5 43.8 50.7 50.3 1.3 1.0 0.9 Algeria 2.9 2.8 2.2 7.3 8.2 8.0 - - - Egypt 9.2 9.0 9.0 10.1 12.2 12.0 - - - Ethiopia 3.9 4.2 4.3 1.0 2.5 2.0 - - - Morocco 5.3 8.0 2.7 4.1 4.5 5.0 0.2 0.2 0.1 Nigeria 0.1 0.1 0.1 4.4 4.5 4.5 0.5 0.5 0.5 South Africa 1.8 1.4 1.7 1.7 2.4 2.3 0.3 0.1 0.1 Tunisia 1.4 0.9 1.0 1.7 2.0 2.0 0.1 0.1 0.1
CENTRAL AMERICA 3.4 3.7 3.8 8.4 8.9 8.4 1.1 1.4 1.3 Cuba - - - 0.8 0.8 0.8 - - - Mexico 3.4 3.7 3.8 4.4 4.8 4.4 1.0 1.3 1.2
SOUTH AMERICA 20.0 20.6 25.2 14.0 12.6 12.7 7.0 11.3 11.3 Argentina 10.4 11.3 15.0 - - - 4.2 8.6 9.0 Brazil 5.5 5.4 6.2 6.7 5.9 6.0 1.2 1.1 1.1 Chile 1.3 1.5 1.7 0.8 0.8 0.7 - - - Colombia - - - 1.6 1.8 1.7 - 0.1 0.1 Peru 0.2 0.2 0.2 1.8 1.7 1.7 - - - Venezuela - - - 1.7 1.4 1.6 - - -
NORTH AMERICA 89.6 83.4 93.6 3.7 2.7 3.4 49.1 43.6 46.5 Canada 31.4 27.6 30.5 0.2 0.3 0.3 21.8 22.1 21.5 United States of America 58.2 55.8 63.2 3.5 2.4 3.1 27.3 21.6 25.0
EUROPE 222.7 256.3 247.1 7.4 9.4 9.2 56.4 76.1 70.0 European Union 144.4 160.5 144.0 4.9 6.6 6.5 28.8 33.4 25.5 Russian Federation 49.8 61.8 69.5 0.5 0.7 0.6 17.2 24.3 29.5 Ukraine 20.7 26.5 25.6 - 0.1 0.1 9.4 17.4 14.0
OCEANIA 24.3 24.5 28.4 0.9 0.9 0.9 18.8 15.8 19.0 Australia 24.0 24.2 28.1 - - - 18.8 15.8 19.0
WORLD 699.0 733.8 742.4 151.3 164.9 165.0 152.5 164.9 165.0 Developing countries 335.4 341.1 343.4 124.0 136.1 135.8 20.0 21.2 21.4 Developed countries 363.6 392.7 399.0 27.3 28.9 29.2 132.6 143.7 143.6 LIFDCs 119.7 111.1 117.3 29.4 35.5 34.9 6.6 2.1 2.3 LDCs 13.5 13.2 12.9 17.3 21.8 21.1 0.2 0.1 0.1

Statistica
l ap
pe
nd
ix
92 93FOOD OUTLOOKOCTOBER 2016
APPENDIX TABLE 2(B): WHEAT STATISTICSTable A2_b – Wheat statistics
,1,2,3,4,5,*,1,> Total Utilization Stocks ending in Per caput food use
12/13-14/15 2015/16 2016/17
2013-2015 2016 2017
12/13-14/15 2015/16 2016/17
average average average estim. f’cast estim. f’cast estim. f’cast
(. . . . . . . . . . . . . . . . . . . . . . . . . . million tonnes . . . . . . . . . . . . . . . . . . . . .) (. . . . . . . . . . Kg/year . . . . . . . .)
ASIA 363.4 369.8 378.9 112.1 132.4 138.9 64.7 65.2 65.4 Bangladesh 4.2 5.1 5.5 0.7 1.6 1.8 23.1 24.1 24.7 China 124.8 119.5 121.9 54.7 75.7 87.5 63.9 64.0 64.0 of which Taiwan Prov.
1.3 1.4 1.5 0.5 0.5 0.5 45.3 45.8 45.7
India 87.4 89.8 94.2 25.1 23.0 22.0 59.1 59.5 59.6 Indonesia 7.2 8.7 9.9 1.0 0.9 0.9 24.2 25.6 25.7 Iran, Islamic Republic of 14.5 15.2 15.4 2.3 3.5 2.5 166.9 167.0 167.4 Iraq 6.3 6.6 6.7 1.8 1.6 0.9 151.0 152.4 151.8 Japan 6.6 6.6 6.7 1.0 0.5 0.7 42.3 42.9 42.7 Kazakhstan 7.5 7.5 7.4 2.8 1.6 1.8 144.7 143.3 143.2 Korea, Republic of 4.4 4.1 4.4 0.8 0.8 0.7 47.6 48.3 48.1 Pakistan 24.4 25.1 25.0 2.8 3.0 2.7 125.6 125.7 125.7 Philippines 4.0 4.9 5.0 0.6 0.6 0.5 23.1 23.3 23.5 Saudi Arabia 3.4 3.6 3.6 2.5 2.8 3.0 98.6 100.8 100.8 Thailand 2.5 4.3 4.3 0.8 1.3 1.2 15.7 16.6 16.5 Turkey 21.9 22.3 22.5 2.9 2.7 1.5 209.1 209.1 209.7
AFRICA 67.6 72.2 72.7 16.8 22.0 19.3 50.8 50.7 50.2 Algeria 9.6 10.3 10.5 3.4 4.4 4.1 209.8 209.9 209.9 Egypt 19.8 20.8 21.2 4.0 4.5 4.3 189.5 190.1 190.6 Ethiopia 4.8 5.5 5.6 0.5 0.8 0.8 41.2 43.2 43.2 Morocco 8.9 9.9 9.4 3.6 6.5 4.7 202.3 203.6 203.9 Nigeria 3.9 4.0 4.0 0.2 0.2 0.2 20.3 19.6 19.1 South Africa 3.2 3.2 3.4 0.5 0.5 0.7 57.7 57.3 58.7 Tunisia 3.0 3.0 3.0 0.8 0.6 0.5 211.1 211.0 211.0
CENTRAL AMERICA 10.7 10.9 11.0 1.3 1.6 1.6 44.0 44.1 44.5 Cuba 0.8 0.8 0.8 - 0.1 0.1 55.5 55.3 55.3 Mexico 6.8 7.0 7.1 0.7 0.8 0.8 47.5 48.0 48.6
SOUTH AMERICA 26.1 26.4 26.7 6.3 5.0 5.1 59.6 59.0 58.6 Argentina 5.5 5.7 6.0 2.4 2.0 2.1 117.2 117.5 117.5 Brazil 11.0 11.1 11.2 1.6 0.8 0.8 51.6 51.5 51.3 Chile 2.3 2.4 2.4 0.1 0.1 0.2 120.3 120.2 120.3 Colombia 1.5 1.5 1.5 0.3 0.5 0.5 28.2 28.2 28.1 Peru 1.9 2.0 2.0 0.5 0.6 0.6 60.2 60.5 60.1 Venezuela 1.7 1.5 1.6 0.3 0.1 0.1 56.6 48.6 48.6
NORTH AMERICA 43.2 40.3 46.1 26.2 30.9 34.6 81.9 82.2 82.3 Canada 8.7 8.8 8.9 7.5 4.2 4.7 80.4 80.7 81.3 United States of America 34.5 31.6 37.2 18.7 26.7 29.9 82.0 82.4 82.4
EUROPE 174.7 187.7 186.3 21.5 28.6 28.4 110.0 109.3 109.3 European Union 119.4 129.8 128.8 10.4 17.2 13.2 111.9 111.0 110.9 Russian Federation 35.0 38.0 38.5 4.9 6.0 8.1 100.3 100.7 100.7 Ukraine 11.8 11.4 10.7 3.3 2.1 3.1 122.4 120.6 121.0
OCEANIA 7.8 8.3 8.8 4.4 5.3 6.3 67.5 67.1 66.9 Australia 6.7 7.1 7.6 4.1 4.9 5.9 79.1 79.3 79.4
WORLD 693.5 715.7 730.5 188.7 225.8 234.2 67.2 67.2 67.2 Developing countries 431.5 442.8 452.7 128.3 154.3 157.6 60.1 60.4 60.3 Developed countries 262.0 272.8 277.8 60.4 71.5 76.6 96.6 96.4 96.4 LIFDCs 140.1 146.1 150.8 37.0 36.8 34.0 47.5 47.6 47.5 LDCs 30.2 33.4 33.8 6.7 8.6 7.5 28.7 29.4 29.1

Sta
tist
ica
l a
pp
en
dix
94 95FOOD OUTLOOKOCTOBER 2016
APPENDIX TABLE 3(A): COARSE GRAIN STATISTICSTable A3_a - Coarse grain statistics
,1,2,3,4,5,*,1,> Production Imports Exports
2012-2014 2015 2016
12/13-14/15 2015/16 2016/17
12/13-14/15 2015/16 2016/17
average average average estim. f’cast estim. f’cast estim. f’cast
(. . . . . . . . . . . . . . . . . . . . . . . . . . . . . . . . . . . . . . . . million tonnes . . . . . . . . . . . . . . . . . . . . . . . . . . . . . . . . . . . . . . .)
ASIA 345.8 356.6 353.9 84.1 102.0 90.1 6.7 3.9 3.8 China 222.6 234.5 227.3 17.2 26.8 16.0 0.1 0.1 0.1 of which Taiwan Prov.
0.1 0.1 0.1 4.4 4.6 4.7 - - -
India 42.1 38.1 43.7 - 0.2 0.3 4.2 1.2 1.3 Indonesia 19.0 19.6 19.4 3.2 2.6 2.6 - 0.3 0.3 Iran, Islamic Republic of 4.3 3.9 3.9 6.6 7.6 6.5 - - - Japan 0.2 0.2 0.2 17.5 17.2 17.6 - - - Korea, D.P.R. 2.5 2.7 2.6 0.2 0.3 0.2 - - - Korea, Republic of 0.2 0.2 0.2 9.6 10.3 10.1 - - - Malaysia 0.1 0.1 0.1 3.5 3.7 3.8 - - - Pakistan 5.3 5.5 5.5 0.1 0.3 0.3 - - - Philippines 7.5 7.0 7.5 0.4 0.6 0.6 - - - Saudi Arabia 0.4 0.4 0.4 11.4 13.7 13.2 - - - Thailand 5.0 4.8 4.9 0.2 0.2 0.1 0.5 0.4 0.2 Turkey 13.3 15.1 13.4 2.0 1.8 2.3 0.1 0.1 0.1 Viet Nam 5.1 5.3 5.2 3.7 7.7 7.8 0.1 0.1 0.1
AFRICA 121.7 121.2 117.9 20.5 27.0 30.0 8.0 7.0 6.0 Algeria 1.5 1.3 1.2 4.3 5.2 5.1 - - - Egypt 7.0 6.8 6.8 7.3 8.6 8.6 - - - Ethiopia 17.6 18.8 19.0 0.1 - - 2.2 2.5 2.1 Kenya 4.0 4.0 3.7 0.8 1.1 1.1 - - - Morocco 2.1 3.7 0.8 2.4 2.9 3.8 - - - Nigeria 18.1 19.2 20.2 0.2 0.2 0.2 0.2 0.3 0.3 South Africa 13.9 11.2 8.2 0.2 2.4 3.7 2.0 0.9 0.7 Sudan 5.0 2.9 6.2 0.4 0.4 0.3 0.2 - - Tanzania, United Rep. of
6.9 7.2 6.7 - - - 0.5 0.7 0.6
CENTRAL AMERICA 35.8 34.9 37.6 15.3 21.0 20.1 0.6 0.6 0.5 Mexico 30.9 30.8 32.5 10.1 14.9 14.6 0.5 0.6 0.5
SOUTH AMERICA 133.3 148.1 130.0 13.1 14.2 15.8 49.2 61.8 49.3 Argentina 37.3 42.4 47.3 - 0.1 0.1 22.5 22.1 27.1 Brazil 80.2 88.3 67.7 1.3 1.5 2.7 23.6 35.9 19.0 Chile 2.0 2.2 1.8 1.5 1.7 1.9 0.1 0.1 0.1 Colombia 1.5 1.5 1.5 4.8 5.5 5.2 0.1 0.1 0.1 Peru 1.9 2.0 1.9 2.4 2.9 2.8 - - - Venezuela 2.4 1.9 2.0 2.4 2.0 2.6 - 0.1 0.1
NORTH AMERICA 368.7 393.0 426.4 5.5 5.6 5.5 47.1 59.9 64.8 Canada 25.2 25.7 24.8 1.0 1.6 1.6 4.8 4.6 4.3 United States of America 343.5 367.2 401.7 4.5 4.0 3.9 42.3 55.3 60.6
EUROPE 248.9 238.2 248.6 14.1 15.5 14.1 39.4 46.5 45.2 European Union 158.7 150.0 155.7 12.5 14.1 12.7 9.9 13.2 10.8 Russian Federation 36.5 39.5 40.1 0.3 0.2 0.1 6.6 9.1 9.1 Serbia 6.1 5.9 5.9 - - - 1.6 1.7 2.0 Ukraine 36.7 33.4 36.9 0.1 - - 20.8 21.8 22.6
OCEANIA 12.8 13.4 14.4 0.2 0.3 0.3 6.6 6.0 6.4 Australia 12.2 12.9 13.8 - - - 6.6 6.0 6.4
WORLD 1 266.9 1 305.4 1 328.8 152.9 185.6 176.0 157.6 185.8 176.0 Developing countries 616.5 642.4 623.8 112.9 141.9 132.1 61.9 71.7 58.3 Developed countries 650.5 663.0 705.0 40.0 43.8 43.9 95.7 114.0 117.7 LIFDCs 146.5 143.5 152.1 6.5 8.0 8.7 9.4 6.3 6.0 LDCs 77.8 78.0 80.9 3.0 3.7 4.3 6.3 6.4 5.7
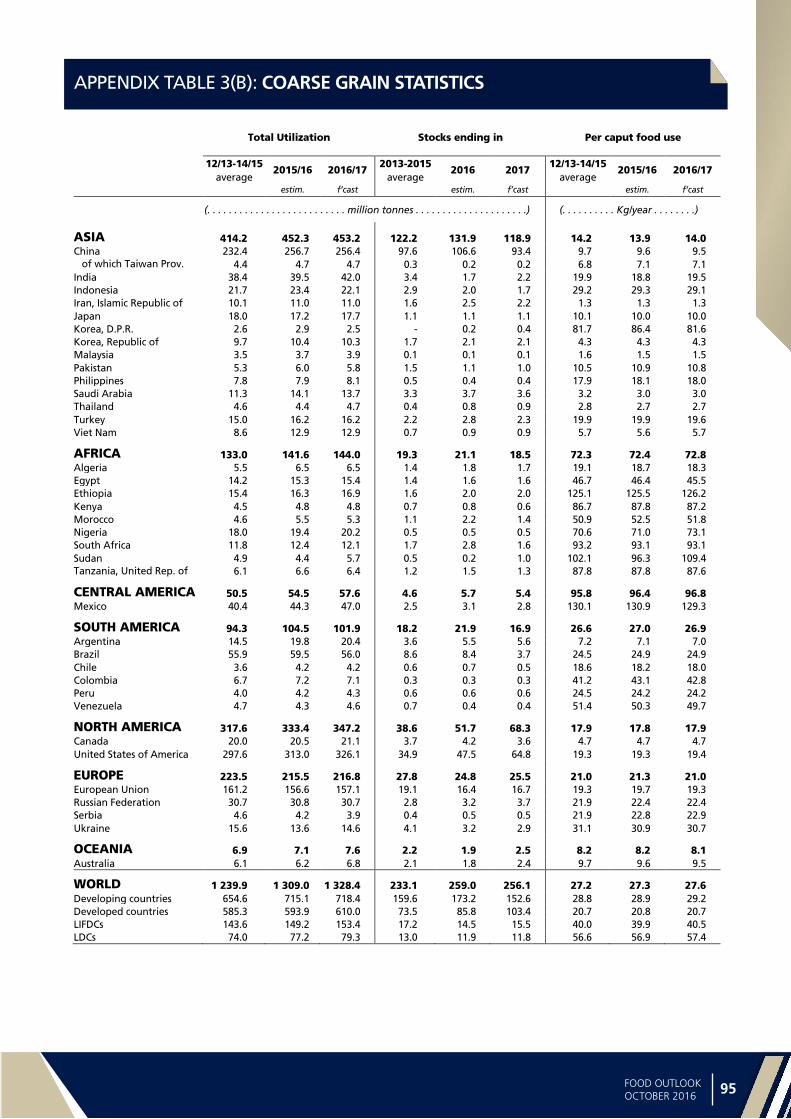
Statistica
l ap
pe
nd
ix
94 95FOOD OUTLOOKOCTOBER 2016
APPENDIX TABLE 3(B): COARSE GRAIN STATISTICSTable A3_b - Coarse grain statistics
,1,2,3,4,5,*,1,> Total Utilization Stocks ending in Per caput food use
12/13-14/15 2015/16 2016/17
2013-2015 2016 2017
12/13-14/15 2015/16 2016/17
average average average estim. f’cast estim. f’cast estim. f’cast
(. . . . . . . . . . . . . . . . . . . . . . . . . . million tonnes . . . . . . . . . . . . . . . . . . . . .) (. . . . . . . . . . Kg/year . . . . . . . .)
ASIA 414.2 452.3 453.2 122.2 131.9 118.9 14.2 13.9 14.0 China 232.4 256.7 256.4 97.6 106.6 93.4 9.7 9.6 9.5 of which Taiwan Prov.
4.4 4.7 4.7 0.3 0.2 0.2 6.8 7.1 7.1
India 38.4 39.5 42.0 3.4 1.7 2.2 19.9 18.8 19.5 Indonesia 21.7 23.4 22.1 2.9 2.0 1.7 29.2 29.3 29.1 Iran, Islamic Republic of 10.1 11.0 11.0 1.6 2.5 2.2 1.3 1.3 1.3 Japan 18.0 17.2 17.7 1.1 1.1 1.1 10.1 10.0 10.0 Korea, D.P.R. 2.6 2.9 2.5 - 0.2 0.4 81.7 86.4 81.6 Korea, Republic of 9.7 10.4 10.3 1.7 2.1 2.1 4.3 4.3 4.3 Malaysia 3.5 3.7 3.9 0.1 0.1 0.1 1.6 1.5 1.5 Pakistan 5.3 6.0 5.8 1.5 1.1 1.0 10.5 10.9 10.8 Philippines 7.8 7.9 8.1 0.5 0.4 0.4 17.9 18.1 18.0 Saudi Arabia 11.3 14.1 13.7 3.3 3.7 3.6 3.2 3.0 3.0 Thailand 4.6 4.4 4.7 0.4 0.8 0.9 2.8 2.7 2.7 Turkey 15.0 16.2 16.2 2.2 2.8 2.3 19.9 19.9 19.6 Viet Nam 8.6 12.9 12.9 0.7 0.9 0.9 5.7 5.6 5.7
AFRICA 133.0 141.6 144.0 19.3 21.1 18.5 72.3 72.4 72.8 Algeria 5.5 6.5 6.5 1.4 1.8 1.7 19.1 18.7 18.3 Egypt 14.2 15.3 15.4 1.4 1.6 1.6 46.7 46.4 45.5 Ethiopia 15.4 16.3 16.9 1.6 2.0 2.0 125.1 125.5 126.2 Kenya 4.5 4.8 4.8 0.7 0.8 0.6 86.7 87.8 87.2 Morocco 4.6 5.5 5.3 1.1 2.2 1.4 50.9 52.5 51.8 Nigeria 18.0 19.4 20.2 0.5 0.5 0.5 70.6 71.0 73.1 South Africa 11.8 12.4 12.1 1.7 2.8 1.6 93.2 93.1 93.1 Sudan 4.9 4.4 5.7 0.5 0.2 1.0 102.1 96.3 109.4 Tanzania, United Rep. of
6.1 6.6 6.4 1.2 1.5 1.3 87.8 87.8 87.6
CENTRAL AMERICA 50.5 54.5 57.6 4.6 5.7 5.4 95.8 96.4 96.8 Mexico 40.4 44.3 47.0 2.5 3.1 2.8 130.1 130.9 129.3
SOUTH AMERICA 94.3 104.5 101.9 18.2 21.9 16.9 26.6 27.0 26.9 Argentina 14.5 19.8 20.4 3.6 5.5 5.6 7.2 7.1 7.0 Brazil 55.9 59.5 56.0 8.6 8.4 3.7 24.5 24.9 24.9 Chile 3.6 4.2 4.2 0.6 0.7 0.5 18.6 18.2 18.0 Colombia 6.7 7.2 7.1 0.3 0.3 0.3 41.2 43.1 42.8 Peru 4.0 4.2 4.3 0.6 0.6 0.6 24.5 24.2 24.2 Venezuela 4.7 4.3 4.6 0.7 0.4 0.4 51.4 50.3 49.7
NORTH AMERICA 317.6 333.4 347.2 38.6 51.7 68.3 17.9 17.8 17.9 Canada 20.0 20.5 21.1 3.7 4.2 3.6 4.7 4.7 4.7 United States of America 297.6 313.0 326.1 34.9 47.5 64.8 19.3 19.3 19.4
EUROPE 223.5 215.5 216.8 27.8 24.8 25.5 21.0 21.3 21.0 European Union 161.2 156.6 157.1 19.1 16.4 16.7 19.3 19.7 19.3 Russian Federation 30.7 30.8 30.7 2.8 3.2 3.7 21.9 22.4 22.4 Serbia 4.6 4.2 3.9 0.4 0.5 0.5 21.9 22.8 22.9 Ukraine 15.6 13.6 14.6 4.1 3.2 2.9 31.1 30.9 30.7
OCEANIA 6.9 7.1 7.6 2.2 1.9 2.5 8.2 8.2 8.1 Australia 6.1 6.2 6.8 2.1 1.8 2.4 9.7 9.6 9.5
WORLD 1 239.9 1 309.0 1 328.4 233.1 259.0 256.1 27.2 27.3 27.6 Developing countries 654.6 715.1 718.4 159.6 173.2 152.6 28.8 28.9 29.2 Developed countries 585.3 593.9 610.0 73.5 85.8 103.4 20.7 20.8 20.7 LIFDCs 143.6 149.2 153.4 17.2 14.5 15.5 40.0 39.9 40.5 LDCs 74.0 77.2 79.3 13.0 11.9 11.8 56.6 56.9 57.4
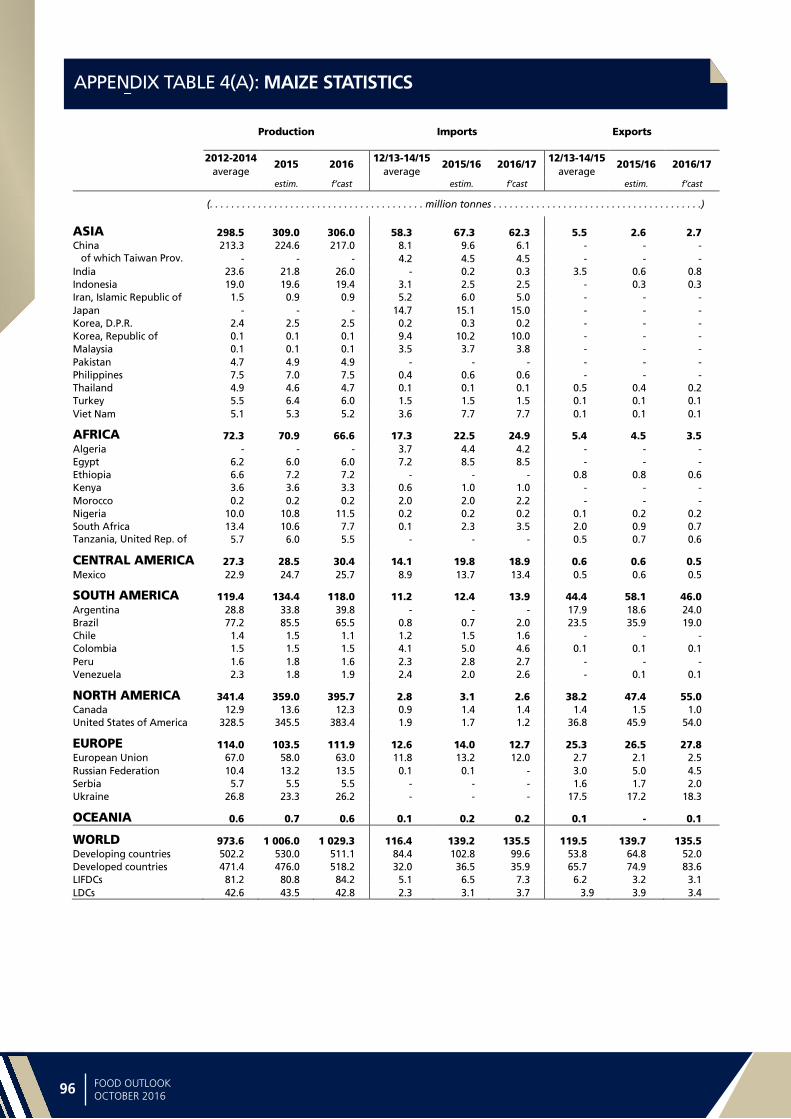
Sta
tist
ica
l a
pp
en
dix
96 97FOOD OUTLOOKOCTOBER 2016
APPENDIX TABLE 4(A): MAIZE STATISTICSTable A4_a - Maize statistics
,1,2,3,4,5,*,1,> Production Imports Exports
2012-2014 2015 2016
12/13-14/15 2015/16 2016/17
12/13-14/15 2015/16 2016/17
average average average estim. f’cast estim. f’cast estim. f’cast
(. . . . . . . . . . . . . . . . . . . . . . . . . . . . . . . . . . . . . . . . million tonnes . . . . . . . . . . . . . . . . . . . . . . . . . . . . . . . . . . . . . . .)
ASIA 298.5 309.0 306.0 58.3 67.3 62.3 5.5 2.6 2.7 China 213.3 224.6 217.0 8.1 9.6 6.1 - - - of which Taiwan Prov.
- - - 4.2 4.5 4.5 - - -
India 23.6 21.8 26.0 - 0.2 0.3 3.5 0.6 0.8 Indonesia 19.0 19.6 19.4 3.1 2.5 2.5 - 0.3 0.3 Iran, Islamic Republic of 1.5 0.9 0.9 5.2 6.0 5.0 - - - Japan - - - 14.7 15.1 15.0 - - - Korea, D.P.R. 2.4 2.5 2.5 0.2 0.3 0.2 - - - Korea, Republic of 0.1 0.1 0.1 9.4 10.2 10.0 - - - Malaysia 0.1 0.1 0.1 3.5 3.7 3.8 - - - Pakistan 4.7 4.9 4.9 - - - - - - Philippines 7.5 7.0 7.5 0.4 0.6 0.6 - - - Thailand 4.9 4.6 4.7 0.1 0.1 0.1 0.5 0.4 0.2 Turkey 5.5 6.4 6.0 1.5 1.5 1.5 0.1 0.1 0.1 Viet Nam 5.1 5.3 5.2 3.6 7.7 7.7 0.1 0.1 0.1
AFRICA 72.3 70.9 66.6 17.3 22.5 24.9 5.4 4.5 3.5 Algeria - - - 3.7 4.4 4.2 - - - Egypt 6.2 6.0 6.0 7.2 8.5 8.5 - - - Ethiopia 6.6 7.2 7.2 - - - 0.8 0.8 0.6 Kenya 3.6 3.6 3.3 0.6 1.0 1.0 - - - Morocco 0.2 0.2 0.2 2.0 2.0 2.2 - - - Nigeria 10.0 10.8 11.5 0.2 0.2 0.2 0.1 0.2 0.2 South Africa 13.4 10.6 7.7 0.1 2.3 3.5 2.0 0.9 0.7 Tanzania, United Rep. of
5.7 6.0 5.5 - - - 0.5 0.7 0.6
CENTRAL AMERICA 27.3 28.5 30.4 14.1 19.8 18.9 0.6 0.6 0.5 Mexico 22.9 24.7 25.7 8.9 13.7 13.4 0.5 0.6 0.5
SOUTH AMERICA 119.4 134.4 118.0 11.2 12.4 13.9 44.4 58.1 46.0 Argentina 28.8 33.8 39.8 - - - 17.9 18.6 24.0 Brazil 77.2 85.5 65.5 0.8 0.7 2.0 23.5 35.9 19.0 Chile 1.4 1.5 1.1 1.2 1.5 1.6 - - - Colombia 1.5 1.5 1.5 4.1 5.0 4.6 0.1 0.1 0.1 Peru 1.6 1.8 1.6 2.3 2.8 2.7 - - - Venezuela 2.3 1.8 1.9 2.4 2.0 2.6 - 0.1 0.1
NORTH AMERICA 341.4 359.0 395.7 2.8 3.1 2.6 38.2 47.4 55.0 Canada 12.9 13.6 12.3 0.9 1.4 1.4 1.4 1.5 1.0 United States of America 328.5 345.5 383.4 1.9 1.7 1.2 36.8 45.9 54.0
EUROPE 114.0 103.5 111.9 12.6 14.0 12.7 25.3 26.5 27.8 European Union 67.0 58.0 63.0 11.8 13.2 12.0 2.7 2.1 2.5 Russian Federation 10.4 13.2 13.5 0.1 0.1 - 3.0 5.0 4.5 Serbia 5.7 5.5 5.5 - - - 1.6 1.7 2.0 Ukraine 26.8 23.3 26.2 - - - 17.5 17.2 18.3
OCEANIA 0.6 0.7 0.6 0.1 0.2 0.2 0.1 - 0.1
WORLD 973.6 1 006.0 1 029.3 116.4 139.2 135.5 119.5 139.7 135.5 Developing countries 502.2 530.0 511.1 84.4 102.8 99.6 53.8 64.8 52.0 Developed countries 471.4 476.0 518.2 32.0 36.5 35.9 65.7 74.9 83.6 LIFDCs 81.2 80.8 84.2 5.1 6.5 7.3 6.2 3.2 3.1 LDCs 42.6 43.5 42.8 2.3 3.1 3.7 3.9 3.9 3.4
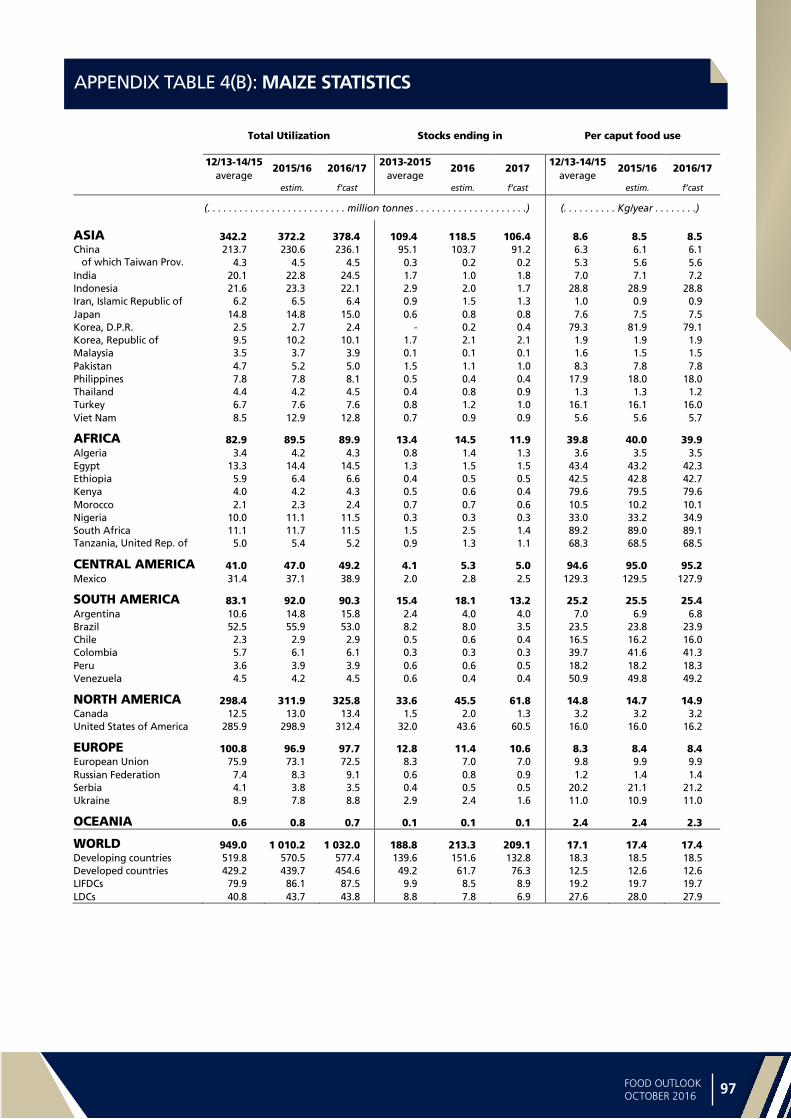
Statistica
l ap
pe
nd
ix
96 97FOOD OUTLOOKOCTOBER 2016
APPENDIX TABLE 4(B): MAIZE STATISTICSTable A4_b - Maize statistics
,1,2,3,4,5,*,1,> Total Utilization Stocks ending in Per caput food use
12/13-14/15 2015/16 2016/17
2013-2015 2016 2017
12/13-14/15 2015/16 2016/17
average average average estim. f’cast estim. f’cast estim. f’cast
(. . . . . . . . . . . . . . . . . . . . . . . . . . million tonnes . . . . . . . . . . . . . . . . . . . . .) (. . . . . . . . . . Kg/year . . . . . . . .)
ASIA 342.2 372.2 378.4 109.4 118.5 106.4 8.6 8.5 8.5 China 213.7 230.6 236.1 95.1 103.7 91.2 6.3 6.1 6.1 of which Taiwan Prov.
4.3 4.5 4.5 0.3 0.2 0.2 5.3 5.6 5.6
India 20.1 22.8 24.5 1.7 1.0 1.8 7.0 7.1 7.2 Indonesia 21.6 23.3 22.1 2.9 2.0 1.7 28.8 28.9 28.8 Iran, Islamic Republic of 6.2 6.5 6.4 0.9 1.5 1.3 1.0 0.9 0.9 Japan 14.8 14.8 15.0 0.6 0.8 0.8 7.6 7.5 7.5 Korea, D.P.R. 2.5 2.7 2.4 - 0.2 0.4 79.3 81.9 79.1 Korea, Republic of 9.5 10.2 10.1 1.7 2.1 2.1 1.9 1.9 1.9 Malaysia 3.5 3.7 3.9 0.1 0.1 0.1 1.6 1.5 1.5 Pakistan 4.7 5.2 5.0 1.5 1.1 1.0 8.3 7.8 7.8 Philippines 7.8 7.8 8.1 0.5 0.4 0.4 17.9 18.0 18.0 Thailand 4.4 4.2 4.5 0.4 0.8 0.9 1.3 1.3 1.2 Turkey 6.7 7.6 7.6 0.8 1.2 1.0 16.1 16.1 16.0 Viet Nam 8.5 12.9 12.8 0.7 0.9 0.9 5.6 5.6 5.7
AFRICA 82.9 89.5 89.9 13.4 14.5 11.9 39.8 40.0 39.9 Algeria 3.4 4.2 4.3 0.8 1.4 1.3 3.6 3.5 3.5 Egypt 13.3 14.4 14.5 1.3 1.5 1.5 43.4 43.2 42.3 Ethiopia 5.9 6.4 6.6 0.4 0.5 0.5 42.5 42.8 42.7 Kenya 4.0 4.2 4.3 0.5 0.6 0.4 79.6 79.5 79.6 Morocco 2.1 2.3 2.4 0.7 0.7 0.6 10.5 10.2 10.1 Nigeria 10.0 11.1 11.5 0.3 0.3 0.3 33.0 33.2 34.9 South Africa 11.1 11.7 11.5 1.5 2.5 1.4 89.2 89.0 89.1 Tanzania, United Rep. of
5.0 5.4 5.2 0.9 1.3 1.1 68.3 68.5 68.5
CENTRAL AMERICA 41.0 47.0 49.2 4.1 5.3 5.0 94.6 95.0 95.2 Mexico 31.4 37.1 38.9 2.0 2.8 2.5 129.3 129.5 127.9
SOUTH AMERICA 83.1 92.0 90.3 15.4 18.1 13.2 25.2 25.5 25.4 Argentina 10.6 14.8 15.8 2.4 4.0 4.0 7.0 6.9 6.8 Brazil 52.5 55.9 53.0 8.2 8.0 3.5 23.5 23.8 23.9 Chile 2.3 2.9 2.9 0.5 0.6 0.4 16.5 16.2 16.0 Colombia 5.7 6.1 6.1 0.3 0.3 0.3 39.7 41.6 41.3 Peru 3.6 3.9 3.9 0.6 0.6 0.5 18.2 18.2 18.3 Venezuela 4.5 4.2 4.5 0.6 0.4 0.4 50.9 49.8 49.2
NORTH AMERICA 298.4 311.9 325.8 33.6 45.5 61.8 14.8 14.7 14.9 Canada 12.5 13.0 13.4 1.5 2.0 1.3 3.2 3.2 3.2 United States of America 285.9 298.9 312.4 32.0 43.6 60.5 16.0 16.0 16.2
EUROPE 100.8 96.9 97.7 12.8 11.4 10.6 8.3 8.4 8.4 European Union 75.9 73.1 72.5 8.3 7.0 7.0 9.8 9.9 9.9 Russian Federation 7.4 8.3 9.1 0.6 0.8 0.9 1.2 1.4 1.4 Serbia 4.1 3.8 3.5 0.4 0.5 0.5 20.2 21.1 21.2 Ukraine 8.9 7.8 8.8 2.9 2.4 1.6 11.0 10.9 11.0
OCEANIA 0.6 0.8 0.7 0.1 0.1 0.1 2.4 2.4 2.3
WORLD 949.0 1 010.2 1 032.0 188.8 213.3 209.1 17.1 17.4 17.4 Developing countries 519.8 570.5 577.4 139.6 151.6 132.8 18.3 18.5 18.5 Developed countries 429.2 439.7 454.6 49.2 61.7 76.3 12.5 12.6 12.6 LIFDCs 79.9 86.1 87.5 9.9 8.5 8.9 19.2 19.7 19.7 LDCs 40.8 43.7 43.8 8.8 7.8 6.9 27.6 28.0 27.9

Sta
tist
ica
l a
pp
en
dix
98 99FOOD OUTLOOKOCTOBER 2016
APPENDIX TABLE 5(A): BARLEY STATISTICSTable A5_a - Barley statistics
,1,2,3,4,5,*,1,> Production Imports Exports
2012-2014 2015 2016
12/13-14/15 2015/16 2016/17
12/13-14/15 2015/16 2016/17
average average average estim. f’cast estim. f’cast estim. f’cast
(. . . . . . . . . . . . . . . . . . . . . . . . . . . . . . . . . . . . . . . . million tonnes . . . . . . . . . . . . . . . . . . . . . . . . . . . . . . . . . . . . . . .)
ASIA 19.6 21.9 20.4 19.1 23.5 20.7 0.9 1.0 0.8 China 1.7 2.0 2.1 4.8 7.6 4.6 - - - India 1.7 1.6 1.5 - - - 0.5 0.4 0.3 Iran, Islamic Republic of
2.8 3.0 3.0 1.4 1.6 1.5 - - -
Iraq 0.8 0.8 0.8 0.1 0.1 0.1 - - - Japan 0.2 0.2 0.2 1.3 1.1 1.3 - - - Kazakhstan 2.2 2.7 2.7 - - - 0.4 0.6 0.5 Saudi Arabia - - - 8.7 10.0 9.7 - - - Syria 0.8 1.0 0.8 0.4 0.5 0.5 - - - Turkey 7.1 8.0 6.8 0.4 0.3 0.8 - - -
AFRICA 6.5 7.6 4.7 2.2 3.4 4.1 - - - Algeria 1.4 1.2 1.1 0.6 0.8 0.9 - - - Ethiopia 1.9 1.9 1.9 - - - - - - Libya 0.1 0.1 0.1 0.5 0.9 1.0 - - - Morocco 1.9 3.5 0.6 0.3 0.8 1.5 - - - Tunisia 0.6 0.4 0.4 0.6 0.8 0.6 - - -
CENTRAL AMERICA 0.8 0.8 0.8 0.1 0.2 0.2 - - - Mexico 0.8 0.8 0.8 0.1 0.2 0.2 - - -
SOUTH AMERICA 5.1 5.7 4.9 0.9 1.0 1.0 2.8 2.7 2.5 Argentina 4.3 4.9 4.0 - - - 2.7 2.6 2.4
NORTH AMERICA 12.9 12.9 12.8 0.5 0.5 0.6 1.8 1.5 1.6 Canada 8.5 8.2 8.7 0.1 0.1 0.1 1.5 1.3 1.3 United States of America 4.5 4.7 4.1 0.5 0.4 0.5 0.3 0.2 0.3
EUROPE 86.1 89.6 89.1 0.5 0.6 0.5 13.3 19.3 16.8 Belarus 1.9 1.5 1.5 - - - 0.1 0.1 0.1 European Union 58.3 60.8 60.0 0.1 0.3 0.2 6.8 10.8 8.0 Russian Federation 16.6 17.5 17.2 0.2 0.1 0.1 3.4 4.0 4.5 Ukraine 7.9 8.3 8.9 - - - 3.0 4.4 4.2
OCEANIA 8.8 8.9 9.8 - - - 5.4 4.9 5.4 Australia 8.4 8.6 9.5 - - - 5.4 4.9 5.4
WORLD 139.8 147.4 142.5 23.3 29.3 27.0 24.1 29.4 27.0 Developing countries 27.9 30.9 25.8 20.5 26.4 24.0 3.3 3.2 2.8 Developed countries 111.9 116.5 116.7 2.8 3.0 3.1 20.8 26.2 24.2 LIFDCs 5.7 5.7 5.4 0.5 0.5 0.5 0.5 0.4 0.3 LDCs 2.5 2.4 2.4 - - - - - -

Statistica
l ap
pe
nd
ix
98 99FOOD OUTLOOKOCTOBER 2016
APPENDIX TABLE 5(B): BARLEY STATISTICSTable A5_b - Barley statistics
,1,2,3,4,5,*,1,> Total Utilization Stocks ending in Per caput food use
12/13-14/15 2015/16 2016/17
2013-2015 2016 2017
12/13-14/15 2015/16 2016/17
average average average estim. f’cast estim. f’cast estim. f’cast
(. . . . . . . . . . . . . . . . . . . . . . . . . . million tonnes . . . . . . . . . . . . . . . . . . . . .) (. . . . . . . . . . Kg/year . . . . . . . .)
ASIA 37.0 43.8 39.9 9.1 10.7 10.3 0.6 0.6 0.6 China 6.2 10.1 6.6 1.4 1.6 1.2 0.1 0.2 0.2 India 1.4 1.3 1.2 - - - 0.9 0.8 0.7 Iran, Islamic Republic of
4.0 4.5 4.6 0.7 1.0 0.9 0.3 0.3 0.3
Iraq 0.9 0.9 0.8 - - - 3.8 3.6 3.5 Japan 1.5 1.3 1.4 0.3 0.2 0.2 2.4 2.4 2.4 Kazakhstan 1.8 2.0 2.1 0.1 0.2 0.4 1.2 1.1 1.1 Saudi Arabia 8.3 10.0 9.8 3.1 3.4 3.3 0.9 0.9 0.9 Syria 1.2 1.4 1.2 0.6 0.5 0.5 14.5 15.1 15.1 Turkey 7.5 7.9 7.9 1.3 1.5 1.2 1.1 1.0 1.0
AFRICA 8.8 10.0 9.7 1.6 2.6 1.7 3.3 3.4 3.3 Algeria 2.0 2.1 2.1 0.6 0.4 0.4 15.5 15.1 14.9 Ethiopia 1.9 1.9 2.0 0.1 0.1 0.1 16.1 16.5 16.4 Libya 0.6 1.0 1.1 - - - 13.2 13.2 13.1 Morocco 2.4 3.1 2.8 0.4 1.5 0.8 40.4 42.2 41.6 Tunisia 1.1 1.1 1.1 0.4 0.4 0.3 8.2 8.0 7.9
CENTRAL AMERICA 0.9 0.9 0.9 0.1 0.1 0.1 - - - Mexico 0.9 0.9 0.9 0.1 0.1 0.1 - - -
SOUTH AMERICA 3.1 3.9 3.5 0.7 0.9 0.8 0.5 0.5 0.5 Argentina 1.4 2.2 1.7 0.6 0.8 0.8 - - -
NORTH AMERICA 10.7 10.5 10.8 3.1 3.6 3.7 0.5 0.5 0.5 Canada 6.2 6.2 6.4 1.4 1.4 1.7 0.3 0.3 0.3 United States of America 4.5 4.3 4.4 1.8 2.2 2.0 0.6 0.5 0.5
EUROPE 73.4 71.8 72.5 9.2 8.9 9.2 1.0 1.1 1.0 Belarus 1.8 1.6 1.6 0.3 0.3 0.2 - - - European Union 51.6 51.3 52.2 7.2 6.5 6.5 0.8 0.8 0.7 Russian Federation 13.4 13.2 12.9 0.9 1.5 1.4 1.1 1.2 1.2 Ukraine 5.0 4.1 4.3 0.7 0.4 0.8 3.3 3.3 3.4
OCEANIA 3.7 3.8 4.1 1.2 1.2 1.5 0.2 0.2 0.2 Australia 3.3 3.4 3.7 1.2 1.2 1.5 0.3 0.3 0.2
WORLD 137.6 144.7 141.3 25.2 28.0 27.4 1.0 1.1 1.0 Developing countries 44.4 53.0 48.2 9.8 11.8 9.9 1.1 1.1 1.1 Developed countries 93.2 91.7 93.2 15.3 16.2 17.6 1.0 1.0 1.0 LIFDCs 5.8 5.8 5.6 1.0 1.0 1.0 1.3 1.3 1.2 LDCs 2.5 2.4 2.5 0.2 0.2 0.2 1.8 1.9 1.9

Sta
tist
ica
l a
pp
en
dix
100 101FOOD OUTLOOKOCTOBER 2016
APPENDIX TABLE 6(A): SORGHUM STATISTICS
APPENDIX TABLE 7(A): OTHER COARSE GRAIN STATISTICS: MILLET, RYE, OATS AND OTHER GRAINS
Table A6_a – Sorghum statistics
,1,2,3,4,5,*,1,> Production Imports Exports
2012-2014 2015 2016
12/13-14/15 2015/16 2016/17
12/13-14/15 2015/16 2016/17
average average average estim. f’cast estim. f’cast estim. f’cast
(. . . . . . . . . . . . . . . . . . . . . . . . . . . . . . . . . . . . . . . . million tonnes . . . . . . . . . . . . . . . . . . . . . . . . . . . . . . . . . . . . . . .)
ASIA 9.2 8.3 9.5 5.9 10.3 6.1 0.1 0.1 - China 2.8 3.1 3.4 4.2 9.5 5.1 - - - India 5.4 4.4 5.4 - - - 0.1 0.1 - Japan - - - 1.4 0.7 0.8 - - -
AFRICA 25.5 24.5 28.2 0.9 1.0 0.9 1.0 0.7 0.6 Burkina Faso 1.8 1.4 1.7 - - - 0.1 - - Ethiopia 3.9 4.3 4.4 0.1 - - 0.4 0.5 0.4 Nigeria 6.7 7.0 7.3 - - - 0.1 0.1 0.1 Sudan 4.4 2.4 5.4 0.3 0.3 0.3 0.2 - -
CENTRAL AMERICA 7.4 5.6 6.3 0.9 0.5 0.6 - - - Mexico 7.0 5.2 5.9 0.9 0.5 0.6 - - -
SOUTH AMERICA 7.0 6.3 5.0 0.7 0.3 0.6 1.9 0.9 0.7 Argentina 3.8 3.1 3.0 - - - 1.9 0.8 0.7 Brazil 2.1 2.1 1.2 - - - - - - Venezuela 0.1 0.1 0.1 - - - - - -
NORTH AMERICA 9.1 15.2 12.4 0.1 0.1 0.1 5.1 9.0 6.2 United States of America 9.1 15.2 12.4 0.1 0.1 0.1 5.1 9.0 6.2
EUROPE 1.1 1.0 1.0 0.4 0.2 0.3 0.1 0.1 0.1 European Union 0.6 0.6 0.7 0.3 0.1 0.2 - - -
OCEANIA 1.9 2.2 2.0 0.1 - - 1.1 1.1 0.9 Australia 1.9 2.2 2.0 - - - 1.1 1.1 0.9
WORLD 61.2 63.1 64.5 9.0 12.5 8.5 9.2 11.9 8.5 Developing countries 49.0 44.5 49.0 7.0 11.3 7.2 2.9 1.6 1.3 Developed countries 12.3 18.5 15.6 2.0 1.2 1.3 6.3 10.2 7.2 LIFDCs 30.6 28.4 33.2 0.8 0.8 0.7 1.0 0.7 0.6 LDCs 16.8 15.5 18.8 0.6 0.6 0.5 0.9 0.6 0.5
Table A7_a – Other coarse grain statistics - Millet, Rye, Oats and other Grains
,1,2,3,4,5,*,1,> Production Imports Exports
2012-2014 2015 2016
12/13-14/15 2015/16 2016/17
12/13-14/15 2015/16 2016/17
average average average estim. f’cast estim. f’cast estim. f’cast
(. . . . . . . . . . . . . . . . . . . . . . . . . . . . . . . . . . . . . . . . million tonnes . . . . . . . . . . . . . . . . . . . . . . . . . . . . . . . . . . . . . . .)
ASIA 18.5 17.5 17.9 0.8 1.0 1.1 0.2 0.2 0.3
AFRICA 17.5 18.1 18.4 0.1 0.1 0.1 1.6 1.9 1.9
CENTRAL AMERICA 0.1 0.1 0.1 0.3 0.5 0.5 - - -
SOUTH AMERICA 1.8 1.8 2.0 0.2 0.4 0.3 0.1 0.1 0.1
NORTH AMERICA 5.2 5.9 5.4 2.1 1.8 2.2 2.1 2.0 2.1
EUROPE 47.7 44.0 46.6 0.6 0.7 0.6 0.7 0.6 0.6
OCEANIA 1.4 1.6 1.9 0.1 0.2 0.2 - 0.1 -
WORLD 92.3 88.9 92.5 4.1 4.6 5.0 4.8 4.8 5.0

Statistica
l ap
pe
nd
ix
100 101FOOD OUTLOOKOCTOBER 2016
APPENDIX TABLE 7(B): OTHER COARSE GRAIN STATISTICS: MILLET, RYE, OATS AND OTHER GRAINS
APPENDIX TABLE 6(B): SORGHUM STATISTICSTable A6_b – Sorghum statistics
,1,2,3,4,5,*,1,> Total Utilization Stocks ending in Per caput food use
12/13-14/15 2015/16 2016/17
2013-2015 2016 2017
12/13-14/15 2015/16 2016/17
average average average estim. f’cast estim. f’cast estim. f’cast
(. . . . . . . . . . . . . . . . . . . . . . . . . . million tonnes . . . . . . . . . . . . . . . . . . . . .) (. . . . . . . . . . Kg/year . . . . . . . .)
ASIA 15.7 17.1 15.7 1.2 1.3 1.1 1.4 1.2 1.4 China 7.7 11.1 8.7 0.6 0.9 0.6 0.4 0.5 0.5 India 5.4 4.4 5.4 - - - 4.0 3.2 3.9 Japan 1.4 0.7 0.8 0.2 0.1 0.1 - - -
AFRICA 25.5 25.9 27.9 2.1 1.6 2.2 18.0 17.9 18.6 Burkina Faso 1.7 1.4 1.7 0.1 - - 84.2 63.8 74.9 Ethiopia 3.6 3.7 4.0 0.3 0.5 0.5 29.8 29.1 29.9 Nigeria 6.7 6.9 7.3 0.1 0.1 0.1 31.8 31.7 32.6 Sudan 4.2 3.7 4.9 0.5 0.1 0.9 89.6 80.5 93.5
CENTRAL AMERICA 8.1 6.0 6.8 0.4 0.3 0.3 0.7 0.6 0.8 Mexico 7.8 5.6 6.5 0.3 0.2 0.2 - - -
SOUTH AMERICA 6.2 6.5 6.0 2.0 2.8 2.7 0.1 0.1 0.1 Argentina 1.9 2.2 2.4 0.6 0.7 0.8 - - - Brazil 2.1 2.1 1.4 0.4 0.4 0.2 - - - Venezuela 0.2 0.1 0.1 0.1 - 0.1 - - -
NORTH AMERICA 3.8 6.2 5.6 0.6 0.9 1.4 - - - United States of America 3.8 6.2 5.6 0.6 0.9 1.4 - - -
EUROPE 1.3 1.2 1.2 0.3 0.4 0.4 0.3 0.3 0.2 European Union 0.9 0.7 0.8 0.1 0.2 0.2 0.4 0.4 0.3
OCEANIA 1.1 0.9 1.0 0.7 0.4 0.6 0.2 0.2 0.2 Australia 1.1 0.9 1.0 0.7 0.4 0.6 - - -
WORLD 61.8 63.8 64.3 7.3 7.6 8.7 3.7 3.6 3.9 Developing countries 53.8 54.5 55.4 5.5 5.7 6.2 4.6 4.4 4.7 Developed countries 7.9 9.3 8.8 1.8 1.9 2.6 0.3 0.3 0.2 LIFDCs 30.4 29.6 32.6 2.2 1.6 2.4 10.1 9.7 10.4 LDCs 16.4 16.5 18.1 1.9 1.4 2.2 14.4 14.2 14.9
Table A7_b – Other coarse grain statistics - Millet, Rye, Oats and other Grains
,1,2,3,4,5,*,1,> Total Utilization Stocks ending in Per caput food use
12/13-14/15 2015/16 2016/17
2013-2015 2016 2017
12/13-14/15 2015/16 2016/17
average average average estim. f’cast estim. f’cast estim. f’cast
(. . . . . . . . . . . . . . . . . . . . . . . . . . million tonnes . . . . . . . . . . . . . . . . . . . . .) (. . . . . . . . . . Kg/year . . . . . . . .)
ASIA 19.3 19.3 19.2 2.5 1.4 1.1 3.6 3.5 3.5
AFRICA 15.8 16.2 16.5 2.1 2.5 2.6 11.1 11.2 11.1
CENTRAL AMERICA 0.4 0.6 0.6 - - - 0.5 0.8 0.8
SOUTH AMERICA 1.9 2.1 2.2 0.1 0.1 0.1 0.8 0.8 0.9
NORTH AMERICA 4.7 4.9 4.9 1.4 1.7 1.4 2.6 2.6 2.5
EUROPE 48.0 45.6 45.4 5.5 4.1 5.3 11.4 11.6 11.4
OCEANIA 1.5 1.6 1.9 0.2 0.2 0.3 5.4 5.5 5.4
WORLD 91.6 90.3 90.8 11.8 10.0 10.9 5.3 5.3 5.2
Table A6_b – Sorghum statistics
,1,2,3,4,5,*,1,> Total Utilization Stocks ending in Per caput food use
12/13-14/15 2015/16 2016/17
2013-2015 2016 2017
12/13-14/15 2015/16 2016/17
average average average estim. f’cast estim. f’cast estim. f’cast
(. . . . . . . . . . . . . . . . . . . . . . . . . . million tonnes . . . . . . . . . . . . . . . . . . . . .) (. . . . . . . . . . Kg/year . . . . . . . .)
ASIA 15.7 17.1 15.7 1.2 1.3 1.1 1.4 1.2 1.4 China 7.7 11.1 8.7 0.6 0.9 0.6 0.4 0.5 0.5 India 5.4 4.4 5.4 - - - 4.0 3.2 3.9 Japan 1.4 0.7 0.8 0.2 0.1 0.1 - - -
AFRICA 25.5 25.9 27.9 2.1 1.6 2.2 18.0 17.9 18.6 Burkina Faso 1.7 1.4 1.7 0.1 - - 84.2 63.8 74.9 Ethiopia 3.6 3.7 4.0 0.3 0.5 0.5 29.8 29.1 29.9 Nigeria 6.7 6.9 7.3 0.1 0.1 0.1 31.8 31.7 32.6 Sudan 4.2 3.7 4.9 0.5 0.1 0.9 89.6 80.5 93.5
CENTRAL AMERICA 8.1 6.0 6.8 0.4 0.3 0.3 0.7 0.6 0.8 Mexico 7.8 5.6 6.5 0.3 0.2 0.2 - - -
SOUTH AMERICA 6.2 6.5 6.0 2.0 2.8 2.7 0.1 0.1 0.1 Argentina 1.9 2.2 2.4 0.6 0.7 0.8 - - - Brazil 2.1 2.1 1.4 0.4 0.4 0.2 - - - Venezuela 0.2 0.1 0.1 0.1 - 0.1 - - -
NORTH AMERICA 3.8 6.2 5.6 0.6 0.9 1.4 - - - United States of America 3.8 6.2 5.6 0.6 0.9 1.4 - - -
EUROPE 1.3 1.2 1.2 0.3 0.4 0.4 0.3 0.3 0.2 European Union 0.9 0.7 0.8 0.1 0.2 0.2 0.4 0.4 0.3
OCEANIA 1.1 0.9 1.0 0.7 0.4 0.6 0.2 0.2 0.2 Australia 1.1 0.9 1.0 0.7 0.4 0.6 - - -
WORLD 61.8 63.8 64.3 7.3 7.6 8.7 3.7 3.6 3.9 Developing countries 53.8 54.5 55.4 5.5 5.7 6.2 4.6 4.4 4.7 Developed countries 7.9 9.3 8.8 1.8 1.9 2.6 0.3 0.3 0.2 LIFDCs 30.4 29.6 32.6 2.2 1.6 2.4 10.1 9.7 10.4 LDCs 16.4 16.5 18.1 1.9 1.4 2.2 14.4 14.2 14.9
Table A7_b – Other coarse grain statistics - Millet, Rye, Oats and other Grains
,1,2,3,4,5,*,1,> Total Utilization Stocks ending in Per caput food use
12/13-14/15 2015/16 2016/17
2013-2015 2016 2017
12/13-14/15 2015/16 2016/17
average average average estim. f’cast estim. f’cast estim. f’cast
(. . . . . . . . . . . . . . . . . . . . . . . . . . million tonnes . . . . . . . . . . . . . . . . . . . . .) (. . . . . . . . . . Kg/year . . . . . . . .)
ASIA 19.3 19.3 19.2 2.5 1.4 1.1 3.6 3.5 3.5
AFRICA 15.8 16.2 16.5 2.1 2.5 2.6 11.1 11.2 11.1
CENTRAL AMERICA 0.4 0.6 0.6 - - - 0.5 0.8 0.8
SOUTH AMERICA 1.9 2.1 2.2 0.1 0.1 0.1 0.8 0.8 0.9
NORTH AMERICA 4.7 4.9 4.9 1.4 1.7 1.4 2.6 2.6 2.5
EUROPE 48.0 45.6 45.4 5.5 4.1 5.3 11.4 11.6 11.4
OCEANIA 1.5 1.6 1.9 0.2 0.2 0.3 5.4 5.5 5.4
WORLD 91.6 90.3 90.8 11.8 10.0 10.9 5.3 5.3 5.2

Sta
tist
ica
l a
pp
en
dix
102 103FOOD OUTLOOKOCTOBER 2016
APPENDIX TABLE 8(A): RICE STATISTICSTable A8_a - Rice statistics
,1,2,3,4,5,*,1,> Production Imports Exports
2012-2014 2015 2016
2013-2015 2016 2017
2013-2015 2016 2017
average average average estim. f’cast estim. f’cast estim. f’cast
(. . . . . . . . . . . . . . . . . . . . . . . . . . . . . . . . million tonnes, milled equivalent . . . . . . . . . . . . . . . . . . . . . . . . . . . . . . .)
ASIA 446.3 444.4 450.1 21.6 21.5 21.4 35.6 35.5 35.8 Bangladesh 34.2 35.0 34.8 0.9 0.3 0.4 - - - China 141.5 143.8 144.5 6.4 6.8 6.8 0.4 0.5 0.4 of which Taiwan Prov.
1.2 1.2 1.2 0.1 0.1 0.1 0.1 0.1 0.1
India 105.8 104.3 107.7 - - - 11.0 10.0 10.7 Indonesia 44.2 45.8 45.1 0.9 1.8 1.0 - - - Iran, Islamic Republic of 1.5 1.7 1.9 1.3 1.1 1.1 - - - Iraq 0.2 0.1 0.2 1.1 1.0 1.1 - - - Japan 7.9 7.6 7.7 0.7 0.7 0.7 - - - Korea, D.P.R. 1.8 1.3 1.6 - 0.1 0.1 - - - Korea, Republic of 4.2 4.3 4.2 0.4 0.4 0.4 - - - Malaysia 1.7 1.7 1.7 1.0 1.2 1.2 - 0.1 - Myanmar 16.8 16.5 16.8 - - - 1.5 1.6 1.5 Pakistan 6.4 6.8 6.9 - - - 3.9 4.4 4.5 Philippines 12.2 11.4 12.2 1.5 1.3 1.2 - - - Saudi Arabia - - - 1.4 1.4 1.6 - - - Sri Lanka 2.7 3.3 3.0 0.3 - - - - - Thailand 23.8 19.0 20.1 0.3 0.3 0.3 9.1 9.9 9.5 Viet Nam 28.8 29.4 28.9 0.5 0.6 0.5 8.2 7.5 7.6
AFRICA 18.1 19.0 19.6 14.3 13.7 14.2 0.6 0.6 0.5 Cote d’Ívoire 0.5 0.5 0.5 1.3 1.4 1.3 - 0.1 - Egypt 4.2 4.1 4.3 - 0.1 0.1 0.4 0.4 0.4 Madagascar 2.7 2.5 2.5 0.3 0.3 0.3 - - - Nigeria 2.8 2.9 3.0 2.8 2.3 2.5 - - - Senegal 0.3 0.6 0.7 1.2 1.2 1.1 - - - South Africa - - - 0.9 0.9 1.0 - - - Tanzania, United Rep. of 1.4 1.9 2.0 0.2 0.1 0.1 - 0.1 0.1
CENTRAL AMERICA 1.8 1.7 1.8 2.2 2.4 2.4 0.1 - - Cuba 0.4 0.3 0.3 0.4 0.6 0.5 - - - Mexico 0.1 0.2 0.2 0.7 0.7 0.7 - - -
SOUTH AMERICA 16.5 17.3 15.9 1.6 1.9 1.6 3.1 3.3 3.0 Argentina 1.1 1.1 1.0 - - - 0.4 0.6 0.5 Brazil 8.1 8.5 7.2 0.6 0.8 0.7 0.8 0.8 0.7 Peru 2.0 2.1 2.2 0.2 0.2 0.3 - - - Uruguay 1.0 1.0 0.9 - - - 0.8 0.9 0.9
NORTH AMERICA 6.5 6.1 7.5 1.1 1.2 1.2 3.2 3.5 3.7 Canada - - - 0.4 0.4 0.4 - - - United States of America 6.5 6.1 7.5 0.7 0.8 0.8 3.2 3.5 3.7
EUROPE 2.6 2.6 2.6 2.2 2.4 2.5 0.5 0.4 0.4 European Union 1.8 1.8 1.8 1.6 1.9 1.9 0.2 0.2 0.2 Russian Federation 0.7 0.7 0.8 0.3 0.2 0.2 0.2 0.1 0.2
OCEANIA 0.7 0.5 0.2 0.5 0.5 0.5 0.4 0.2 0.4 Australia 0.6 0.5 0.2 0.1 0.2 0.2 0.4 0.2 0.4
WORLD 492.4 491.5 497.8 43.4 43.5 43.8 43.4 43.5 43.8 Developing countries 474.3 474.2 479.2 37.8 37.8 37.8 39.3 39.3 39.3 Developed countries 18.1 17.4 18.6 5.6 5.8 6.0 4.2 4.1 4.5 LIFDCs 159.8 159.2 163.5 15.4 14.2 15.0 11.2 10.2 10.9 LDCs 72.9 73.8 74.9 9.6 8.9 9.3 3.0 3.1 3.0

Statistica
l ap
pe
nd
ix
102 103FOOD OUTLOOKOCTOBER 2016
APPENDIX TABLE 8(B): RICE STATISTICSTable A8_b - Rice statistics
,1,2,3,4,5,*,1,> Total Utilization Stocks ending in Per caput food use
12/13-14/15 2015/16 2016/17
2013-2015 2016 2017
12/13-14/15 2015/16 2016/17
average average average estim. f’cast estim. f’cast estim. f’cast
(. . . . . . . . . . . . . . . . . million tonnes, milled equivalent . . . . . . . . . . . . .) (. . . . . . . . . . Kg/year . . . . . . . .)
ASIA 422.4 434.5 438.7 159.7 160.2 159.4 78.3 78.3 78.3 Bangladesh 34.7 35.8 35.7 7.0 7.3 6.9 179.4 180.8 180.9 China 138.5 145.5 147.2 85.2 98.0 101.8 77.1 77.2 77.2 of which Taiwan Prov.
1.3 1.2 1.3 0.3 0.2 0.3 48.0 48.1 48.4
India 95.7 97.6 99.2 24.0 18.2 16.5 69.0 69.2 69.3 Indonesia 45.5 46.8 47.0 6.8 6.6 6.5 135.0 135.2 135.6 Iran, Islamic Republic of 2.8 2.9 2.9 0.8 0.5 0.5 33.5 33.1 33.4 Iraq 1.4 1.3 1.3 0.4 0.1 0.1 40.1 35.2 33.2 Japan 8.3 8.5 8.4 3.6 3.4 3.3 51.3 50.0 49.1 Korea, D.P.R. 1.8 1.5 1.7 0.2 0.1 0.1 60.3 54.0 57.5 Korea, Republic of 4.5 4.4 4.4 1.2 1.7 2.0 79.4 74.8 72.8 Malaysia 2.7 2.8 2.8 0.2 0.2 0.2 83.8 84.2 84.2 Myanmar 15.6 15.3 15.4 2.9 2.2 2.2 194.2 193.4 193.4 Pakistan 2.6 2.7 2.7 0.6 0.9 0.9 11.7 11.7 11.6 Philippines 13.3 12.7 13.8 2.3 2.7 2.8 117.6 116.3 116.9 Saudi Arabia 1.3 1.4 1.5 0.2 0.4 0.3 43.0 44.0 44.6 Sri Lanka 2.9 3.2 3.2 0.3 0.7 0.6 122.6 126.6 128.7 Thailand 14.1 14.7 13.5 17.8 10.7 8.2 100.7 102.3 102.7 Viet Nam 21.1 21.6 21.9 2.8 2.9 3.0 159.7 158.7 158.9
AFRICA 31.6 32.8 33.5 5.3 4.9 4.8 24.7 24.8 24.9 Cote d’Ívoire 1.7 1.8 1.9 0.3 0.4 0.3 73.8 75.1 75.7 Egypt 3.9 3.8 3.9 0.6 0.6 0.7 38.9 38.4 38.6 Madagascar 3.0 2.9 3.0 0.3 0.2 0.1 107.1 106.9 107.0 Nigeria 5.8 5.6 5.6 0.9 0.6 0.6 29.4 27.2 27.2 Senegal 1.6 1.7 1.8 0.3 0.5 0.4 104.0 105.2 106.0 South Africa 1.0 1.0 0.9 0.2 0.1 - 17.7 17.0 16.1 Tanzania, United Rep. of 1.5 1.9 2.0 0.3 0.6 0.6 25.1 28.0 28.6
CENTRAL AMERICA 3.9 4.0 4.1 0.5 0.5 0.5 17.5 17.7 17.9 Cuba 0.8 0.8 0.9 0.1 0.1 0.1 67.4 68.7 71.6 Mexico 0.8 0.8 0.8 0.1 - - 6.3 6.4 6.3
SOUTH AMERICA 15.1 15.1 15.2 2.0 2.5 1.9 32.9 31.8 32.1 Argentina 0.5 0.5 0.5 0.1 0.4 0.2 9.6 10.2 10.3 Brazil 8.2 7.8 7.8 0.9 0.7 0.2 36.5 33.8 33.8 Peru 2.2 2.3 2.4 0.4 0.4 0.4 64.2 65.3 65.8 Uruguay 0.1 0.1 0.1 - 0.2 0.1 7.6 8.4 8.5
NORTH AMERICA 4.4 3.9 4.6 1.3 1.5 1.9 9.2 9.1 9.5 Canada 0.4 0.4 0.4 - - - 11.1 11.1 11.2 United States of America 4.0 3.5 4.2 1.2 1.5 1.9 9.0 8.9 9.3
EUROPE 4.2 4.4 4.6 0.7 0.8 1.0 5.1 5.2 5.4 European Union 3.1 3.2 3.4 0.5 0.6 0.7 5.4 5.5 5.6 Russian Federation 0.7 0.8 0.8 0.1 0.1 0.1 4.9 5.1 5.2
OCEANIA 0.7 0.7 0.7 0.2 0.3 0.1 15.5 15.8 16.0 Australia 0.3 0.3 0.3 0.2 0.2 0.1 9.9 10.1 10.3
WORLD 482.3 495.4 501.4 169.6 170.7 169.6 54.3 54.2 54.3 Developing countries 463.1 476.4 481.5 163.5 164.5 163.1 64.7 64.4 64.3 Developed countries 19.3 19.0 19.9 6.1 6.3 6.5 11.2 11.1 11.2 LIFDCs 164.3 168.0 170.6 36.3 30.5 28.2 58.9 58.7 58.7 LDCs 78.8 81.0 81.7 15.4 15.3 14.9 67.7 67.4 67.0

Sta
tist
ica
l a
pp
en
dix
104 105FOOD OUTLOOKOCTOBER 2016
APPENDIX TABLE 9: CEREAL SUPPLY AND UTILIZATION IN SELECTED EXPORTERS (million tonnes)Table A9 - Cereal supply and utilization in selected exporters (million tonnes)
,1,2,3,4,12,20,28,36,44,*,1,>
Wheat1 Coarse Grains2 Rice (milled basis)
2014/15
2015/16
2016/17
2014/15
2015/16
2016/17
2014/15
2015/16
2016/17 estim. f’cast estim. f’cast estim. f’cast
UNITED STATES (June/May) UNITED STATES UNITED STATES (Aug./July) Opening stocks 16.1 20.5 26.7 34.3 46.9 47.5 1.0 1.6 1.5 Production 55.1 55.8 63.2 377.6 367.2 401.7 7.1 6.1 7.5 Imports 4.1 3.1 3.1 3.5 4.0 3.7 0.8 0.8 0.7 Total Supply 75.3 79.4 93.0 415.4 418.1 452.9 8.9 8.4 9.8 Domestic use 31.3 31.6 37.2 311.7 313.0 326.1 4.3 3.5 4.2 Exports 23.5 21.1 25.9 56.8 57.7 62.1 3.1 3.4 3.7 Closing stocks 20.5 26.7 29.9 46.9 47.5 64.8 1.6 1.5 1.9
CANADA (August/July) CANADA THAILAND (Aug./July) Opening stocks 10.4 7.1 4.2 4.7 3.3 4.2 19.6 16.2 10.7 Production 29.4 27.6 30.5 22.1 25.7 24.8 22.0 19.0 20.1 Imports 0.1 0.1 0.1 1.8 1.7 1.5 0.3 0.2 0.3 Total Supply 40.0 34.8 34.8 28.6 30.8 30.5 41.8 35.4 31.0 Domestic use 8.9 8.8 8.9 19.8 20.5 21.1 15.1 14.7 13.5 Exports 23.9 21.8 21.2 5.4 6.1 5.8 10.5 10.0 9.3 Closing stocks 7.1 4.2 4.7 3.3 4.2 3.6 16.2 10.7 8.2
ARGENTINA (Dec./Nov.) ARGENTINA INDIA (Oct./Sept.) Opening stocks 2.0 4.9 2.0 3.8 5.3 5.5 25.5 21.5 18.2 Production 13.9 11.3 15.0 39.9 42.4 47.3 105.5 104.3 107.7 Imports 0.0 0.0 0.0 0.1 0.1 0.1 0.0 0.0 0.0 Total Supply 15.9 16.2 17.0 43.7 47.7 52.9 131.0 125.8 125.9 Domestic use 5.9 5.7 6.0 18.3 19.8 20.4 97.3 97.6 99.2 Exports 5.1 8.5 9.0 20.1 22.4 26.9 12.2 10.0 10.2 Closing stocks 4.9 2.0 2.1 5.3 5.5 5.6 21.5 18.2 16.5
AUSTRALIA (Oct./Sept.) AUSTRALIA PAKISTAN (Sept./Aug.) Opening stocks 3.9 4.3 4.9 1.9 1.9 1.8 0.7 1.1 0.9 Production 23.7 24.2 28.1 11.7 12.9 13.8 7.0 6.8 6.9 Imports 0.0 0.0 0.0 0.0 0.0 0.0 0.0 0.0 0.0 Total Supply 27.7 28.5 33.0 13.6 14.7 15.7 7.7 7.9 7.8 Domestic use 6.8 7.1 7.6 6.0 6.2 6.8 2.8 2.7 2.7 Exports 16.6 16.5 19.5 5.7 6.7 6.5 3.9 4.4 4.2 Closing stocks 4.3 4.9 5.9 1.9 1.8 2.4 1.1 0.9 0.9
EU (July/June) EU VIET NAM (Jan./Dec.) Opening stocks 9.0 13.5 17.2 20.1 22.2 16.4 2.7 3.0 2.9 Production 157.1 160.5 144.0 171.7 150.0 155.7 29.2 29.4 28.9 Imports 5.7 6.6 6.5 9.6 14.1 12.7 0.5 0.5 0.6 Total Supply 171.8 180.6 167.7 201.4 186.2 184.7 32.5 32.9 32.4 Domestic use 123.9 129.8 128.8 165.1 156.6 157.1 21.5 21.6 21.9 Exports 34.3 33.6 25.7 14.1 13.2 10.8 8.0 8.4 7.5 Closing stocks 13.5 17.2 13.2 22.2 16.4 16.7 3.0 2.9 3.0
TOTAL OF ABOVE TOTAL OF ABOVE TOTAL OF ABOVE Opening stocks 41.4 50.3 55.0 64.6 79.6 75.4 49.5 43.3 34.1 Production 279.3 279.4 280.7 623.0 598.1 643.2 170.8 165.6 171.1 Imports 9.9 9.8 9.7 15.0 19.8 18.0 1.6 1.6 1.6 Total Supply 330.6 339.5 345.5 702.6 697.5 736.6 221.9 210.5 206.8 Domestic use 176.8 182.9 188.5 520.8 516.0 531.5 140.9 140.1 141.5 Exports 103.5 101.5 101.3 102.2 106.1 112.1 37.7 36.2 34.9 Closing stocks 50.3 55.0 55.8 79.6 75.4 93.0 43.3 34.1 30.4
1 Trade data include wheat flour in wheat grain equivalent. For the EU semolina is also included. 2 Argentina (December/November) for rye, barley and oats, (March/February) for maize and sorghum; Australia (November/October) for rye, barley and oats, (March/February) for maize and sorghum; Canada (August/July); EU (July/June); United States (June/May) for rye, barley and oats, (September/August) for maize and sorghum.

Statistica
l ap
pe
nd
ix
104 105FOOD OUTLOOKOCTOBER 2016
APPENDIX TABLE 10: TOTAL OILCROPS STATISTICS (million tonnes) Table A10 – Total oilcrops statistics (million tonnes)
,1,2,3,4,*,1,> Production1 Imports Exports
12/13-14/15 2015/16 2016/17
12/13-14/15 2015/16 2016/17
12/13-14/15 2015/16 2016/17
average average average estim. f’cast estim. f’cast estim. f’cast
ASIA 134.6 124.0 132.0 100.1 120.4 122.3 2.8 2.9 3.1 China
60.2 56.8 57.0 76.9 91.3 92.8 1.1 1.3 0.9 of which: China Mainland
60.1 56.7 56.9 74.4 88.7 90.1 1.1 1.2 0.9
Taiwan Prov. 0.1 0.1 0.1 2.4 2.5 2.7 - - - India 36.9 31.6 36.9 0.2 0.3 0.3 0.8 0.8 1.1 Indonesia 11.0 11.1 12.1 2.3 2.6 2.5 0.1 0.1 0.1 Iran, Islamic Republic of 0.7 0.7 0.7 0.8 1.9 2.0 0.1 0.1 0.1 Japan 0.3 0.3 0.3 5.7 5.7 5.5 - - - Korea, Republic of 0.2 0.2 0.2 1.5 1.6 1.7 - - - Malaysia 5.0 4.7 5.2 0.7 0.8 0.9 - - 0.2 Pakistan 5.3 4.0 4.7 1.4 2.8 3.0 - - - Thailand 0.7 0.7 0.7 2.2 2.6 2.7 - - - Turkey 3.1 3.1 3.2 2.7 3.2 3.4 0.1 0.1 0.1
AFRICA 17.4 18.2 17.9 3.8 3.6 4.6 0.7 0.6 0.7 Nigeria 5.1 5.0 5.0 - - - 0.1 - 0.1
CENTRAL AMERICA 1.7 1.8 1.8 6.3 6.3 6.1 0.2 0.2 0.2 Mexico 1.3 1.3 1.3 5.6 5.6 5.4 - - -
SOUTH AMERICA 167.0 177.0 183.0 1.8 3.0 2.9 64.9 75.2 77.2 Argentina 59.1 61.8 60.5 0.1 0.4 0.7 9.7 11.8 11.4 Brazil 91.4 98.7 105.3 0.4 0.7 0.3 46.6 55.4 57.3 Paraguay 8.9 10.0 9.6 - - - 4.9 5.0 5.4 Uruguay 3.5 2.6 3.2 - - - 3.2 2.5 2.8
NORTH AMERICA 126.6 142.6 150.0 3.1 2.0 2.3 58.0 69.6 70.1 Canada 23.2 26.0 25.2 0.6 0.5 0.6 13.1 15.9 14.9 United States of America 103.4 116.6 124.8 2.5 1.5 1.7 44.9 53.8 55.2
EUROPE 62.2 66.1 66.7 20.3 21.5 21.6 5.8 5.9 5.7 European Union 32.0 32.4 31.2 18.0 18.7 19.1 1.1 0.9 1.0 Russian Federation 12.7 13.7 14.8 1.7 2.0 1.8 0.4 0.5 0.6 Ukraine 15.1 17.8 18.5 - - - 3.7 3.9 3.6
OCEANIA 5.5 4.3 5.4 - - - 3.5 2.4 2.8 Australia 5.1 3.9 5.0 - - - 3.4 2.3 2.7
WORLD 515.1 534.1 556.9 135.5 156.8 159.8 135.9 156.8 159.8 Developing countries 320.8 321.1 334.8 105.7 126.8 129.6 68.7 79.0 81.3 Developed countries 194.3 213.0 222.1 29.8 30.1 30.2 67.1 77.8 78.6 LIFDCs 55.7 50.6 55.8 1.7 2.6 2.6 1.5 1.6 1.9 LDCs 10.7 10.9 10.8 0.8 1.5 1.6 0.5 0.5 0.5
1 The split years bring together northern hemisphere annual crops harvested in the latter part of the first year shown, with southern hemisphere annual crops harvested in the early part of the second year shown; for tree crops which are produced throughout the year, calendar year production for the second year shown is used.

Sta
tist
ica
l a
pp
en
dix
106 107FOOD OUTLOOKOCTOBER 2016
APPENDIX TABLE 11: TOTAL OILS AND FATS STATISTICS 1 (million tonnes) Table A11 – Total oils and fats statistics1 (million tonnes)
,1,2,3,4,*,1,> Imports Exports Utilization
12/13-14/15 2015/16 2016/17
12/13-14/15 2015/16 2016/17
12/13-14/15 2015/16 2016/17
average average average estim. f’cast estim. f’cast estim. f’cast
ASIA 44.3 46.4 48.4 49.7 49.2 51.5 101.9 110.2 113.8 Bangladesh 1.8 2.0 2.0 - - - 2.1 2.4 2.5 China 11.4 9.5 10.0 0.5 0.6 0.7 36.8 38.6 39.1 of which: China Mainland
10.5 8.5 9.0 0.3 0.4 0.4 35.6 37.3 37.8
Taiwan Prov. 0.4 0.4 0.4 - - - 0.8 0.9 0.9 India 12.3 15.4 15.9 0.4 0.2 0.3 21.6 24.2 25.4 Indonesia 0.1 0.2 0.2 25.5 27.1 28.0 10.2 11.0 11.5 Iran 1.6 1.1 1.2 0.2 0.2 0.2 2.0 1.7 1.8 Japan 1.3 1.3 1.3 - - - 3.1 3.2 3.2 Korea, Republic of 1.0 1.1 1.2 - - - 1.4 1.5 1.6 Malaysia 1.5 1.5 1.7 19.2 17.9 19.0 4.4 5.0 5.3 Pakistan 2.8 3.0 3.1 0.1 0.2 0.1 4.4 4.9 5.0 Philippines 0.7 0.9 0.9 0.9 0.8 0.8 1.6 1.8 2.0 Singapore 0.8 0.8 0.8 0.2 0.1 0.1 0.7 0.7 0.7 Turkey 1.8 1.9 2.0 0.7 0.6 0.7 2.9 3.2 3.3
AFRICA 10.1 10.8 11.2 1.8 2.0 1.9 16.2 17.2 17.6 Algeria 0.8 0.8 0.9 0.1 0.1 0.1 0.9 1.0 1.0 Egypt 2.0 2.1 2.1 0.3 0.3 0.2 2.2 2.4 2.4 Nigeria 1.4 1.5 1.6 0.2 0.1 0.2 3.2 3.4 3.4 South Africa 0.8 0.8 0.9 0.1 0.1 0.1 1.3 1.4 1.5
CENTRAL AMERICA 2.5 2.7 2.7 1.0 1.3 1.2 5.1 5.1 5.4 Mexico 1.4 1.5 1.5 0.1 0.1 - 3.4 3.4 3.6
SOUTH AMERICA 3.1 3.2 3.5 8.9 10.9 10.9 17.0 17.8 19.0 Argentina 0.1 0.1 - 5.3 6.7 6.7 4.0 4.1 4.5 Brazil 0.6 0.6 0.7 1.7 1.9 1.9 8.4 8.9 9.3 Paraguay - - - 0.6 0.7 0.7 0.2 0.1 0.1 Uruguay 0.1 0.1 0.1 - - - 0.1 0.1 0.2
NORTH AMERICA 4.9 5.2 5.2 6.6 7.0 7.1 19.7 20.4 21.1 Canada 0.5 0.4 0.4 3.2 3.5 3.6 1.3 1.3 1.3 United States of America 4.4 4.8 4.8 3.4 3.5 3.6 18.4 19.1 19.8
EUROPE 14.0 14.2 14.4 9.8 10.7 11.6 37.2 39.2 39.0 European Union 11.5 11.5 11.6 3.3 3.1 3.2 30.7 32.4 32.1 Russian Federation 1.2 1.4 1.4 2.0 2.3 2.5 4.3 4.6 4.6 Ukraine 0.3 0.3 0.3 3.9 4.9 5.5 0.9 0.9 0.9
OCEANIA 0.6 0.7 0.7 1.8 1.9 1.9 1.2 1.2 1.3 Australia 0.4 0.5 0.5 0.7 0.7 0.7 0.8 0.8 0.9
WORLD 79.5 83.1 86.1 79.6 83.0 86.1 198.2 211.2 217.3 Developing countries 58.7 61.7 64.4 62.1 64.1 66.1 137.0 147.1 152.6 Developed countries 20.8 21.4 21.8 17.5 18.9 20.0 61.2 64.1 64.7 LIFDCs 21.2 25.0 25.9 2.5 2.5 2.5 36.3 39.8 41.3 LDCs 6.3 7.1 7.3 0.5 0.7 0.7 9.3 10.1 10.3
1 Includes oils and fats of vegetable, marine and animal origin.

Statistica
l ap
pe
nd
ix
106 107FOOD OUTLOOKOCTOBER 2016
APPENDIX TABLE 12: TOTAL MEALS AND CAKES STATISTICS 1 (million tonnes) Table A12 – Total meals and cakes statistics1 (million tonnes)
,1,2,3,4,*,1,> Imports Exports Utilization
12/13-14/15 2015/16 2016/17
12/13-14/15 2015/16 2016/17
12/13-14/15 2015/16 2016/17
average average average estim. f’cast estim. f’cast estim. f’cast
ASIA 34.1 35.5 38.5 15.5 12.9 14.4 144.2 160.8 167.8 China 2.7 2.7 2.9 2.1 2.4 2.4 78.9 88.2 91.8 of which: China Mainland
2.1 2.1 2.2 2.1 2.3 2.4 76.4 85.6 89.0
Taiwan Prov. 0.6 0.6 0.6 - - - 2.5 2.6 2.7 India 0.2 0.3 0.3 4.2 0.9 2.2 12.3 13.4 14.0 Indonesia 4.0 4.6 4.9 4.1 4.4 4.6 6.0 6.9 7.2 Iran, Islamic Republic of 2.5 1.7 2.1 0.1 0.1 0.1 3.2 3.7 3.8 Japan 2.4 2.2 2.4 - - - 6.4 6.3 6.3 Korea, Republic of 3.9 4.0 4.5 0.2 0.2 0.2 4.9 5.3 5.6 Malaysia 1.4 1.3 1.5 2.6 2.7 2.7 2.0 1.9 2.2 Pakistan 0.8 0.7 0.7 0.2 0.3 0.4 3.6 3.8 4.2 Philippines 2.3 2.8 3.0 0.6 0.5 0.5 2.7 3.2 3.6 Saudi Arabia 0.8 1.0 1.1 - - - 1.1 1.5 1.6 Thailand 3.3 3.0 3.2 0.2 0.2 0.2 5.6 5.9 5.9 Turkey 1.8 1.8 1.9 0.1 0.1 0.1 4.7 5.3 5.7 Viet Nam 4.3 5.1 5.6 0.2 0.3 0.2 5.3 6.7 7.1
AFRICA 5.3 6.7 6.7 0.9 1.0 0.9 12.4 14.2 14.5 Egypt 1.1 2.3 1.7 - - - 2.7 3.4 3.5 South Africa 1.1 0.9 1.0 0.1 0.1 0.1 2.1 2.2 2.3
CENTRAL AMERICA 3.6 4.5 4.8 0.2 0.2 0.2 8.6 9.8 10.0 Mexico 1.9 2.7 2.9 0.1 0.1 0.1 6.3 7.2 7.4
SOUTH AMERICA 5.4 5.6 5.9 46.1 53.3 55.0 27.1 29.8 31.3 Argentina - - - 27.2 32.4 33.4 3.6 4.5 5.3 Bolivia - - - 1.6 1.7 1.8 0.2 0.3 0.3 Brazil - - - 13.9 15.4 15.6 16.2 16.8 17.4 Chile 1.2 1.2 1.3 0.2 0.2 0.2 1.6 1.7 1.7 Paraguay - - - 2.2 2.7 2.9 0.5 0.6 0.5 Peru 0.9 1.0 1.1 0.8 0.7 0.9 1.2 1.4 1.5 Uruguay 0.2 0.2 0.2 - - - 0.2 0.2 0.2 Venezuela 1.3 1.1 1.3 - - - 1.4 1.4 1.5
NORTH AMERICA 4.9 5.2 5.0 15.7 15.9 16.5 35.6 38.8 39.7 Canada 1.0 0.9 0.9 4.5 4.8 4.8 2.2 2.2 2.1 United States of America 3.9 4.3 4.1 11.3 11.1 11.7 33.4 36.7 37.6
EUROPE 30.0 30.9 31.9 7.6 8.1 9.0 64.6 68.4 68.8 European Union 27.3 28.2 29.1 1.3 1.2 1.3 55.7 58.2 58.2 Russian Federation 0.6 0.5 0.5 2.2 2.2 2.4 5.1 5.9 6.1 Ukraine - - - 3.6 4.3 4.9 1.3 1.4 1.5
OCEANIA 2.9 3.2 3.3 0.3 0.3 0.2 3.6 4.1 4.2 Australia 1.0 1.1 1.2 0.1 0.1 0.1 1.6 1.9 2.1
WORLD 86.2 91.6 96.2 86.3 91.7 96.2 296.1 325.9 336.4 Developing countries 45.5 49.5 52.9 62.8 67.6 70.6 185.4 207.8 216.9 Developed countries 40.7 42.1 43.3 23.5 24.1 25.6 110.7 118.2 119.5 LIFDCs 2.2 2.6 2.7 5.1 1.8 3.1 19.8 22.0 22.7 LDCs 0.8 0.8 0.9 0.4 0.4 0.4 4.1 4.7 4.9
1 Expressed in product weight; includes meals and cakes derived from oilcrops as well as fish meal and other meals from animal origin.

Sta
tist
ica
l a
pp
en
dix
108 109FOOD OUTLOOKOCTOBER 2016
APPENDIX TABLE 13: TOTAL MEAT STATISTICS1
(thousand tonnes, carcass weight equivalent)
Table A13 –Total meat statistics1 (thousand tonnes, carcass weight equivalent)
,1,2,3,*,1,> Production Imports Exports Utilization
2015 2016 2015 2016 2015 2016 2015 2016 estim. f’cast estim. f’cast estim. f’cast estim. f’cast
ASIA 134 573 132 999 15 736 16 914 4 203 4 153 146 413 145 802 China 86 782 84 581 4 314 5 012 609 553 90 736 89 070 India 6 532 6 745 1 1 1 709 1 685 4 824 5 061 Indonesia 3 429 3 459 86 92 5 5 3 510 3 547 Iran, Islamic Republic of 2 694 2 726 101 134 67 85 2 728 2 774 Japan 3 248 3 259 3 158 3 332 14 14 6 379 6 589 Korea, Republic of 2 429 2 472 1 124 1 200 42 44 3 568 3 628 Malaysia 1 681 1 688 336 346 61 62 1 956 1 972 Pakistan 3 161 3 218 29 30 69 70 3 120 3 177 Philippines 3 214 3 259 402 458 12 10 3 604 3 707 Saudi Arabia 926 959 1 196 1 202 93 103 2 030 2 058 Singapore 120 121 348 354 34 33 434 442 Thailand 2 832 2 869 35 29 952 992 1 924 1 906 Turkey 3 238 3 248 23 10 371 324 2 894 2 933 Viet Nam 4 400 4 439 1 826 1 879 26 32 6 201 6 286
AFRICA 17 310 17 319 2 804 2 822 295 253 19 819 19 888 Algeria 755 762 89 84 2 2 842 844 Angola 264 259 438 368 - - 701 627 Egypt 2 088 2 108 385 395 13 13 2 459 2 489 Nigeria 1 494 1 503 4 4 1 1 1 497 1 506 South Africa 2 886 2 868 556 663 207 165 3 234 3 366
CENTRAL AMERICA 9 165 9 357 3 071 3 155 520 546 11 717 11 966 Cuba 313 317 263 253 - - 576 570 Mexico 6 456 6 634 1 992 2 062 298 328 8 150 8 368
SOUTH AMERICA 42 863 43 209 794 891 8 133 8 816 35 530 35 285 Argentina 5 138 5 196 19 23 451 425 4 705 4 793 Brazil 26 885 27 244 67 62 6 616 7 277 20 336 20 030 Chile 1 460 1 475 378 482 329 330 1 509 1 626 Colombia 2 531 2 520 131 127 15 21 2 647 2 626 Uruguay 675 681 48 53 356 364 368 370 Venezuela 2 034 1 918 46 35 1 - 2 083 1 954
NORTH AMERICA 47 931 49 329 3 053 2 874 8 513 8 775 42 413 43 440 Canada 4 450 4 568 782 750 1 723 1 848 3 497 3 471 United States of America 43 481 44 760 2 259 2 112 6 789 6 927 38 904 39 957
EUROPE 61 025 61 623 3 183 3 293 4 882 5 627 59 329 59 289 Belarus 1 129 1 149 37 35 261 305 904 879 European Union 46 795 47 287 1 452 1 519 4 155 4 803 44 093 44 003 Russian Federation 9 039 9 123 1 235 1 275 155 193 10 120 10 205 Ukraine 2 403 2 393 72 80 219 240 2 256 2 233
OCEANIA 6 349 5 985 486 476 3 242 2 934 3 595 3 555 Australia 4 483 4 185 256 249 2 208 1 939 2 533 2 522 New Zealand 1 356 1 291 78 73 1 031 991 404 373
WORLD 319 216 319 821 29 128 30 425 29 787 31 103 318 814 319 225 Developing countries 200 470 199 428 19 309 20 513 13 131 13 747 206 973 206 224 Developed countries 118 747 120 393 9 818 9 912 16 656 17 356 111 841 113 000 LIFDCs 19 351 19 578 1 328 1 317 1 868 1 840 18 811 19 055 LDCs 9 882 9 889 1 353 1 243 24 25 11 211 11 108 1 Including “other meat”.

Statistica
l ap
pe
nd
ix
108 109FOOD OUTLOOKOCTOBER 2016
APPENDIX TABLE 14: BOVINE MEAT STATISTICS (thousand tonnes, carcass weight equivalent)
Table A14 –Bovine meat statistics (thousand tonnes, carcass weight equivalent)
,1,2,3,*,1,> Production Imports Exports Utilization
2015 2016 2015 2016 2015 2016 2015 2016 estim. f’cast estim. f’cast estim. f’cast estim. f’cast
ASIA 17 886 18 044 4 578 4 893 1 943 1 901 20 564 21 032 China 6 710 6 795 1 207 1 399 38 33 7 898 8 151 India 2 630 2 640 - - 1 678 1 655 952 985 Indonesia 601 610 70 75 - - 670 685 Iran, Islamic Republic of 254 254 98 131 4 4 348 381 Japan 481 465 703 689 2 2 1 164 1 161 Korea, Republic of 323 308 366 443 8 7 720 740 Malaysia 31 31 220 219 15 13 236 237 Pakistan 1 725 1 775 4 4 33 33 1 697 1 747 Philippines 295 300 136 127 3 1 428 426
AFRICA 6 230 6 261 747 734 128 88 6 848 6 907 Algeria 140 140 82 77 - - 222 217 Angola 105 104 94 75 - - 199 179 Egypt 859 877 360 370 9 10 1 210 1 237 South Africa 870 880 25 24 92 50 803 854
CENTRAL AMERICA 2 555 2 571 366 374 323 336 2 598 2 609 Mexico 1 850 1 865 195 200 151 170 1 894 1 895
SOUTH AMERICA 15 549 15 324 329 379 2 542 2 804 13 341 12 899 Argentina 2 713 2 653 - - 201 210 2 512 2 443 Brazil 9 425 9 284 53 50 1 626 1 830 7 853 7 504 Chile 211 200 217 271 11 11 417 460 Colombia 845 830 5 4 13 19 837 815 Uruguay 546 551 4 4 333 343 216 212 Venezuela 530 510 30 30 - - 565 540
NORTH AMERICA 11 873 12 401 1 681 1 487 1 440 1 496 12 131 12 393 Canada 1 058 1 073 282 270 356 388 987 955 United States of America 10 815 11 328 1 396 1 215 1 084 1 108 11 142 11 436
EUROPE 10 371 10 472 928 900 475 531 10 824 10 841 European Union 7 715 7 882 322 334 289 315 7 748 7 901 Russian Federation 1 604 1 551 510 470 43 44 2 071 1 977 Ukraine 380 370 2 2 27 25 355 347
OCEANIA 3 089 2 692 63 61 2 273 1 994 881 787 Australia 2 379 2 022 14 14 1 688 1 430 707 635 New Zealand 690 650 16 13 582 561 124 102
WORLD 67 553 67 764 8 691 8 828 9 124 9 149 67 188 67 469 Developing countries 41 623 41 619 5 254 5 629 4 936 5 128 42 007 42 105 Developed countries 25 930 26 146 3 437 3 199 4 188 4 020 25 181 25 364 LIFDCs 7 933 7 948 133 134 1 804 1 777 6 262 6 305 LDCs 3 519 3 520 166 148 4 4 3 682 3 664

Sta
tist
ica
l a
pp
en
dix
110 111FOOD OUTLOOKOCTOBER 2016
APPENDIX TABLE 15: OVINE MEAT STATISTICS (thousand tonnes, carcass weight equivalent)Table A15 – Ovine meat statistics (thousand tonnes, carcass weight equivalent)
,1,2,3,*,1,> Production Imports Exports Utilization
2015 2016 2015 2016 2015 2016 2015 2016 estim. f’cast estim. f’cast estim. f’cast estim. f’cast
ASIA 8 196 8 307 559 541 42 45 8 714 8 804 Bangladesh 213 216 - - - - 213 216 China 4 185 4 273 252 218 1 3 4 436 4 488 India 730 728 - - 22 21 709 707 Iran, Islamic Republic of 291 295 1 1 - - 292 296 Pakistan 467 470 - - 12 13 455 457 Saudi Arabia 134 136 61 57 2 2 193 191 Turkey 366 368 1 1 - - 367 369
AFRICA 3 103 3 094 32 31 35 36 3 100 3 090 Algeria 315 320 4 4 - - 319 324 Nigeria 487 488 - - - - 487 488 South Africa 182 179 11 11 1 1 191 189 Sudan 483 481 - - 6 6 478 476
CENTRAL AMERICA 124 125 20 21 - - 144 145 Mexico 95 94 12 12 - - 106 106
SOUTH AMERICA 324 330 7 7 16 15 315 321 Brazil 116 118 7 7 - - 123 125
NORTH AMERICA 92 93 125 132 3 3 213 222 United States of America 75 76 103 109 3 3 175 182
EUROPE 1 242 1 264 179 182 25 25 1 396 1 422 European Union 919 938 166 169 18 17 1 067 1 090 Russian Federation 191 193 4 4 - - 195 197
OCEANIA 964 919 26 27 842 814 147 132 Australia 558 542 1 1 442 434 117 109 New Zealand 405 377 4 4 400 380 9 1
WORLD 14 045 14 132 948 942 964 937 14 029 14 136 Developing countries 11 733 11 841 619 599 93 96 12 259 12 344 Developed countries 2 312 2 291 328 343 871 841 1 770 1 792 LIFDCs 3 503 3 499 24 25 42 43 3 485 3 481 LDCs 1 599 1 593 5 5 17 18 1 587 1 580

Statistica
l ap
pe
nd
ix
110 111FOOD OUTLOOKOCTOBER 2016
APPENDIX TABLE 16: PIGMEAT STATISTICS (thousand tonnes, carcass weight equivalent)Table A16 – Pigmeat statistics (thousand tonnes, carcass weight equivalent)
,1,2,3,*,1,> Production Imports Exports Utilization
2015 2016 2015 2016 2015 2016 2015 2016 estim. f’cast estim. f’cast estim. f’cast estim. f’cast
ASIA 66 413 65 135 3 815 4 449 220 197 70 257 69 433 China 55 380 53 994 1 447 1 948 127 100 56 930 55 882 India 357 357 1 - - - 357 357 Indonesia 748 750 6 6 - - 753 756 Japan 1 254 1 275 1 286 1 390 2 2 2 545 2 665 Korea, D.P.R. 114 114 3 3 - - 116 116 Korea, Republic of 1 217 1 240 606 598 4 3 1 831 1 839 Malaysia 230 230 25 26 5 5 249 250 Philippines 1 720 1 740 93 107 3 3 1 810 1 843 Thailand 985 990 3 3 30 32 958 961 Viet Nam 3 354 3 388 112 140 25 31 3 440 3 497
AFRICA 1 365 1 366 304 277 35 28 1 634 1 615 Madagascar 60 58 - - - - 60 58 Nigeria 257 259 1 1 - - 258 260 South Africa 240 238 41 29 29 24 252 243 Uganda 118 117 1 1 - - 118 117
CENTRAL AMERICA 1 840 1 905 1 049 1 086 158 168 2 730 2 822 Cuba 199 201 16 17 - - 215 218 Mexico 1 323 1 385 845 870 137 147 2 030 2 109
SOUTH AMERICA 5 662 5 769 191 212 864 1 036 4 989 4 945 Argentina 475 495 16 19 1 1 490 513 Brazil 3 519 3 609 2 2 691 870 2 829 2 740 Chile 524 525 46 70 169 161 401 434 Colombia 240 237 65 56 - - 305 293 Venezuela 260 255 - - - - 260 255
NORTH AMERICA 13 172 13 424 853 861 3 384 3 483 10 586 10 813 Canada 2 051 2 090 244 235 1 191 1 281 1 099 1 044 United States of America 11 121 11 334 605 622 2 192 2 203 9 482 9 765
EUROPE 28 262 28 381 538 644 2 544 3 076 26 256 25 949 Belarus 377 406 6 5 29 40 354 371 European Union 23 349 23 384 13 13 2 416 2 957 20 946 20 440 Russian Federation 3 069 3 139 415 520 34 41 3 450 3 618 Serbia 260 265 29 29 22 15 267 279 Ukraine 730 710 6 7 29 7 707 709
OCEANIA 508 520 302 291 35 34 776 777 Australia 374 385 221 212 33 32 562 565 Papua New Guinea 72 72 9 9 - - 81 81
WORLD 117 223 116 499 7 052 7 821 7 241 8 023 117 228 116 354 Developing countries 74 104 72 977 4 100 4 662 1 275 1 428 77 171 76 256 Developed countries 43 119 43 522 2 952 3 159 5 965 6 595 40 057 40 099 LIFDCs 1 626 1 631 183 185 4 4 1 805 1 811 LDCs 1 580 1 584 188 170 1 1 1 767 1 753

Sta
tist
ica
l a
pp
en
dix
112 113FOOD OUTLOOKOCTOBER 2016
APPENDIX TABLE 17: POULTRY MEAT STATISTICS (thousand tonnes, carcass weight equivalent)Table A17 – Poultry meat statistics (thousand tonnes, carcass weight equivalent)
,1,2,3,*,1,> Production Imports Exports Utilization
2015 2016 2015 2016 2015 2016 2015 2016 estim. f’cast estim. f’cast estim. f’cast estim. f’cast
ASIA 40 122 39 558 6 733 6 979 1 973 1 986 44 895 44 551 China 19 022 18 035 1 402 1 441 428 402 19 996 19 073 India 2 666 2 872 - - 8 7 2 658 2 865 Indonesia 1 963 1 980 3 4 - - 1 966 1 984 Iran, Islamic Republic of 2 132 2 160 - - 60 78 2 072 2 082 Japan 1 501 1 507 1 134 1 215 9 9 2 622 2 713 Korea, Republic of 878 913 134 140 31 33 988 1 020 Kuwait 47 50 143 152 - - 190 201 Malaysia 1 418 1 425 57 63 40 44 1 434 1 444 Saudi Arabia 681 709 971 986 60 70 1 592 1 625 Singapore 100 101 152 164 9 10 243 255 Thailand 1 657 1 687 4 4 874 923 796 768 Turkey 1 913 1 910 1 1 346 303 1 568 1 608 Yemen 149 148 57 48 - - 205 196
AFRICA 5 170 5 156 1 688 1 746 89 93 6 770 6 809 Angola 32 31 233 198 - - 265 229 South Africa 1 571 1 548 479 598 79 83 1 971 2 063
CENTRAL AMERICA 4 526 4 637 1 618 1 655 37 39 6 107 6 253 Cuba 36 36 229 218 - - 265 254 Mexico 3 085 3 187 928 966 8 10 4 005 4 143
SOUTH AMERICA 21 120 21 578 266 292 4 644 4 893 16 742 16 977 Argentina 1 764 1 861 3 4 217 182 1 550 1 682 Brazil 13 794 14 202 4 4 4 274 4 552 9 524 9 654 Chile 700 725 115 140 141 149 674 716 Venezuela 1 230 1 140 15 5 1 - 1 244 1 145
NORTH AMERICA 22 568 23 184 385 385 3 667 3 775 19 266 19 794 Canada 1 324 1 388 235 223 176 179 1 373 1 432 United States of America 21 244 21 796 146 157 3 491 3 595 17 889 18 358
EUROPE 19 956 20 312 1 371 1 400 1 753 1 911 19 577 19 801 European Union 13 770 14 041 852 903 1 351 1 432 13 271 13 512 Russian Federation 4 084 4 150 258 232 78 108 4 266 4 275 Ukraine 1 244 1 264 63 70 164 207 1 144 1 126
OCEANIA 1 356 1 423 91 93 50 52 1 396 1 464 Australia 1 150 1 214 18 20 31 31 1 137 1 203 New Zealand 178 181 1 1 19 21 160 161
WORLD 114 818 115 848 12 153 12 550 12 213 12 749 114 753 115 649 Developing countries 68 930 68 912 9 246 9 533 6 725 6 994 71 467 71 451 Developed countries 45 889 46 936 2 907 3 018 5 488 5 755 43 287 44 199 LIFDCs 4 707 4 919 959 945 15 14 5 651 5 850 LDCs 2 500 2 508 967 894 2 2 3 466 3 401

Statistica
l ap
pe
nd
ix
112 113FOOD OUTLOOKOCTOBER 2016
APPENDIX TABLE 18: MILK AND MILK PRODUCTS STATISTICS (thousand tonnes, milk equivalent) Table A18 – Milk and milk products statistics (thousand tonnes, milk equivalent)
,1,2,3,4,*,1,> Production Imports Exports
2012-2014 2015 2016 2012-2014 2015 2016 2012-2014 2015 2016
average average average
estim. f’cast estim. f’cast estim. f’cast
ASIA 296 515 317 174 326 945 37 746 39 597 39 808 6 572 6 304 6 273 China 41 861 42 601 43 108 11 701 10 731 11 943 106 75 74 India1 138 811 153 032 160 377 130 93 98 762 259 244 Indonesia 1 384 1 450 1 490 2 550 2 548 2 515 101 101 101 Iran, Islamic Republic of 7 628 7 800 7 870 482 469 459 447 467 483 Japan 7 491 7 375 7 340 1 758 2 011 1 940 5 7 8 Korea, Republic of 2 141 2 200 2 193 875 977 936 19 21 20 Malaysia 86 86 86 1 877 2 296 2 120 516 720 617 Pakistan 38 944 41 000 42 000 429 461 445 78 64 64 Philippines 20 23 23 1 676 1 654 1 787 120 149 183 Saudi Arabia 2 344 2 400 2 440 2 770 2 954 2 988 1 451 1 363 1 390 Singapore - - - 1 785 1 756 1 560 622 609 592 Thailand 1 081 1 300 1 340 1 444 1 583 1 437 203 197 219 Turkey 18 477 20 517 20 927 192 227 226 502 469 473
AFRICA 45 834 46 191 46 121 9 204 10 399 9 703 1 094 1 152 1 135 Algeria 3 079 3 400 3 420 2 621 3 057 2 706 3 3 3 Egypt 5 896 5 940 5 970 1 539 1 606 1 591 499 465 456 Kenya 4 954 4 880 4 980 43 90 93 17 10 11 South Africa 3 406 3 420 3 250 232 307 283 251 379 373 Sudan 7 543 7 500 7 470 202 256 269 - - - Tunisia 1 168 1 200 1 220 99 95 87 59 45 40
CENTRAL AMERICA 16 795 17 168 17 461 4 794 5 561 5 700 663 732 760 Costa Rica 1 060 1 125 1 145 52 68 63 167 146 145 Mexico 11 147 11 570 11 830 2 964 3 327 3 504 162 205 222
SOUTH AMERICA 68 901 70 145 66 104 3 684 3 733 3 597 4 559 4 325 4 193 Argentina 11 508 11 552 10 000 83 14 16 2 413 2 017 1 974 Brazil 34 363 35 203 33 443 931 934 1 155 190 380 211 Colombia 6 480 6 600 6 400 183 231 315 24 49 49 Uruguay 2 134 2 074 1 836 19 27 27 1 298 1 375 1 452 Venezuela 2 626 2 600 2 200 1 631 1 614 1 046 - - -
NORTH AMERICA 100 365 103 163 105 029 2 170 2 668 2 839 10 307 9 871 9 489 Canada 8 498 8 682 8 685 607 649 630 480 520 535 United States of America 91 866 94 480 96 343 1 549 2 005 2 194 9 825 9 349 8 952
EUROPE 214 799 222 414 223 624 6 844 5 308 5 645 23 447 26 731 27 267 Belarus 6 701 7 047 7 175 107 171 192 4 103 4 822 4 985 European Union 155 233 163 600 165 700 1 443 1 347 1 362 16 317 18 429 18 824 Russian Federation 30 924 30 550 30 085 4 360 3 034 3 329 204 290 299 Ukraine 11 440 10 984 10 369 184 33 39 852 904 880
OCEANIA 30 247 32 449 31 958 856 1 060 1 115 21 810 22 953 23 223 Australia2 10 002 10 470 10 325 589 706 747 3 620 3 643 3 659 New Zealand3 20 174 21 909 21 563 81 151 164 18 187 19 307 19 561
WORLD 773 456 808 705 817 243 65 298 68 326 68 406 68 453 72 069 72 339 Developing countries 395 651 417 470 423 371 52 815 56 412 56 007 12 580 12 080 11 932 Developed countries 377 805 391 235 393 872 12 483 11 914 12 400 55 873 59 989 60 407 LIFDCs 187 769 202 424 209 941 7 110 8 134 7 968 1 444 978 1 012 LDCs 32 336 32 545 32 522 3 300 3 797 3 728 191 155 158
1 Dairy years starting April of the year stated (production only). 2 Dairy years ending June of the year stated (production only).
3 Dairy years ending May of the year stated (production only). Note: Trade figures refer to the milk equivalent trade in the following products: butter (6.60), cheese (4.40), milk powder (7.60), skim condensed/evaporated milk (1.90), whole condensed/evaporated milk (2.10), yoghurt (1.0), cream (3.60), casein (7.40), skim milk (0.70), liquid milk (1.0), whey dry (7.6). The conversion factors cited refer to the solids content method. Refer to IDF Bulletin No. 390 (March 2004).

Sta
tist
ica
l a
pp
en
dix
114 115FOOD OUTLOOKOCTOBER 2016
APPENDIX TABLE 19: FISH AND FISHERY PRODUCTS STATISTICS 1
Table A19 – Fish and fishery products statistics1
,1,2,3,4,*,1,> Capture fisheries
production Aquaculture
fisheries production Exports Imports
2013 2014 2013 2014 2014 2015 2016 2014 2015 2016 estim. f’cast estim. f’cast
Million tonnes (live weight equivalent) USD billion USD billion
ASIA 50.8 52.8 62.6 65.6 57.8 53.1 55.8 43.4 41.8 42.7 China2 17.4 18.3 43.9 45.8 23.8 22.1 22.3 13.5 13.4 13.8 of which: Hong Kong SAR 0.2 0.2 - - 1.0 0.8 0.7 3.6 3.6 3.9 Taiwan Prov. 0.9 1.1 0.3 0.3 1.8 1.6 1.5 1.2 1.2 1.3 India 4.6 4.7 4.6 4.9 5.6 4.9 5.0 0.1 0.1 0.1 Indonesia 6.0 6.4 4.0 4.3 4.2 3.6 3.7 0.3 0.3 0.3 Japan 3.7 3.7 0.6 0.7 1.9 1.9 1.8 14.8 13.5 13.4 Korea, Rep. of 1.6 1.7 0.4 0.5 1.7 1.5 1.6 4.3 4.3 4.4 Philippines 2.3 2.4 0.8 0.8 1.0 0.8 0.5 0.3 0.4 0.3 Thailand 1.8 1.8 1.0 0.9 6.6 5.6 5.6 2.7 2.5 2.9 Viet Nam 2.8 2.9 3.2 3.4 8.0 8.0 8.1 1.3 1.3 1.3
AFRICA 8.4 8.6 1.6 1.7 6.1 5.9 5.9 5.6 5.4 5.4 Egypt 0.4 0.3 1.1 1.1 - - - 0.7 0.7 0.7 Morocco 1.3 1.4 - - 2.0 1.9 2.0 0.2 0.2 0.1 Namibia 0.5 0.4 - - 0.7 0.7 0.7 0.1 0.1 0.1 Nigeria 0.7 0.8 0.3 0.3 0.1 0.1 - 1.3 1.3 1.3 Senegal 0.5 0.5 - - 0.4 0.4 0.4 - - - South Africa
0.4 0.6 - - 0.6 0.6 0.6 0.4 0.4 0.4
CENTRAL AMERICA 2.2 2.2 0.4 0.4 2.8 2.5 2.1 1.8 1.7 1.6 Mexico 1.6 1.5 0.2 0.2 1.2 1.0 0.9 0.9 0.8 0.7 Panama 0.2 0.2 - - 0.2 0.2 0.2 0.1 0.1 0.1
SOUTH AMERICA 10.3 8.6 2.1 2.4 15.5 13.2 12.9 3.4 2.8 2.5 Argentina 0.9 0.8 - - 1.6 1.5 1.6 0.2 0.2 0.2 Brazil 0.8 0.8 0.5 0.6 0.2 0.2 0.3 1.6 1.2 1.1 Chile 1.8 2.2 1.0 1.2 5.9 4.8 4.8 0.4 0.4 0.3 Ecuador 0.5 0.7 0.3 0.4 4.3 3.7 3.6 0.1 0.1 0.1 Peru 5.9 3.6 0.1 0.1 2.9 2.4 2.1 0.2 0.3 0.3
NORTH AMERICA 6.3 6.1 0.6 0.6 11.2 11.1 11.4 23.3 21.5 21.4 Canada 0.9 0.9 0.2 0.1 4.5 4.7 4.9 3.0 2.7 2.7 United States of America 5.1 5.0 0.4 0.4 6.1 5.9 6.0 20.3 18.8 18.7
EUROPE 13.5 13.7 2.8 2.9 51.8 45.5 49.1 60.8 52.6 57.5 European Union2 5.0 5.5 1.2 1.3 33.5 29.9 32.5 54.1 47.9 52.7 of which Extra -EU 6.1 5.4 5.5 28.2 25.0 27.1 Iceland 1.4 1.1 - - 2.1 2.1 1.9 0.1 0.2 0.1 Norway 2.1 2.3 1.2 1.3 10.8 9.1 10.4 1.4 1.2 1.3 Russian Federation 4.3 4.2 0.2 0.2 3.8 3.1 2.9 3.0 1.7 1.5
OCEANIA 1.2 1.3 0.2 0.2 3.1 2.9 2.9 2.8 2.7 2.6 Australia 0.2 0.2 0.1 0.1 1.1 1.1 1.0 1.7 1.4 1.4 New Zealand 0.4 0.4 0.1 0.1 1.2 1.1 1.2 0.2 0.2 0.2
WORLD3 92.7 93.4 70.3 73.8 148.3 134.1 140.0 141.3 128.5 133.6 Excl. Intra-EU 120.9 109.5 112.9 115.4 105.6 108.0 Developing countries 68.4 68.9 66.1 69.4 80.8 73.2 75.3 38.7 37.6 38.1 Developed countries 24.3 24.5 4.2 4.4 67.4 60.8 64.0 102.0 90.2 93.2 LIFDCs 11.8 12.1 7.1 7.6 9.1 8.2 8.1 3.3 3.3 3.4 LDCs 10.3 10.7 3.2 3.4 2.9 2.9 2.9 1.1 1.1 1.1
1 Production and trade data exclude whales, seals, other aquatic mammals and aquatic plants. Trade data include fish meal and fish oil. 2 Including intra-trade. Cyprus is included in the European Union as well as in Asia. 3 For capture fisheries production, the aggregate includes also 22 155 tonnes in 2013 and 7 999 in 2014 of not identified countries, data not included in any other aggregates.

Statistica
l ap
pe
nd
ix
114 115FOOD OUTLOOKOCTOBER 2016
APPENDIX TABLE 20: SELECTED INTERNATIONAL PRICES FOR WHEAT AND COARSE GRAINS
APPENDIX TABLE 21: TOTAL WHEAT AND MAIZE FUTURES PRICES
Wheat Maize Barley Sorghum
Period US No. 2 Hard
Red Winter
Ord. Prot. 1
US Soft Red
Winter No. 2 2
Argentina
Trigo Pan 3
US No. 2
Yellow 2
Argentina 3 France feed
Rouen
Australia feed
Southern
States
US No. 2
Yellow 2
................................................................................. (USD/tonne) .................................................................................
Annual (July/June)
2006/07 212 176 188 150 145 185 185 155
2007/08 361 311 322 200 192 319 300 206
2008/09 270 201 234 188 180 178 179 170
2009/10 209 185 224 160 168 146 154 165
2010/11 316 289 311 254 260 266 248 248
2011/12 300 259 264 281 269 270 249 264
2012/13 348 310 336 311 277 297 298 281
2013/14 318 265 335 216 219 243 241 218
2014/15 266 221 246 173 177 205 242 210
2015/16 211 194 208 166 170 174 185 173
2015 – September 218 195 223 166 161 175 184 177
2015 – October 221 208 224 164 164 186 193 182
2015 – November 211 201 210 166 167 179 185 173
2015 – December 212 191 193 164 166 178 182 170
2016 – January 214 192 194 161 161 167 176 165
2016 – February 205 189 194 160 167 164 170 165
2016 – March 207 189 192 159 163 164 172 161
2016 – April 201 193 199 164 170 166 170 162
2016 – May 193 189 202 169 187 166 176 153
2016 – June 198 186 210 181 197 162 183 170
2016 – July 188 168 210 161 179 154 169 147
2016 – August 188 157 215 150 177 157 147 140
2016 – September 188 158 201 148 171 152 138 141
December March May July
Dec. 2016 Dec. 2015 Mar. 2017 Mar. 2016 May 2017 May 2016 July 2017 July 2016
................................................................................. (USD/tonne) .................................................................................
Wheat
August 22 160 185 168 187 174 188 177 188
August 29 146 178 155 181 160 183 163 184
Sept 5 146 172 154 175 159 177 163 179
Sept 12 150 178 158 181 163 183 167 185
Sept 19 148 179 156 181 161 183 165 185
Sept 26 146 187 154 189 159 191 163 192
Maize
August 22 135 149 139 153 141 155 144 157
August 29 126 148 130 152 133 155 136 156
Sept 5 125 143 129 147 133 150 136 152
Sept 12 133 152 138 157 141 160 143 161
Sept 19 133 149 137 153 140 156 145 158
Sept 26 130 153 133 158 136 160 139 162
Source: Chicago Board of Trade (CBOT)
1 Delivered United States f.o.b Gulf; 2 Delivered United States Gulf; 3 Up River f.o.b. Sources: International Grain Council and USDA.

Sta
tist
ica
l a
pp
en
dix
116 117FOOD OUTLOOKOCTOBER 2016
APPENDIX TABLE 22: SELECTED INTERNATIONAL PRICES FOR RICE AND PRICE INDICES
International prices FAO indices
Indica
Period Thai 100% B1
Thai broken 2
US long grain 3
Pakisan Basmati4
Total Higher quality
Lower quality
Japonica Aromatic
Annual (Jan/Dec) ..........................(USD per tonne) .......................... ............................. (2002-2004=100) .............................
2009 587 329 545 937 253 224 196 317 231
2010 518 386 510 881 227 206 212 252 229
2011 565 464 577 1060 242 232 250 258 220
2012 588 540 567 1137 231 225 241 235 222
2013 534 483 628 1372 233 219 226 230 268
2014 435 322 571 1324 235 207 201 266 255
2015 395 327 490 849 211 184 184 263 176
Monthly
2015 – September 367 316 491 855 206 176 176 266 168
2015 – October 376 323 497 661 199 179 175 251 154
2015 – November 380 329 500 621 196 180 178 244 146
2015 – December 373 332 490 716 197 180 181 242 152
2016 – January 375 331 474 734 195 179 181 240 149
2016 – February 389 339 466 745 197 180 181 244 148
2016 – March 392 343 452 681 196 180 184 242 142
2016 – April 401 351 440 679 195 181 187 236 145
2016 – May 448 355 442 750 199 191 195 230 151
2016 – June 456 356 448 825 198 191 198 223 159
2016 – July 457 362 454 907 200 193 199 222 166
2016 – August 435 367 448 863 195 186 192 221 161
2016 – September 399 358 421 836 190 174 184 221 157
1 White rice, 100% second grade, f.o.b. Bangkok, indicative traded prices.2 A1 super, f.o.b. Bangkok, indicative traded prices.3 US No.2, 4% brokens f.o.b.4 Up to May 2011: Basmati ordinary, f.o.b. Karachi; from June 2011 onwards: Super Kernel White Basmati Rice 2%.
Note: The FAO Rice Price Index is based on 16 rice export quotations. ‘Quality’ is defined by the percentage of broken kernels, with higher (lower) quality referring to rice with less (equal to or more) than 20 percent brokens. The sub-index for Aromatic Rice follows movements in prices of Basmati and Fragrant rice.Sources: FAO for indices. Rice prices: Livericeindex.com, Thai Department of Foreign Trade (DFT) and other public sources.

Statistica
l ap
pe
nd
ix
116 117FOOD OUTLOOKOCTOBER 2016
APPENDIX TABLE 23: SELECTED INTERNATIONAL PRICES FOR OILCROP PRODUCTS
International prices1 FAO indices7
Period Soybeans 2 Soybean oil 3 Palm oil 4 Soybean cake 5 Rapeseed
meal 6
Oilseeds Vegetable oils Oilcakes/meals
.............................................. (USD per tonne) .............................................. ................... (2002-2004=100) ................
Annual (Oct/Sept)
2004/05 275 545 419 212 130 104 103 1012005/06 259 572 451 202 130 100 107 962006/07 335 772 684 264 184 129 150 1282007/08 549 1325 1050 445 296 216 246 2142008/09 422 826 627 385 196 157 146 1792009/10 429 924 806 388 220 162 177 1832010/11 549 1308 1147 418 279 214 259 2002011/12 562 1235 1051 461 295 214 232 2192012/13 563 1099 835 539 345 213 193 2552013/14 521 949 867 534 324 194 189 2532014/15 407 777 658 406 270 155 153 1942015/16 396 773 655 351 232 151 155 168Monthly2014 - January 566 935 871 539 337 208 189 2562014 - February 594 991 911 571 361 219 198 2712014 - March 501 1001 959 582 396 193 205 2782014 - April 516 1005 911 563 375 198 199 2692014 - May 522 973 896 552 340 197 195 2632014 - June 514 933 859 531 304 192 189 2512014 - July 480 886 839 477 272 178 181 2262014 - August 457 855 755 485 265 170 167 2292014 - September 433 850 714 463 265 162 162 2192014 - October 430 835 724 463 258 161 164 2182014 - November 447 827 728 485 265 167 165 2282014 - December 446 816 694 449 278 168 161 2132015 - January 421 789 681 431 279 159 156 2062015 - February 407 775 693 412 273 154 157 1972015 - March 402 748 673 392 262 152 152 1882015 - April 396 753 657 380 263 151 150 1832015 - May 385 781 663 371 290 148 154 1802015 - June 397 800 670 372 282 152 156 1802015 - July 413 746 635 389 264 157 148 1862015 - August 375 729 544 371 270 144 135 1792015 - September 367 725 533 362 256 142 134 1742015 - October 377 743 581 351 255 146 143 1702015 - November 367 726 561 328 232 142 138 1592015 - December 372 757 568 317 215 144 141 1532016 - January 368 722 564 316 217 142 139 1522016 - February 370 762 639 303 203 142 150 1462016 - March 379 761 694 301 219 145 160 1452016 - April 398 797 723 339 242 152 166 1632016 - May 425 790 708 406 261 160 163 1932016 - June 455 797 679 430 259 169 162 2042016 - July 429 790 652 400 234 159 157 1892016 - August 414 812 736 375 228 156 169 1782016 - September 404 823 758 346 221 153 172 165
1 Spot prices for nearest forward shipment 2 Soybeans: US, No.2 yellow, c.i.f. Rotterdam.3 Soybean oil: Dutch, fob ex-mill.4 Palm oil: Crude, c.i.f. Northwest Europe.5 Soybean cake: Pellets, 44/45 percent, Argentina, c.i.f. Rotterdam.6 Rapeseed meal: 34 percent, Hamburg, f.o.b. ex-mill.7 The FAO indices are based on the international prices of five selected seeds, ten selected oils and five selected cakes and meals. The indices are calculated using the
Laspeyres formula; the weights used are the export values of each commodity for the 2002-2004 period.Sources: FAO and Oil World.
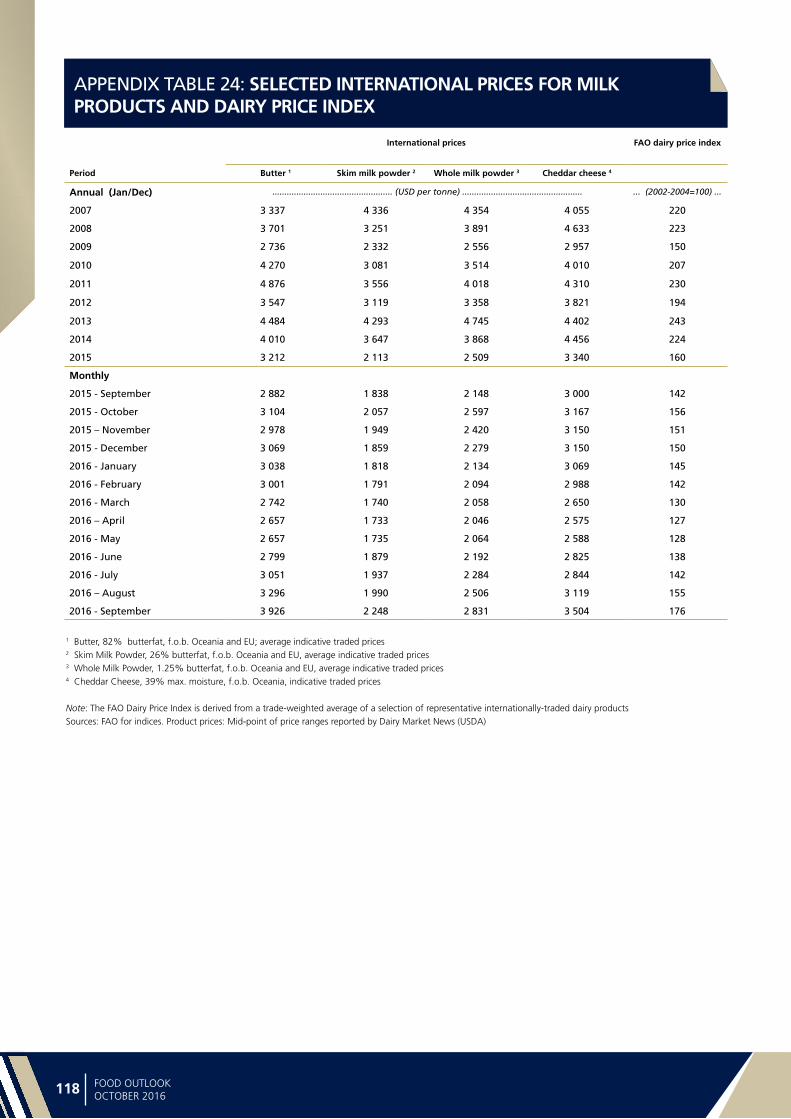
Sta
tist
ica
l a
pp
en
dix
118 119FOOD OUTLOOKOCTOBER 2016
APPENDIX TABLE 24: SELECTED INTERNATIONAL PRICES FOR MILK PRODUCTS AND DAIRY PRICE INDEX
International prices FAO dairy price index
Period Butter 1 Skim milk powder 2 Whole milk powder 3 Cheddar cheese 4
Annual (Jan/Dec) .................................................. (USD per tonne) .................................................. ... (2002-2004=100) ...
2007 3 337 4 336 4 354 4 055 220
2008 3 701 3 251 3 891 4 633 223
2009 2 736 2 332 2 556 2 957 150
2010 4 270 3 081 3 514 4 010 207
2011 4 876 3 556 4 018 4 310 230
2012 3 547 3 119 3 358 3 821 194
2013 4 484 4 293 4 745 4 402 243
2014 4 010 3 647 3 868 4 456 224
2015 3 212 2 113 2 509 3 340 160
Monthly
2015 - September 2 882 1 838 2 148 3 000 142
2015 - October 3 104 2 057 2 597 3 167 156
2015 – November 2 978 1 949 2 420 3 150 151
2015 - December 3 069 1 859 2 279 3 150 150
2016 - January 3 038 1 818 2 134 3 069 145
2016 - February 3 001 1 791 2 094 2 988 142
2016 - March 2 742 1 740 2 058 2 650 130
2016 – April 2 657 1 733 2 046 2 575 127
2016 - May 2 657 1 735 2 064 2 588 128
2016 - June 2 799 1 879 2 192 2 825 138
2016 - July 3 051 1 937 2 284 2 844 142
2016 – August 3 296 1 990 2 506 3 119 155
2016 - September 3 926 2 248 2 831 3 504 176
1 Butter, 82% butterfat, f.o.b. Oceania and EU; average indicative traded prices2 Skim Milk Powder, 26% butterfat, f.o.b. Oceania and EU, average indicative traded prices3 Whole Milk Powder, 1.25% butterfat, f.o.b. Oceania and EU, average indicative traded prices4 Cheddar Cheese, 39% max. moisture, f.o.b. Oceania, indicative traded prices
Note: The FAO Dairy Price Index is derived from a trade-weighted average of a selection of representative internationally-traded dairy productsSources: FAO for indices. Product prices: Mid-point of price ranges reported by Dairy Market News (USDA)

Statistica
l ap
pe
nd
ix
118 119FOOD OUTLOOKOCTOBER 2016
APPENDIX TABLE 25: SELECTED INTERNATIONAL MEAT PRICES
Bovine meat prices Ovine meat
price
Pig meat prices Poultry meat prices
Period Australia United
States
Brazil New Zealand United
States
Brazil Germany United
States
Brazil
Annual (Jan/Dec) ......................................................................................... (USD per tonne) .........................................................................................
2007 2 544 4 023 2 367 2 498 2 117 2 200 1 907 935 1 443
2008 3 024 4 325 3 785 2 975 2 270 3 000 2 364 997 1 896
2009 2 562 3 897 3 118 3 495 2 202 2 223 2 035 989 1 552
2010 3 272 4 378 3 919 3 662 2 454 2 747 1 913 1 032 1 781
2011 3 944 4 516 4 816 5 370 2 648 3 023 2 169 1 147 2 083
2012 4 176 4 913 4 492 4 754 2 676 2 784 2 233 1 228 1 931
2013 4 009 5 535 4 326 4 130 2 717 2 872 2 311 1 229 2 014
2014 5 016 6 678 4 515 4 687 3 183 3 434 2 106 1 206 1 940
2015 4 638 6 201 4 130 3 641 2 576 2 499 1 582 1 003 1 642
Monthly
2015 - September 4 866 5 820 4 364 3 626 2 437 2 508 1 679 946 1 587
2015 - October 4 066 5 484 3 939 4 017 2 328 2 471 1 634 917 1 552
2015 – November 4 016 5 560 4 164 3 682 2 338 2 219 1 424 909 1 538
2015 - December 3 787 5 742 3 990 3 491 2 380 1 924 1 402 866 1 484
2016 - January 3 796 5 476 3 722 3 228 2 310 1 823 1 447 868 1 392
2016 - February 4 021 5 644 3 724 3 103 2 251 1 783 1 467 871 1 392
2016 - March 3 887 5 686 3 556 3 091 2 228 1 768 1 480 892 1 413
2016 – April 4 001 5 670 3 721 3 188 2 276 1 904 1 496 931 1 448
2016 - May 4 187 5 360 3 769 3 307 2 253 2 071 1 644 984 1 533
2016 - June 4 175 5 541 3 772 3 700 2 398 2 131 1 792 998 1 581
2016 - July 4 378 5 356 3 754 3 690 2 511 2 148 1 868 940 1 628
2016 – August 4 224 5 340 3 990 3 846 2 530 2 218 1 903 925 1 646
2016 - September 4 094 5 350 4 030 3 824 2 560 2 240 1 944 922 1 656
Bovine meat prices:Australia: Cow 90CL export prices to the USA (FAS)USA: Frozen beef, export unit valueBrazil: Frozen beef, export unit value
Ovine meat pricesNew Zealand: Lamb 17.5kg cwt, export price
Pig meat prices:USA: Frozen pigmeat, export unit valueBrazil: Frozen pigmeat, export unit valueGermany: Monthly market price for pig carcase grade E
Poultry meat prices:USA: Broiler cuts, export unit valueBrazil: Export unit value for chicken (f.o.b.)
Prices for the two most recent months may be estimates and subject to revision.

Sta
tist
ica
l a
pp
en
dix
120 121FOOD OUTLOOKOCTOBER 2016
APPENDIX TABLE 26: SELECTED INTERNATIONAL MEAT PRICES AND FAO MEAT PRICE INDICES
FAO indices
Period Total meat Bovine meat Ovine meat Pig meat Poultry meat
Annual (Jan/Dec) .............................................................................. (2002-2004=100) .........................................................................
2007 131 126 108 125 151
2008 161 158 128 152 184
2009 141 135 151 131 162
2010 158 165 158 138 179
2011 183 191 232 153 206
2012 182 195 205 153 201
2013 184 197 178 157 206
2014 198 231 202 164 200
2015 168 213 157 126 168
Monthly
2015 - September 168 216 157 127 161
2015 - October 158 192 173 123 157
2015 – November 155 195 159 113 156
2015 - December 150 191 151 110 150
2016 - January 145 184 139 109 144
2016 - February 147 190 134 108 144
2016 - March 146 186 133 108 147
2016 – April 150 190 138 111 151
2016 - May 154 190 143 117 160
2016 - June 160 192 160 126 164
2016 - July 162 193 159 130 163
2016 – August 163 194 166 133 164
2016 - September 163 192 165 135 164
The FAO Meat Price Indices consist of 2 poultry meat product quotations (the average weighted by assumed fixed trade weights), 3 bovine meat product quotations (average weighted by assumed fixed trade weights), 3 pig meat product quotations (average weighted by assumed fixed trade weights), 1 ovine meat product quotation (average weighted by assumed fixed trade weights): the four meat group average prices are weighted by world average export trade shares for 2002/2004.
Prices for the two most recent months may be estimates and subject to revision.
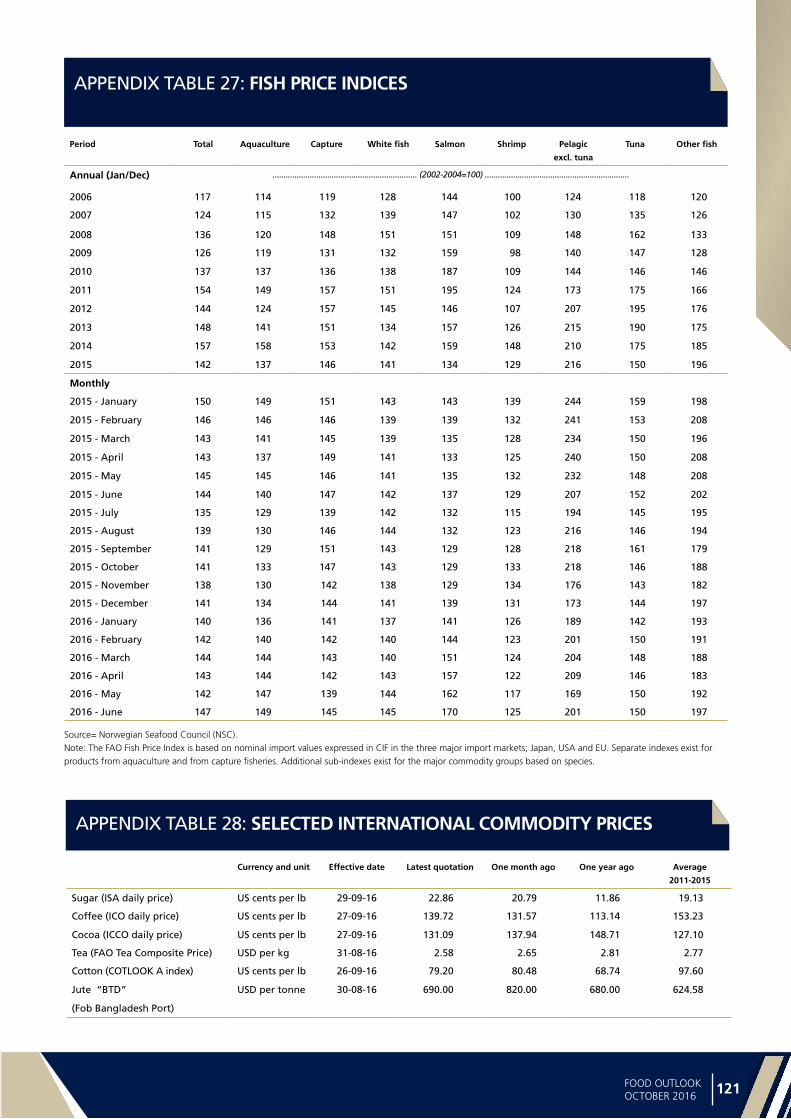
Statistica
l ap
pe
nd
ix
120 121FOOD OUTLOOKOCTOBER 2016
APPENDIX TABLE 27: FISH PRICE INDICES
APPENDIX TABLE 28: SELECTED INTERNATIONAL COMMODITY PRICES
Period Total Aquaculture Capture White fish Salmon Shrimp Pelagic
excl. tuna
Tuna Other fish
Annual (Jan/Dec) .................................................................. (2002-2004=100) ..................................................................
2006 117 114 119 128 144 100 124 118 120
2007 124 115 132 139 147 102 130 135 126
2008 136 120 148 151 151 109 148 162 133
2009 126 119 131 132 159 98 140 147 128
2010 137 137 136 138 187 109 144 146 146
2011 154 149 157 151 195 124 173 175 166
2012 144 124 157 145 146 107 207 195 176
2013 148 141 151 134 157 126 215 190 175
2014 157 158 153 142 159 148 210 175 185
2015 142 137 146 141 134 129 216 150 196
Monthly
2015 - January 150 149 151 143 143 139 244 159 198
2015 - February 146 146 146 139 139 132 241 153 208
2015 - March 143 141 145 139 135 128 234 150 196
2015 - April 143 137 149 141 133 125 240 150 208
2015 - May 145 145 146 141 135 132 232 148 208
2015 - June 144 140 147 142 137 129 207 152 202
2015 - July 135 129 139 142 132 115 194 145 195
2015 - August 139 130 146 144 132 123 216 146 194
2015 - September 141 129 151 143 129 128 218 161 179
2015 - October 141 133 147 143 129 133 218 146 188
2015 - November 138 130 142 138 129 134 176 143 182
2015 - December 141 134 144 141 139 131 173 144 197
2016 - January 140 136 141 137 141 126 189 142 193
2016 - February 142 140 142 140 144 123 201 150 191
2016 - March 144 144 143 140 151 124 204 148 188
2016 - April 143 144 142 143 157 122 209 146 183
2016 - May 142 147 139 144 162 117 169 150 192
2016 - June 147 149 145 145 170 125 201 150 197
Source= Norwegian Seafood Council (NSC).Note: The FAO Fish Price Index is based on nominal import values expressed in CIF in the three major import markets; Japan, USA and EU. Separate indexes exist for products from aquaculture and from capture fisheries. Additional sub-indexes exist for the major commodity groups based on species.
Currency and unit Effective date Latest quotation One month ago One year ago Average
2011-2015
Sugar (ISA daily price) US cents per lb 29-09-16 22.86 20.79 11.86 19.13
Coffee (ICO daily price) US cents per lb 27-09-16 139.72 131.57 113.14 153.23
Cocoa (ICCO daily price) US cents per lb 27-09-16 131.09 137.94 148.71 127.10
Tea (FAO Tea Composite Price) USD per kg 31-08-16 2.58 2.65 2.81 2.77
Cotton (COTLOOK A index) US cents per lb 26-09-16 79.20 80.48 68.74 97.60
Jute “BTD” USD per tonne 30-08-16 690.00 820.00 680.00 624.58
(Fob Bangladesh Port)

122 123
MAR
KET
INID
CATO
RS

Ma
rke
t ind
icato
rs
122 123FOOD OUTLOOKOCTOBER 2016
Futures prices for wheat, maize and soybeans declined
steadily between June and September following a brief
run-up in April and May when South American weather
developments threatened production. Wheat prices declined
to multi-year lows, as global supplies appeared ample. The
USDA, citing other origin export competition, predicted
2016/17 domestic farm prices would drop below USD 143
per tonne, their lowest level in 11 years. Maize futures prices
also declined to multi-year lows on expectation of a bumper
crop in the United States. Soybean prices remained on
average higher than the previous year for the same period,
CME futures prices CME futures volumes
Historical volatility (30 days) Implied volatility
100
300
500
700
20162015201420132012
Wheat Maize Soybeans
USD per tonne
0
200
400
600
20162015201420132012
Wheat Maize Soybeans
Thousand contracts
0
30
60
90
20162015201420132012
Wheat Maize Soybeans
Percent
0
20
40
60
20162015201420132012
Wheat Maize Soybeans
Percent
but substantially below 2013 levels. Despite the record
soybean harvest projected for 2016/17, heightened domestic
and Asian export demand were moderately supportive of
prices. Exogenous markets, such as foreign exchange and
energy, exhibited some stability compared with 2014 and
2015, which was a period of dramatic price adjustments.
Nonetheless, relative USD strength and low crude oil prices
remained a weight on overall commodity prices. A strong
pace for US exports since early June indicated that lower
cereal and oilseed prices were finding a clearing level for
demand.
Futures marketsContributed by Ann Berg (International Consultant)

Ma
rke
t in
dic
ato
rs
124 125FOOD OUTLOOKOCTOBER 2016
FORWARD CURVES
Forward curves for wheat and maize displayed unusually
steep upward sloping (contango) price configurations
extending to December 2017. For maize, the December
2016/December 2017 spread exhibited USD 16 per tonne
carry versus USD 8 per tonne the previous year. For wheat,
the December 2016/December 2017 spread displayed
USD 28 per tonne carry versus USD 14 per tonne the
previous year. These wide curves reflected, in part, the
insufficient capacity for storing the 2016/2017 maize crop
following the large wheat harvest. The forward curve for
soybeans, however, was flat to downward sloping with the
November 2016/November 2017 spread displaying USD 5
inversion (backwardation). In September 2016, the USDA
revised the 2015/2016 stocks-to-use ratio downward, to
less than 5 percent (from 12.5 percent projected earlier)
which reflected greater than expected end-year export
demand. The dwindling carryout explained the extremely
high year-end basis levels and old crop/new crop futures
inversion that began with the July 2016 contract. The
current November 2016/November 2017 inversion may
reflect a perception of understated demand again for the
2016/2017 crop year, and producer preference for storing
soybeans over wheat or maize. Deliveries were made
against the September contracts for maize and wheat, but
not for soybeans, even as the September contract rose
to USD 11 per tonne premium to November, expiring at
approximately the same level as the cash price.
VOLUMES
Trade volumes for wheat, maize and soybeans continued
strong following a record year in 2015. Maize and soybean
volumes were on track to surpass last year’s levels while
wheat volumes appeared to be on a match course. While
lower than April’s record when prices spiked briefly, monthly
volumes have remained elevated despite price erosion
and slumping volatilities, indicators normally linked to low
volumes. Open interest was mixed: soybeans displayed
record numbers of outstanding contracts during April, May
and June, while wheat and maize remained below the
record numbers recorded in 2012. This might indicate that
many producers facing maize and wheat prices at multi-year
lows rejected “locking in” prices, and that the high volumes
were mostly the result of speculative activity.
VOLATILITY
Volatility levels for maize and soybeans tended to track
US crop development, peaking in June and July as prospects
Forward curves snapshots as of 13 September 2014, 2015 and 2016
Wheat
Maize
Soybeans
120
140
160
180
DecSeptJulyMayMarchDecSept
2014
2015
2016
USD per tonne
130
160
190
220
DecSeptJulyMayMarchDecSept
2014
2015
2016
USD per tonne
300
320
340
360
380
NovSeptAugJulyMayMarchJanNovSept
2014
2015
2016
USD per tonne

Ma
rke
t ind
icato
rs
124 125FOOD OUTLOOKOCTOBER 2016
turned increasingly favourable for record harvests. Historical
volatility (based on 30 days) for maize and soybeans
reached 37 and 33 respectively, declining to the low 20s
by September. Implied volatility (calculated by the level of
option premiums on underlying futures contracts) followed a
similar upward path and fell to 23 (maize) and 17 (soybeans)
during September. Wheat followed a slightly different course
as historical volatility peaked in May at 33 and hovered in
the upper 20s during the subsequent months, while implied
volatility rose in May from 24 to the upper 20s between
June and September. Overall levels were unremarkable
compared with other time periods. For example, historical
volatility reached a low of 11 during March 2016 (maize
and soybeans) and a three-year high (maize) in August 2013
of 71. Grain price volatility continued to be insulated from
crude oil volatility which, as tracked by the Volatility Index
Exchange Traded Fund (ETF, listed on the Chicago Board of
Options), soared to 80 in February and March 2016, and
thereafter drifted down to the high 30s to low 40s.
INVESTMENT FLOWS
Managed money and commercial traders actively exchanged position strategies over the course of the past several months, as charts reveal mirror images of their net buying and selling. In wheat, managed money maintained its net short for a 12-month period, raising the level to 30 percent of open interest in September, a record over the life of the CFTC reporting period (since 2006). Commercials, also a net short for most of the past year, reversed their position to a net long during July. Swaps dealers, a perennial large net long in wheat, reduced their position to a record low 15 percent of open interest by September, possibly indicating a client withdrawal of funds due to five years of negative returns. In maize, managed money and commercials took opposite strategies during June, establishing large net long and short positions respectively. Reversing those sharply in July, both ended up as moderate net shorts in September. In soybeans, managed money has maintained a net long to varying degrees since March, while commercials maintained a net short. Despite its aggressive buying and selling and seemingly successful year-long strategy of betting on a wheat price decline, managed money involved with agricultural products returned a YTD negative performance of 1.83 percent (January through April), according to the hedge fund tracker Barclay Hedge. Passively managed index funds, notably the Deutsche Bank Agricultural Index Fund, have lost value for five consecutive years, yielding a negative 9 percent return for the period.
CME net-length as % of open interests (Jan 2012 - Sep 2016)
Maize
Soybeans
Wheat
-60
-40
-20
0
20
40
20162015201420132012
Percent
Commercial Managedmoney
Swapdealers
-60
-40
-20
0
20
40
20162015201420132012
Percent
Commercial Managedmoney
Swapdealers
-60
-40
-20
0
20
40
60
20162015201420132012
Percent
Commercial Managedmoney
Swapdealers

Ma
rke
t in
dic
ato
rs
126 127FOOD OUTLOOKOCTOBER 2016
Ocean freight rates
OCEAN FREIGHT MARKET (SEPTEMBER 2015 - SEPTEMBER 2016)
After reaching an all-time low in the first half of February,
dry bulk freight markets continued to stage a recovery in
the past six months, although volatility was often a feature.
The Baltic Dry Index (BDI), a composite index of activity on
benchmark routes, touched an eleven-month peak of 804
points in September and, despite easing slightly in recent
days, was still up by more than 90% when compared to
mid-March. As the data show, gains were underpinned by
strength in all segments, but were steepest in the Capesize
sector. Nevertheless, highlighting underlying pressure from
industry oversupply and wider macroeconomic concerns,
the BDI was down by 6% y/y.
Being associated with the transportation of coal,
iron ore and a range of other heavy raw materials, the
Capesize sector is most closely linked to the broader
economic cycle. During the past six months, rates in this
segment trended significantly higher, the Baltic sub-Index
posting a net increase of more than 700%. However,
day-to-day swings in sentiment were sometimes especially
pronounced, with periods of heightened activity at key
origins – including Australia and Brazil – contrasting with
a relatively subdued market at other times. Compared to
the same point of 2015, values were up by almost one-
quarter y/y.
While the grains and oilseeds carrying sectors advanced
solidly, gains were markedly less pronounced than in the
Capesize sector. Although the Panamax market was often
volatile, it was much firmer when compared to six months
earlier. Activity at the US Gulf was initially slow, but values
during March-April were supported by good demand for
grains and oilseeds new crop shipments from South America,
with underpinning, too, from tonnage tightness in other
regions.
In recent months, there was marked uptick in business
volumes in the northern hemisphere – especially in the
North Atlantic and Black Sea region – as importers sought
to book the dispatch of freshly harvested supplies. Despite
Baltic Capesize sub-Index(14 Sep 2015 - 14 Sep 2016)
Baltic Exchange sub-Indices – Grains and oilseeds carrying sectors
(14 Sep 2015 - 14 Sep 2016)
Contributed by the International Grains Council (IGC) www.igc.int
0
50
100
150
200
SAJJMAMFJDNOS2015 2016
14 September 2015 = 100
Summary of dry bulk freight markets
14 Sept.
2016
Changes
6 months y/y
%
Baltic Dry Index (BDI)* 756 92.4 -6.1
Sub-indices:
Capesize 1 444 706.7 21.9
Panamax 649 34.9 -10.2
Supramax 665 55.7 -16.8
Handysize 415 64.7 -8.2
Source: Baltic Exchange, * 4 January 1985 = 1000
25
50
75
100
125
SAJJMAMFJDNOS2015 2016
Panamax
Supramax
Handysize
14 September 2015 = 100

Ma
rke
t ind
icato
rs
126 127FOOD OUTLOOKOCTOBER 2016
Dry bulk freight markets: BDI (annual averages) vs scrappage, 2007-2016 *
a recovery in rates since the middle of March, the Baltic
sub-Index was still down by 10% on a year ago.
Concerning nominal and reported rates on key trading
routes, a trip from Brazil to southern China as at mid-
September was typically around US$17/t. While this
represented an increase of 13% on six months earlier,
it was US$3/t lower than its early-July peak. In contrast,
a voyage from the US Gulf to the same destination was
up by around 35% from mid-March, broadly mirroring
the movement in the overall sub-Index for the Panamax
segment. On the Argentina-EU (ARAH) route, quotations
were in the region of US$14/t, up by about one-quarter.
After bottoming out in the first quarter, Supramax and
Handysize markets turned higher, the Baltic sub-Indices
for each rising by 56% and 65%, respectively. As the
accompanying chart illustrates, rates were evidently less
volatile than those for larger vessels. Scrap and fertiliser
business in Europe provided a degree of support at times,
while demand for new crop supplies underpinned values
in South America through to mid-year. More recently, a
boost in enquiries from importers for freshly cut crops in
Black Sea producers added to the positive tone, offsetting
some pressure from subdued activity in the EU, where the
traditional summer slowdown weighed. However, rates
remained lower when compared to a year earlier.
Supply-side developmentsAside from demand-side developments, the heavy
expansion of the global dry bulk fleet has been a constant
source of pressure over a number of years. However, there
is now evidence that, despite a mild recovery during recent
0
10
20
30
40
0
2000
4000
6000
8000
2016201520142013201220112010200920082007
Jan. 4, 1985=100 Million tonnes, dwt
estim. f’cast
Scrappage (right axis)
BDI (left axis)
Summary of freight rates on selected routes
USD/t 14 Sep.
2016
Changes
6 months y/y
US (Gulf) to: %
EU (ARAH) 18 80.0 38.5
China (Dalian) 31 34.8 -4.6
Japan 30 36.4 -3.2
Canada (St. Lawrence) to:
EU (ARAH) 13 62.5 0.0
China (Dalian) 34 17.2 -10.5
Japan 36 16.1 -12.2
Argentina to:
EU (ARAH) 14 27.3 -22.2
Mexico 21 23.5 -19.2
Brazil to:
EU (ARAH) 22 22.2 -18.5
China (Dalian) 17 13.3 ...
EU (France, Rouen) to:
Algeria 18 50.0 -14.3
Egypt (Mediterranean) 19 26.7 -13.6
Black sea to:
Egypt (Alexandria) 15 66.7 0.0
Tunisia 18 50.0 -5.3
Australia (East Coast) to:
China (Dalian) 13 44.4 0.0
Yemen 31 19.2 0.0
months, historically low freight rates are encouraging an
increase in scrapping volumes.
The above table provides a snapshot of developments
on major grains and oilseeds trade routes, and highlights
changes in rates on six months earlier and one year ago.
* Source: Bulk Shipping Analysis; refers to vessels above 10,000t dead weight,
including Handysize, Supramax, Panamax, Capesize and larger carriers.
EU (ARAH) refers to Antwerp, Rotterdam, Hamburg

Ma
rke
t in
dic
ato
rs
128 129FOOD OUTLOOKOCTOBER 2016
Food import bills
Forecast changes in global food import bills by type (2016 over 2015)
-20 -15 -10 -5 0 5 10 15 20 25 30Percent
Dairy
Meat
Wheat
Rice
TropicalBeverages
Vegetablesand Fruits
Vegetable Oilsand Animal Fats
Oilseeds
Fish
Sugar
Coarse Grains
World food import bill in 2016 falling to a six-year low At USD 1.17 trillion, the value of total food imports in 2016
is forecast to decline by 11 percent, or USD 148 billion,
from last year, marking the largest annual fall in absolute
terms in recent history, to a level not witnessed since 2010.
The June Food Outlook report had foreseen global import
expenditures on foodstuffs dipping below USD 1 trillion
in 2016. However, revisions to historical data, combined
with higher than anticipated freight rates and larger
volumes and prices for several commodities, now suggest
that the global food import bill will not likely fall below
the USD 1 trillion mark. Nevertheless, both sizeable and
widespread falls in the commodity basket are likely to
characterize 2016.
The volatility in freight costs, especially over the past
12 months, is noteworthy. For instance, as indicated by
the Baltic Dry Index, shipping charges in the third quarter
of 2016 are down almost a third compared with the
corresponding period of last year, but have risen by over
90 percent from the first quarter of 2016. Taking wheat
destined for East Asian markets as an example, importers
would now be required to pay, on average, 5 percent more
than in January owing to the freight increase.
Turning to developments at the product level, the
import bills anticipated to undergo the largest absolute
declines in 2016 are those for livestock products and
cereal-based foodstuffs, which could fall by around
USD 27 billion, or 12 percent, and USD 25 billion,
or 16 percent, respectively. In the case of livestock,
considerably lower quotations compared with last year are
driving expenditures on these food groups down, even
though import volumes of meat are forecast to reach a
record high in 2016 and those of dairy products likely to
be at a near-high level. As for cereals, lower international
prices, coupled with a decline in traded volumes, are
foreseen to curb import bills for this commodity group.
Commodity import bills that could instead increase in
2016 include sugar (+ USD 10 billion), fish (+ USD 6 billion),
fruit and vegetables (+ USD 5 billion), and vegetable
oils (+ USD 3 billion). In all of these cases, international
benchmark quotations are above the 2015 levels, and
import volumes are set to exceed those of last year.
The tendency at the world level for substantially lower
import costs in 2016 does not necessarily extend to many
of the economically vulnerable nations. The food import
bills of least-developed countries (LDCs), low-income food-
deficit countries (LIFDCs) and those geographically situated
in sub-Saharan Africa (SSA) are forecast to fall by less than
the 11 percent global decline, with falls ranging between
only 5 and 9 percent among the country groups. For all of
these economically disadvantaged countries, higher import
volumes of products in the oilseed complex, as well as of
sugar and cereals, particularly maize, are seen to offset the
gains to be made from lower import bills of other product
groups. In some cases, particularly for countries in SSA as
well as LIFDCs, the larger maize purchases are in response
to shortfalls in the domestic production of the staple.
Despite the general decline of the US dollar-
denominated food bills in 2016, a different picture
emerges when denominated in local currencies, given
the prevailing strength of the US dollar. Although
having stabilized in recent months, the US dollar remains
exceptionally strong, keeping the cost of food imports
high from a local currency perspective and adding strain to
scarce foreign exchange reserves from which the cost of
importing is met.
Contact:[email protected]

Ma
rke
t ind
icato
rs
128 129FOOD OUTLOOKOCTOBER 2016
World Developed Developing LDC LIFDC Sub-Saharan Africa
2015 2016
f’cast
2015 2016
f’cast
2015 2016
f’cast
2015 2016
f’cast
2015 2016
f’cast
2015 2016
f’cast
TOTAL FOOD 1 316.1 1 167.9 795.1 694.5 521.0 473.5 37.8 34.4 81.3 77.4 41.9 37.6
Vegetables and Fruits 237.7 242.8 168.8 172.2 68.9 70.6 3.7 4.0 12.5 13.0 3.3 3.4
Cereals 162.0 136.6 71.4 60.8 90.7 75.8 11.0 9.6 18.6 16.3 11.9 10.8
Fish 122.7 128.3 87.6 92.5 35.1 35.8 1.0 1.0 3.9 4.0 4.0 4.1
Meat 149.5 134.7 96.5 86.3 53.0 48.4 2.7 2.2 3.4 2.9 3.4 3.0
Dairy 77.4 65.1 47.6 40.2 29.8 24.9 2.1 1.8 3.6 2.9 2.2 1.7
Vegetable Oils and Animal Fats 89.8 93.0 40.1 41.5 49.8 51.5 5.8 6.1 18.2 19.4 4.5 4.7
Oilseeds 78.1 79.5 24.1 24.3 54.0 55.1 0.5 0.6 1.0 1.0 0.4 0.4
Sugar 43.9 54.9 22.6 28.1 21.4 26.8 3.6 4.5 5.7 7.1 3.3 4.0
Tropical beverages 102.0 93.2 77.2 70.4 24.9 22.7 1.5 1.4 3.7 3.4 1.6 1.4
Import bills of total food and major foodstuffs (USD billion)
Exchange rates and food prices
% changes in the currencies of selected LIFDCs against the USD (Sep 2015 - Sep 2016)
USD remains high but stable, as food prices climb
(Sep 2015 - Sep 2016)
145
155
165
175
SAJJMAMFJDNOS85
89
93
97
2002-2004=100 January 1980=100
FAO food price index (left axis)
2015 2016
Price-adjusted major currencies dollar index (right axis)
-60 -50 -40 -30 -20 -10 0 10Percent
Venezuela
Egypt
Jordan
Peru
NigeriaIndia
Ethiopia
Honduras
Tunisia
PakistanSudan
Dom. Rep.
Bangladesh
Congo D.R.
El Salvador
Ghana
MoroccoW. Afr. Franc
Uzbekistan
AngolaYemen
Tanzania
Sri Lanka
Kenya
Having reached a 13-year high at the beginning of 2016, the US Dollar relative to major currencies had lost some ground by
the end of the first quarter of this year. Since then, it has been largely stable, with the inflation-adjusted index fluctuating
slightly around a level of 90 points. Nevertheless, the US Dollar remains historically strong, rendering the cost of importing
expensive as most commodity prices are US Dollar-denominated. This is particularly the case for numerous major food-
importing LIFDCs (importing more than USD 1 billion of food annually) who, over September 2015 - September 2016, have
incurred currency falls against the US Dollar, with percentage depreciation often reaching double-digit levels.
Source: US Federal Reserve

Ma
rke
t in
dic
ato
rs
130 131FOOD OUTLOOKOCTOBER 2016
FAO price indices1
FAO Global Food Consumption Price Index steady2
The FAO Global Food Consumption Price Index tracks
changes in the cost of the global food basket as depicted
by the latest FAO world food balance sheet (see http://
faostat3.fao.org/download/FB/FBS/E).
The index has been largely stable after reaching
a 12 month high in June 2016. However, it has since
diverged from the trade-weighted FAO Food Price Index
(FFPI). Averaging 159 points in September, the FAO Global
Food Consumption Price Index is 11 points lower than
the FPI. This is because prices of basic foodstuffs such as
cereals, which carry a much greater weight in consumption
have fallen compared to rises in the quotations of higher
value traded commodities, notably sugar and dairy.
The FAO Food Price Index up again in September3
The FAO Food Price Index averaged 170.9 points in
September 2016, up almost 5 points (2.9 percent) from
August and 10 percent above the corresponding month
last year. The September value is the highest since March
2015. Barring a small dip in July, the FFPI has been going up
steadily since the start of the year, mainly supported by a
surge in sugar prices and more moderate increases for dairy
products, meat and oils. Last month’s rise in the FFPI was
driven mostly by stronger dairy and sugar quotations.
The FAO Cereal Price Index averaged 140.9 points in
September, down 2.7 points (1.9 percent) from August
and 8.9 percent below its year-earlier level. The decline
in September marked the third consecutive month
of decreases, largely due to ample global supplies,
especially export availabilities. This year’s record wheat
production, coupled with an expected rebound in global
rice production and above-average performance of coarse
grains, maize in particular, have continued to weigh on
cereal export quotations.
1 All changes referred to in this section, in absolute or percentage terms, are calculated based on unrounded figures.
The FAO global food consumption and food price indices
(Oct 2013 - Sep 2016)
The FAO Vegetable Oil Price Index averaged almost
172 points in September, up 2.9 points (or 1.7 percent)
from August, reflecting higher quotations of palm, soy
and rapeseed oils. Palm oil values continued to strengthen,
underpinned by weaker than anticipated output growth and
low stock levels in both exporting and importing countries.
International soyoil quotations appreciated on tight global
export availabilities, while rapeseed oil prices firmed on
concerns about global output falling for a third consecutive
year in 2016/17.
The FAO Dairy Price Index averaged 176 points in
September, up as much as 21 points (13.8 percent) from
August. Quotations rose for all dairy products, in particular
butter, which was bolstered by reduced stocks and strong
internal demand in the EU. The Index has risen by 49 points,
38 percent, since April. The current price surge stems from
expectations that falling milk production in the EU and a
muted opening to the dairy year in Oceania would result in
tighter availabilities for export, following excess supplies in
the preceding two years.
3 The FAO food price indices are updated on a monthly basis and are available on: http://www.fao.org/worldfoodsituation
2 The FAO Global Food Consumption Price Index is published twice a year in Food Outlook.
140
160
180
200
220
2016201520142013
2002-2004=100
FAO global foodconsumption price index
FAO foodprice index

Ma
rke
t ind
icato
rs
130 131FOOD OUTLOOKOCTOBER 2016
The FAO Meat Price Index4 averaged 163.5 points in
September, essentially unchanged from August. Since
January, when it hit a five-year low, the Index has risen
by 12.6 percent. The largest increase for the year so
far has been recorded for pigmeat, followed by ovine
and poultry meat, while bovine meat experienced only a
limited rise. Firm international demand, in particular from
Asia, underpinned pigmeat and poultry meat prices, while
reduced international supplies reinforced those of ovine
meat. Meanwhile, a recovery in bovine meat production
in the United States has reduced the need for imports,
contributing to a restrained international price rise for this
commodity.
The FAO Sugar Price Index averaged 304.8 points in
September, up 19 points (6.7 percent) from August,
the fifth consecutive monthly increase. The latest surge
in international sugar prices was largely on the back of
unfavourable weather conditions in the Centre South main
producing region in Brazil, the world’s largest sugar producer
and exporter. Reports of lower production in India, the
world’s second largest sugar producer, and tight supplies in
Thailand and China, also added to the upward pressure on
prices.
140
160
180
200
220
2002-2004=100
20162015
2014
2013
FAO Food Price Index
DNOSAJJMAMFJ120
170
220
270
320
20162015
2002-2004=100
Dairy
Vegetable oils
Cereals
Sugar
Meat
FAO Food Commodity Price Indices
SAJJMAMFJDNOS
4 Unlike for other commodity groups, most prices utilized in the calculation of the FAO Meat Price Index are not available when the FAO Food Price Index is computed and published; therefore, the value of the Meat Price Index for the most recent months is derived from a mixture of projected and observed prices. This can, at times, require significant revisions in the final value of the FAO Meat Price Index which could in turn influence the value of the FAO Food Price Index.

Ma
rke
t in
dic
ato
rs
132 133FOOD OUTLOOKOCTOBER 2016
Food Price Index1 Meat2 Dairy3 Cereals4 Vegetable Oils5 Sugar6
2000 91.1 96.5 95.3 85.8 69.5 116.1
2001 94.6 100.1 105.5 86.8 67.2 122.6
2002 89.6 89.9 80.9 93.7 87.4 97.8
2003 97.7 95.9 95.6 99.2 100.6 100.6
2004 112.7 114.2 123.5 107.1 111.9 101.7
2005 118.0 123.7 135.2 101.3 102.7 140.3
2006 127.2 120.9 129.7 118.9 112.7 209.6
2007 161.4 130.8 219.1 163.4 172.0 143.0
2008 201.4 160.7 223.1 232.1 227.1 181.6
2009 160.3 141.3 148.6 170.2 152.8 257.3
2010 188.0 158.3 206.6 179.2 197.4 302.0
2011 229.9 183.3 229.5 240.9 254.5 368.9
2012 213.3 182.0 193.6 236.1 223.9 305.7
2013 209.8 184.1 242.7 219.3 193.0 251.0
2014 201.8 198.3 224.1 191.9 181.1 241.2
2015 164.0 168.1 160.3 162.4 147.0 190.7
2015 167.2 172.6 167.5 160.8 154.1 189.3
2015 September 155.3 167.6 142.3 154.8 134.2 168.4
October 158.2 158.0 155.6 157.3 142.6 197.4
November 155.2 154.6 151.1 153.6 138.2 206.5
December 153.4 150.0 149.5 151.6 141.5 207.8
2016 January 149.3 145.2 145.1 149.1 139.1 199.4
February 149.7 146.7 142.0 148.2 150.3 187.1
March 150.8 145.8 130.3 147.6 159.8 219.1
April 152.8 149.6 127.4 149.8 166.4 215.3
May 156.7 154.4 128.0 152.5 163.3 240.4
June 163.9 159.9 137.9 156.9 161.9 276.0
July 162.5 161.7 142.3 148.1 157.3 278.7
August 166.0 163.2 154.6 143.6 169.0 285.6
September 170.9 163.5 176.0 140.9 172.0 304.8
FAO food price index
1 Food Price Index: Consists of the average of 5 commodity group price indices mentioned above, weighted with the average export shares of each of the groups for
2002-2004: in total 73 price quotations considered by FAO commodity specialists as representing the international prices of the food commodities are included in the
overall index. Each sub-index is a weighted average of the price relatives of the commodities included in the group, with the base period price consisting of the averages
for the years 2002-2004.
2 Meat Price Index: Computed from average prices of four types of meat, weighted by world average export trade shares for 2002-2004. Commodities include two
poultry products, three bovine meat products, three pig meat products, and one ovine meat product. There are 27 price quotations in total used in the calculation of
the index. Where more than one quotation exists for a given meat type, a simple average is used. Prices for the two most recent months may be estimates and subject
to revision.
3 Dairy Price Index: Consists of butter, SMP, WMP, and cheese price quotations; the average is weighted by world average export trade shares for 2002-2004.
4 Cereals Price Index: This index is compiled using the International Grains Council (IGC) wheat price index, itself an average of 10 different wheat price quotations,
1 maize export quotation and 16 rice quotations. The rice quotations are combined into three groups consisting of Indica, Japonica and Aromatic rice varieties. Within
each variety, a simple average of the relative prices of appropriate quotations is calculated; then the average relative prices of each of the three varieties are combined
by weighting them with their assumed (fixed) trade shares. Subsequently, the IGC wheat price index, after converting it to base 2002-2004, the relative prices of maize
and the average relative prices calculated for the rice group as a whole are combined by weighting each commodity with its average export trade share for 2002-2004.
5 Vegetable Oils Price Index: Consists of an average of 10 different oils weighted with average export trade shares of each oil product for 2002-2004.
6 Sugar Price Index: Index form of the International Sugar Agreement prices with 2002-2004 as base.

132 133

www.amis-outlook.org
AMIS five year anniversary: A short journey from stormy oceans to calm seas
When the G20 leaders set in motion the establishment of the Agricultural Market Information System (AMIS) in June 2011, food markets were
struggling to cope with exceptionally uncertain supply and demand prospects, a stormy market climate marked with high and volatile prices that lasted many years before a slow return to some normality only recently. For its first and foremost task, AMIS was to guide the international community to ride over those turbulent waves. Once achieved, AMIS was expected to keep a close eye on market conditions, constantly seeking to improve market transparency and coordinate policy actions, its two main pillars. Five years on, AMIS can pride itself on realising most of its initial goals. After no less than ten expert meetings on market information, five high- level events on policy matters, not to mention numerous international seminars and national workshops, the international community today has a strong instrument to fall back on if or when the next storm approaches. And yet, an admirable achievement of AMIS that often goes unnoticed is the rich and collaborative network of national and international experts it helped to create, who today celebrate five years of exceptional partnership.
AMIS Secretary
AMIS

Food Outlook is published by the Trade and Markets Division of FAO under Global Information and Early Warning System (GIEWS). It is a
biannual publication focusing on developments affecting global food and feed markets. Each report provides comprehensive assessments and short term forecasts for production, utilization, trade, stocks and prices on a commodity by commodity basis and includes feature articles on topical issues. Food Outlook maintains a close synergy with another major GIEWS publication, Crop Prospects and Food Situation, especially with regard to the coverage of cereals. Food Outlook is available in English. The summary section is also available in Arabic, Chinese, French, Russian and Spanish.
Food Outlook and other GIEWS reports are available on the internet as part of the FAO world wide web (http://www.fao.org/) at the following URL address: http://www.fao.org/giews/. Other relevant studies on markets and global food situation can be found at http://www.fao.org/worldfoodsituation.
This report is based on information available up to late September 2016. The next Food Outlook report will be published in May/June 2017.
For enquiries or further information contact:
Abdolreza Abbassian
Trade and Markets Division
Food and Agriculture Organization of the United Nations
Viale delle Terme di Caracalla
00153 Rome - Italy
Telephone: 0039-06-5705-3264
Facsimile: 0039-06-5705-4495
E-mail: [email protected] or [email protected]
I6198E/1/09.16