Food and Retail Market in Croatia 2
47
Food & retail market in Croatia Prepared for Landbrugsraadet Royal Danish Embassy Zagreb Trade Council of Denmark Date: 10.03.2007
-
Upload
ujedinjeni-regioni-srbije-becej -
Category
Documents
-
view
113 -
download
8
Transcript of Food and Retail Market in Croatia 2
Food & retail market in Croatia
Prepared for Landbrugsraadet
Royal Danish Embassy Zagreb Trade Council of Denmark
Date: 10.03.2007

Royal Danish Embassy Zagreb Page 2 of 47 Trade Council of Denmark
Table of contents 1 Introduction................................................................................................. 3 2 Croatia – an introduction ............................................................................ 4 3 Retail market overview ................................................................................ 5
3.1 Development of the retail sector ....................................................................... 7 3.2 Retail and wholesale operators ......................................................................... 10
3.2.1 Company profiles.................................................................................. 11 3.3 Buying Groups and Associations..................................................................... 13 3.4 Distributors ......................................................................................................... 14 3.5 Food Fairs ........................................................................................................... 14
4 Food production and imports ....................................................................14 4.1 Pricing .................................................................................................................. 14 4.2 Foreign trade ....................................................................................................... 14 4.3 EU membership ................................................................................................. 14
5 Main food groups in Croatia ......................................................................14 5.1 Meat and meat products.................................................................................... 14
5.1.1 Beef and pork producers ..................................................................... 14 5.1.2 Poultry producers ................................................................................. 14 5.1.3 Fish producers....................................................................................... 14 5.1.4 Legal aspects concerning the meat and fish sector.......................... 14 5.1.5 Forecast meat and fish sector ............................................................. 14
5.2 Dairy products .................................................................................................... 14 5.2.1 Dairy producers .................................................................................... 14 5.2.2 Forecast for the dairy sector ............................................................... 14
5.3 Fruit and vegetables ........................................................................................... 14 5.4 Confectionary...................................................................................................... 14 5.5 Beverages ............................................................................................................. 14
5.5.1 Alcoholic beverages.............................................................................. 14 5.5.2 Soft drinks.............................................................................................. 14
5.6 Organic products................................................................................................ 14 5.7 Private label ......................................................................................................... 14
6 Exporting to Croatia...................................................................................14 6.1 Investment........................................................................................................... 14 6.2 Corruption........................................................................................................... 14
7 Retail sector forecast ..................................................................................14 8 HoReCa market in Croatia.........................................................................14
8.1 Sector performance............................................................................................ 14 8.2 Key players .......................................................................................................... 14
8.2.1 Gastro grupa.......................................................................................... 14 8.3 HoReCa sector forecast..................................................................................... 14
9 Method of obtaining information...............................................................14 10 Appendix 1: Store Checks of Selected Retailers ..................................14 11 Appendix 2: Address and contact persons ..........................................14
Royal Danish Embassy Zagreb Page 3 of 47 Trade Council of Denmark
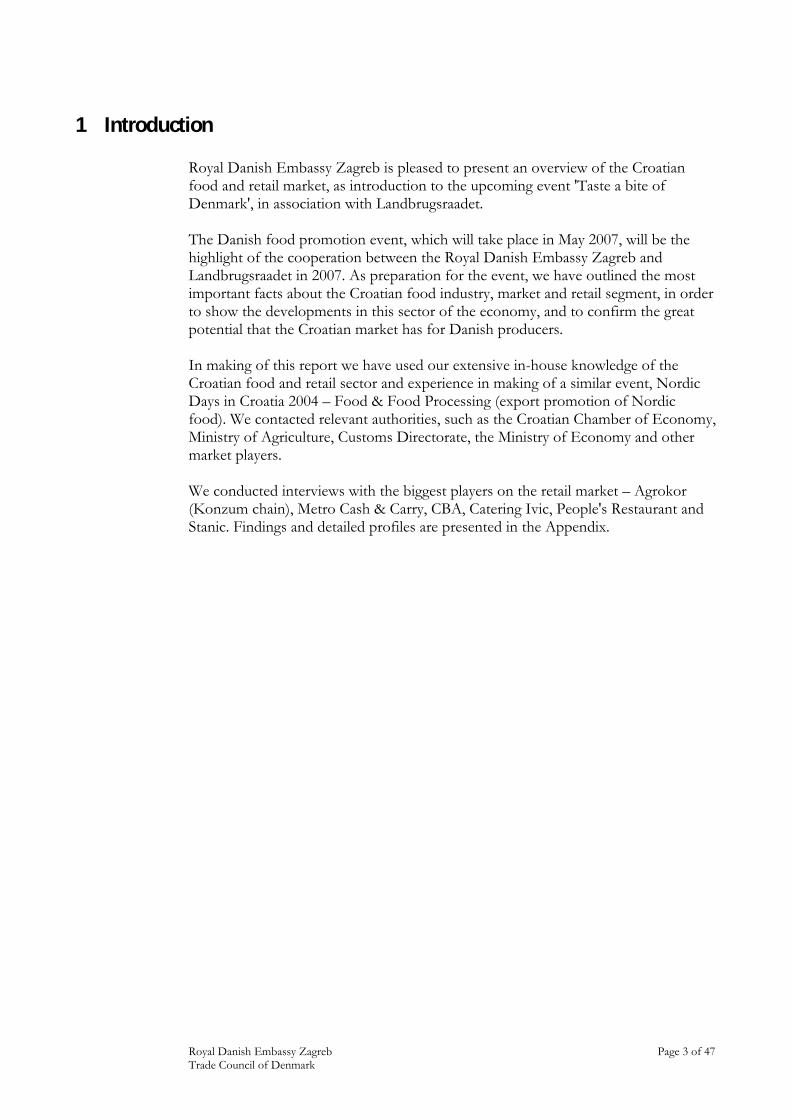
1 Introduction Royal Danish Embassy Zagreb is pleased to present an overview of the Croatian food and retail market, as introduction to the upcoming event 'Taste a bite of Denmark', in association with Landbrugsraadet. The Danish food promotion event, which will take place in May 2007, will be the highlight of the cooperation between the Royal Danish Embassy Zagreb and Landbrugsraadet in 2007. As preparation for the event, we have outlined the most important facts about the Croatian food industry, market and retail segment, in order to show the developments in this sector of the economy, and to confirm the great potential that the Croatian market has for Danish producers. In making of this report we have used our extensive in-house knowledge of the Croatian food and retail sector and experience in making of a similar event, Nordic Days in Croatia 2004 – Food & Food Processing (export promotion of Nordic food). We contacted relevant authorities, such as the Croatian Chamber of Economy, Ministry of Agriculture, Customs Directorate, the Ministry of Economy and other market players. We conducted interviews with the biggest players on the retail market – Agrokor (Konzum chain), Metro Cash & Carry, CBA, Catering Ivic, People's Restaurant and Stanic. Findings and detailed profiles are presented in the Appendix.

Royal Danish Embassy Zagreb Page 4 of 47 Trade Council of Denmark
2 Croatia – an introduction
Year Data Population 2001 4.2 million Population of Zagreb (core) 2001 779.000 Percentage of urban population 2001 63.7% GDP per capita 2006 7.613 EUR GDP growth 2006 4.6% GDP growth forecast 2007 4.2% Average annual inflation rate 2001-2006 2.6% Foreign direct investments 2001-2006 7.368 million EUR Unemployment rate (ILO) 2006 11.8% Number of retail outlets 2006 16.000 Retail sales of food 2006 4.3 billion EUR Retail sales of food growth 2006 6% Total agricultural output 2006 0.6% in relation to EU25 Total import from Denmark 2006 134 million EUR
Figure 1: Croatia at a glance (RBA quarterly analysis, Ministry of Agriculture)

Royal Danish Embassy Zagreb Page 5 of 47 Trade Council of Denmark
3 Retail market overview Croatia's GDP per capita is close to 7.700 EUR (2006), while the capital of Zagreb (one fourth of total Croatian population) achieves over 15.000 EUR. Average net salary on the country level stands at 4.600 HRK (=4.600 DKK), while the average for Zagreb is 5.500 HRK. Due to large regional differences and centralized economy, the retail activities are equally focused on Zagreb and urban centers at the coast. GDP growth rates slowed down since its peak in 2002 (5.6%) and now stand at 4.6% (2006). In 2006, the main growth generator was gross capital formation. Broken down by category of consumption, only government consumption increased in 2006, to the highest level since 2003 (effect of the upcoming election). The greatest increase in gross value added was achieved in the tourist sector, transport and construction. It is expected that GDP growth will remain between 4.0 and 4.5% in the years to come. Overall, FDI flows to Croatia have mostly been below 2 billion USD over the last five years. Investor confidence in the country remains strong, with the prospect of EU membership being the biggest benefit for the business. EU accession is planned for 2010. Retail market sector is following suit with dynamic developments and growth. Drivers behind it include sector consolidation, increased competition among leading players and presence of competitive foreign players on the market. A further catalyst is the growing Croatian tourist industry (in the summer, tourists represent 50% of all shoppers in supermarkets and independent retail outlets). The most significant impediment to growth is the high level of unemployment and low levels of personal income. Projections for 2007 and 2008 predict the rise of employment between 1-2% and growth of personal income by 4.8% and 5.4% in 2007 and 2008, respectively. Despite challenges, Croatia's retail market has grown significantly in the last 6 years, reaching 4.3 billion EUR in 2006. In 2000, 30% of Croatians shopped regularly in the neighboring countries, due to the low retail standards in the country. In 2006 this figure stood at less than 3% of the total population. Analysis by A.T. Kearney in 2006 ranked Croatia number 7 on the top 10 most attractive emerging retail markets (behind India, Russia, Ukraine, China, Slovenia and Latvia).

Royal Danish Embassy Zagreb Page 6 of 47 Trade Council of Denmark
Rank/ country
Region Country risk
Market attractiveness*
Market saturation**
Time pressure***
Score
India Asia 62 34 91 80 100 Russia Eastern Europe 52 58 71 92 99
Ukraine Eastern Europe 46 34 82 90 87 China Asia 68 40 53 90 83
Slovenia Eastern Europe 83 52 43 68 82 Latvia Eastern Europe 67 49 51 79 81
Croatia Eastern Europe 63 48 49 88 80 Vietnam Asia 54 24 88 68 79 Turkey Mediterranean 51 56 66 65 78 Slovakia Eastern Europe 73 52 33 90 77
Figure 2: A.T. Kearney's Global Retail Development Index (AT Kearney analysis, Euromoney database, World Bank report) * 0=low attractiveness, 100=high attractiveness **0=not saturated, 100=highly saturated ***0=no time pressure, 100=high time pressure Household spending has hovered between 2.4-5.4% since 2003, after the central bank made substantial efforts to temper a strong upsurge in consumer demand in 2002. With the strong kuna against the euro, and growth of domestic credit, this led to strong import growth, despite household spending falling below overall real GDP growth, as Croatian consumers find international goods more competitive.
Item Average yearly expenditure per household, EUR, 2005
% of total expenditure
% change, 03/05
Personal consumption 9.416 100 6.3 Food and beverages 3.127 33.2 8.2 Alcohol and tobacco 376 12 1.3
Figure 3: Personal expenditure (Croatian Bureau of Statistics) There are three factors influencing the food retail segment in Croatia, as well as the whole CEE – health, convenience and indulgence. Health is the most visible among them on the Croatian market – with 18.2% of males and 16.2% of females being obese (BMI over 30). Health will in the future appear in combination with indulgence and convenience, to address new consumer demands.
Royal Danish Embassy Zagreb Page 7 of 47 Trade Council of Denmark
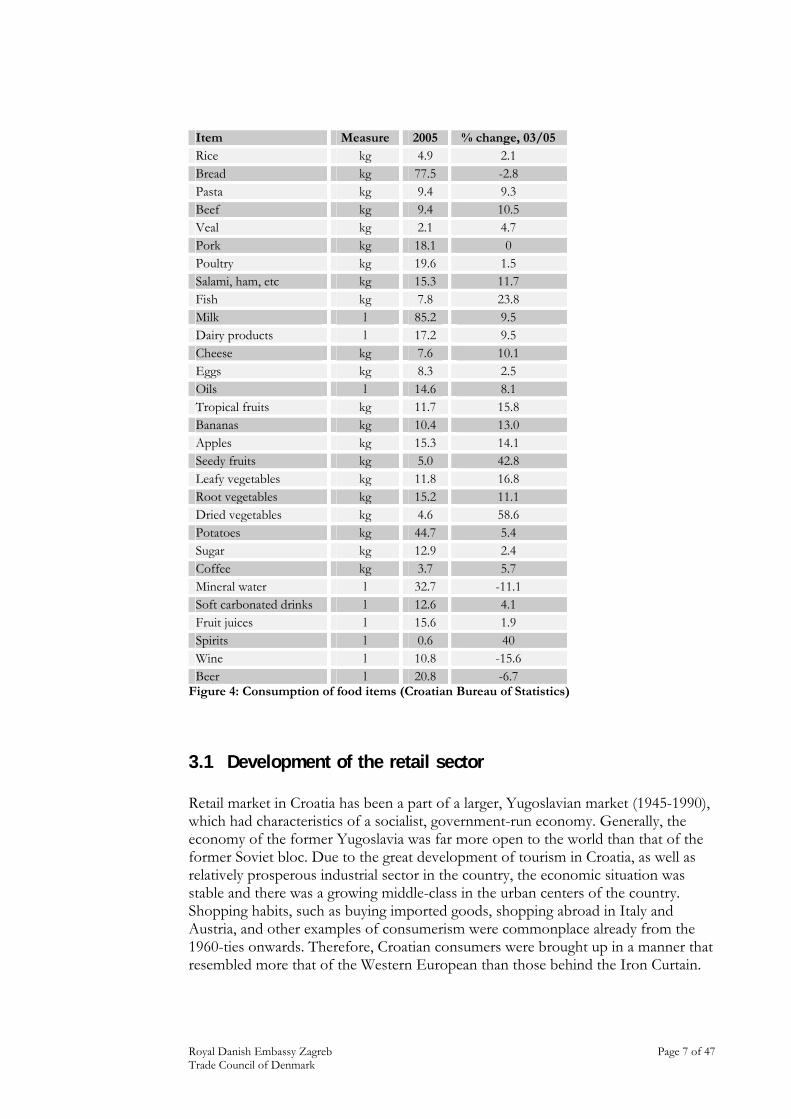
Item Measure 2005 % change, 03/05 Rice kg 4.9 2.1 Bread kg 77.5 -2.8 Pasta kg 9.4 9.3 Beef kg 9.4 10.5 Veal kg 2.1 4.7 Pork kg 18.1 0 Poultry kg 19.6 1.5 Salami, ham, etc kg 15.3 11.7 Fish kg 7.8 23.8 Milk l 85.2 9.5 Dairy products l 17.2 9.5 Cheese kg 7.6 10.1 Eggs kg 8.3 2.5 Oils l 14.6 8.1 Tropical fruits kg 11.7 15.8 Bananas kg 10.4 13.0 Apples kg 15.3 14.1 Seedy fruits kg 5.0 42.8 Leafy vegetables kg 11.8 16.8 Root vegetables kg 15.2 11.1 Dried vegetables kg 4.6 58.6 Potatoes kg 44.7 5.4 Sugar kg 12.9 2.4 Coffee kg 3.7 5.7 Mineral water l 32.7 -11.1 Soft carbonated drinks l 12.6 4.1 Fruit juices l 15.6 1.9 Spirits l 0.6 40 Wine l 10.8 -15.6 Beer l 20.8 -6.7
Figure 4: Consumption of food items (Croatian Bureau of Statistics)
3.1 Development of the retail sector Retail market in Croatia has been a part of a larger, Yugoslavian market (1945-1990), which had characteristics of a socialist, government-run economy. Generally, the economy of the former Yugoslavia was far more open to the world than that of the former Soviet bloc. Due to the great development of tourism in Croatia, as well as relatively prosperous industrial sector in the country, the economic situation was stable and there was a growing middle-class in the urban centers of the country. Shopping habits, such as buying imported goods, shopping abroad in Italy and Austria, and other examples of consumerism were commonplace already from the 1960-ties onwards. Therefore, Croatian consumers were brought up in a manner that resembled more that of the Western European than those behind the Iron Curtain.

Royal Danish Embassy Zagreb Page 8 of 47 Trade Council of Denmark
Beginning of the 1990-ties marked a hard period for the country and the economy, with the occurrence of war/post-war period and transition from a centralized to a market economy. First signs of economic recovery and strengthening of the purchasing power appeared in the beginning of 2000-2001. This coincided with the market entry of the first international retailers, after which several new ones continuously entered the market each year. This trend continues today. Domestic retailers have tried to follow suit, however, many of the old retail giants from the pre-1990 period have disappeared. Some have simply not survived due to their inability to adapt to new market demands, while other have been lost in the privatization period, which bankrupted a lot of companies and left a large negative impact on the economy as a whole. Despite growing competition from international players, Croatian retailers are holding strong – they used their advantage from the 1990-ties, when foreign investors avoided the country due to the complex socio-economic situation. Foreign retail chains brought new ideas and concepts, like distribution alliances and supply chains.
Outlet 2002 2003 2004 2005 2006 2007f 2008fSupermarkets 2.45 2.80 3.29 3.90 4.60 5.38 6.28 Hypermarkets 0.18 0.18 0.21 0.24 0.28 0.32 0.37 Discount stores
0.04 0.05 0.06 0.07 0.08 0.09 0.10
Buying group stores
0.41 0.42 0.45 0.47 0.50 0.52 0.54
Total mass grocery retail
3.08 3.45 4.00 4.68 5.54 6.30 7.29
Figure 5: Total sales by outlet in million USD (BMI) Increased competition has encouraged price wars in domestic companies and improvements in shop concepts, such as emergence of hypermarkets. Strict government policy, such as the law forbidding Sunday trading for larger retailers is discouraging for some foreign business. The law on Sunday ban of trading was introduced in 2004 and quickly overruled, following pressure from the retail chains. In 2007, Croatia should get a new Law on Sunday Trading, which will regulate this issue by prescribing strict rules for holiday and overtime payments, as well as more liberal approach during the tourist season.

Royal Danish Embassy Zagreb Page 9 of 47 Trade Council of Denmark
Total retail sales reached an estimated 4.68 million USD in 2005, of which supermarket sales accounted for more than 89%. Supermarket sales rose by around 163.9% between 1999 and 2005, while hypermarket sales experienced a 144% increase and continue to provide the highest turnover by retail outlet at an average of 12.5 million USD in 2005.
Outlet 1999 2000 2001 2002 2003 2004 2005 Supermarkets 300 350 404 470 525 549 617 Hypermarkets 3 4 7 9 11 14 20 Discount stores
60 65 70 82 96 104 112
Buying group stores
700 750 800 820 840 865 895
Total mass retailers
1.063 1.169 1.283 1.381 1.472 1.532 1.644
Figure 6: Structure of sector by number of outlets (BMI) New categories of retail outlets changed consumers' shopping habits. According to Puls market research in 2006, 54% of the population still shops daily, in small quantities. However, this figure marks a decrease since 2003, when 64% reported that they shop daily. When it comes to 'large shopping', 37% of the population makes it once per month, while 17% shop in large quantities 2-3 times per month. The most popular outlets for 'large shopping' are hypermarkets/supermarkets/cash&carry centers (66%) and supermarket chain stores (36%). Approximately 70% of citizens pay in cash, 25% with credit cards.
Outlet Sales in 2005, million USD Supermarket 6.32 Hypermarkets 12.25 Discount stores 0.56 Buying group stores 0.53 Total mass retailers 2.85
Figure 7: Estimated value of sales per type of outlet in 2005 (BMI) In general, per-capita food consumption expenditure will increase by 16% between 2005-2010. However, despite this overall increase, expenditure on food as percentage of GDP will fall from 14% to around 4%, as consumers become more price conscious and retailers increase competition to keep up with the new demands of high quality and lower prices.

Royal Danish Embassy Zagreb Page 10 of 47 Trade Council of Denmark
3.2 Retail and wholesale operators Retail trade is consolidating rapidly. In 2006, the leading 10 chains held 66% of the total market. Five years ago, they held only 1%. One major difference between Croatia and the other countries is the region is that the market leader is a domestic retail chain – Konzum (part of Agrokor concern). Konzum covers 22% of the retail market. Besides, there are 6 domestic chains on the top list, which shows that Croatian retail chains are successful in fighting foreign competition, even though some of them are only present locally.

Royal Danish Embassy Zagreb Page 11 of 47 Trade Council of Denmark
Company Type and number of outlets
Origin Estimated sales, mill USD
Number of employees
Agrokor Konzum shops Maxi Konzum supermarkets Super Konzum hypermarkets
Croatian 1.700 9.000
REWE Billa supermarkets 24 Minaco shops: 24
Austrian 320 na
Metro Metro cash & carries: 6 German 277 1.300 Ultra Buying group Croatian 259 4.070 CBA Buying group Croatian 220 na
Mercator Mercator hypermarkets: 8 Mercator supermarkets: 39
Mercator shops: 19
Slovenian 223 2.500
KTC KTC supermarkets: 20 Croatian 110 na Kerum Kerum supermarkets: 30 Croatian 89 na Coop Ipercoop hypermarkets: 6 Italian Getro Getro cash & carries: 15
Getro family supermarkets: 2Croatian 40 1.600
Lidl & Schwartz
Kaufland supermarkets: 15 German 51 na
Figure 8: Top retailers in 2005 (GFK Croatia) According to market research, Getro has the lowest prices, while the newcomer Lidl is on the second place. Billa is the most expensive retail chain. Mercator is perceived as the 'tidiest' store with the nicest interior decorum, while Lidl is the 'messiest'. In the last 15 years, the number of stores in Croatia has doubled and trading is the main activity of every third company on the market. In 2005, Croatia had 77 hypermarkets and supermarkets per one million inhabitants, similar to Hungary. Czech Republic had 110, Slovenia 181, while Scandinavian countries had 400 per average. In 2006, there were 3297 kiosks, 371 supermarkets (300-2499 m2) and 35 hypermarkets (over 2499 m2). There were also 736 drugstores, 3676 grocery stores (40-100 m2) and 4270 small shops (up to 40 m2).
3.2.1 Company profiles Konzum
Konzum is the dominant retailer on the Croatian market and part of the Agrokor concern (which includes major food producing companies). Konzum employs over 9.000 people and has over 500.000 customers every day. It started as a state-owned Unikonzum chain in 1970, and was privatized/bought by the Agrokor company in 1994. It grew from a Zagreb-based chain to cover the entire country in only two years. They have a very successful private-label brand K-plus (canned food, bakery products, cosmetics, beverages, fresh meat). The company has a loyalty program called K-plus card (for collection of points for discounted prices). In 2004, Konzum developed a wholesale chain called Velpro, which has 11 supply centers for retailers and foodservice companies. Velpro has its own private-label brand called Rial (food and non-food). Konzum also launched a drugstore called Kozmo in 2005 and the plan is to open 100 stores by 2010.

Royal Danish Embassy Zagreb Page 12 of 47 Trade Council of Denmark
Getro
Getro is a Croatian cash and carry system, largest in the country. It was founded 11 years ago and operates as a retail and wholesale shop dealing with private customers and registered businesses (28.000). Getro developed several private-label brands, such as President's Choice, Grand, Grandi, Cookie, Dominica, etc (food and non-food items). Their total store sizes range between 5000-19000 m2, of which a minimum of 4000 m2 is used for the cash & carry center, while the rest is leased as outlets to other retailers. It remains to be a family company, with the EBRD holding a minority stake since 2002. The company ranks second in total retail sales. Their expansion plans include Serbia and Montenegro, as well as Bosnia & Herzegovina.
Billa
Rewe Group operates in 14 countries worldwide and their first Billa supermarket was opened in Zagreb in 1999. Since then they grew to 48 outlets and they took over a local retailer Minaco. Billa Croatia currently employs 1500 workers. Their private-label brand Clever (around 200 different products of food, cosmetics, beverages, household items) is among the most popular on the market. Their supermarkets (24) sizes range from 1200 to 2000 m2.
Kaufland
Kaufland has been in Croatia since 2002. Their strategy is based on discounted prices and small hypermarkets of 2000 m2. They are constantly expanding and acquiring new premises. Besides food, they offer a range of small household items. They experienced problems with domestic suppliers, which at one point boycotted them due to claims of dumping prices. However, their market share holds strong and is growing.
KTC
KTC started as a small family store in 1992 in the northern Croatia, and has since expanded to 16 shopping outlets. They remain in 100% ownership of the Katavic family. Their strategy is to focus on rural areas, with shops of 3-4 thousand m2, carrying food and non-food items (56 thousand items). They are present in 17 small towns in the north and northeast of the country. KTC directly imports around 6 thousand items from Italy, Poland, Slovenia, Bosnia and the Ukraine. Since they are situated in agricultural areas, they place special emphasis on building good relations with the farmers – they work with cooperatives on production of private-label preserves and pickles.

Royal Danish Embassy Zagreb Page 13 of 47 Trade Council of Denmark
3.3 Buying Groups and Associations CBA CBA is an association of 8 Croatian retailing companies, established in 2001 by Biljemerkant, Boso, Idis, Trgom Novi Marof, Bakmaz, Jolly, Studenac and Pemo (small retailers in rural areas), as part of the European CBA network. The idea was to unite the cut the cost of supply and logistics and thus become more competitive in light of international arrivals to the retail scene. CBA offers to its members unified supply, joint visual identity and marketing efforts, as well as joint expansion of the retail network. Besides Croatia, CBA is present in 11 other countries, with Hungary as a starting point. The goal of CBA Europe is to become the determinative commercial chain in Central Europe and standardize quality and technology within members from different countries. Ultra Ultra is an association of 20 small Croatian retailers, founded in 2001. They are present in all parts of Croatia and have over 430 outlets. The company has its own private-label brand, which includes 150 products for household, hygiene, etc (non-food items). Their total turnover in 2005 stood at 417 million EUR, which was an increase of 108% y-o-y.

Royal Danish Embassy Zagreb Page 14 of 47 Trade Council of Denmark
Plus market
This chain of supermarkets is a recent initiative by the program 'Buy Croatian'. As an attempt to fight of competition from international retail chains entering the market, a retail chain called Plus market was established, whose first shop opened at the end of 2006. This concept is part of the Strategic Partnership and Business Cooperation Agreement between the Croatian Chamber of Crafts (representing 20.000 artisans – small shop owners), leading national chain Konzum and leading Croatian food producers (Agrokor, Franck, Koestlin, Kras, Lura, Podravka, Zvecevo). The idea is to connect between 2000-5000 small private shops with Konzum's wholesale store Velpro in a network Plus market. Members will keep their own legal independency, but will profit from reduced prices of goods, joint marketing and standardizing of small retail stores. Due to the fact that domestic food producers are a part of this initiative, Plus market shops will predominantly carry Croatian products.
3.4 Distributors AWT International
The company has been present on the Croatian market for ten years and is one of the largest distributors of food. It is a part of the international AWT group, present in several countries in the south eastern Europe. They are distributors fro Hipp, Barilla, Chipita, Henkel, Kelly's, Master Foods, Pfanner, Schneekoppe, Moelnylcke and Unilever. The company has four distribution centers in major cities with over 21.000 m2 of storage space. Every year they import over 25.000 products.
Item 2005 Change 2004/2005 Turnover 110-120 million EUR +6% Profit 1.4-1.5 million EUR -52% Productivity 27.200 EUR na
Figure 9: Economic indicators for AWT, 2005 (Poslovna Hrvatska)
Atlantic Trade
Part of the Atlantic Group, Croatian-owned, also includes companies Neva (production of cosmetics), Cedevita (production of teas, medical bonbons, etc) and Multipower (German, former Haleco). Atlantic Trade is a distributor for Duracell, Calvo, Durex, Duyvis, Ferrero, Johnson & Johnson, Katjes, Lorenz, Manner, Nestle Purina, Vivera and Wrigley. 59% of income is generated in Croatia, while around 35% comes from sales in the EU (mostly Germany).
Item 2005 Change 2004/2005 Turnover 110-120 million EUR +14% Profit 1.5-1.6 million EUR -24% Productivity 19.200 EUR na
Figure 10: Economic indicators for Atlantic Trade, 2005 (Poslovna Hrvatska)

Royal Danish Embassy Zagreb Page 15 of 47 Trade Council of Denmark
Magma
Magma is one of the largest Croatian companies, with several divisions: distribution of clothing (representatives of Miss Selfridge, Topshop, etc), production and retail of sports clothing (Magma Sport), distribution of food (Haribo, Kellog's, Bahlsen). The company is very strong regionally, with representation in Bosnia and Serbia.
Item 2005 Change 2004/2005 Turnover 70-80 million EUR +7% Profit 3.0-3.4 million EUR na Productivity 16.000 EUR na
Figure 11: Economic indicators for Magma, 2005 (Poslovna Hrvatska)
Stanic
Stanic company's portfolio consists of over 700 products, including poultry, dairy, fish, fruit and vegetables, confectionary, etc. The company's sales are to the retail segment, as well as HoReCa. They have their own warehouses (total 15.000 m2) with cooling facilities on eight locations in Croatia. The company has a packing and cutting plant and currently they are processing around 40 types of products. They are distributors for Zott, President, Sorger, Bayerland, Bonduelle, Heinz, Cirio, Pedro, Grozzete and others.
Item 2005 Change 2004/2005 Turnover 40-50 million EUR +3% Profit 1.8-1.9 million EUR -7% Productivity 19.330 EUR na
Figure 12: Economic indicators for Stanic, 2005 (Poslovna Hrvatska)
3.5 Food Fairs
Fair name Location Date Participants Hotel and Gastroteh Zagreb 21.-24.02.2007 HORECA, food Sajam Gast Split 07.-11.03.2007 Food, beverages,
HORECA Bjelovarski sajam Bjelovar 23.-25.03.2007
07.-09.09.2007 Agriculture
Figure 13: Food fairs in Croatia (Croatian Chamber of Economy)

Royal Danish Embassy Zagreb Page 16 of 47 Trade Council of Denmark
4 Food production and imports Agriculture, fisheries and related industries contribute with 10% of the national GDP and employ 6.5% of the total workforce. Around 2.600 companies in Croatia are involved in food production and processing. Croatia is self-sufficient in only five agricultural items: poultry, eggs, wine, wheat and corn.
Product Measure 2003 2005 % change Wheat 000 tonnes 609 602 -1.1 Corn 000 tonnes 1.569 2.207 41 Other grain 000 tonnes 174 217 24 Sugar beet 000 tonnes 678 1.338 97 Oil beet 000 tonnes 29 41 95 Soy 000 tonnes 83 120 44 Sunflower 000 tonnes 69 78 13 Tobacco leaf 000 tonnes 10 10 0 Potatoes 000 tonnes 375 273 -27 Peas 000 tonnes 10 6 40 Cabbage 000 tonnes 98 51 -48 Tomato 000 tonnes 59 29 -51 Apples 000 tonnes 58 70 21 Grapes 000 tonnes 333 181 -46 Olives 000 tonnes 9 37 311 Plums 000 tonnes 43 36 -16 Fish Tonnes 29.601 48.414 64 Cattle 000 heads 466 485 4 Pigs 000 heads 1.489 1.230 -17 Horses 000 heads 10 9 -10 Sheep 000 heads 721 768 6.5 Poultry 000 heads 11.185 10.045 -10 Cow's milk Million liters 642 766 19 Eggs Million pieces 873 824 -5.6 Honey Tonnes 1.616 2.657 64
Figure 14: Agricultural production (Ministry of Agriculture) Large increases in olive production, sugar beet and oil beet are a result of state subsidized efforts to achieve higher quotas when entering the EU.
4.1 Pricing Consumer prices grew by 3.2% in 2006, compared with 2005. Increase of food prices, which constitute around one third of the consumer price basket, was 2.5% and was achieved in all categories of food items. Since 2001, food and beverage prices grew by 10%, of which the biggest growth was in fish, alcohol and tobacco prices.

Royal Danish Embassy Zagreb Page 17 of 47 Trade Council of Denmark
Item EUR per kg XII/2006 Beef loin 6.00 Pork loin boneless 4.00 Cured ham 10.00 Chicken 3.37 Milk, 2.8% (1 l) 0.57 Cheese 3.40 Plain yoghurt 500 ml 0.76 Fresh eggs (10 pc) 1.20 Butter 250 g 1.00 Margarine 250 g 1.10 Wheat flour kg 0.40 Rice 1.04 White bread 0.94 White sugar 0.94 Table mineral water (1.5l) 1.00 Quality white wine 4.05 Bottled beer, domestic (0.5 l) 0.74 Potatoes 0.26 Table apples 0.7 Tomatoes 1.6 Carrots 0.7
Figure 15: Consumer prices (estimates) Since there is no official statistics of retail prices in Croatia, we have used the current average prices in retail chains to get a good estimate.
Item EUR per kg XII/2004
EUR per kg XII/2006
Change 04/06, %
Heifer Simmental for slaughter 1.7 1.4 -18 Young Simmental bull (>450 kg)
1.8 1.6 -11
Cow Simmental for slaughter 0.9 0.8 -11 Pig (80-120 kg) 1.6 1.4 -12.5 Carp 2.1 1.8 -14 Wheat 0.15 0.13 -13 Potatoes 0.17 0.26 53
Figure 16: Average producer prices for agricultural products (wholesale, Ministry of Agriculture) In the last two years, producer prices of cattle have been steadily decreasing. This is due to the fact that supply of some live animals still exceeds demand. On the other hand, the supply of high quality animals such as young calves is not sufficient. Eurostat shows that Croatia has the highest prices in the region of South Eastern Europe in the following categories: juices, mineral waters, cigarettes, sugar, milk and cheese. Fish is the only category where Croatia achieves lower prices, for example 20% less than in Slovenia.

Royal Danish Embassy Zagreb Page 18 of 47 Trade Council of Denmark
4.2 Foreign trade Agricultural and food products make up 9% of Croatian total exports and imports. Croatia exports foodstuffs largely to its immediate neighbors – Slovenia, Bosnia – Herzegovina, Montenegro, Italy and Serbia. The major export products are tobacco, cereals, seeds, medical herbs, mandarins, honey, Vegeta (food seasoning), biscuits and wafers, chocolate, canned fish, soups, olive oil, beer and alcoholic beverages. The country imports a large amount of produce from the EU, including cocoa, soybeans, oil crops, breeding cattle, milk, meat, fruit and vegetables. Over the past two decades, meat cattle, milk and egg production has decreased. It is estimated that by 2010, the imports of food in Croatia will reach 4 billion EUR.
Import 2003/million USD
2005/million USD
% change 03-05 From Denmark, % of total imports, 05
Total 1,117.00 1,462.00 30.88 9.2 Food and live animals
1,000.00 1,332.00 33.20 1.9
- live animals 61.95 115.92 87.11 0.35 - meat and meat products
839.77 175.14 -79.14 2.36
- dairy and eggs 77.05 86.99 12.90 0.36 - fish 82.73 98.44 19.98 6.39 - grain and grain products
106.34 133.32 25.37 0.00
- fruit and vegetables
234.34 266.83 13.86 0.00
- sugar, sugar products, honey
64.79 101.79 57.10 0.18
- coffee, tea, cocoa, seasoning
98.56 121.53 23.30 0.00
- animal feed 81.44 97.04 19.15 1.90 - other food 109.74 135.72 23.67 0.00 - beverages 90.26 104.05 15.28 0.18
Figure 17: Imports (Croatian Bureau of Statistics) When it comes to imports of food, Croatia's traditional trading partners hold the top positions – Italy, Germany and Austria account for 30% of the total food imports. Croatia is currently negotiating accession with the EU, and agriculture is considered to be one of the most difficult chapters that remain to be covered. As a candidate member, Croatia is obliged to incorporate an EU-harmonized system concerning food safety, veterinary and phytosanitary measures. Implementation of such regulated standards, as well as HACCP system in the Croatian food industry, will be the next challenge.
Royal Danish Embassy Zagreb Page 19 of 47 Trade Council of Denmark
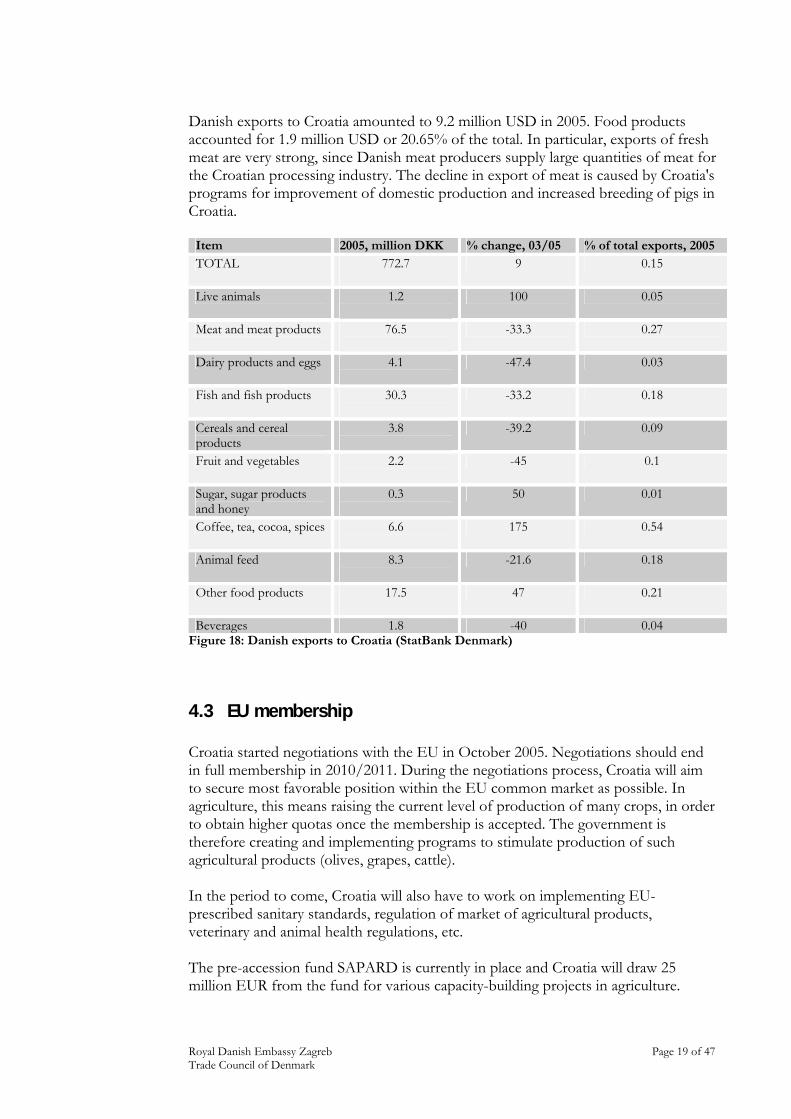
Danish exports to Croatia amounted to 9.2 million USD in 2005. Food products accounted for 1.9 million USD or 20.65% of the total. In particular, exports of fresh meat are very strong, since Danish meat producers supply large quantities of meat for the Croatian processing industry. The decline in export of meat is caused by Croatia's programs for improvement of domestic production and increased breeding of pigs in Croatia.
Item 2005, million DKK % change, 03/05 % of total exports, 2005 TOTAL 772.7
9 0.15
Live animals 1.2
100 0.05
Meat and meat products 76.5
-33.3 0.27
Dairy products and eggs 4.1
-47.4 0.03
Fish and fish products 30.3
-33.2 0.18
Cereals and cereal products
3.8
-39.2 0.09
Fruit and vegetables 2.2
-45 0.1
Sugar, sugar products and honey
0.3
50 0.01
Coffee, tea, cocoa, spices 6.6
175 0.54
Animal feed 8.3
-21.6 0.18
Other food products 17.5
47 0.21
Beverages 1.8 -40 0.04 Figure 18: Danish exports to Croatia (StatBank Denmark)
4.3 EU membership Croatia started negotiations with the EU in October 2005. Negotiations should end in full membership in 2010/2011. During the negotiations process, Croatia will aim to secure most favorable position within the EU common market as possible. In agriculture, this means raising the current level of production of many crops, in order to obtain higher quotas once the membership is accepted. The government is therefore creating and implementing programs to stimulate production of such agricultural products (olives, grapes, cattle). In the period to come, Croatia will also have to work on implementing EU-prescribed sanitary standards, regulation of market of agricultural products, veterinary and animal health regulations, etc. The pre-accession fund SAPARD is currently in place and Croatia will draw 25 million EUR from the fund for various capacity-building projects in agriculture.

Royal Danish Embassy Zagreb Page 20 of 47 Trade Council of Denmark
Croatia is a member of the Central European Free Trade Agreement, which is a free-trade pact that can act as a stepping-stone for SEE countries moving towards EU membership. With Bulgaria and Romania joining the EU in January 2007 and leaving the agreement, CEFTA's only members remain Croatia and Macedonia, although smaller markets of Albania, Kosovo and Moldova will likely sign on soon. Serbia and Bosnia – Herzegovina are expected to join as well, after resolving objections over competitive conditions. With these 2 countries in as well, CEFTA will cover 28.5 million people. Croatia, as the most developed country in the pact, carries the weight of 42% of the total.
30%
6%3%42%
10%9%
Serbia Macedonia Moldova Croatia Bosnia-Herzegovina Albania
Figure 19: Economic weight of existing and potential CEFTA members (% of combined GDP, 2006 forecasts, excluding Kosovo, Montenegro data combined with Serbia, BMI)

Royal Danish Embassy Zagreb Page 21 of 47 Trade Council of Denmark
5 Main food groups in Croatia
5.1 Meat and meat products Croatia's meat industry produced 19.275 tonnes of beef and 39.331 tonnes of pork in 2005. There are several very strong meat processing companies, which transformed themselves from state-run agricultural combinates to private-owned companies and the current domestic production of inputs does not satisfy their needs. In the period between mid eighties and mid nineties there was a significant reduction in livestock production in Croatia. However, since mid nineties livestock production, especially beef production, is no longer decreasing, and in 2006, it amounted to 485.000 heads of cattle, 1.230.000 pigs, 768.000 heads of sheep and 10.040.000 heads of poultry. With the approaching EU membership, meat-processing industries, including farms and slaughterhouses, are under pressure to comply with the standards of the European Union and modernize their facilities. In an attempt to restructure and improve production of cattle and pigs, the government has put in place programs for development of these industries, promoting specialization and implementing new production systems.
Item Production in 2005, t % produced in companies % produced in family farms Beef 78.388 24 76 Pork 182.595 30.9 69.1 Sheep 13.748 1.4 98.6 Poultry 115.456 75.8 24.2
Figure 20: Domestic production of meat (Croatian Bureau of Statistics) Croatians consume most poultry, with pork being the close second. Despite the trend of healthy eating, as well as recent outbreaks of avian flu and swine fever, there have been no major changes in the quantities of consumed meat.
CROATIA
24%
37%
39%
cattle pork poultry
DENMARK
22%
41%
37%
cattle pork poultry
Figure 21: Distribution of meat consumption in Croatia and Denmark, 2005 (Croatian Bureau of Statistics, Eurostat) Per capita consumption figures stand at 19.6 kg of poultry, 11.6 kg of cattle and 18.1 kg of pork per year.

Royal Danish Embassy Zagreb Page 22 of 47 Trade Council of Denmark
There are 196 slaughterhouses in Croatia. A number of slaughterhouses are of international standard and 12 have exporting licenses for the EU and US markets. However, many municipal slaughterhouses will have to upgrade their standards or be closed, for not complying with EU regulations.
5.1.1 Beef and pork producers Mesna industrija Braca Pivac
Meat industry Braca Pivac is the largest importer of meat in Croatia, employing over 380 persons. It is a holding of several companies, including Braca Pivac meat processing industry, PPK Karlovac (former agrocombinate), Bermes meat industry and Dalmesso (one of the largest producers of prosciutto). It was established in 1957 as a small private meat shop. Their turnover in 2005 reached 80 million EUR. Their products include fresh meat, semi-durable and durable meat products, distributed throughout Croatia. Their own network of retail shops includes 43 outlets, as well as 7 wholesale distribution centers. They are exporting to Bosnia – Herzegovina and Macedonia, are ISO-certified and have implemented HAACP. More information on www.pivac.hr.
Item 2005 Change 2004/2005 Turnover 80 million EUR +17% Profit 5.8 million EUR +50% Productivity 29.730 EUR +23%
Figure 22: Economic indicators for Mesna Industrija Pivac, 2005 (Poslovna Hrvatska)

Royal Danish Embassy Zagreb Page 23 of 47 Trade Council of Denmark
PIK Vrbovec
PIK Vrbovec is one of the oldest Croatian meat industries, formerly an agro-combinate. They have been on the market for over 70 years and were bought in 2005 by the Agrokor concern (biggest Croatian food industry). The company produces fresh meat and durable products, including beef and pork, all sorts of sausages, dried meat and bacon, canned meat, and other processed beef and pork. The company is licensed for exports to the EU and is one of the largest suppliers of McDonald’s in Croatia. More information can be found on www.agrokor.hr.
Item 2005 Change 2004/2005 Turnover 160 million EUR +300% Profit 60 million EUR +400% Productivity 52.000 EUR na
Figure 23: Economic indicators for PIK Vrbovec, 2005 (Poslovna Hrvatska)
Belje
Belje has a long tradition in the meat production since it was once the biggest meat company in Croatia. It is now part of Agrokor concern. The company is set up in several profit centers: manufacture of sausages and salami, production of flour, production of wine, dairy production, crop production, animal feed production, pig production, production of fattening calves and milk production. Until 2010, Agrokor intends to invest 400 million HRK in Belje and make it one of the forerunners of the Croatian food exporting industry. More information is on www.agrokor.hr.
Item 2005 Change 2004/2005 Turnover 110 million EUR +93% Profit 20 million EUR +145% Productivity 16.530 EUR na
Figure 24: Economic indicators for Belje, 2005 (Poslovna Hrvatska)
Danica
Danica is part of Podravka concern, one of the leading food producers in Central and Eastern Europe. Podravka has companies in 17 countries and a strong distribution network from the Adriatic to the Baltic Sea. Podravka's brands are widely recognizable, and include the roof brand Podravka and Vegeta, the universal food seasoning sold in over 40 countries worldwide. Danica meat industry has licenses to export to the EU and the US. The company is currently undergoing internal restructuring. They have over 700 employees. More on www.podravka.hr.
Item 2005 Change 2004/2005 Turnover 50 million EUR +13% Profit 230 thousand EUR -19% Productivity 13.330 EUR na
Figure 25: Economic indicators for Danica, 2005 (Poslovna Hrvatska)

Royal Danish Embassy Zagreb Page 24 of 47 Trade Council of Denmark
5.1.2 Poultry producers Perutnina Ptuj – Pipo
This company is 65% owned by the Slovenian Perutnina Ptuj. The company is among the most important meat producers in Croatia, with a market share of 20%. Their income in 2005 amounted to 219 million HRK. Their product portfolio includes fresh and chilled chicken meat, chicken parts (fresh and chilled), sausages, salami, etc. The company is known for its environmental awareness and has invested in a biogas plant, using animal waste from the production process.
Item 2005 Change 2004/2005 Turnover 30 million EUR 2% Profit 1.3 million EUR 263% Productivity 12.270 EUR
Figure 26: Economic indicators for Perutnina Ptuj - Pipo, 2005 (Poslovna Hrvatska)
Koka
Koka is a part of the Vindija food industry concern, one of the top three Croatian food industries, consisting of meat, dairy and bakery companies. Their products are fresh and frozen chicken meat, chicken salami, pates, light products and ready-to-bake chicken meals. The company holds 80% market share in the poultry segment. Koka exports 85% of the total production, mostly to the markets of the UK, Austria, Sweden and Slovenia.
Item 2005 Change 2004/2005 Turnover 130 million EUR 32% Profit 770 thousand EUR -59% Productivity 7.600 EUR -10%
Figure 27: Economic indicators for Koka, 2005 (Poslovna Hrvatska)
5.1.3 Fish producers Fish processing in Croatia has a 150-year tradition and is one of the first industries in these areas. Unfortunately, only 3 companies are still active, out of 14 plants that previously existed on the coast. Four plants are situated on the islands. Processing industry produces sterilized and non-sterilized fish, as well as a wide range of fish products. Industrial processing is dominated by sterilized sardine cans, tuna fillets and tuna with vegetables, mackerel fillet and vegetable mackerels, which make up 90% of total production. Fish processing today faces difficulties due to the lack of inputs (decreased catch of sardines, along with increased demand for fattening tuna in cages, made a special impact on input prices, as well as end product prices). Currently, the capacities used are 35%, compared with the pre-war figures of 76%. There were 3720 registered fishermen in Croatia in 2005, with 3692 vessels. A total of 44.111 tones of fish and shellfish were produced in 2005, of which 78% was caught and 22% bred.

Royal Danish Embassy Zagreb Page 25 of 47 Trade Council of Denmark
Production 2005 Item Caught Bred
Index 04/05
Total 34.636
9.475
110
Fish 33.194
6.475
111
- blue fish 28.621
3.425
107
- sardines 16.521
- 101
- anchovies 9.504
- 127
- tuna 1.021
3.425
97
- other 1.575
- 104
Other fish 4.573
3.050
130
- hake 870
- 128
- goatfish 911
- 102
- mullet 30
- 125
- eel 25
- 227
- sea bass 28
3.000
101
- Pickerel 145
- 125
- bouge 125
- 151
- sole 210
- 137
- other 2.229
50
250
Shellfish 258
- 94
- lobster 7 - 223 - scampi and other 251
- 93
Oysters and other 1.184
3.000
109
- oysters, mussels 90
3.000 99
- squid 243
- 352
- cuttlefish 80
- 205
- octopi 771
- 124
Figure 28: Production of fish and shellfish in Croatia, 2005 (Croatian Bureau of Statistics)

Royal Danish Embassy Zagreb Page 26 of 47 Trade Council of Denmark
The biggest growth of production and market share is recorded for salted anchovies, frozen fish, smoked fish, fish pates and marinades, as well as various fish produces. Since 2002, production of these products has increased 5 times. Still, the production is minimal compared with Croatia's potential. Fisheries are one of the rare branches of production with a positive foreign trade balance and it is expected to improve further once the fishing fleet is in place. This should decrease Croatia's current vast imports of blue fish needed for tuna breeding (Croatia imports 30.000 tons of herring and sardines from Sweden, Denmark, Spain). Fish is exported to Italy and Spain, while entire production of tuna is exported to Japan. Exports of salted anchovies are increasing, especially to Italy and Spain. Canned fish is exported to the region, Czech Republic, Austria, USA, Canada, Australia and Poland. There are only three companies in Croatia dealing with canned fish and fish processing. The largest company, Adria, is the market leader, with 70% of the total quantity of canned fish produced. The rest is shared between Sardina and Mirna (around 20 million cans per year each).
Adria
Adria produces around 25 million cans of fish per year. The company is over 100 years old and is situated in the coastal city of Zadar. Adria has adopted HACCP and ISO standards and its main products are canned Adriatic sardines of high quality. Other products include fishmeal, salted anchovies and other processed blue fish. Adria's strategic partner is Podravka, which enables them access to international markets, such as Poland, Sweden, Hungary, Greece, USA and others. The company has 350 employees.
Item 2005 Change 2004/2005 Turnover 20 million EUR +26% Profit -700 thousand EUR +71% Productivity 5.470 EUR na
Figure 29: Economic indicators for Adria, 2005 (Poslovna Hrvatska)
Mirna
Mirna invested around 1 million EUR in 2005 with the purpose of acquiring technologically advanced equipment for production and construction of a new fishing ship. Due to mismanagement in the past, Mirna is still in financial difficulties. Sales are generated mostly through exports, which grew with a rate of 25% in 2005. However, profitability is low due to high input costs. In European terms, this company produces 5% of the total European production of canned fish.
Item 2005 Change 2004/2005 Turnover 2.9 million EUR -20% Profit -430 thousand EUR na Productivity 6.670 EUR na
Figure 30: Economic indicators for Mirna, 2005 (Poslovna Hrvatska)

Royal Danish Embassy Zagreb Page 27 of 47 Trade Council of Denmark
Sardina
The company is situated on the island of Brac and is 100 years old. However, it is fully modernized and production follows ISO and HACCP standards. Most of the income is generated on tuna and high quality white fish. Around 1/3 of income comes from fish cans. Their majority owner is the Swiss company Ameco. Sardina is the smallest of the three remaining fish processing companies, but it is recording high growth rates. Besides Eastern Europe, USA and Canada, the company's large export market is Israel, since they also produce kosher fish.
Item 2005 Change 2004/2005 Turnover 20 million EUR +9% Profit 30 thousand EUR -25% Productivity 11.070 EUR na
Figure 31: Economic indicators for Sardina, 2005 (Poslovna Hrvatska)
5.1.4 Legal aspects concerning the meat and fish sector Croatia is currently negotiating chapter 'Agriculture' with the EU and is trying to secure certain benefits when it comes to traditional farming and fisheries. One of the greatest concerns of the Croatian public was that the EU accession would put an end to traditions such as kolinje (on-farm slaughtering of pigs) and production of domestic sausages and other products. In fisheries, it is related to the usage of traditional methods. Another important issue is compliance with EU regulation in all aspects of food production, which will be gradually adopted, also with assistance of pre-accession funds.
5.1.5 Forecast meat and fish sector As household income rises, it is expected that there will be increased demand on higher quality meats and meat products, particularly the popular delicacies such as cured ham (prosciutto), good cuts of fresh meat and fish and shellfish. Ready-made meals are not very popular at the moment, but it is reasonable to expect that they will also acquire a market due to the increase of urban population and extended working hours. It is expected that efforts of the government to increase domestic production of cattle, pigs and blue fish will yield results in the upcoming period, so it is predicted that there will be a decrease of imports in these segments.

Royal Danish Embassy Zagreb Page 28 of 47 Trade Council of Denmark
5.2 Dairy products Dairy contributes 7.3% to the agricultural GDP of Croatia. So far as the economics and development of milk production are concerned, Croatia is far behind the EU member states. Most Croatian milk is produced on family farms, and that production is expensive and insufficient to meet the needs of the dairy industry. The low level of milk production is to some extent a consequence of war activities and unfavorable results of reconstruction and privatization, but essentially the agricultural structure is underdeveloped with a large number of small farms (2.8 cows per farm on average) and poor production capacities, 10.000 producing only 6.000 liters each per year. In the immediate future it will be particularly important to encourage the setting up of modern farms or to help the existing ones to improve their facilities. However, despite a decreasing trend in the total number of cows and farms, milk production is rising. There were 239.000 milking cows in Croatia in 2005, a fall of 15.000 since 2000. By contrast, the total milk production increased by 179m liters to a total of 766 m liters over that same period. Domestic production meets about 80% of the annual needs for milk and dairy products. Due to insufficient domestic milk production and the outdated and inadequate processing facilities, Croatia needs to import milk and dairy products. In recent years, the share of imported milk has decreased, while the import of high-quality dairy products has increased. The main outputs of the processing sector are liquid cow milk (65.60%), fermented products (11.35%), cheeses (4.5%) and other products (13.58%). In the period 2000-2005, there was an increase in the volume of industrially processed milk in Croatia. Nevertheless, the dairy industry does not have sufficient equipment to manufacture enough high-quality dairy products to satisfy the demands of the local market. Consumption of dairy products is growing, with the accent on milk drinks, yogurt, UHT milk and fermented products. Also consumption of home – produced cheeses has grown significantly because of their high quality and increased presence in the market. The opportunities for the Croatian milk sector are the strong preference for native products in the domestic market, direct marketing, the image of Croatia as a “clean country” and attractive tourist destination, hence tourist demand and possible exports. However, despite strong presence of domestic dairy industries, international producers are present and expected to grow in greater numbers in the future. The two leading producers of dairy are Dukat and Vindija, both suppliers of fresh and long-life milk. While Dukat's strategy is to focus on the core business (milk and dairy), Vindija has chosen a strategy of diversification and is expanding into different areas, from soft drinks to animal feed. Meat industry is also a big part of Vindija's business. In the entire dairy segment, Dukat holds 35% of the market, while Vindija has 42% (volume). On the value side, Dukat accounts for 39% and Vindija only 30% of the market share. Croatia produces around 10 thousand tons of semi-hard cheeses and the same amount of melted and fresh cheeses per year. Over 10 thousand tons of cheese is imported, mostly of the semi-hard variety. Gauda accounts for the largest share of imports (4700 tons in I-X 2005), due to the lowest customs tariff. Most of the cheese comes from Argentina and Uruguay (1/3 of total imports). Domestic producers export around 1.000 tons per year.

Royal Danish Embassy Zagreb Page 29 of 47 Trade Council of Denmark
5.2.1 Dairy producers Dukat
Dukat is the market leader in the dairy segment. The company produces fresh and long-life milk, yoghurts, puddings, fresh/cottage cheese, cream, hard cheese, butter and margarine. It is part of the Lura concern (which recently changed its name to Dukat), including also Eurobev, a soft-drink producer and distributor for Pepsi Cola. However, the company has decided to focus solely on the growing dairy segment and is at the moment in the process of selling the soft drink business. Dukat's goal is to become a regional leader and the basis for expansion is organic growth of the company, despite current high market shares. The company already owns Serbian Somboled and is a market leader in Bosnia – Herzegovina, as well (share of 15%).
Item 2005 Change 2004/2005 Turnover 280 million EUR +10% Profit 30 million EUR ++% Productivity 31.330 EUR na
Figure 32: Economic indicators for Dukat (former Lura), 2005 (Poslovna Hrvatska)
Vindija
Vindija concern consists of the dairy industry (Vindija), bakery (Latica) poultry producer (Koka and Vindon), as well as a newly established animal feed producer (Biodar). The brand Vindija has a long tradition and is perceived as 'healthy and fresh'. The company is an innovator when it comes to introduction of bottled fresh milk and isotonic drinks and is still the only regional producer of special cheeses (with mould). However, in the segment of yoghurts and other dairy products, Vindija lags behind competition. One of the reasons is outdated technology, which should be solved with the planned construction of new plant in Varazdin. In a typical retail store, Vindija is represented with 27% of all milk and dairy products, and 50% of all chicken meat. The company is also looking for expansion opportunities, and is currently the owner of one dairy in Serbia.
Item 2005 Change 2004/2005 Turnover 300 million EUR 2% Profit 8 million EUR 16% Productivity 23.200 EUR na
Figure 33: Economic indicators for Vindija, 2005 (Poslovna Hrvatska)

Royal Danish Embassy Zagreb Page 30 of 47 Trade Council of Denmark
5.2.2 Forecast for the dairy sector Milk producers and dairy industries are faced with challenges brought by the approaching EU accession. Primarily, this is related to milk producers, who will have to make major investments in technology and production process in order to be able to produce high-quality milk, compliant with the standards of the Union. Milk producers are subsidized by the government (22 million HRK in 2005), which is one of the reasons behind the growth of milk production in the recent years. However, there is a sense of fear among Croatian milk producers that they will not be able to compete on the EU market, which has surpluses and cheaper prices (Croatian producer receives 2.9 HRK per liter of grade-A milk, while the EU farmer gets 2.3 HRK per liter). Dairy industries are already present in the region and are expanding market shares through acquiring existing companies in SEE. When it comes to product preferences, it is expected that the functional food segment within the dairy group (probiotic yoghurts, kefirs) will continue to grow. Healthy, low-fat and sugar-free products will continue to be popular. In the cheese segment, Croatians have preferences towards goat and sheep cheese and ecologically produced cheeses. Traditional domestic cheese types (Dalmatian goat cheese, Pag cheese) are expected to retain popularity.
5.3 Fruit and vegetables Estimates say that 30-40% of all fruit consumption in Croatia comes from imports. Domestic production only meets the needs for potatoes and tangerines. Apples are the most popular fruit, and their yearly consumption is 15.3 kg per person. Second is southern fruit with 10.4 kg per person and only 5.0 kg of seedy fruit is eaten per year. Imports of vegetables in 2006 grew by 26% compared with the previous year (value of imports was 72.3 million USD). It is estimated that less than 25% of the total vegetable consumption comes from domestic producers. Potato is the most popular vegetable (consumption per person per year: 45 kg).

Royal Danish Embassy Zagreb Page 31 of 47 Trade Council of Denmark
It is expected that the Croatian fruit and vegetable market will remain stable in the next 2-4 years. It is hard to expect major increases in consumption, but there will be decreases in prices. Traditionally, fruit and vegetables are bought in open markets and every larger settlement has at least one such place. Although this tradition is still alive and some of the largest open markets in Croatia (Zagreb, Split, etc) are also big tourist attractions, they are faced with a growing competition from supermarkets.
5.4 Confectionary The market of confectionary in Croatia grew at the rate of 5% in the period from 2000-2005. Total imports of confectionary in 2005 stood at 42.300 tons, showing a growth of 4.300 tons, or 11.4 % as compared to 2004. At the same time an amount of 12.300 tons of products were placed on foreign markets, representing an increase of 7.8%. There is a rising demand for healthy low-calorie products, as well as different varieties of salted snacks and dips. However, Croatians have a taste for sweets, especially chocolate and soft lines, which have shown growth the last 3 years.

Royal Danish Embassy Zagreb Page 32 of 47 Trade Council of Denmark
The market leader in confectionary is the domestic producer Kras, with 22.7% market share (retail value). They are under huge pressure from the competition, and they have been declining since 2000 (drop from 30.9% market share is 2001). The company's strengths are their brands, which have been on the market for decades and are recognized in the entire region. Mars and Ferrero are contributing with around 15% market share each. Besides Kras, there are two more companies on the top ten list (Cedevita and Zvecevo).
Brand name NBO/licensee Origin Dorina Kras Croatia Milka Kraft Austria Orbit Wrigley USA Twix Mars USA
Bounty Mars USA Kinder Surprise Ferrero Italy
Lindt Lindt & Sprüngli AG Switzerland Bajadera Kras Croatia
Mars Mars USA Winterfresh Wrigley USA
Figure 34: Brand shares, confectionary (Euromonitor)
5.5 Beverages
5.5.1 Alcoholic beverages Alcohol consumption and production took a severe knock with the introduction of the new law on road safety in August 2004. Following a series of tragic road accidents, the government established a complete ban on drinking and driving – no alcohol is allowed in the driver's blood. This greatly contributed to the decrease of total volume sales of alcoholic drinks by almost 6% in the period from 2004-2006. Only wine recorded marginal growth of 1%. The most popular alcoholic drink in Croatia is beer, which also suffered the greatest negative effect of the 0-promille law. In 2005, total beer volume sales decreased by almost 5% y-o-y. Beer producers tried to cushion the blow by introducing innovative packaging, new lines of alcohol-free or reduced alcohol beer and new sizes, but without major success.
Domestic lager brands are the most popular (Ozujsko and Karlovacko). Lager imports grew each year until 2005, however. Wine seems to be relatively steady in production and consumption. The most popular spirits are bitters, whose total volume sales grew by 21% from 2004-2006. Again, domestic producers are the most popular (Vigor is the absolute leader with volume share over 9%). Traditional spirits like rakija (slivovica, destilled from plums, for example) are produced at home and in hand-made distilleries, which limits their sales performance. There is a longstanding tradition of brandy production, however the consumption is decreasing consistently with 2005 volume sales almost half the level seen in 2000 (2.5 million liters compared with 4.2 million liters). On the other hand, whiskey has increased by almost 17% from 2004-2006. FABs (flavored alcoholic beverages) were introduced in late 2003 and have gained instant market appreciation.

Royal Danish Embassy Zagreb Page 33 of 47 Trade Council of Denmark
Forecast for the performance of alcoholic drinks largely depends on the situation with the law on road safety. Since its introduction, there have been talks that the law will be abolished (returned to the previous 0.5 promille limit). It can be expected that the government will consider it, in light of the upcoming election later in the year.
5.5.2 Soft drinks The market for soft drinks in Croatia increased between 2000-2005, growing at an average annual rate of 3.9%. 0.8b liters of soft drink were consumed in Croatia in 2005, a figure expected to grow by 5 per cent a year. This according to research analysts Zenith International will see consumption rates by 2010 rise to 1b liters. Of this market around 39 per cent is due to sales of carbonated soft drinks, with a further 8 per cent from fruit juices and nectars. The leader on the market in 2005 was The Coca-Cola Company. The second-largest player was Jamnica with Kolinska in third place. The Pepsi-licensee, Eurobev (also produces fruit juices), was recently taken over from Dukat by Badel 1862, one of the largest producers of spirits and mineral water on the market.
Croatia has extensive resources of water, which yield around 45 billion of cubic meters per year. Domestic producers are very dominant on the market – market leader is Agrokor's Jamnica/Jana, although Nestle and Coca Cola are present as well. There are also seven producers of gallon water in Croatia; the market leader in this segment is Podravka and their water Studena.

Royal Danish Embassy Zagreb Page 34 of 47 Trade Council of Denmark
Traditionally, coffee is the most popular hot drink in Croatia. Value sales outpaced volume between 2000 and 2005. This was due to the fact that instant coffee, cappuccino and decaffeinated coffee, which are more expensive than fresh ground coffee, increased greatly in terms of total coffee over the review period. Tea volume sales increased on a more moderate pace. Although there are no obstacles for multinational players to enter Croatia, hot drinks sales are dominated by local companies. In both coffee and tea, foreign brands account for only about a quarter of value sales. 'Other hot drinks' is the only category where their share is slightly higher. Coffee and tea (albeit predominantly fruit tea) have a long tradition in the country and consumers predominantly choose familiar domestic brands. Domestic company Franck remained the leader in both coffee and tea sales. Multinational players however are winning over consumers with new product formats. This was demonstrated by the introduction and immediate acceptance of 3-in-1 instant coffee products. Nestlé Adriatic, which was the first to launch the 3-in-1 Nescafé brand, is the leader in instant coffee.
As the health trend grows stronger, consumers will demand more innovative soft drinks, with lower calorie and sugar content. Vindija is at the moment leading the way with their brand new line of functional juices. At the same time, the water segment is expected to continue growing.
5.6 Organic products Croatia has over 300 registered organic (ecological, bio) farmers, accounting for about 0.3% of total arable area. This is well below the EU average (4-5% of total arable land). The biggest domestic producer in this segment is Mavrovic, former Croatian pro-boxer, turned macrobiotics fan, whose estate produces eco-wheat and wheat products (bread, rolls, cakes, etc). Only ten years ago, the organic food market in Croatia was virtually non-existent. However, with the expansion of the retail segment, changing perception and Croatians' strong anti-GMO convictions, organic food has become one of the fastest growing segments on the market. Ecological products have to be placed on special shelves in the shops, and in order to have the 'ecological product' label; they have to comply with specific regulation (divided from other products in the production process, for example). This of course makes eco products considerably more expensive than the 'normal' products (20-30% on average). Based on the fact that the government is heavily subsidizing ecological production, it is expected that more producers will enter the market. Likewise, consumer demand for high-quality eco products in all segments (meat, cereal, drinks) will grow, as income, urban population, education level and population age increase.

Royal Danish Embassy Zagreb Page 35 of 47 Trade Council of Denmark
5.7 Private label Private label share in Croatia stood at 7% in 2006. Such as small percentage is the result of the fact that a lot of Croatian buyers still shop in small grocery stores, especially in rural areas. As shopping habits change in favor of large store formats, it is expected that the private label share will increase. Croatian private-label shoppers are mostly urban citizens in the lower-middle segment. The strongest private label is K-Plus (by Agrokor's Konzum), which includes products like toilet paper, handkerchiefs, UHT milk, rice and serviettes, to packaged meat, fresh milk and fruit yoghurts. A lot of Konzum's production is outsourced abroad (serviettes, rice: Italy, yoghurt: Germany, etc). Product Retailer K-Plus toilet paper Konzum K-Plus handkerchiefs Konzum K-Plus pasta Konzum K-Plus UHT milk Konzum K-Plus rice Konzum K-Plus serviettes Konzum K-Plus fresh meat Konzum K-Plus fresh milk Konzum K-Plus fruit yoghurts Konzum
Figure 35: Top-ten private label products in Croatia Besides Konzum, all leading retailers have private labels, while Getro and Konzum cover the widest assortment of goods by private labels. It is expected that discounters like Lidl (who entered the market in late 2006) and possibly Aldi (rumored to be entering Croatia) will influence the Croatian private label market to a large extent.
6 Exporting to Croatia The most common way to enter the Croatian market, being a Danish producer, is through a distributor. In the general food segment, the common procedure is to make an agreement with an experienced company, who is familiar with Croatian retail practices and has a strong foothold in retail chains. Croatia is a EU-member candidate, which means that the Stabilization and Association Agreement (free-trade) is in place. Around 80% of the foreign trade in Croatia is handled under free-trade conditions, since Croatia has free-trade agreements with over 30 countries. Croatia is also a member of CEFTA.
Royal Danish Embassy Zagreb Page 36 of 47 Trade Council of Denmark
6.1 Investment The tax and customs incentives are achievable for those investors investing at least 4 million HRK (approx. 540,000 €) in the newly founded companies. The tax and customs incentives are achievable under the condition of holding the same number of employees; otherwise these incentives can no longer be used. Tax benefits include reduced profit tax rates (10%-0%; standard rate is 20%), financial aid for the opening of new jobs or for the retraining of employees that can be granted on a one-off basis up to 15,000 HRK (approx. 2000 €) per employee and aid for the education or retraining which can be granted in the amount reaching 50% of the education or retraining cost.
6.2 Corruption According to Transparency International's Corruption Perception Index, Croatia rates 3.4, which is equal to Poland, Egypt, Saudi Arabia and Syria (10= no corruption, 1=worst corruption). On the worldwide scale, Croatia ranks 69 out of 163 countries. Perceived corruption is worst in politics, legal system and health care. Efforts are made to fight corruption and in 2006, there were several highly publicized cases of corruption in the health system. However, this was only the tip of the iceberg. Corruption and measures of its reduction will be the key factor in the negotiations between Croatia and the EU, and the result will be the introduction of stricter rules and procedures in the near future. In the business sector, corruption widely pronounced in the system of public procurement (tenders).
7 Retail sector forecast Growth of supermarkets and hypermarkets will continue at least until Croatia's accession to the EU (expected in 2009/2010). Almost all major players in the retail business have announced expansion plans, with Lidl being the most ambitious – 150 shops throughout Croatia. New entries expected in the next two years include Aldi and Hofer, who are expected to introduce a concept of 'hard discount' in a small-store format. Developments in the real estate sector are a good indicator of accelerated activities in the retail segment. In 2006, City Center One was opened (key tenant – Interspar), while in 2007 there will be at least two new major shopping centers: Avenue Mall (Konzum supermarket) and Shopping City Zagreb (key tenant still unknown). AC Nielsen estimates that Croatia has room for 500 supermarkets (in 2005, there were 310 super- and hypermarkets). Although the average Croatian income is three times smaller than the EU average, prices are only 20% lower. It is not likely that 'hard-discounters' will influence an overall decrease of prices, and as Croatian citizens' living standards improve, in the long run, so will the demand for more expensive products.

Royal Danish Embassy Zagreb Page 37 of 47 Trade Council of Denmark
8 HoReCa market in Croatia HoReCa market (hotels-restaurants-cafes), in a country so devoted to tourism, has great potential. Unfortunately, there is a lack of analytical work devoted to this sector. However, it is possible to identify the main market players (suppliers to HoReCa), whose entry was early enough to secure a significant portion of the market. According to the research of the market leader, Gastro Grupa, HoReCa industry in Croatia includes almost 16.000 companies, of which 2.000 are accommodation-providers. There are 788 hotels in Croatia, as well as a large number of B&Bs and private accommodation providers. The restaurant business has quite a long tradition, as Croatians have a habit of eating and socializing outside their homes. The current trend is to provide authentic and distinguishable experiences – both in the cuisine, as well as interior décor and atmosphere of the venue. The most common restaurants are those offering Croatian and Italian fares. French cuisine is also present, as well as Chinese and Mexican. Other national cuisines are represented with one or two restaurants (Japanese, Thai, etc), so there is a lot of room for further expansion and improvement of the offer. Besides in the segment of national cuisine, the supply is also low in the segment of healthy restaurants (there are a few vegetarian restaurants present in Zagreb and other larger cities). Full service restaurants are popular for dining, especially in large cities and at the coast during the tourist season (June to September). Self-service restaurants, snack bars and fast food restaurants are becoming increasingly present, with the arrival of new shopping centres. Typically, cafes, the most common and the most popular meeting places of Croatians, do not serve food.
Item Turnover (I-IX 06), 000 HRK
Turnover index (I-IX 05/I-IX 06)
Quantity (I-IX 06), 000 litter
Quantity index (I-IX 05/I-IX 06)
Beer 255.574 104.3 9.453 96.1 Wine 193.486 110.7 2.574 100.6 Rakija 20.704 114.5 101 109.1 Spirits 84.131 102.3 314 99.2 Juice concentrates 7.487 84.0 162 81.6 Natural juices 93.805 107.8 2.233 107.8 Other carbonated 193.490 109.0 5.450 105.9 Mineral water 114.640 110.5 6.676 102.3 Hot beverages 287.903 110.0 - -
Figure 36: Turnover of items in HoReCa sector (Bureau of Statistics)

Royal Danish Embassy Zagreb Page 38 of 47 Trade Council of Denmark
8.1 Sector performance Total income of the HoReCa sector in the second quarter for 2006 was 3.66 billion HRK, which marks a nominal increase of 9.5% compared with the same period the year before. The increase in the second quarter was reflected in the growth of turnover in the first half of the year. The majority of the turnover was made in hotels (2.3 billion HRK, 9% y-o-y increase). Bars/cafes made a turnover of 1.48 billion HRK (nominal increase of 6.7%), while the turnover in restaurants increased by 5.5%, to 947 million HRK.
Type Companies Units Seats Employees Hotels 437 - 291.025 33.274 Camps 269 - 17.731 2.435 Restaurants 343 3.011 193.456 16.413 Bars 685 8.576 380.502 27.731 Cantinas 65 - 15.165 2.226 Other - 596 19.890 1.736 TOTAL 1.799 12.183 917.769 83.815
Figure 37: HoReCa facilities in Croatia in Q3, 2006 (Bureau of Statistics) There are over 3000 restaurants in Croatia, not including self-service and cantinas, which is 97 less than was recorded in the same period a year before (as well as 30 companies less). Bars show a similar decrease of 5% y-o-y in the number of units. The booming tourism sector is having a positive influence on the hotel industry, which recorded 27 hotel companies more in 2006 compared with the previous year.
Type Turnover (I-IX 06), 000 HRK Turnover index (I-IX 05/I-IX 06)Hotels 6.518.780 106.5 Camps 427.429 129.0 Restaurants 705.401 107.6 Bars 584.901 103.3 Cantinas 264.502 94.0 TOTAL 8.552.696 106.9
Figure 38: Turnover of the HoReCa sector in Croatia in Q3, 2006 (Bureau of Statistics) In total, the sector recorded an increase of turnover y-o-y in 2006 (index 106.5), with the biggest increase recorded in camps, while cantinas made a somewhat smaller turnover (index 94). Cafes/Bars Cafes and bars are the most common form of hospitality venues in Croatia. Croatians have a so-called 'café culture', which means that the cafes are usually filled with people during all hours of the day. Cafes usually serve hot beverages (coffee, tea) during the day and alcoholic drinks during the evening (beer and liquor being the most popular). Usually, cafes and bars stop serving hot drinks after 7 PM. Vast majority of them do not offer any food, snacks included.

Royal Danish Embassy Zagreb Page 39 of 47 Trade Council of Denmark
Type Units Employees Turnover (I-IX 06), 000 HRK
Turnover index (I-IX 05/I-IX 06)
Coffee bars 642 2.377 279.863 105.5 Beer halls 17 145 15.900 117.5 Buffets 153 565 79.307 103.1
Figure 39: Cafes and bars Restaurants Croatia has a long tradition of restaurants and eating out. Due to tourism, being the main economic activity, restaurant industry is concentrated at the coast and in the capital of Zagreb. Out of the tourist season, however, many coastal restaurants are closed. Restaurants are experiencing a slow rise of turnover and more units are opened every month. There is a rising popularity of ethnic and gourmet restaurants, as well as restaurant-night clubs/lounge bars. Chain restaurants (except fast food) are not yet present in Croatia. The predominant establishments are small family units.
Type Units Employees Turnover (I-IX 06), 000 HRK
Turnover index (I-IX 05/I-IX 06)
FSRs 340 3.855 595.386 103.6 Pizzerias 60 443 50.217 97.4 Bistros 109 496 59.305 92.4 Patisseries 30 153 12.500 94.7 Fast food 55 581 148.184 106.4
Figure 40: Restaurants US-style fast food outlets are present on the Croatian market since 1980-ties, when the first chain Ham-ham was opened. Traditional Croatian fast food (such as cevapi, burek, etc) was available in restaurants and kiosks all over the country, as well. The first international fast food chain to enter the market was McDonald’s, in 1994. Since then, McDonald’s opened 16 restaurants in Croatia. Subway is the second international operator, with 6 restaurants. Other foreign operators are not present. However, the fast food market is growing – main consumers are school children. However, the presence of international operators is still below that in the other transition countries.

Royal Danish Embassy Zagreb Page 40 of 47 Trade Council of Denmark
Company cafeterias were an integrated part of the corporate culture and often a part of an employee's benefits package before the 1990-ties. Today, they have either been completely abandoned, or are operated by private entrepreneurs. In hospitals, schools, nursing homes etc, the meals are in most cases cooked internally. Suppliers are selected through the public tendering procedure each year.
8.2 Key players Unlike in Western Europe, the distribution for the HoReCa market is still highly segmented. There is still no company that is involved solely in the HoReCa sector, like for instance the Italian Marr. Although the distribution for the HoReCa market is still under development, some companies are making efforts to specialize in this dynamic sector. Only 30% of the total supplies to the sector come directly from producers. It is expected that this market will grow at a rate of 5% in the upcoming period.
8.2.1 Gastro grupa The largest supplier to the HoReCa sector is Gastro Grupa, which is an alliance of 36 wholesale-distribution companies. Roto-promet, the largest member of Gastro Grupa is also the single largest distributor of beverages in Croatia, as well as a large supplier of coffee, tea, instant drinks, soups, seasoning, confectionary, and hygiene products for the HoReCa sector. HoReCa sales constitute over 75% of their total turnover. A very small percentage of supplies comes from retail and the rest is cash & carries and wholesale. Gastro grupa as a whole has around 25% of the total HoReCa supply market, however, the share is higher in some product groups, such as beer, wine and coffee (between 40-70%). The alliance has 450 delivery vehicles.
Item 2005 Change 2004/2005 Turnover 2.5-2.6 million EUR na Profit 860-870 thousand EUR na Productivity 124.530 EUR na
Figure 41: Economic indicators for Gastro Grupa, 2005 (Poslovna Hrvatska)
8.3 HoReCa sector forecast Croatian tourism industry will be the driving force of the HoReCa sector in the future. It is expected to increase by 40% until 2010. Growth will be driven by the approaching EU membership, arrival of low-cost airlines to Croatian airports and greater profiling of the tourist offer. Coupled with rising personal income and the tradition for outside dining, it is expected that restaurants, bars and cafes will do well. However, consumer expectations will also increase and creativity on the supply side will be the key in attracting and keeping the market position. With the adoption of EU food safety regulations, those that are unable to meet them will be forced to leave the market. It is expected that the implementation of these regulations will be quite strict.

Royal Danish Embassy Zagreb Page 41 of 47 Trade Council of Denmark
When it comes to distributors for the HoReCa sector, more companies will probably join the market in the years to come. Although local players are well positioned on the market, there will be room for companies that are able to provide a full service approach – including both food and non-food supplies.

Royal Danish Embassy Zagreb Page 42 of 47 Trade Council of Denmark
9 Method of obtaining information During the preparation of this report, we have used local sector knowledge, various desk research methods, as well as personal interviews with the relevant companies, during which we provided them with questionnaires (in the appendix). List of sources: Agency for Promotion of Trade and Investments (www.apiu.hr) Banka Magazine (www.bankamagazine.hr) Business Monitor International (www.businessmonitor.com) Croatian Bureau of Statistics (www.dzs.hr) Croatian Chamber of Economy (www.hgk.hr) Croatian National Bank (www.hnb.hr) Delegation of the European Commission in Croatia (www.delhrv.cec.eu.int/en) Deloitte (www.deloitte.com) Eurostat (ec.europa.eu/eurostat) Euromonitor International (www.euromonitor.com) GfK Croatia (www.gfk.hr) Gospodarski list online (www.gospodarski-list.hr) Government of the Republic of Croatia (www.vlada.hr) Hendal Croatia (www.hendal.hr) Jutarnji list online (www.jutarnji-list.hr) Lider Magazine (www.liderpress.hr) Ministry of Agriculture, Forestry and Water Management (www.mps.hr) Ministry of Economy, Labour and Entrepreneurship (www.mingorp.hr) Poslovni.hr (www.poslovni.hr) Privredna banka Zagreb d.d. (www.pbz.hr) Privredni vjesnik online (www.privredni-vjesnik.hr) PWC (www.pwc.com) Raiffeisenbank Austria d.d. (www.rba.hr) Slobodna Dalmacija online (www.slobodna-dalmacija.hr) StatBank Denmark (www.statbank.dk) Vecernji list online (www.vecernji-list.hr) Web sites of food and retail companies

Royal Danish Embassy Zagreb Page 43 of 47 Trade Council of Denmark
10 Appendix 1: Store Checks of Selected Retailers Interspar, 23 February 2007
Category Euro/kg Producer/Brand Dairy products Butter 4.55 Dukat (Croatia) Rosenberg cheese 17.55 Rosenberg (Denmark) Plain yoghurt 1.35 Dukat (Croatia) Feta (in cubes) 11.62 Greece Edam 6.75 Dukat (Croatia) Fruit yoghurt 2.53 Dukat (Croatia) Meat and cold cuts Pork chops 5.40 Croatia Whole chicken 2.83 Vindija (Croatia) Bacon 7.49 Croatia Chicken legs 4.86 Vindija (Croatia) Veal schnitzel 11.57 Croatia Fish Shrimps – fresh 10.54 Ledo (Croatia) Salmon fillet – fresh 11.48 Mackerel - fresh 7.29 Croatia
Metro, 23 February 2007
Category Euro/kg Producer/Brand Dairy products Cheese Podravec 5.62 Sirela (Croatia) Cheese Ementaler 8.24 Aro (Private label) Cottage Cheese 3.60 Dukat (Croatia) Cheese spread 6.26 Sirela (Croatia) Butter 2.96 Vindija (Croatia) Kefir drink 1.56 Dukat (Croatia) Meat and cold cuts Chicken fillet 5.77 Perutnina Ptuj (Croatia) Turkey leg 3.08 Puris (Croatia) Turkey fillet 5.91 Puris (Croatia) Pork fillet (boneless) 5.09 Croatia Leg of veal (boneless) 5.94 Croatia Fish Squids (fresh) 9.39 South Africa Pangasius fillet (fresh) 8.24 Croatia Mackerel (fresh) 6.67 Croatia
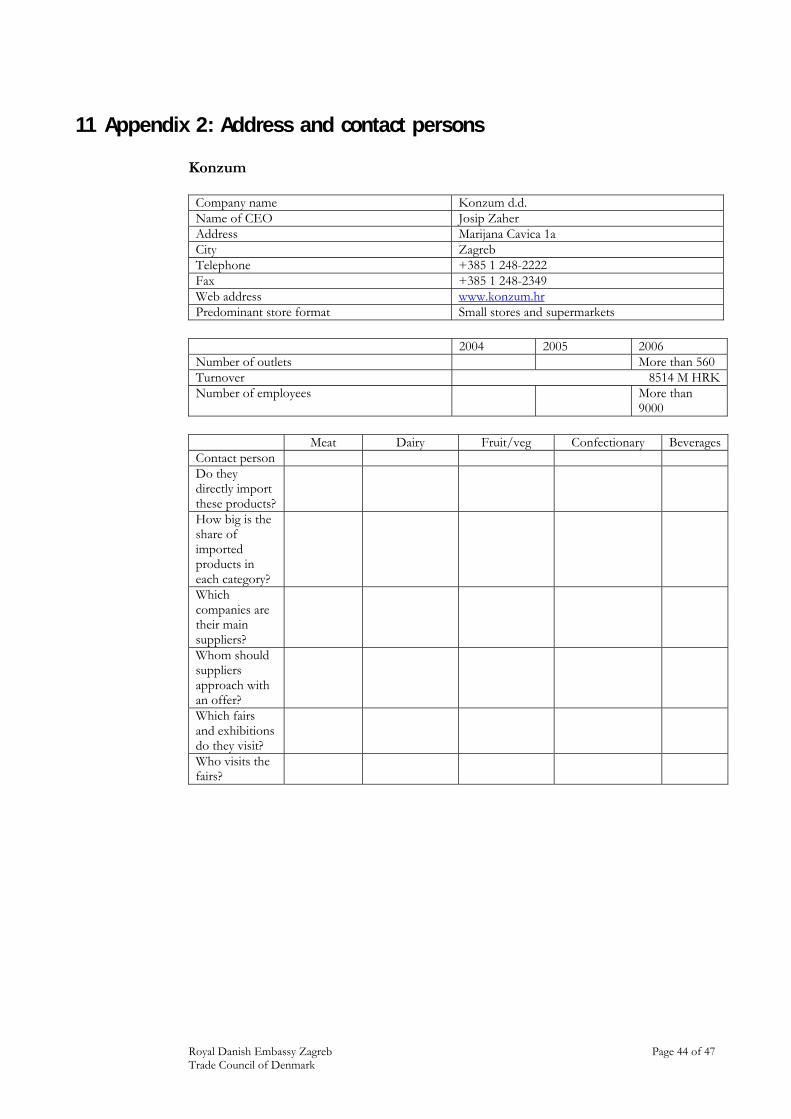
Royal Danish Embassy Zagreb Page 44 of 47 Trade Council of Denmark
11 Appendix 2: Address and contact persons Konzum
Company name Konzum d.d. Name of CEO Josip Zaher Address Marijana Cavica 1a City Zagreb Telephone +385 1 248-2222 Fax +385 1 248-2349 Web address www.konzum.hr Predominant store format Small stores and supermarkets
2004 2005 2006 Number of outlets More than 560 Turnover 8514 M HRKNumber of employees More than
9000
Meat Dairy Fruit/veg Confectionary BeveragesContact person Do they directly import these products?
How big is the share of imported products in each category?
Which companies are their main suppliers?
Whom should suppliers approach with an offer?
Which fairs and exhibitions do they visit?
Who visits the fairs?

Royal Danish Embassy Zagreb Page 45 of 47 Trade Council of Denmark
Metro Cash & Carry
Company name Metro Cash & Carry d.o.o. Name of CEO Dr. Damir First Address Jankomir 31 City 10090 Zagreb Telephone +385 1 3444 444 Fax +385 1 3444 355 Web address http://www.metro-cc.hr Predominant store format Metro junior store format (>=7.000 sqm)
2004 2005 2006 Number of outlets 3 5 6 Turnover na Number of employees 842 1301 1415
Meat Dairy Fruit/veg Confectionary BeveragesContact person Mr. Sasa
Cajic Mr. Tomislav
Brajevic Mr. Robert
Kuhta Ms. Mironija Radeljic-Jakic
Mrs. Svjetlana
Galic Do they directly import these products?
How big is the share of imported products in each category?
Which companies are their main suppliers?
Whom should suppliers approach with an offer?
Which fairs and exhibitions do they visit?
Who visits the fairs?

Royal Danish Embassy Zagreb Page 46 of 47 Trade Council of Denmark
CBA
Company name CBA Internacional d.o.o. Name of CEO Mr Zeljko Vugric Address Koturaska 69 City Zagreb Telephone +385 1 632-3400 Fax +385 1 632-3401 Web address www.cba-zg.hr Predominant store format Stores of all sizes organized under the umbrella
of one buying group – CBA Internacional
2004 2005 2006 Number of outlets N/A Turnover 10 M EURNumber of employees N/A
Meat Dairy Fruit/veg Confectionary BeveragesContact person Do they directly import these products?
How big is the share of imported products in each category?
Which companies are their main suppliers?
Whom should suppliers approach with an offer?
Which fairs and exhibitions do they visit?
Who visits the fairs?
Royal Danish Embassy Zagreb is part of the Danish Trade Council, Royal Danish Ministry of Foreign Affairs, which is the official export and investment promotion agency of Denmark. The Danish Trade Council has approx. 350 employees, of whom approx. 280 are based abroad at embassies, consulates general and trade commissions on approx. 100 markets. The Danish Trade Council advises and assists Danish companies in their export activities and internationalisation process according to the vision: We must be the partner preferred by enterprises in international trade and investment activities. The Work in the Danish Trade Council follows specific procedures and quality guidelines that are described in our internal quality manual. In this way our customers are secured the best possible quality under the varying working and market conditions that at any given point of time are in force for the respective embassies, consulates general and trade commissions.
Royal Danish Embassy Trg Nikole Subica Zrinskog 10 HR-10000 Zagreb Croatia Tel +385 1 4924 540 Fax +385 1 4924 554 E-mail [email protected] www.dtczagreb.um.dk