Japan Retail Foods Update 2011 Retail Food Sector
19
THIS REPORT CONTAINS ASSESSMENTS OF COMMODITY AND TRADE ISSUES MADE BY USDA STAFF AND NOT NECESSARILY STATEMENTS OF OFFICIAL U.S. GOVERNMENT POLICY Date: GAIN Report Number: Approved By: Steve Shnitzler, ATO Director Prepared By: Sumio Thomas Aoki, Senior Marketing Specialist, Paul Miyamoto, Intern Retail Food Sector Retail Foods Update 2011 Japan JA1524 12/21/2011 Required Report - public distribution
Transcript of Japan Retail Foods Update 2011 Retail Food Sector

THIS REPORT CONTAINS ASSESSMENTS OF COMMODITY AND TRADE ISSUES MADE BY
USDA STAFF AND NOT NECESSARILY STATEMENTS OF OFFICIAL U.S. GOVERNMENT
POLICY
Date:
GAIN Report Number:
Approved By:
Steve Shnitzler, ATO Director
Prepared By:
Sumio Thomas Aoki, Senior Marketing
Specialist, Paul Miyamoto, Intern
Retail Food Sector
Retail Foods Update 2011
Japan
JA1524
12/21/2011
Required Report - public distribution

Report Highlights:
Some say that Japan was moving into a period of economic growth right until March 11, 2011 and
the Japanese retail industry was poised to improve on sales and revenues. But sales were
severely restrained because of the Great Northeast Japan Earthquake and Tsunami. However,
changes in the retail industry impacted industry alliances with the merger of department store
giants Mitsukoshi and Isetan; the expansion of the Mitsubishi group food distribution network; the
tie-up of two Eastern Japan supermarkets, Arcs and Universe; and headstrong competition
between AEON and Seven & i Holdings.
Post:
Tokyo ATO

Japanese Retail Food Sector Report 2011
U. S. Agricultural Trade Office
JAPAN
I. Japanese Retail Sales

1. Overall
Total retail sales including food & beverages, general merchandise, and fabrics/apparel &
accessories in Japan amounted to $752.6 billion in 2010. The total food and beverage retail sales
amount was $472.6 billion. Total retail sales have increased each year since 2008. 2007 showed
a total retail sales of $614.6 billion and food & beverages sales of $370.6 billion. The exchange
rates used in this report are 104.46 yen/$ for 2008, 94.57 yen/$ for 2009, and 88.81 yen/$ for
2010.
Figure 1a. Total Retail Sales (million US$)
Year Total Food &
Beverage
General
Merchandise
Fabrics, Apparel, &
Accessories
2008 651,215 399,971 151,043 100,201
2009 703,743 437,940 155,123 110,680
2010 752,572 472,638 160,094 119,840
Source: METI
Figure 1b. Chart of Total Retail Sales (million $)
2. Retail Food Sales
A. 2011
The retail food sales increased from 2009 to 2010 for the three retail categories listed in Figure 2,
according to the Current Survey of Commerce* conducted by The Ministry of Economic, Trade and
Industry (METI). An explanation of the Current Survey of Commerce is in the below chart.
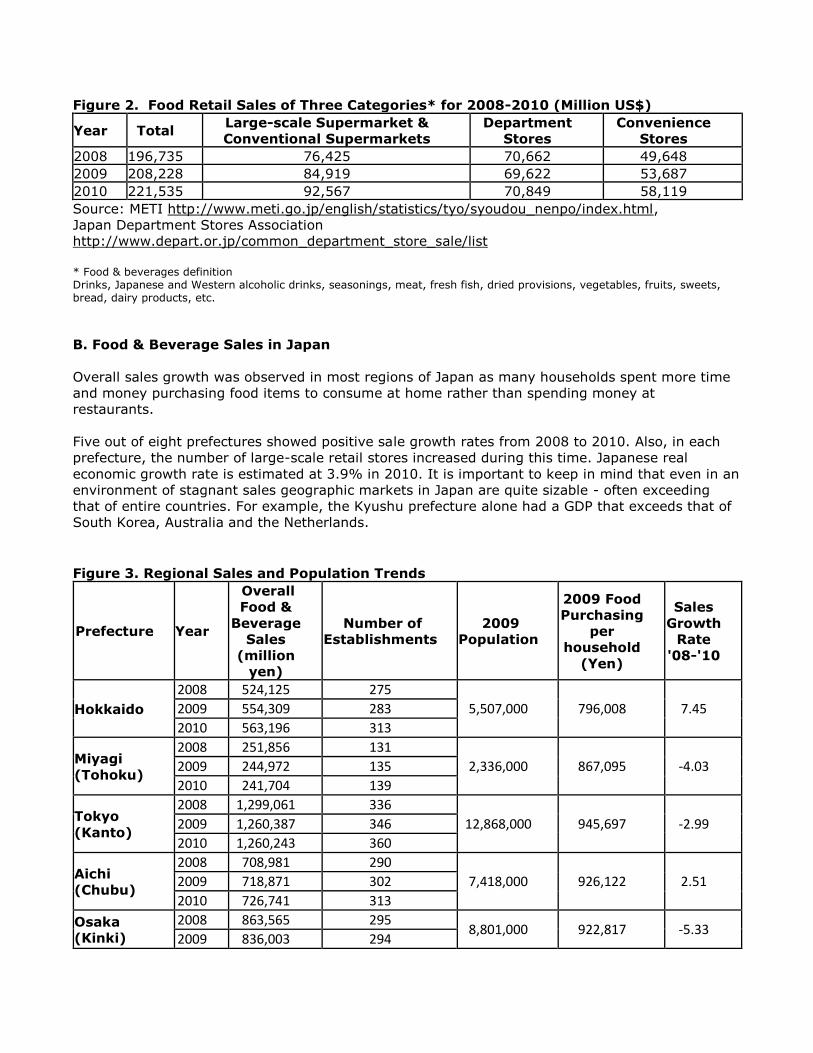
Figure 2. Food Retail Sales of Three Categories* for 2008-2010 (Million US$)
Year Total Large-scale Supermarket &
Conventional Supermarkets
Department
Stores
Convenience
Stores
2008 196,735 76,425 70,662 49,648
2009 208,228 84,919 69,622 53,687
2010 221,535 92,567 70,849 58,119
Source: METI http://www.meti.go.jp/english/statistics/tyo/syoudou_nenpo/index.html,
Japan Department Stores Association
http://www.depart.or.jp/common_department_store_sale/list
* Food & beverages definition Drinks, Japanese and Western alcoholic drinks, seasonings, meat, fresh fish, dried provisions, vegetables, fruits, sweets, bread, dairy products, etc.
B. Food & Beverage Sales in Japan
Overall sales growth was observed in most regions of Japan as many households spent more time
and money purchasing food items to consume at home rather than spending money at
restaurants.
Five out of eight prefectures showed positive sale growth rates from 2008 to 2010. Also, in each
prefecture, the number of large-scale retail stores increased during this time. Japanese real
economic growth rate is estimated at 3.9% in 2010. It is important to keep in mind that even in an
environment of stagnant sales geographic markets in Japan are quite sizable - often exceeding
that of entire countries. For example, the Kyushu prefecture alone had a GDP that exceeds that of
South Korea, Australia and the Netherlands.
Figure 3. Regional Sales and Population Trends
Prefecture Year
Overall
Food &
Beverage
Sales
(million
yen)
Number of
Establishments
2009
Population
2009 Food
Purchasing
per
household
(Yen)
Sales
Growth
Rate
'08-'10
Hokkaido
2008 524,125 275
5,507,000 796,008 7.45 2009 554,309 283
2010 563,196 313
Miyagi
(Tohoku)
2008 251,856 131
2,336,000 867,095 -4.03 2009 244,972 135
2010 241,704 139
Tokyo
(Kanto)
2008 1,299,061 336
12,868,000 945,697 -2.99 2009 1,260,387 346
2010 1,260,243 360
Aichi
(Chubu)
2008 708,981 290
7,418,000 926,122 2.51 2009 718,871 302
2010 726,741 313
Osaka
(Kinki)
2008 863,565 295 8,801,000 922,817 -5.33
2009 836,003 294

2010 817,535 297
Hiroshima
(Chugoku)
2008 203,272 84
2,863,000 853,563 2.78 2009 202,869 91
2010 208,919 100
Ehime
(Shikoku)
2008 110,498 63
1,436,000 862,375 2.02 2009 110,981 70
2010 112,734 72
Fukuoaka
(Kyushu)
2008 262,211 143
5,053,000 793,021 2.72 2009 264,166 144
2010 269,333 161
II. Trends and Changes in the Retail Market
1. Hints to Consider When Thinking About Exporting to Japan
If you are considering developing products or searching for products to export to Japan, consider
these characteristics of the Japanese market.
(1) Senior Represents the core customer base
(2) Produce Senior and female customers want fresh produce
(3) Deli Including housewives, convenience is in higher demand
(4) In-store Preparation Similar to Deli, more demand for prepared foods
(5) Desserts More women purchase desserts at convenient stores
2.Elderly Population Is Growing Rapidly
As noted above, Japan has the fastest growing elderly population (over 65) or Generation M, in the
world. In 2010, Generation M represents 23% of the entire population in Japan. By the year
2020, it is estimated to increase 29% and then 36% by the year 2040. Of course the total
population is estimated to decline from 127 million in 2010 to approximately 105 million in 2040.
As of August 22, 2010, 40,280,000 Japanese are over 60 years old, which is 31.5% of the total
population (Weekly Toyo Keizai, September 3, 2011, pp 40-43).
According to the article, Generation MF is the market that retailers must have a strategic plan.
Generation M has the most money in Japan as well.
There are several short term affects of this trend:
1. Generation M won’t be mobile and won’t be able to shop. According to an article in the
Weekly Toyo Keizai magazine, Seven-Eleven store owners rented vehicles to start servicing
hard-to-reach customers. After the Northeast Earthquake and Tsunami, AEON started a
similar service in Miyagi prefecture (Northeast Japan).
2. Greater need of delivery service.
3. Expanded availability of internet shopping.
4. Additional mobile vehicle shops.
5. Development of products that fit Generation MF.
Figure 4: Forecast for Elderly Population
Year Population (1,000 People)

Total Age 0-14 Years Age 15-64 Years 65 and Older
2005 127,768 17,585 84,422 25,761
2010 127,176 16,479 81,285 29,412
2015 125,430 14,841 76,807 33,781
2020 122,735 13,201 73,635 35,899
2025 119,270 11,956 70,960 36,354
2030 115,224 11,150 67,404 36,670
2035 110,679 10,512 67,919 37,249
2040 105,695 9,833 57,335 38,527
2045 100,443 9,036 53,000 38,407
2050 95,152 8,214 49,297 37,641
Source: National Institute of Population and Social Security Research
3. Customers are looking for convenience and added value. Here are three examples:
A. Naturally defrosting frozen food
(1) Top three frozen food manufacturers all have their focus on frozen foods that defrost in room
temperature and taste good. These products are convenient (natural defrost), eco-friendly (no-
cooking) and tasty.
(2) These products must also be bite sizes and packaged in small containers to fit Japanese lunch
boxes.

B. Seasonings
(1) There are many premixed seasonings and sauces in Japan. Noodle soup bases (soba, udon for
example), various teriyaki-type sauces and powdered soup bases are popular.
(2) Developing and offering recipes to show how to use these convenient seasonings is a must.
C. Cosmetics
(1) Cosmetic products have always been sold in supermarkets but they never had the glitter and
the professional cosmeticians to apply make-up and lure customers to purchasing the newest and
best products. AEON changed that by upgrading their cosmetic sales floor from economy type
décor to top department store sales décor and has become the most popular place to try and
purchase cosmetic products.
4.Home dining and Home Meal Replacements
The HMR (Home Meal Replacement) market, which represents, ready-to-cook, ready-to-heat and
ready-to-eat meals, continues to grow. Driven by such macro trends as an increasing number of
single households, the aging population and an increasing number of working women, etc,
consumer demand for HMR products is still strong. Retail food outlets are adding to or expanding
their HMR product line.
The expanding retail presence of “delicatessen” in supermarkets of all sizes – as well as in
department stores and convenience stores – attests to the popularity of the HMR market. HMR
sales are also increasing at a brisk rate in the fast food industry.
Summitt Store Experiments Fresh Ingredient In-Store Preparation Corner
Summitt Stores is experimenting with a tasting corner and in-store preparation kitchen constructed
right in the fresh food aisle. Fresh produce, meats, and seafood are normally displayed and
stocked on store shelves for customers to simply examine and select. Summitt preparation
kitchen will cook take-out meals using these fresh products right in the store and as the customers
shop. Summitt will also offer tastings of various dishes from their menu.
This is an important step forward. As companies introduce more and more foods, customers often
ask how to prepare and serve.
5. Healthy Foods Offer Expanded Opportunities
Driven by the aging population of Japan and rising consumer interest in health maintenance and
improvement, the demand for healthy and nutritionally balanced foods has increased. Interest is
strongest among those aged 50 and above, and adult women.
The healthy food category (or functional foods) has been growing steadily since the mid 1990’s. In
Japan, functional food can be divided into “Foods for Specific Health Use,” or FOSHU, and health-
enhanced food. Among the numerous attributes that serve to distinguish one from the other, the
most important is that FOSHU products require government approval, while health-enhanced food
products do not. What motivates companies to pursue the FOSHU designation, rather than avoid
the often-lengthy approval process, is that they can affix the FOSHU seal on the product in
question should it meet the Minster of Health Labor and Welfare (MHLW) criteria.

6. Usage of Private Brands (PB) Expands
The majority of major food retailers now feature their own private brands. Studies conclude that
PB products will continue to gain more shelf space. According to a study by Manao Kidachi, Chuo
University(Private Brand Development and Food Manufacturers Production Role in Japan*), AEON
recorded PB sales of $4.8 billion in 2008 and practically doubled PB sales to $9.7 billion in 2010.
Generally, PB products amount to approximately 10% of total sales. AEON hopes to increase to
20%. Second, PB products were generally produced by secondary food manufacturers. Today,
leading manufacturers are beginning to expand production of PB products.
A 2009 survey by the Japan Finance Corporation found that 67.8% of all food manufacturers
produce PB products and that 23.2% of those companies would like to increase the number PB
products; and 9.8% of all manufacturers wished to introduce PB products to their line-up. In
another survey performed in 2010 this time to survey consumer response toward PB products, the
survey found that even if the economy improves consumers will continue to purchase PB products.
*Japan Finance Corporation, Farm, Forest and Sea Department, “Survey of PB Products”, August
18, 2009.
*Japan Finance Corporation, Farm, Forest and Sea Department, “2009 2nd Survey of Consumer
Trends”, February 9, 2010.
7. Continued Consolidation of the Food Retail Industry
A. Mitsubishi Shokuhin (Food) Becomes the Largest Food and Beverage Distributor
On February 18, 2011 Mitsubishi wholesale company was established with the merger of Mitsubishi
Shokuhin (food), RyoShoku Ltd., Meidi-ya Corporation, San-Esu Inc., and Food Service Network
Co., Ltd. Ryoshoku Ltd. was one of the strongest beverage distributors and was the second largest
wholesale company after Kokubu Co. Meidi-ya Corporation ranked eighth and Food Service
Network ranked ninth.
The reason for the merger, according to the press release dispatched by the four companies, was
to protect the safety of food quality and food supply by creating a new wholesale distribution
model capable of adapting to changing consumer demands and diversification and to withstand
long term deflation. The strengths of the individual companies will mesh well.
As was discussed in section II of this report, supermarkets and convenient store businesses are
strengthening their positions and market share. These retailers have become an essential and
necessary shopping entity for many Japanese to function on a daily basis. Their buying power is
stronger and they are expanding their manufacturing capability. Not only that they have also been
strengthening their distribution network and logistics that compete with other entities of the food
distribution industry. Mitsubishi Shokuhin and future growth and consolidation will perhaps
balance the relationship between the strong retailers and wholesalers.
B. ARCS Group (Always Rising Community Service) Spreads its Network to Mainland
Japan with Universe
ARCS is a holding company established in 2002 with the merger of Hokkaido supermarkets, Ralse
and Fukuhara. In order to compete with rising national supermarket chains, maintain localized
food businesses and to share logistical distribution ARCS merged with other Hokkaido

supermarkets such as Dounan Ralse (Obihiro) and Fuji (Asahikawa) in 2004, and Tokoh Store
(Sapporo) in 2009. ARCS reached record sales in 2010 of $3.9 billion.
One of the biggest stories of 2011 was the news that ARCS will expand outside of Hokkaido, which
ARCS president Yokoyama once said that they would avoid. On October21, 2011, Universe
supermarkets, headquartered in the most northern prefecture on mainland Japan joined ARCS,
creating a group that includes 47 stores located in three northern prefectures, (Aomori prefecture
30 stores, Iwate prefecture 16 stores, and Akita prefecture 1 store) adding $1.3 billion in value to
the ARCS group.
ARCS’ website address is http://www.arcs-g.co.jp/ (Japanese Only)
C. Competition in Western Japan’s Food Distribution Industry is Heating Up
Three regions, Chugoku, Shikoku and Kyushu have experienced changes in their distribution
network similar to northern Japan. Asahi Shokuhin who is one of the largest food distributors
finished construction of a distribution center located in Tosu city, Saga prefecture in the Kyushu
region inside the Tosu Distribution Center. The facility will warehouse and distribute dried, frozen,
and chilled products to Chugoku, Shikoku and Kyushu regions. The Chugoku and Shikoku supermarket sector saw some changes too. AEON has acquired the
largest supermarket chain in Shikoku, Marunaka http://www.marunaka.net/ (Japanese only), for
$648 million. Marunaka provides AEON 340 stores and $4.6 billion in sales. Marunaka’s strategy
was to acquire AEON’s private brand, digital money, and AEON’s distribution network. AEON
strengthens its network in western Japan where it traditionally lagged.
III. Retail Market Industry
1. Retail Establishment Trends
In 2010, supermarkets and convenience stores continued to be the primary distribution channel for
food in Japan. Large-scale supermarkets appear to have lost some ground to regional
supermarkets. However, to compete against AEON and Ito Yokado regional supermarkets are
merging such as ARCS in Hokkaido and Universe in Northern Japan.
2. Large-scale Supermarkets and Conventional Supermarkets
A. Outlets
The number of outlets changed very little. AEON shrank from 569 outlets in 2007 to 415 outlets in
2009. Barrow grew from 120 (2007) to 173 (2009) and AEON Kyushu (western Japan) doubled
from 48 to 99. Most others remained relatively the same.
B. City-style Stores

March 11 affected the retail industry in many ways. One key finding from March 11 was that
convenience stores were better suited to quickly re-establish their store and support the local
consumers in an emergency situation. Convenience stores were the first ones to deliver products
using small vans and to open their stores in affected areas. Taking the lessons learned to compete
with convenience stores, large supermarkets, AEON and Seven & i (Ito Yokado) are developing
small “City-style stores”. Store sizes measure about 1800 square yards of floor space. Tokyo and
other cities are major targets for these City-style stores.
C. Target Population
As the Japanese market continues to mature, supermarket giants AEON and Seven & i have
strengthened their network to reach single adults and the older generation, who will be referred to
as the Generation Mature (herein referred to as Generation M).
D. Price Competition
Price competition has become more intense and is a major feature of the supermarket business in
Japan. Supermarkets are seeking to reduce costs and improve their infrastructures through the
introduction of management systems and the improvement of procurement processes as well as
through the closure of unprofitable stores in their efforts to improve efficiency. The companies
which have succeeded to reduce management cost and to prevent losses have regained their
profit.
E. Company profiles
Figure 5 summarizes the top 16 supermarkets.
AEON http://www.aeon.info/en/, Ito-Yokado http://www.7andi.com/en/, and Daiei
http://www.daiei.co.jp/index.php (Japanese only) have nationwide supermarket networks. All
three are gradually expanding into regional areas outside of Tokyo and Osaka.
Uny http://www.uny.co.jp/ (J) is the strongest regional supermarket with a concentration in the
Chubu and Kanto area.
Figure 5: Top 16 Supermarkets by Total Sales in 2009
Rank
Company Name
Total Sales (US$
Mil.)
Food Sales (US$
Mil.)
Ratio of Food
Sales (%) Number of
Outlets Location of
HQ & Stores
Growth Rate '09-'10 (%)
1 Aeon 21,323 10,660 49.9 415 Chiba 4.43
2 Ito-Yokado 15,190 7,197 47.4 175 Tokyo -1.92
3 Uny 7,720 4,816 62.4 233 Aichi 6.82
4 Daiei 8,319 4,914 52.7 207 Hyogo -0.47
5 Izumi 4,606 1,511 32.8 83 Hiroshima 12.92
6 Life Corp. 4,771 3,862 80.9 203 Tokyo 5.03
7 Heiwado 3,463 2,004 57.8 105 Shiga -3.41
8 Izumiya 3,457 1,948 56.3 86 Osaka -0.8
9
York Benimaru 3,575 2,633 73.6 156 Fukushima 5.38
10 Maruetsu 3,537 3,285 92.8 242 Tokyo 6.07
11 Barrow 2,214 1,610 72.7 173 Gifu 4.44
12 Fuji 3,124 1,256 40.2 93 Ehime 1.89

13 Okuwa 2,611 1,937 74.1 143 Wakayama 2.67
14
Aeon Kyushu 2,670 1,115 41.7 99 Fukuoka 10.21
15 Summit 2,266 2,106 92.9 97 Tokyo 4.71
16 Inageya 1,797 1,685 93.7 127 Tokyo -0.59
Source: Food and Beverage Distribution; Nihon Shokuryo Shimbunsha
F. Other supermarket locations:
Chubu and Kanto Maruetsu http://www.maruetsu.co.jp/corporate/ (J)
Valor Supermarket http://chirashi.valor.co.jp/store_search.php (J)
Kanto Summitt http://www.summitstore.co.jp/ (J)
Inageya http://www.inageya.co.jp/ (J)
Kyushu/Chugoku Izumi http://www.izumi.co.jp/e_ir/corporate_data.html (J)
AEON Kyushu
Tokyo Kinki Life Corporation http://www.lifecorp.jp/company/index.html (J)
Kinki Heiwado http://www.heiwado.jp/profile/gaiyo.html (J)
Okuwa , http://www.okuwa.net/corpo/002.html (J)
Kinki/Kanto Izumiya http://www.izumiya.co.jp/ (J)
Fuji http://www.fujicitio.com/company/company01.html (J)
Tohoku York Benimaru http://www.yorkbeni.co.jp/company/outline.html (J)
G. Specialty Supermarkets
Specialty supermarkets are important for export products because these stores carry products with
higher prices. Here is a list and some background information for these specialty supermarkets.
Kinokuniya - First self-service supermarket in Japan.
http://www.e-kinokuniya.com/kinokuniya2.pdf
Meidi-ya - First supermarket to specialize in imported products.
http://www.meidi-ya.co.jp/en/
Seijo Ishii Combination of specialty products and convenient store. http://www.seijoishii.co.jp/ (Japanese
only)
Dean & Deluca - Premium product and prices. Emphasis on delicatessen.
http://www.deandeluca.co.jp/
Queens Isetan - Special shelf space for imported products.
http://www.queens.jp/pc.html (Japanese only)
Kaldi Coffee - Specializes in premium imported products. http://www.kaldi.co.jp/english/
3. Convenience Stores

A. Outlets
The total number of store outlets for the top 10 convenience store companies increased 9.7% in
past three years. Total outlets were 45,236 in 20109a, which was a slight increase of 4,013 from
41,223 outlets in 20079b. Sales made a huge jump in three years. In 2007, sales for the top 10
were approximately $62 billion, whereas in 2010 that shot up to $90 billion.
One reason for the increase of outlets and sales is the greater utilization of convenience stores by
female office workers and Generation M. Convenience stores have developed products, such as
desserts and drinks, and services such as a la carte deli bars that attract female office workers to
stop by before going to the office or returning home. Generation M has less mobility and utilize
convenience stores that are closer to their homes.
Most recently, convenience store companies such as Lawson developed discount convenience
stores. These stores have smaller store space, less SKU’s, and no fast foods (FF) that convenience
stores consistently offer. Discount convenience store prices are cheaper than convenience stores
as well.
B. Company Profiles
The following table (Figure 6) summarizes the top 10 convenience stores in Japan 2010. Seven
Eleven has 1,198 more stores than in 2007. Lawson had 1,407 more and FamilyMart was up by
1,530 stores compared to 2007.
One major change since 2008 was FamilyMart’s acquisition of am/pm Japan on March 1, 2010.
am/pm Japan Co. became its wholly owned subsidiary. The effective cost for the acquisition was
about $155 million.
Figure 6: Top 10 Convenient Stores in 2010
Rank Company Name Total Sales (US$ Million) No. of Outlets Location
1 Seven-Eleven Japan 33,190 13,232 Nationwide
2 Lawson 18,948 9,994 Nationwide
3 FamilyMart 16,220 8,717 Nationwide
4 Circle K Sunkus 10,395 6,274 Nationwide
5 Mini Stop 3,626 2,042 Tokyo/Nagoya
6 DAILY YAMAZAKI 2,440 1,634 Nationwide
7 Seicomart 1,927 1,102 Hokkaido
8 Cocostore 1,299 837 Nationwide
9 Three F 1,164 704 Tokyo area
10 POPLAR 1,022 700 Nationwide
Source: Lawson Annual Report 2011
4. Department Stores
A. Outlets and Sales

Department store sales accounted for only 5% of the total retail food market with sales of US$19
billion in 2007. Significant restructuring among major department stores has been increasing. For
example, the major department store Sogo filed for chapter eleven bankruptcy and merged with
Seibu Department Store, which is now Millennium Retailing Co. The second largest department
store, Isetan, merged with the third largest department store Mitsukoshi. The Kansai region’s
large department store Hankyu merged with its strongest competitor, Hanshin Department Store.
They now operate under a name, H2O Retailing. Daimaru Department Store merged with
Matsuzakaya and established J Front Retailing.
Food sales at department stores have continuously declined for the past several years with a
dramatic decrease in sales from 2000 to 2002 related to store closures.
B. Depachika
It is important to note the “depachika” phenomenon when discussing the retail food sector of a
department store. Depachika means the basement floor of the department store where fresh food
halls are traditionally located. Traditionally, depachika was a quiet retail food location. This
changed when shops introduced high-quality HMR. In fact, this was responsible for spurring the
high-quality HMR market in Japan. In addition, famous restaurants became tenants and lent their
brand names to popularize depachika. The Depachika phenomenon turned the basement floor
from nothing special into an attractive place and a means of bringing customers to department
stores.
C. Premium Price, High Quality, BUT Small Quantity
Department stores usually carry imported branded products. The sale prices are higher than
supermarkets but keep in mind that the capacity of department stores to stock quantities is low.
D. Company Profiles
Figure 7 summarizes the top 10 department stores in Japan.
Figure 7: Top 10 Department Stores in 2007
Rank Company
Name
Total Sales
(US$ million)
Food Sales
(US$ million)
Growth
Rate (Food)
‘06~’07
Number of
Outlets
1 Takashimaya 9,479 1,856 2.7% 20
2 Isetan 7,143 748 0.3% 10
3 Mitsukoshi 7,036 1,695 - 3.8% 18
4 Sogo 4,564 Undisclosed - 12
5 Marui 4,532 Undisclosed - 17
6 Daimaru 4,382 962 2.0% 24
7 Seibu 4,255 Undisclosed - 16
8 Tokyu 2,735 Undisclosed - 12
9 Kintetsu 2,731 783 0% 9
10 Hankyu 2,676 695 0.9% 11
Source: Nikkei MJ, Nihon Shokuryo Shinbun – (2010 data not available)
IV. Road Map for Market Entry
1. Food Distribution System in Japan

When considering market entry in Japan’s relatively developed food market, it is important to keep
the following points in mind:
Overall, traditional entry points via importers are beginning to make way for other more
diverse avenues. For example, even within one food retail organization (i.e., large-scale
supermarket, regional supermarket chain, convenience store chain, etc.), there may be
several routes for procurement – including importers, wholesalers, etc.
Large-scale supermarkets still rely primarily on importers and wholesalers. Most are
engaged to some degree in developing and maintaining private labels, which they tend to
outsource to food processors.
Conventional supermarkets tend to depend more on wholesalers. They usually procure
from a number of regional/local and national wholesalers who buy imported food products
from trading houses and importers. Wholesalers and big trading houses are generally
interested in handling high volume products, not niche-oriented products.
A. Distribution Structure for National and Conventional Supermarkets - Giant nationwide
supermarket chains including Aeon and Seven & i mainly purchase their foods through three
channels: (1) direct from the importers; (2) direct from the manufacturers and processors; and (3)
wholesalers and distributors. Conventional supermarkets purchase through similar distribution
channels, although they mainly purchase from wholesalers, whereas the major national chains rely
more on direct routes.
Figure: 9
B. Distribution Structure for Department Stores - Food items at department stores are
procured almost entirely through wholesalers and tenant merchants. Imported products reaching

department store “tenant merchant” shelves is dependent upon the wholesaler purchasing these
products from importers or trading companies. Tenant merchant companies mainly purchase the
ingredients for their products from wholesalers and then manufacture the products to be sold.
Figure 10:
*ADO - All Nippon Department Stores Development Organization
C. Distribution Structure for Convenience Stores - Convenience store chains utilize trading
companies and wholesalers, depending on the type of product. Due to limited space, convenience
stores can only handle a few brands per category. Product performance is reviewed continuously,
and slow moving products are replaced quickly, ensuring the highest turnover possible. Their
management systems present the most significant challenges for imported packaged processed
foods, since they require that U.S. exporters: 1) modify product taste/specifications to fit the
tastes of Japanese consumers; 2) shorten delivery time to ensure freshness; and 3) update and
introduce new products frequently.
D. Co-ops and voluntary chains use a variety of sources, including importers, wholesalers and
direct importing. Serving voluntary chains, there are several major joint procurement
organizations: CGC Japan, Nichiryu, All Japan Supermarket Association (AJS) and Consumer
Cooperatives (Co-ops). Their major role is to develop private brand products with Japanese food

processors and overseas sources to sell to member retailers. Some of these organizations directly
import non-branded food products that are “volume” oriented in nature. E. Most traditional stores (i.e., Mom & Pop and one category stores) depend on wholesalers.
Penetration of imported foods into these shops and stores is relatively low.
F. Specialty stores (i.e., foreign foods, discount foods, etc.) also primarily depend on
wholesalers. Selected coffee shop chains, discount stores and natural food specialty stores with
chain operations may be worth development for U.S. food exporters.
G. Online Sales - Finally, online sales including TV, mail order offers yet another possible channel
that U.S. exporters can consider for retail food distribution. Majority of the sales are still non foods,
but food and beverage sales are increasingly being purchased online.
2. International Competition of Food Exports to Japan
The United States is the largest exporter of food products to the Japanese market, representing
27.4% of all imported value in 2010. China’s export has increased in the past two years. Their
share increased from 9.6% in 2008 to 11.9% in 2010.
Figure 11a: Major Food Exporters to Japan
Rank Country
Value % Share
2008 2009 2010 2008 2009 2010
1 United States 16,983 12,974 13,862 31.61 29.25 27.37
2 China 5,146 5,160 6,021 9.58 11.63 11.89
3 Australia 4,635 3,806 4,232 8.63 8.58 8.36
4 Thailand 3,628 2,959 3,785 6.75 6.67 7.47
5 Canada 4,280 3,165 3,503 7.97 7.14 6.92
6 Brazil 2,407 1,809 2,380 4.48 4.08 4.7
7 Indonesia 1,475 861 1,547 2.75 1.94 3.05
8 France 1,490 1,228 1,307 2.77 2.77 2.58
9 New Zealand 1,304 1,142 1,287 2.43 2.57 2.54
10 Philippines 1,068 1,193 1,069 1.99 2.69 2.11
World Total 53,729 44,353 50,652 100 100 100
Source: Global Trade Atlas

Figure 11b - Source Global Trade Atlas
3. Summary of Key Advantages and Current Position of the U.S. Food Products in the
Japanese Market (Figure 12):
Figure 12
Key Words Advantages Current Position
Quality
U.S. specialty food products attract
Japanese consumers. U.S. products
usually have a good story to tell.
Have a good story to educate
customers about the quality of
your product. Emphasize quality.
Cultural
Influences
Japanese consumers are strongly
influenced by U.S. food culture.
Be able to explain how your
product relates to American
culture.
Health
Consciousness
Health related food market in the U.S.
is advanced. Even though your product
may not be a health product, make
sure to emphasize any health benefits.
Address health related benefits
but be careful you don’t make
claims unless you have Japanese
government approval.
Food Safety
U.S. agriculture can successfully
differentiate itself from Japan and third
countries on food safety issues by
HACCP, GAP, ISO, etc.
Educating your customer about
safety issues helps to facilitate
communication and provides your
customer transferable knowledge.
Stable Supply
The U.S. is the largest exporter of food
products to Japan. As a largest
supplier of food products in the world,
the U.S. has a great opportunity to
expand exports to Japan.
Japan’s food self sufficiency rate is
only 39% and it has been
declining due to aging population
and the declining farm population.
VII. Post Contact and Further Information
If you have any questions or comments regarding this report or need assistance with exporting to
Japan, please contact the U.S. Agricultural Trade Offices in Tokyo or Osaka at the following
addresses:

Tokyo
Osaka
U.S. Agricultural Trade Office
U.S. Embassy, Tokyo
1-10-5 Akasaka, Minato-ku
Tokyo 107-8420
Tel: 81-3-3224-5115
Fax: 81-3-3582-6429
E-mail: [email protected]
U.S. Agricultural Trade Office
U.S. Consulate General, Osaka-Kobe
2-11-5, Nishi-tenma, Kita-ku,
Osaka 530-8543
Tel: 81-6-6315-5904
Fax: 81-6-6315-5906
E-mail: [email protected]
ATO Japan has begun a series of regional reports to provide specific information on major regions
in Japan. Please go to http://www.usdajapan.org/ and click on “Regional Briefs”. To date, the
ATO has reports on the Kansai region (Osaka/Kobe), and the Chugoku region (Hiroshima).
Reports on Hokkaido (Sapporo), and Kyushu (Fukuoka/Kagoshima) will be available soon.
Other websites: http://www.myfood.jp http://www.us-ato.jp