Sistema de Clasificacion de Cargos Que Rige La Carrera Funcionarial 20080430 Go 38921
Upload
fraser-federal-reserve-archiveCategory
view
221download
1
Prefatory Note The attached document represents the most complete and accurate version available based on original files from the FOMC Secretariat at the Board of Governors of the Federal Reserve System. Please note that some material may have been redacted from this document if that material was received on a confidential basis. Redacted material is indicated by occasional gaps in the text or by gray boxes around non-text content. All redacted passages are exempt from disclosure under applicable provisions of the Freedom of Information Act.
Content last modified 03/07/2014.
Confidential (FR) Class III FOMC
CURRENT ECONOMIC AND FINANCIAL CONDITIONS
Supplemental Notes
Prepared for the Federal Open Market Committee by the staff of the Board of Governors of the Federal Reserve System
April 25, 2008

Contents
ii
The Domestic Nonfinancial Economy ......................................................1
Consumer Sentiment....................................................................................1 Sales of New Homes....................................................................................1 Shipments and Orders for Nondefense Capital Goods ................................2
Tables and Charts Reuters/University of Michigan Survey of Consumers ...............................4 Private Housing Activity..............................................................................5 Indicators of Single-Family Housing...........................................................6 Orders and Shipments of Nondefense Capital Goods..................................7
The Domestic Financial Economy ...........................................................3 Errata for Part 2 of the Greenbook.....................................................3
Tables Commercial Bank Credit .............................................................................8 Selected Financial Market Quotations .........................................................9
Supplemental Notes
-1-
The Domestic Nonfinancial Economy Consumer Sentiment After having declined just a touch to 69.5 in March, the Reuters/University of Michigan index of consumer sentiment plunged to 62.6 in April. The decrease was slightly larger than had been reported in the preliminary estimate released in the middle of the month, implying that sentiment fell a bit further in the second half of the month. Both the “current conditions” and the “expected conditions” components of the overall index decreased significantly between March and April. Among those items not included in the overall sentiment index, consumers’ expectations about the change in unemployment over the next twelve months worsened considerably in April, and consumers’ appraisals of buying conditions for cars also softened. However, consumers’ appraisals of buying conditions for houses strengthened in April, largely because of increases in the number of households noting that prices and interest rates were low.
Since July, the level of sentiment has fallen precipitously; these declines reflect heightened concerns about the economy that can only partially be explained by the usual influences on sentiment, including inflation, the stock market, and employment conditions. The index from the Reuters/Michigan survey now stands a touch below the nadir reached during the 1990-1991 recession.
Among households, the median of expected inflation over the next twelve months rose 1/2 percentage point to 4.8 percent in April, and the median of expected inflation over the next five to ten years rose to 3.2 percent, the highest level since the summer of 2006.
Sales of New Homes New home sales continued to decline in March. The number of new-home sales agreements sank 8½ percent in March to an annual rate of 526,000 units; sales in February were revised down a touch. For the first quarter as a whole, sales came in at an average annual rate of 570,000 units, down 13 percent from the preceding quarter and 33 percent below their year-earlier level. Inventories of new homes for sale moved down another 1 percent in March and are now 20 percent below their peak in the summer of 2006. Even so, these inventories represented about 10¾ months’ supply at March’s slower sales pace—the highest reading since 1981.
The constant-quality price index for new homes—which controls for changes in readily measurable attributes such as home size and the geographic composition of sales—fell at
-2-
an annual rate of 9¾ percent in the first quarter, a somewhat larger drop than the 5 percent rate of decline recorded in the fourth quarter.
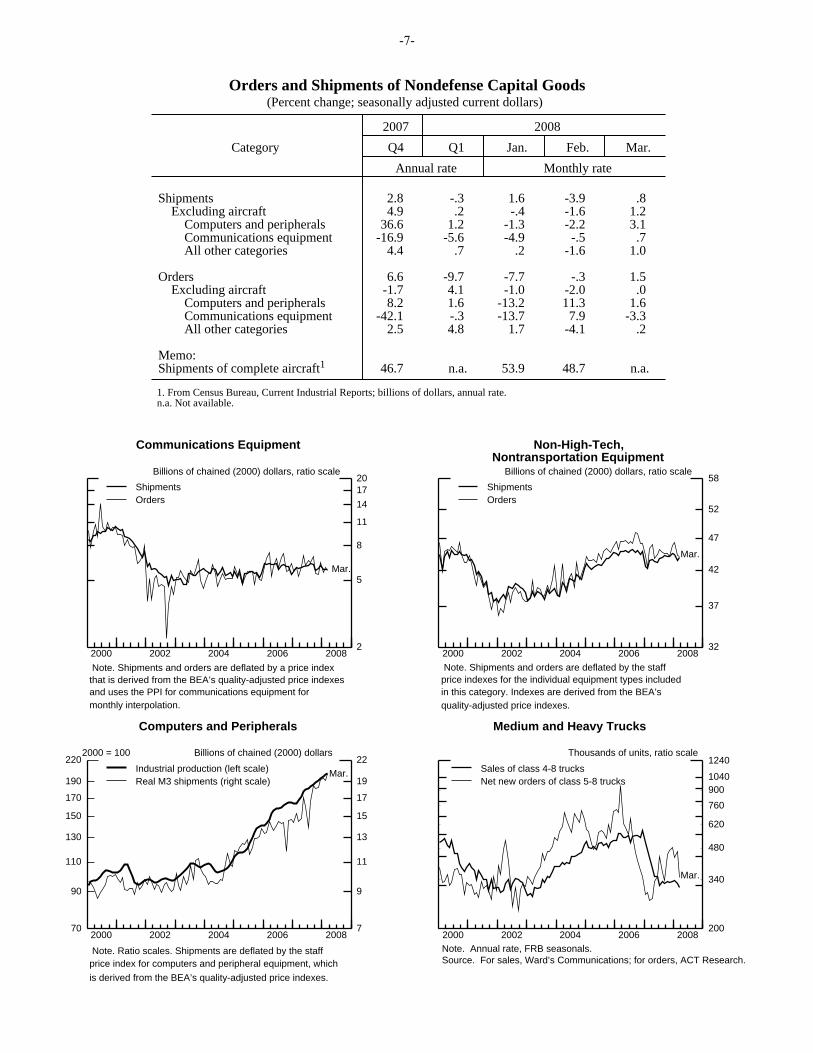
Shipments and Orders for Nondefense Capital Goods Shipments of nondefense capital goods excluding aircraft increased 1.2 percent in March after having declined in the preceding two months; new orders, which also fell in January and February, were flat and point to weaker shipments in the near term. Within the high-tech category, both orders and shipments of computers and peripherals posted solid gains in March and were revised up in February. However, although shipments of communications equipment stepped up in March, the rise reversed only a part of the declines posted in January and February, while orders dropped more than 3 percent. Outside of the high-tech sector, shipments increased somewhat last month but orders only edged up after having plunged in February.
The three-month moving average of the staff’s constructed series on real adjusted durable goods orders was down 1 percent in March. This series—which strips out nondefense aircraft, defense capital goods, and industries for which reported orders actually equal shipments—is one of the staff’s indicators of near-term industrial production.

-3-
The Domestic Financial Economy
Errata for Part 2 of the Greenbook: Page III-17 The sentence that reads:
Indeed, the net fractions of banks tightening lending standards reached or surpassed historical highs for all loan categories in the survey.
should read: Indeed, the net fractions of domestic banks tightening lending standards were close to, or surpassed, historical highs for nearly all loan categories in the survey.
Page III-A-1 The sentence that reads:
In the April survey, domestic and foreign institutions reported having further tightened their lending standards and terms on all loan categories over the past three months, with the net fractions of banks reporting tighter lending standards now being at, or above, historical highs for all loan categories in the survey.
should read: In the April survey, domestic and foreign institutions reported having further tightened their lending standards and terms on all loan categories over the past three months, with the net fractions of domestic banks reporting tighter lending standards now close to, or above, historical highs for nearly all loan categories in the survey.

April 25, 2008
Reuters/University of Michigan Survey of Consumers Indexes of consumer sentiment
(Not seasonally adjusted)
2007 2008
Category Sept. Oct. Nov. Dec. Jan. Feb. Mar. Apr.P Apr.F
Composite of current and expected conditions1 83.4 80.9 76.1 75.5 78.4 70.8 69.5 63.2 62.6Current conditions1 97.9 97.6 91.5 91.0 94.4 83.8 84.2 78.4 77.0Expected conditions1 74.1 70.1 66.2 65.6 68.1 62.4 60.1 53.4 53.3
Personal financial situation Now compared with 12 months ago2 109 111 101 98 98 94 93 87 86 Expected in 12 months2 119 119 115 112 116 112 112 97 100
Expected business conditions Next 12 months2 82 78 73 68 68 54 46 42 40 Next 5 years2 96 84 76 81 88 83 81 72 71
Appraisal of buying conditions Cars 139 128 117 117 119 119 114 112 110 Large household appliances2 144 142 136 137 146 123 124 115 112 Houses 123 131 122 128 124 140 129 135 136
Expected unemployment change - next 12 months 127 130 128 139 141 141 148 155 154
Prob. household will lose a job - next 5 years 21 21 19 23 21 24 22 24 23
Expected inflation - next 12 months Mean 4.0 3.7 4.3 4.4 4.0 3.9 4.6 5.6 5.7 Median 3.1 3.1 3.4 3.4 3.4 3.6 4.3 4.8 4.8
Expected inflation - next 5 to 10 years Mean 3.4 3.1 3.4 3.5 3.4 3.4 3.2 3.4 3.5 Median 2.9 2.8 2.9 3.1 3.0 3.0 2.9 3.1 3.2
Note. Figures on financial, business, and buying conditions are the percent reporting ’good times’ (or’better’) minus the percent reporting ’bad times’ (or ’worse’), plus 100. Expected change in unemployment is the fraction expecting unemployment to rise minus the fraction expecting unemployment to fall, plus 100. P Preliminary. F Final. 1. Feb. 1966 = 100. 2. Indicates the question is one of the five equally-weighted components of the index of sentiment.
2000 2002 2004 2006 200840
60
80
100
120
140
160
1801985 = 100
60
70
80
90
100
110
120
1301966 = 100
Reuters/Michigan (right scale)
Conference Board (left scale) Apr. Mar.
Consumer sentiment
2000 2002 2004 2006 20080
1
2
3
4
5
0
1
2
3
4
5Percent
Median, 5 to 10 years ahead
Median, 12 months ahead
Apr.
Expected inflation
-4-
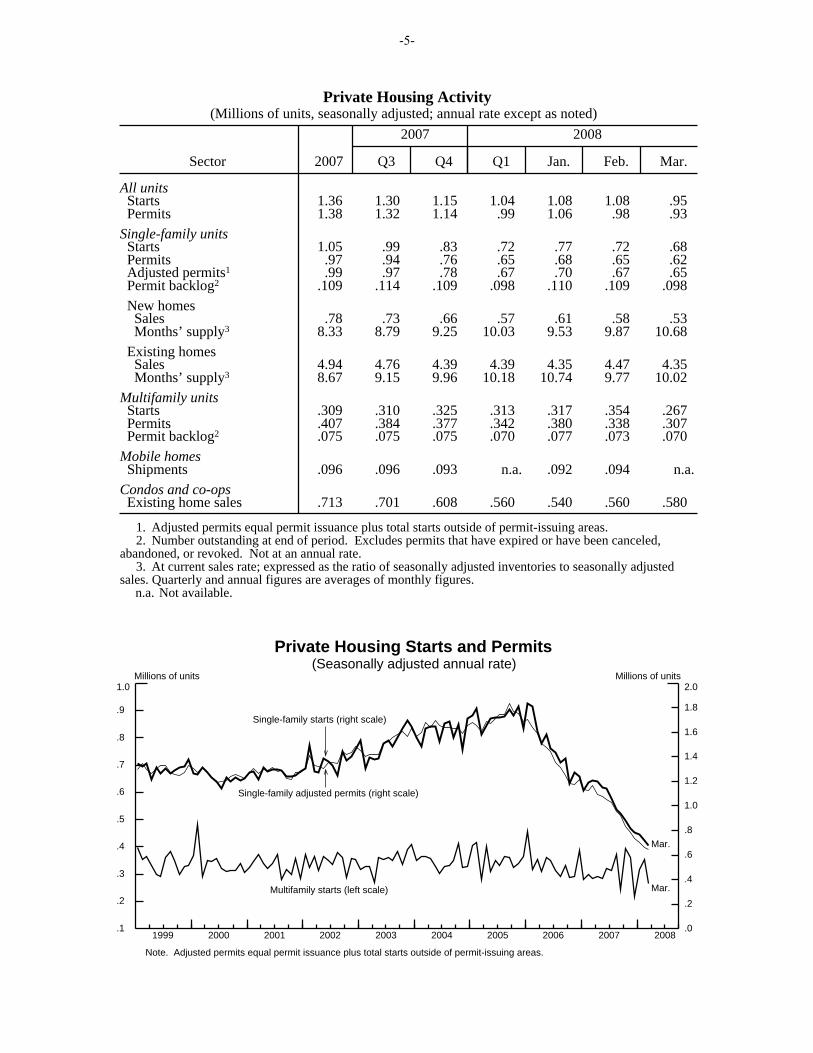
Private Housing Activity(Millions of units, seasonally adjusted; annual rate except as noted)
2007 2008
Sector 2007 Q3 Q4 Q1 Jan. Feb. Mar.
All units Starts 1.36 1.30 1.15 1.04 1.08 1.08 .95 Permits 1.38 1.32 1.14 .99 1.06 .98 .93
Single-family units Starts 1.05 .99 .83 .72 .77 .72 .68 Permits .97 .94 .76 .65 .68 .65 .62 Adjusted permits1 .99 .97 .78 .67 .70 .67 .65 Permit backlog2 .109 .114 .109 .098 .110 .109 .098
New homes Sales .78 .73 .66 .57 .61 .58 .53 Months’ supply3 8.33 8.79 9.25 10.03 9.53 9.87 10.68
Existing homes Sales 4.94 4.76 4.39 4.39 4.35 4.47 4.35 Months’ supply3 8.67 9.15 9.96 10.18 10.74 9.77 10.02
Multifamily units Starts .309 .310 .325 .313 .317 .354 .267 Permits .407 .384 .377 .342 .380 .338 .307 Permit backlog2 .075 .075 .075 .070 .077 .073 .070
Mobile homes Shipments .096 .096 .093 n.a. .092 .094 n.a.
Condos and co-ops Existing home sales .713 .701 .608 .560 .540 .560 .580
1. Adjusted permits equal permit issuance plus total starts outside of permit-issuing areas. 2. Number outstanding at end of period. Excludes permits that have expired or have been canceled,
abandoned, or revoked. Not at an annual rate. 3. At current sales rate; expressed as the ratio of seasonally adjusted inventories to seasonally adjusted
sales. Quarterly and annual figures are averages of monthly figures. n.a. Not available.
1999 2000 2001 2002 2003 2004 2005 2006 2007 2008.1
.2
.3
.4
.5
.6
.7
.8
.9
1.0 Millions of units
.0
.2
.4
.6
.8
1.0
1.2
1.4
1.6
1.8
2.0Millions of units
Private Housing Starts and Permits(Seasonally adjusted annual rate)
Single-family starts (right scale)
Single-family adjusted permits (right scale)
Mar.
Note. Adjusted permits equal permit issuance plus total starts outside of permit-issuing areas.
Multifamily starts (left scale) Mar.
-5-

-6-
Indicators of Single-Family Housing
Existing Single-Family Home Sales Millions of units
6_5
(annual rate) lndex(2001=100) 140
6.0
5.5
5.0
4.5
40
30
20
10
-10
-20
Source. National Association of Realtors.
New Home Sales Months' Supply
Months' supply (right scale)
130
120
110
100
90
80
Months 11
10
9
8
7
6
5
4
3
2
Note. . Months' supply is calculated using the 3-month moving average of sales.
Source. for months' supply, Census Bureau.
Prices of Existing Homes
Percent change, annual rate 40
Quarterly OFHEO purchase-only index Monthly OFHEO purchase-only index Case-Shiller 10-city price index
Note. The Case-Shiller and monthly OFHEO indexes are 3-month percent changes. Source. For purchase-only indexes, OFHEO; for Case-Shiller,
Chicago Mercantile Exchange.
30
20
10
0
-10
-20
New Single-Family Home Sales Millions of units
1_5
(annual rate)
1.3
1.1
0.9
0.7
0.5
20
15
10
5
-5
-10
Note:
Source. for sales agreements, Census Bureau
Mortgage Rates
Percent 9
30-year jumbo FRM 30-year conforming FRM 1-year conforming ARM
Note. The Apr. readings are for data through Apr. 23, 2008. Source. Conforming rates are from Freddie Mac. The
jumbo rate is the sum of the 30-year conforming FRM rate and the jumbo conforming spread from bankrate.com.
Price of New Homes
8
7
6
5
4
Percent change from preceding period, annual rate 20
Constant quality index
15
10
5
0
-5
-10
Source. Census Bureau.
2000 2001 2002 2003 2004 2005 2006 2007 200870
90
110
130
150
170
190
220
7
9
11
13
15
17
19
222000 = 100 Billions of chained (2000) dollars
2000 2002 2004 2006 2008
Mar.
Note. Ratio scales. Shipments are deflated by the staffprice index for computers and peripheral equipment, which
is derived from the BEA’s quality-adjusted price indexes.
Industrial production (left scale)Real M3 shipments (right scale)
Computers and Peripherals
2000 2001 2002 2003 2004 2005 2006 2007 20082
5
8
11
14
1720
2
5
8
11
14
1720
Billions of chained (2000) dollars, ratio scale
2000 2002 2004 2006 2008
Mar.
Note. Shipments and orders are deflated by a price index that is derived from the BEA’s quality-adjusted price indexesand uses the PPI for communications equipment for monthly interpolation.
ShipmentsOrders
Communications Equipment
2000 2001 2002 2003 2004 2005 2006 2007 2008200
340
480
620
760
9001040
1240
200
340
480
620
760
9001040
1240Thousands of units, ratio scale
2000 2002 2004 2006 2008
Mar.
Note. Annual rate, FRB seasonals. Source. For sales, Ward’s Communications; for orders, ACT Research.
Sales of class 4-8 trucksNet new orders of class 5-8 trucks
Medium and Heavy Trucks
2000 2001 2002 2003 2004 2005 2006 2007 200832
37
42
47
52
58
32
37
42
47
52
58Billions of chained (2000) dollars, ratio scale
2000 2002 2004 2006 2008
Mar.
Note. Shipments and orders are deflated by the staff price indexes for the individual equipment types included in this category. Indexes are derived from the BEA’squality-adjusted price indexes.
ShipmentsOrders
Non-High-Tech, Nontransportation Equipment
Orders and Shipments of Nondefense Capital Goods(Percent change; seasonally adjusted current dollars)
2007 2008
Category Q4 Q1 Jan. Feb. Mar.
Annual rate Monthly rate
Shipments 2.8 -.3 1.6 -3.9 .8 Excluding aircraft 4.9 .2 -.4 -1.6 1.2 Computers and peripherals 36.6 1.2 -1.3 -2.2 3.1 Communications equipment -16.9 -5.6 -4.9 -.5 .7 All other categories 4.4 .7 .2 -1.6 1.0
Orders 6.6 -9.7 -7.7 -.3 1.5 Excluding aircraft -1.7 4.1 -1.0 -2.0 .0 Computers and peripherals 8.2 1.6 -13.2 11.3 1.6 Communications equipment -42.1 -.3 -13.7 7.9 -3.3 All other categories 2.5 4.8 1.7 -4.1 .2
Memo: Shipments of complete aircraft1 46.7 n.a. 53.9 48.7 n.a.
1. From Census Bureau, Current Industrial Reports; billions of dollars, annual rate. n.a. Not available.
-7-

Commercial Bank Credit(Percent change, annual rate, except as noted; seasonally adjusted)
Type of credit H1 Q3 Q4 Q1 Mar. Apr. Level1
2007 2007 2007 2008 2008 2008e Apr. 2008e
Total 11.1 12.4 9.5 6.7 13.4 -6.4 8,978
Loans2
Total 11.2 11.7 10.5 9.8 8.4 .2 6,798 To businesses Commercial and industrial 25.1 21.4 27.3 15.9 19.9 11.5 1,481 Commercial real estate 9.8 10.4 9.1 9.4 13.1 7.4 1,631
To households Residential real estate -1.4 2.6 -5.4 5.4 14.0 4.5 1,889 Revolving home equity 6.4 5.4 7.3 10.8 18.5 16.0 500 Other -4.0 1.7 -9.6 3.5 12.5 .4 1,389 Consumer 10.8 10.7 10.6 7.4 4.6 7.7 817 Originated3 9.4 10.1 8.4 7.8 4.0 8.6 1,228 Other4 20.8 19.7 21.0 12.1 -21.8 -41.5 981
SecuritiesTotal 10.7 14.8 6.3 -2.5 29.0 -26.6 2,180 Treasury and agency -5.0 7.7 -17.5 -6.8 43.2 -14.6 1,115 Other5 29.9 23.4 34.4 2.0 14.9 -38.9 1,066
Note. Yearly annual rates are Q4 to Q4; quarterly and monthly annual rates use corresponding average levels. Datahave been adjusted to remove the effects of mark-to-market accounting rules (FIN 39 and FAS 115), the initial consoli-dation of certain variable interest entities (FIN 46), the initial adoption of fair value accounting (FAS 159), and the effectsof sizable thrift-to-bank and bank-to-thrift structure activity in October 2006, March 2007, and October 2007. Data alsoaccount for breaks caused by reclassifications. 1. Billions of dollars. Pro rata averages of weekly (Wednesday) levels. 2. Excludes interbank loans. 3. Includes an estimate of outstanding loans securitized by commercial banks. 4. Includes security loans and loans to farmers, state and local governments, and all others not elsewhere classified.Also includes lease financing receivables. 5. Includes private mortgage-backed securities, securities of corporations, state and local governments, foreigngovernments, and any trading account assets that are not Treasury or agency securities, including revaluation gainson derivative contracts. e Estimated.
-8-
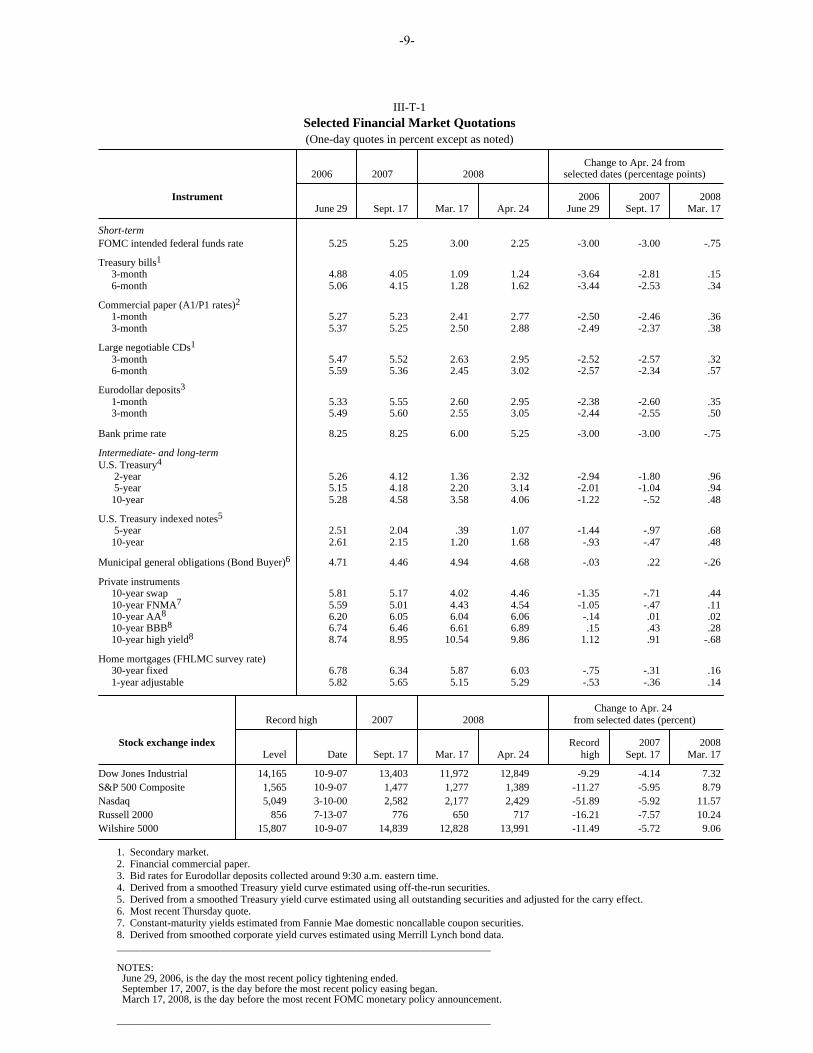
III-T-1Selected Financial Market Quotations(One-day quotes in percent except as noted)
Change to Apr. 24 from2006 2007 2008 selected dates (percentage points)
Instrument 2006 2007 2008 June 29 Sept. 17 Mar. 17 Apr. 24 June 29 Sept. 17 Mar. 17
Short-termFOMC intended federal funds rate 5.25 5.25 3.00 2.25 -3.00 -3.00 -.75
Treasury bills1
3-month 4.88 4.05 1.09 1.24 -3.64 -2.81 .15 6-month 5.06 4.15 1.28 1.62 -3.44 -2.53 .34
Commercial paper (A1/P1 rates)2
1-month 5.27 5.23 2.41 2.77 -2.50 -2.46 .36 3-month 5.37 5.25 2.50 2.88 -2.49 -2.37 .38
Large negotiable CDs1
3-month 5.47 5.52 2.63 2.95 -2.52 -2.57 .32 6-month 5.59 5.36 2.45 3.02 -2.57 -2.34 .57
Eurodollar deposits3
1-month 5.33 5.55 2.60 2.95 -2.38 -2.60 .35 3-month 5.49 5.60 2.55 3.05 -2.44 -2.55 .50
Bank prime rate 8.25 8.25 6.00 5.25 -3.00 -3.00 -.75
Intermediate- and long-termU.S. Treasury4
2-year 5.26 4.12 1.36 2.32 -2.94 -1.80 .96 5-year 5.15 4.18 2.20 3.14 -2.01 -1.04 .94 10-year 5.28 4.58 3.58 4.06 -1.22 -.52 .48
U.S. Treasury indexed notes5
5-year 2.51 2.04 .39 1.07 -1.44 -.97 .68 10-year 2.61 2.15 1.20 1.68 -.93 -.47 .48
Municipal general obligations (Bond Buyer)6 4.71 4.46 4.94 4.68 -.03 .22 -.26
Private instruments 10-year swap 5.81 5.17 4.02 4.46 -1.35 -.71 .44 10-year FNMA7 5.59 5.01 4.43 4.54 -1.05 -.47 .11 10-year AA8 6.20 6.05 6.04 6.06 -.14 .01 .02 10-year BBB8 6.74 6.46 6.61 6.89 .15 .43 .28 10-year high yield8 8.74 8.95 10.54 9.86 1.12 .91 -.68
Home mortgages (FHLMC survey rate) 30-year fixed 6.78 6.34 5.87 6.03 -.75 -.31 .16 1-year adjustable 5.82 5.65 5.15 5.29 -.53 -.36 .14
Change to Apr. 24 Record high 2007 2008 from selected dates (percent)
Stock exchange index Record 2007 2008 Level Date Sept. 17 Mar. 17 Apr. 24 high Sept. 17 Mar. 17
Dow Jones Industrial 14,165 10-9-07 13,403 11,972 12,849 -9.29 -4.14 7.32S&P 500 Composite 1,565 10-9-07 1,477 1,277 1,389 -11.27 -5.95 8.79Nasdaq 5,049 3-10-00 2,582 2,177 2,429 -51.89 -5.92 11.57Russell 2000 856 7-13-07 776 650 717 -16.21 -7.57 10.24Wilshire 5000 15,807 10-9-07 14,839 12,828 13,991 -11.49 -5.72 9.06
1. Secondary market. 2. Financial commercial paper. 3. Bid rates for Eurodollar deposits collected around 9:30 a.m. eastern time. 4. Derived from a smoothed Treasury yield curve estimated using off-the-run securities. 5. Derived from a smoothed Treasury yield curve estimated using all outstanding securities and adjusted for the carry effect. 6. Most recent Thursday quote. 7. Constant-maturity yields estimated from Fannie Mae domestic noncallable coupon securities. 8. Derived from smoothed corporate yield curves estimated using Merrill Lynch bond data. _______________________________________________________________________
NOTES: June 29, 2006, is the day the most recent policy tightening ended. September 17, 2007, is the day before the most recent policy easing began. March 17, 2008, is the day before the most recent FOMC monetary policy announcement.
_______________________________________________________________________
-9-