Fomc 19930921 Blue Book 19930917
23
Prefatory Note The attached document represents the most complete and accurate version available based on original copies culled from the files of the FOMC Secretariat at the Board of Governors of the Federal Reserve System. This electronic document was created through a comprehensive digitization process which included identifying the best- preserved paper copies, scanning those copies, 1 and then making the scanned versions text-searchable. 2 Though a stringent quality assurance process was employed, some imperfections may remain. Please note that this document may contain occasional gaps in the text. These gaps are the result of a redaction process that removed information obtained on a confidential basis. All redacted passages are exempt from disclosure under applicable provisions of the Freedom of Information Act. 1 In some cases, original copies needed to be photocopied before being scanned into electronic format. All scanned images were deskewed (to remove the effects of printer- and scanner-introduced tilting) and lightly cleaned (to remove dark spots caused by staple holes, hole punches, and other blemishes caused after initial printing). 2 A two-step process was used. An advanced optimal character recognition computer program (OCR) first created electronic text from the document image. Where the OCR results were inconclusive, staff checked and corrected the text as necessary. Please note that the numbers and text in charts and tables were not reliably recognized by the OCR process and were not checked or corrected by staff.
-
Upload
fraser-federal-reserve-archive -
Category
Documents
-
view
217 -
download
2
Transcript of Fomc 19930921 Blue Book 19930917

Prefatory Note
The attached document represents the most complete and accurate version available based on original copies culled from the files of the FOMC Secretariat at the Board of Governors of the Federal Reserve System. This electronic document was created through a comprehensive digitization process which included identifying the best-preserved paper copies, scanning those copies,1 and then making the scanned versions text-searchable.2 Though a stringent quality assurance process was employed, some imperfections may remain.
Please note that this document may contain occasional gaps in the text. These gaps are the result of a redaction process that removed information obtained on a confidential basis. All redacted passages are exempt from disclosure under applicable provisions of the Freedom of Information Act.
1 In some cases, original copies needed to be photocopied before being scanned into electronic format. All scanned images were deskewed (to remove the effects of printer- and scanner-introduced tilting) and lightly cleaned (to remove dark spots caused by staple holes, hole punches, and other blemishes caused after initial printing). 2 A two-step process was used. An advanced optimal character recognition computer program (OCR) first created electronic text from the document image. Where the OCR results were inconclusive, staff checked and corrected the text as necessary. Please note that the numbers and text in charts and tables were not reliably recognized by the OCR process and were not checked or corrected by staff.

Strictly Confidential (FR) Class I FOMC
MONETARY POLICY ALTERNATIVES
Prepared for the Federal Open Market Committee
By the staff Board of Governors of the Federal Reserve System

Strictly Confidential (FR)Class I - FOMC September 17, 1993
MONETARY POLICY ALTERNATIVES
Recent Developments
(1) The federal funds rate averaged close to the Committee's
expectation of 3 percent during the intermeeting period. Short-term
interest rates have edged down since the August meeting, while interme-
diate- and long-term rates have decreased 20 to 30 basis points, on
23balance. These declines extended the drop in longer-term
rates since their recent highs, posted just after the July Humphrey-
Hawkins testimony, to nearly 3/4 percentage point. A sizable portion of
these reductions in rates appears to incorporate a moderation in infla-
tion expectations, a notion supported by survey data. Revisions to the
inflation outlook were probably prompted by generally favorable data on
broad price indexes and evidence of continuing sluggishness in economic
activity. The market response to the cast of data on aggregate demand
and to greater assurance of fiscal restraint suggests that real long-
1. The Desk's allowance for adjustment plus seasonal borrowing waskept unchanged at $250 million, while actual borrowing, which wasboosted by technical difficulties at two large banks, averaged $425million in the two full maintenance periods since the August FOMCmeeting.
2. Rate movements are calculated using quotes through noon,September 17. At that time a few banks had reduced their prime ratesfrom 6 to 5-3/4 percent, but none were money-center banks and theaction had not become general.
3. The thirty-year constant maturity Treasury yield has dropped abit more than rates on corporate bonds and mortgages. However, thisdifferential primarily reflects movements in the exceptional premiumfor the most recently auctioned Treasury bond--the security used inthe construction of the constant maturity yield. Owing to the Trea-sury's decision to reduce the volume of such securities offered andthe frequency of auctions in the future, the yield on the thirty-yearbond auctioned in early August has been unusually far below nearbysecurities on the yield curve, and the gap has widened on balance overthe intermeeting period. Indeed, private securities underwriters aresaid to be using a more seasoned issue as a benchmark for pricingdecisions.
term interest rates may also have fallen since late July; this inter-
pretation of rate movements is consistent with the reduced foreign
exchange value for the U.S. dollar and continued strength in stock
markets. Market perceptions, in light of incoming data, that the
Federal Reserve would raise nominal short-term rates later and by less
than was previously foreseen probably contributed to declines in real
yields on bonds and equity. Apparently, investors turned increasingly
to longer-term assets to preserve returns, which has helped to lift most
major stock market indexes 1 to 2 percent since the August meeting.
(2) On balance, the weighted average foreign exchange value of
the dollar fell about 3 percent since the last meeting, depreciating
even more against the mark and other European currencies, while appreci-
ating about 3 percent against the yen. The dollar was buoyed against --
the yen early in the period by U.S. intervention sales of yen ($165
million equivalent) and the accompanying public statement by the Trea-
sury Department, which the market apparently read as signalling a new
attitude--that further strengthening of the yen was not desirable.
The mark's strength was partly related to the
unexpectedly slow pace of interest rate reductions by the Bundesbank;
while the discount and Lombard rates were cut 50 basis points on
September 10, the key RP rate was lowered only 10 basis points. German
three-month market rates were essentially unchanged and long-term rates
declined 25 basis points over the intermeeting period. Other ERM
monetary authorities continued to be cautious in reducing interest
rates, despite the additional leeway offered by the wider, 15 percent,
exchange rate margins. Japanese three-month interest rates fell 30
basis points and long-term rates 10 basis points.
(3) Appetites for longer-term securities continue to weaken M2
demand. Bond and stock mutual funds posted a record gain in July, and
weekly data indicate an even stronger advance in August. M2 grew at the
subdued rate of 1-3/4 percent in August, close to the forecast in the
last bluebook, leaving the aggregate slightly above the lower end of its
annual growth cone. A temporary dip in mortgage refinancing likely
restrained M2 growth last month. Components generally followed recent
trends: M1 again grew rapidly--at a 10-1/2 percent rate for the
month;4 savings and MMDAs posted a moderate gain, while there were
runoffs in small time deposits and money market mutual funds, the
closest substitutes for capital market investments. 5
(4) M3 growth was slow in August, although it rose for the
first time in three months and was somewhat above the staff projection
at the last meeting. This aggregate is now at the lower end of its
growth cone. Sluggish depository credit continued to depress M3 growth.
With credit demands continuing to be concentrated in capital markets,
bank credit decelerated to a 3-1/4 percent rate of growth in August.
Most of the increase was in bank securities portfolios; business loans
4. Total reserves and the monetary base grew at 9-3/4 and 11-1/2percent rates, respectively, in August.
5. M2 plus bond and stock mutual funds (excluding institutionalholdings and IRA/Keogh accounts) is estimated to have grown at about a5 percent rate in August, the same as its average pace for the year todate.
6. The unexpected pickup in M3 in August owed primarily to adecline in money fund holdings of large CDs, which resulted in a rare,albeit small, increase in net CDs in this aggregate. (The aggregatesare constructed on a consolidated basis by subtracting deposits heldby money-stock issuers--depository institutions and money funds--fromreported deposit liabilities.) Expansion of M3 continued to be helddown by the decline in institutional money funds that began inSeptember of 1992; the stable short-term interest rate environmentsince then has eliminated the yield advantage of their slowly-adjusting average returns over direct investment in money marketinstruments.

were little changed, while real estate and consumer loan growth slowed,
and security loans ran off.
(5) The growth of nonfederal debt, though still subdued,
appears to have picked up a little in recent months, with both business
and household borrowing strengthening somewhat. In the business sector,
commercial paper issuance has been strong of late, but the bulk of net
borrowing remained focused on bond markets. Receptive financial markets
readily absorbed heavy bond issuance and a pickup in initial public
offerings of equity, the proceeds of which financed considerable
retirement of higher-cost bonds and probably the paydown of bank loans.
The improvement in household financial positions has supported higher
debt growth. Consumer credit picked up to a 7 percent pace in July (on
a month-average basis), and bank data for August suggest further
appreciable growth. Mortgage debt is estimated to be expanding
moderately, as households do not appear to be taking out significant
additional cash in refinancing their mortgages. From the fourth quarter
of 1992 through July, nonfederal debt grew at only a 3 percent rate.
Federal debt growth eased over the summer from its rapid second-quarter
rate on a seasonally adjusted basis. Total domestic nonfinancial debt
is estimated to have grown at a 5-1/2 percent rate in July, and at a
4-1/2 percent rate from the fourth quarter through July, leaving this
aggregate somewhat above the lower bound of its monitoring range for
1993.
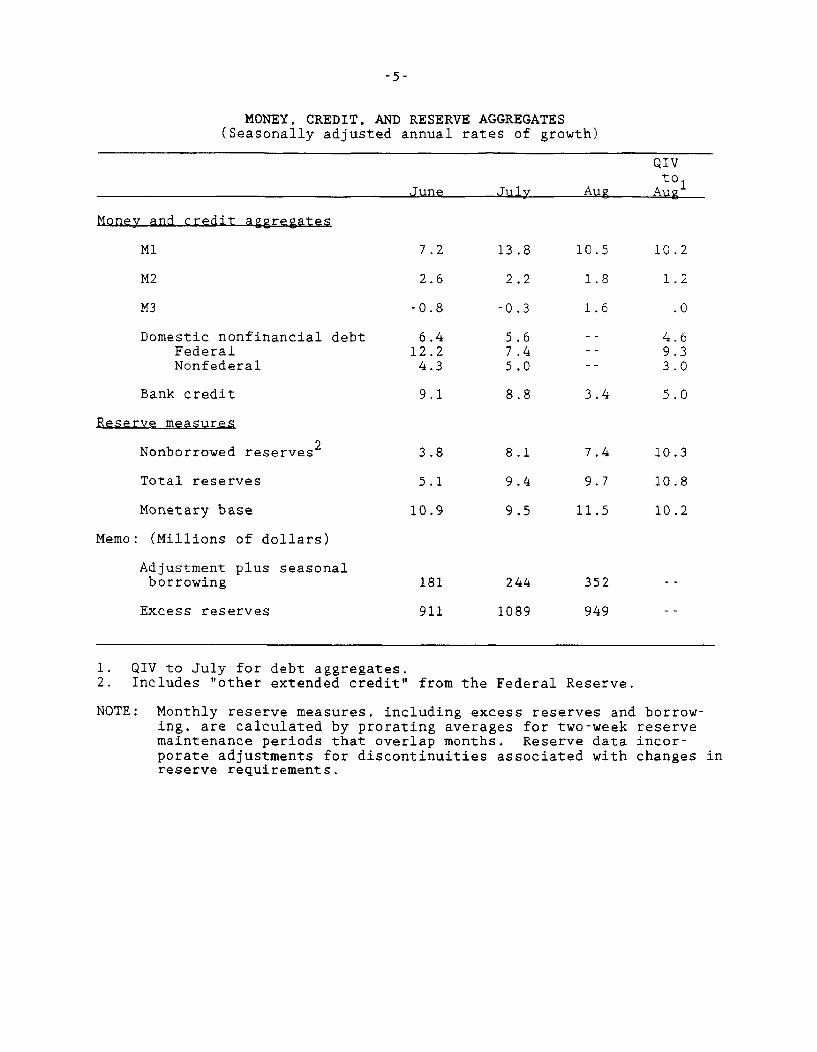
MONEY, CREDIT, AND RESERVE AGGREGATES(Seasonally adjusted annual rates of growth)
QIVto
June July Aug Aug
Money and credit aggregates
M1 7.2 13.8 10.5 10.2
M2 2.6 2.2 1.8 1.2
M3 -0.8 -0.3 1.6 .0
Domestic nonfinancial debt 6.4 5.6 -- 4.6Federal 12.2 7.4 -- 9.3Nonfederal 4.3 5.0 -- 3.0
Bank credit 9.1 8.8 3.4 5.0
Reserve measures
Nonborrowed reserves2 3.8 8.1 7.4 10.3
Total reserves 5.1 9.4 9.7 10.8
Monetary base 10.9 9.5 11.5 10.2
Memo: (Millions of dollars)
Adjustment plus seasonalborrowing 181 244 352
Excess reserves 911 1089 949
1. QIV to July for debt aggregates.2. Includes "other extended credit" from the Federal Reserve.
NOTE: Monthly reserve measures, including excess reserves and borrow-ing, are calculated by prorating averages for two-week reservemaintenance periods that overlap months. Reserve data incor-porate adjustments for discontinuities associated with changes inreserve requirements.

Policy Alternatives
(6) Three policy alternatives are presented for consideration
by the Committee. Under alternative B, federal funds would continue to
trade around 3 percent in combination with an initial allowance for
adjustment plus seasonal borrowing of $250 million. Under alterna-
tive A, the federal funds rate would decline to 2-1/2 percent, either
through a reduction in the initial borrowing allowance or a cut in the
discount rate by 50 basis points and an unchanged initial borrowing
allowance. Under alternative C, the federal funds rate would rise to
3-1/2 percent in association with a boost in the initial borrowing
allowance.
(7) Alternative B is consistent with the staff's economic
forecast. In that forecast, short-term rates are assumed to remain at
current levels through the end of 1994. Growth in output settles into a
pace broadly in line with that of potential output, preserving the
current modest slack in resource markets. Accordingly, core inflation
edges lower. Market participants apparently believe that the federal
funds rate will remain at 3 percent, at least for the next several
months, and under alternative B, money market interest rates would
remain around current levels. However, participants seem to expect
stronger economic growth over coming months than implicit in the staff
forecast and little further progress in reducing inflation. In the
absence of stronger growth, intermediate- and longer-term rates might
well drift lower as incoming data tilt market sentiment and investors
continue to reach for yield. Bond yields could remain unusually
volatile for a time as market participants continue to assess the
7. Demands for seasonal credit are likely to diminish over theintermeeting period, as they typically do in the fall, calling fordownward technical adjustment to the borrowing allowance.

sustainability of the much reduced levels of long-term rates that have
recently been reached. This skittishness may focus particularly on
indicators bearing on the outlook for prices, partly in light of their
possible implications for monetary policy going forward. Consistent
with the staff forecast of policy easings in Germany and Japan, the
dollar should trade on the high side of recent levels under alterna-
tive B.
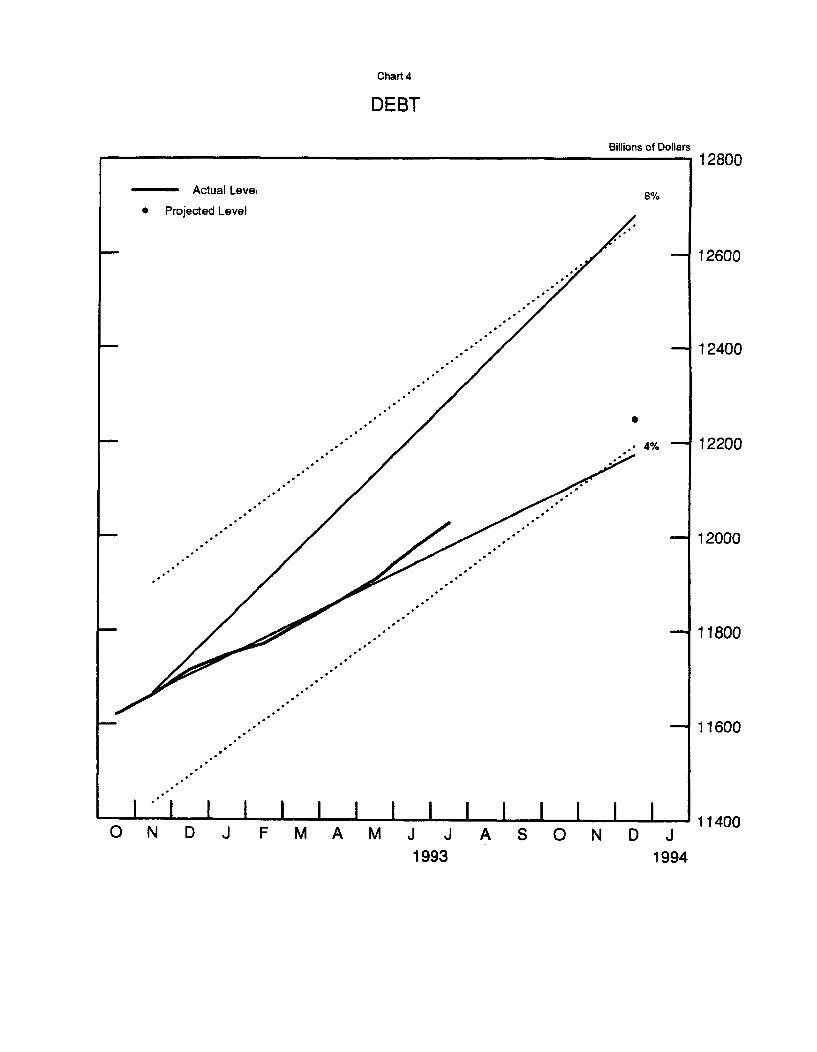
(8) While lower long-term rates and tight quality spreads
should continue to spur considerable activity in capital markets, net
growth in debt is expected to remain moderate. Debt of nonfederal
sectors is projected to grow more rapidly over the balance of the year
than in the first half but more slowly than nominal output. In the
business sector, net equity issuance should stay around the elevated
levels of late, restraining borrowing. Households likely will respond
vigorously to recent declines in mortgage rates, but mainly to refinance
existing mortgages. Mortgage and consumer debt is expected to continue
to increase at a moderate rate. Including the federal government, the
debt of nonfinancial sectors is projected to expand at a bit more than a
4 percent pace over the final five months of the year, leaving its
growth for the year at 4-1/2 percent, a little above the lower bound of
its annual range.
(9) As shown in the table below, M2 under alternative B is
projected to grow at a 2 percent average rate over the final four months
of this year. Special factors, especially mortgage refinancings.
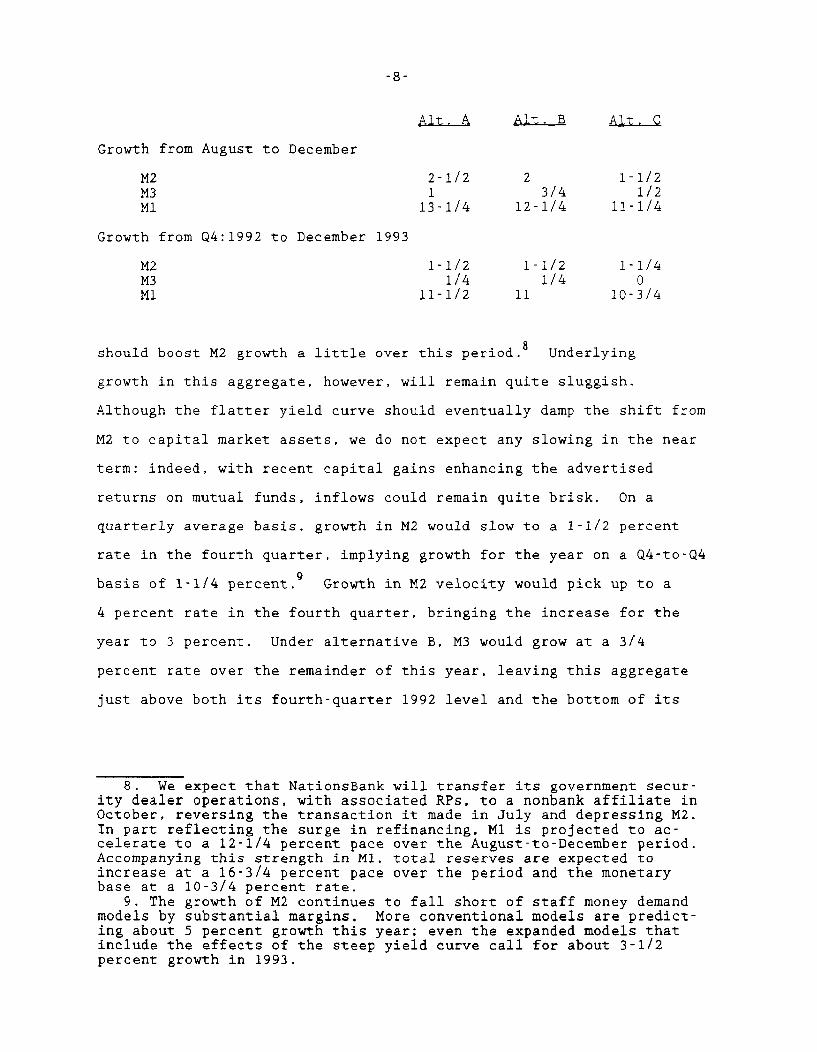
Alt. A Alt. B Alt. C
Growth from August to December
M2 2-1/2 2 1-1/2M3 1 3/4 1/2M1 13-1/4 12-1/4 11-1/4
Growth from Q4:1992 to December 1993
M2 1-1/2 1-1/2 1-1/4M3 1/4 1/4 0M1 11-1/2 11 10-3/4
should boost M2 growth a little over this period. Underlying
growth in this aggregate, however, will remain quite sluggish.
Although the flatter yield curve should eventually damp the shift from
M2 to capital market assets, we do not expect any slowing in the near
term: indeed, with recent capital gains enhancing the advertised
returns on mutual funds, inflows could remain quite brisk. On a
quarterly average basis, growth in M2 would slow to a 1-1/2 percent
rate in the fourth quarter, implying growth for the year on a Q4-to-Q4
basis of 1-1/4 percent.9 Growth in M2 velocity would pick up to a
4 percent rate in the fourth quarter, bringing the increase for the
year to 3 percent. Under alternative B, M3 would grow at a 3/4
percent rate over the remainder of this year, leaving this aggregate
just above both its fourth-quarter 1992 level and the bottom of its
8. We expect that NationsBank will transfer its government secur-ity dealer operations, with associated RPs, to a nonbank affiliate inOctober, reversing the transaction it made in July and depressing M2.In part reflecting the surge in refinancing, M1 is projected to ac-celerate to a 12-1/4 percent pace over the August-to-December period.Accompanying this strength in M1, total reserves are expected toincrease at a 16-3/4 percent pace over the period and the monetarybase at a 10-3/4 percent rate.
9. The growth of M2 continues to fall short of staff money demandmodels by substantial margins. More conventional models are predict-ing about 5 percent growth this year; even the expanded models thatinclude the effects of the steep yield curve call for about 3-1/2percent growth in 1993.

Alternative Levels and Growth Rates for Key Monetary Aggregates
M2 M3 M1
Alt. A Alt. B Alt. C Alt. A Alt. B Alt. C Alt. A Alt. B Alt. C
Levels in BillionsJul-93 3521.4 3521.4 3521.4 4169.9 4169.9 4169.9 1085.5 1085.5 1085.5Aug-93 3526.7 3526.7 3526.7 4175.3 4175.3 4175.3 1095.0 1095.0 1095.0Sep-93 3533.6 3532.7 3531.8 4178.4 4177.7 4177.0 1103.9 1103.3 1102.8Oct-93 3536.2 3533.3 3530.3 4176.7 4174.9 4173.2 1115.5 1113.9 1112.3Nov-93 3545.9 3541.2 3536.5 4183.3 4180.2 4177.0 1129.1 1126.4 1123.7Dec-93 3555.1 3549.2 3543.3 4189.9 4185.4 4180.9 1143.2 1139.6 1135.9
Monthly Growth RatesJul-93 2.2 2.2 2.2 -0.3 -0.3 -0.3 13.8 13.8 13.8Aug-93 1.8 1.8 1.8 1.6 1.6 1.6 10.5 10.5 10.5Sep-93 2.3 2.0 1.7 0.9 0.7 0.5 9.7 9.1 8.5Oct-93 0.9 0.2 -0.5 -0.5 -0.8 -1.1 12.6 11.5 10.4Nov-93 3.3 2.7 2.1 1.9 1.5 1.1 14.7 13.5 12.3Dec-93 3.1 2.7 2.3 1.9 1.5 1.1 15.0 14.0 13.0
Quarterly Averages93 Q1 -1.8 -1.8 -1.8 -3.7 -3.7 -3.7 6.6 6.6 6.693 Q2 2.2 2.2 2.2 2.5 2.5 2.5 10.5 10.5 10.593 Q3 3.2 3.1 3.1 1.1 1.1 1.1 12.7 12.7 12.693 Q4 2.1 1.6 1.1 0.8 0.6 0.3 12.6 11.7 10.8
Growth RateFrom ToDec-92 Jun-93 1.0 1.0 1.0 0.2 0.2 0.2 9.1 9.1 9.1
Jun-93 Sep-93 2.1 2.0 1.9 0.7 0.6 0.6 11.4 11.2 11.0
Jun-93 Dec-93 2.3 2.0 1.6 0.9 0.7 0.5 13.0 12.4 11.7
Aug-93 Dec-93 2.4 1.9 1.4 1.0 0.7 0.4 13.2 12.2 11.2
Sep-93 Dec-93 2.4 1.9 1.3 1.1 0.7 0.4 14.2 13.2 12.0
92 Q4 Jun-93 0.9 0.9 0.9 -0.2 -0.2 -0.2 9.4 9.4 9.4
92 Q4 Aug-93 1.2 1.2 1.2 0.0 0.0 0.0 10.2 10.2 10.2
92 Q4 Dec-93 1.6 1.4 1.2 0.3 0.2 0.1 11.4 11.1 10.8
90 Q4 91 Q4 2.8 2.8 2.8 1.1 1.1 1.1 8.0 8.0 8.0
91 Q4 92 Q4 1.8 1.8 1.8 0.3 0.3 0.3 14.3 14.3 14.392 Q4 93 Q4 1.4 1.3 1.2 0.2 0.1 0.0 11.0 10.8 10.5
1.0 to 5.0 0.0 to 4.01993 Target Ranges:
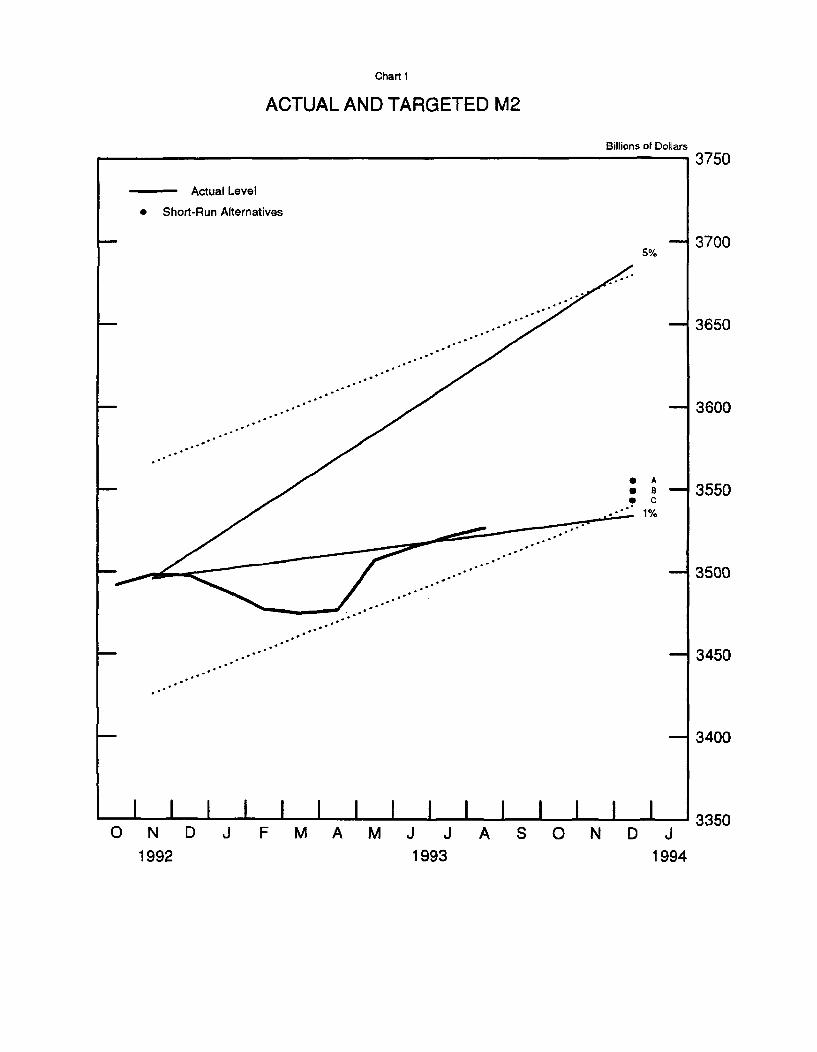
Chart 1
ACTUAL AND TARGETED M2
Billions of Dollars
- Actual Level
* Short-Run Alternatives
* A* B -* C
. 1%
ON D J F MA M J J A S ON D J1992 1993 1994
3750
3700
3650
3600
3550
3500
3450
3400
3350
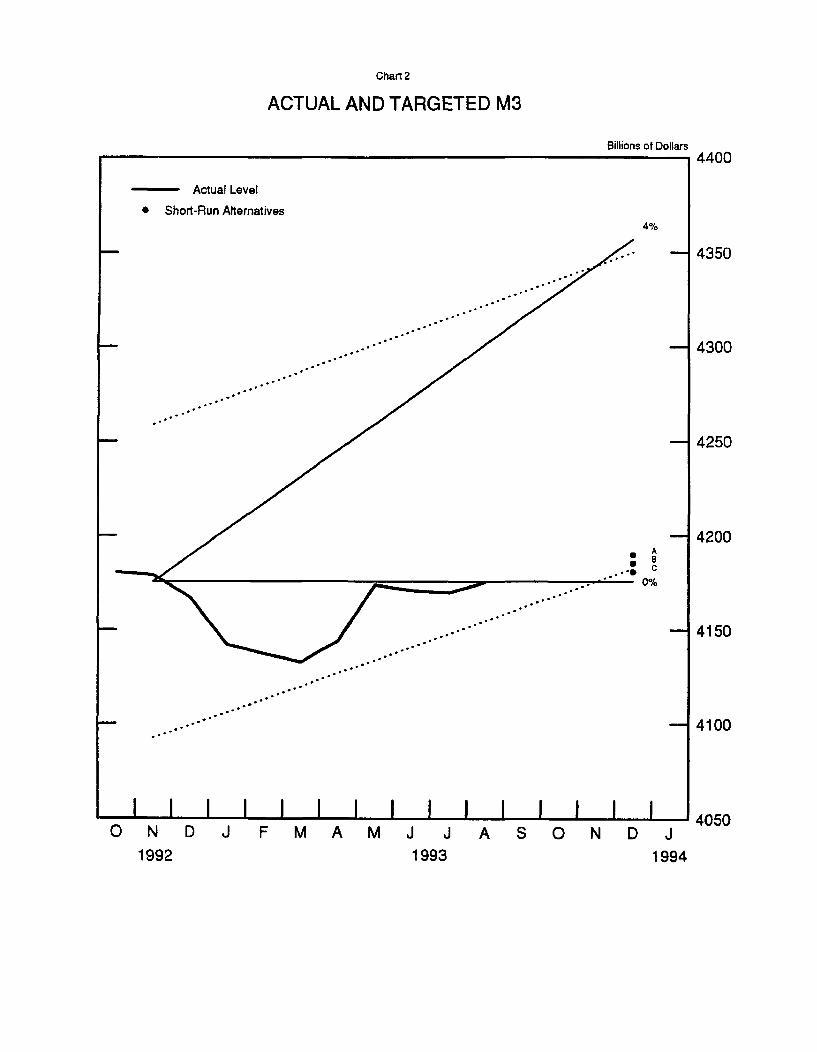
Chart 2
ACTUAL AND TARGETED M3
Billions of Dollars
- Actual Level
* Short-Run Alternatives
A
- 0%
4400
-- 4350
-- 4300
-- 4250
-- 4200
-44150
- 4100
1 1 1 1 1 1 1 1 1 1 1 1 1 I ION D J F MA M J J A S N D J
1992 1993 1994
4050I I I I I I I I I

Chart 3
M1
Billions of Dollars1200
- Actual Level 15%
* Short-Run Alternatives
1150
- .* - 1050
1000O N D J F M A M J J A S O N D J
1992 1993 1994
Billions of Dollars
- Actual Level
* Projected Level8%
12800
-- 12600
-- 12400
.. 4% - 12200
-( 12000
-1 11800
-- 11600
I I l l I l l l I l l I IO N D J F M A M J J A S O N D J
11400
Chart 4
DEBT
I I
1993 1994
-10-
annual range. Sluggish demand for bank loans is expected to hold down
banks' needs for funds. Moreover, the RTC, with new funding author-
ity, is expected to begin working down its backlog of resolutions in
coming months, leading to more rapid shrinkage of thrift institutions
and the substitution of Treasury financing for deposit financing to
carry acquired assets.
(10) Under alternative A, money market interest rates would
drop by the full 50 basis point decline in the federal funds rate.
The prime rate would also decrease by this amount. Intermediate-term
rates would fall appreciably, as expectations of the path of short-
term rates in the months ahead were revised down, and the dollar would
weaken on foreign exchange markets. Real long-term rates would move
lower as well, and the drop in interest and exchange rates would
provide additional stimulus to spending over time. The extent of the
decline in nominal bond rates, however, would depend importantly on
how the market interpreted the Committee's rationale for this action.
(11) This alternative might seem attractive if the Committee
saw the lack of progress toward full employment in the staff outlook
as unsatisfactory and was willing to settle for essentially no further
disinflation in this expansion; market perceptions that the Committee
had down-weighted its price stability objective could limit declines
in nominal long-term rates. Alternative A might also be chosen if the
Committee saw economic activity and inflation as possibly coming in
below the staff forecast; market perceptions that the Committee was
signalling an expectation that the outlook for real activity had
deteriorated and for disinflation had improved could result in sub-
stantial declines in bond yields. Although the longer-term effects of
lower interest rates on money demand may be uncertain, over the next
several months deposit rates would lag declines in market rates,
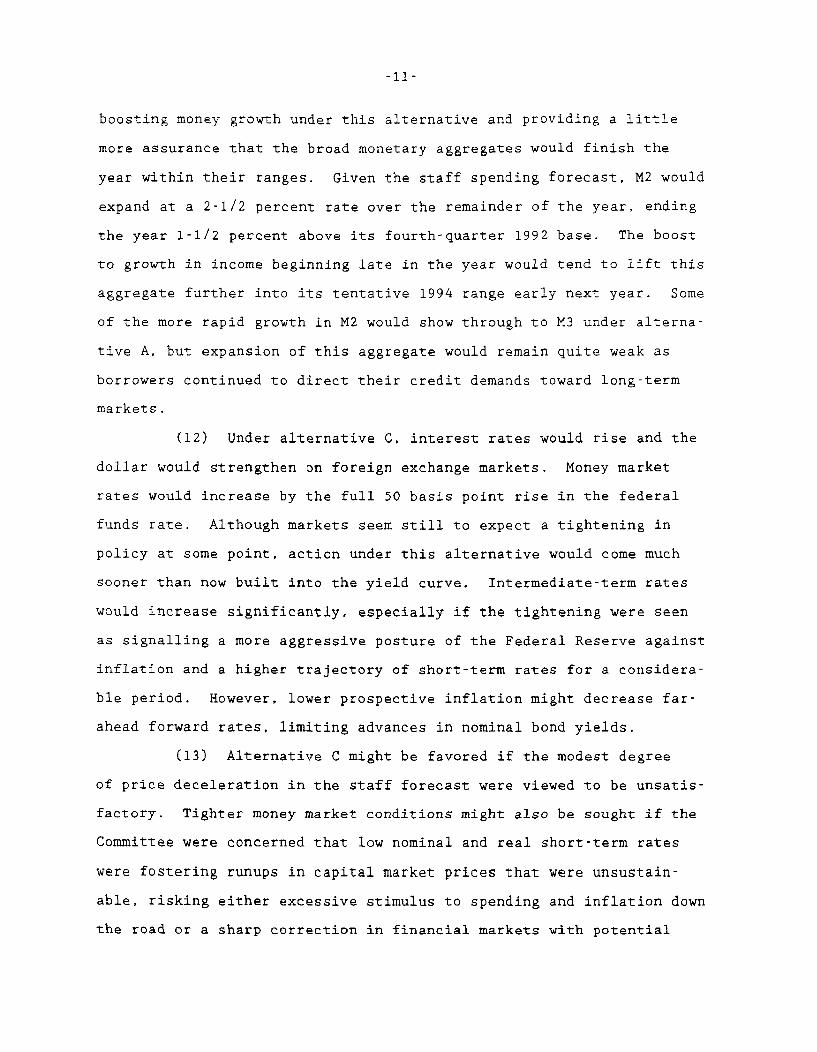
-11-
boosting money growth under this alternative and providing a little
more assurance that the broad monetary aggregates would finish the
year within their ranges. Given the staff spending forecast, M2 would
expand at a 2-1/2 percent rate over the remainder of the year, ending
the year 1-1/2 percent above its fourth-quarter 1992 base. The boost
to growth in income beginning late in the year would tend to lift this
aggregate further into its tentative 1994 range early next year. Some
of the more rapid growth in M2 would show through to M3 under alterna-
tive A, but expansion of this aggregate would remain quite weak as
borrowers continued to direct their credit demands toward long-term
markets.
(12) Under alternative C, interest rates would rise and the
dollar would strengthen on foreign exchange markets. Money market
rates would increase by the full 50 basis point rise in the federal
funds rate. Although markets seem still to expect a tightening in
policy at some point, action under this alternative would come much
sooner than now built into the yield curve. Intermediate-term rates
would increase significantly, especially if the tightening were seen
as signalling a more aggressive posture of the Federal Reserve against
inflation and a higher trajectory of short-term rates for a considera-
ble period. However, lower prospective inflation might decrease far-
ahead forward rates, limiting advances in nominal bond yields.
(13) Alternative C might be favored if the modest degree
of price deceleration in the staff forecast were viewed to be unsatis-
factory. Tighter money market conditions might also be sought if the
Committee were concerned that low nominal and real short-term rates
were fostering runups in capital market prices that were unsustain-
able, risking either excessive stimulus to spending and inflation down
the road or a sharp correction in financial markets with potential

-12-
systemic implications. M2 under this alternative is projected to grow
at a 1-1/2 percent rate over the final four months of the year,
restrained primarily by higher opportunity costs and less robust
mortgage refinancings. M2 growth could be faster than this if
declines in bond and stock prices prompted a reassessment of the
relative risks of deposits and capital market instruments. M3 would
expand at only a 1/2 percent rate over this period, held down in part
by sizable outflows from institution-only money market funds. These
growth rates would place both aggregates near the bottom of their
annual ranges for this year, and on a lower trajectory going into 1994
than under alternative B, partly reflecting damped income growth.
-13-
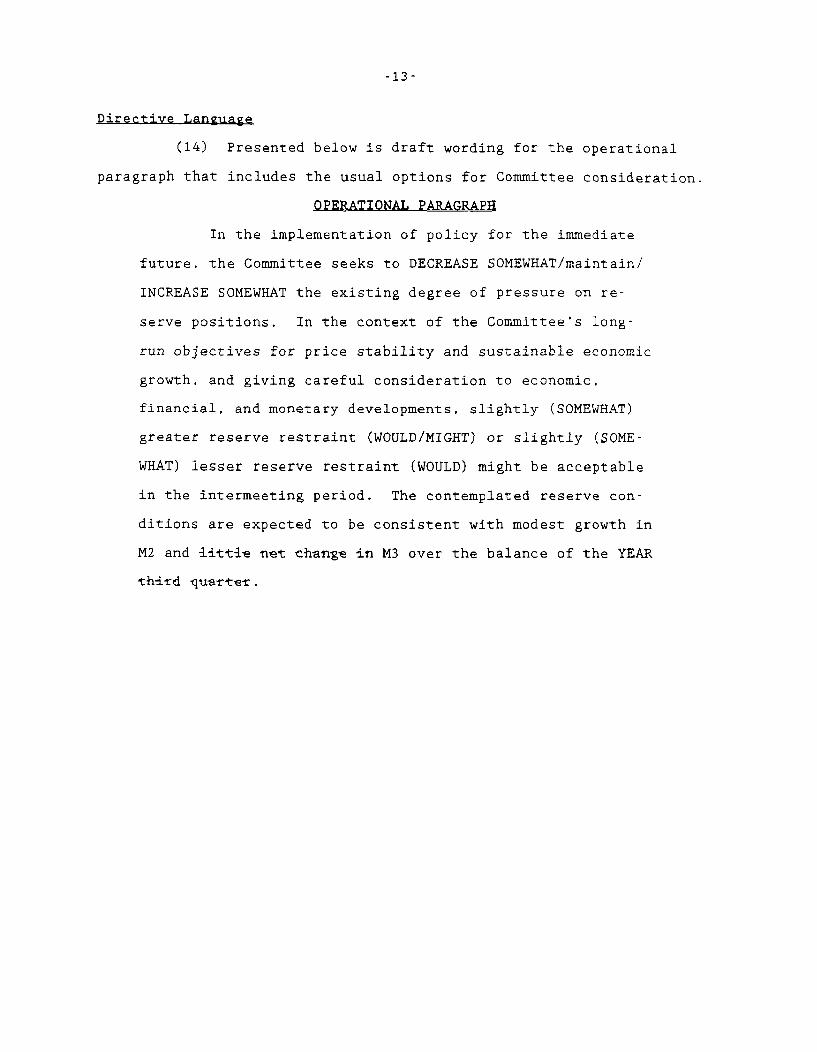
Directive Language
(14) Presented below is draft wording for the operational
paragraph that includes the usual options for Committee consideration.
OPERATIONAL PARAGRAPH
In the implementation of policy for the immediate
future, the Committee seeks to DECREASE SOMEWHAT/maintain/
INCREASE SOMEWHAT the existing degree of pressure on re-
serve positions. In the context of the Committee's long-
run objectives for price stability and sustainable economic
growth, and giving careful consideration to economic,
financial, and monetary developments, slightly (SOMEWHAT)
greater reserve restraint (WOULD/MIGHT) or slightly (SOME-
WHAT) lesser reserve restraint (WOULD) might be acceptable
in the intermeeting period. The contemplated reserve con-
ditions are expected to be consistent with modest growth in
M2 and [DEL: little net change in] M3 over the balance of the YEAR
[DEL: third quarter].
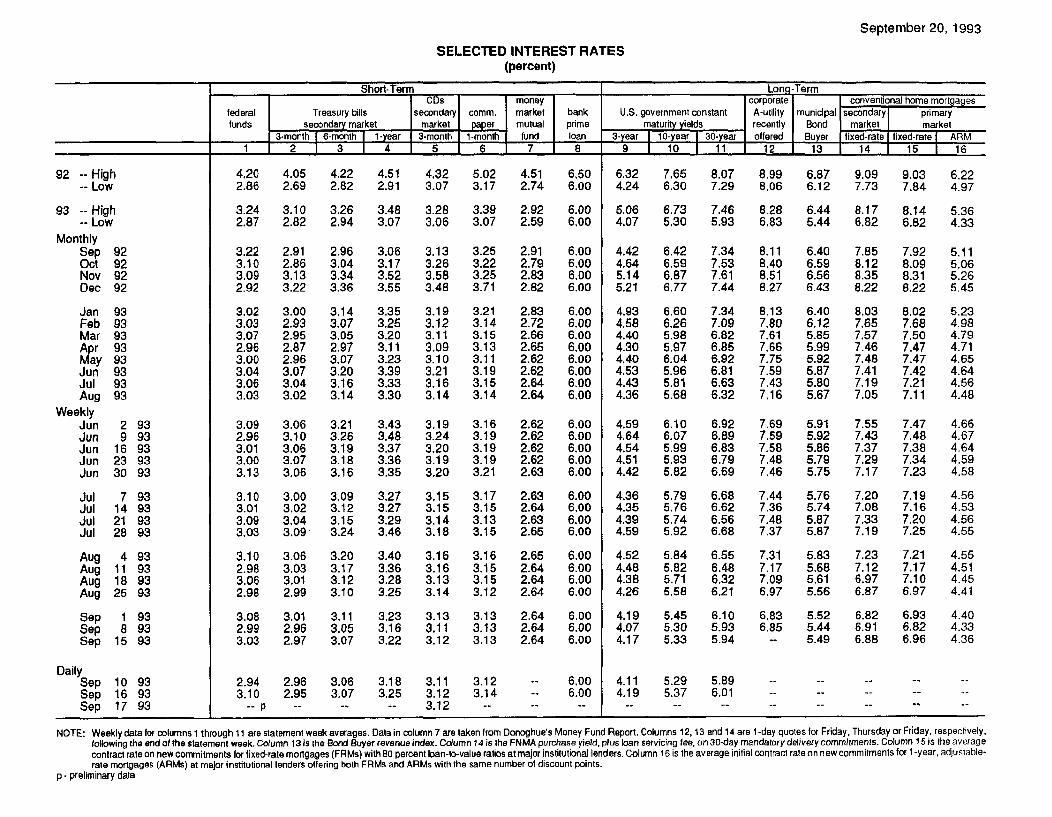
September 20, 1993
SELECTED INTEREST RATES(percent)
Short-Term Long-TermCDs money corporate conventional home mortgages
federal Treasury bills secondary comm. market bank U.S. government constant A-utility municipal secondary primaryfunds secondary market market paper mutual prime maturity yields recently Bond market market
3-month I 6-month I 1-year 3-month 1-month fund loan 3-year 10-year 30-year offered Buyer fixed-rate fixed-rate ARM1 2 3 4 5 6 7 8 9 10 11 12 13 14 15 16
92 -- High-- Low
93 -- High-- Low
MonthlySep 92Oct 92Nov 92Dec 92
Jan 93Feb 93Mar 93Apr 93May 93Jun 93Jul 93Aug 93
WeeklyJun 2 93Jun 9 93Jun 16 93Jun 23 93Jun 30 93
Jul 7 93Jul 14 93Jul 21 93Jul 28 93
Aug 4 93Aug 11 93Aug 18 93Aug 25 93
Sep 1 93Sep 8 93Sep 15 93
DailySep 10 93Sep 16 93Sep 17 93
4.20 4.05 4.22 4.51 4.32 5.02 4.51 6.502.86 2.69 2.82 2.91 3.07 3.17 2.74 6.00
3.24 3.10 3.26 3.48 3.28 3.39 2.92 6.002.87 2.82 2.94 3.07 3.06 3.07 2.59 6.00
3.22 2.91 2.96 3.06 3.13 3.25 2.91 6.003.10 2.86 3.04 3.17 3.26 3.22 2.79 6.003.09 3.13 3.34 3.52 3.58 3.25 2.83 6.002.92 3.22 3.36 3.55 3.48 3.71 2.82 6.00
3.02 3.00 3.14 3.35 3.19 3.21 2.83 6.003.03 2.93 3.07 3.25 3.12 3.14 2.72 6.003.07 2.95 3.05 3.20 3.11 3.15 2.66 6.002.96 2.87 2.97 3.11 3.09 3.13 2.65 6.003.00 2.96 3.07 3.23 3.10 3.11 2.62 6.003.04 3.07 3.20 3.39 3.21 3.19 2.62 6.003.06 3.04 3.16 3.33 3.16 3.15 2.64 6.003.03 3.02 3.14 3.30 3.14 3.14 2.64 6.00
3.09 3.06 3.21 3.43 3.19 3.16 2.62 6.002.96 3.10 3.26 3.48 3.24 3.19 2.62 6.003.01 3.06 3.19 3.37 3.20 3.19 2.62 6.003.00 3.07 3.18 3.36 3.19 3.19 2.62 6.003.13 3.06 3.16 3.35 3.20 3.21 2.63 6.00
3.10 3.00 3.09 3.27 3.15 3.17 2.63 6.003.01 3.02 3.12 3.27 3.15 3.15 2.64 6.003.09 3.04 3.15 3.29 3.14 3.13 2.63 6.003.03 3.09 3.24 3.46 3.18 3.15 2.65 6.00
3.10 3.06 3.20 3.40 3.16 3.16 2.65 6.002.98 3.03 3.17 3.36 3.16 3.15 2.64 6.003.06 3.01 3.12 3.28 3.13 3.15 2.64 6.002.98 2.99 3.10 3.25 3.14 3.12 2.64 6.00
3.08 3.01 3.11 3.23 3.13 3.13 2.64 6.002.99 2.96 3.05 3.16 3.11 3.13 2.64 6.003.03 2.97 3.07 3.22 3.12 3.13 2.64 6.00
2.94 2.96 3.06 3.18 3.11 3.123.10 2.95 3.07 3.25 3.12 3.14
-- p -- - - 3.12
6.006.00
--
6.32 7.65 8.07 8.99 6.874.24 6.30 7.29 8.06 6.12
5.06 6.73 7.46 8.28 6.444.07 5.30 5.93 6.83 5.44
4.42 6.42 7.34 8.11 6.404.64 6.59 7.53 8.40 6.595.14 6.87 7.61 8.51 6.565.21 6.77 7.44 8.27 6.43
4.93 6.60 7.34 8.13 6.404.58 6.26 7.09 7.80 6.124.40 5.98 6.82 7.61 5.854.30 5.97 6.85 7.66 5.994.40 6.04 6.92 7.75 5.924.53 5.96 6.81 7.59 5.874.43 5.81 6.63 7.43 5.804.36 5.68 6.32 7.16 5.67
4.59 6.10 6.92 7.69 5.914.64 6.07 6.89 7.59 5.924.54 5.99 6.83 7.58 5.864.51 5.93 6.79 7.48 5.794.42 5.82 6.69 7.46 5.75
4.36 5.79 6.68 7.44 5.764.35 5.76 6.62 7.36 5.744.39 5.74 6.56 7.48 5.874.59 5.92 6.68 7.37 5.87
4.52 5.84 6.55 7.31 5.834.48 5.82 6.48 7.17 5.684.38 5.71 6.32 7.09 5.614.26 5.58 6.21 6.97 5.56
4.19 5.45 6.10 6.83 5.524.07 5.30 5.93 6.85 5.444.17 5.33 5.94 -- 5.49
9.09 9.03 6.227.73 7.84 4.97
8.17 8.14 5.366.82 6.82 4.33
7.85 7.92 5.118.12 8.09 5.068.35 8.31 5.268.22 8.22 5.45
8.03 8.02 5.237.65 7.68 4.987.57 7.50 4.797.46 7.47 4.717.48 7.47 4.657.41 7.42 4.647.19 7.21 4.567.05 7.11 4.48
7.55 7.47 4.667.43 7.48 4.677.37 7.38 4.647.29 7.34 4.597.17 7.23 4.58
7.20 7.19 4.567.08 7.16 4.537.33 7.20 4.567.19 7.25 4.55
7.23 7.21 4.557.12 7.17 4.516.97 7.10 4.456.87 6.97 4.41
6.82 6.93 4.406.91 6.82 4.336.88 6.96 4.36
4.11 5.29 5.894.19 5.37 6.01
NOTE: Weekly data for columns 1 through 11 are statement week averages. Data in column 7 are taken from Donoghue's Money Fund Report. Columns 12, 13 and 14 are 1-day quotes for Friday, Thursday or Friday, respectively,following the end of the statement week. Column 13 is the Bond Buyer revenue index. Column 14 is the FNMA purchase yield, plus loan servicing fee, on 30-day mandatory delivery commitments. Column 15 is the averagecontract rate on new commitments for fixed-rate mortgages (FRMs) with 80 percent loan-to-value ratios at major institutional lenders. Column 16 is the average initial contract rate on new commitments for 1 -year, adjustable-rate mortgages (ARMs) at major institutional lenders offering both FRMs and ARMs with the same number of discount points.
p - preliminary data
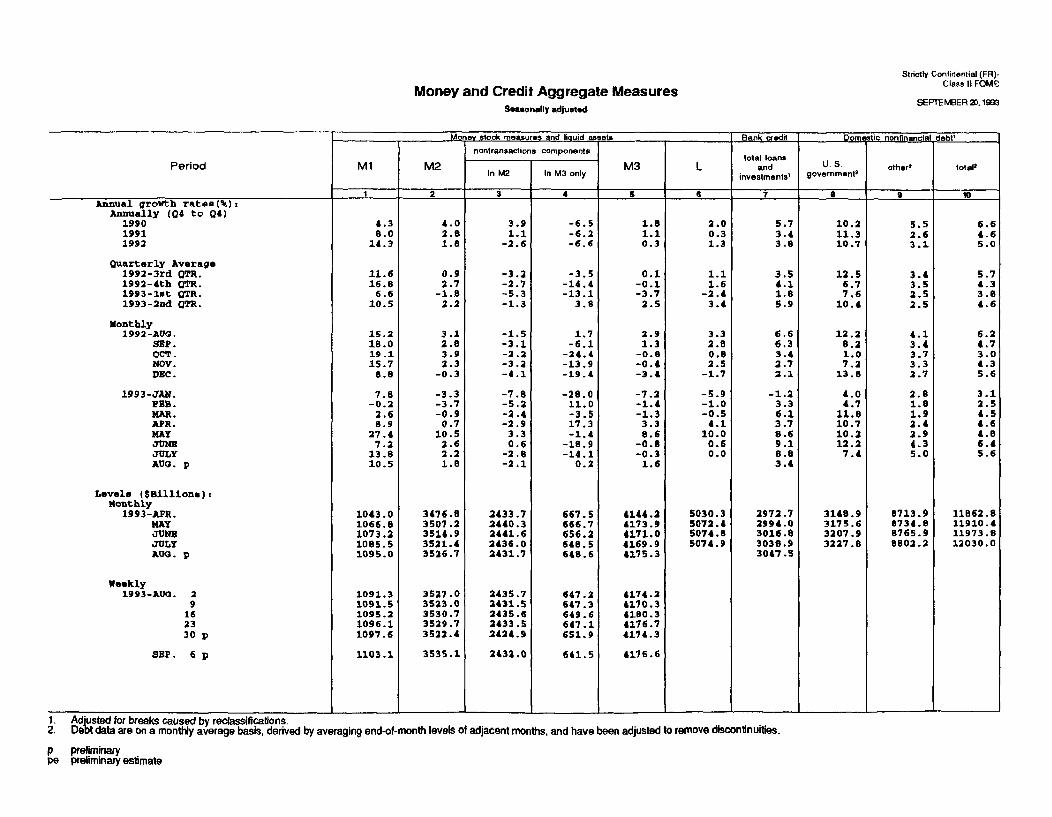
Strictly Confidential (FR).Class II FOMC
Money and Credit Aggregate Measures lasOMSeonlly adjusted SEPTEMER 20, 193
Sesonally adjusted
Money stock measures and liquid assets Bank credit Domestic nonfinancial debt'
nontransactions components tot loanstotal loans
Period M1 M2 M3 L and U. S. other totalIn M2 In M3 only investments' government
2
S2 3 4 S ~ 7 a 9Annual growth rates(%):
Annually (Q4 to Q4)1990 4.3 4.0 3.9 -6.5 1.8 2.0 5.7 10.2 5.5 6.61991 8.0 2.8 1.1 -6.2 1.1 0.3 3.4 11.3 2.6 4.61992 14.3 1.8 -2.6 -6.6 0.3 1.3 3.8 10.7 3.1 5.0
Quarterly Average1992-3rd QTR. 11.6 0.9 -3.2 -3.5 0.1 1.1 3.5 12.5 3.4 5.71992-4th QTR. 16.8 2.7 -2.7 -14.4 -0.1 1.6 4.1 6.7 3.5 4.31993-1st QTR. 6.6 -1.8 -5.3 -13.1 -3.7 -2.4 1.8 7.6 2.5 3.81993-2nd QTR. 10.5 2.2 -1.3 3.8 2.5 3.4 5.9 10.4 2.5 4.6
Monthly1992-AUG. 15.2 3.1 -1.5 1.7 2.9 3.3 6.6 12.2 4.1 6.2
SEP. 18.0 2.8 -3.1 -6.1 1.3 2.8 6.3 8.2 3.4 4.7OCT. 19.1 3.9 -2.2 -24.4 -0.8 0.8 3.4 1.0 3.7 3.0NOV. 15.7 2.3 -3.2 -13.9 -0.4 2.5 2.7 7.2 3.3 4.3DEC. 8.8 -0.3 -4.1 -19.4 -3.4 -1.7 2.1 13.8 2.7 5.6
1993-JAN. 7.8 -3.3 -7.8 -28.0 -7.2 -5.9 -1.2 4.0 2.8 3.1PBB. -0.2 -3.7 -5.2 11.0 -1.4 -1.0 3.3 4.7 1.8 2.5MAR. 2.6 -0.9 -2.4 -3.5 -1.3 -0.5 6.1 11.8 1.9 4.5APR. 8.9 0.7 -2.9 17.3 3.3 4.1 3.7 10.7 2.4 4.6MAY 27.4 10.5 3.3 -1.4 8.6 10.0 8.6 10.2 2.9 4.8JUNO 7.2 2.6 0.6 -18.9 -0.8 0.6 9.1 12.2 4.3 6.4JULY 13.8 2.2 -2.8 -14.1 -0.3 0.0 8.8 7.4 5.0 5.6AUG. p 10.5 1.8 -2.1 0.2 1.6 3.4
Levels ($Billions):Monthly
1993-APR. 1043.0 3476.8 2433.7 667.5 4144.2 5030.3 2972.7 3148.9 8713.9 11862.8MAY 1066.8 3507.2 2440.3 666.7 4173.9 5072.4 2994.0 3175.6 8734.8 11910.4JUNE 1073.2 3514.9 2441.6 656.2 4171.0 5074.8 3016.8 3207.9 8765.9 11973.8JULY 1085.5 3521.4 2436.0 648.5 4169.9 5074.9 3038.9 3227.8 8802.2 12030.0AUG. p 1095.0 3526.7 2431.7 648.6 4175.3 3047.5
Weekly1993-AUG. 2 1091.3 3527.0 2435.7 647.2 4174.2
9 1091.5 3523.0 2431.5 647.3 4170.316 1095.2 3530.7 2435.6 649.6 4180.323 1096.1 3529.7 2433.5 647.1 4176.730 p 1097.6 3522.4 2424.9 651.9 4174.3
SEP. 6 p 1103.1 3535.1 2432.0 641.5 4176.6
1. Adjusted for breaks caused by reclassifications.2. Debt data are on a monthly average basis, derived by averaging end-of-month levels of adjacent months, and have been adjusted to remove discontinuities.
p preliminarype preliminary estimate
Components of Money Stock and Related MeasuresSeasonay adjusted unle otherwise noted
Strictly Confidentila (FR)-Class II FOMC
SEPTEMBER 0. 1993
Period
Levels ($Bll1ons):Annually (4th gtr.)
199019911992
Monthly1992-AU0.
BBP.
OCT.NOV.DEC.
1993-JAN.FBB.MAR.
APR.MAYJUNE
JULTAUG. p
Currency Damanddeposits
Othercheckabledeposits
OvernightRPs and
Euro-dollarNSA'
Savingsdeposits'
Smalldenomi-nation
timedeposits
5
Money marketmutual funds
generapurpose Institutions
andbroker/ odealer
* I T I
Largedenon.-naliontime
deposilsI-a--
TermRP'sNSA'
---
TermEuro-
dollarsNSA'
1
Savingsbonds
Short-termTreasurysecurities
Commercial,WT'
Bankersacceplan-
oel
I_ I I _ 4 _ - I - -
245.4265.8290.0
282.4286.3
288.0289.8292.3
294.8296.9299.0
301.6304.0306.8
309.6312.5
277.7287.0338.8
322.5329.0
336.0339.5340.9
341.9341.9342.0
347.3359.1360.6
365.8370.8
293.1329.6380.2
362.8366.7
373.7381.6385.2
388.6386.4386.3
386.2395.5397.9
403.3403.9
78.8 919.873.4 1028.875.4 1179.0
76.574.4
75.775.874.8
73.374.174.5
72.770.073.9
76.378.6
1145.71158.9
1170.51180.41186.0
1184.41182.41178.8
1181.61193.71198.7
1200.11205.1
1171.61081.0883.8
926.9912.7
896.5881.7870.1
861.3856.1851.1
844.2837.4829.8
821.3814.2
348.2362.9344.1
348.9343.9
346.3343.7342.3
339.5333.6333.1
331.8336.8336.5
336.3334.5
131.5175.6207.5
220.9220.7
210.9209.2202.3
197.7201.9200.9
200.4202.8198.1
195.0193.3
496.8433.3361.9
378.1373.7
367.0361.3357.5
350.7346.3340.5
346.0345.9342.7
338.2338.4
93.674.780.5
75.877.6
79.681.480.6
79.782.185.7
88.889.792.8
96.496.1
68.060.747.0
51.449.4
48.147.245.6
43.647.050.4
49.850.547.6
44.045.4
125.2137.0154.5
147.4149.3
151.9154.7156.8
158.9161.1162.7
163.9164.8165.7
167.2
329.9319.4325.6
322.9321.0
320.2325.1331.6
337.1340.9338.0
337.4345.9350.3
349.7
356.2336.3369.6
355.7363.4
368.0372.4368.4
360.7355.9360.3
365.5368.3369.1
373.0
36.324.420.4
31.120.7
20.520.330.4
20.620.219.3
19.319.416.7
15.1
1. Net of money market mutual fund holdings of these items.2. Includes money market deposit accounts.3. Includes retail repurchase agreements. All IRA and Keogh accounts at commercial banks and thrift nstitutions are subtracted from small time deposits.4. Excludes IRA and Keogh accounts.5. Net of large denomination time deposits held by money market mutual funds, depository institutions, U.S. government, and foreign banks and official institutions.
p preliminary
1

September 17,1993
NET CHANGES IN SYSTEM HOLDINGS OF SECURITES 1
Millions of dollars, not seasonally adjusted
STRICTLY CONFIDENTIAL (FR)CLASS II-FOMC
Treasury bills Treasurycoupons Federal Net changeNet purchases 3 agencies outright
Period Net 2 Redemptions Net withn Redemptions Net redemptions holdingspurchases (-) change 1 ear 1-5 510 over 10 (.) Change ) total 4 Net RPs
199019911992
1992 ---Q1---Q2---Q3
---04
1993 ---Q1---Q2
1992 SeptemberOctoberNovemberDecember
1993 JanuaryFebruaryMarchAprilMayJuneJulyAugust
WeeklyJune 2
9162330
July 7142128
August 4111825
September 1815
Memo: LEVEL (bil. $)6September 15
17,44820,03813,086
-1,0004,415
8678,805
7,749
5954,0721,0643,669
13.04819,03811,486
-2,6004,415
8678.805
--- 7,749
5954,0721,0643,669
121349
7,280
902
2285,664
819420280
3792761431041063
2285,664
819420280
--
379276143104
1063
158.9
31
425 50,043 6,583,096 13,118
- 2,452285 2,193350 3,900461 4,572
279 1,441244 2,490
350 3,500200
461 4,172- 200
279244
100
100
211
191.5191.5
-100 -
1,280 3752,818 2,333
597 655945 731
1,276 947
716 7051,147 1,110
750 731
1,176 947100 ---
-- 375--- 11,282- 19,365
--- 2,452--- 3,730--- 5,927--- 7,256
--- 3,141--- 4,990
--- 5,332--- 200
6,756--- 300
1,4412,490
2001,100
200
650
250
2002,300..
3,1414,990
2001,800
300
1,150350200
4,026
320.175.0 22.5 31.1
13,24027,72630,219
-2337,8966,617
15,939
2,85112,648
5,8904,2727,8203,848
-103-85
3,0395,083
3087,258
-1662,577
2285,664
819420258
-19-298
-49300379
1,426368304
4,03663
11,128-1,614
-13,215
-14,6361,137
14,195-13,912
-46110,624
9,739-19,267
2,4252,929
-6,1284,788
879-5,5144,112
12,027-14,317
4,528
-7,245-5,4641,4589,6294,161
-6,769-2,7713,712
-9,9146,299
-1,1592,726
-4,8153,833
-3,2061.867
330.9 -5.8
1. Change from end-of-period to end-of-period. 4. Reflects net change in redemptions (-) of Treasury and agency securities.2. Outright transactions in market and with foreign accounts. 5. Includes change in RPs (+), matched sale-purchase transactions (-). and matched purchase sale transactions (+).3. Outright transactions in market and with foreign accounts, and short-term notes acquired 6. The levels of agency issues were as follows:in exchange for maturing bills. Excludes maturity shifts and rollovers of maturing issues. I ....
September 15
-mWihin1 year 1-5 5-10 over 10 total
1.9 2.2 0.6 0.1 4.8