Fomc 19790320 Blue Book 19790316
28
Prefatory Note The attached document represents the most complete and accurate version available based on original copies culled from the files of the FOMC Secretariat at the Board of Governors of the Federal Reserve System. This electronic document was created through a comprehensive digitization process which included identifying the best- preserved paper copies, scanning those copies, 1 and then making the scanned versions text-searchable. 2 Though a stringent quality assurance process was employed, some imperfections may remain. Please note that this document may contain occasional gaps in the text. These gaps are the result of a redaction process that removed information obtained on a confidential basis. All redacted passages are exempt from disclosure under applicable provisions of the Freedom of Information Act. 1 In some cases, original copies needed to be photocopied before being scanned into electronic format. All scanned images were deskewed (to remove the effects of printer- and scanner-introduced tilting) and lightly cleaned (to remove dark spots caused by staple holes, hole punches, and other blemishes caused after initial printing). 2 A two-step process was used. An advanced optimal character recognition computer program (OCR) first created electronic text from the document image. Where the OCR results were inconclusive, staff checked and corrected the text as necessary. Please note that the numbers and text in charts and tables were not reliably recognized by the OCR process and were not checked or corrected by staff.
-
Upload
fraser-federal-reserve-archive -
Category
Documents
-
view
226 -
download
3
Transcript of Fomc 19790320 Blue Book 19790316
Prefatory Note
The attached document represents the most complete and accurate version available based on original copies culled from the files of the FOMC Secretariat at the Board of Governors of the Federal Reserve System. This electronic document was created through a comprehensive digitization process which included identifying the best-preserved paper copies, scanning those copies,1 and then making the scanned versions text-searchable.2 Though a stringent quality assurance process was employed, some imperfections may remain.
Please note that this document may contain occasional gaps in the text. These gaps are the result of a redaction process that removed information obtained on a confidential basis. All redacted passages are exempt from disclosure under applicable provisions of the Freedom of Information Act.
1 In some cases, original copies needed to be photocopied before being scanned into electronic format. All scanned images were deskewed (to remove the effects of printer- and scanner-introduced tilting) and lightly cleaned (to remove dark spots caused by staple holes, hole punches, and other blemishes caused after initial printing). 2 A two-step process was used. An advanced optimal character recognition computer program (OCR) first created electronic text from the document image. Where the OCR results were inconclusive, staff checked and corrected the text as necessary. Please note that the numbers and text in charts and tables were not reliably recognized by the OCR process and were not checked or corrected by staff.
March 16, 1979Strictly Confidential (FR) Class I FOMC
MONETARY AGGREGATES ANDMONEY MARKET CONDITIONS
Prepared for the Federal Open Market Committee
By the staff Board of Governors of the Federal Reserve System

STRICTLY CONFIDENTIAL (FR) March 16, 1979
CLASS I - FOMC
MONETARY AGGREGATES ANDMONEY MARKET CONDITIONS
Recent developments
(1) M-1 declined further in February, at a 3¾ per cent annual
rate. Data for early March suggest a resumption of M-1 growth,
but for the February-March period growth is still projected at only a 1 per
cent annual rate, 2 percentage points below the low end of the range set by
the FOMC. Shifts of transactions balances to Automatic Transfer Service (ATS)
savings accounts and NOW accounts in New Yorkare estimated to be reducing
M-1 growth by about 2¼ percentage points during February and March, about
one percentage point less than the effect in each of the first three
months after the introduction of these accounts. After allowing for
this impact, M-1 continues to be much weaker than would be expected on
the basis of the continued rapid expansion of nominal GNP and the usual
lagged effect of higher interest rates. The persistence of this weakness
since last fall and collateral evidence of very sharp increases inclose
substitutes for money, such as money market mutual funds and repurchase
agreements, suggest that a downward adjustment in the public's demand
for money relative to income may be under way--similar to the adjustment
that took place in 1975-76 following the high interest rate levels reached
in 1974.

Comparison of FOMC Policy Ranges forFebruary-March
to Latest Staff Estimates
Ranges Latest Estimates
M-1 3 to 7 1.0
M-2 5 to 9 3.7
Federal funds rate (per Avg. for statementcent per annum) 10 or a bit higher week ending
Feb. 7 10.0614 10.1521 9.9728 10.06
Mar. 7 10.0714 10.21
(2) M-2 increased at a 2 per cent annual rate in February--
following its January decline--and is projected to grow at a 3¾ per
cent annual rate over February and March, also below the lower end of its
range. Despite the continued growth of ATS accounts, savings deposits
dropped sharply further in February. Money Market Certificates (MMCs),
on the other hand, continued to expand at a rapid pace, and growth in
the large time deposits included in M-2 strengthened. Deposits at savings
and loan associations and mutual savings banks expanded in February at
about a 9 per cent annual rate, roughly the same pace as recorded in each
of the preceding three months, as large sales of MMCs continued to offset
outflows from other account categories.
(3) Following a weak advance in December, commercial bank
credit in January-February expanded at about a 12½ per cent
annual rate, with business loan growth unusually strong. Banks financed
the expansion of earning assets during the two months in part by issuing
nearly $8 billion of large-denomination time deposits--only some of which
are included in M-2. Moreover, funds obtained from nondeposit sources

expanded about $8 billion--mainly Federal funds and RP's with nonbank
customers. Another estimated $5 billion of bank credit was financed from
foreign branch repayments of advances previously extended by domestic
head offices. Foreign branches obtained a portion of the funds for these
repayments from increased Eurodollar deposits of U.S. residents and perhaps
others as confidence in the stability of the dollar on exchange markets
increased and the relatively high Eurodollar interest rates became
attractive to investors active in international money markets.
(4) The Trading Desk has continued to maintain a Federal
funds rate of 10 per cent or a bit higher since the February FOMC meeting.
On March 2, as incoming data suggested that growth in both M-1 and M-2
over February-March would likely be at rates below the Committee's ranges,
the FOMC held a telephone meeting to determine whether supplementary
instructions were required. In light of contradictory evidence on under-
lying trends in the economy following the economy's strong performance
in the fourth quarter of 1978, the FOMC decided that the funds rate
objective should remain unchanged.
(5) Nonborrowed reserves are expected to decline at about an
8¼ per cent annual rate over the February-March period, as a sharp decrease
in February is projected to be only partly offset by modest growth in
March. This contraction reflects mainly the decline of demand deposits
from mid-January through late February. As in January, member bank
borrowing at the discount window averaged about $1 billion in February,
and is expected to continue at close to this level in March. Thus, the
growth in total reserves over February and March is expected to be
similar to that for nonborrowed reserves. Given the decline in total
reserves over February-March, the monetary base is expected to expand

at only a 3 3/4 per cent annual rate, even though the currency component is
projected to grow at a 9 3/4 per cent annual rate over the period.
(6) Short-term interest rates have generally risen about 5 to
25 basis points and bond yields about 10 to 20 basis points since the
February FOMC meeting. With economic activity continuing to expand
and the rise in prices accelerating, some market participants appear
to have concluded that the probability of a further tightening in
monetary policy over the near-term has increased, despite the weak
performance of the aggregates. Nonetheless, most short-term rates
remain below levels reached around the turn of the year. Rates on
shorter-dated Treasury bills provide the main exception to this pattern,
as they have moved up to their highest level of the current expansion,
partly in response to sizable bill sales by foreign official institutions
and Treasury issuance of cash management bills. Treasury and corporate
bond yields also reached new highs for the current expansion during the
intermeeting period. Rates on primary mortgages have remained essentially
unchanged since year end.
(7) The dollar has been quite firm in the exchange markets
since the last FOMC meeting.
the U.S. has sold large amount of dollars to
acquire marks and Swiss francs to repay swap debt. In addition, the Desk
has added modestly to foreign currency balances, particularly yen. From
February 6 to March 16 the System purchased about $1 billion equivalent of
foreign currencies and the Treasury about $750 million equivalent.

-5-
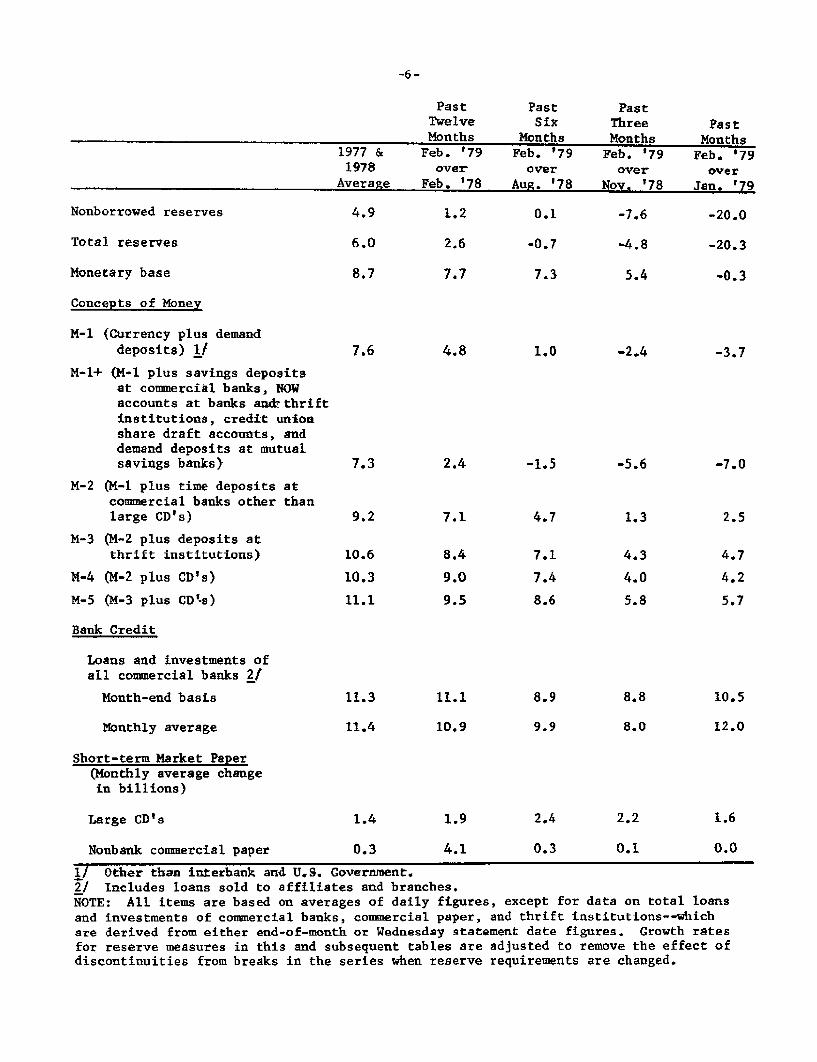
(8) The table on the next page shows percentage annual rates
of change in related monetary and financial flows over various time
periods.
Past Past PastTwelve Six Three PastMonths Months Months Months
1977 & Feb. '79 Feb. '79 Feb. '79 Feb. '791978 over over over over
Average Feb. '78 Aug. '78 Nov. '78 Jan. '79
Nonborrowed reserves 4.9 1.2 0.1 -7.6 -20.0
Total reserves 6.0 2.6 -0.7 -4.8 -20.3
Monetary base 8.7 7.7 7.3 5.4 -0.3
Concepts of Money
M-l (Currency plus demanddeposits) 1f 7.6 4.8 1.0 -2.4 -3.7
M-1+ (M-1 plus savings depositsat commercial banks, NOWaccounts at banks and thriftinstitutions, credit unionshare draft accounts, anddemand deposits at mutualsavings banks) 7.3 2.4 -1.5 -5.6 -7.0
M-2 (M-1 plus time deposits atcommercial banks other thanlarge CD's) 9.2 7.1 4.7 1.3 2.5
M-3 (M-2 plus deposits atthrift institutions) 10.6 8.4 7.1 4.3 4.7
M-4 (M-2 plus CD's) 10.3 9.0 7.4 4.0 4.2
M-5 (M-3 plus CDts) 11.1 9.5 8.6 5.8 5.7
Bank Credit
Loans and investments ofall commercial banks 2/
Month-end basis 11.3 11.1 8.9 8.8 10.5
Monthly average 11.4 10.9 9.9 8.0 12.0
Short-term Market Paper(Monthly average changein billions)
Large CD's 1.4 1.9 2.4 2.2 1.6
Nonbank commercial paper 0.3 4.1 0.3 0.1 0.0
1/ Other than interbank and U.S. Government.2/ Includes loans sold to affiliates and branches.NOTE: All items are based on averages of daily figures, except for data on total loansand investments of commercial banks, commercial paper, and thrift institutions--whichare derived from either end-of-month or Wednesday statement date figures. Growth ratesfor reserve measures in this and subsequent tables are adjusted to remove the effect ofdiscontinuities from breaks in the series when reserve requirements are changed.

Prospective developments
(9) Shown below for Committee consideration are three alternative
specifications for the monetary aggregates and the Federal funds rate for
the March-April period. Alternative B calls for no near-term change in
the Federal funds rate, while alternatives A and C, respectively, would ease
and increase restraint in coming weeks. (More detailed and longer-term
data are contained in the tables on pp. 8 and 9.)
Alt. A Alt. B Alt. C
Ranges for March-April
M-1 4½ to 9½ 4 to 9 3½ to 8½
M-2 4 to 8 3½ to 7½ 3 to 7
Federal funds rate 9¼ to 10 9¾ to 10½ 10¼ to 11(intermeeting period)
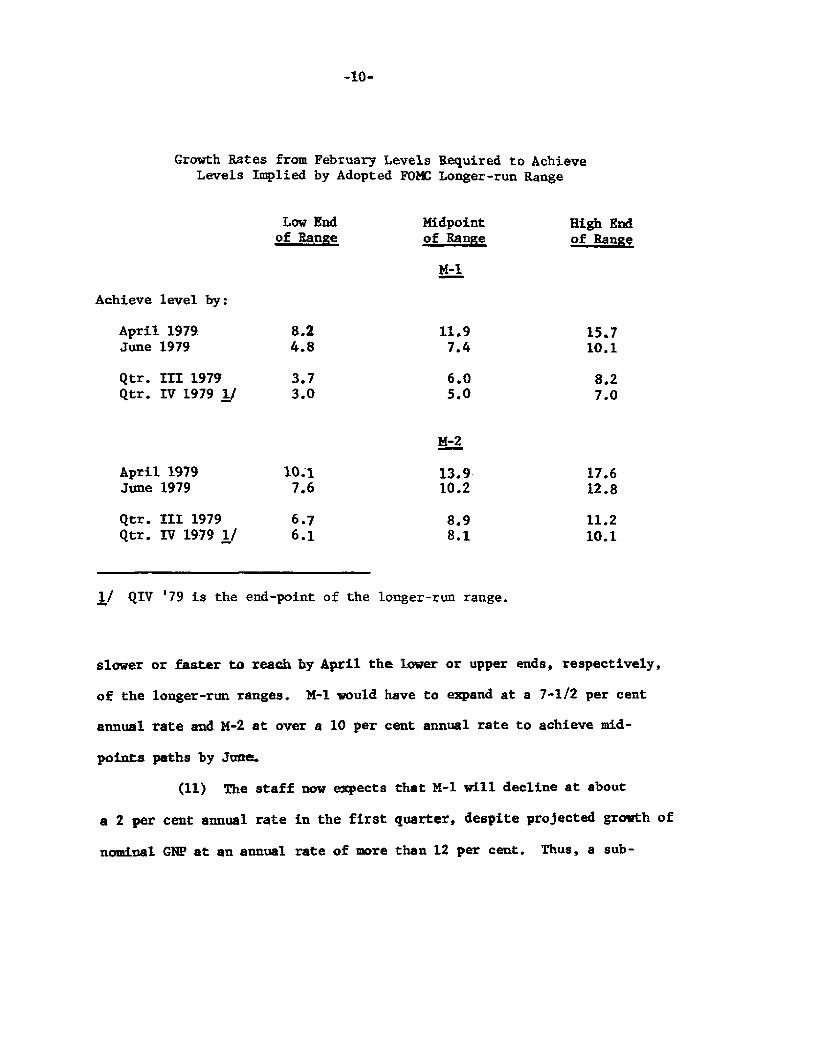
(10) The table on page 10 shows the growth rates for the
aggregates that would be required to reach levels in April and June
implied by the longer-run ranges adopted by the FOMC in February. To
reach levels in April that are on the midpoint paths of the longer-run QIV '78
to QIV '79 ranges, M-1 would have to expand at about a 12 per cent annual rate
from February and M-2 at a 14 per cent annual rate, as shown in the middle
column of the table. Growth for M-1 would have to be about 3¾ percentage points

Alternative Levels and Growth Rates for Key Monetary Aggregates
M-1 1/-
Alt. A Alt. B Alt. C Alt A Alt. B Alt. C
1979 FebruaryMarchApril
1978 QIV
1979 QIQIIQIIIQIV
Growth RatesMonthly:
1979 MarchApril
Quarterly Average:
1979 QIQIIQIIIQIv
Semi-Annual:
QIV '78-QII '79QII '79-QIV '79
Annual:
QIV '78-QIV '79
/ The staff has assumed that over the longer-run policy period from QIVgrowth will be reduced by a little qnder 3 percentage points by ATS.
'78 to QIV '79 M-1
M-2
358.8360.6362.9
361.4
359.8365.0369.7373.1
358.8360.5362.6
361.4
359.7364.4369.0373.1
358.8360.4362.3
361.4
359.7364.0368.5373.1
877.2881.1886.2
873.8
877.9891.7907.2921.9
877.2880.8885.4
873.8
877.8890.4905.5921.7
877.2880.4884.7
873.8
877.7889.4904.2921.5
6.07.7
5.46.3
5.36.9
-1.85.85.23.7
-1.95.25.04.4
-1.94.84.95.0
1.96.37.06.5
4.45.9
1.85.36.77.7
2.04.4

Alternative Levels and Growth Rates for Key Monetary Aggregates (cont'd)
M-3 Bank Credit
Alt. A Alt. B Alt. C Alt. A Alt. B Alt. C
1979 February 1510.0 1510.0 1510.0 991.2 991.2 991.2March 1518.2 1517.8 1517.4 999.2 999.2 999.2April 1527.4 1526.4 1525.5 1007.6 1007.4 1007.2
1978 QIV 1493.3 1493.3 1493.3 967.2 967.2 967.2
1979 QI 1510.8 1510.6 1510.5 990.6 990.6 990.6QII 1536.6 1534.9 1533.5 1015.9 1015.4 1014.9QIII 1562.8 1560.5 1558.5 1040.8 1039.8 1038.5QIV 1588.3 1587.9 1587.3 1064.7 1062.9 1059.8
Growth RatesMonthly:
1979 March 6.5 6.2 5.9 9.7 9.7 9.7April 7.3 6.8 6.4 10.1 9.8 9.6
Quarterly Average:
1979 QI 4.7 4.6 4.6 9.7 9.7 9.7QII 6.8 6.4 6.1 10.2 10.0 9.8QIII 6.8 6.7 6.5 9.8 9.6 9.3QIV 6.5 7.0 7.4 9.2 8.9 8.2
Semi-Annual:
QIV '78-QII '79 5.8 5.6 5.4 10.1 10.0 9.9QII '79-QIV '79 6.7 6.9 7.0 9.6 9.4 8.8
Annual:
10.1 9.9 9.6QIV '78-QIV '79 6.4 6.3 6.3
-10-
Growth Rates from February Levels Required to AchieveLevels Implied by Adopted FOMC Longer-run Range
Low End Midpoint High Endof Range of Range of Range
M-1
Achieve level by:
April 1979 8.2 11.9 15.7June 1979 4.8 7.4 10.1
Qtr. mlI 1979 3.7 6.0 8.2Qtr. IV 1979 I/ 3.0 5.0 7.0
M-2
April 1979 10.1 13.9 17.6June 1979 7.6 10.2 12.8
Qtr. III 1979 6.7 8.9 11.2Qtr. IV 1979 1/ 6.1 8.1 10.1
j/ QIV '79 is the end-point of the longer-run range.
slower or faster to reach by April the lower or upper ends, respectively,
of the longer-run ranges. M-1 would have to expand at a 7-1/2 per cent
annual rate and M-2 at over a 10 per cent annual rate to achieve mid-
points paths by June.
(11) The staff now expects that M-1 will decline at about
a 2 per cent annual rate in the first quarter, despite projected growth of
nominal GNP at an annual rate of more than 12 per cent. Thus, a sub-

-11-
stantial increase in V-1, at about a 14 per cent annual rate,
is implied for the current quarter, as shown in Appendix II. About
3 percentage points of this increase can be explained by shifts of demand
deposits to ATS and NOW accounts, and another few percentage points by the
usual lagged effects of higher interest rates on money demand. But there
is also a large unexplained residual, and, as noted in paragraph (1), it
appears to the staff that this residual may to a great extent reflect a
downward shift in money demand relative to income.
(12) The strength and duration of such a shift in money demand
is most difficult to estimate while it is in process. The downward shift
that began in late 1974 seems to have lasted for a little over two years,
and may have reduced M-1 growth by as much as 5 percentage points at an
annual rate in the early part of the period and 3 percentage points later
(based on experience with the money demand equation in the Board's quarterly
econometric model). With the public having economized on cash balances
to such a great extent only a few years ago, we are projecting that the
present shift may not be as large nor last as long. Thus, we have--again--
projected a resumption of M-1 growth for the policy period immediately
ahead.
(13) Under alternative B, with the funds rate remaining un-
changed from the currently prevailing level of 10 per cent or a little
higher, given the staff's GNP projection, we expect M-1 to increase
over the March-April period in a range centered on a 4 to 9 per cent
annual rate range. With growth at the midpoint of this range, the level
of M-l in April would be below the low end of the path implied by the
Committee's current longer-run range. Growth at the 9 per cent upper end

-12-
of the alternative B short-run range, would bring M-1 to a level in
April just above the low end of the Committee's longer-run range, as
shown in the chart on the next page.
(14) Under alternative B, M-2 is expected to expand in a 3 to
7 per cent annual rate range in March-April, considerably above its
recent rate of growth. Most of the acceleration reflects the projected
strengthening of M-1, but the interest-bearing component of M-2 is
expected to rise a little faster than it has, on average, over the past
few months. Commercial banks can be expected to benefit to some extent
from the elimination of the rate ceiling differential on MMCs, effective
mid-March, and the unusually rapid outflow of savings deposits of recent
months is expected to diminish. However, as shown in the chart on the
following page, even growth in M-2 at the upper end of the alternative B
range would leave the level of this aggregate in April below the lower end
of the path implied by the Committee's longer-run range.
(15) It is estimated that the mid-March regulatory changes that
reduced the effective interest rates on MMCs offered by thrifts by about
50 basis points could slow their total deposit inflows by roughly 2
percentage points, at an annual rate. Thrifts are thus likely to have to
reduce their liquidity and borrow more from the FHLBanks and other sources
to finance mortgage lending. They may also limit their new commitment
activity further over the near-term as they reevaluate their prospective
deposit inflows. Such a slowing of thrift deposit flows suggests that
the level of M-3 in April will remain below the lower limit of the path
traced by its longer-run growth rate range.

-13-
Growth Ranges and Actual M-1, M-2, M-3, and Bank Credit
M-1 Billions of d
Alt. B. Range ---
. .- 4'/%
..-- "" Q4 '78-Q4 79
--- - **- a- 1 Y2%- i I . 9% - --.... - --- -
D J F M A M J J1979
A S 0 N 0
ollars385
380
375
370
365
360
355
950
930
910
890
870
1640
1600
1560
1520
1480
1080
1060
1040
1020
1000
980
960
M-2
,8%
Q4 '78-Q4 '79
Q4 '78-Q4 '79
3ANK CREDIT
, 102%
'-" Q4 '78--4 '79
1 ,-.'"' ..- 7% -
.. % ,~ % ^ -[ 1 I I I I ---~~~~~~~~ a-a-
>' ! %-''"""'""
0 N1978

-14-
(16) If, as projected, the monetary aggregates strengthen in
March-April, market expectations of a near-term tightening of monetary
policy may themselves lead to some upward pressures on short-term interest
rates. In addition, the Treasury market may have to absorb further bill
sales by foreign accounts, and the Treasury may have to offer a sizable
amount of cash management bills to cover cash drains prior to the mid-
April tax date. Rate pressures could be intensified if banks increase
the pace of their CD offerings, which they might well do if bank
credit demands remain strong, availability of corporate RP money declines
as the April tax date approaches, or the return flow of funds from their
branches abroad diminishes. Any tendency for short-term rates to rise,
however, would be blunted by stability of the funds rate at near current
levels, as contemplated under alternative B. The dollar may well continue
to trade around current levels in the exchange markets over the next few
weeks, accompanied by continuation of some central bank net sales of
dollars.
(17) Under alternative B, bond yields can be expected to fluctuate
in a fairly narrow range. The volume of oncoming supplies in the municipal
market is likely to rise from the recent pace, but the corporate new
issue calendar remains quite modest. Moreover, the Treasury is entering
a period of seasonally light coupon financing activity. It is expected
to raise about $2 billion of new money in early April through sale of a
15-year bond (or perhaps a 5-year note), but thereafter it is expected
to borrow only about $1 billion of additional new money in the coupon
market until June. While there appears to be little reason to expect any
significant rise in bond market rates under alternative B, the projected
slowing of deposit flows at thrift institutions suggests that primary
mortgage yields may edge higher in coming weeks.

-15-
(18) Under alternative C, the Federal funds rate would rise
to the midpoint of a 10-1/4 to 11 per cent range. Growth in M-1 and
M-2 would likely be in annual rate ranges of 3-1/2 to 8-1/2 per cent
and 3 to 7 per cent, respectively. A tightening action at this time,
while widely discussed by financial market participants in recent weeks,
does not appear to have been fully discounted, and thus market interest
rates would be expected to move up rather significantly in both long-
and short-term markets, with the increases greatest in the short-term
area.
(19) A firming policy action at this time could lead to a
further strengthening of the dollar. This would probably be reflected
mainly in larger central bank net sales of dollars and would also pro-
vide greater opportunities to reduce outstanding Federal Reserve swap
debt. Such developments would, in domestic markets, tend to raise
shorter-dated Treasury bill rates further relative to other short-term
interest rates and, if foreign official institutions continued to liquidate
their holdings of nonmarketable Treasury issues, increase Treasury borrow-
ing in domestic markets.
(20) Alternative A involves a decline in the funds rate over the
intermeeting period to the midpoint of a 9-1/4 to 10 per cent range.
Market rates would likely respond initially to this action by declining
from current levels. Thereafter, however, if the monetary aggregates
continue to rise as projected, and incoming data confirm the staff's
economic forecast, the decline of interest rates might begin to be
reversed. A decline in the funds rate would probably induce some downward
pressure on the international exchange value of the dollar.

-16-
(21) Over the QIV '78-QIV '79 period as a whole, the staff
still expects little net change in the Federal funds rate, given M-1
growth a shade above the middle of the Committee's 1½ to 4½ per cent
1/range.- The funds rate might drift upward between now and mid-year
under alternative B and would, of course, more surely rise under
alternative C. But interest rates might tend to decline somewhat
in the latter half of the year, especially under alternative C, as the
rate of growth in nominal GNP decelerates further. Under alternative A,
however, we would expect interest rates to rise later in the year to
offset the stimulative effect on the aggregates of the easing in market
conditions assumed for the weeks ahead if M-1 growth over the year is to
be near the middle of the 1½ to 4½ per cent range. The projected
interest rate paths are shown in appendix I. All paths assume a down-
ward shift in money demand (in addition to ATS effects) on the order of
2 to 2½ percentage points for the year.
1/ Assuming, on the basis of recent evidence, that ATS shifts reduce M-1
growth by a little less than 3 percentage points.

-17-
Directive language
(22) Given below are suggested operational paragraphs
for the directive in the customary form. Alternative language consistent
with the short-run specifications of the alternatives discussed in the
preceding section is shown for the Committee's objective for the Federal
funds rate early in the period. At a later point, alternative language
is also provided for placing main emphasis either on monetary aggregates
or on money market conditions. The language and specifications adopted
last month are shown in strike-through form.
In the short run, the Committee seeks to achieve bank reserve
and money market conditions that are broadly consistent with the
longer-run ranges for monetary aggregates cited above, while
giving due regard to the program for supporting the foreign
exchange value of the dollar and to developing conditions in
domestic financial markets. Early in the period before the next
regular meeting, System open market operations are to be directed
at [DEL: maintaining the] ATTAINING A weekly average Federal funds rate
(A) SLIGHTLY BELOW THE CURRENT LEVEL.(B) at about the current level.(C) SLIGHTLY ABOVE THE CURRENT LEVEL.
[DEL: provided that over the February-March period the annual rates of
growth of M-1 and M-2, given approxiimately equal weight, appear
to be within ranges of 3 to 7 per cent and 5 to 9 per cent,
respectively. If growth of M-1 and M-2 for the 2 month period
appears to be outside the indicated limits, the Manager will
promptlly notify the Chairman, who will then consult with the
Commmittee to determine whether the situation calls for
supplementary instructions.]
-18-
SUBSEQUENTLY, OPERATIONS SHALL BE DIRECTED AT-MAINTAINING THE
WEEKLY AVERAGE FEDERAL FUNDS RATE WITHIN THE RANGE OF TO
PER CENT. IN DECIDING ON THE SPECIFIC OBJECTIVE FOR THE
FEDERAL FUNDS RATE THE MANAGER SHALL BE GUIDED MAINLY BY THE
RELATIONSHIP BETWEEN THE LATEST ESTIMATES OF ANNUAL RATES OF
GROWTH IN THE MARCH-APRIL PERIOD OF M-1 AND M-2 AND THE FOLLOWING
RANGES OF TOLERANCE: TO PER CENT FOR M-1 AND TO
PER CENT FOR M-2. IF, WITH APPROXIMATELY EQUAL WEIGHT
GIVEN TO M-1 AND M-2, THEIR RATES OF GROWTH APPEAR TO BE
Monetary aggregates emphasis
SIGNIFICANTLY ABOVE OR BELOW THE MIDPOINTS
Money market emphasis
CLOSE TO OR BEYOND THE UPPER OR LOWER LIMITS OF THE
INDICATED RANGES, THE OBJECTIVE FOR THE FUNDS RATE IS TO BE
RAISED OR LOWERED IN AN ORDERLY FASHION WITHIN ITS RANGE.
IF THE RATES OF GROWTH IN THE AGGREGATES APPEAR TO BE
FALLING ABOVE THE UPPER LIMIT OR BELOW THE LOWER LIMIT OF THE
INDICATED RANGES AT A TIME WHEN THE OBJECTIVE FOR THE FUNDS RATE
HAS ALREADY BEEN MOVED TO THE CORRESPONDING LIMIT OF ITS
RANGE, THE MANAGER WILL PROMPTLY NOTIFY THE CHAIRMAN, WHO WILL
THEN DECIDE WHETHER THE SITUATION CALLS FOR SUPPLEMENTARY
INSTRUCTIONS FROM THE COMMITTEE.

APPENDIX I
Projected Federal Funds Rate
Alt. A
9-7/8 to 10
9½ to 10
9¾ to 10¾
10 to 11
Alt. B
10 to 10-1/8
10 to 10½
9¾ to 10¾
9½ to 10½
1979--QI
QII
QIII
QIV
Alt. C
10 to 10¾
10½ to 11
9¾ to 10¾
9 to 10

APPENDIX II
Implied Velocity Growth Rates
Alt. A Alt. B
v-1 (GNP/M-1)
1978--I1IV
1.29.5 (8.5)
1979--1IIIIIIV
V-2 (GNP/M-2)
1978--111IV
1979--1IIIIIIV
13.74.2.2.85.1
-0.66.1
10.03.70.92.3
1.29.5
(10.6)(1.5)(0.2)(2.7)
13.94.72.84.3
(8.5)
(10.8)(2.0)(0.3)(2.0)
1.29.5 (8.5)
13.95.22.93.8
-0.66.1
10.04.31.11.7
(10.8)(2.5)(0.4)(1.4)
-0.66.1
10.14.6
1,2(w
Note: Figures in parentheses reflect V-I without ATS.
Alt. C

MAR. 16, 1979Table 1
Money and Credit Aggregate Measures
Bank Reserves kCd Money Stock Measures
TotalPeriod Non- Monetary Loans
Total borrowed Base and M-1 M-l 2 M-3 M-4 M-5 M-6 M-7
invest-ments
1 2 3 4 5 6 9 10 11 '12
ANNUALLY%
197619771978
SEMI-ANNUALLY:
2ND HALF 1977
1ST HALF 19782ND HALF 1978
QUARTERLY:
1ST QTR. 19782ND QTR. 19783RD OTR. 19784TH QTR. 1978
QUARTERLY-AV:
1ST QTR. 19782NO QTR. 19783RD QTR. 19784TH OTR. 1978
MONTHLY:
1978--FEB.MAR.APR.MAYJUNEJULYAUG.SEPT.OCT.NOV.DEC.
1979--JAN.FEB. P
0.65.36.6
6.9
7.65.5
6.610.4
6.20.5
8.96.28.62.3
7,1-1,2
q,31,011.614.8-5.08.65.1
-3.6-0.1
6.0-20.3
0.83.06.7
3.0
7.65.6
9.32.76.72.4
14.50.66.64.6
9.6-2.91.3-8.915.68.50.211.3-1.213.4-4.9
2.2-20.0
6.78.39.1
9.2
8.89.0
8.79.09.87.3
9.97.69.38.4
9.13.17.810.58.6
10.65.2
13.4
5.77.9
8.6-0.3
8.011.3
1..79,A
10.417.08,.S,9
10.114.910.87.7
8.57.9
19.916.613.711.0
5.19.79.86.71.1
14.810.5
PER CENT ANNUAL RATES OF GROWTH)
I I I5.87.97.3
8.1
8.06.3
5,310,89.80.4
t-,
4.4
1.82.8
16.49.76.26.88.5
13.81.7
-2.01.7
-5.3-3.7
12.69.3'.3
7.5
6.24.2
4.18,67,5
-2,0
5.07.26.02.4
1.52.3
12.18.45.22.97.0
12.30.6
-5.1-1.6
-8.2-7.0
10.99.8a.b
941
7.78.9
6.59.7
11.24.7
7.08.49.97.7
5.04.7
11.29.28.58.7
11.613.06.54.72.7
-1.22.5
12.711.7
9.4
11.1
8.310.0
7.69.4
11.67.0
8.18.4
10.49.3
6.46.49.98.69.49.6
11.513.48.86.75.5
2.84.7
7.110.110.5
10.3
10.69.8
9.511.211.0
7.6
10.210.610.1
9.4
8.67.6
13.011.98.39.6
10.013.16.0
12.64.0
3.74.2
10.211.710.5
11.8
10.010.5
9.310.311.48.7
10.09.8
10.510.2
8.58.1
11.010.4
9.210.110.513.4
8.411.5
6.1
5.55.7
9.911.510.1
12.0
9.99.9
9.310.011.07.9
10.19.69.79.8
8.57.4
10.910.38.68.2
10.114.37.59.96.0
4.85.6
- . - * - I - * - II
9.911.61.4
11.9
)1.310.8
10.811.110.910.3
11.5lo.q10.9
11.2
10.09.1
12.111.39.78.69.914.09.4
12.78.6
5.97.2
1/ BASED ON DATA ADJUSTED FOR2/ BASED ON QUARTERLY AVERAGEP - PRELIMINARY
CHANGES IN RESERVE REQUIREEnT$,DATA.
.., .,, ,. , ~-
1
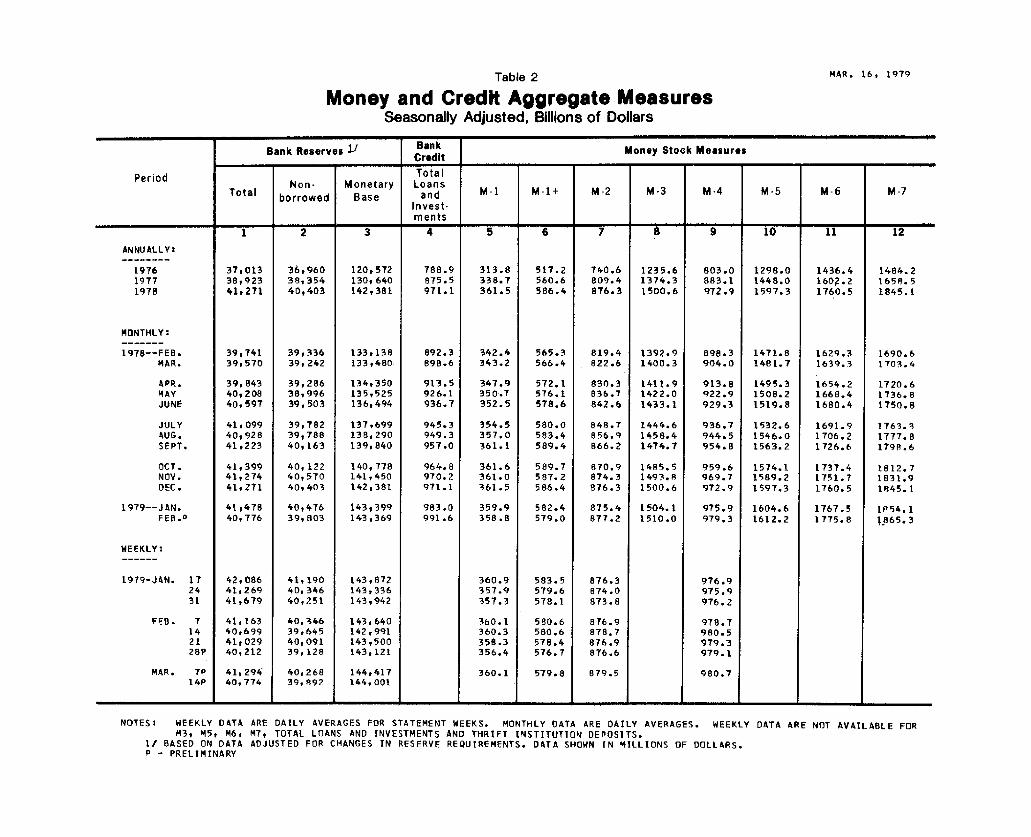
Table 2 MAR. 16, 1979
Money and Credit Aggregate MeasuresSeasonally Adjusted, Billions of Dollars
Bank Reserves Bank Money Stock MeasuresCredit
Period TotalNon- Monetary Loans
Total borrowed Base and M- 1 M-l+ M-2 M-3 M-4 M-5 M-6 M-7Invest-ments
1 2 3 4 5 6 7 8 9 10 11 12
ANNUALLY:
1976 37,013 36,960 120,572 788.9 313.8 517.2 740.6 1235.6 803.0 1298.0 1436.4 1484.21977 38,923 38,354 130,640 875.5 338.7 560.6 809.4 1374.3 883.1 1448.0 160?.2 1658.51978 41,271 40,403 142,381 971.1 361.5 586.4 876.3 1500.6 972.9 1597.3 1760.5 1845.1
MONTHLY:
1978--FEB. 39,741 39,336 133,138 892.3 342.4 565.3 819.4 1392.9 898.3 1471.8 1629.3 1690.6MAR. 39,570 39,242 133,480 898.6 343.2 566.4 822.6 1400.3 904.0 1481.7 1639.3 1703.4
APR. 39,843 39,286 134,350 913.5 347.9 572.1 830.3 1411.9 913.8 1495.3 1654.2 1720.6MAY 40,208 38,996 135,525 926.1 350.7 576.1 836.7 1422.0 922.9 1508.2 1668.4 1736.8JUNE 40,597 39,503 136,494 936.7 352.5 578.6 842.6 1433.1 929.3 1519.8 1680.4 1750.8
JULY 41,099 39,782 137,699 945.3 354.5 580.0 848.7 1444.6 936.7 1532.6 1691.9 1763.3AUG. 40,928 39,788 138,290 949.3 357.0 583.4 856.9 1458.4 944.5 1546.0 1706.2 1777.8SEPT. 41,223 40,163 139,840 957.0 361.1 589.4 866.2 1474.7 954.8 1563.2 1726.6 1798.6
OCT. 41,399 40,122 140,778 964.8 361.6 589.7 870.9 1485.5 959.6 1574.1 1737.4 1812.7NOV. 41,274 40,570 141,450 970.2 361.0 587.2 874.3 1493.8 969.7 1589.2 1751.7 1831.9DEC. 41,271 40,403 142,381 971.1 361.5 586.4 876.3 1500.6 972.9 1597.3 1760.5 1845.1
1979--JAN. 41,478 40,476 143,399 983.0 359.9 582.4 875.4 1504.1 975.9 1604.6 1767.5 1854.1FEB.
0 40,776 39,803 143,369 991.6 358.8 579.0 877.2 1510.0 979.3 1612.2 1775.8 1865.3
WEEKLY:
1979-J4N. 17 42,086 41,190 t43,872 360.9 583.5 876.3 976.924 41,269 40,346 143,336 357.9 579.6 874.0 975.931 41,679 40,251 143,942 357.3 578.1 873.8 976.2
FEB. 7 41,163 40,346 143,640 360.1 580.6 876.9 978.714 40,699 39,645 142t991 360.3 580.6 878.7 980.521 41,029 40,091 143,500 358.3 578.4 876.9 979.328P 40,212 39,128 143t121 356.4 576.7 876.6 979.1
MAR. 7P 41t294 40,268 144,417 360.1 579.8 879.5 980.714P 40,774 39,892 144,001
NOTES: WEEKLY DATA ARE DAILY AVERAGES FOR STATEMENT WEEKS. MONTHLY DATA ARE DAILY AVERAGES. WEEKLY DATA ARE NOT AVAILABLE FORM3, M5, M6, M7, TOTAL LOANS AND INVESTMENTS AND THRIFT INSTITUTION DEPOSITS.
1/ BASED ON DATA ADJUSTED FOR CHANGES IN RESERVE REQUIREMENTS. DATA SHOWN IN MILLIONS OF DOLLARS.P - PRELIMINARY

Table 3 MAR. 16, 1979
COMPONENTS OF MONEY STOCK AND RELATED MEASURES
OtherShort Term Private
Savings U.S.Gov't Short-termBondsl/ Securities Assets
1/1 I
2/ANNUALLY:
197619771978
2,SEMI-ANNUALLY:
2ND HALF 1977
1ST HALF 19782ND HALF 1978
QUARTERLY:
1ST QTR. 19782ND QTR. 19783RD QTR. 19784TH QTR. 1978
QUARTERLY-AV:
1ST QTR. 19782ND QTR. 19783RD QTR. 19784TH QTR. 1978
MONTHLY:
197B--FEB.4AR.APR.MAYJUNEJULYAUG.SEPT.OCT.NOV.DEC.
1979--JAN.FEB.P
10.0
9.310.2
9.57.9
11.79.7
10.58.09.6
10.6
10.76.77.99.26.59.19.0
16.67.6
10.011.2
8.68.6
7.3
7.64.9
3.811.99.1
-2.7
5.59.77.62.1
-1.01.0
19.510.3
5.66.07.8
13.2-0.5-6.3-1.4
-10.9-8.3
8.111.412.5
11.7
12.212.0
12.111.411.711.9
12.511.511.312.4
12.910.610.913.4
9.611.210.912.78.5
21.95.1
9.09.0
15.011.2
9.4
9.8
7.610.8
7.48.9
12.27.7
7.27.9
11.110.2
7.36.07.88.7
10.19.8
14.112.510.0
9.43.5
1.67.0
(Per cent annual rates of growth)
25.011.11.8
6.4
2.90.7
2.24.73.6
-6.2
2.03.82.3
-0.9
1.11.64.36.03.8
-3.84.89.7
-1.6-9.6-7.5
-13.0-12.0
7.511.416.1
12.9
11.719.3
12.012.519.518.9
11.711.418.519.2
12.89.8
10.711.015.521.621.214.819.324.512.0
12.720.7
-23.312.832.8
25.6
42.619.0
42.325.5
8.336.6
47.733.512.225.0
47.439.528.040.3
7.018.0-5.512.31.4
92.115.1
48.419.1
& I - - a & &
15.414.010.2
13.6
8.511.5
8.38.3
12.110.7
8.97.8
10.911.8
7.87.87.57.2
10.111.111.213.512.59.89.5
9.79.2
17.819.515.0
20.1
17.012.0
18.014.013.5
7.7
17.415.913.710.1
17.820.014.812.214.511.911.816.3
9.24.69.1
-4.5-6.8
7.112.6
7.7
22.3
12.03.2
11.39.59.3
-4.3
16.27.51.05.4
9.1-4.513.513.4
1.5-23.5
9.043.1-7.2
-14.48.8
-5.87.3
11.913.447.3
10.1
51.933.9
55.439.39.1
70.0
52.345.618.746.9
55.252.843.134.336.915.35.06.7
55.078.165.8
28.440.2
. -
1/ GROWTH RATES ARE BASED ON ESTIMATED MONTHLY AVERAGE LEVELSPREVIOUS MONTH REPORTED DATA.
2/ BASED ON QUARTERLY AVERAGE DATA.P - PRELIMINARY.
DERIVED BY AVERAGING END OF CURRENT MONTH AND END OF
Period

Table 4
COMPONENTS OF MONEY STOCK AND RELATED MEASURESMAR. 16, 1979
_________________________ U
Period
ANNUALLY:
197619771978
MONTHLY:1978--FEB.
MAR.
APR.MAYJUNE
JULYAUG.SEPT.
OCT.NOV.DEC.
1979--JAN.FEB.P
WEEKLY:
1979-JAN. 10172431
FEB. 7142128P
MAR. 7P
80.888.697.5
90.290.7
91.392.092.5
93.293.995.2
95.896.697.5
98.298.9
98.098.098.498.5
98.998.698.899.1
99.5
233.0250.1264.1
252.3252.5
256.6258.8260.0
261.3263.0265.9
265.8264.4264.1
261.7259.9
262.7262.9259.5258.7
261.2261.7259.5257.3
260.5
489.2544.4611.4
555.9560.8
565.9572.2576.8
582.2587.5593.7
597.9608.8611.4
616.0620.6
613.2615.9618.0618.9
618.6620.2621.0622.7
620.7
426.7470.7514.8
477.0479.4
482.5486.0490.1
494.1499.9505.1
509.3513.3514.8
515.5518.5
514.4515.4516.1516.6
516.8518.4518.6520.3
519.5
202.1219.7222.0
220.6220.9
221.7222.8223.5
222.8223.7225.5
225.2223.4222.0
219.6217.4
221.0219.7218.8218.0
217.6217.5217.3217.5
216.9
224.7251.0292.8
256.4258.5
260.8263.2266.6
271.4276.2279.6
284.1289.9292.8
295.9301.0
293.4295.7297.3298.5
299.2300.9301.4302.8
302.6
62.473.796.6
78.981.5
83.486.286.7
88.087.688.5
88.695.496.6
100.5102.1
98.9100.5101.9102.4
101.8L01.8L02.4L02.4
L01.2
Mutual Short- OtherSavings Credit Term Private
- Bank Union Savings US. Short-& S&L Shares Bonds Gov't term
Shares I/ 1 Sec / Assets
8 9 10 11 12
38.946.653.1
47.948.7
49.349.850.4
50.951.452.1
52.5
52.753.1
52.952.6
71.976.680.6
77.477.8
78.278.678.9
79.379.579.8
80.180.480.6
80.780.8
66.577.682.7
80.179.8
80.781.681.7
80.180.783.6
83.182.182.7
82.382.8
456.1518.3571.2
525.6529.0
532.3535.5540.0
545.0550.1556.3
562.1566.7571.2
575.8580.2
47.856.384.6
61.464.1
66.468.370.4
71.371.672.0
75.380.284.6
86.689.5
UL
Non- TotalDeposit Gov'tFunds Demand
y DepositsA/
13 14
51.062.077.1
65.565.4
65.766.266.4
66.768.869.8
74.973.077.1
82.885.7
81.984.783.882.4
84.088.587.183.5
11.411.715.4
8.79.3
10.28.3
13.4
14.716.916.8
20.121.015.4
14.810.2
13.614.115.015.1
11.89.79.49.5
10.3
1/ ESTIMATED MONTHLY AVERAGE LEVELS DERIVED BY AVERAGING END OF CURRENT MONTH AND END OF PREVIOUS MONTH REPORTED DATA.
21 INCLUDES PRIVATE DOMESTIC NONFINANCIAL INVESTORS' HOLDINGS OF COMMERCIAL PAPER, BANKERS ACCEPTANCES, SECURITY RP'S ANDMONEY MARKET MUTUAL FUND SHARES.
3/ BORROWINGS BY BANKS FROM OTHER THAN COMMERCIAL BANKS IN THE FORM OF FEDERAL FUNDS PURCHASED, SECURITIES SOLD UNDER
AGREEMENTS TO REPURCHASE, AND OTHER LIABILITIES FOR BORROWED MONEY, PLUS GROSS LIABILITIES TO OWN FOREIGN BRANCHES
(EURODOLLAR BORROWINGS), LOANS SOLD TO AFFILIATES, LOAN RPS, AND OTHER MINOR ITEMS.4/ INCLUDES TREASURY DEMAND DEPOSITS AT COMMERCIAL BANKS AND FEDERAL RESERVE BANKS AND TREASURY NOTE BALANCES.P - PRELIMINARY
II
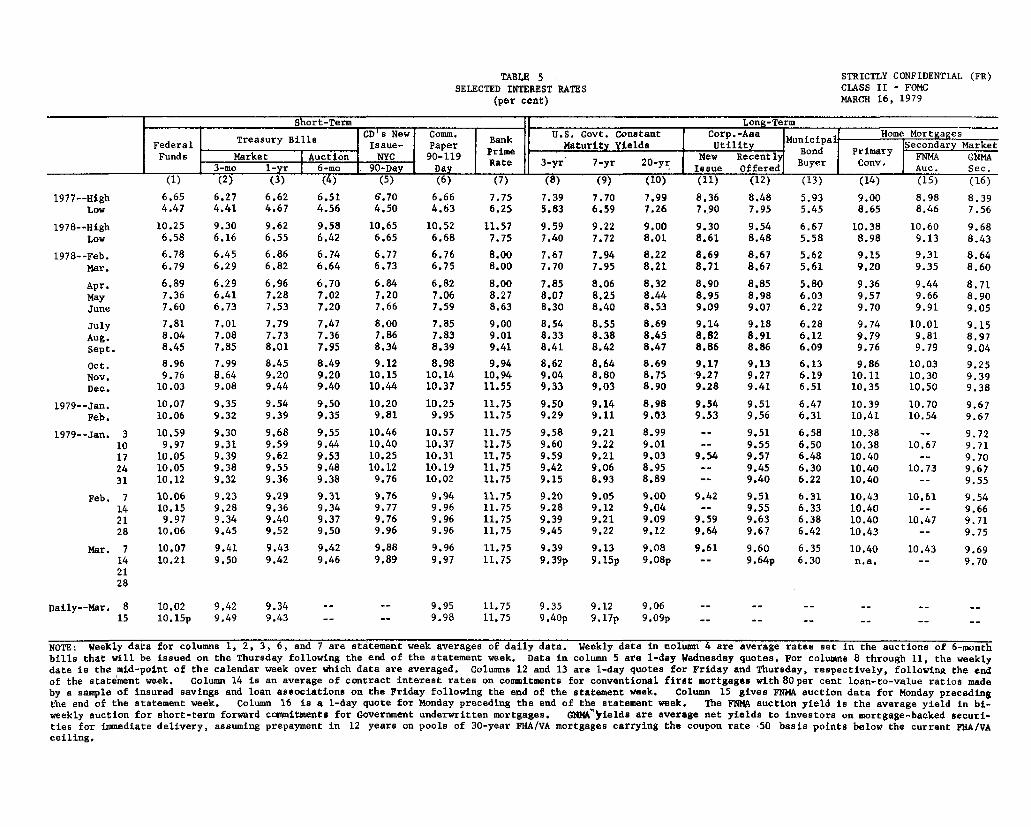
TABLE 5SELECTED INTEREST RATES
(per cent)
STRICTLY CONFIDENTIAL (FR)CLASS II - FOMCMARCH 16, 1979
Short-Term Long-Term
Treasury Bill CD's New Comm. Bank U.S. Govt. Constant Corp.-Aaa uniHome MortgagesFederal rar Issue- Paper B Maturity Yields Utility MBnciPl Secondary MarketFunds Market Auction NYC 90-119 Prime N0 Mew Recentl ary FNMA GNMA
3-mo 1-yr 6-mo . 90-Day Day Rate 3-yr 7-yr 20yr Issue Offered Buyer Cony. Auc. Sec.(1) (2) (3) (4) (5) (6) (7) (8) (9) (10) (11) (12) (13) (14) (15) (16)
1977--HighLow
1978--HighLow
1978--Feb.Mar.
Apr.MayJune
JulyAug.Sept.
Oct.Nov.Dec.
1979--Jan.Feb.
1979--Jan. 310172431
Feb. 7142128
Mar. 7142128
Daily--Mar. 815
6.65 6.27 6.62 6.51 6.70 6.66 7.75 7.39 7.70 7.99 8.36 8.48 5.93 9.00 8.98 8.394.47 4.41 4.67 4.56 4.50 4.63 6.25 5.83 6.59 7.26 7.90 7.95 5.45 8.65 8.46 7.56
10.25 9.30 9.62 9.58 10.65 10.52 11.57 9.59 9.22 9.00 9.30 9.54 6.67 10.38 10.60 9.686.58 6.16 6.55 6.42 6.65 6.68 7.75 7.40 7.72 8.01 8.61 8.48 5.58 8.98 9.13 8.43
6.78 6.45 6.86 6.74 6.77 6.76 8.00 7.67 7.94 8.22 8.69 8.676.79 6.29 6.82 6.64 6.73 6.75 8.00 7.70 7.95 8.21 8.71 8.67
5.62 9.15 9.31 8.645.61 9.20 9.35 8.60
6.89 6.29 6.96 6.70 6.84 6.82 8.00 7.85 8.06 8.32 8.90 8.85 5.80 9.36 9.44 8.717.36 6.41 7.28 7.02 7.20 7.06 8.27 8.07 8.25 8.44 8.95 8.98 6.03 9.57 9.66 8.907.60 6.73 7.53 7.20 7.66 7.59 8.63 8.30 8.40 8.53 9.09 9.07 6.22 9.70 9.91 9.05
7.81 7.01 7.79 7.47 8.00 7.85 9.00 8.54 8.55 8.69 9.14 9.18 6.28 9.74 10.01 9.158.04 7.08 7.73 7.36 7.86 7.83 9.01 8.33 8.38 8.45 8.82 8.91 6.12 9.79 9.81 8.978.45 7.85 8.01 7.95 8.34 8.39 9.41 8.41 8.42 8.47 8.86 8.86 6.09 9.76 9.79 9.04
8.96 7.99 8.45 8.49 9.12 8.98 9.94 8.62 8.64 8.69 9.17 9.13 6.13 9.86 10.039.76 8.64 9.20 9.20 10.15 10.14 10,94 9.04 8.80 8.75 9.27 9.27 6.19 10.11 10.3010.03 9.08 9.44 9.40 10.44 10.37 11.55 9.33 9.03 8.90 9.28 9.41 6.51 10.35 10.50
10.07 9.35 9.54 9.50 10.20 10.25 11.75 9.50 9.14 8.98 9.54 9.51 6.47 10.39 10.7010.06 9.32 9.39 9.35 9.81 9.95 11.75 9.29 9.11 9.03 9.53 9,56 6.31 10.41 10.54
10.599.97
10.0510.0510.12
10.0610.159.97
10.06
9.309.319.399.389.32
10.4610.4010.2510.129.76
10.5710.3710.3110.1910,02
11.7511.7511.7511.7511.75
9.23 9.29 9.31 9.76 9.94 11.759.28 9.36 9.34 9.77 9.96 11.759.34 9.40 9.37 9.76 9.96 11.759.45 9.52 9.50 9.96 9.96 11.75
9.589.609.599.429.15
9.219.229.219.068.93
8.999.019.038.958.89
9.519.559.579.459.40
6.586.506.486.306.22
10.3810.3810.4010.4010.40
9.20 9.05 9.00 9.42 9.51 6.31 10.439.28 9.12 9.04 -- 9.55 6.33 10.409.39 9.21 9.09 9.59 9.63 6.38 10.409.45 9.22 9.12 9.64 9.67 6.42 10.43
10.07 9.41 9.43 9.42 9.88 9.96 11.75 9.39 9.13 9.0810.21 9.50 9.42 9.46 9.89 9.97 11.75 9.39p 9.15p 9 .08p
10.02 9.42 9.3410.15p 9.49 9.43
9.61 9.60 6.35 10.40- 9.64p 6.30 n.a.
10.67
10.73
10.61
10.47
9.259.399.38
9.679.67
9.729.719.709.679.55
10.43 9.69- 9.70
- - 9.95 11.75 9.35 9.12 9.06- - 9.98 11.75 9.40p 9.17p
9.0
9p
NOTE: Weekly data for columns 1, 2, 3, 6, and 7 are statement week averages of daily data. Weekly data in column 4 are average rates set in the auctions of 6-monthbills that will be issued on the Thursday following the end of the statement week. Data in column 5 are 1-day Wednesday quotes. For columns 8 through 11, the weeklydate is the mid-point of the calendar week over which data are averaged. Columns 12 and 13 are 1-day quotes for Friday and Thursday, respectively, following the endof the statement week. Column 14 is an average of contract interest rates on commitments for conventional first mortgages with 80per cent loan-to-value ratios madeby a sample of insured savings and loan associations on the Friday following the end of the statement week. Column 15 gives FNMA auction data for Monday precedingthe end of the statement week. Column 16 is a 1-day quote for Monday preceding the end of the statement week. The FMMA auction yield is the average yield in bi-weekly auction for short-term forward commitments for Government underwritten mortgages. GNMA ields are average net yields to investors on mortgage-backed securi-ties for immediate delivery, assuming prepayment in 12 years on pools of 30-year FHA/VA mortgages carrying the coupon rate -50 basis points below the current FHA/VAceiling.

TABLE 6SECURITY DEALER POSITIONS AND BANK POSITIONS
(millions of dollars)
STRICTLY CONFIDENTIAL (FR)CLASS II - FOMCMARCH 16, 1979
U.S. Govt. Security Underwriting Member Bank Reserve positionsDealer Positions Syndicate Positions Borrowing at FRB** Basic Reserve Deficit**
Bills Coupn Corporate Muniipal Reserves I Total Seasonal 8 New York 38 OthersI Issues Bonds Bonds Ither
1977--HighLow
1978--HighLow
1978--Feb.Mar.
Apr.MayJune
JulyAug.Sept.
Oct.Nov.Dec.
1979--Jan.Feb.
1979--Jan. 310172431
Feb. 7142128
Mar. 7142128
7,2341,729
5,625278
3,4182,713
3,1831,0232,847
1,1961,9942,571
1,4951,9601,697
2,818*2,819
1382,1952,9133,4633,649
4,1562,767
*2,236*1,989
*3,647*2,571
3,017-1,445
2,043-1,076
1,492740
-1835
78
-626423125
-309462219
503*16
544833441451364
36645
*-339*-224
*-136*313
513-111
719-227
243200
149219178
197168193
177214232
214158p
726-12240416
340
279111357165p
171p92p
1,86120
1,716172
406328
5571,2121,094
1,3171,1391,060
1,277703868
1,00397 3p
1,183686896923
1,428
8171,054
9381,084p
1,026p882p
1318
23625
4947
4492
120
143189191
233186134
106114p
12293
105105113
101111121123p
107108p
-9,151-4,234
-8,224-2,370
-4,980-6,778
-6,196-4,038-4,514
-3,651-4,793-5,098
-4,651-3,448-3,345
-3,424-2,631
-4,188-4,182-4,341-2,503-2,344
-2,582-3,108-2,602-2,232
-3 ,99 8p-6,770p
-13,975-8,206
-14,657-8,273
-12,603-11,060
-12,998-11,653-12,202
-10,204-11,089-11,357
-11,551-13,448-12,533
-12,351-12,921
-10,520-13,555-12,858-12,798-10,977
-11,620-13,088-13,549-13,427
-13,714p-14,191p
NOTE: Government security dealer trading positions are on a commitment basis. Trading positions, which exclude Treasury securities financed byrepurchase agreements maturing in 16 days or more, are indicators of dealer holdings available for sale over the near-term. Underwriting syndi-cate positions consist of issues still in syndicate, excluding trading positions. The basic reserve defilit is excess reserves less borrowing atFederal Reserve less net Federal funds purchases. Weekly data are daily averages for statement weeks, except for corporate and municipal issuesin syndicate which are Friday figures.
* Strictly confidential.** Monthly averages for excess reserves and borrowings are weighted averages of statement week figures.