fMRI: Interpretation, Limits and Potential Pitfalls - … · fMRI: Interpretation, Limits and...
59
fMRI: Interpretation, Limits and Potential Pitfalls Seong-Gi Kim [email protected] www.kimlab.pitt.edu
Transcript of fMRI: Interpretation, Limits and Potential Pitfalls - … · fMRI: Interpretation, Limits and...

fMRI: Interpretation, Limits and Potential Pitfalls
Seong-Gi Kim
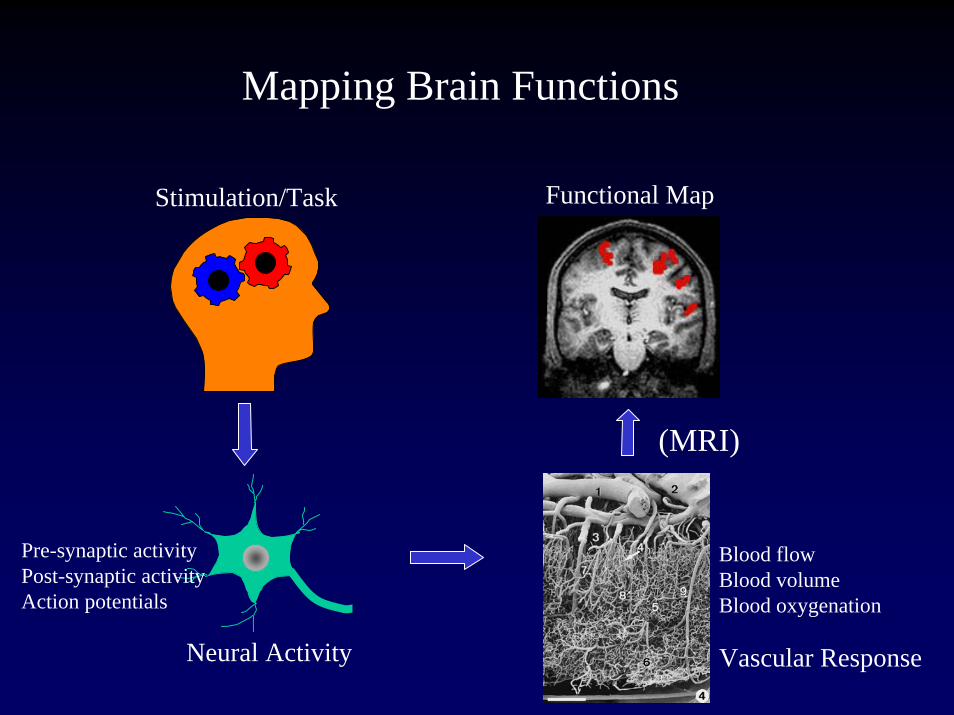
Mapping Brain Functions
Neural Activity Vascular Response
Stimulation/Task Functional Map
(MRI)
Pre-synaptic activityPost-synaptic activityAction potentials
Blood flowBlood volumeBlood oxygenation

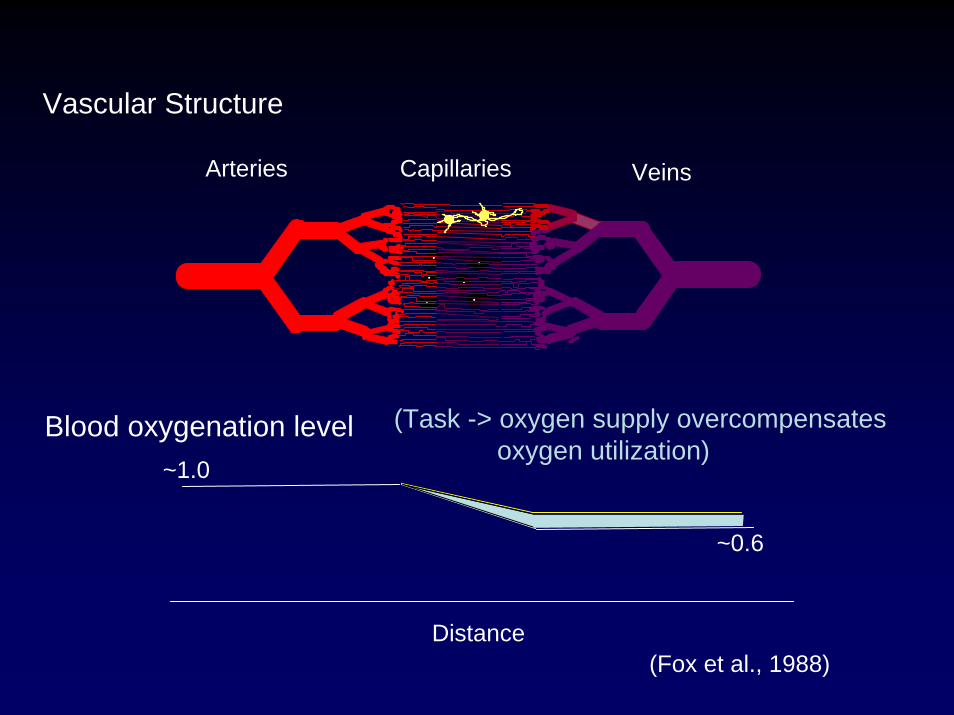
Blood oxygenation level~1.0
~0.6
CapillariesArteries Veins
Vascular Structure
Distance

Blood Oxygenation Level-dependent ContrastOgawa et al. Magn. Reson. Med, 1990
HEMOGLOBIN
Deoxyhemoglobin (Paramagnetic)
Oxyhemoglobin (Diamagnetic)
-O2
Reduce T2* -> Reduce signal intensity in T2*-weighted images

4 mm
T2*-weighted images of rat brain (no activation)(isotropic resolution of 58 μm, 9.4 T)
Dark lines – venous vessels (>20 micrometer diameters)
Sung-Hong Park et al., Magn. Reson. Med., 2008

Blood Oxygenation Level-dependent Contrast
Mouse brain images at 360 MHz
Breathing 100% O2Breathing air
Ogawa et al. MRM, 1990
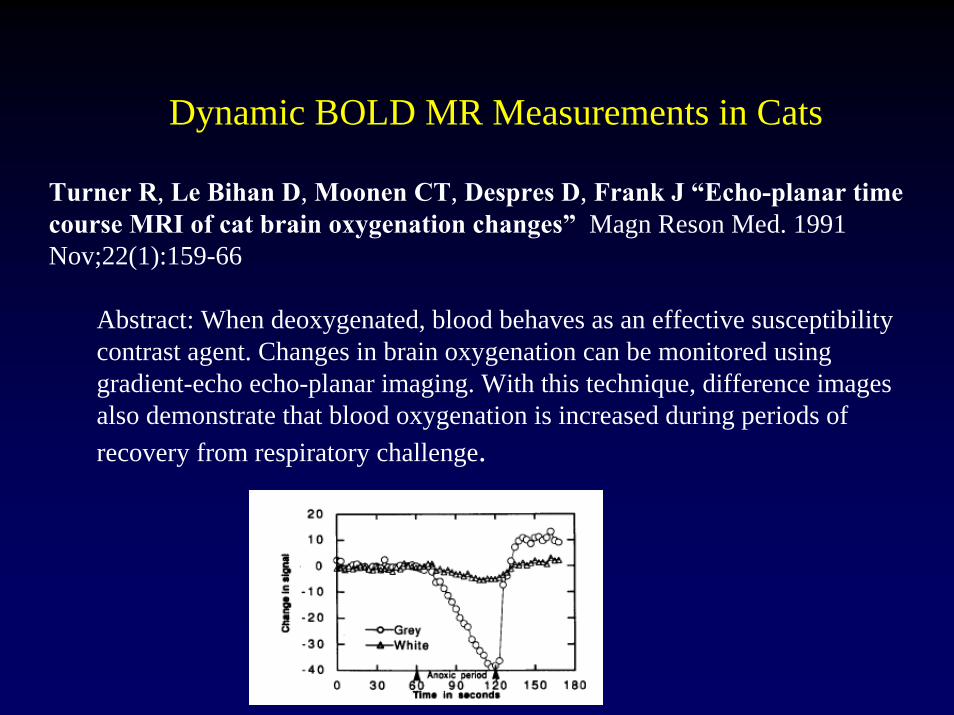
Dynamic BOLD MR Measurements in Cats
Turner R, Le Bihan D, Moonen CT, Despres D, Frank J “Echo-planar time course MRI of cat brain oxygenation changes” Magn Reson Med. 1991 Nov;22(1):159-66
Abstract: When deoxygenated, blood behaves as an effective susceptibility contrast agent. Changes in brain oxygenation can be monitored using gradient-echo echo-planar imaging. With this technique, difference images also demonstrate that blood oxygenation is increased during periods of recovery from respiratory challenge.
Blood oxygenation level~1.0
~0.6
CapillariesArteries Veins
Vascular Structure
Distance
(Task -> oxygen supply overcompensatesoxygen utilization)
(Fox et al., 1988)

University of Minnesota/Bell LabOgawa et al. Proc Natl Acad Sci USA, 1992
Functional Image(Visual Stimulation)
Anatomical Image
One of First Human fMRI StudiesPrimary Visual Cortex

- Functional MRI with a few millimeter resolution is routinely used for mapping brain functions such as vision, motor, language, cognition, etc.
- Underlying assumption is that fMRI signal change is indirectly related to neural activity, and its location is indicative of neural activity site.
Current Status of Functional MRI

Physiological Changes
Biophysical Basis of BOLD fMRI
Spatial Resolution
Interpretation - Quantification
Temporal Resolution

Vascular Physiological Changes
Costantino Iadecola & Maiken NedergaardNature Neurosci, 2007
Blood Vessel Dilation
Blood Velocity Increase
Blood Oxygenation Change
Cerebral Blood Flow

Vessel Imaging of Rat Brain
Anatomical Image
1 mm
Hig
h-re
solu
tion
Ana
tom
ical
Imag
e 200µm
Vazquez et al., 500
µm

200µm
20x Mag., Reverse contrast
1 mm
Vazquez et al.
Bright:
dilation
A
V V
Vessel Imaging of Rat Brain during Stimulation
4-s forepaw stim
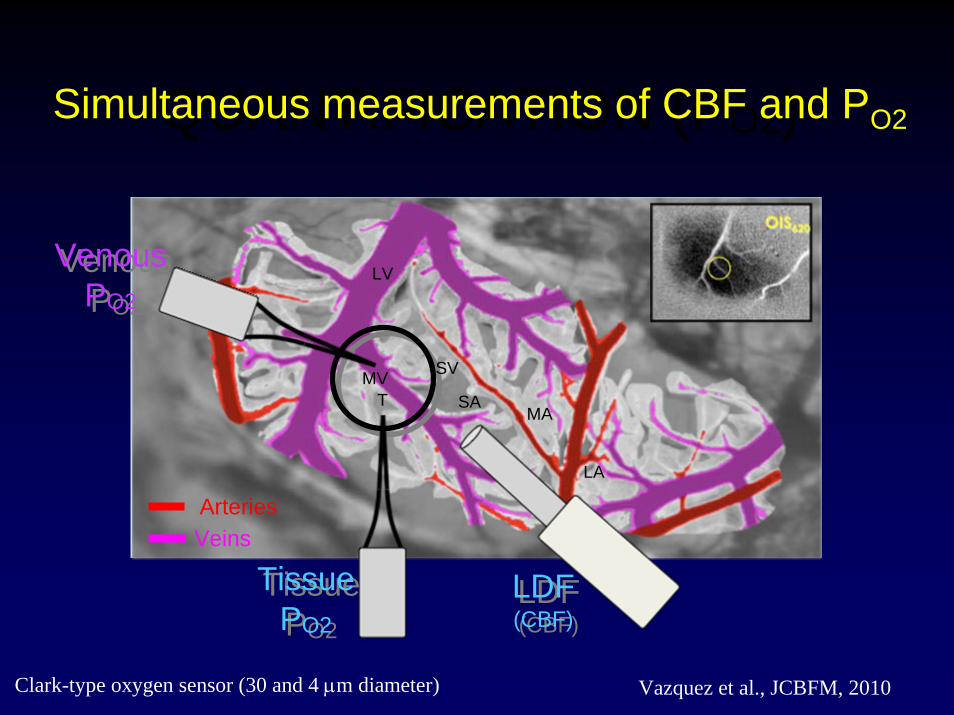
QUANTIFICATION (PO2)
ArteriesVeins
SAMA
LA
SVMV
LV
T
LDF(CBF)LDF(CBF)
TissuePO2
TissuePO2
VenousPO2
VenousPO2
Vazquez et al., JCBFM, 2010
Simultaneous measurements of CBF and PO2
Clark-type oxygen sensor (30 and 4 μm diameter)

CBF and tissue PO2 changes during stimulation
Forepaw Stimulation
Time (s)
LDF (CBF)
Tissue PO2
Vazquez et al., JCBFM, 2010

Lar. Ven.Lar. Ven.
Med. Ven.Med. Ven.
Sm. Ven.Sm. Ven.
Venous Blood PO2 changes during stimulation
Vazquez et al., JCBFM, 2010S
O2
PO2
Physiological Changes
Biophysical Basis of BOLD fMRI
Spatial Resolution
Interpretation - Quantification
Temporal Resolution

Intravascular water moves freely
Slow exchange of IV and EV waterIntact BBB ⇒ tight junctions betweenendothelial cells impede the diffusion of water. (In 50 ms, less than 5% of the capillary water diffuses into the EVS.)
Extravascular water moves freely
EV
RBC
blood vessel(IV)
Compartmentalization of Water
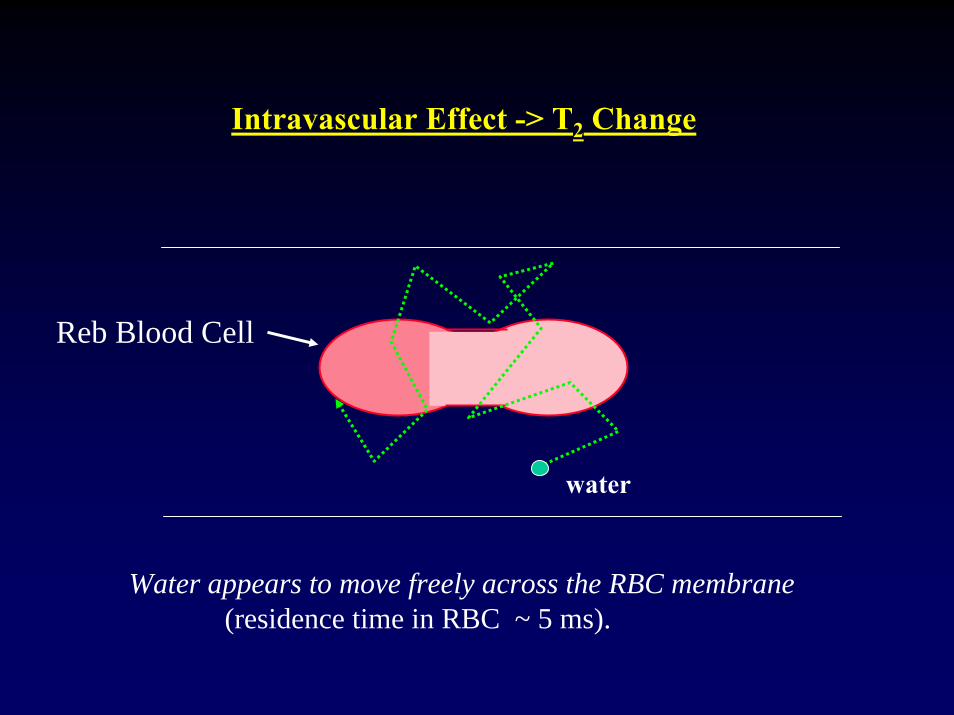
Reb Blood Cell
water
Intravascular Effect -> T2 Change
Water appears to move freely across the RBC membrane(residence time in RBC ~ 5 ms).
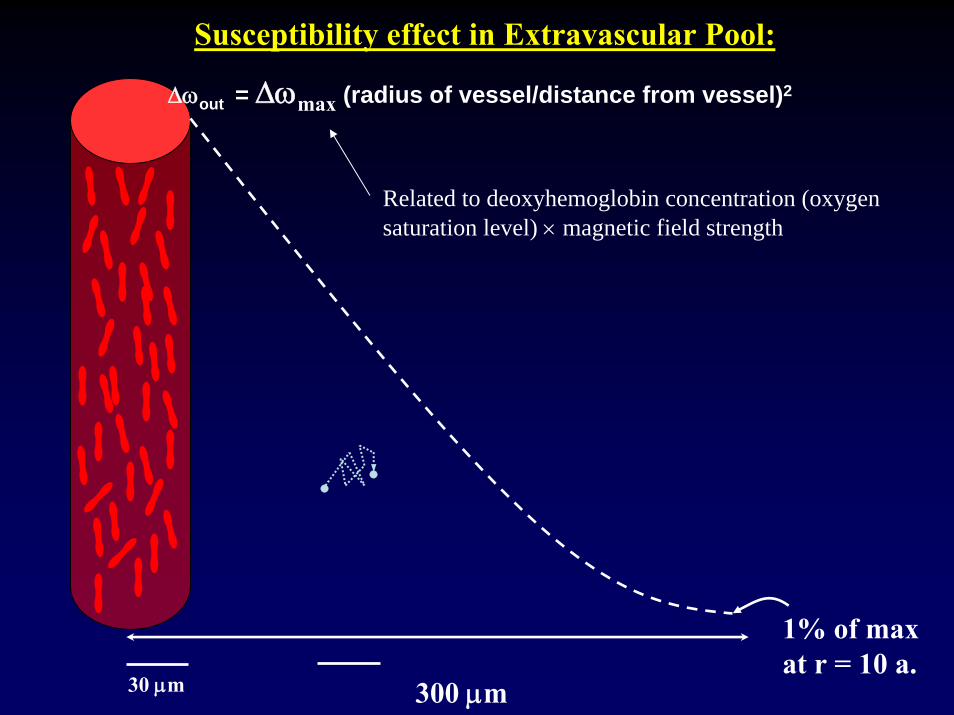
Susceptibility effect in Extravascular Pool:
1% of maxat r = 10 a.
30 μm 300 μm
Δωout = Δωmax (radius of vessel/distance from vessel)2
Related to deoxyhemoglobin concentration (oxygen saturation level) × magnetic field strength

Susceptibility effect in Extravascular Pool:
1% of maxat r = 10 a.
30 μm 300 μm
ΔBoutMRI signal at echo time (TE):
a summation of all water proton signal withina voxel. Each proton signal decays by T2 and dephases by local susceptibility effect (i.e., Phase shift)
S(TE) = ∑ S.exp(-TE/T2).e(-iϖTE)
≈ S.exp(-TE/T2*)

x’
y’
x’
y’
x’
y’
x’
y’
t = 0 (after 90° pulse)
τ
τ
180° pulse along x’
Spin-echo
Spin Echo (two spins)

Capillary tube (1.4 mm o.d., 1.0 mm i.d.) filled with blood in a saline bath(positioned orthogonal to main magnetic field)
100% oxyHb
SE GE
100% deoxyHb
Ogawa et al., MRM, 1990

Boxerman et al., MRM, 1995
CBV = 2%Δχ = 0.1 ppm
Conventional Gradient-echo and Spin-echo BOLD Signal

Extravascular and Intravascular BOLD Signal Contributions
Gradient Echo Spin Echo
X
X
X
X
X
X
X
Extravascular
Largevessels
Smallvessels
IntravascularLarge
Small

Physiological Changes
Biophysical Basis of BOLD fMRI
Spatial Resolution
Interpretation - Quantification
Temporal Resolution

Vascular Structures - Histology
Midline Human visual cortex
White matter~ 2 mm
Duvernoy et al.Brain Research Bulletin, 1981
Since all fMRI techniques rely on blood signals, it is desirable to detect responses of small vessels which are close to active neurons.

Layer 4 is known to be highest capillary density and metabolic responses.
Cortical cytoarchitectureof cat visual area 18
Cortical Layer Model
GrayMatter
PiaMatter
WhiteMatter
Vascular structure
Pia1
2
3
4
5
6
white
2 mmL
D1
23
45
6
WM
-Timan et al., Brain Res, 2004
- Torre et al., Anat Rec 1998

Cortical Depth-Dependent Gradient-echo BOLD fMRI
(156 x 156 µm2 in-resolution, 4-shot EPI, 9.4T)
0
1
2
3
4
5
6
-0.5 0 0.5 1 1.5 2 2.5
Distance from Cortical Surface (mm)
% C
hang
e (T
E=2
0 m
s, 9.
4T) WMGM
2 mm Zhao et al., NeuroImage, 2006

Scanning Electron Microscopy
500 µm
Gray Gray mattermatter
PiaPiamatermater Torre et al., 1998
(Human cortex)
Vascular structures vs. fMRI resolution
BOLD Signal ∝
Δdeoxyhemoglobin conc. in blood xvenous blood volume

0.3 3.0 (%)0.3 3.0 (%)
2 mm
TE=20 ms TE=40 ms
Gradient-echo vs. Spin-echo BOLD fMRI
(156 x 156 µm2 in-resolution, 4-shot EPI, 9.4T)
Gradient-Echo Spin-Echo

Spatial Specificity of BOLD Signal to Neural Activity Site
- Venous Vascular Structures
Pial Venous Vessels: 130 – 380 μm diameter
Intracortical Veins: 80 – 120 μm average diameter1 – 2 mm apart

Distance between Intracortical Veins
Distance between emerging venous veins: 0.75 - 4 mm
Duvernoy et al. Brain Research Bulletin, 1981
Pia
GM
WM
artery vein

Hubel & Wiesel, 1968
Ocular DominanceColumns
Color sensitiveregions
Orientation columns
Gray matter (1.5 – 3 mm)
Neurons with similar properties are clustered as columnsSingle-neuron Activities
Can you map cortical columns?

+10-10 0Signal intensity (arbitrary unit)
A P
D
V SPL
5 mm
Iso-orientation maps in the medial area using fMRI
Fukuda et al., J of Neurosci, 2006
(with contrast agent, dilation of small vessels)

A P
D
V SPL
180°
0°
90°
5 mm
Observation of orientation preference maps
Fukuda et al., J of Neurosci, 2006
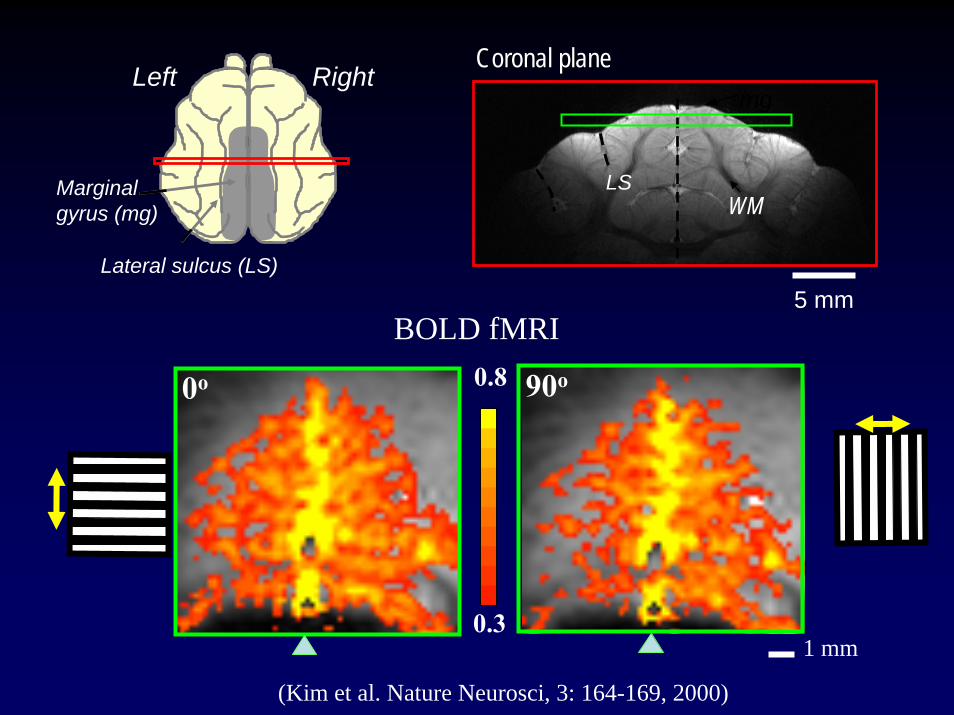
Left Right
Lateral sulcus (LS)
Marginal gyrus (mg)
5 mm
LS
mgCoronal planeCoronal plane
WM
0o 90o
0.3
0.8
1 mm
BOLD fMRI
(Kim et al. Nature Neurosci, 3: 164-169, 2000)

5 mm
1.0
-1.0
ΔS
(x m
ean)
CBVGE BOLD SE BOLD
A
R
BOLD vs. CBV is-orientation maps(obtained with the differential approach; 0° – 90°)
GE CBV
2 mm
SE
Moon et al., J of Neurosci, 2007

Physiological Basis
Biophysical Basis
Spatial Resolution
Interpretation - Quantification
Temporal Resolution
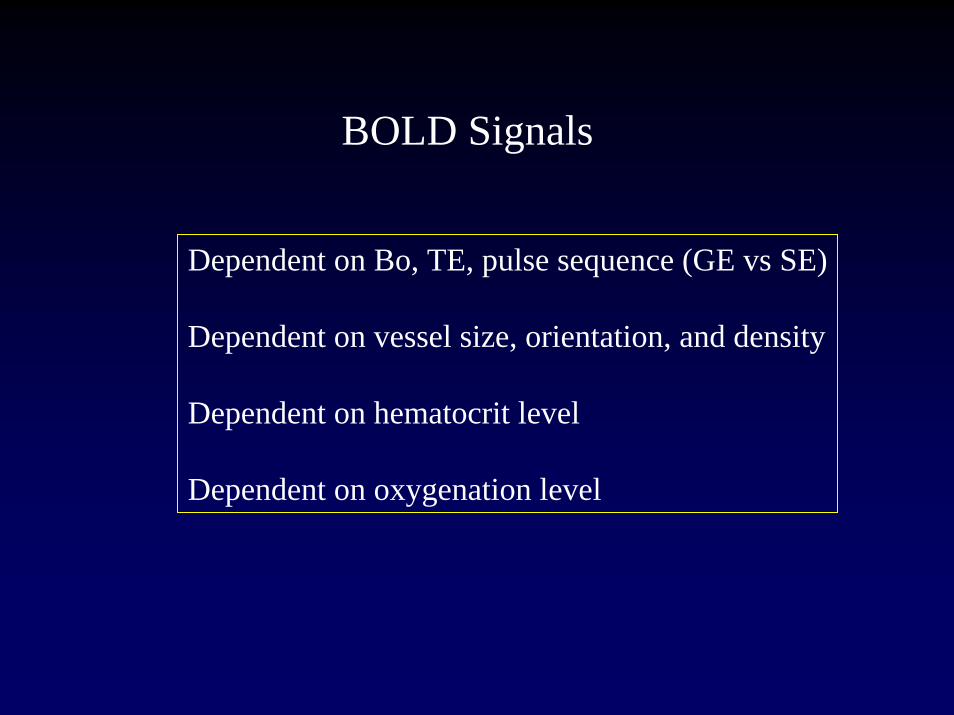
BOLD Signals
Dependent on Bo, TE, pulse sequence (GE vs SE)
Dependent on vessel size, orientation, and density
Dependent on hematocrit level
Dependent on oxygenation level

ΔR2* = Δ(1/T2*) = −percent change/TE ∝ −CBVv(1 – ΔSv) + ΔCBVv(1 – Sv)
1 - Sv = CMRO2 / CBF
• Cerebral Oxygen Consumption Rate• Cerebral Blood Flow• Venous Blood Volume
where

Parenchymal Microvessel (<50 μm diameter)
Region Blood volume
Occipital cortex 1%
Corpus callosum 0.4%
Cerebellar nuclei 1.3%
Rat; Fenstermacher et al.
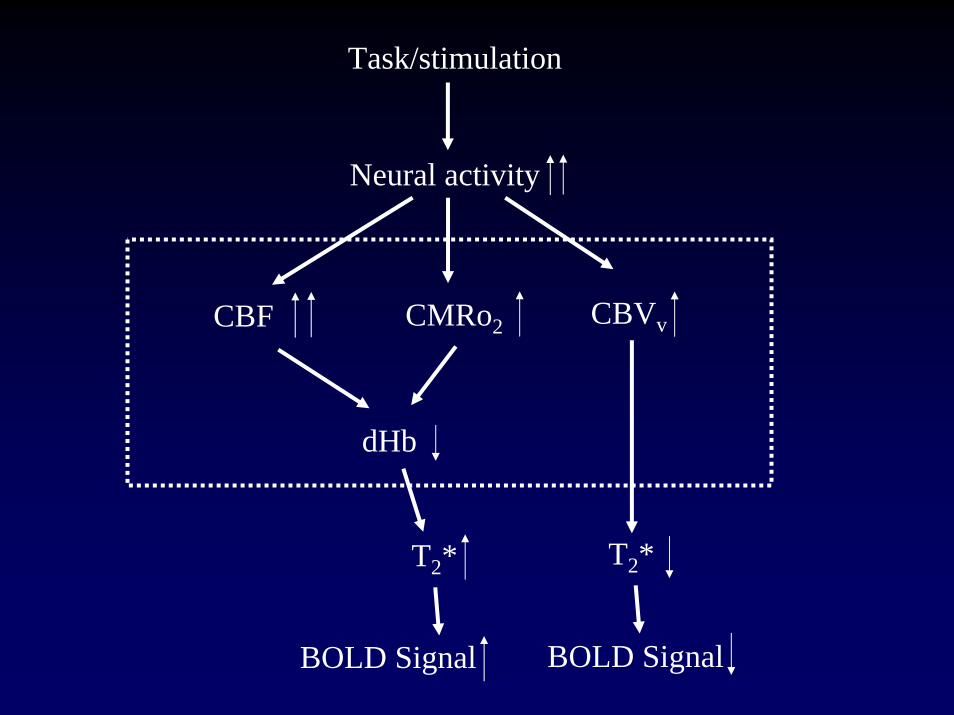
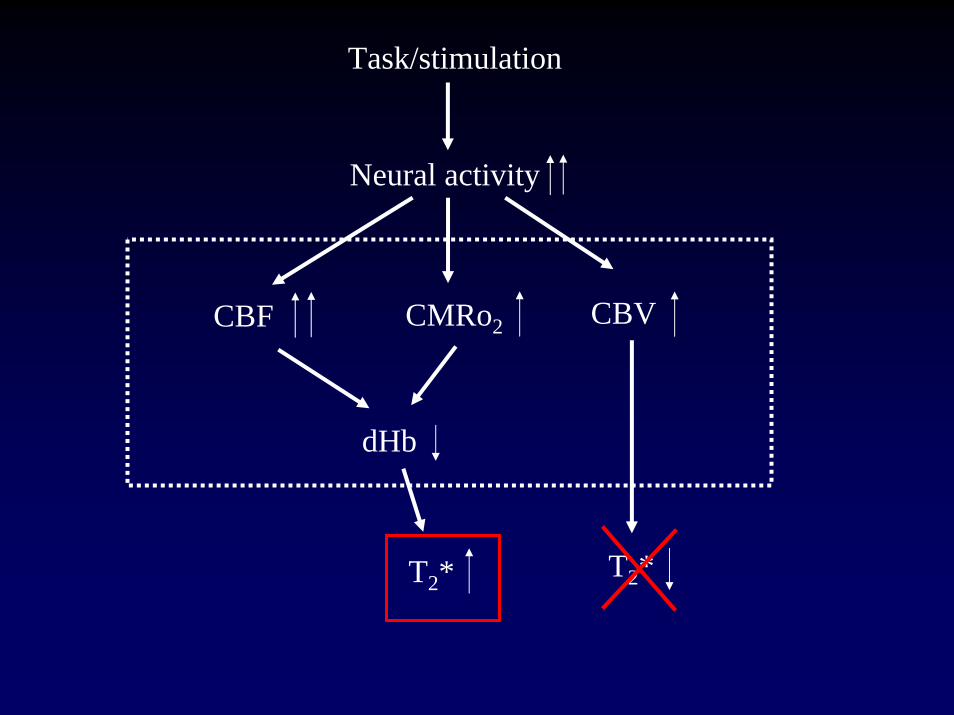
Task/stimulation
Neural activity
CBF CBVvCMRo2
dHb
T2* T2*
BOLD Signal BOLD Signal

rCB
V(a
rbitr
ary
unit)
rCBV = 0.31 rCBF + 0.67( r = 0.85 )
rCBF (arbitrary unit)1.0 1.4 1.8 2.2
0.4
0.6
0.8
1.0
1.2
1.4
1.6
CBV vs. CBF during Hypercapnia
58 ml/100 g/min
(α-chloralose anesthetized rats)
rCBV = 0.975rCBF0.40
(100% CBF -> 31% CBV)
Lee et al., MRM, 2001
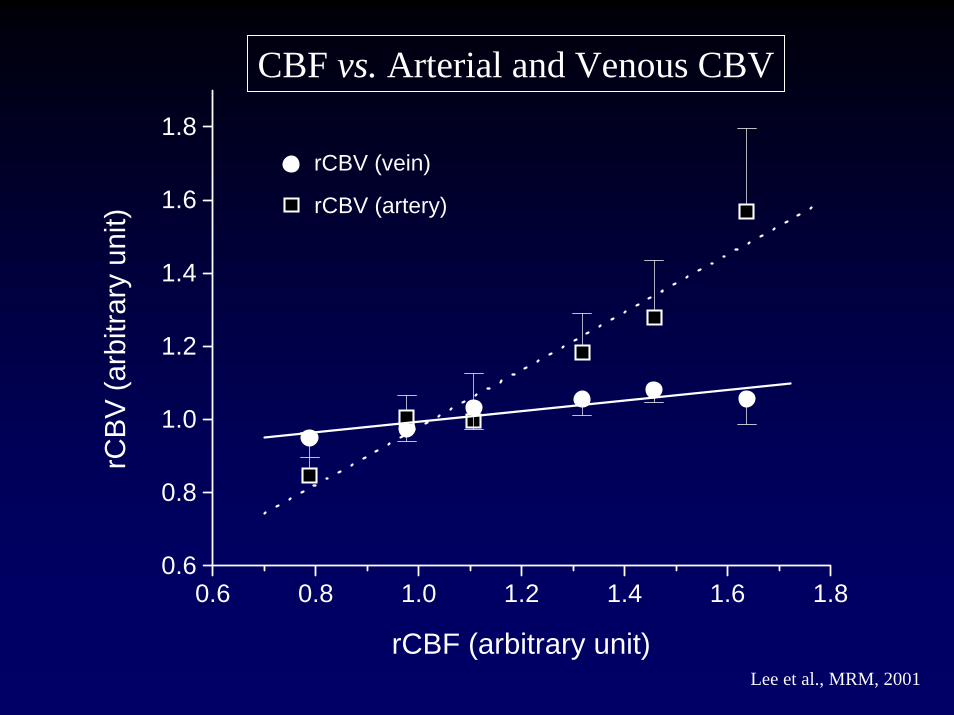
0.6 0.8 1.0 1.2 1.4 1.6 1.80.6
0.8
1.0
1.2
1.4
1.6
1.8
rCB
V(a
rbitr
ary
unit)
rCBV (vein)
rCBV (artery)
rCBF (arbitrary unit)
CBF vs. Arterial and Venous CBV
Lee et al., MRM, 2001
Task/stimulation
Neural activity
CBF CBVCMRo2
dHb
T2* T2*
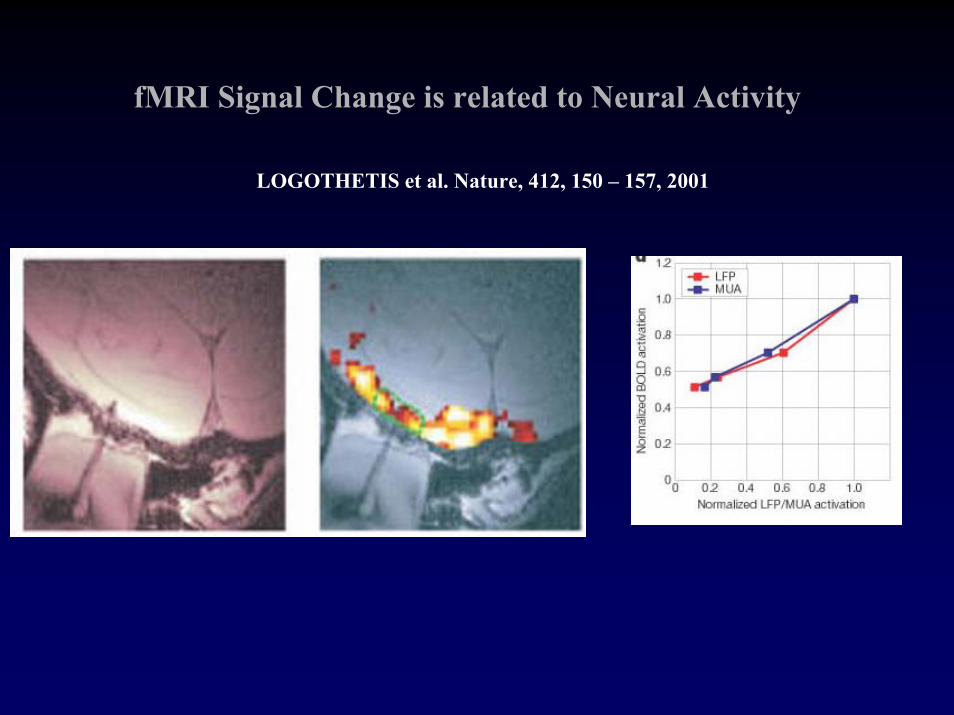
fMRI Signal Change is related to Neural Activity
LOGOTHETIS et al. Nature, 412, 150 – 157, 2001
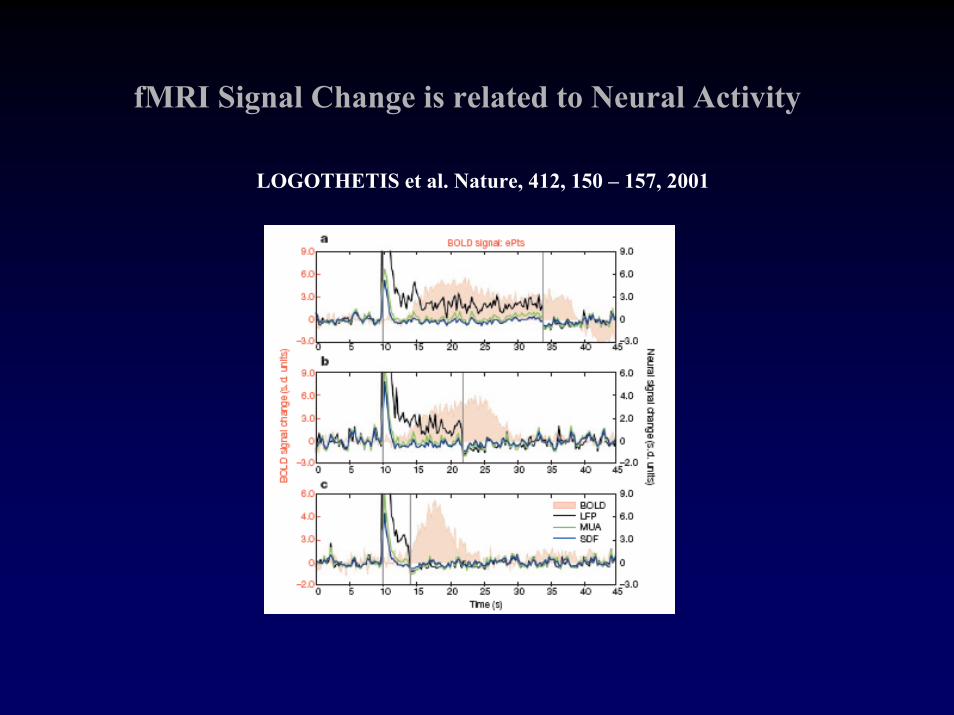
fMRI Signal Change is related to Neural Activity
LOGOTHETIS et al. Nature, 412, 150 – 157, 2001

0.94
0.97
1
1.03
1.06
1.09
0 100 200 300 400
Time (seconds)
Nor
mal
ized
BO
LD S
igna
l
25
30
35
40
45
50
55
ETC
O2
(mm
Hg)
n = 6 subjects for each study
Visual Stimulation under different baseline conditions
hypercapnia
hypocapnia
Cohen et al. JCBFM, 2002

-2
0
2
4
6
-4 0 4 8 12 16 20 24 28 32 36 40
Time (seconds)
Ave
rage
BO
LD C
hang
e (%
)
hypocapnia
normocapniahypercapnia
-0.4
0
0.4
0.8
1.2
0 0.5 1 1.5 2 2.5 3
Time (seconds)
Aver
age
BOLD
Cha
nge
(%)

Interpretation of fMRI signals
- fMRI signal is an index of ensemble of neural activity(presumably monotonic relation)
- Difficulty to compare fMRI signals across cortical regions and subjectsdue to BOLD signal dependencies on vascular structure and volume.
- Neural source of BOLD signal is not clear – spiking activities vs. synaptic activity, excitatory vs. inhibitory
- Excellent non-invasive tool to map whole brain functions with relatively high spatial (a few millimeters in humans) and temporal resolution (~a few seconds).

Physiological Basis
Biophysical Basis
Spatial Resolution
Interpretation - Quantification
Temporal Resolution

99
100
101
102
103
104
105
0 2 4 6 8 10 12 14 16 18 20
Time (sec)
+ 2 sec
- 2 sec
0 sec
Relative Delay Time
0
10
20
30
40
50
-2 -1.5 -1 -0.5 0 0.5 1 1.5 2
Relative Delay (sec)
# of
pix
els
Provided by P.A. Bandettini
Heterogeneity of fMRI changes in humans: response times(Bilateral finger movements)

Task Execution
BOLD response
Task Execution
BOLD response
Time to peak
Inter-epoch delay time (1 – 10 sec)
2 sec
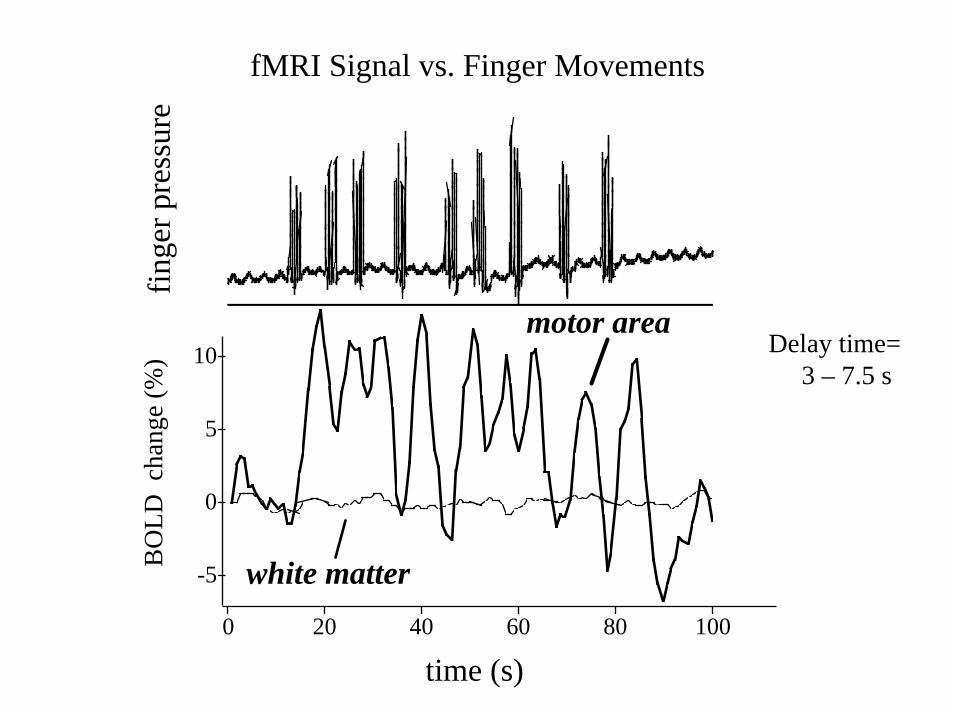
-5
0
5
10
15
20
25
0 20 40 60 80 100
time (s)
white matter
motor area
fMRI Signal vs. Finger Movements
BO
LD c
hang
e (%
)fin
ger p
ress
ure
Delay time=3 – 7.5 s

Presentation Contemplation Decision
time
displayed until decision is made
mental rotation experiment
Richter et al. J. Cogn. Neurosci, 1999
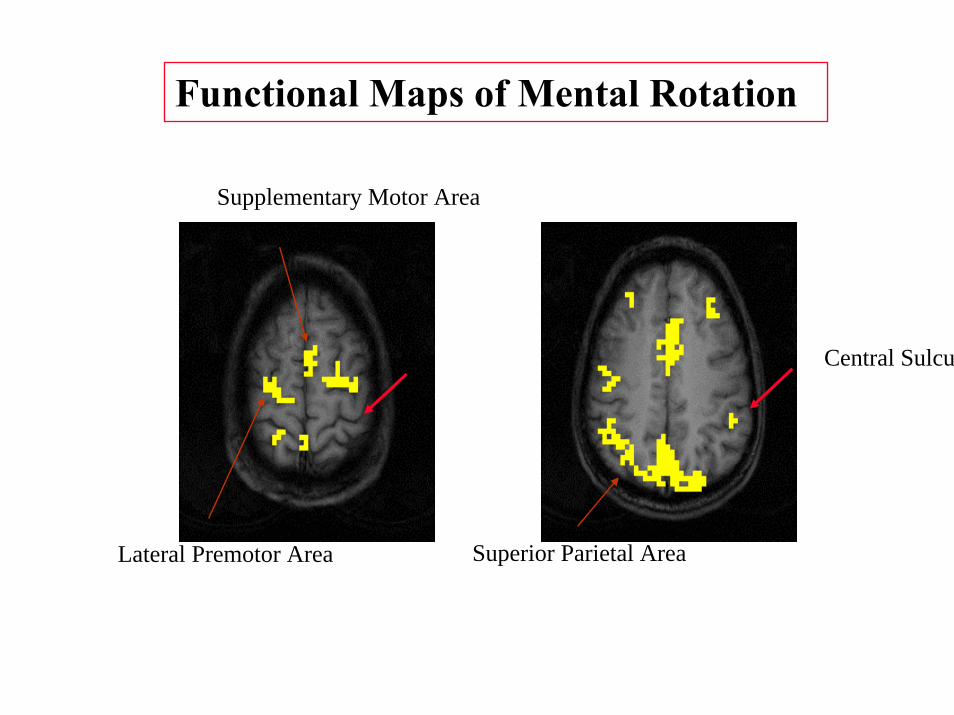
Superior Parietal Area
Supplementary Motor Area
Lateral Premotor Area
Central Sulcus
Functional Maps of Mental Rotation

-10 -5 0 5 10 15
1%R
elat
ive
fMR
I int
ensi
ty
Supplementary motor
Primary motor
Time from button press (sec)
Response Time-locked Time Courses in M1 and SMA