FluoroMax -3 & FluoroMax -P · 3880 Park Avenue, Edison, NJ 08820 In France: Japan: (81)...
198
Fluoromax-3 v. 2.0 (1 Oct 2001) i FluoroMax ® -3 & FluoroMax ® -P Operation Manual http://www.isainc.com Rev. 2 In the USA: Jobin Yvon Inc. 3880 Park Avenue, Edison, NJ 08820 In France: Japan: (81) 3/5823.0140 Tel: 1-732-494-8660 16-18, rue du Canal China: (86) 10/6836.6542 Fax: 1-732-549-5157 91165 Longjumeau cedex Germany: (49) 89/46.23.17-0 E-Mail: [email protected] Tel: (33) 1/64.54.13.00 Italy: (39) 2/57.60.47.62 1-800-533-5946 Fax: (33) 1/69.09.93.19 U.K.: (44) 208/2048142
Transcript of FluoroMax -3 & FluoroMax -P · 3880 Park Avenue, Edison, NJ 08820 In France: Japan: (81)...

Fluoromax-3 v. 2.0 (1 Oct 2001)
i
FluoroMax®-3 & FluoroMax®-P
Operation Manual http://www.isainc.com Rev. 2
In the USA: Jobin Yvon Inc. 3880 Park Avenue, Edison, NJ 08820 In France: Japan: (81) 3/5823.0140 Tel: 1-732-494-8660 16-18, rue du Canal China: (86) 10/6836.6542 Fax: 1-732-549-5157 91165 Longjumeau cedex Germany: (49) 89/46.23.17-0 E-Mail: [email protected] Tel: (33) 1/64.54.13.00 Italy: (39) 2/57.60.47.62 1-800-533-5946 Fax: (33) 1/69.09.93.19 U.K.: (44) 208/2048142

Fluoromax-3 v. 2.0 (1 Oct 2001)
ii
Copyright ©2001 by Jobin Yvon Inc.
All rights reserved. No part of this work may be reproduced, stored, in a retrieval system, or transmitted in any form by any means, including electronic or mechanical, photocopying and recording, without prior written permission from Jobin Yvon Inc. Requests for permission should be requested in writing.
Information in this manual is subject to change without notice, and does not represent a commitment on the part of the vendor.
October 2001
Part Number 81038

Fluoromax-3 v. 2.0 (1 Oct 2001)
iii
Table of Contents 0: Introduction ................................................................................................ 0-1
About the FluoroMax®-3 and FluoroMax®-P........................................................................................... 0-1 Chapter overview.................................................................................................................................... 0-2 Symbols used in this manual.................................................................................................................. 0-3
1: Requirements & Installation ............................................................................ 1-1 Surface requirements ............................................................................................................................. 1-1 Environmental requirements................................................................................................................... 1-2 Electrical requirements ........................................................................................................................... 1-3 Unpacking and Installation ..................................................................................................................... 1-4
2: System Description....................................................................................... 2-1 Introduction ............................................................................................................................................. 2-1 Basic theory of operation........................................................................................................................ 2-1 Optical layout .......................................................................................................................................... 2-1
3: System Operation......................................................................................... 3-1 Introduction ............................................................................................................................................. 3-1 Controls and indicators........................................................................................................................... 3-1 Turning on the system ............................................................................................................................ 3-2 Checking system performance............................................................................................................... 3-3
4: Data Acquisition........................................................................................... 4-1 Real Time Display................................................................................................................................... 4-2 Visual Instrument Setup ......................................................................................................................... 4-3 Run Experiment ...................................................................................................................................... 4-4 Constant Wavelength Analysis............................................................................................................... 4-9 Running an unknown sample ............................................................................................................... 4-10
5: Optimizing Data ........................................................................................... 5-1 Cuvette preparation ................................................................................................................................ 5-1 Sample preparation ................................................................................................................................ 5-2 Measuring the G factor ........................................................................................................................... 5-3 Improving the signal-to-noise ratio ......................................................................................................... 5-6 Correcting data ..................................................................................................................................... 5-12
6: Maintenance............................................................................................... 6-1 Introduction ............................................................................................................................................. 6-1 Lamp replacement.................................................................................................................................. 6-1 Electronics .............................................................................................................................................. 6-8
7: Components & Accessories ............................................................................. 7-1 Itemized list of FluoroMax®-3 accessories ............................................................................................. 7-2 Model 1940 Absorption/Transmission Accessory .................................................................................. 7-3 FL-1013 Liquid Nitrogen Dewar Assembly............................................................................................. 7-6 Model 1908MOD Scatter Block Assembly ............................................................................................. 7-7 Model 1908 Standard Lamp Assembly .................................................................................................. 7-7 Sample cells ........................................................................................................................................... 7-8 F-3000 Fiber Optic Mount....................................................................................................................... 7-9 Model 1938 Cut-On Filter ..................................................................................................................... 7-10 Model 1939 Cut-On Filter ..................................................................................................................... 7-10 FL-1010 Cut-On Filter Holder ............................................................................................................... 7-11 FL-1011 Four-Position Thermostatted Cell Holder .............................................................................. 7-12 FL-1012 Dual-Position Thermostatted Cell Holder .............................................................................. 7-14 Model 1933 Solid Sample Holder ......................................................................................................... 7-16

Fluoromax-3 v. 2.0 (1 Oct 2001)
iv
F-3005/6 Autotitration Injector .............................................................................................................. 7-18 Models F-3001, F-3002, and F-3003 Microscope Fiber-Optic Interfaces ............................................ 7-19 Model 1905-OFR 150-W Xenon Lamp................................................................................................. 7-20 F-3004 Sample Heater/Cooler Peltier Thermocouple Drive ................................................................ 7-21 MicroMax Microwell Plate Reader........................................................................................................ 7-22 Fl-1044 L-Format Polarizer................................................................................................................... 7-23 FL-1015 Injector Port............................................................................................................................ 7-24 F-1001/1 Temperature Bath ................................................................................................................. 7-25 Model TRIG-15/25 External Trigger Accessory ................................................................................... 7-26 FM-2005 Upgrade to FluoroMax®-P..................................................................................................... 7-27
8: Troubleshooting........................................................................................... 8-1 Using diagnostic spectra ........................................................................................................................ 8-4 Further assistance… .............................................................................................................................. 8-9
9: Producing Correction Factors ........................................................................... 9-1 Introduction ............................................................................................................................................. 9-1 Generating emission correction factors.................................................................................................. 9-2 Calculating emission correction factors.................................................................................................. 9-8 Calculating excitation correction factors............................................................................................... 9-11
10: Technical Specifications ..............................................................................10-1 Spectrofluorometer system................................................................................................................... 10-2 Minimum computer requirements......................................................................................................... 10-4 Software................................................................................................................................................ 10-4
11: Bibliography ............................................................................................11-1
12: Glossary .................................................................................................12-1
13: DataMax Initialization Files ..........................................................................13-1 Introduction ........................................................................................................................................... 13-1 SAQ.INI................................................................................................................................................. 13-3 SPEX.INI............................................................................................................................................... 13-4 ALLOBJCT.INI ...................................................................................................................................... 13-5 MONOx.INI ........................................................................................................................................... 13-7 SCx.INI.................................................................................................................................................. 13-8 ACQx.INI............................................................................................................................................... 13-9 Layout file for FluoroMax®-3 ............................................................................................................... 13-10 Layout files for the FluoroMax®-P....................................................................................................... 13-13
14: FluoroMax®-P Phosphorimeter Operation..........................................................14-1 Introduction ........................................................................................................................................... 14-1 Theory of operation .............................................................................................................................. 14-2 Applications for the phosphorimeter..................................................................................................... 14-5 Operation of the phosphorimeter.......................................................................................................... 14-7 Processing phosphorimeter data........................................................................................................ 14-10 Lamp replacement.............................................................................................................................. 14-11
15: Index .....................................................................................................15-1

Fluoromax-3 v. 2 (1 Oct 2001) Introduction
0-1
Note: Keep this and the other referencemanuals near the system.
0: Introduction About the FluoroMax®-3 and FluoroMax®-P
Both the FluoroMax®-3 and FluoroMax®-P are self-contained, fully automated spectro-fluorometer systems. Data output is viewed on a PC, while printouts may be obtained via an optional plotter or printer. All FluoroMax®-3 and FluoroMax®-P functions are under the control of DataMax spectroscopy software. The main parts of the Fluoro-Max®-3 and FluoroMax®-P spectrofluorometer systems are: • State-of-the-art optical components • A personal computer • DataMax for Windows™, the driving software. The difference between the FluoroMax®-3 and FluoroMax®-P is that the FluoroMax®-P contains a phosphorimeter for phosphorescence measurements. This manual explains how to operate and maintain a FluoroMax®-3 and FluoroMax®-P spectrofluorometer. The manual also describes measurements and tests essential to obtain accurate data. For a complete discussion of the almost limitless power provided by DataMax, refer to the DataMax Operation Manual (contains data-acquisition information) and the Grams/32® User’s Guide (contains post-processing instructions for data manipulation), which accompany the system.

Fluoromax-3 v. 2 (1 Oct 2001) Introduction
0-2
Chapter overview 1: Requirements & Installation Power and environmental requirements;
select the best spot for the instrument.
2: System Description How the FluoroMax®-3 and DataMax work.
3: System Operation Operation of the spectrofluorometer system, and calibration instructions.
4: Data Acquisition How to use the four applications in DataMax to acquire data; how to determine peaks in an unknown sample.
5: Optimizing Data Acquisition Hints for improving the signal-to-noise ratio, instructions for obtaining corrected data, and other information useful for optimizing data and ensuring reproducibility.
6: System Maintenance Routine maintenance procedures such as replacing the lamp.
7: Components & Accessories Description and application of the accessories available for the FluoroMax®-3.
8: Troubleshooting Potential sources of problems, their most probable causes, and possible solutions.
9: Producing Correction Factors How to correct for variation in sensitivity across the spectral range.
10: Technical Specifications Instrument specifications and computer requirements.
11: Glossary A list of some useful technical terms related to fluorescence spectroscopy.
12: Bibliography Important sources of information.
13: DataMax Initialization Files Printouts of important files used by DataMax to set up the FluoroMax®-3.
14: FluoroMax®-P Phosphorimeter Op-eration
Describes theory and operation of the phosphorimeter, and its applications, available on the FluoroMax®-P system.
15: Index

Fluoromax-3 v. 2 (1 Oct 2001) Introduction
0-3
Warning:
Note:
Symbols used in this manual Certain symbols are used throughout the text for special conditions when operating the instruments:
A hazardous condition exists, or danger exists that could damage the equipment. Jobin Yvon Inc. is not responsible for damage arising out of improper use of the equipment.
General information is given concerning operation of the equipment.

Fluoromax-3 v. 2 (1 Oct 2001) Introduction
0-4

FluoroMax-3 v. 2 (1 Oct 2001) Requirements & Installation
1-1
1: Requirements & Installation Surface requirements
• A sturdy table- or bench-top. • Surface must hold 90 kg (200 lbs.). • Surface should be about 27" × 72" (69 cm × 183 cm) to hold spectrofluorometer,
computer, and accessories comfortably. • Overhead clearance should be at least 36" (91 cm).

FluoroMax-3 v. 2 (1 Oct 2001) Requirements & Installation
1-2
Warning: Excessive humidity can damage the optics.
Warning: For adequate cool-ing, do not cover, block, or obstruct the vents on the left side and underside of the in-strument.
Environmental requirements • Temperature 59–86°F (15–30°C) • Maximum temperature fluctuation ± 2°C • Ambient relative humidity < 75% • Low dust levels • No special ventilation

FluoroMax-3 v. 2 (1 Oct 2001) Requirements & Installation
1-3
Warning: Jobin Yvon Inc. is not liable for damage from line surges and voltage fluctuations. A surge protector is strongly recom-mended for minor power fluctuations. For more severe voltage variations, use a generator or uninterruptible power supply. Im-proper line voltages can damage the equipment severely.
Warning: The FluoroMax®-3 is equipped with a three-conductor power cord that is connected to the system frame (earth) ground. This ground provides a return path for fault current from equipment malfunction or external faults. For all instruments, ground continu-ity is required for safe operation. Any discontinuity in the ground line can make the instrument unsafe for use. Do not operate this system from an ungrounded source.
Note: Jobin Yvon Inc. recommends connecting the host com-puter, monitor, and printer to a single surge-protector, to make start-up more convenient, and to conserve AC outlets. Connect the FluoroMax®-3 to a separate line, if possible, to isolate the xe-non-lamp power supply inside the FluoroMax®-3.
Electrical requirements • 110 VAC ± 5%, 60 Hz; or 220 VAC ± 5%, 50 Hz • Have enough outlets available for:
Host computer (PC) Monitor Optional printer FluoroMax®-3 Each of certain accessories, such the MicroMax, temperature bath, etc.

FluoroMax-3 v. 2 (1 Oct 2001) Requirements & Installation
1-4
Note: Many public carriers will not recognize a claim for concealed damage if it is re-ported later than 15 days af-ter delivery. In case of a claim, inspection by an agent of the carrier is required. For this reason, the original pack-ing material should be re-tained as evidence of alleged mishandling or abuse. While Jobin Yvon Inc. assumes no responsibility for damage oc-curring during transit, the company will make every ef-fort to aid and advise.
Warning: The spectrofluoro-meter system is a delicate instrument. Mishandling may seriously damage its compo-nents.
Unpacking and installation Introduction
The FluoroMax®-3 spectrofluorometer system is delivered in a single packing carton. If a host computer (PC) is ordered as a part of the system, the PC is delivered in a few clearly labeled boxes. All accessories, cables, software, and manuals ordered with the system are included with the delivery. Examine the shipping boxes carefully. Any evidence of damage should be noted on the delivery receipt and signed by representatives of the receiving and carrier companies. Once a location has been chosen, unpack and assemble the equipment as described below. To avoid excessive moving and handling, the equipment should be unpacked as close as possible to the selected location.
FluoroMax®-3 carton contents Quantity Item Part number
1 FluoroMax®-3 1 Null modem communications cable 400144 1 Power cord (110 V)
(220 V) 98015 98020
1 DataMax software package

FluoroMax-3 v. 2 (1 Oct 2001) Requirements & Installation
1-5
Warning: Watch your fingers!
Unpacking and installation
1 Carefully open the FluoroMax®-3 shipping car-ton.
2 Remove the foam-injected top piece and any other shipping restraints in the carton.
3 With a co-worker or two, carefully lift the instru-ment from the carton, and rest it on the side of the laboratory bench where the system will stay.
4 Place the instrument in its permanent location. 5 Level the spectrofluorometer.
Adjust the four leveling feet on the bottom of the instrument.
6 Inspect for previously hidden damage. Notify the carrier and Jobin Yvon Inc. if any is found.
7 Check the packing list to verify that all components and accessories are present.
8 Plug one end of the power cord into the proper receptacle on the left side (while facing the unit) of the spectro-fluorometer.

FluoroMax-3 v. 2 (1 Oct 2001) Requirements & Installation
1-6
9 Plug one end of the 9-pin communications cable into this 9-pin connector (COM1) on the FluoroMax®-3’s right panel.
10 With an optional trigger accessory, plug one end of the trigger cable into this 25-pin connector on the FluoroMax®-3. Allow the unconnected ends of the cables to dangle freely; they will be con-nected in later steps.
Computer installation The information gathered by the spectrofluorometer system is displayed and controlled through the host PC via DataMax software. The host PC may be purchased from Jobin Yvon Inc. or another supplier. Set up the host PC reasonably close to the FluoroMax®-3 system. The limitation is the length of the null modem communications cable. The recommended location for the PC is just to the right of the spectrofluorometer, but other positions are possible. Follow the instructions for the host PC to set up the computer system, including the CPU, monitor, keyboard, mouse, speakers, printers, etc.
Connecting the FluoroMax® to the computer
1 Attach the free end of the communication cable to COM1 (first serial port) of the computer. If COM1 is not available, then use an unused serial port (COM) on the host computer. If only a 25-pin connector is available, use a standard 25-pin–9-pin converter, or contact Spex® Fluorescence Service for assistance. During soft-ware installation, the serial port setting used on the host computer to communi-cate with the FluoroMax®-3 is entered.

FluoroMax-3 v. 2 (1 Oct 2001) Requirements & Installation
1-7
2 With all devices OFF, plug the power cords from the monitor, computer, FluoroMax®, and the printer into properly grounded receptacles.
3 If a Trigger-box accessory is included, attach the free end of the Trigger-box cable to the Trigger box.
4 Install any accessories that arrived with the sys-tem, using the instructions that accompany the accessory. See Chapter 7 for a detailed list of accessories.
Software installation The spectrofluorometer system is controlled by DataMax spectroscopy software operat-ing within the Windows™ environment. If the computer and software were purchased from Jobin Yvon Inc., the software installation is complete. If the computer is not from Jobin Yvon Inc., perform the installation. Contact a Jobin Yvon Inc. Sales Representative for recommended specifications for a suitable host computer. Before the DataMax software can be installed, however, Windows™ must be installed already and operating properly. Refer to the Windows™ manual that came with the computer for installation instructions. The DataMax software is supplied on one CD-ROM. The 3½" floppy disk is the DataMax Instrument Disk (or DataMax INI disk), which contains the spectrofluorome-ter’s specific hardware configuration.
If Autorun is enabled:
1 Turn on the com-puter, and insert the DataMax CD-ROM. The set-up win-dow to install DataMax appears:

FluoroMax-3 v. 2 (1 Oct 2001) Requirements & Installation
1-8
Note: The Feature Pack is also on the DataMax CD-ROM.
2 Click Install Datamax. A warning appears, re-minding you to install the Feature Pack after DataMax.
3 Click OK. The computer automatically installs DataMax.
4 The computer asks for the instrument (INI) floppy disk. Insert the floppy disk into drive A:.
5 Use the default options. The computer in-stalls the options, then returns to the set-up window:
6 Click Install Feature Pack.
7 Accept the default options. After installation, the computer returns to the set-up window.
8 Click Exit.

FluoroMax-3 v. 2 (1 Oct 2001) Requirements & Installation
1-9
If Autorun is disabled, use the following—or other appropriate—method:
1 Insert the DataMax CD-ROM into the drive. 2 Go into
Windows™ Control Panel.
3 Click
Add/Remove Programs.
This opens the Add/Remove Programs Properties dialog box:
4 Click Install… This opens the Run Installation Program window. The computer should find the SETUP.EXE file on the CD-ROM drive.
5 Click Finish to finish the installation.
Users outside of the USA: Users outside of the USA receive a softkey device that connects to the printer port of the host computer for software security. The softkey should be left in place on the host computer at all times.
FluoroMax-3 v. 2 (1 Oct 2001) Requirements & Installation
1-10

Fluoromax-3 v. 2.0 (25 Jan 2002) System Description
2-1
2: System Description Introduction
A spectrofluorometer is an analytical instrument used to measure and record the fluo-rescence of a sample. While recording the fluorescence, the excitation, emission, or both wavelengths may be scanned. With additional accessories, variation of signal with time, temperature, concentration, polarization, or other variables may be monitored.
Basic theory of operation A continuous source of light shines onto an excitation monochromator, which selects a band of wavelengths. This monochromatic excitation light is directed onto a sample, which emits luminescence. The luminescence is directed into a second, emission mono-chromator, which selects a band of wavelengths, and shines them onto a detector. The signal from the detector is reported to a system controller and host computer, where the data can be manipulated and presented, using special software.
Optical layout
1 Xenon arc-lamp and lamp housing 1a Xenon-lamp power supply 1b Xenon flash lamp (FluoroMax®-P only) 2 Excitation monochromator
23
1
4
5
71a
61b
Fluoromax-3 v. 2.0 (25 Jan 2002) System Description
2-2
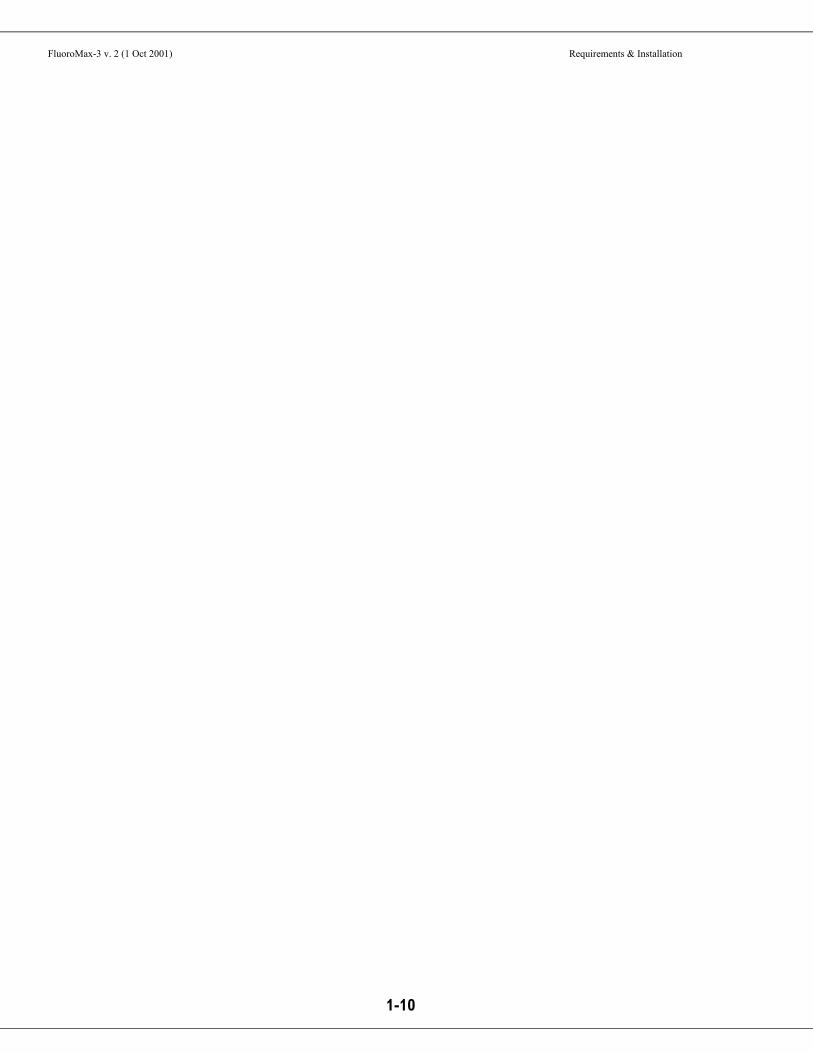
Left: motor and gear-box that rotate the mir-ror to switch lamps. Right: Twin sources in the FluoroMax®-P.
CW lamp
flash lamp
3 Sample compartment 4 Emission monochromator 5 Signal detector (photomultiplier tube and housing) 6 Reference detector (photodiode and current-acquisition module) 7 Instrument controller Host computer (not on diagram)
Illuminator (xenon arc-lamp, 1) The continuous light source is a 150-W ozone-free xenon arc-lamp. Light from the lamp is collected by a diamond-turned elliptical mirror, and then focused on the entrance slit of the excitation monochromator. A portion of the light is directed upward to the Spex® logo on the instrument cover, to provide a “lamp on” indicator on the front panel. The lamp housing is separated from the excitation monochromator by a quartz window. This vents heat out of the instrument, and protects against the unlikely occurrence of lamp failure. In the FluoroMax®-P, a second source, a xenon flash lamp, is available also. A DataMax-controlled motor and gearbox rotate the mirror in the illumination area, in or-der to switch between the CW source and the flash lamp.
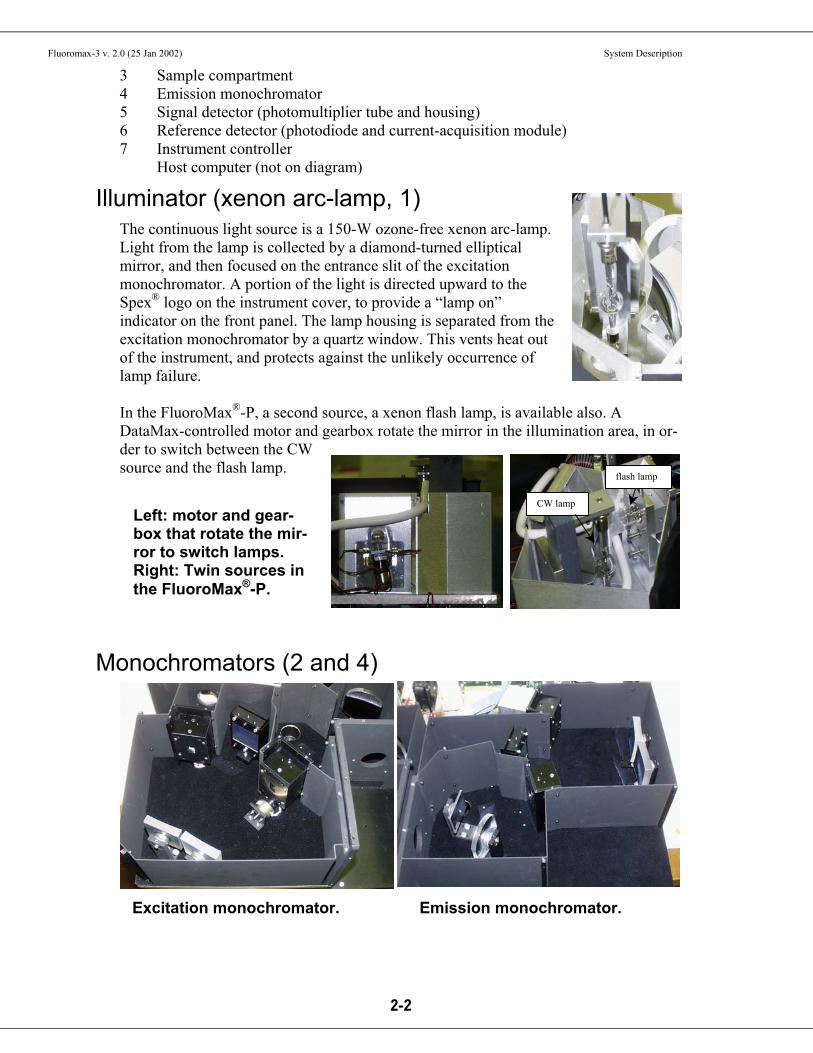
Monochromators (2 and 4) Excitation monochromator. Emission monochromator.

Fluoromax-3 v. 2.0 (25 Jan 2002) System Description
2-3
The FluoroMax®-3 contains Czerny-Turner monochromators for excitation and emis-sion. The Czerny-Turner design uses all-reflective optics to maintain high resolution over the entire spectral range, and minimize spherical aberrations and re-diffraction.
Gratings The essential part of a monochromator is a reflection grating. A grating disperses the incident light by means of its vertical grooves. A spectrum is obtained by rotating the gratings, and recording the intensity values at each wavelength. The gratings in the Fluoro-Max®-3 contain 1200 grooves mm–1, and are blazed at 330 nm (excitation) and 500 nm (emission). Blazing is etching the grooves at a particular angle, to optimize the grating’s reflectivity in a par-ticular spectral region. The wavelengths selected are optimal for ex-citation in the UV and visible, and for emission in the high-UV to near-IR. Each grating is coated with MgF2 for protection against oxidation. The system uses a direct drive for each grating, to scan the spectrum at up to 200 nm s–1, with accu-racy better than 0.5 nm, and repeatability of 0.3 nm.
Slits The entrance and exit ports of each monochromator have continuously adjustable slits controlled by DataMax. The width of the slits on the excitation monochromator deter-mines the bandpass of light incident on the sample. The emission monochromator’s slits control the intensity of the fluorescence signal recorded by the signal detector. When setting slit width, the trade-off is intensity of signal versus spectral resolution. The wider the slits are, the more light falls on the sample and detector, but the resolu-tion decreases. The narrower the slits are, the higher the resolution gets, but at the ex-pense of signal. Set the slits for intensity toward the higher end of the detector’s linear response, with sharp-enough resolution to discern desired spectral features. Slits may be set in bandpass units, or the physical width of the slit (mm). Under band-pass units, each monochromator’s slits are set simultaneously, for the bandpass is de-termined by the dispersion of the monochromator: bandpass (in nm) = slit width (in mm) × dispersion (in nm mm–1) The dispersion of FluoroMax®-3 monochromators is 4.25 nm mm–1, for gratings with 1200 grooves mm–1. Below is a table showing standard slit widths with their corre-sponding bandpasses. Slit width (mm) Bandpass (nm) Rounded bandpass (nm) 0.50 2.125 2 1.175 4.994 5 2.00 8.500 8.5
Shutters An excitation shutter, standard on the FluoroMax®-3, is located just after the excitation monochromator’s exit slit. The shutter protects samples from photobleaching or photo-degradation from prolonged exposure to the light source. DataMax controls the shutter,

Fluoromax-3 v. 2.0 (25 Jan 2002) System Description
2-4
and can set the shutter to automatic or photobleach modes. An emission shutter is an optional accessory, placed just before the emission monochromator’s entrance, and pro-tects the detector from bright light.
Sample compartment (3) A toroidal mirror focuses the beam from the excitation monochromator on the sample. About 8% of this excitation light is split off, using a beam-splitter, to the reference pho-todiode. Fluorescence from the sample is then collected and directed to the emission spectrometer. The sample compartment accommodates various optional accessories, as well as fiber-optic bundles to take the excitation beam to a remote sample (or the MicroMax), and return the emission beam to the emission monochromator. See Chapter 7 for a list of accessories.
To insert or remove a sample platform,
1 If a multiple-sample turret is installed, shut off the system.
2 Remove the four screws on the front of the sample platform.
3 Slide out the old platform. 4 Slide in the new platform. 5 If the platform has a rotatable turret or magnetic
stirrer, slide the 15-pin connector gently and se-curely onto the 15-pin receptacle in the sample compartment.
6 Re-attach the four screws on the front of the sample platform.
Detectors (5 and 6) Each FluoroMax®-3 contains two detectors: • Signal detector The signal detector is a photon-
counting detector. This detector is an R928P photomultiplier tube, which sends the signal to a photon-counting module. The detector’s response ranges from 180–850 nm, with dark counts < 1000 counts per second (cps). The linear range for photon counting is 0–4 mil-

Fluoromax-3 v. 2.0 (25 Jan 2002) System Description
2-5
Slave-controller electronics above the optical platform.
Lamp power supply (1a).
lion cps. The working range is up to about 1–2 million cps. Above 4 million cps, photon-pulse pile-up reduces the signal-to-noise ratio, and causes the detector to lose its linear re-sponse.
• Reference detector The reference detector monitors the xenon lamp, in order to correct for wavelength- and time-dependent output of the lamp. This detector is a UV-enhanced silicon photodiode, which is just before the sample compartment. It requires no external bias, and has good re-sponse from 190–980 nm. The output is collected by a cur-rent-input module, with a range from 0–12 µA.
Both the reference and signal detectors have correction-factor files run for them, to cor-rect for wavelength dependencies of each optical component. The files are created at Jobin Yvon Inc. for every instrument, and may be applied to data through DataMax. See Chapter 9 for more details.
Electronics and controllers (1a and 7) The right rear and bottom of the FluoroMax®-3 houses the electronics for running the lamp, instrument, scans, and measurements.

Fluoromax-3 v. 2.0 (25 Jan 2002) System Description
2-6
Electronics underneath the optical platform.
• Xenon-lamp power
supply (1a) This supply is a tunable 180-W-maximum power supply. It supplies a large start-up voltage to the 150-W xenon lamp, then holds the lamp steady at 12 V. The voltage is filtered, to stabilize the illumination as much as possible. The lamp is started with the left rocker-switch on the front-right panel of the instrument.
• Slave controller Located on the right rear of the FluoroMax®-3, it is com-posed of a dedicated motherboard that holds control and data-acquisition cards. A set of drivers is held in firm-ware on the motherboard, for low-level instrument con-trol. This controller is linked to the host computer via a null modem serial link. The controller houses the CTI (counter, timer, integrator) card, for all instrument con-trol and data-acquisition.
• Monochromator 180F boards and optional ac-cessory board
Underneath the optical platform, there are several control boards. They control the monochromators and any op-tional accessories connected to the sample compartment. See Chapter 8 for more details.
Computer system and software (not on diagram) Not shown on the schematic is the host computer with DataMax software. The techni-cal specifications chapter lists the computer requirements. An optional printer or net-work card is useful for printing. DataMax software for Windows™ controls all interac-tion with the spectrofluorometer. For information on DataMax, see the DataMax Op-eration Manual and the GRAMS/32® User’s Guide.
Excitation monochro-mator control board
Emission monochro-mator control board
Sample compartment
Excitation mono-chromator direct drive
Emission monochro-mator direct drive
Emission PMT
Accessory control board may be here
Photon-counting module for PMT
AC power, DC sup-plies, and filters

Fluoromax-3 v. 2.0 (12 Feb 2002) System Operation
3-1
Note: Each time the xenon lamp is ignited adds one more hour to lamp use. Jobin Yvon Inc. suggests leaving the lamp on between brief periods of inactivity.
3: System Operation Introduction
This chapter explains how to turn on the FluoroMax®-3 system, check its calibration, and, if necessary, recalibrate the spectrometers. While doing these procedures, how to define a scan, run a scan, and optimize system settings to obtain the best results is ex-plained.
Controls and indicators Power switch
The power switch is located on the lower right-hand side of the instrument. When switched on, the xenon lamp arcs immediately, and the FluoroMax®-3 turns on.
Lamp-on indicator Once the lamp is operating normally, the Spex® logo is illuminated on the upper front panel.
Hour meter An hour meter is mounted on the lower right-hand side, to monitor total usage of the xenon lamp.
Fluoromax-3 v. 2.0 (12 Feb 2002) System Operation
3-2
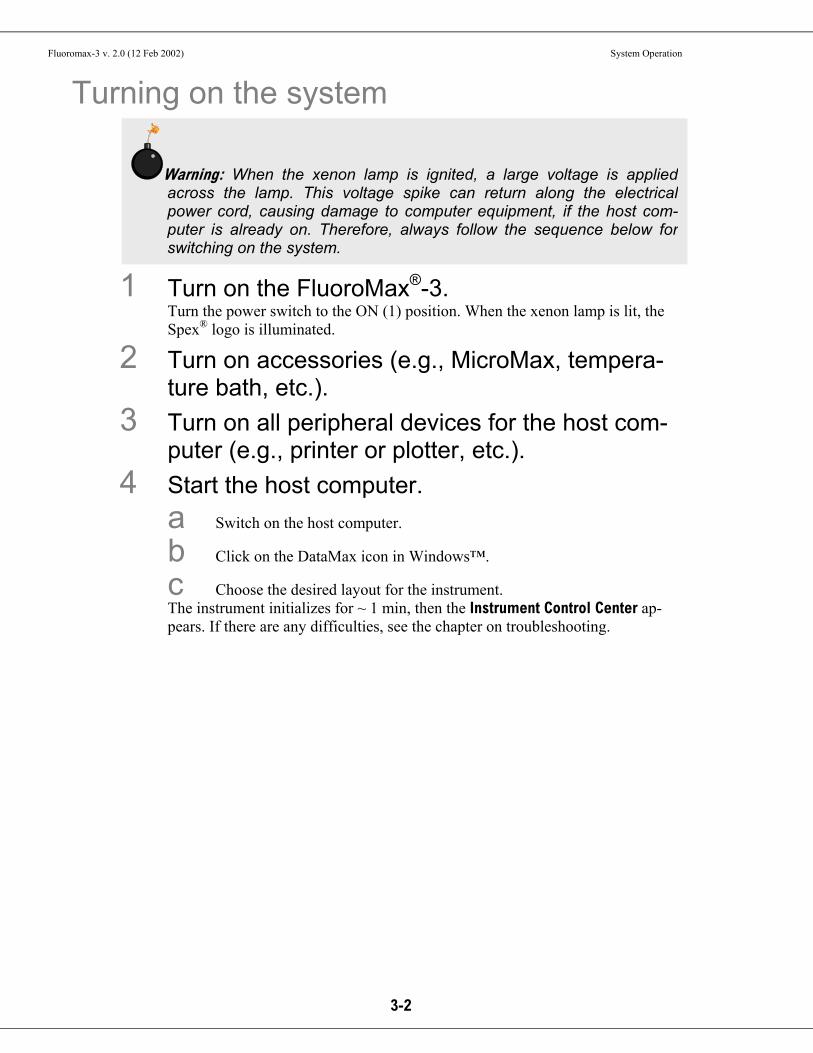
Warning: When the xenon lamp is ignited, a large voltage is appliedacross the lamp. This voltage spike can return along the electricalpower cord, causing damage to computer equipment, if the host com-puter is already on. Therefore, always follow the sequence below forswitching on the system.
Turning on the system
1 Turn on the FluoroMax®-3. Turn the power switch to the ON (1) position. When the xenon lamp is lit, the Spex® logo is illuminated.
2 Turn on accessories (e.g., MicroMax, tempera-ture bath, etc.).
3 Turn on all peripheral devices for the host com-puter (e.g., printer or plotter, etc.).
4 Start the host computer. a Switch on the host computer.
b Click on the DataMax icon in Windows™.
c Choose the desired layout for the instrument. The instrument initializes for ~ 1 min, then the Instrument Control Center ap-pears. If there are any difficulties, see the chapter on troubleshooting.

Fluoromax-3 v. 2.0 (12 Feb 2002) System Operation
3-3
Checking system performance Introduction
Upon installation and as part of routine maintenance checks, examine the performance of the FluoroMax®-3. Jobin Yvon recommends checking the system calibration before each day of use with the system. Scans of the xenon-lamp output and the Raman-scatter band of water are sufficient to verify system calibration, repeatability, and throughput. • Calibration is the procedure whereby the drive of each spectrometer is referenced
to a known spectral feature. One verifies the excitation and emission monochromators’ calibration at a particular wavelength in this step.
• Repeatability is the ability of the system to produce consistent spectra. • Throughput is the amount of signal passing through and detected by the system.
The throughput is correlated to the signal-to-noise ratio and sensitivity of the system.
The FluoroMax®-3 is an autocalibrating spectrofluorometer. This means the system initializes its monchromators’ drives, locates the home position of the each drive, and assigns a wavelength value to this position from a calibration file. While the system usually maintains calibration by this method, it is wise to check the calibration prior to the day’s session with the instrument. For the calibration checks detailed here, a single-sample mount or automated sample changer should be the only sample-compartment accessories used. The scans shown herein are examples. A Performance Test Report for your new in-strument is included with the documentation. Use the Performance Test Report to vali-date the spectral shape and relative intensity taken during the calibration checks.

Fluoromax-3 v. 2.0 (12 Feb 2002) System Operation
3-4
Excitation calibration check This calibration check verifies the wavelength calibration of your excitation mono-chromator, using the reference photodiode located before the sample compartment. It is an excitation scan of the xenon lamp’s output, and should be the first check performed.
1 Secure the lid of the sample chamber in place. 2 On the Run Experiment toolbar, select the Ex-
periment button.
This opens the Emission Acquisition dialog box:
3 Click on the Exp Type… button. This opens the Select Experiment Type dialog box:
4 Choose Excitation Acquisition. Click OK to close the Select Experiment Type dialog box.

Fluoromax-3 v. 2.0 (12 Feb 2002) System Operation
3-5
The Emission Acquisition window will convert to Excitation Acquistion. (For calibration and calibration verification, always adjust the excitation spectrome-ter first.)
5 Set the scan parameters for the xenon lamp scan:
a In the Excitation Acquisition dialog box: Name the experimental parameters lamp.exp, Start the scan at 220 nm, Step the wavelength by 0.5 nm, Set the emission to 400 nm, Perform 1 scan.
Use a filename lamp.spc, End the scan at 600 nm, Use an Integration Time of 0.1 s.
Describe the file as the spectral profile of the xenon lamp.
Fluoromax-3 v. 2.0 (12 Feb 2002) System Operation
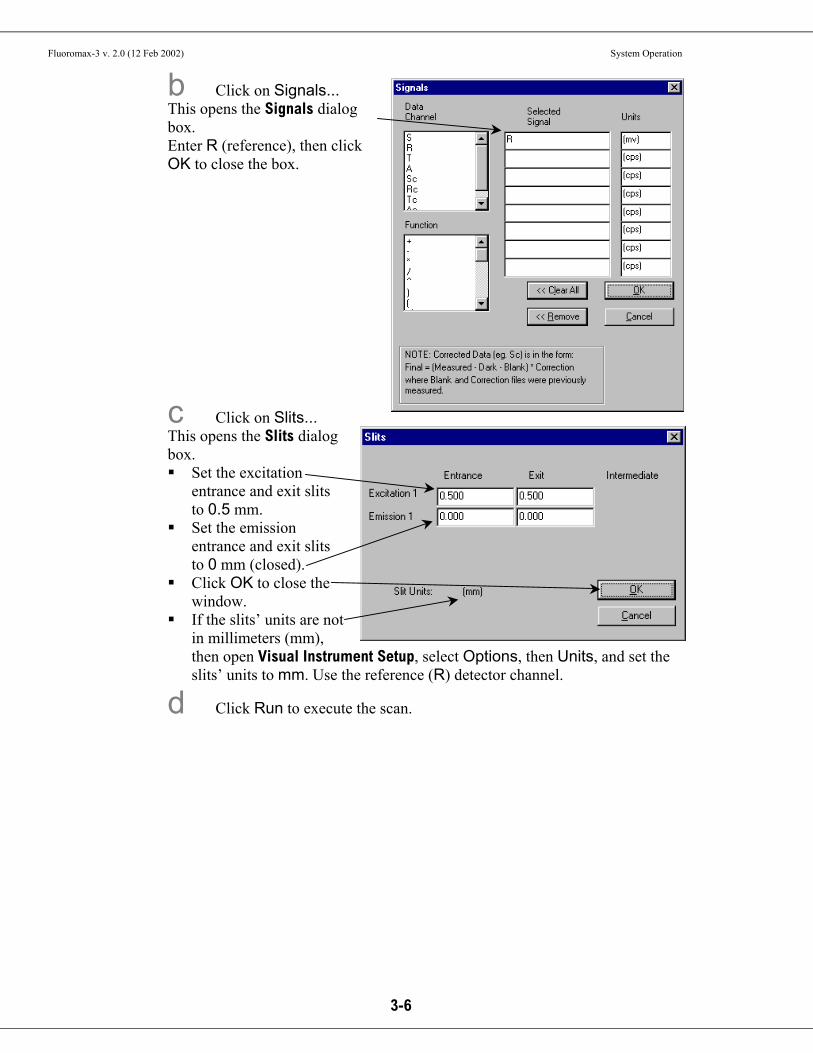
3-6
b Click on Signals... This opens the Signals dialog box. Enter R (reference), then click OK to close the box.
c Click on Slits... This opens the Slits dialog box. Set the excitation
entrance and exit slits to 0.5 mm.
Set the emission entrance and exit slits to 0 mm (closed).
Click OK to close the window.
If the slits’ units are not in millimeters (mm), then open Visual Instrument Setup, select Options, then Units, and set the slits’ units to mm. Use the reference (R) detector channel.
d Click Run to execute the scan.

Fluoromax-3 v. 2.0 (12 Feb 2002) System Operation
3-7
Find the calibration peak for the xenon-lamp spectrum. The 467-nm peak is used for excitation calibration. The intensity of this spectrum should be noted for reference, although it is not used for instrument specifications.
Is the peak at 467 ± 0.5 nm?
Instrument is within specification. Go to emission cali-bration check.
Instrument is not within specification. Recalibrate excitation monochromator.
No Yes
structure ~ 450 nm calibration peak at 467
broadband

Fluoromax-3 v. 2.0 (12 Feb 2002) System Operation
3-8
Note: The Visual Instrument Setup varies, depend-ing on the in-strument con-figuration.
Excitation-monochromator recalibration Re-calibration of the FluoroMax®-3 is performed by moving to the position of the ob-served peak, going into Visual Instrument Setup, and telling the software the correct position for this peak. The software saves this change in position to the calibration file.
1 Note the wavelength where the 467-nm peak was observed.
2 Open the Real Time Display.
3 Set the excitation monochromator to the position where the peak was observed. Hit the Tab key to set the monochromator to the entered value.
4 Close the Real Time Display.
5 Open the Visual Instrument Setup dialog box:
6 Click on the grating for the excitation mono-chromator. The Grating/Turret dialog box appears.

Fluoromax-3 v. 2.0 (12 Feb 2002) System Operation
3-9
7 Click on the Calibrate... button. This opens the Enter Correct Position dialog box:
8 Enter the actual xenon-lamp peak, 467 nm.
9 Click OK. The excitation monochromator should now be calibrated.
10 Click Close to close the Grating/Turret dialog box.
11 Close Visual Instrument Setup. 12 Confirm that the excitation monochromator is
calibrated by running another lamp scan in Run Experiment. This time the peak should occur at 467 ± 0.5 nm.

Fluoromax-3 v. 2.0 (12 Feb 2002) System Operation
3-10
Note: Avoid glass or acrylic cuvettes: they may exhibit UV fluorescence or filtering ef-fects.
Note: The emission calibration of the instrument is directly affected by the calibration of the excitation monochromator.
Emission calibration check
This calibration check verifies the wavelength calibration of the emission monochroma-tor with the emission photomultiplier tube. It is an emission scan of the Raman-scatter band of water performed in right-angle mode. This check should be performed after the xenon-lamp scan. When completed, the performance of the system has been verified. The water sample should be research-quality, triple-distilled or deionized water. HPLC-grade (18-MΩ spec.) or equivalent water is suggested for the Raman scan. Impure sam-ples of water will cause elevated background levels as well as distorted spectra with (perhaps) some unwelcome peaks. Use a 4-mL quartz cuvette.
1 Insert the water sample into the sample compartment. With an automated sample changer, note the position number in which the sam-ple cell is placed.
2 Make sure the lid of the sample chamber is se-curely in place.
3 In the Run Experiment toolbar, choose the Ex-periment button.
This opens the Emission Acquisition dialog box.
a Click on Exp Type… to open the Select Experi-ment Type dialog box:
Choose Emission Acquisition. Click OK to close the box.
Fluoromax-3 v. 2.0 (12 Feb 2002) System Operation
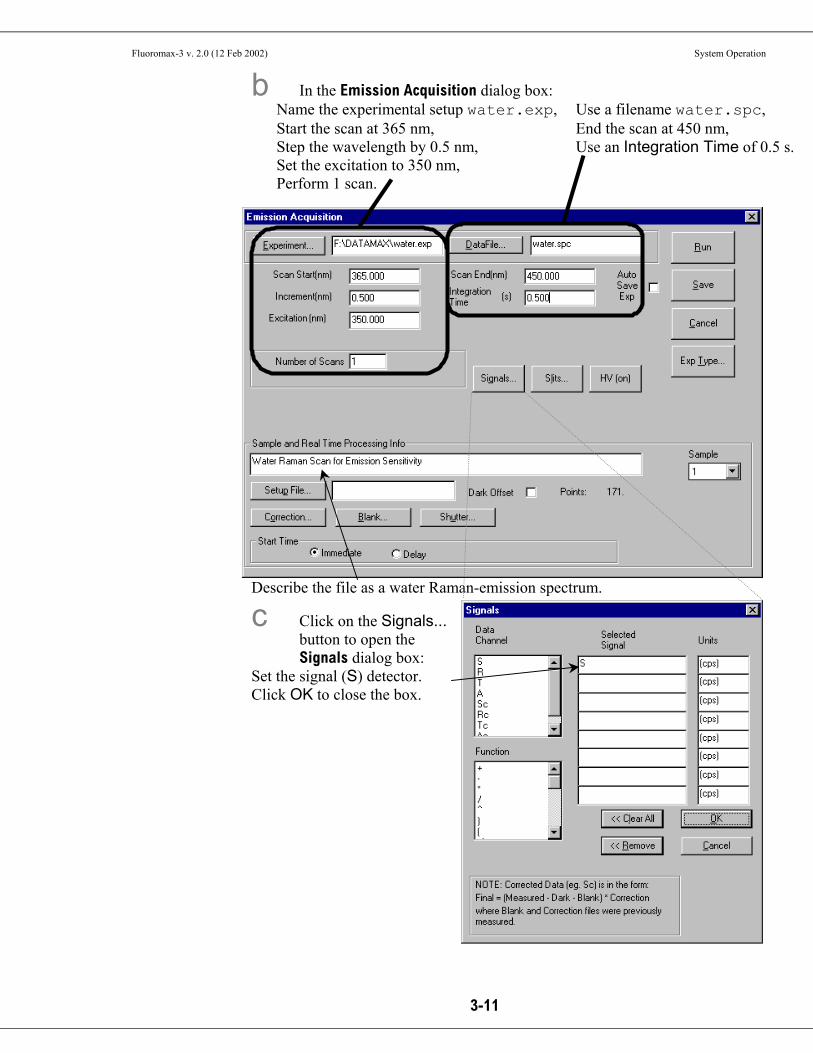
3-11
b In the Emission Acquisition dialog box: Name the experimental setup water.exp, Start the scan at 365 nm, Step the wavelength by 0.5 nm, Set the excitation to 350 nm, Perform 1 scan.
Use a filename water.spc, End the scan at 450 nm, Use an Integration Time of 0.5 s.
Describe the file as a water Raman-emission spectrum.
c Click on the Signals... button to open the Signals dialog box:
Set the signal (S) detector. Click OK to close the box.

Fluoromax-3 v. 2.0 (12 Feb 2002) System Operation
3-12
For a new instrument, intensity > 300 000 counts s–1.
water Raman peak at 397 nm
d Click on the Slits... button to open the Slits dialog box:
Set the slits to 5 nm. Click OK to close the box. If your slits’ units are not in bandpass units (nm), then open Visual Instrument Setup, select Options, then Units, and set the slits’ units to nm.
e Click Run to execute the scan. Your spectrum should resemble the following:

Fluoromax-3 v. 2.0 (12 Feb 2002) System Operation
3-13
Note: Observed throughput (and hence peak intensity) is affected by lamp age and alignment, slit settings, and sample purity. As the xenon lamp ages, the throughput of the system will decline slowly. Therefore, low water Raman peak intensity may indicate a need to replace the xenon lamp.
The Rayleigh scatter band or excitation band, which is about 10 times the intensity of the Raman band, occurs at 350 nm (the excitation wavelength). The scan begins at 365 in order to avoid detecting the Rayleigh band.
4 Find the peak of the water Raman band.
Is the peak at 397 ± 0.5 nm?
Instrument is within specification. Calibration is com-plete.
Instrument is not within specification.
No Yes
Has the excitation monochromator been calibrated?
Continue on to Emission re-calibration.
Yes
Go back to Excitation calibration.
No

Fluoromax-3 v. 2.0 (12 Feb 2002) System Operation
3-14
Emission recalibration Calibration for the FluoroMax®-3 is performed by: • moving to the position of the observed peak, • going to the Visual Instrument Setup application, and • telling the software the correct position for this peak. The software will save this change in position to the calibration file.
1 Note where the 397-nm peak was observed. 2 Open the Real Time
Display. 3 Reset the emission
monochromator to the position where the peak was observed. Hit Tab to set the monochromator to the entered value.
4 Close the Real Time Display.

Fluoromax-3 v. 2.0 (12 Feb 2002) System Operation
3-15
Note: The VisualInstrument Setup varies, depend-ing on the in-strument con-figuration.
5 Open the Visual Instrument Setup dialog box:
6 Click on the grating for the emission mono-chromator.
The Grating/Turret dialog box appears:
7 Click on the Calibrate... button.
This opens the Enter Correct Position dialog box:
8 Enter 397 nm, the ac-tual peak position us-ing 350-nm excitation.
9 Click OK to close the dialog box. The emission monochromator now should be calibrated.
10 Click OK to close the Grating/Turret dialog box. 11 Close Visual Instrument Setup.

Fluoromax-3 v. 2.0 (12 Feb 2002) System Operation
3-16
12 Confirm that the emission monochromator is calibrated, by running another water Raman scan in Run Experiment. This time the peak should occur at 397 ± 0.5 nm.
Fluoromax-3 v. 2.0 (12 Feb 2002) System Operation
3-17
Notes on excitation and emission calibration • Two experiments, lamp.exp and water.exp, have been defined and saved.
They can be run, after the system is switched on each day, to check the calibration and performance of the FluoroMax®-3.
• Jobin Yvon Inc. recommends monitoring the number of hours of xenon-lamp use, via the hour meter.
• Additionally, you may want to record the water-Raman intensity daily or weekly. • The lamp is rated for 1200–1500 h, but if the Raman intensity starts to drop, you
may wish to change the lamp sooner.

Fluoromax-3 v. 2.0 (12 Feb 2002) System Operation
3-18

Fluoromax-3 v. 2.0 (12 Feb 2002) Data Acquisition
4-1
4: Data Acquisition This chapter presents an introduction to the four applications used in DataMax to record and present data with the FluoroMax®-3. These applications, started in DataMax’s In-strument Control Center, are: Run Experiment Real Time Display
Visual Instrument Setup
Constant Wavelength Analysis
For a detailed description of these four DataMax routines, see the DataMax Operation Manual. In addition, two methods for determining best excitation and emission wavelengths are presented, in case these wavelengths are unknown for the sample.

Fluoromax-3 v. 2.0 (12 Feb 2002) Data Acquisition
4-2
Note: Real Time Display is not used for data-acquisition, but for opti-mizing scan parameters before the actual experiment.
Note: Adjust slits in Real Time Display to obtain the proper signal levelsbefore using the Constant Wavelength Analysis application.
Real Time Display The Real Time Display presents the signal from the detector in real time. Use the Real Time Display to be sure that no detector overranges during an actual experiment. Adjust various scan parameters, such as the monochromator positions, detector biases, etc., to see their effects on the signal. By toggling the Cont Off/Cont On button and arrows, the excitation and emission’s approximate peak positions may be found.
1 In Instrument Control Center, click the Real Time Display button. The Real Time Display opens:
Fluoromax-3 v. 2.0 (12 Feb 2002) Data Acquisition
4-3
Note: The Visual Instrument Setup varies, depend-ing on the in-strument con-figuration.
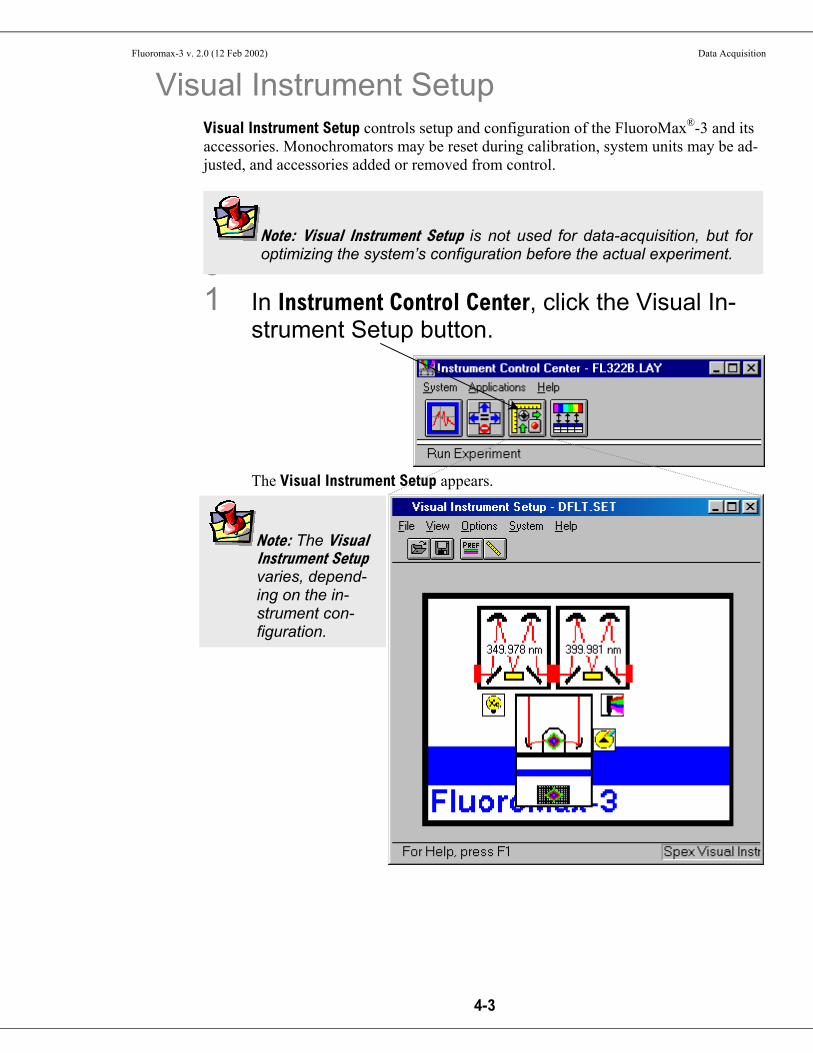
Visual Instrument Setup Visual Instrument Setup controls setup and configuration of the FluoroMax®-3 and its accessories. Monochromators may be reset during calibration, system units may be ad-justed, and accessories added or removed from control.
2 3 1 In Instrument Control Center, click the Visual In-
strument Setup button. The Visual Instrument Setup appears.
Note: Visual Instrument Setup is not used for data-acquisition, but foroptimizing the system’s configuration before the actual experiment.

Fluoromax-3 v. 2.0 (12 Feb 2002) Data Acquisition
4-4
Run Experiment Most kinds of experiments are performed within the Run Experiment application. The following general fluorescence experiments are found here: • Excitation scan Increments the excitation monochromator, while the emis-
sion monochromator remains fixed. Records an excitation spectrum for a sample.
• Emission scan Increments the emission monochromator, while the excita-tion monochromator remains fixed. Records an emission spectrum for a sample.
• Synchronous scan Increments both excitation and emission monochromators, keeping them a constant distance, or offset, apart. For reflec-tance or scattering measurements, set this offset to zero.
• Time-based scan Keeps both monochromators fixed, while taking data over time. Use this experiment to monitor time-based reactions, photodecay, and other kinetic phenomena.
• Discover scan DataMax searches both excitation and emission over a user-defined range. Peaks are discovered and reported, along with spectra. Useful for samples whose spectra are completely unknown.
• Batch scan Runs a series of up to 16 pre-defined experiments. Either several experiments may be performed on one sample, or one experiment may be done on several samples.
• Matrix scan Runs a pre-defined emission scan at different positions of the fixed excitation monochromator, to create a three-dimensional matrix of the excitation and emission spectra, plus fluorescence intensity.
• Temperature scan Runs a previously saved experiment over a range of temperatures, using an optional temperature bath or Peltier device.
• Polar scan Runs a quicker version of a polarization scan, by taking each of the four polarization components separately. Use this po-larization scan for samples that photodegrade. Requires the optional polarization accessory.
• Microplate scan Runs a previously saved experiment, using the optional Mi-croMax accessory, for up to 384 wells in a microwell plate.

Fluoromax-3 v. 2.0 (12 Feb 2002) Data Acquisition
4-5
Experiment acquisition dialog box Four of the above-listed experiment types are run using the following protocol:
1 In Instrument Control Center, click the Run Experiment button. The DataMax window appears.
2 Click Collect. A drop-down menu appears.
3 Click Experiment…. An experiment acquisition dialog box opens.

Fluoromax-3 v. 2.0 (12 Feb 2002) Data Acquisition
4-6
4 Click Exp Type…. The Select Experiment Type dialog box appears:
5 Choose from: Emission
Acquisition Excitation
Acquisition Synchronous
Acquisition Time Base
Acquisition
6 Click OK. The Select Experiment Type dialog box closes. The experiment acquisition dia-log box changes into the requested type of experiment’s dialog box.
7 Enter the appropriate scan parameters. 8 Click Run.
The experiment begins.

Fluoromax-3 v. 2.0 (12 Feb 2002) Data Acquisition
4-7
Note: The DataMax Op-eration Manual has more de-tails on these scans.
Collect drop-down menu The three other experiment types can be found in the Collect menu, using the following method:
1 In Instrument Control Center, click the Run Ex-periment button. The Run Experiment window appears.
2 Click Collect. A drop-down menu appears.
a For a matrix scan, choose Matrix Scan….
b For a discover scan, choose Discover Scan….
c For a batch scan, choose Batch Scan….
Fluoromax-3 v. 2.0 (12 Feb 2002) Data Acquisition
4-8
Note: The DataMax Op-eration Manual has more de-tails on these scans.
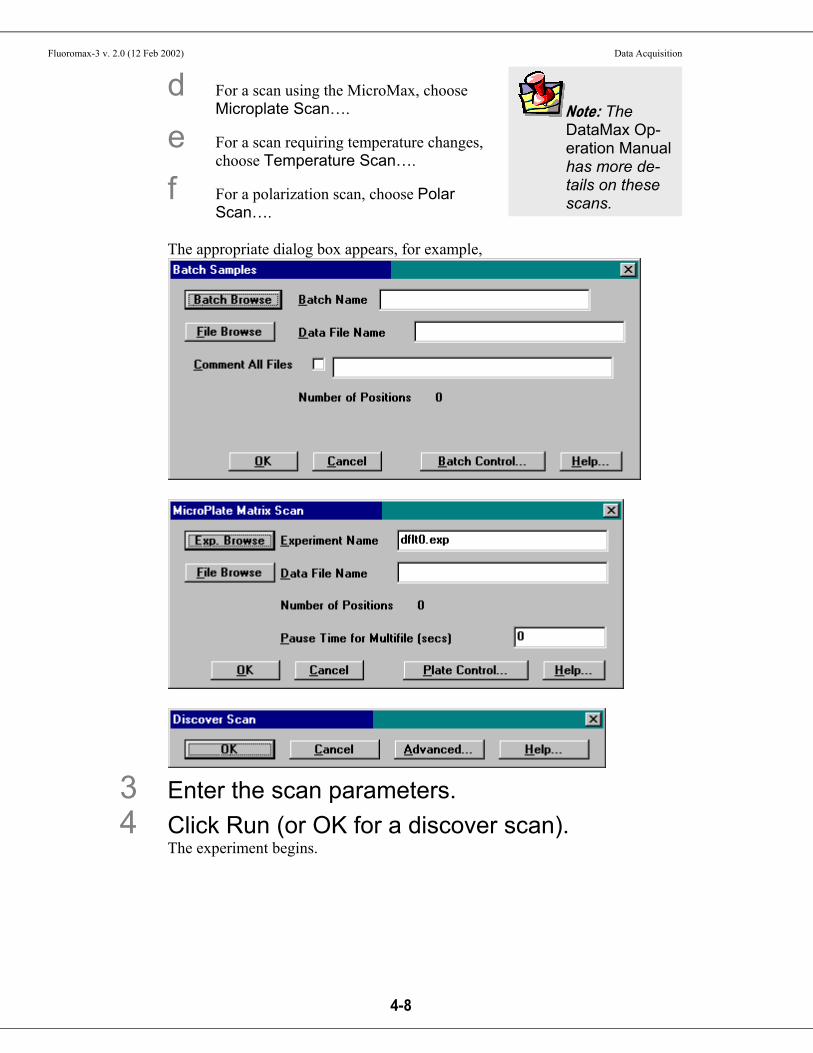
d For a scan using the MicroMax, choose Microplate Scan….
e For a scan requiring temperature changes, choose Temperature Scan….
f For a polarization scan, choose Polar Scan….
The appropriate dialog box appears, for example,
3 Enter the scan parameters. 4 Click Run (or OK for a discover scan).
The experiment begins.

Fluoromax-3 v. 2.0 (12 Feb 2002) Data Acquisition
4-9
Note: The DataMax Opera-tion Manual has a detailed discussion of Constant Wave-length Analysis.
Note: Adjust slits in Real Time Display to obtain the proper signal levelsbefore using the Constant Wavelength Analysis application.
Constant Wavelength Analysis Constant Wavelength Analysis is a DataMax application for monitoring one or a few specific excitation-emission wavelength-pairs. Among the experiments possible are: • Multiple samples • Kinetics measurements: Timing of data-acquisition, photobleach protection • Quantitative analysis: Concentration curves, standards, and blanks
Up to 32 wavelength-pairs may be examined. Signal types are chosen via detector alge-bra. Data may be output in: • DataMax special .CWA format • text format • Microsoft™ Excel® spreadsheet format
1 In Instrument Control Center, click Constant Wavelength Analysis. The Constant Wavelength Analysis dialog box appears.
Fluoromax-3 v. 2.0 (12 Feb 2002) Data Acquisition
4-10
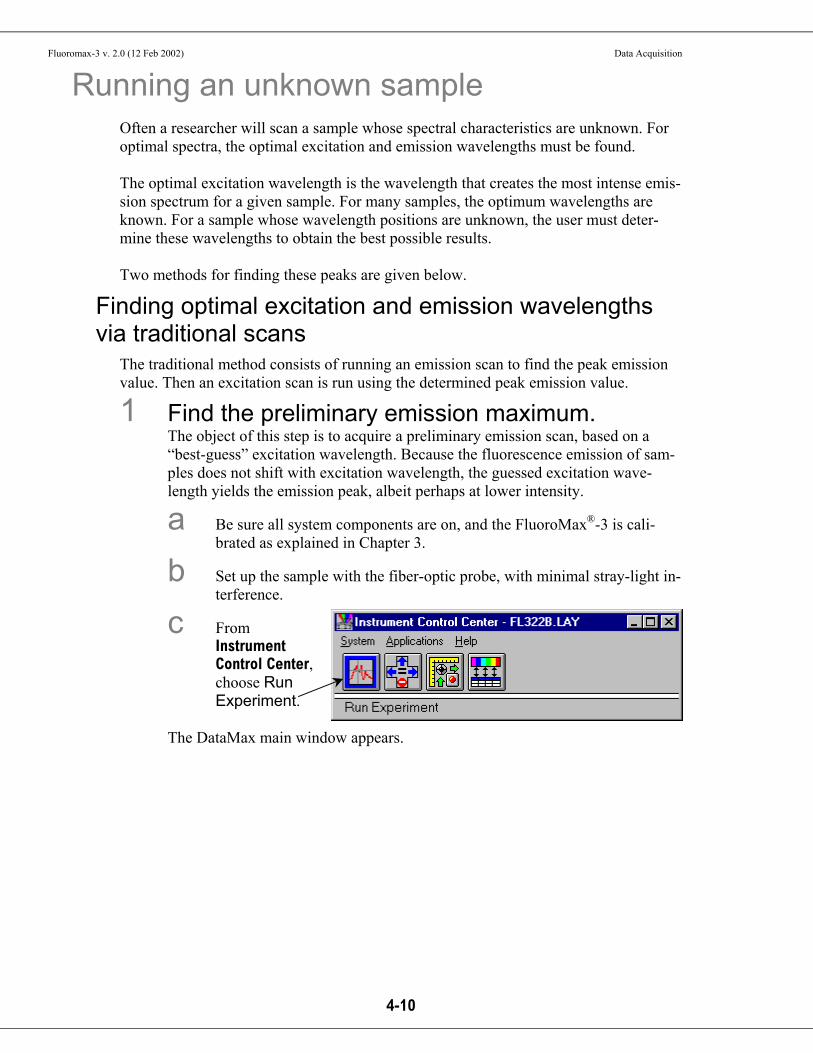
Running an unknown sample Often a researcher will scan a sample whose spectral characteristics are unknown. For optimal spectra, the optimal excitation and emission wavelengths must be found. The optimal excitation wavelength is the wavelength that creates the most intense emis-sion spectrum for a given sample. For many samples, the optimum wavelengths are known. For a sample whose wavelength positions are unknown, the user must deter-mine these wavelengths to obtain the best possible results. Two methods for finding these peaks are given below.
Finding optimal excitation and emission wavelengths via traditional scans
The traditional method consists of running an emission scan to find the peak emission value. Then an excitation scan is run using the determined peak emission value.
1 Find the preliminary emission maximum. The object of this step is to acquire a preliminary emission scan, based on a “best-guess” excitation wavelength. Because the fluorescence emission of sam-ples does not shift with excitation wavelength, the guessed excitation wave-length yields the emission peak, albeit perhaps at lower intensity.
a Be sure all system components are on, and the FluoroMax®-3 is cali-brated as explained in Chapter 3.
b Set up the sample with the fiber-optic probe, with minimal stray-light in-terference.
c From Instrument Control Center, choose Run Experiment.
The DataMax main window appears.
Fluoromax-3 v. 2.0 (12 Feb 2002) Data Acquisition
4-11
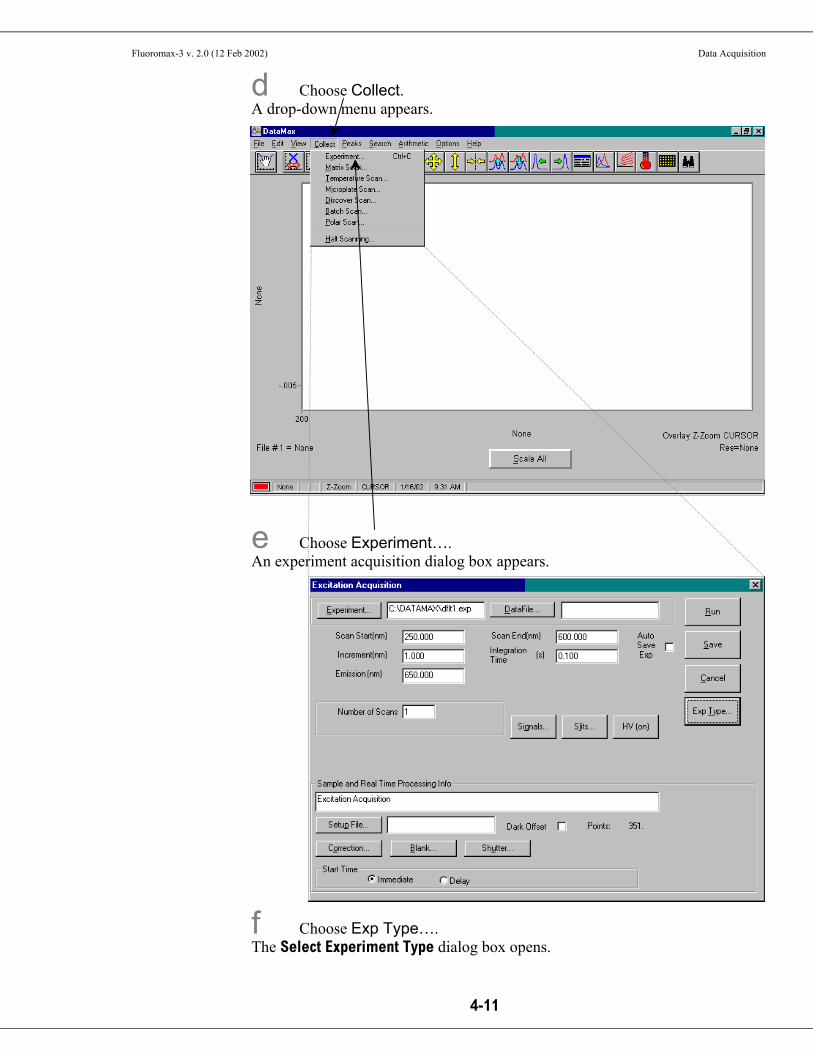
d Choose Collect. A drop-down menu appears.
e Choose Experiment…. An experiment acquisition dialog box appears.
f Choose Exp Type…. The Select Experiment Type dialog box opens.

Fluoromax-3 v. 2.0 (12 Feb 2002) Data Acquisition
4-12
Note: To minimize Rayleigh scatter, offset the start position by at least 15 nmfrom the excitation wavelength, with a bandpass of 5 nm. For example, for anexcitation wavelength of 300 nm, use 315 nm as the start. Set the ending wave-length to 550 nm. Use an increment of 2 nm and an integration time of 0.1 s.
g Choose Emission Acquisition.
h Click OK. The Select Experiment Type dialog box closes, and the experiment acquisition box becomes an Emission Acquisition dialog box.
i Set the scan parameters. Most of these parameters are a trade-off between speed and precision. Choose integration time, increments, and number of scans judiciously, to give an accu-rate result without excessive time spent. Fluorescence Applications suggests an increment of 1.0 nm, an integration time of 0.1–0.5 s, and one scan. If unsure of an excitation wavelength, try 300 nm, at which many samples absorb light. Use S (signal detector) for the acquisition mode. Don’t forget a data file name.

Fluoromax-3 v. 2.0 (12 Feb 2002) Data Acquisition
4-13
j Click Run. The scan starts.
k With the spectrum on the screen, note the greatest intensity. If the signal exceeds 12 µA, then the emission detector is saturating. Reduce the photomultiplier-tube bias by at least 100 V. If there is no obvious peak, increase the excitation wavelength, starting, and ending by 25 nm, and retry a scan.
l With an acceptable emission peak, record its wavelength. This is the emission maximum. Otherwise, repeat steps i through k until an obvious emission peak appears.
2 Find the optimal excitation wavelength. This procedure uses the emission maximum to determine the optimum excita-tion wavelength, and is similar to step 1.
a Choose Collect. A drop down menu appears.
b Choose Experiment…. The Emission Acquisition dialog box appears.

Fluoromax-3 v. 2.0 (12 Feb 2002) Data Acquisition
4-14
c Click Exp Type….
The Select Experiment Type dialog box opens.
d Choose Excitation Acquisition.
e Click OK. The Select Ex-periment Type dialog box closes. The Emission Acqui-sition dialog box changes into an Excitation Acquisition win-dow.
f Set the scan parame-ters.

Fluoromax-3 v. 2.0 (12 Feb 2002) Data Acquisition
4-15
Use the emission maximum determined above for the excitation, use 250 nm for starting, enter the emission maximum minus 15 nm for the end of the scan, and select two acquisition modes, S and S/R. S collects raw signal from the emis-sion detector, and S/R ratioes the signal to the reference detector.
g Set excitation and emission slits identical to the emission scan. Be sure that the emission scan did not exceed 20 µA in the emission scan.
h Enter the data file name.
i Click Run. The scan starts. The resulting spectrum shows maximum excitation wavelength. If the raw S-channel signal > 20 µA, reduce photomultiplier-tube high voltage by at least 100 V, and rescan.
j Note the excitation peak. This is the optimum excitation peak position.
3 Find the optimal emission peak. a Use the optimum excitation wavelength determined in step 2.
b When complete, both excitation and emission peaks are found. Optimized excitation and emission spectra of a 1 × 10⁻⁸-M anthracene solution are shown below. Because the acquisition modes were different for the excitation and emission scans, the data intensity had to be normalized. After normalization, the excita-tion and emission scans are virtually mirror images of one another.
Normalized excitation and emission spectra of a 1 × 10⁻⁸-M anthracene solution.
300 350 400 450 500 Wavelength (nm)
Inte
nsity
(106 c
ount
s s–1
)
4
3
2
1
0
Excitation Emission

Fluoromax-3 v. 2.0 (12 Feb 2002) Data Acquisition
4-16
Finding optimal excitation and emission wavelengths via the discover scan
The discover scan searches an excitation and emission matrix over a specified range, and reports the six maxima and their associated wavelength-pairs.
1 In Instrument Control Center, click Run Experiment. The Run Experiment window appears.
2 Choose Collect. A drop-down menu appears.
3 Choose Discover Scan…. The Discover Scan dialog box appears.
4 Click Advanced…. The Discover Scan – Advanced Parameters window opens.

Fluoromax-3 v. 2.0 (12 Feb 2002) Data Acquisition
4-17
5 Enter scan parameters. 6 Click OK.
The Discover Scan – Advanced Parameters dialog box closes.
7 Click OK. The discover scan searches through the excitation-emission matrix to find the six most intense peaks. If the signal > 20 µA, reduce the photomultiplier-tube bias by at least 100 V, and restart the discover scan.

Fluoromax-3 v. 2.0 (12 Feb 2002) Data Acquisition
4-18

Fluoromax-3 v. 2.0 (12 Feb 2002) Optimizing Data
5-1
Warning: Soaking the cuvettes for a long period causes etching of the cuvette surface, which results in light-scattering when the cuvettes are used.
Note: Clean the sample cells thoroughly before use to minimize back-ground contributions.
Warning: Nitric acid is a dangerous substance. When using nitric acid, wear safety goggles, face shield, and acid-resistant gloves. Certain compounds, such as glycerol, can form explosive materials when mixed with nitric acid.
5: Optimizing Data Spectra can be enhanced by optimization of data acquisition. This chapter lists some methods of optimizing sample preparation, spectrofluorometer setup, and data correc-tion to get higher-quality data.
Cuvette preparation 1 Empty all contents
from the cuvettes. 2 Fully immerse and
soak the cuvettes for 24 h in 50% aqueous nitric acid. This cleans the cuvettes’ inner and outer surfaces.
3 Rinse with de-ionized water. 4 Clean the
cuvettes in the cleaning solution with a test-tube brush. Use Alconox® or equivalent detergent as a cleaning solution.
5 Rinse the cuvettes with de-ionized water. 6 Soak the cuvettes in concentrated nitric acid. 7 Rinse them with de-ionized water before use.

Fluoromax-3 v. 2.0 (12 Feb 2002) Optimizing Data
5-2
Sample preparation The typical fluorescence or phosphorescence sample is a solution analyzed in a stan-dard cuvette. The cuvette itself may contain materials that fluoresce. To prevent inter-ference, Jobin Yvon Inc. recommends using non-fluorescing fused-silica cuvettes that have been cleaned as described above.
Small-volume samples If only a small sample volume is available, and the intensity of the fluorescence signal is sufficient, dilute the sample and analyze it in a 4-mL cuvette. If fluorescence is weak or if trace elements are to be determined, Jobin Yvon recommends using a capillary cell such as our 50-µL or 250-µL optional micro-sample capillary cells, which are specifi-cally designed for a small volume. A 1-mL cell (5 mm × 5 mm cross-section) is also available.
Solid samples Solid samples usually are mounted in the Model 1933 Solid Sample Holder, with the fluorescence collected from the front surface of the sample. The mounting method de-pends on the form of the sample. • Thin films and cell monolayers on coverslips can be placed in the holder directly. • Minerals, crystals, vitamins, paint chips, and similar samples usually are ground
into a homogeneous powder. The powder is packed into the depression of the Solid Sample Holder. For very fine powder, or powder that resists packing (and therefore falls out when the holder is put into its vertical position), the powder can be held in place with a thin quartz coverslip, or blended with potassium bromide for better cohesion.
Dissolved solids Solid samples, such as crystals, sometimes are dissolved in a solvent and analyzed in solution. Solvents, however, may contain organic impurities that fluoresce and mask the signal of interest. Therefore, use high-quality, HPLC-grade solvents. If background fluorescence persists, recrystallize the sample to eliminate organic impurities, and then dissolve it in an appropriate solvent for analysis.
Biological samples For reproducible results, some samples may require additional treatment. For example, proteins, cell membranes, and cells in solution need constant stirring to prevent settling. Other samples are temperature-sensitive and must be heated or cooled to ensure repro-ducibility in emission signals.
Fluoromax-3 v. 2.0 (12 Feb 2002) Optimizing Data
5-3
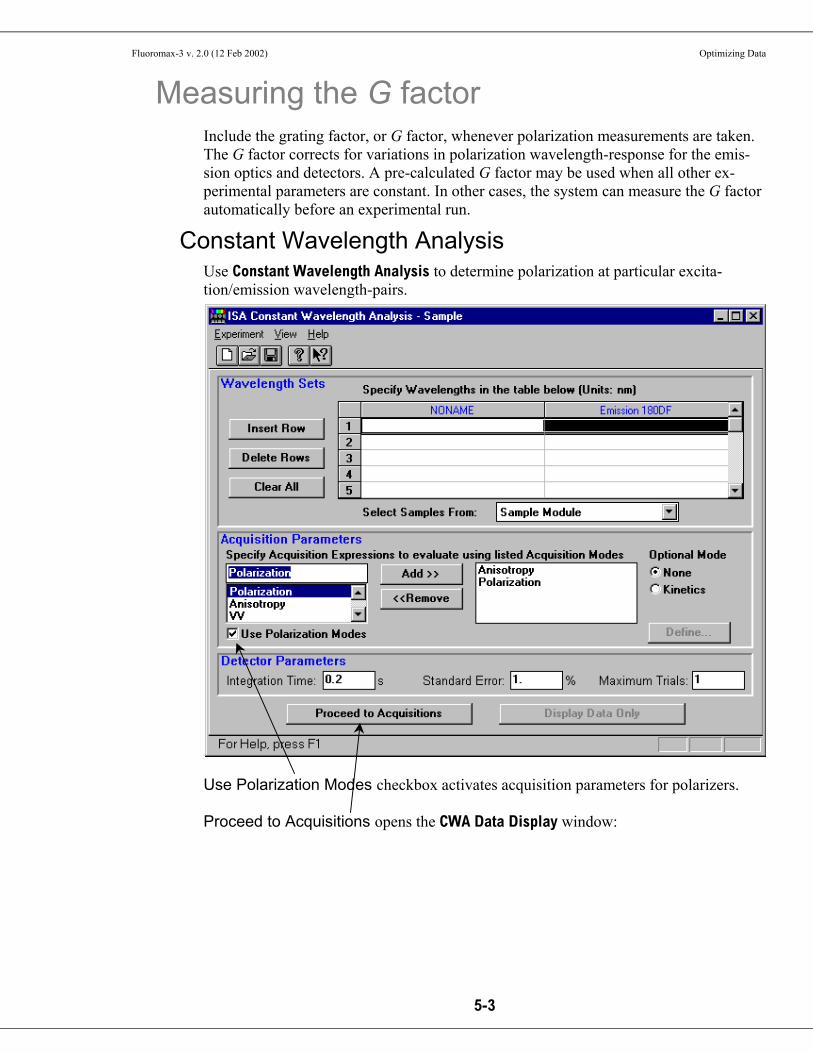
Measuring the G factor Include the grating factor, or G factor, whenever polarization measurements are taken. The G factor corrects for variations in polarization wavelength-response for the emis-sion optics and detectors. A pre-calculated G factor may be used when all other ex-perimental parameters are constant. In other cases, the system can measure the G factor automatically before an experimental run.
Constant Wavelength Analysis Use Constant Wavelength Analysis to determine polarization at particular excita-tion/emission wavelength-pairs.
Use Polarization Modes checkbox activates acquisition parameters for polarizers.
Proceed to Acquisitions opens the CWA Data Display window:

Fluoromax-3 v. 2.0 (12 Feb 2002) Optimizing Data
5-4
Note: For weak signals, enter the G factor, rather than measure it automatically. This may improve the S/N.
Click Start Acq to open the New Polari-zation Sample window:
Either enter the G factor or have it meas-ured automatically during the scan.
Fluoromax-3 v. 2.0 (12 Feb 2002) Optimizing Data
5-5
Note: For detailed information on the G factor, see the Polarizers Operation Manual.
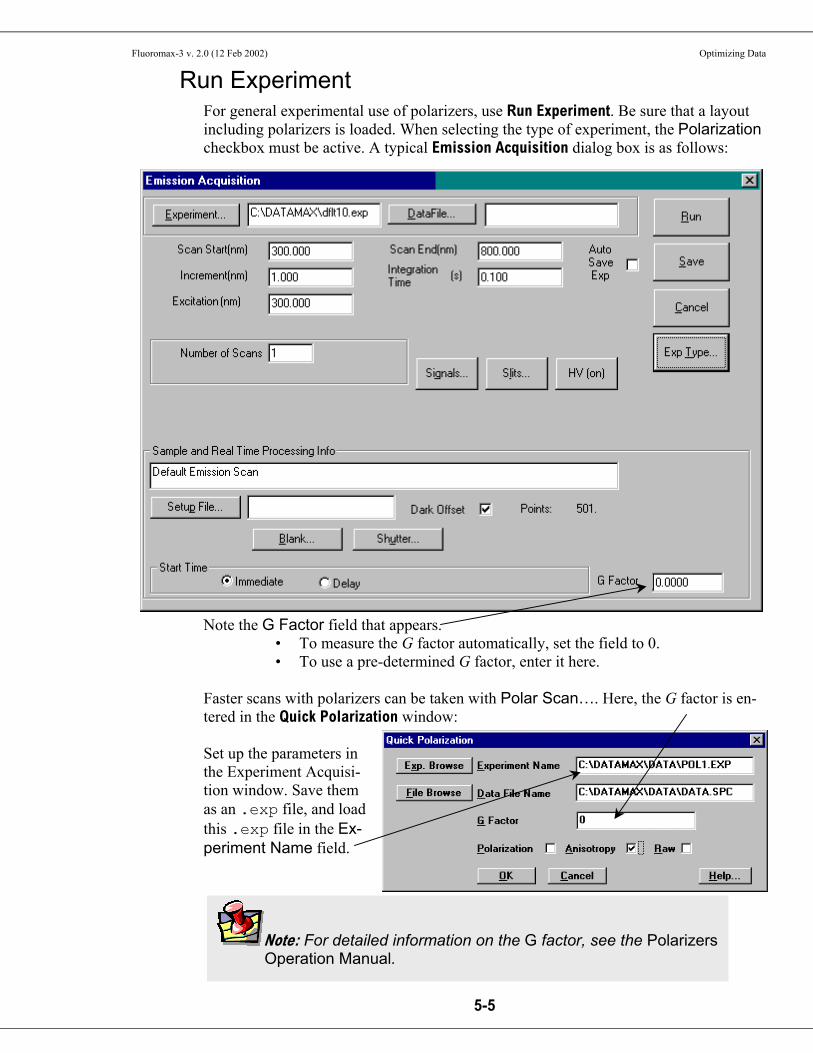
Run Experiment For general experimental use of polarizers, use Run Experiment. Be sure that a layout including polarizers is loaded. When selecting the type of experiment, the Polarization checkbox must be active. A typical Emission Acquisition dialog box is as follows:
Note the G Factor field that appears. • To measure the G factor automatically, set the field to 0. • To use a pre-determined G factor, enter it here.
Faster scans with polarizers can be taken with Polar Scan…. Here, the G factor is en-tered in the Quick Polarization window: Set up the parameters in the Experiment Acquisi-tion window. Save them as an .exp file, and load this .exp file in the Ex-periment Name field.

Fluoromax-3 v. 2.0 (12 Feb 2002) Optimizing Data
5-6
Improving the signal-to-noise ratio Because of various hardware or software conditions, occasionally it is necessary to op-timize the results of an experiment. The quality of acquired data is determined largely by the signal-to-noise ratio (S/N). This is true especially for weakly fluorescing samples with low quantum yields. The signal-to-noise ratio can be improved by: • Using the appropriate integration time, • Scanning a region several times and averaging the results, • Changing the bandpass by adjusting the slit widths, and • Mathematically smoothing the data. The sections that follow discuss the alternatives for improving the S/N ratio and the ad-vantages and disadvantages of each.

Fluoromax-3 v. 2.0 (12 Feb 2002) Optimizing Data
5-7
Note: This table is only a guide. The optimum inte-gration time for other measurements, such as time-base, polarization, phosphorescence life-times, and anisotropy, may be different.
Determining the optimum integration time The length of time during which photons are counted and averaged for each data point is referred to as the integration time. An unwanted portion of this signal comes from noise and dark counts (distortion inherent in the signal detector and its electronics when high voltage is applied). By increasing the integration time, the signal is averaged longer, resulting in a better S/N. This ratio is enhanced by a factor of t1/2, where t is the multiplicative increase in integration time. For example, doubling the integration time from 1 s to 2 s increases the S/N by over 40%, as shown below: For an integration time of 1 second,
S N t/ /
/===
1 2
1 211
For an integration time of 2 seconds, S N t/
.
/
/==≈
1 2
1 221414
or approximately 42%. Because S/N determines the noise level in a spectrum, use of the appropriate integration time is important for high-quality results. To discover the appropriate integration time:
a Find the maximum fluorescence intensity by acquiring a preliminary scan, using an integration time of 0.1 s and a bandpass of 5 nm.
b From this preliminary scan, note the maximum intensity, and select the appro-priate integration time from the table below.
Signal intensity (counts per second)
Estimated integration time (seconds)
1000 to 5000 2.0 5001 to 50 000 1.0
50 001 to 500 000 0.1 500 001 to 4 000 000 0.05
Set integration time through Run Experiment for a specific experiment, Real Time Display to view the effects of different integration times on a spectrum, or Visual Instrument Setup to establish a default for all ex-periments. See the DataMax manual to learn more about setting the integration time.
Fluoromax-3 v. 2.0 (12 Feb 2002) Optimizing Data
5-8
Scanning a sample multiple times Scanning a sample more than once, and averaging the scans together, enhances the S/N. In general, the S/N improves by n1/2, where n is the number of scans. To scan a sample multiple times, specify the number of scans in the Number of Scans field in Run Experiment, from an experiment dialog box. See the DataMax manual for detailed instructions regarding the data-entry fields of each type of experiment dialog box.

Fluoromax-3 v. 2.0 (12 Feb 2002) Optimizing Data
5-9
Using the appropriate wavelength increment The increment in a wavelength scan is the spacing, in nm, between adjacent data points. The spacing between the data points affects the resolution of the spectrum, and total time for acquisition. Consider the required resolution, time needed, and concerns about photobleaching of the sample. Most samples under fluorescence analysis display rela-tively broad-band emissions with a Lorentzian distribution, so they do not require a tiny increment. Common increments range from 0.05–10 nm, depending on the sample and slit size. A first try might be 0.5–1 nm increment. After acquiring the initial spectrum, examine the results. If two adjacent peaks are not resolved (i.e., separated) satisfactorily, reduce the increment. If the spectrum is described by an excessive number of data points, increase the increment, to save time and lamp exposure. A scan taken, using an increment of 0.1 nm, with a peak at full-width at half-maximum (FWHM) of 20 nm, should be characterized with a 1-nm increment instead. For time-based scans, the increment is the spacing in s or ms between data points. Here, the consideration is the necessary time resolution. The time increment dictates the total time per data point and for the scan in general. Set this value to resolve any changes in the luminescence of samples as the react or degrade. Time increments often range from 0.1–20 s. Set increments using the experiment acquisition dialog boxes. See the DataMax manual for more information.
Fluoromax-3 v. 2.0 (12 Feb 2002) Optimizing Data
5-10
Selecting the appropriate bandpass The bandpass (wavelength spread) affects the resolution of your spectra. If the band-pass is too broad, narrow peaks separated by a small change in wavelength may be un-resolved. For example, for two 2-nm peaks 5 nm apart, and a bandpass of 10 nm, one broad peak, instead of two well-defined ones, is visible. By adjusting the slit widths, the intensity and bandpass of the light is controlled. The slits of the excitation spectrometer determine the amount of light that passes through the excitation spectrometer to the sample. The emission spectrometer slits control the amount of fluorescence recorded by the signal detector. Signal level is proportional to the square of the slit width, that is, signal level ∝ (slit width)2 Bandpass is calculated using the following formula: bandpass (nm) = slit width (mm) × dispersion (nm/mm) A FluoroMax®-3, which has a single-grating monochromator and 1200 grooves/mm gratings, has a dispersion of 4.25 nm/mm. For steady-state fluorescence measurements, set the entrance and exit slits the same for a monochromator. Such a procedure occurs automatically with bandpass units. For bio-logical samples that may photobleach, try narrowing the excitation slits and opening the emission slits wider.

Fluoromax-3 v. 2.0 (12 Feb 2002) Optimizing Data
5-11
Smoothing data Smoothing the data improves the appearance of the spectrum. Smoothing, as are most post-processing features, is handled by GRAMS/32®. By selecting Arithmetic from the main menu of Run Experiment, choose FFT (fast-Fourier transform), Binomial, or Savitsky-Golay smoothing. Automatic smoothing and the degree to which smoothing occurs is achieved by entering the Peaks/Settings dialog box and typing the relevant in-formation. See the GRAMS/32® User’s Guide for additional information regarding smoothing data. An additional option, Zap, for removing outliers, also appears under the Arithmetic menu. The GRAMS/32® User’s Guide covers this option thoroughly. In general, start with a 9- or 11-point smooth for a time-base measurement. To select the proper number of points for wavelength-scan types, first locate the area that re-quires smoothing—usually this is a peak. Determine the number of data points used to make up the peak, and then smooth the data using the number of points closest to this number. To avoid artificially enhancing the data, use the appropriate number of points to smooth the data. For example, selection of too large a number results in the back-ground being smoothed into the peak.

Fluoromax-3 v. 2.0 (12 Feb 2002) Optimizing Data
5-12
Note: The excita-tion range is 240–600 nm; the emission range is 290–850 nm.
Correcting data Introduction
Collecting accurate information about the fluorescent or phosphorescent properties of a sample depends upon several factors: • Equipment specifications • Sample characteristics • Timing considerations. To ensure that the spectra collected indicate the actual properties of the sample and not external conditions, data often must be corrected. To correct data means to subtract in-formation from the data not directly related to the properties of the sample. Gratings, detectors, and other spectrometer components have response characteristics that vary as a function of wavelength. These characteristics may be superimposed on spectra, thereby yielding a potentially misleading trace. For accurate intensity comparisons, such as those required for quantum-yield determinations, response characteristics must be eliminated. Supplied with the instrument are sets of excitation and emission correction factors to eliminate response characteristics. These files1, xcorrect and mcorrect, are included with the software; copy them to your hard disk.
Items that may be convoluted into a spectrum
Ways to remove these artifacts
Fluctuations caused by the light source Monitoring lamp output using the reference detector, R, and using the signal ratio S/R to correct lamp profile or temporal fluctuations
Influence of the sample holder Running a blank scan (which is then subtracted from the sample scan)
System hardware (e.g., optics, detectors). Using radiometric correction factors
To use radiometric correction factors, either: • Select the ones supplied with the program, or • Select a set generated at your facility during or after acquisition, discussed in the
following section. Acquiring radiometric correction factors is explained in Chaper 11: Producing Correction Factors.
Blank Subtraction and Dark Offset functions are described in the DataMax manual.
1Filenames include a three-letter extension. For the sake of clarity, we have omitted the extensions in this section. Refer to the software manual for specifics regarding extensions.

Fluoromax-3 v. 2.0 (12 Feb 2002) Optimizing Data
5-13
Note: Before applying correction factors, Jobin Yvon Inc. recom-mends subtracting the dark counts, and the spectrum of the blank, from the data. Refer to the DataMax manual for specific instructions.
During acquisition Data can be acquired either as raw data or as corrected data. A spectrum composed of raw data exhibits the effects of system parameters, while a corrected spectrum displays only the properties related to the sample. To automatically acquire corrected emission data, enter mcorrect in the Correction factor file field in the Run Experiment dialog box. To acquire corrected excitation data, enter xcorrect.
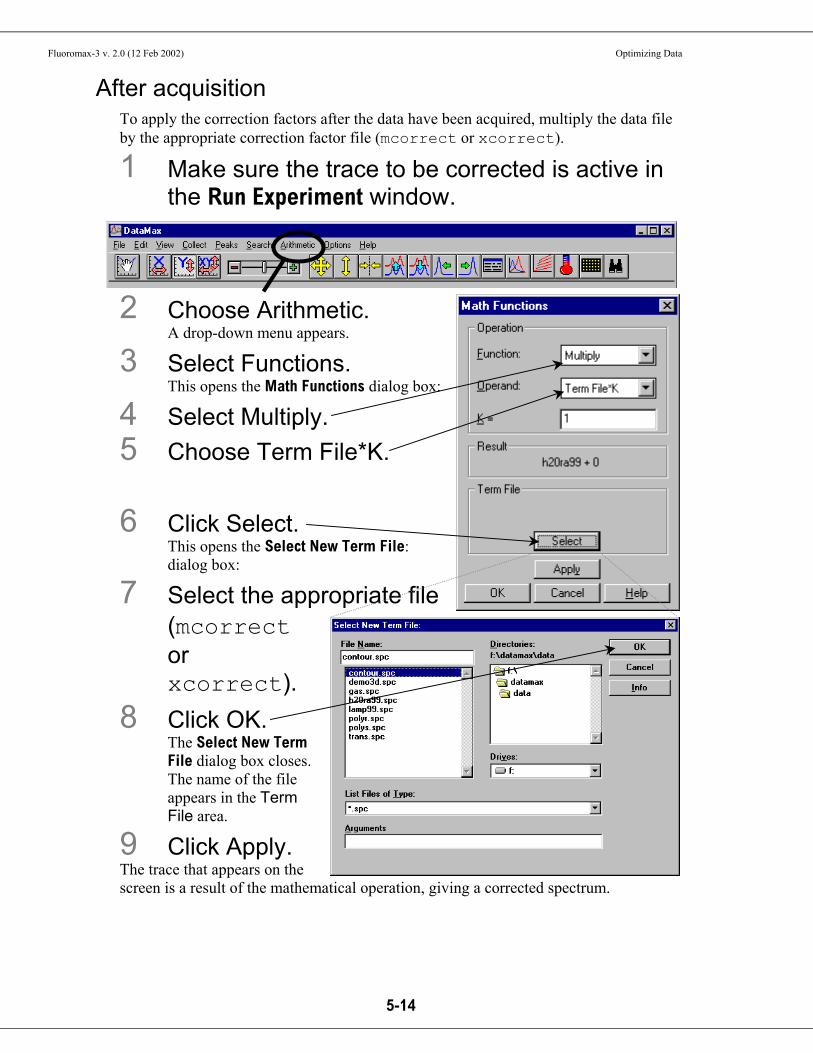
Fluoromax-3 v. 2.0 (12 Feb 2002) Optimizing Data
5-14
After acquisition To apply the correction factors after the data have been acquired, multiply the data file by the appropriate correction factor file (mcorrect or xcorrect).
1 Make sure the trace to be corrected is active in the Run Experiment window.
2 Choose Arithmetic. A drop-down menu appears.
3 Select Functions. This opens the Math Functions dialog box:
4 Select Multiply. 5 Choose Term File*K.
6 Click Select. This opens the Select New Term File: dialog box:
7 Select the appropriate file (mcorrect or xcorrect).
8 Click OK. The Select New Term File dialog box closes. The name of the file appears in the Term File area.
9 Click Apply. The trace that appears on the screen is a result of the mathematical operation, giving a corrected spectrum.

Fluoromax-3 v. 2.0 (13 Feb 2002) Maintenance
6-1
Warning: Do not remove the protec-tive cover from the replacementlamp until instructed to do so.
Warning: Xenon lamps, by nature, are an explosion hazard. Be sure that the power is off, and all AC (mains) power is disconnected from the system. Read and follow all the cautions below:
6: Maintenance Introduction
The FluoroMax®-3 requires little maintenance. To remove dust and fingerprints, wipe the outside panels with a clean, damp cloth. The lamp is the only component that must be replaced routinely. Regular examination of the xenon-lamp scan and water Raman spectrum serves as early indicators of the system’s integrity. See Chapter 3 for these tests.
Lamp replacement When to replace the lamp
Obtaining good spectral results depends on the xenon lamp. Keep track of lamp usage with the hour meter. After 1200–1500 h of use, the lamp output decreases significantly, indicating that the lamp should be replaced. A new lamp produces a peak intensity of 300 000 cps for a water-Raman scan; when the current lamp’s output drops below 100 000 cps, replace it. Replacing the lamp within the recommended time may prevent a catastrophic failure. Each time the lamp is turned on constitutes one full hour of use. Therefore, Jobin Yvon Inc. suggests leaving the lamp on during brief periods of inactiv-ity.
Parts and tools required Xenon lamp The replacement xenon lamp is packed in the manufacturer’s box. Read all instructions and precautions before removing the lamp from the protective cover, and inserting it into the FluoroMax®-3.
Phillips screwdriver 3/32" Allen key 7/64" Allen key 1/8" Allen key 9/64" Allen key

Fluoromax-3 v. 2.0 (13 Feb 2002) Maintenance
6-2
Hazards ! Xenon arc lamps are an explosion hazard. Wear goggles and protective clothing
when opening the lamp housing and when handling the lamp. ! The lamp power supply should not be connected to an AC power line while han-
dling lamp leads. Lethal high voltages may exist. ! The lamp will remain extremely hot for approximately one-half hour after it has
been turned off. Do not touch the lamp or the metal unit until the lamp has cooled.
! Never look directly at the xenon arc or its reflection. Intense radiation can per-
manently damage eyes. ! Do not touch the focusing lens, back-scatter mirror, or the surface of the lamp.
Fingerprints will be burned onto these surfaces when the lamp is ignited.
Changing the lamp
1 Switch off and prepare the FluoroMax®-3. a Be sure that the FluoroMax®-3 and the host computer are turned off.
b Remove the AC (mains) power cord from the FluoroMax®-3.
c Disconnect the RS-232 cable, optional trigger-box cable, power cord, and any other cables attached to the spectrofluorometer.
2 Remove the sample mount from the front of the FluoroMax®-3. a Remove the four Phillips screws that secure the sample mount to the in-
strument.
b Gently slide the sample mount out of the instrument. Some sample mounts have a 15-pin connector at the inside end for automated accessories.
3 Remove the instrument cover. a Remove the seven Phillips screws (two on each side, and three in the
back) from the cover.
!

Fluoromax-3 v. 2.0 (13 Feb 2002) Maintenance
6-3
b Lift the cover vertically off the instrument by grasping opposite corners of the cover and raising upward.
If the cover sticks, gently work each side upward until the cover slides smoothly off.
4 Remove the lamp-housing cover at the rear of the instrument. a Remove the two Phillips screws
from the lamp-housing cover.
b Gently rotate the lamp-housing cover with its cooling fans at-tached.
c Rotate the cover backwards, and set it behind the instrument so that electrical connections are not strained.
The lamp is held in place by spring tension and the height adjustment on top of the lamp. The anode and cathode connections are attached to the lamp via thumbscrews on top and bottom of the lamp.
5 Prepare the replacement lamp. a Place the new xenon lamp (still in its protective cover) on top of the ex-
citation monochromator.
b Remove the top half of the new lamp’s protective cover.
Keep this top half handy for later.
6 Remove the old xenon lamp. a While holding the metal anode (top)
portion of the lamp, loosen the height adjustment above the lamp with a 1/8" Allen key, until the lamp is removable.

Fluoromax-3 v. 2.0 (13 Feb 2002) Maintenance
6-4
Warning: Improper connections to the lamp severely affect lamp perform-ance and affect the power supply. Carefully note the anode and cath-ode connections to the lamp. The anode (+) is on top; the cathode (–) is on the bottom. The nipple on the lamp’s glass envelope marks the anode (+) side.
b Press down against the spring action. Notice how the nipple faces away from the collection mirror (not visible here behind the hand).
c Gently tilt the lamp away from the top post.
d Lift the old lamp out of the lamp housing far enough to remove the anode and cathode connections.
e Remove the thumb-screw at the anode end (top) of the lamp, leaving the post exposed.
f Remove the anode cable.
g Remove the thumbscrew at the cathode end (bottom) of the lamp, leaving the post exposed.
h Remove the cathode cable.
7 Place the old lamp in the top protective cover from the new lamp.
8 Put the old lamp (in the top cover) in a safe place.

Fluoromax-3 v. 2.0 (13 Feb 2002) Maintenance
6-5
Warning: Do not touch any portion of the lamp except the metal cathodeand anode.
Note: Do not replacethe FluoroMax®-3cover until the lampis correctly adjusted.
9 Attach connections to the new lamp. a Attach the cathode connection to the new lamp.
b Secure the connection with the new lamp’s thumbscrew.
c Attach the anode connection to the new lamp.
d Secure the connection with the new lamp’s thumbscrew.
e Recheck that the connections are correct.
10 Insert the new xenon lamp. a Insert the new lamp in the bottom
holder.
b Press the lamp down into the holder to compress the spring.
c Tilt and raise the anode end of the lamp into the top holder.
d Place the lamp so that the nipple on the glass envelope is opposite the collection mirror.
e Set the height adjustment, using the 1/8" Allen key. Try to return the new lamp to the approximate position of the old lamp.
11 Replace the lamp-housing cover. 12 Secure the two screws on the lamp-housing
cover. 13 Reconnect all cables
(power, accessories, etc.) to the FluoroMax®-3.
Anode (+)
Cathode (–)
Col-lection mirror

Fluoromax-3 v. 2.0 (13 Feb 2002) Maintenance
6-6
Is the peak inten-sity ≥ 300 000 cps?
Yes
No further adjust-ment is necessary. Adjust the lamp:
Continue with the procedure below.
No
Replace the lamp-housing cover. Replace the FluoroMax®-3 cover.
STOP. The FluoroMax®-3 is ready for operation.
Adjusting the new xenon lamp Choices There are two choices after lamp installation: • Let the lamp “burn in”, i.e., run, for 6 h before adjustment of its position. • Set the coarse lamp adjustments immediately. After a 6-h burn-in, set the fine ad-
justments. For lamp replacement, the major adjustment is to optimize the height screw that was loosened to remove the old xenon lamp.
Procedure
1 With the instrument cover still removed, turn on the FluoroMax®-3.
2 Insert a clean cuvette filled with de-ionized wa-ter in the sample compartment.
3 With the room lights off and ambient stray light minimized, acquire a xenon-lamp scan and wa-ter Raman scan, as explained in Chapter 3. This should confirm that the instrument is roughly calibrated.
4 Open Real Time Display. a Move the excitation monochromator to 350 nm, and the emission mono-
chromator to 397 nm.
b Set the slits to 5-nm bandpass.
c Open the excitation shutter and emission shutter.

Fluoromax-3 v. 2.0 (13 Feb 2002) Maintenance
6-7
Is the signal within specifica-tions?
Yes
No further adjust-ment is necessary. Continue to adjust the
screws, to improve the water Raman signal.
No
Replace the lamp-housing cover. Replace the FluoroMax®-3 cover.
STOP. The FluoroMax®-3 is ready for operation. After repeated ad-
justments, is the signal still low?
No
Yes
Go to Chapter 10: Troubleshooting.
d Set the integration time to 0.5 s.
5 Adjust the xenon lamp’s position. There are three adjustments to optimize the lamp position:
Adjustment Allen key required
Focus 3/32" Tilt and Center 9/64" Height 1/8"
a Slowly work each adjustment to optimize the signal.
At maximum signal (> 300 000 cps, depending upon the spectrometer), the lamp is optimized.
b Remove the Allen keys.
6 Acquire another water Raman scan. a Use the same parameters as in step 3.
b Note the peak intensity.
c Use the flowchart below.
Focus Tilt and center
Height

Fluoromax-3 v. 2.0 (13 Feb 2002) Maintenance
6-8
Warning: The information in this section does not constitute permission to adjust, manipulate, or remove any electrical or other components in the FluoroMax®-3. This information is provided for reference purposes only. Contact Spex® Fluorescence Service in case of system failure or suspected failure, before attempting repairs or testing with meters. DO NOT ATTEMPT ANY REPAIRS OR INSTRUMENT EVALUATION WITHOUT THE EXPRESS PERMISSION OF SPEX® FLUORES-CENCE SERVICE.
±15 V Supply
Reference-detector current-acquisition module
Electronics In case of the rare chance of system failure, this section is provided to help the user un-derstand the electronics components.
Xenon-lamp power supply
The xenon lamp’s power supply has a capacity of 150–300 W, and is found in the center back of the instrument. In order to suppress the emf spike emitted from the lamp’s power supply during arcing and start-up of the lamp—several thousand volts—this contains specialized line filters. The power supply is preset at the factory for the correct current and voltage to supply the xenon lamp with 150 W. Poor lamp performance or difficulty maintaining a stable lamp arc may be the result of an improperly set power supply. Contact Spex® Fluores-cence Service for more details.
CTI card and slave controller The main instru-ment board and CPU board for the slave controller are located in the top rear of the FluoroMax®-3, mounted on a
CTI card
CPU board

Fluoromax-3 v. 2.0 (13 Feb 2002) Maintenance
6-9
Excitation monochro-mator control board
Emission monochro-mator control board
Sample compartment
Excitation mono-chromator direct drive
Emission monochro-mator direct drive
Emission PMT
Accessory control board may be here
Photon-counting module for PMT
AC power, DC sup-plies, and filters
motherboard. The CPU board contains a firmware version of the low-level system driv-ers. The CTI card is used for all instrument control, data collection, and system timing. Connections from this board go to the monochromator-drive boards, detector acquisi-tion-modules, and optional trigger input from a TRIG-15/25 accessory. The board has an internal ±15 V DC supply.
Monochromator drives and accessory controllers The monochromator drives, drive electronics, and accessory electronics are found on the underside of the optical platform. Electrical connections for the emission detector and the basic system-electronics for AC-power conversion are also underneath the in-strument. To gain access to the drive electronics, remove the bottom cover of the instrument. Remove all screws on the bottom cover except those that attach the dust screens for the exhaust fans. The leveling feet do not need to be removed before detaching the bottom cover. There are two or three 180F-drive boards underneath the instrument. Each has a spe-cific role: one board controls the drives, slits, shutter, and automated accessories in the excitation monochromator. Another board controls the same components of the emis-
Do not detach screens’ screws

Fluoromax-3 v. 2.0 (13 Feb 2002) Maintenance
6-10
sion monochromator. The third board is an optional sample-compartment-accessory control board for options such as a sample changer. The emission photomultiplier tube is coupled to a photon-counting acquisition module, called a DM302. The photomultiplier tube’s housing contains a high-voltage supply preset for the standard R928P photomultiplier tube. The DM302 is connected to the S-channel input on the CTI board at P140. The reference detector is a silicon photodiode, which has a current-acquisition module directly behind it. This module is connected to the CTI board at P130. The silicon photodiode does not require high-voltage bias. Each direct drive has the main-gear drive and stepper motor accessible on the bottom platform. Power and optical sensors are interfaced with the respective 180F drive board.

Fluoromax-3 v. 2.0 (15 Feb 2002) Components & Accessories
7-1
7: Components & Accessories Accessories for the FluoroMax®-3 can be added to obtain optimum results for a variety of applications. The following list represents all the accessories and components, in al-phabetical order, available for the FluoroMax®-3 spectrofluorometers. A brief descrip-tion of each is included in the following sections. Like the list presented below, the de-scriptions that follow are alphabetized, except where logical order dictates otherwise. For additional information or product literature on any of these items, contact your lo-cal Sales Representative.

Fluoromax-3 v. 2.0 (15 Feb 2002) Components & Accessories
7-2
Itemized list of FluoroMax®-3 accessories Item Model Page
Accessory, absorption/transmission 1940 7-3 Adapter, micro cell (See Cell, micro) 1923A Adapter, micro cell (See Cell, micro) 1924A Assembly, liquid-nitrogen Dewar FL-1013 7-6 Assembly, scatter block 1908MOD 7-7 Assembly, standard lamp 1908 7-7 Cell, HPLC flow 1955 7-8 Cell, micro 1923 7-8 Cell, micro 1924 7-8 Cell, quartz 1925 7-8 Cell, sample 1920 7-8 Cell, sample (reduced volume) QC-SK 7-8 Dewar, liquid-nitrogen (See Assembly, liquid-nitrogen Dewar) 1932D Fiber-optic mount F-3000 7-9 Filter, cut-on (1" × 2") 1938 7-10 Filter, cut-on (2" × 2") 1939 7-10 Holder, filter FL-1010 7-11 Holder, four-position variable temp. control w/ magnetic stirrer FL-1011 7-12 Holder, dual-position variable temp. control w/ magnetic stirrer FL-1012 7-14 Holder, solid-sample 1933 7-16 Injector, autotitration F-3005/6 7-18 Injector port (see Port, injector) FL-1015 Interface, microscope (Nikon) fiber-optic F-3001 7-19 Interface, microscope (Olympus) fiber-optic F-3002 7-19 Interface, microscope (Zeiss) fiber-optic F-3003 7-19 Lamp, xenon replacement, 150-W 1905-OFR 7-20 Peltier drive, sample heater/cooler F-3004 7-21 Plate reader, MicroMax microwell MicroMax 7-22 Polarizer, L-format FL-1044 7-23 Port, injector FL-1015 7-24 Temperature bath F-1000/1 7-25 Trigger accessory, external TRIG-15/25 7-26 Upgrade from FluoroMax®-3 to FluoroMax®-P FM-2005 7-27
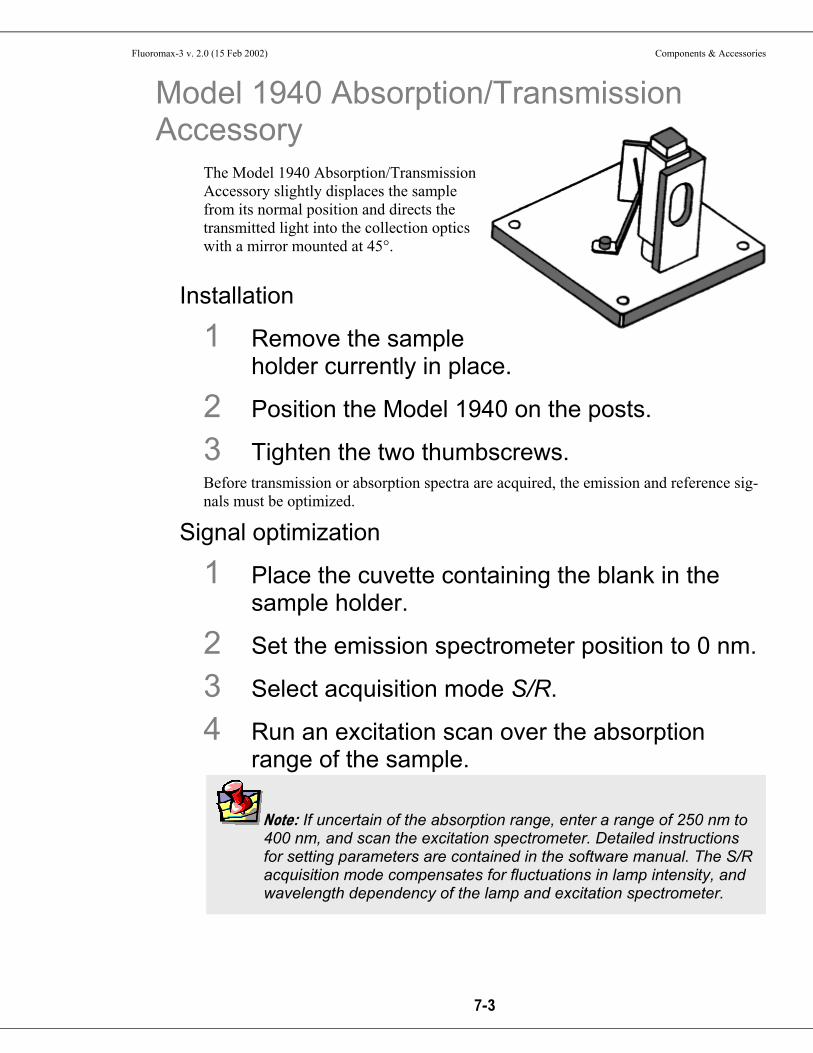
Fluoromax-3 v. 2.0 (15 Feb 2002) Components & Accessories
7-3
Note: If uncertain of the absorption range, enter a range of 250 nm to 400 nm, and scan the excitation spectrometer. Detailed instructions for setting parameters are contained in the software manual. The S/R acquisition mode compensates for fluctuations in lamp intensity, and wavelength dependency of the lamp and excitation spectrometer.
Model 1940 Absorption/Transmission Accessory
The Model 1940 Absorption/Transmission Accessory slightly displaces the sample from its normal position and directs the transmitted light into the collection optics with a mirror mounted at 45°.
Installation
1 Remove the sample holder currently in place.
2 Position the Model 1940 on the posts.
3 Tighten the two thumbscrews. Before transmission or absorption spectra are acquired, the emission and reference sig-nals must be optimized.
Signal optimization
1 Place the cuvette containing the blank in the sample holder.
2 Set the emission spectrometer position to 0 nm.
3 Select acquisition mode S/R.
4 Run an excitation scan over the absorption range of the sample.
Fluoromax-3 v. 2.0 (15 Feb 2002) Components & Accessories
7-4
Warning: Only when both emission and reference signals are within prescribed limits, proceed with the measurements.
Note: The linear range of the R928P detector operated in the photon-counting mode is 2 million cps.
Note: Use S/R be-cause the ratio of the sample (here, “S”) to the blank (here “R”) removes R (here, the blank).
5 Note the emission signal at maximum transmission of the blank.
6 Adjust the slits to maximize the signal without saturating the detector.
7 Similarly, locate the maximum reference signal of the lamp spectrum.
8 Set the excitation spectrometer to that position.
9 Adjust the high voltage HV2, as needed, so that the reference signal is ~ 1 µA (saturation of the reference detector is 10 µA).
10 Acquire transmission spectra. Either
a Position the emission spectrometer at 0 nm, and use the S/R acquisition mode.
b Acquire an excitation scan of the blank.
c Acquire an excitation scan of the sample.
Or
When the spectrometers are synchronously scanned using an offset of 0 nm, the emission slits should be opened five times as wide as the slits of the excitation spectrometer.

Fluoromax-3 v. 2.0 (15 Feb 2002) Components & Accessories
7-5
Note: If the detectors are saturated, close the slits a little or install a neutral-density filter.
a Acquire a synchronous scan with an offset of 0 nm over the absorption range of the blank.
b Acquire a synchronous scan with an offset of 0 nm over the absorption range of the sam-ple.
11 Calculate the absorption. The absorption spectrum can be determined from the following equation:
A = log(S/R)blank – log(S/R)sample

Fluoromax-3 v. 2.0 (15 Feb 2002) Components & Accessories
7-6
Note: If condensation ap-pears on the outside of the Dewar flask, it must be re-evacuated.
FL-1013 Liquid Nitrogen Dewar Assembly For phosphorescence or delayed fluorescence measurements, samples are often frozen at liquid-nitrogen temperature (77 K) to preserve the fragile triplet state. The sample is placed in the quartz cell and slowly immersed in the liquid-nitrogen-filled Dewar flask. The white Teflon® cone in the bottom of the Dewar flask keeps the quartz sample-tube centered in the Dewar flask. The Teflon® cover on the top of the Dewar flask holds any excess liquid nitrogen that bubbled out of the assembly. A pedestal holds the Dewar flask in the sampling module. A special stove-pipe sample cover replaces the standard sample lid, so that liquid nitrogen can be added to the Dewar flask as needed. The De-war flask holds liquid nitrogen for at least 30 min with minimal outside condensation and bubbling.
FL-1013 Liquid Nitrogen Dewar Assembly.
Included in the FL-1013 Liquid Nitro-gen Dewar Assembly, the Dewar flask can be purchased as a spare. The bottom portion, which sits directly in the light path, is constructed of fused silica.
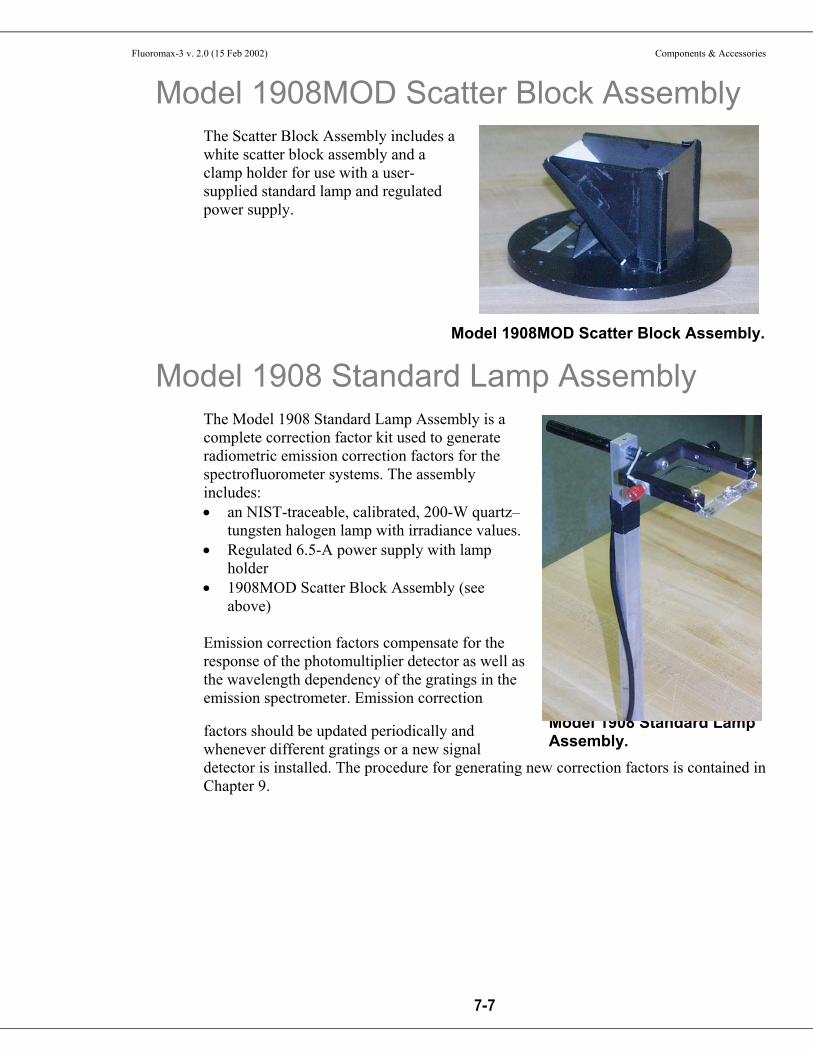
Fluoromax-3 v. 2.0 (15 Feb 2002) Components & Accessories
7-7
Model 1908 Standard Lamp Assembly.
Model 1908MOD Scatter Block Assembly The Scatter Block Assembly includes a white scatter block assembly and a clamp holder for use with a user-supplied standard lamp and regulated power supply.
Model 1908 Standard Lamp Assembly
The Model 1908 Standard Lamp Assembly is a complete correction factor kit used to generate radiometric emission correction factors for the spectrofluorometer systems. The assembly includes: • an NIST-traceable, calibrated, 200-W quartz–
tungsten halogen lamp with irradiance values. • Regulated 6.5-A power supply with lamp
holder • 1908MOD Scatter Block Assembly (see
above) Emission correction factors compensate for the response of the photomultiplier detector as well as the wavelength dependency of the gratings in the emission spectrometer. Emission correction
factors should be updated periodically and whenever different gratings or a new signal detector is installed. The procedure for generating new correction factors is contained in Chapter 9.
Model 1908MOD Scatter Block Assembly.

Fluoromax-3 v. 2.0 (15 Feb 2002) Components & Accessories
7-8
Sample cells Model 1955 HPLC Flow Cell
With a sample capacity of 20 µL, this non-fluorescing fused silica cell is ideal for on-line monitoring of fluorescent samples. The cell maintains high sensitivity because it has a large aperture for collecting the excitation light to the sample and fluorescence emission from the sample. The flat sides allow maximum throughput while keeping the scattering of the incident radiation to a minimum. The cell fits in a standard cell holder.
Model 1923 Micro Cell (with Model 1923A Adapter) This non-fluorescing fused silica cylindrical cell holds 50 µL. This cell does not accept a magnetic stirrer. The 1923A Adapter is required to be able to mount in a standard 10 mm by 10 mm cell holder.
Model 1924 Micro Cell (with Model 1924A Adapter) This non-fluorescing fused silica cylindrical cell holds 250 µL. A magnetic stirrer can-not be used with this cell. The 1924A Adapter is required to enable mounting in the standard 10-mm-×-10-mm cell holder.
Model 1925 Quartz Cuvette With a 4-mL volume, this cell measures 10 mm × 10 mm in cross-section, and comes with a Teflon® stopper to contain volatile liquids.
Model 1920 Sample Cell This 2-mL to 4-mL non-fluorescing fused silica cell, capable of accepting a magnetic stirrer, has a 10-mm path length and includes a white Teflon® cap that prevents sample evaporation.
Model QC-SK Reduced Volume Sample Cell This non-fluorescing fused silica cell is selected for samples with a maximum volume of 1 mL. The square cross-section of the sample cavity is 5 mm. The precise imaging capability of the excitation light focused onto the sample allows for high sensitivity. The adapter and a “flea” magnetic stirrer are included.

Fluoromax-3 v. 2.0 (15 Feb 2002) Components & Accessories
7-9
F-3000 Fiber Optic Mount Now you can study marine environments, skin and hair, or other large samples in situ! For those users who want to examine samples unable to be inserted into the sample compartment, the F-3000 Fiber Optic Mount (plus fiber-optic bundles) allows remote sensing of fluorescence. The F-3000 couples to the T-box; light is focused from the ex-citation spectrometer onto the fiber-optic bundle, and then directed to the sample. Fluo-rescence emission from the sample is directed back through the bundle and into the front-face collection port in the sample compartment. Randomized fiber optic bundles ranging in length from 1 meter to 5 meters are available. Contact the local Sales Repre-sentative for details.
F-3000 Fiber Optic Mount.

Fluoromax-3 v. 2.0 (15 Feb 2002) Components & Accessories
7-10
Model 1938 Cut-On Filter The Model 1938 Cut-On Filter Set consists of 5 filters with dimensions of 1" × 2". To position the filter properly, the Model FL-1010 Filter Holder is required. Cut-on filters are used to eliminate second-order effects of the gratings. For example, if sample excitation is at 300 nm, a second-order peak will occur at 600 nm. If the emis-sion spectrum extends from 400 nm to 650 nm, a sharp spike will occur at 600 nm. This peak is the second-order peak of the excitation spectrometer. To remove this unwanted peak in the emission spectrum, place a 350 nm filter in the emission slot. Cut-on filters typically are used for phosphorescence measurements, where second-order effects are common. The sample compartment has slots to hold the Model FL-1010 filter holder in the emis-sion and excitation light-path positions. To eliminate second-order effects from an exci-tation spectrum, install the filter holder and the appropriate cut-on filter in the excita-tion light path.
Model 1939 Cut-On Filter The Model 1939 Cut-On Filter set consists of five 2" × 2" filters with cut-on wave-lengths of 350 nm, 399 nm, 450 nm, 500 nm, and 550 nm. To position the filter prop-erly, the FL-1010 Filter Holder is required. Cut-on filters are used to eliminate second-order effects of the gratings. For example, if sample excitation is at 300 nm, a second-order peak will occur at 600 nm. If the emis-sion spectrum extends from 400 nm to 650 nm, a sharp spike will occur at 600 nm. This peak is the second-order peak of the excitation spectrometer. To remove this unwanted peak in the emission spectrum, place a 350 nm filter in the emission slot. Cut-on filters typically are used for phosphorescence measurements, where second-order effects are common. The sample compartment has slots to hold the Model FL-1010 filter holder in the emis-sion and excitation light-path positions. To eliminate second-order effects from an exci-tation spectrum, install the filter holder and the appropriate cut-on filter in the excita-tion light path.

Fluoromax-3 v. 2.0 (15 Feb 2002) Components & Accessories
7-11
FL-1010 Cut-On Filter Holder Cut-on filters are used to eliminate second-order effects of the gratings. The sample compartment has three slots that can hold the FL-1010 Fil-ter Holder. Refer to either Model 1939 Cut-On Filter or Model 1938 Cut-On Filter for a detailed description of the placement of the filter holder and the interaction of the cut-on filters and the holder.

Fluoromax-3 v. 2.0 (15 Feb 2002) Components & Accessories
7-12
Warning: Failure to clamp these hoses securely may result in flooding and damage to the optics and electronics of the instrument.
FL-1011 Four-Position Thermostatted Cell Holder
The FL-1011 Four-Position Thermostatted Cell Holder keeps a sample at a constant temperature from –20°C to +80°C. The temperature is maintained by an ethylene-glycol–water mixture pumped through from an external circulating temperature bath (not included). The holder also includes a magnetic stirrer, for mixing turbid or viscous samples. Also required is the FM-2003 Sample Compartment Accessory.
FL-1011 Four-Position Thermostatted Cell Holder.
Installation
1 Remove the compartment gap-bed.
2 Position the FL-1011 gap-bed drawer.
3 Tighten with four screws.
4 Attach the ¼" tubing to the brass inlets on the bottom of the holder.
Fluoromax-3 v. 2.0 (15 Feb 2002) Components & Accessories
7-13
Note: Selecting too high a speed may create a vortex, which could affect the re-producibility of the meas-urement.
Note: While the four-position model maintains the tempera-ture of all four samples, only one sample is mixed at a time.
Use
1 Place the sample in a 10 mm × 10 mm cuvette and insert a magnetic stirring bar.
(The stirring bar is available from Bel-Art Products, Pequannock, NJ)
2 Place a cuvette in each holder.
3 Allow the samples to reach the desired temperature.
4 Turn on the magnetic stirrer.
5 Select the appropriate mixing speed. The speed at which the sample should be mixed depends on the viscosity of the sample.
6 Run your experiment as usual.
7 Place the next cuvette in the sample position by lifting up the knob and rotating the holder. Be sure to press down, to lock the cuvette into the proper position.

Fluoromax-3 v. 2.0 (15 Feb 2002) Components & Accessories
7-14
Warning: Failure to clamp these hoses securely may result in flooding and damage to the optics and electronics of the instrument.
FL-1012 Dual-Position Thermostatted Cell Holder
The FL-1012 Dual-Position Thermostatted Cell Holder keeps a sample at a constant temperature from –20°C to +80°C. The temperature is maintained by an ethylene-glycol–water mixture pumped through from an external circulating temperature bath (not included). The holder also includes a magnetic stirrer, enabling mixing of turbid or viscous samples. Also required is the FM-2003 Sample Compartment Accessory.
FL-1012 Dual-Position Thermostatted Cell Holder.
Installation
1 Remove the present holder from the posts.
2 Replace with the FL-1012.
3 Tighten the two thumbscrews
4 Attach the ¼" tubing to the brass inlets on the bottom of the holder.
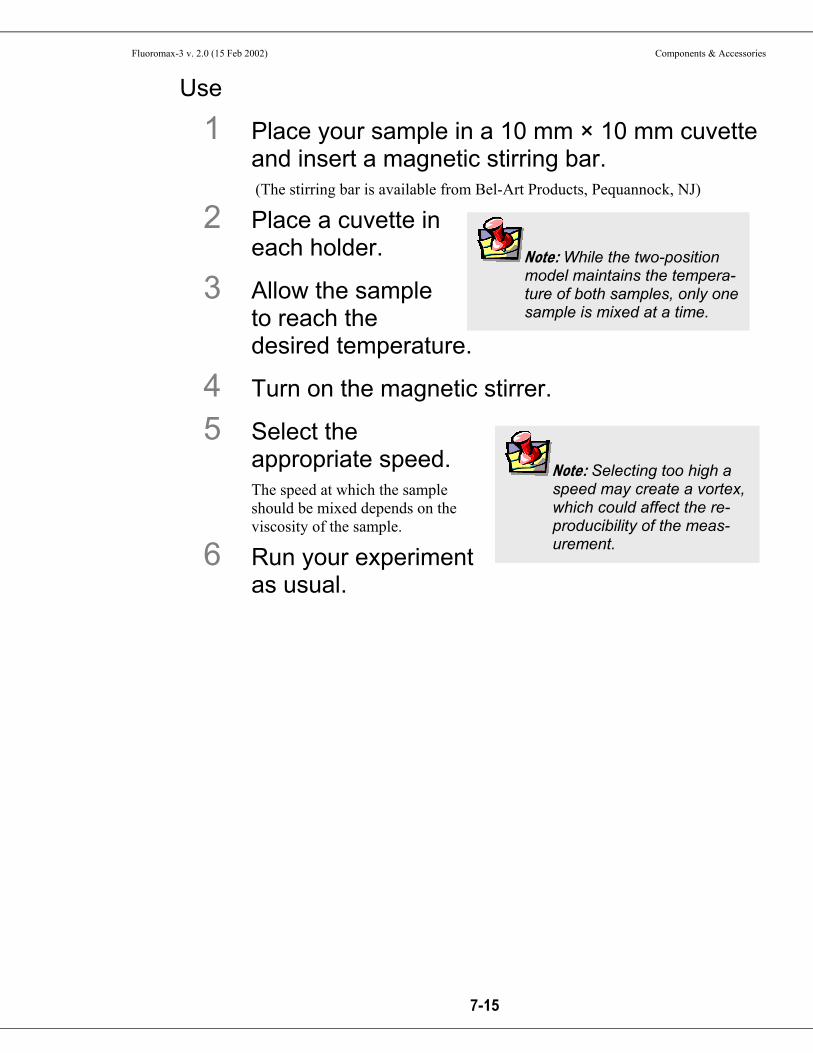
Fluoromax-3 v. 2.0 (15 Feb 2002) Components & Accessories
7-15
Note: Selecting too high a speed may create a vortex, which could affect the re-producibility of the meas-urement.
Note: While the two-position model maintains the tempera-ture of both samples, only one sample is mixed at a time.
Use
1 Place your sample in a 10 mm × 10 mm cuvette and insert a magnetic stirring bar. (The stirring bar is available from Bel-Art Products, Pequannock, NJ)
2 Place a cuvette in each holder.
3 Allow the sample to reach the desired temperature.
4 Turn on the magnetic stirrer.
5 Select the appropriate speed. The speed at which the sample should be mixed depends on the viscosity of the sample.
6 Run your experiment as usual.

Fluoromax-3 v. 2.0 (15 Feb 2002) Components & Accessories
7-16
Note: When the sample is perpendicular the light is collected at an angle of 22.5°. This orientation minimizes stray and re-flected light off the sur-face of the sample.
Model 1933 Solid Sample Holder The Model 1933 Solid Sample Holder is designed for samples such as thin films, pow-ders, pellets, microscope slides, and fibers. The holder consists of a base with a dial in-dicating angle of rotation, upon which a bracket, a spring clip, and a sample block rest.
Model 1933 Solid Sample Holder (with sample block nearby).
Installation
1 Remove the present holder.
2 Position the base on the posts.
3 Tighten the two thumbscrews. For pellets, crystals, creams, gels, powders, and similar materials:
1 Fill the well of the block.
2 Place a quartz coverslip or Teflon® film over the well. This holds the sample in place when vertically positioned.
3 Carefully insert the block between the bracket and spring clip, so that the sample is perpendicular to the excitation light.
Fluoromax-3 v. 2.0 (15 Feb 2002) Components & Accessories
7-17
For samples such as thin films, microscope slides, fibers, or other materials:
1 Place the material on the block on the side opposite that of the well.
2 Insert the block between the bracket and spring clip. The sample should be perpendicular to the excitation light and fluorescence col-lected.

Fluoromax-3 v. 2.0 (15 Feb 2002) Components & Accessories
7-18
F-3005/6 Autotitration Injector For controlled, automatic injection of aliquots into the sample of your choice, the F-3005/6 Autotitration Injector is just the thing, available in both 110-V (F-3005) and 220-V (F-3006) models. The F-3005/6 comes with dual syringes, for complete control over dispensing and aspirating volumes of liquids into and out of the sample cell. A mix function is included. With the injector come 18-gauge Teflon® tubing and two sy-ringes (1 mL and 250 µL). The syringes are interchangeable; aliquot size is controllable to 0.1% of total syringe volume.
F-3005/6 AutoTitrator Injector.

Fluoromax-3 v. 2.0 (15 Feb 2002) Components & Accessories
7-19
Models F-3001, F-3002, and F-3003 Microscope Fiber-Optic Interfaces
The Microscope Fiber-Optic Interface eases the use of the FluoroMax®-3 systems for fluorescence-microscopy measurements. Interfaces are available for Nikon, Olympus, and Zeiss microscopes.
Models F-3001, F-3002, F-3003 Microscope Fiber-Optic Interfaces

Fluoromax-3 v. 2.0 (15 Feb 2002) Components & Accessories
7-20
Model 1905-OFR 150-W Xenon Lamp The Model 1905 150-W xenon lamp delivers light from 240 nm to 850 nm for sample excitation. The lamp has an approximate life of 1500 hours, and is ozone-free.

Fluoromax-3 v. 2.0 (15 Feb 2002) Components & Accessories
7-21
F-3004 Sample Heater/Cooler Peltier Thermocouple Drive
For rapid control of the sample’s temperature in the FluoroMax®-3’s sample compart-ment, choose the F-3004 Peltier Drive. Instead of messy fluids, the Peltier device heats and cools the sample thermoelectrically and fast! The temperature range is –10°C to +120°C. To prevent condensation of moisture on chilled cuvettes, an injection port for dry nitrogen gas is provided. All software is included, along with a controller and stir-ring mechanism.
F-3004 Sample Heater/Cooler Peltier Thermocouple Drive.

Fluoromax-3 v. 2.0 (15 Feb 2002) Components & Accessories
7-22
MicroMax Microwell Plate Reader
The MicroMax Microwell Titer-Plate Reader allows multiple samples to be scanned in one experiment. The MicroMax is controlled through the DataMax software via a serial port to the host computer. The titer plate moves beneath a stationary optical beam, and fluorescence measurements are collected with top-reading geometry. Thus, any titer plates—even disposable ones—may be used. Up to 96-well plates may be inserted into the MicroMax (or 384-well plates in the MicroMax 384), with a rapid scan speed. Various scan types are possible: • Single-Point Analysis • Excitation • Emission • Time-Base • Synchronous • Multigroup Signals are transmitted between the FluoroMax®-3 and the MicroMax via a fiber-optic bundle.

Fluoromax-3 v. 2.0 (15 Feb 2002) Components & Accessories
7-23
FL-1044 L-Format Polarizer For L-format spectrofluorometers such as the FluoroMax®-3, the FL-1044 dual polarizer is ideal. The kit includes two polarizers, to be placed at the entrance and the exit of the T-box. The polarizers are fully automated, and are adjustable to within 1° rotation. Insertion and removal from the optical path is controlled by the computer.

Fluoromax-3 v. 2.0 (15 Feb 2002) Components & Accessories
7-24
FL-1015 Injector Port For the study of reaction kinetics, such as Ca2+ measurements, the FL-1015 Injector Port is ideal. This accessory allows additions of small volumes via a syringe or pipette to the sample cell without removing the lid of the sample compartment. With the injec-tor in place, a lock-tight seal is achieved, prevented both light and air from reaching the sample. The Injector Port is recommended for use with the TRIG-15/25 Trigger Box/Event Marker.
FL-1015 Injection Port.
The Injector Port will accommodate most pipettes and syringes, with an injection hole diameter of 0.125" (3.2 mm). A cap is included to cover the port when not in use.
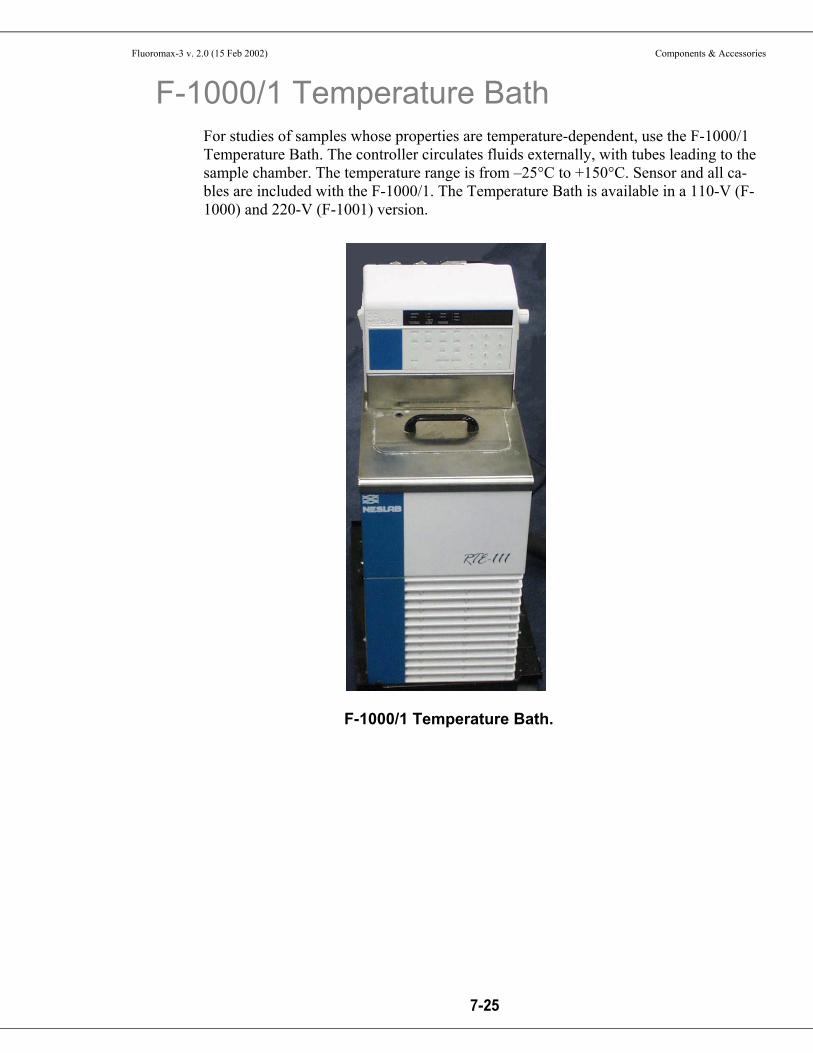
Fluoromax-3 v. 2.0 (15 Feb 2002) Components & Accessories
7-25
F-1000/1 Temperature Bath For studies of samples whose properties are temperature-dependent, use the F-1000/1 Temperature Bath. The controller circulates fluids externally, with tubes leading to the sample chamber. The temperature range is from –25°C to +150°C. Sensor and all ca-bles are included with the F-1000/1. The Temperature Bath is available in a 110-V (F-1000) and 220-V (F-1001) version.
F-1000/1 Temperature Bath.

Fluoromax-3 v. 2.0 (15 Feb 2002) Components & Accessories
7-26
Model TRIG-15/25 External Trigger Accessory
The TRIG-15/25 accessory permits the fluorescence system to be operated with almost any external trigger stimulus. Data acquisition can be synchronized with external events, by automatically following a voltage pulse (minimum 3 V above ground), or manually pushing a button on a trigger-release cable. Multiple trigger events are re-corded and stored with the associated data file. A TTL trigger output also is provided, for activating external devices, such as a stopped-flow unit. The front panel has four sets of banana-jack inputs for two independent trigger inputs, Trigger 1 and Trigger 2.
Model TRIG-15/25 External Trigger Accessory.
There are two sets of jacks for each of these two trigger inputs: an upper set, for manual switch inputs, and a lower set, for pulsed voltage inputs. These two input types can be used simultaneously, but any one event is ignored while the interface is activated by another.

Fluoromax-3 v. 2.0 (15 Feb 2002) Components & Accessories
7-27
FM-2005 Upgrade to FluoroMax®-P To perform phosphorescence measurements using the FluoroMax®-3, order the FM-2005 upgrade. This accessory offers automated switching via a motorized mirror be-tween the existing CW xenon lamp in the FluoroMax® system, and a new pulsed xenon lamp installed in the FluoroMax®-3 housing. No manual adjustments are necessary. The FM-2005 provides DataMax-controlled flashlamp delays, number of flashes per data point, signal gating, and acquisition time, all maintaining the accuracy and preci-sion you have come to expect from Spex® products. Acquire long phosphorescence life-times, while eliminating fast fluorescence interference automatically.

Fluoromax-3 v. 2.0 (15 Feb 2002) Components & Accessories
7-28

Fluoromax-3 v. 2.0 (18 Feb 2002) Troubleshooting
8-1
8: Troubleshooting The FluoroMax®-3 system has been designed to operate reliably and predictably. If there is a problem, examine the chart below, and try the steps on the following pages.
Problem Possible Cause Remedy
Excitation shutter closed. Using the software, open the shutter.
Slits are not open to the proper width.
Adjust the slits.
FluoroMax®-P is in phos-phorimeter layout.
Change to a steady-state layout.
Monochromator is miscali-brated.
Check and recalibrate monochromator.
Light is not reaching the sample.
Sample turret is not in cor-rect position.
Using DataMax, set the position and open the cover to verify the position.
CW lamp is not aligned. Align the lamp.
Slits are improperly set. Adjust the slit widths.
Shutter(s) is(are) not com-pletely open.
Open the shutter(s).
Lamp power supply is set to the wrong current rating.
Call the Spex® Fluorescence Service Depart-ment.
Lamp is too old. Replace lamp. (150-W lamp has lamp lifetime 1200–1500 h.)
Signal intensity is low.
Shutter(s) closed. Open all shutters.
Signal intensity is at least 10 times lower than normal.
Polarizer is in the light path.
In Visual Instrument Setup, move the polar-izer out of the light path.
Spectrometers are set to wrong wavelength.
Select appropriate wavelength based on exci-tation and emission of sample.
Detectors are saturated. Adjust slits. (Signal detector is linear to 4 × 10⁶ cps in photon-counting mode. Reference detector saturates at 12 µA.)
Optical density effects and self-absorption.
Sample is too concentrated. Dilute sample by a factor of 10 or 100 and retry experiment.
No change in signal intensity.
Detectors are saturated. Reduce slit settings.
High voltage is off. Turn on high voltage through the software. No signal.
Lamp is not on. Turn on lamp.
Lamp unstable. Let lamp warm up 20 min before use.
Light leaks. Check dark value to determine.
Erratic signal.
Sample has particles that scatter light irregularly.
Filter sample, or let particles settle before run-ning scan.

Fluoromax-3 v. 2.0 (18 Feb 2002) Troubleshooting
8-2
Raman band super-imposed on fluores-cence scan.
Aqueous solutions and solvents have Raman bands.
Change excitation wavelength to move Raman band away from fluorescence peak, or run a blank scan of the solvent and subtract it from the fluorescence spectrum.
Large off-scale peak at twice the excitation wavelength.
Second-order effects from the spectrometer.
Use cut-on filters to eliminate 2nd-order peak.
Scattered light off the exci-tation wavelength.
Place bandpass filters in excitation light path.
Decrease emission-spectrometer slit widths.
Dirty cuvette. Clean the cuvette as described in Chapter 5.
Stray light in emission scan (also see example in this chapter).
Solid-sample holder in sample compartment.
Rotate the holder to prevent direct scatter from entering the emission spectrometer.
Corrected excitation spectrum curves up-ward ~240–270 nm.
Dark count is divided by low reference signal.
Use Dark Offset data-entry field; retry scan.
Stirring speed is too fast. Use slower stirring speed. Noisy spectrum with magnetic stirrer. Stirring bar is too large;
light beam is striking it. Use a smaller stirring bar (available from BelArt Products, Pequannock, NJ).
Boot disk corrupted. Use backup boot disk. If no backup boot disk is available, call Spex® Fluorescence Service.
Cables are improperly con-nected.
Check communications cables’ connections.
Wrong COM-port settings. See datamax\isa_ini\sac.ini file.
Communication prob-lems between com-puter and instrument.
Computer’s or SAC’s I/O-controller is failing.
Replace I/O controller: Call Spex® Fluores-cence Service.
Hardware Init. error appears.
Broken IR sensor in mono-chromator.
Replace IR sensor: Call Spex® Fluorescence Service.
Error converting slit units appears.
Datamax\isa_ini\dflt.set file is corrupt.
Delete datamax\isa_ini\dflt.set file. When system is restarted, the system rec-reates this file.
Software is not enabled. Check status. Sample turret is not operating. Cables are connected im-
properly. Check cable connections.
Instrument Control Cen-ter icon is not on desk-top, but appears in taskbar
isamain.ini is improp-erly set
In windows directory, open isamain.ini
Change the coordinates listed to Left = 524 Top = 174 Right = 824 Bottom = 282
If problem persists, change isamain.ini into a read-only file.
Error “no trace view object” appears
isascan.set or isas-can.vw are corrupted
Delete isascan.set and isascan.vw from datamax directory. (They are recreated automatically.)

Fluoromax-3 v. 2.0 (18 Feb 2002) Troubleshooting
8-3
FluoroMax®-P resets itself in phosphorime-ter mode
Flash lamp’s life is expired, drawing excess current, causing transient emf inter-ference.
Replace xenon flash lamp.
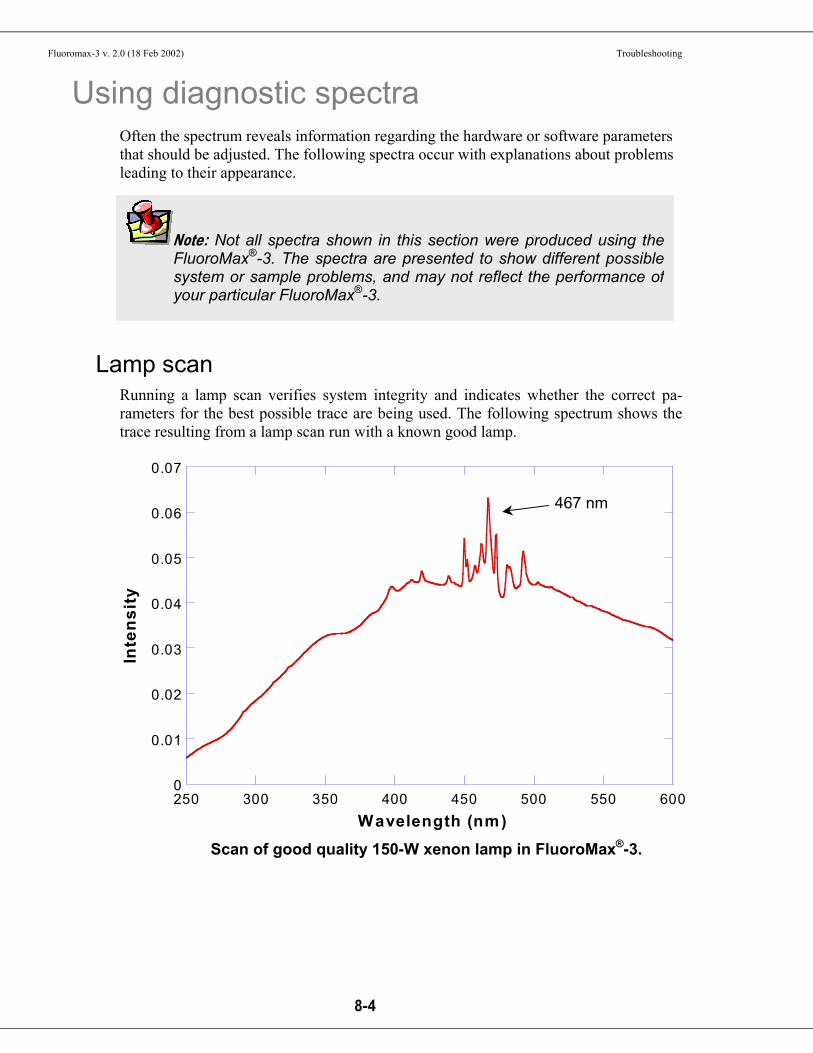
Fluoromax-3 v. 2.0 (18 Feb 2002) Troubleshooting
8-4
Note: Not all spectra shown in this section were produced using theFluoroMax®-3. The spectra are presented to show different possiblesystem or sample problems, and may not reflect the performance ofyour particular FluoroMax®-3.
Using diagnostic spectra Often the spectrum reveals information regarding the hardware or software parameters that should be adjusted. The following spectra occur with explanations about problems leading to their appearance.
Lamp scan Running a lamp scan verifies system integrity and indicates whether the correct pa-rameters for the best possible trace are being used. The following spectrum shows the trace resulting from a lamp scan run with a known good lamp.
0
0.01
0.02
0.03
0.04
0.05
0.06
0.07
250 300 350 400 450 500 550 600
Inte
nsity
Wavelength (nm)
467 nm
Scan of good quality 150-W xenon lamp in FluoroMax®-3.

Fluoromax-3 v. 2.0 (18 Feb 2002) Troubleshooting
8-5
The following lamp scan spectrum shows poor resolution in the area around the peak.
Poor lamp scan of 150-W Xe lamp. Note low resolution in the area near the 467-nm peak.
This lack of spectral resolution appears because the slit widths are set too wide. To re-solve this problem, narrow the slit widths.
Inte
nsity
(cou
nts
s–1)
0.4473
0.3355
0.2236
0.1118
0
Xenon-lamp peaks are unresolved
300 400 500 600 700 800 Wavelength (nm)

Fluoromax-3 v. 2.0 (18 Feb 2002) Troubleshooting
8-6
Clean water Raman scan.
0
1
2
3
4
5
365 380 395 410 425 440 455Wavelength (nm)
Inte
nsity
(105 c
ount
s/s)
397 nm
C o n tam in ated w ater in a w ater R am an scan .
0
1
2
3
4
5
3 6 5 3 8 0 3 9 5 4 1 0 4 2 5 4 4 0 4 5 5
W a v e le ngth (nm)
Inte
nsity
(105 c
ount
s/s)
Contaminated water or dirty cuvette (note high background)
Clean water
Water Raman spectra Contaminated water Running a water Raman scan helps identify abnormalities caused by accessory prob-lems or miscalibration. The following spectrum is normal:
Below is a normal water Raman spectrum superimposed on one that exhibits a problem. In this instance, the water was contaminated, resulting in a high background.
If a spectrum similar to this is obtained after running a water Raman scan,
1 Rotate the cuvette 90° and rerun the scan.

Fluoromax-3 v. 2.0 (18 Feb 2002) Troubleshooting
8-7
If the problem goes away, then the problem was due to the cuvette surface. Clean or use a different cuvette.
Or
1 Clean the cuvette.
2 Fill with fresh, double-distilled, deionized water. If the problem goes away, then the problem was due to contaminated water.
Light not striking cuvette The following graph shows a normal water-Raman scan with a superimposed problem scan.
Here the problem is low intensity of the water signal when compared with the superim-posed typical water Raman scan. To resolve this problem:
1 Make sure the cuvette is filled to the proper level. Light should fall on the sample, and the meniscus should not be in the light path.
2 Make sure that the excitation and emission slits are set to the proper widths.
3 Verify that the detector is set to the proper voltage.
Low intensity during a Raman scan.
0
1
2
3
4
5
365 380 395 410 425 440 455Wavelength (nm)
Inte
nsity
(105 c
ount
s/s)
Clean water
Low signal

Fluoromax-3 v. 2.0 (18 Feb 2002) Troubleshooting
8-8
Stray light In the following diagram, notice the high level of stray-light below 380 nm in the water Raman spectrum.
To correct this problem,
1 Inspect the cuvette surface for fingerprints and scratches.
2 Clean the cuvette or use a new one.
3 Verify that the excitation and emission slits are set correctly for a water Raman scan.
4 Verify that the excitation spectrometer is at the correct position.
Normal
S
High stray light in a water Raman scan.
0
10
20
30
40
50
60
365 380 395 410 425 440 455Wavelength (nm)
Inte
nsity
(105 c
ount
s/s)

Fluoromax-3 v. 2.0 (18 Feb 2002) Troubleshooting
8-9
Further assistance... Read all software and accessory manuals before contacting the Spex® Fluorescence Service Department. Often the manuals show the problem’s cause and a method of so-lution. Technical support is available for both hardware and software troubleshooting. Before contacting the service department, however, complete the following steps.
1 If this is the first time the problem has occurred, try turning off the system and accessories. After a cool-down period, turn everything back on.
2 Make sure all accessories are properly configured, and turned on as needed.
3 Following the instructions in Chapter 3, System Operation, run a lamp scan and a water Raman scan to make sure the system is properly calibrated. Print the spectrum for each and note the peak intensities.
4 Check this chapter to see if the problem is discussed.
5 Visit our web site at www.isainc.com/fluor/fluor.htm to see if the question is addressed in the Systems or FAQs sections of the site.
6 Try to duplicate the problem and write down the steps required to do so. The service engineers will try to do the same with a test system. Depending on the the problem, a service visit may not be required.
7 If an error dialog box appears in DataMax, write down the exact error displayed.
8 In DataMax, in the Instrument Control Center toolbar, choose Help. Under Help, choose About Instrument Control Center. This opens the About Instrument Control Center window. The version of the software is listed here.
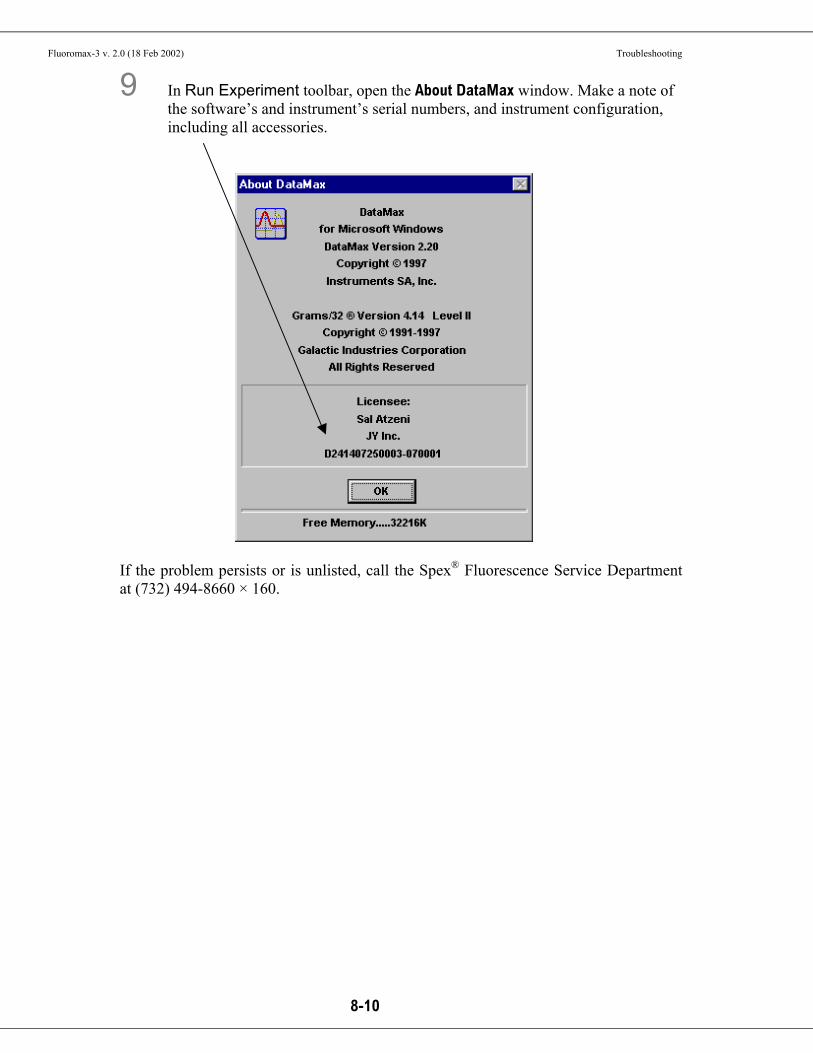
Fluoromax-3 v. 2.0 (18 Feb 2002) Troubleshooting
8-10
9 In Run Experiment toolbar, open the About DataMax window. Make a note of the software’s and instrument’s serial numbers, and instrument configuration, including all accessories.
If the problem persists or is unlisted, call the Spex® Fluorescence Service Department at (732) 494-8660 × 160.

Fluoromax-3 v. 2.0 (18 Feb 2002) Producing Correction Factors
9-1
9: Producing Correction Factors Introduction
Gratings, detectors and other spectrometer components have response characteristics that are functions of wavelength. These characteristics are superimposed on spectra, and may yield a potentially misleading trace. For accurate intensity comparisons, such as those required for quantum-yield determinations, spectrometer-response characteris-tics must be eliminated. Corrections are made for each of these potential problems by using radiometric correction factors. Supplied with the FluoroMax®-3 are sets of excitation and emission correction factors designed to eliminate response characteristics. These files, xcorrect.spc and mcorrect.spc, are included with the software and should be copied to the hard disk. The excitation correction range is from 240–600 nm, and the correction range for emission spectra is from 290–850 nm.

Fluoromax-3 v. 2.0 (18 Feb 2002) Producing Correction Factors
9-2
Generating emission correction factors Generate a new correction-factor file only when the gratings or detectors have been re-placed with those of different specifications than the original hardware.
Required kits Emission correction factors should be updated periodically or whenever different grat-ings or signal detectors are installed. The correction factors can be updated either at the user’s location, or by a representative from the Spex® Fluorescence Service Depart-ment. To arrange for a visit and a fee estimate, call Spex® Fluorescence Service De-partment. To update the correction factors without a service visit, follow the instruc-tions below. One way to generate correction factors for the instrument is to scan the spectrum of a standard lamp. Because the actual irradiance values of the standard lamp as a function of wavelength are known, dividing the irradiance values by the lamp spectrum results in a set of relative correction values. These values can then be applied to the raw fluo-rescence data. The emission correction factor file mcorrect.spc was acquired in this manner. To generate emission correction factors, several items are needed: a standard lamp, ap-propriate holders, and a scatter assembly. Jobin Yvon Inc. offers two kits: the Model 1908 Standard Lamp Accessory, and the Model 1908MOD Scatter Assembly. The Model 1908 is a complete correction factor kit, while the Model 1908MOD Scatter As-sembly is provided for users who already have a calibrated standard lamp and a con-stant-current source. The Model 1908 Standard Lamp Assembly is a complete correction factor kit, which includes the following items: • 200-watt quartz tungsten-halogen filament lamp with irradiance values • Constant-current power supply with lamp holder • 1908MOD scatter assembly The Model 1908MOD scatter assembly includes: • Lamp-mount assembly and mask with square center • Scatter block with neutral-density filter and reflectance plate

Fluoromax-3 v. 2.0 (18 Feb 2002) Producing Correction Factors
9-3
Generation
1 Turn off xenon lamp.
2 Open the Real Time Display.
3 Turn off the high voltage to the emission photomultiplier tube.
4 Close the slits.
5 Place the 1908MOD scatter block assembly in the sample chamber, so that light is directed toward the right angle. Looking down, the scatter plate should be toward the left.
6 Place the mask over the sample compartment. The square hole should be vertically centered over the white scatter plate. Secure the mask with black tape.
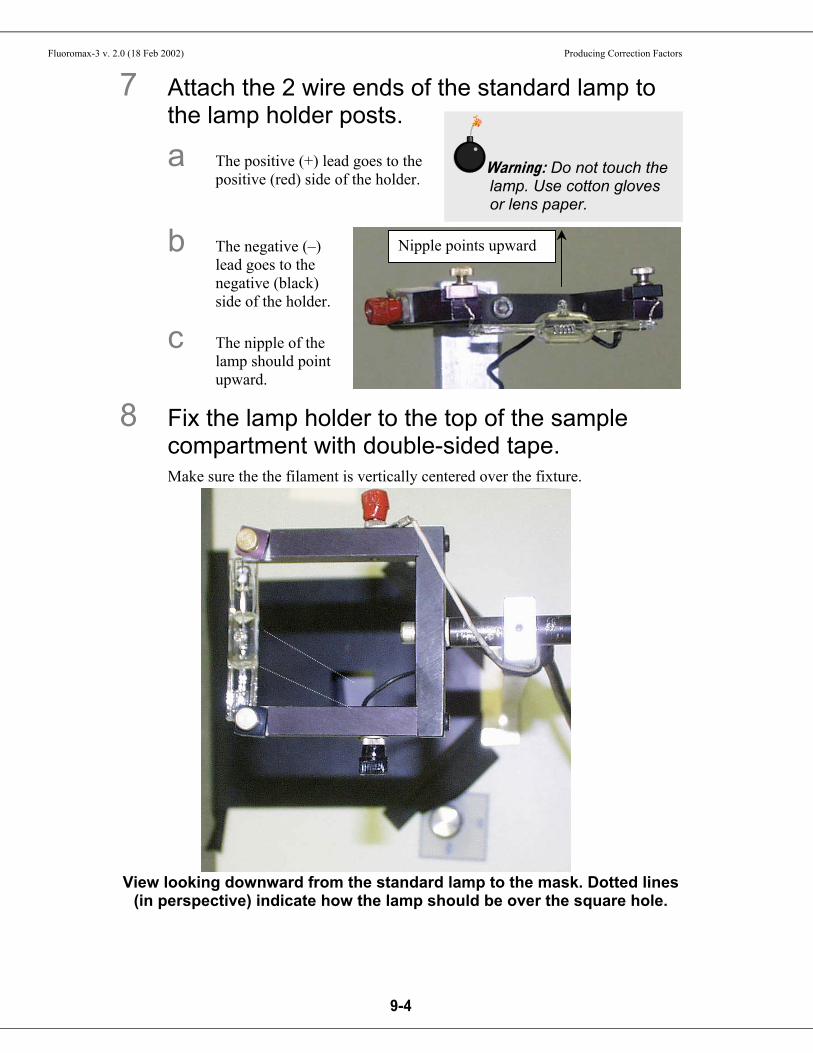
Fluoromax-3 v. 2.0 (18 Feb 2002) Producing Correction Factors
9-4
Warning: Do not touch the lamp. Use cotton gloves or lens paper.
7 Attach the 2 wire ends of the standard lamp to the lamp holder posts.
a The positive (+) lead goes to the positive (red) side of the holder.
b The negative (–) lead goes to the negative (black) side of the holder.
c The nipple of the lamp should point upward.
8 Fix the lamp holder to the top of the sample compartment with double-sided tape. Make sure the the filament is vertically centered over the fixture.
View looking downward from the standard lamp to the mask. Dotted lines (in perspective) indicate how the lamp should be over the square hole.
Nipple points upward
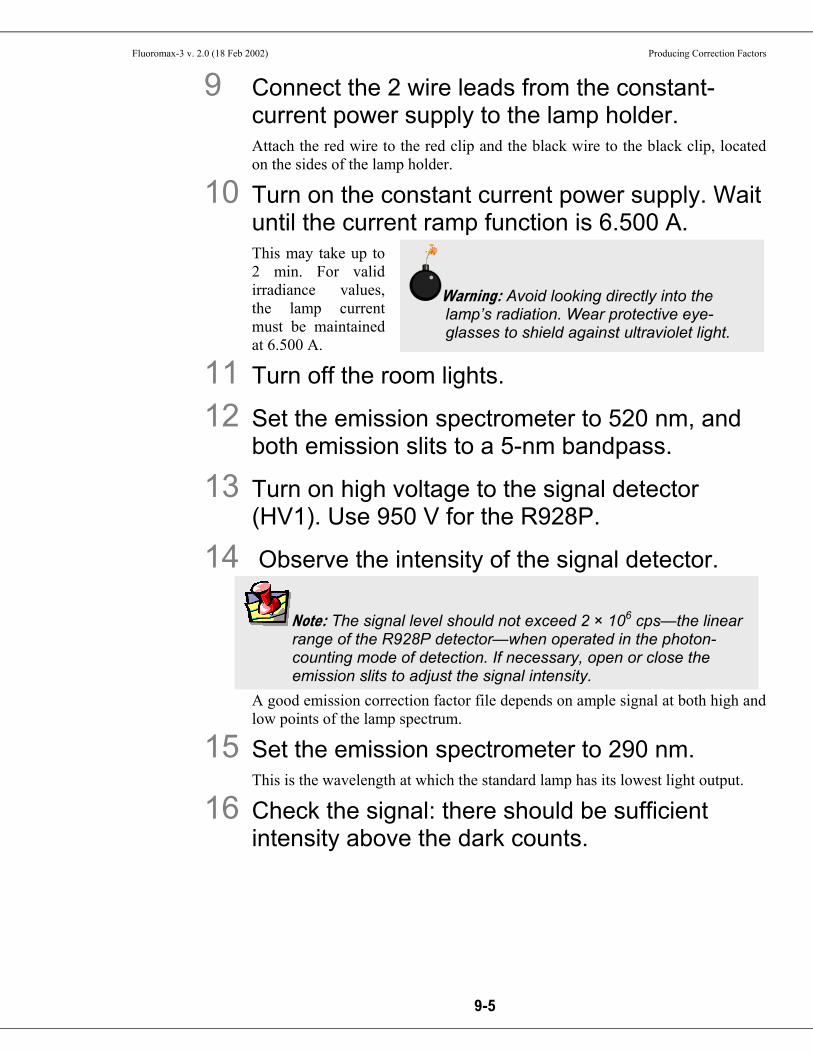
Fluoromax-3 v. 2.0 (18 Feb 2002) Producing Correction Factors
9-5
Warning: Avoid looking directly into the lamp’s radiation. Wear protective eye-glasses to shield against ultraviolet light.
Note: The signal level should not exceed 2 × 10⁶ cps—the linear range of the R928P detector—when operated in the photon-counting mode of detection. If necessary, open or close the emission slits to adjust the signal intensity.
9 Connect the 2 wire leads from the constant-current power supply to the lamp holder. Attach the red wire to the red clip and the black wire to the black clip, located on the sides of the lamp holder.
10 Turn on the constant current power supply. Wait until the current ramp function is 6.500 A. This may take up to 2 min. For valid irradiance values, the lamp current must be maintained at 6.500 A.
11 Turn off the room lights.
12 Set the emission spectrometer to 520 nm, and both emission slits to a 5-nm bandpass.
13 Turn on high voltage to the signal detector (HV1). Use 950 V for the R928P.
14 Observe the intensity of the signal detector.
A good emission correction factor file depends on ample signal at both high and low points of the lamp spectrum.
15 Set the emission spectrometer to 290 nm. This is the wavelength at which the standard lamp has its lowest light output.
16 Check the signal: there should be sufficient intensity above the dark counts.

Fluoromax-3 v. 2.0 (18 Feb 2002) Producing Correction Factors
9-6
Determine the dark counts
1 Place the sample lid over the mask to block light to the detector.
2 In Run Experiment, select the Experiment button. This opens the Emission Acquisition dialog box.
3 Type in the following parameters in the Emission Acquisition dialog box:
Number of Scans 1 Start 290 nm End 850 nm Increment 5 nm Integration Time 1 s Excitation Position 350 nm
4 Run the standard lamp spectrum.
5 Name this file stlamp.
6 Place the lid over the mask to block the light between the standard lamp and the scatter fixture.
7 Run another scan using the same parameters, and name this file blank. This data file is a straight line with low intensity.
8 Choose Arithmetic from the toolbar.
9 Using the Arithmetic menu, subtract blank from stdlamp.
10 Name this file stdlamp2. Below are the blank and lamp spectra. Notice that the blank is almost non-existent. Because of the low intensity of the blank file, the blank-subtracted file, stdlamp2, will resemble the stdlamp file.

Fluoromax-3 v. 2.0 (18 Feb 2002) Producing Correction Factors
9-7
Note: Obtaining emission correction factors for the region between 250 nm and 300 nm is possible. Because the gratings are ex-tremely inefficient in this range and the standard lamp output is low, generating these factors is somewhat more involved.
Blank and lamp spectra.
Your spectrum should appear similar to the one pictured above. Its actual appearance, however, depends on the configuration of the FluoroMax®-3 system. The lamp scan was acquired with gratings in the emission spectrometer blazed in the visible region and an R928P red-sensitive photomultiplier as the detector. Different gratings or detectors may alter the shape of the lamp spectrum.
300 400 500 600 700 800 Wavelength (nm)
Inte
nsity
(× 1
06 cou
nts
s–1)
1.2
0.9
0.6
0.3
0
stdlamp
blank
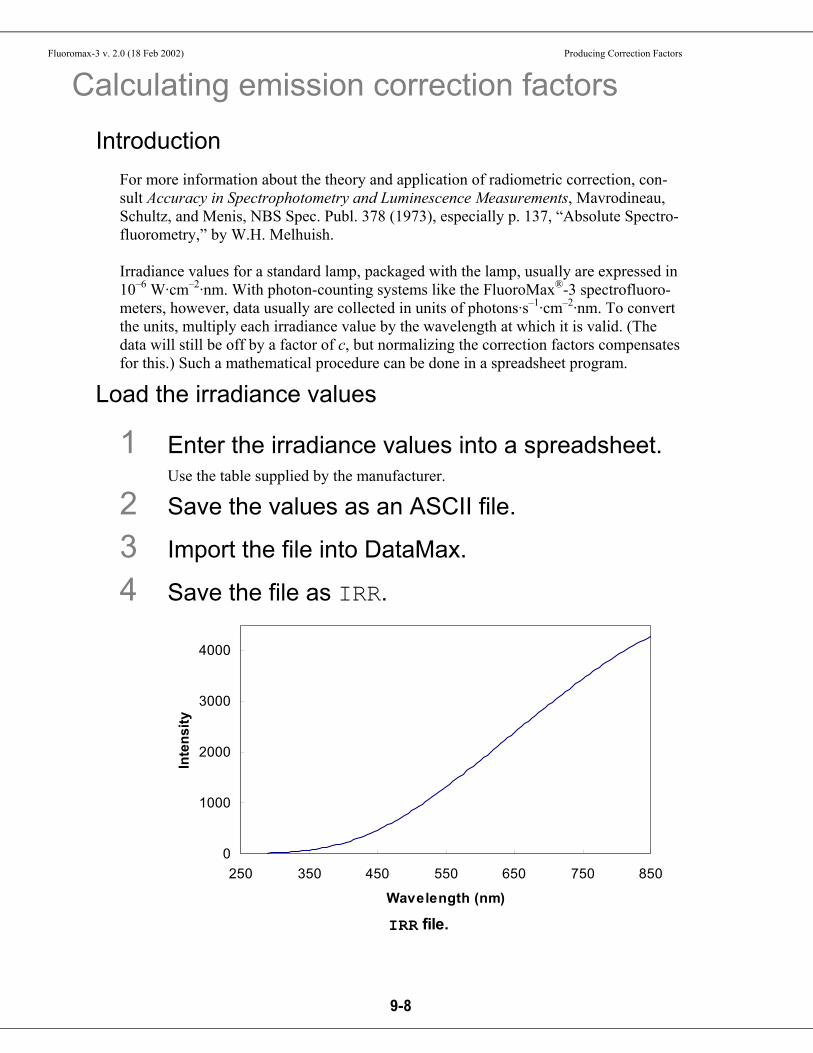
Fluoromax-3 v. 2.0 (18 Feb 2002) Producing Correction Factors
9-8
Calculating emission correction factors Introduction
For more information about the theory and application of radiometric correction, con-sult Accuracy in Spectrophotometry and Luminescence Measurements, Mavrodineau, Schultz, and Menis, NBS Spec. Publ. 378 (1973), especially p. 137, “Absolute Spectro-fluorometry,” by W.H. Melhuish. Irradiance values for a standard lamp, packaged with the lamp, usually are expressed in 10–6 W·cm–2·nm. With photon-counting systems like the FluoroMax®-3 spectrofluoro-meters, however, data usually are collected in units of photons·s–1·cm–2·nm. To convert the units, multiply each irradiance value by the wavelength at which it is valid. (The data will still be off by a factor of c, but normalizing the correction factors compensates for this.) Such a mathematical procedure can be done in a spreadsheet program.
Load the irradiance values
1 Enter the irradiance values into a spreadsheet. Use the table supplied by the manufacturer.
2 Save the values as an ASCII file.
3 Import the file into DataMax.
4 Save the file as IRR.
IRR file.
0
1000
2000
3000
4000
250 350 450 550 650 750 850
Wavelength (nm)
Inte
nsity
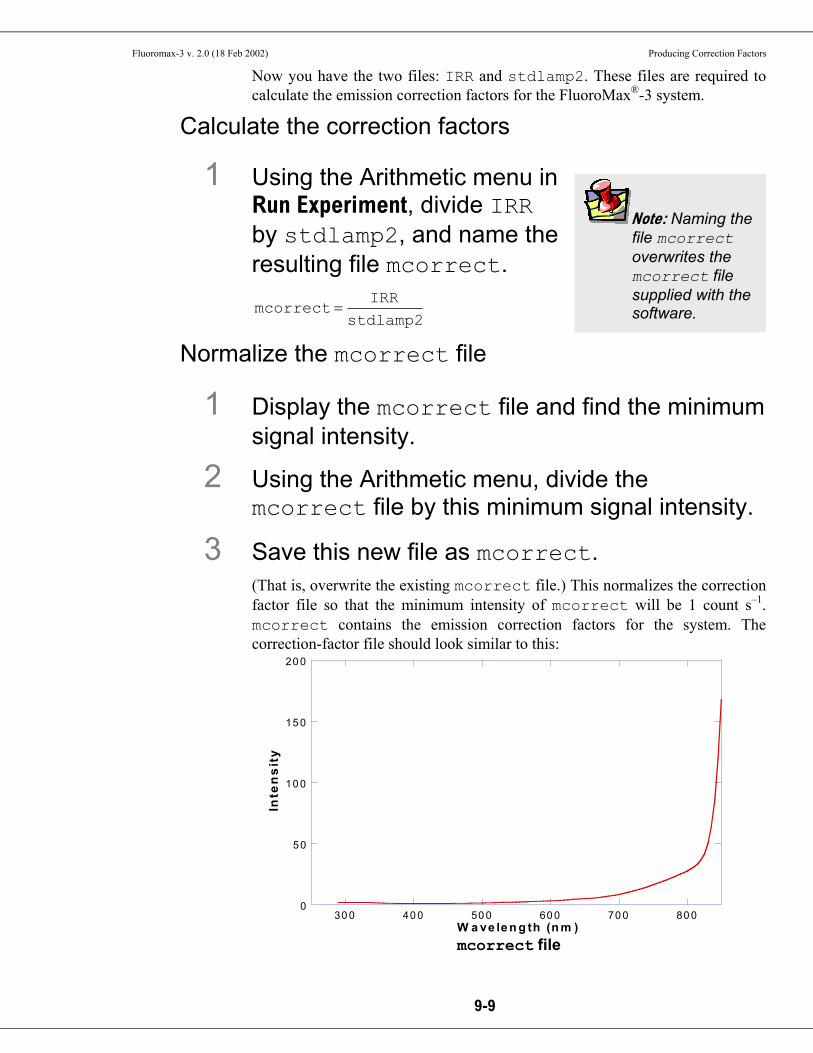
Fluoromax-3 v. 2.0 (18 Feb 2002) Producing Correction Factors
9-9
Note: Naming the file mcorrect overwrites the mcorrect file supplied with the software.
Now you have the two files: IRR and stdlamp2. These files are required to calculate the emission correction factors for the FluoroMax®-3 system.
Calculate the correction factors
1 Using the Arithmetic menu in Run Experiment, divide IRR by stdlamp2, and name the resulting file mcorrect. mcorrect IRR
stdlamp2=
Normalize the mcorrect file
1 Display the mcorrect file and find the minimum signal intensity.
2 Using the Arithmetic menu, divide the mcorrect file by this minimum signal intensity.
3 Save this new file as mcorrect. (That is, overwrite the existing mcorrect file.) This normalizes the correction factor file so that the minimum intensity of mcorrect will be 1 count s–1. mcorrect contains the emission correction factors for the system. The correction-factor file should look similar to this:
mcorrect file
0
50
10 0
15 0
20 0
30 0 40 0 50 0 60 0 70 0 80 0
Inte
nsi
ty
W a ve le n g th (n m )
Fluoromax-3 v. 2.0 (18 Feb 2002) Producing Correction Factors
9-10
Once the emission correction factors have been found, determination of the excitation correction factors may be necessary. The following procedures describe how to obtain excitation correction factors using the photomultiplier and the photodiode. Follow the procedure that applies to your configuration.

Fluoromax-3 v. 2.0 (18 Feb 2002) Producing Correction Factors
9-11
Calculating excitation correction factors
The photodiode reference detector handles the bulk of excitation correction from 240–600 nm when a ratio acquisition mode is selected (e.g., S/R for single-beam and T-box sampling modules). More accurate measurements require that compensation be applied for the difference in optical path between the detector and the sample. This can be ac-complished by a simple excitation scan with rhodamine-B placed in the sample posi-tion.
1 Fill a cuvette with a solution of rhodamine-B. Use 8 g L–1 of laser-grade rhodamine-B in 1,2-propanediol.
2 Place the cuvette in the sample compartment. For single-beam sampling modules, place the cuvette in the standard cell holder and select right-angle detection.
3 Enter the Real Time Display.
4 Set the excitation and emission monochromators to 467 nm and 630 nm, respectively. The largest lamp peak occurs at 467 nm.
5 Set the two slits on the excitation spectrometer to 0.5 mm.
6 Make sure the shutter is open.
7 Set the excitation monochromator to 560 nm and the emission monochromator to 630 nm.
8 Adjust the slits on the emission monochromator.

Fluoromax-3 v. 2.0 (18 Feb 2002) Producing Correction Factors
9-12
Note: Obtain a signal intensity of no greater than 1× 10⁶ cps.
The slit width discovered in this step will be used to run the scan.
9 With the Real Time Display still running, open Run Experiment.
10 In Run Experiment, choose Collect.
11 Under Collect, choose Experiment. This opens the Emission Acquisition dialog box:
12 Click Exp Type. This opens the Select Experiment Type dialog box:
13 Choose Excitation Acquisition, then OK. This closes the Select Experiment Type window, and then resets the Emission Acquisition dialog box to Excitation Acquisition.

Fluoromax-3 v. 2.0 (18 Feb 2002) Producing Correction Factors
9-13
14 Click Signals.... This opens the Signals dialog box:
15 Enter S/R in the Selected Signal column.
16 Click OK to close the Signals box.
17 Click Slits.... This opens the Slits dialog box:
18 Use the XFER button in the Real Time Display to move the slit widths to Slits. Click OK to close the Slits window.
19 Enter the remaining parameters in the Excitation Acquisition window:

Fluoromax-3 v. 2.0 (18 Feb 2002) Producing Correction Factors
9-14
Note: Doing so replaces the xcorrect file that was shipped with the system.
Note: Be sure the Auto Zero function is on.
20 Click Run to execute the scan.
21 Save the file as xcorrect.
22 If no zeroes are shown, invert the data. In Run Experiment, use the Arithmetic menu to divide the spectrum into 1.
23 Normalize the data.
Start the scan at 240 nm. End the scan at 600 nm.
Increment by 5 nm after each data point.
Set the Inte-gration Time to 5 s.
Perform one scan.

Fluoromax-3 v. 2.0 (18 Feb 2002) Producing Correction Factors
9-15
Find the minimum data point and divide the file by that value.
24 Save the normalized file as xcorrect. This overwrites the existing excitation correction-factor file.
To acquire corrected data for an experiment, enter the name of this file in the COR-RECTION factor file field in the Data Acquisition Parameters dialog box. The COR-RECTION factor file must be in the same directory as the data to be acquired and cor-rected.

Fluoromax-3 v. 2.0 (18 Feb 2002) Producing Correction Factors
9-16

Fluoromax-3 v. 2.0 (18 Feb 2002) Technical Specifications
10-1
10: Technical Specifications Each FluoroMax®-3 system consists of: • An excitation source • An excitation spectrometer • A sampling module with reference detector • An emission spectrometer • An emission detector. A FluoroMax®-P system adds: • A motorized mirror to change between light sources • A pulsed xenon lamp • A phosphorimeter-control module Each system is controlled by an IBM-PC-compatible computer, and may include a printer for hard-copy documentation.
Important The FluoroMax®-3 spectrofluorometer system is designed to comply with the require-ments of the Low Voltage Directive 73/23/EEC and the EMC Directive 89/336/EEC and, as of 1 January 1997, carries the CE marking accordingly. The system was tested using standard (authorized by Jobin Yvon Inc.) components, cables, etc. The details and specifications for each component of the FluoroMax®-3 and Fluoro-Max®-P series of spectrometers follow.

Fluoromax-3 v. 2.0 (18 Feb 2002) Technical Specifications
10-2
Spectrofluorometer system FluoroMax®-3 and FluoroMax®-P
The FluoroMax®-3 and FluoroMax®-P spectrofluorometers consist of components con-trolled by the specialized software. The basic (standard) FluoroMax®-3 and Fluoro-Max®-P spectrofluorometer systems contain of the following components:
Excitation Source 150-W xenon, continuous output, ozone-free lamp
Optics All-reflective, for focusing at all wavelengths and precise imag-ing for microsamples.
Dispersion 4.25 nm mm–1
Spectrometers Single-grating excitation and emission spectrometers (standard). Spectrometers are f/3.5 Czerny-Turner design with classically-ruled gratings and all-reflective optics, using 1200-grooves/mm gratings:
Resolution 0.3 nm Maximum scan speed 200 nm s–1 Accuracy ±0.5 nm Step Size 0.0625–100 nm
Range 0–950 nm (physical) Gratings Excitation 330-nm blaze (220–600 nm optical range) Emission 500-nm blaze (290–850 nm optical range)
Sample Module The sample module also has a removable gap-bed assembly for sampling accessory replacement.
Detectors • Calibrated photodiode for excitation reference correction from 200–980 nm.
• Emission detector is an R928P for high sensitivity in photon-counting mode (180–850 nm). High voltage = 950 V, linear-ity to 2 × 10⁶ counts s–1, < 1000 dark counts s–1.
Sensitivity Double-distilled, de-ionized, ICP-grade water-Raman scan 2500:1 S/N at 397 nm, 5-nm bandpass, 1-s integration time, background noise first standard deviation at 450 nm. 300 000 counts s–1 using these conditions.
Excitation shutter Computer-controlled
Integration time 0.001–160 s
Slit width 0–30 nm bandpass, continuously adjustable via host computer
Dimensions (in-strument)
32.5" wide × 10.5" high × 19" long 82.6 cm wide × 26.7 cm high × 48.3 cm long

Fluoromax-3 v. 2.0 (18 Feb 2002) Technical Specifications
10-3
Dimensions (sample com-partment only)
5.5" wide × 7" high × 7" long 14.0 cm wide × 17.8 cm high × 17.8 cm long
Weight 75 lbs (34 kg)
Ambient tem-perature range
15–30°C (59–86°F)
Maximum rela-tive humidity
75%
Power 5 A, 120 V, 60 Hz; or 2.5 A, 240 V, 50 Hz single-phase AC
Phosphorimeter (FluoroMax®-P only) The following components and specifications also apply to the FluoroMax®-P.
Source UV xenon flash tube Flash rate 0.05–25 Hz Flash duration 3 µs at full-width half-maximum. Low-intensity tail extends > 30
µs. Delay after flash 50 µs to 10 s, in increments of 1 µs. Flashes per data point
1–999
Sample window 10 µs to 10 s, in increments of 1 µs.

Fluoromax-3 v. 2.0 (18 Feb 2002) Technical Specifications
10-4
Note: Additional COM ports may be required to control accessories such as the MicroMax, temperature bath, etc.
Minimum computer requirements • Pentium III 90 MHz • 64 megabytes memory (more is recommended) • Minimum 4-gigabyte hard drive • SVGA display card and SVGA monitor to match display card • At least one 3½" high-density floppy
drive • CD-ROM drive • 101-key enhanced keyboard • Mouse is strongly recommended • 2 COM ports minimum (1 for
communication, 1 for printer) • Windows™
Software DataMax software for data-acquisition and manipulation through the Windows™ envi-ronment.

Fluoromax-3 v. 2.0 (18 Feb 2002) Bibliography
11-1
11: Bibliography P.M. Bayley and R.E. Dale, Spectroscopy and the Dynamics of Molecular Biological Systems, Academic Press, London, 1985. R. Becker, Theory and Interpretation of Fluorescence and Phosphorescence, Wiley-Interscience, 1969. B. Berlman, Handbook of Fluorescence Spectra in Aromatic Molecules, Vols. I & II, Academic Press, New York, 1965 & 1971. C.R. Cantor and P.R. Schimmel, Biophysical Chemistry, Freeman, New York, 1980. M. Chalfie, Green Fluorescent Protein: Properties, Applications, and Protocols, Wiley-Interscience, New York, 1998. R.F. Chen, et al., Biochemical Fluorescence: Concepts, Vol. I & II, 1964 & 1970.
J.N. Demas, Excited State Lifetime Measurements, Academic Press, New York, 1983. Enrico Gratton, David M. Jameson, and Robert D. Hall, “Multifrequency Phase and Modulation Fluorometry,” Ann. Rev. Biophys. Bioeng. 13, 105–124 (1984). G.G. Guilbault, Ed., Fluorescence—Theory, Instrumentation and Practice, Marcel Dekker, New York, 1976. _______, Practical Fluorescence: Theory, Methods and Techniques, 2nd ed., Marcel Dekker, 1990. _______, “Molecular Fluorescence Spectroscopy,” Anal. Chem. 8, 71–205 (1977). D.M. Hercules, Ed., Fluorescence and Phosphorescence Analysis, Wiley-Interscience, New York, 1965. J. Ingle and S. Courch, Spectrochemical Analysis, Prentice-Hall, Englewood Cliffs, NJ, 1988. F.H. Johnson, The Luminescence of Biological Systems, Amer. Assoc. Adv. Sci., Washington, D.C., 1955. S.U. Koney, Fluorescence and Phosphorescence of Proteins and Nucleic Acids, Plenum Press, New York, 1967. M.A. Konstantinova-Schlezinger, Ed. Fluorometric Analysis, Davis Publishing Co., New York, 1965.

Fluoromax-3 v. 2.0 (18 Feb 2002) Bibliography
11-2
Joseph R. Lakowicz, Principles of Fluorescence Spectroscopy, 2nd ed., Plenum Press, New York, 1999. _______, Ed., Topics in Fluorescence Spectroscopy, Vols. 1–5, Plenum Press, New York, 1991–1998. _______, Badri P. Melinal, Enrico Gratton, “Recent Developments in Frequency-Domain Fluorometry,” Anal. Instr., 14 (314), 193–223 (1985). _______, S. Soper, and R. Thompson, Advances in Fluorescence Sensing Technology IV, SPIE Proc. Series, Vol. 3602 (1999). W.T. Mason, Ed., Fluorescent and Luminescent Probes for Biological Activity: A Practical Guide to Technology for Quantitative Real-Time Analysis, 2nd ed., Academic Press–Harcourt Brace & Co., 1999. W.H. Melhuish and M. Zander, “Nomenclature, Symbols, Units and Their Usage in Spectrochemical Analysis VI: Molecular Luminescence Spectroscopy,” Pure App. Chem., 53, 1953 (1981). J.N. Miller, Ed., Standardization & Fluorescence Spectrometry: Techniques in Visible and Ultraviolet Spectrometry, Vol. 2, Chapman and Hall, 1981. W.G. Richards and P.R. Scott, Structure and Spectra of Molecules, John Wiley & Sons, 1985. A. Schillen, et al., Luminescence of Organic Substances, Hellwege Verlag, Berlin, 1967. S. Schulman, Ed., Molecular Luminescence Spectroscopy: Methods and Applications, Vols. 1–3, Wiley–Interscience, New York, 1985–1993. A. Sharma and S. Schulman, Introduction to Fluorescence Spectroscopy, Wiley Interscience, New York, 1999. D. Skoog, Principles of Instrumental Analysis, 5th ed., Saunders College/Holt, New York, 1998. N.J. Turro, Modern Molecular Photochemistry, Benjamin/Cummings, New York, 1978. K. Van Dyke, Bioluminescence and Chemiluminescence: Instruments and Applications, Vol. 1, CRC Press, Boca Raton, FL, 1985. T. Vo-Dinh, Room Temperature Phosphorimetry for Chemical Analysis, John Wiley & Sons, 1984. I.M. Warner and L.B. McGowan, Ed., Advances in Multidimensional Luminescence, Jai Press, Greenwich, CT, 1991.

Fluoromax-3 v. 2.0 (18 Feb 2002) Bibliography
11-3
E.L. Wehry, Ed., Modern Fluorescence Spectroscopy, Vol. 1–4, Plenum Press, New York, 1981. C.E. White and R.J. Argauer, Fluorescence Analysis: A Practical Approach, Marcel Dekker, 1970. J.D. Winefordner, et al., Luminescence Spectrometry in Analytical Chemistry, Wiley-Interscience, New York, 1972. In addition, the following journals may prove useful: Analytical Chemistry Biophysics and Biochemistry Fluorescence

Fluoromax-3 v. 2.0 (18 Feb 2002) Bibliography
11-4

Fluoromax-3 v. 2.0 (19 Feb 2002) Glossary
12-1
12: Glossary Absorption The electronic transition from the ground state to the excited singlet
state, by absorption of a photon of a particular energy. This process typically occurs in ~10–15 s.
Absorbance The extent of light absorption by a substance, –log T, where T is the transmittance of the sample. Absorbance is also synonymous with optical density, OD. Absorbance is defined as
A = εcl = OD = –log T
where ε is the extinction coefficient (M–1 cm–1), C is the sample con-centration (M), and l is the path length (cm).
Acquisition modes (R, S channels)
The logical input channels used on the spectrofluorometer to input collected signal from the detectors present on the system. The detec-tors are assigned as: the reference detector connected to channel R, and the emission connected to channel S. These logical channel names are used in the collection of data in most DataMax applica-tions. The user may create algebraic expressions on these input chan-nels when defining experiments in DataMax (e.g., S/R).
Anisotropy (<r>) A measurement of the fluorescence polarization of a samples, defined as the linear-polarizer’s component’s intensity divided by the total light intensity. The measurement of anisotropy can provide insight into molecular size and shape, as well as the environment that sur-rounds it.
Autopolarizers An automated device to hold and precisely rotate a set of polarizers to acquire anisotropy (or polarization) measurements. FluoroMax®-3 systems with autopolarizers contain two automated polarizer mounts, one for the excitation polarizer and one for the emission polarizer. Both are located between the sample compartment and their respec-tive monochromators. Their calibration is maintained by optical sen-sors that are offset in the software. Autopolarizers on the Fluoro-Max®-3 may be inserted into and out of the light path in DataMax, in the Visual Instrument Setup software application. Automated re-alignment of the polarizers also may be performed in Visual Instru-ment Setup.
Bandpass The range of wavelengths of light passing through the excitation and emission spectrometers, usually expressed in nanometers (nm). This value is dependent on the size of all slits in the monochromator, as well as the dispersion of the monochromator. For spectrofluorome-ters, both slits on the monochromator should be set equal to properly set the bandpass, if not done automatically through the software. When adjusting the bandpass for samples, the wider the bandpass, the higher the signal intensity, with a trade-off in lower resolution.

Fluoromax-3 v. 2.0 (19 Feb 2002) Glossary
12-2
Bandpass filter An optical element, which selectively transmits a range of wave-lengths, while absorbing light of higher and lower wavelengths.
Bioluminescence Emission of light originating from a chemical reaction in a living or-ganism.
Blank subtraction The removal of the spectral response of the solvent (and sample con-tainer) from the sample’s spectral response. To accomplish this, an identical scan is run on the solvent just before running the actual sample. Proper use of a blank can remove solvent luminscence arti-facts, scattering events, and any artifacts from the sample cuvette or container. In the experiment portion of the software, click on the Blank button to recall a previously acquired blank spectrum.
Blaze wavelength (of grat-ings)
The wavelength at which a grating is optimized for peak efficiency. As a rough guide, gratings are usable from 2/3 of the blaze wave-length to twice the blaze wavelength. The excitation and emission gratings for the FluoroMax®-3 are blazed for efficiency in the UV and visible.
Chemiluminescence Emission of light originating from a chemical reaction. Concentration determina-
tion A function of the Constant Wavelength Analysis software applica-tion, that calculates an unknown sample’s concentration. The user runs known samples and enters the concentration in order to calibrate the routine. Then an assay may be completed with the measurements based on concentration.
Constant wavelength analysis (CWA)
The DataMax software application designed for performing single-point measurements at discrete wavelength pairs. The data are ac-quired as single points at a user-defined set of excitation/emission wavelength pairs for a user-defined number of samples. These data are displayed in either spreadsheet format, or in a plot. This applica-tion is for MicroMax or FluoroMax®-3 users who routinely perform assays on a large number of samples. Additional options such as Variable Time Kinetics make this application even more flexible.
Corrected emission scan An emission scan that has been corrected for the wavelength re-sponse of the emission monochromator and the signal detector. To obtain a corrected emission scan, an emission spectrum is multiplied by the appropriate emission correction factor file. A set of emission correction factors is supplied with the instrument and stored under the name MCORRECT.SPC on the software disks.
Corrected excitation scan An excitation scan corrected for the wavelength-characteristics of the xenon lamp, the aging of the xenon lamp, and the gratings in the ex-citation spectrometer. To obtain a first-order correction of the excita-tion scan, the emission detector signal is ratioed to the reference sig-nal (i.e., S/R). This provides correction for the lamp and excitation-monochromator spectral response, which is ~95% of the required correction. To obtain a completely correct scan, the excitation scan acquired in the S/R acquisition mode is multiplied by excitation cor-

Fluoromax-3 v. 2.0 (19 Feb 2002) Glossary
12-3
rection factors. A set of excitation correction factors (XCORRECT.SPC) is included on the software disks.
Correction factors A spectral set of multiplicative factors used to compensate for the instrumental wavelength-response from detectors and optics. These correction factors are specific to a particular optical configuration for the instrument, and must be run for each detector in the spectro-fluorometer system. Excitation and emission correction factors are included by default with each new spectrofluorometer. Their default filenames and XCORRECT.SPC and MCORRECT.SPC, respectively.
CTI card This acquisition and control card, located in the rear of the Fluoro-Max®-3, is the counter-timer-integrator board. It handles all spectro-fluorometer control, timing, and data acquisition for measurements on the system. The boards carry by default two acquisition channels, and are linked to all monochromator and accessory control boards on the underside of the instrument. The CTI card fits into an ISA slot in the motherboard on the rear of the FluoroMax®-3.
Current input module (DM303)
The current input module collects the current signal from the refer-ence photodiode, digitizes the data, and sends it to the CTI card for data-processing. This module is located directly behind the reference photodiode. It has linear response from 0–10 µA.
Dark counts Inherent background signal measured in counts s–1 (cps) observed on the photomultiplier tube when high voltage is applied. Typically, the R928P photomultiplier tube used for the FluoroMax®-3 system has dark counts of < 1000 cps.
Dark offset The software correction used to subtract dark counts (or dark signal) on a detector from a spectral acquisition. This option usually appears as a checkbox in the DataMax software. Use a corrected signal chan-nel for the acquisition (e.g., S) in order to run the dark offset correc-tion.
Datafile A file used to store spectral data, constant-wavelength analysis data, or other recorded data. In DataMax, the most common datafile is the spectral file (.SPC). This is the file-type that contains spectra ac-quired from a scan run from the Run Experiment menu (e.g., emis-sion scan, time base scan, multigroup, etc.). Datafiles contain all of the information regarding the instrument setup for a scan as well as the spectra (see File Information in the DataMax Software Manual). Multifiles are three-dimensional datafiles that contain an array of spectral files.
Dispersion The range of wavelengths of light across the field of view of the en-trance and exit apertures. Dispersion depends on the focal length of the monochromator, the groove density of the optics, and the f-number (speed) of the monochromator. Dispersion is usually ex-pressed in nanometers of spectral coverage per millimeters of slit width (nm/mm).

Fluoromax-3 v. 2.0 (19 Feb 2002) Glossary
12-4
Emission monochromator The monochromator located after the sample compartment used to isolate discrete wavelength components of the sample’s fluorescence, and may be used to scan the emission from a sample. The emission monochromator on the FluoroMax®-3 is an 0.18-m single mono-chromator with a Czerny-Turner design: the monochromator includes a collimating mirror, the reflection grating (blazed at 500 nm), and a focusing mirror, with slit apertures at the entrance and exit. The emission-photomultiplier detector is connected to the exit of this monchromator to measure the fluorescence emission.
Emission scan An acquisition that shows the spectral distribution of light emitted by a sample. During an emission scan, the excitation spectrometer re-mains at a fixed wavelength while the emission spectrometer scans a user-selected region.
Energy transfer The inter-molecular or intra-molecular transfer of the excited energy from a donor to an acceptor. The transfer occurs without the appear-ance of a photon and is primarily a result of dipole-dipole interac-tions between the donor and acceptor.
Excitation/emission ma-trix (EEM)
A three-dimensional plot showing the total luminescence from a sample across all useful wavelengths. Total luminescence spectros-copy is devoted to measurements of these EEMs for various materi-als. See also: Multifile, Total Luminescence Spectroscopy
Excitation monochromator The monochromator, located between the xenon lamp and the sample compartment, used to isolate discrete wavelength components of the excitation beam. This beam is directed to the sample, during which the excitation monochromator may be used to scan the excitation spectrum from a sample. The excitation monochromator on the FluoroMax®-3 is an 0.18-m single monochromator with Czerny-Turner design. This means that the monochromator includes a colli-mating mirror, the reflection grating (blazed at 330 nm), and a focus-ing mirror, with slit apertures at the entrance and exit. An excitation shutter is located directly after the excitation exit slit to protect the sample from photobleaching. The reference detector looks at a frac-tion of the light exiting the excitation monochromator to correct for the lamp response, if desired.
Excitation scan A scan that reveals the spectral distribution of light absorbed by the sample. The scan is collected by rotating the excitation grating while holding the emission monochromator fixed. For non-ratiometric ac-quisitions, acquire the scan using S/R to correct for the spectral out-put of the lamp.
Excited state (S1) The energy level to which an electron in the ground level of a mole-cule is raised after the absorption of a photon of a particular wave-length. Subsequently, fluorescence occurs, if the molecule returns to the ground state via a radiative transfer from the S1 state to the ground state.
Fluoromax-3 v. 2.0 (19 Feb 2002) Glossary
12-5
Experiment file A file that contains specific information on the experimental setup for an acquisition defined in Run Experiment. This file is saved with a default *.EXP extension. In addition to basic scan parameters, this file saves system defaults (such as slit units), and some accessory set-tings for the acquisition. Each acquisition type in the Run Experiment menu has its own default experiment file (e.g., DFLT0.EXP is the default emission-scan definition). These are the default experiments that appear in the Experiment menu on startup. Use experiment files to archive scan settings for acquisitions that are performed routinely.
Extrinsic fluorescence Inherent fluorescence of fluorescent probes added to a system to study non-fluorescent molecules. These probes have gained accep-tance in a variety of applications.
Filter An optical element that is used to select certain wavelengths of light. Types of filters include high-pass, low-pass, bandpass, and neutral-density.
Flash lamp A source that provides pulsed light to excite a sample for phospho-rescence or fluorescence measurements. The repetition rates and time response of the source determine the useful range of the source for these measurements. The lamps can be used in either “free running” or “gated” modes depending on the support electronics.
Fluorescence The emission of light during the transition of electrons from the ex-cited singlet state to the ground state from molecules originally ex-cited by the absorption of light. Fluorescence typically occurs within ~10–9 seconds.
Fluorescence lifetime (τ) The average length of time that a molecule remains in the excited state before returning to the ground state.
Fluorophore (fluorescent probe)
A molecule or compound that has a known fluorescence response. These probes have various sensitive areas depending on the peak ex-citation and emission wavelengths and their fluorescence lifetimes. Fluorophores are used to provide information on concentration, size, shape, and binding, in a particular medium. Good fluorophores are stable over wide pH and temperature ranges.
Front-face detection A mode of detection in which fluorescence is collected off the front surface of the sample. Front-face detection is usually selected for tur-bid samples in solution (e.g., blood), samples of high concentration, or solid samples such as powders, thin films, pellets, and cells on a coverslip. Front-face detection collects fluorescence off the sample at a 22.5° angle to minimize reflections and scattering.
Grating An optical element in a monochromator that uses finely-etched verti-cal grooves to disperse incident light into its constituent wavelengths. Reflection gratings (grooves etched on a highly reflective surface) are used in the FluoroMax®-3. Gratings are scanned by rotating their optical centers about the optical axis of the instrument, with the inci-dent angle of the entrance beam determining the wavelength of light
Fluoromax-3 v. 2.0 (19 Feb 2002) Glossary
12-6
directed to the exit aperture. Gratings come in a variety of formats and are commonly made by physically ruling (scribing) the grating, or holographically etching the grating grooves.
Ground state (S0) The lowest energy level in a molecule. For fluorescence to occur, a molecule absorbs a photon of light, thereby exciting it to the S1 level. A fluorescence emission occurs during a transition from an excited state S1 to the ground state S0.
High-pass filter Optical component that passes light of a higher wavelength. Increment The spacing between adjacent measurement points in an acquisition.
Typically, increments take the form of wavelength (nm) or time (s or ms).
Inner-filter effect The scattering of the excitation or emission beam from a concen-trated sample by the individual molecules in the sample. This reduces the apparent signal intensity from the sample creating an artifact in the data. For this reason, we recommend using concentrations of <0.05 OD in a 1-cm-pathlength cell. Samples measured in higher concentrations should be measured in a reduced-pathlength cell, or in front-face mode.
Integration time The amount of time that each data point is collected from the detec-tor(s), specified in either seconds or milliseconds. Longer integration times can help improve the signal-to-noise ratio for a measurement, while shorter integration times reduce the amount of time required for a scan.
Internal conversion Electronic transitions within an excited molecule that do not result in emission. Also called a “non-radiative transition”, this usually in-volves changes in vibrational levels.
Intersystem crossing The electronic transition from the excited singlet state to the excited triplet state before returning to the ground state. This transition in-volves a change of spin that is quantum-mechanically forbidden, giv-ing a much longer timescale than fluorescence. This transition causes phosphorescence on the timescale of microseconds to seconds.
Intrinsic fluorescence The natural fluorescent properties of molecules. Jabłonski (energy) dia-
gram A diagram that illustrates various energy levels and electronic transi-tions available in a particular molecule. Possible paths for fluores-cence, phosphorescence, and non-radiative transfers are shown on this diagram, along with the various vibrational sub-levels available around each energy level.
Laser A monochromatic light source that provides high excitation intensity. Linearity (1) Signal response; the desired response from a light detector is a
linear relationship. For example, when detector response is linear, if the light intensity doubles, the detected signal also doubles. Most detectors exhibit non-linear behavior near saturation. On the FluoroMax®-3, the emission photomultiplier tube is linear up to

Fluoromax-3 v. 2.0 (19 Feb 2002) Glossary
12-7
2–4 million counts per second. Above this, pulse pileup occurs on the photon-counting module (when multiple photons are counted as one). This results in a non-linear response, and the detector ef-ficiency drops.
(2) Spectral positioning accuracy or tracking error of a spectrometer drive mechanism. See Spectral Calibration.
Low-pass filter Optical component that passes light of a lower wavelength. Luminescence The emission of light from matter excited from a variety of proc-
esses, resulting in an electronic transition within the molecule to a lower energy state. See also: Bioluminescence, Chemiluminesence, Fluorescence.
MCD shutter Multi-channel device shutter. The Uniblitz shutter is used for its rapid cycle time.
Mercury lamp A light source that offers discrete narrow lines as opposed to a broadband radiation (e.g., xenon). Mercury lamps often are used to verify the accuracy and resolution of a spectrometer or spectrograph.
Mirror-image rule A sample that absorbs light for certain energy-level transitions usu-ally exhibits an emission profile that appears to be the mirror image of the absorption spectrum. The reason is that the same energy-level transitions are used for excitation and emission, with the transitions returning to the ground state as the complement to the those in the excited state.
Molar extinction coeffi-cient (ε)
The absorptivity of a particular substance, in M–1 cm–1.
Multifile The three-dimensional acquisition datafiles collected by the software using matrix scans or temperature scans, stored as an array of data-files. A multifile is still stored with an .SPC extension. Multifiles may be used in their entirety in DataMax as 3D files, or they may be split up into individual two-dimensional spectra using multifile utili-ties.
Multigroup scan This experiment type allows a time-based scan to be acquired across more than one excitation/emission pair. Up to 16 different wave-length pairs may be entered for a multigroup scan. The spectro-fluorometer will cycle through each pair, integrating for the specified time, before moving on to the next point. Use the multigroup scan for measuring ratiometric probes (such as Fura-2 or BCECF).
Neutral-density filter An optical element that absorbs a significant fraction of the incident light. These filters usually are characterized by their optical density, on a logarithmic scale. For example, a filter with OD = 1 transmits 10% of the incident light. Ideally, these filters absorb all wavelengths equally. See also Absorbance.
Optical-density effects (Inner-filter effect)
Fluorescence intensities are proportional to the concentration over a limited range of optical densities. High optical densities can distort

Fluoromax-3 v. 2.0 (19 Feb 2002) Glossary
12-8
(Inner-filter effect) the emission spectra along with apparent intensities. For fluorescence measurements in a 1-cm-pathlength cell, samples should have an OD of 0.05 or less. See also: Inner-filter effect.
Phosphorescence The emission of light or other electromagnetic radiation during the transition of electrons from the triplet state to the ground state. Phos-phorescence is generally red-shifted relative to fluorescence and oc-curs within ~10–6 to ~1 second. To enhance phosphorescence, sam-ples often are frozen at liquid-nitrogen temperature (77 K).
Photobleaching The reduction in fluorescence from a photosensitive sample overly exposed to excitation light. Not all samples photobleach, but if so, take care to keep the sample out of room light, and to use the excita-tion shutter and its photobleach modes on the spectrofluorometer to protect the sample from excessive exposure.
Photoelectron An electron released through the interaction of a photon with the ac-tive element of a detector. The photoelectron may be released either from a junction to the conduction band of a solid-state detector, or from the photocathode to the vacuum in a PMT. A photoelectron is indistinguishable from other electrons in any electrical circuit.
Photon-counting detection A method of detection used primarily with photomultiplier tubes, in which discrete current pulses from the tube are integrated and “counted up”. With this method, noise inherent to the detector can be minimized, resulting in much more sensitive detection than used in traditional current- or voltage-detection modules. A limit to photon-counting is when pulse pileup occurs, that is, when two counts occur too fast for the module to count them individually. This creates non-linearity in the detector at high signal-levels.
Polarization (P) A measurement of the fluorescence polarization of a sample defined as the linear polarizer’s component’s intensity divided by the natural light intensity. The measurement of polarization provides insight into molecular size, shape, and the environment surrounding the mole-cule. Another unit, called millipolarization (mP), is used to monitor small changes in polarization. P = mP × 1000.
Quantum yield (Fluores-cence quantum yield)
The efficiency of the absorption of a photon to be emitted (fluo-resced). Quantum yields typically are expressed as percents. The fluorescence quantum yield is the percentage of photons absorbed that actually leads to fluorescence. This number is reduced by scatter-ing, quenching, internal conversion, and non-radiative effects, along with several other specialized processes. Measurements of quantum yields usually require the comparison of a sample with a known fluorophore such as Rhodamine-B or Ru(BPY)3.
Quenching Reduction in the fluorescence intensity of a sample by a variety of chemical or environmental influences. Quenching may be static, dy-namic, or collisional in nature.
Raman scattering Scattering caused by vibrational and rotational transitions. Raman b d ll d hift d l ti t th i id t l t

Fluoromax-3 v. 2.0 (19 Feb 2002) Glossary
12-9
bands generally appear red-shifted relative to the incident electro-magnetic radiation. The primary characteristic of Raman scatter is that the difference in energy between the Raman peak and the inci-dent radiation is constant in energy units (cm–1).
Rayleigh scattering Light scattering from particles whose dimensions are much smaller than the wavelength of incident light. Rayleigh-scattered light is of the same energy as the incident light. The scattered radiation’s inten-sity is inversely proportional to the 4th power of the wavelength of incident radiation.
Real Time Display The DataMax software application that gives the user full control of the system in real-time, in order to optimize the system setup for a particular measurement. Use Real Time Display to find the optimal slit widths for sample measurements, or to check that the excitation beam is striking the sample properly.
Reference detector The detector used to monitor the output of the xenon lamp. A silicon photodiode with enhanced-UV response is used for the FluoroMax®-3, and is connected to input channel R. Use S/R to correct for the xenon-lamp response during an excitation scan.
Resolution The ability of a spectrometer or spectrograph to separate two closely spaced peaks. Resolution can be improved by decreasing the number of pixels binned together or the slit widths in the instrument.
Right-angle detection Collection of fluorescence at 90° to the incident radiation. Right-angle detection is typically selected for dilute and clear solutions in order to minimize the scatter component in the detected emission.
Sample changer (auto-mated)
An automated accessory that automatically positions up to four cu-vette samples held in the sample compartment. Use this accessory to run up to four samples at one time for a small assay, or to run blanks with the samples simultaneously. Automated sample changers are thermostatted and possess magnetic stirrers.
Saturation The effect of having too much signal incident on a particular detec-tor. Saturated detectors give an erroneous result and no longer show any response for small changes in signal. In some cases, saturation can damage a detector’s performance, so avoid saturation whenever possible. The R928P photomultiplier tube used on the FluoroMax®-3 saturates at 1 × 10⁷ cps.
Signal channel See: Acquisition modes. Signal photomultiplier Detector used to measure excitation and fluorescence from the sam-
ple, operated in photon-counting mode to provide the highest sensi-tivity. Different detectors can be used to optimize different wave-length regions.
Signal-to-noise ratio (S/N) The measurement of the signal observed divided by the noise com-ponent seen in that signal. Generally, the better the S/N is, the better the measurement is. This is accomplished by using photon-counting

Fluoromax-3 v. 2.0 (19 Feb 2002) Glossary
12-10
detection with the proper high-voltage bias for improved sensitivity during fluorescence measurements. The user then optimizes the sam-ple signal to the higher area of the linear range for the detector, typi-cally between 100 000 and 2 000 000 cps. Next, dark offsets or blank subtraction may be used to improve the S/N. Finally, increasing the integration time or repeating the same scan several times can improve the signal to noise. For specifications, signal-to-noise may be repre-sented as signal to peak-to-peak noise, or signal-to-noise at first stan-dard deviation (FSD).
Singlet state The spin-paired ground or excited state. The process of absorption generally produces the first excited singlet state, which takes time to fluoresce, and may undergo intersystem crossing to form a triplet state.
Spectral calibration The accuracy of a monochromator with respect to its wavelength alignment. This is a measure of the monochromator being at the cor-rect wavelength when it is set there. Monochromators are tradition-ally calibrated using line-spectra sources, such as mercury lamps. Spectrofluorometers may be calibrated by performing two scans, one of the source, and one of a standard (such as water) to calibrate all of the monochromators. For Spex® spectrofluorometers, the xenon-lamp scan is performed on the excitation with the 467.1-nm peak assigned as such in the software. The water Raman band is scanned with 350-nm excitation, and the 397-nm peak is assigned as such in the soft-ware for the emission monochromators.
Spectral correction The removal of the wavelength sensitivity of detectors, optics, sources, and backgrounds from the spectrum taken on a sample. When spectral correction has been properly performed, the true theo-retical spectra from a sample should be all the remains. Spectral cor-rection is accomplished with a variety of options on Spex® spectro-fluorometers. Excitation and emission correction factor files are pro-vided to remove the wavelength sensitivity of detectors and their op-tics. The reference detector is present to remove the lamp and excita-tion optics response. Blank subtraction and dark offset are used to remove background levels and responses.
Spectral response Most detectors have a higher sensitivity to some wavelengths than to others. The spectral response of a detector is often expressed graphi-cally in a plot of responsivity versus wavelength.
Spectrofluorometer An analytical instrument used to measure the fluorescence properties of a molecule or substance. The device consists of at least two mono-chromators, a source, sample compartment and detection electronics. The instruments may be scanned on the excitation, emission or both to provide insight on the characteristics of the sample being studied. Newer spectrofluorometers provide many more automated options, including polarization, temperature, titer plates, pressure, and many more. Today, these instruments are computer-controlled, allowing

Fluoromax-3 v. 2.0 (19 Feb 2002) Glossary
12-11
easy control of assays and complex experiments. Stokes shift The energy difference between the absorption peak of lowest energy
and the fluorescence peak of maximum energy. Synchronous scan Scan type characterizing the overlap between the excitation and
emission. The excitation and emission spectrometers are scanned at the same time, with a constant offset specified in either nanometers (wavelength units) or in cm–1 (energy units).
Technical spectrum A spectrum acquired on research instrumentation with instrumental bias remaining in the measurement. This spectrum must undergo proper spectral correction in order to match the theoretical spectrum. Spex® spectrofluorometers offer various methods for such correction, including spectral correction, dark offset, blank subtraction, and oth-ers.
Temperature scan A DataMax 3D scan-defintion that consists of a particular scan made across a user-defined temperature range. This scan may be used to monitor a sample’s temperature response, or, more specifically, to perform a melting curve for a sample. Temperature scans require an automated bath compatible with DataMax to be attached to the spec-trofluorometer system along with a thermostattable sample mount.
Throughput The amount of light that passes through the spectrofluorometer for a particular measurement. The throughput usually is measured as the counts per second measured on the water Raman band at 350-nm ex-citation with 5-nm bandpass. As bandpass increases, so does the throughput. Like bandpass, throughput has an inverse relationship with resolution. When the throughput is increased, the resolution de-creases.
Time-based scan Scan type in which the sample signal is monitored as a function of time, while both the excitation and the emission spectrometers re-main at fixed wavelengths. Time-based data are used to monitor en-zyme kinetics, dual-wavelength measurements, and determine reac-tion-rate constants.
Total luminescence spec-troscopy (TLS)
Spectroscopy devoted to monitoring changes to the entire excita-tion/emission matrix of luminescence on a sample. This discipline is best applied to fast kinetics measurements of samples during reac-tions, temperature curves, or changes in other parameters.
Transmission Light that passes through a sample without being absorbed, scattered, or reflected. Transmission is usually measured as a percentage of the incident light at a certain wavelength.
Triplet state (T1) The spin-paired ground or excited state formed from the excited singlet state, in which electrons are unpaired. The triplet state gives rise to phosphorescence.
Tyndall scattering Scatter that occurs from small particles in colloidal suspensions.

Fluoromax-3 v. 2.0 (19 Feb 2002) Glossary
12-12
Variable time kinetics A special measurement menu in the Constant Wavelength Analysis software application. The user defines measurements that occur at specific times, for specific durations, and with different integration times. Those measuring assays can do the actual measurements at the desired times. See the DataMax software manual for more informa-tion.
Vibrational states Sublevels within an electronic energy level that are the result of vari-ous types of motion of the atoms in a molecule. Transition between these states at a particular energy level does not involve a large change in energy, and typically is a non-radiative transition. In larger electronic transitions such as fluorescence, a molecule drops from the lowest vibrational level of the excited state to the highest vibrational level of the ground state. This emission is termed the Stokes shift be-tween the S1 and ground states.
Xenon lamp A high-intensity lamp that produces a continuum of light from the ultraviolet to the near-infrared for sample excitation. A xenon lamp is classified as a broadband source.
Xenon-lamp scan A profile of the lamp output as a function of wavelength. The lamp scan is acquired using the reference detector while scanning the exci-tation spectrometer. The maximum xenon-lamp peak at 467 nm can be used to determine proper calibration of the excitation spectrome-ter.

Fluoromax-3 v. 2.0 (19 Feb 2002) DataMax Initialization Files
13-1
Warning: Do not alter the above files unless directed to do so by a Jo-bin Yvon Inc. representative.
Warning: The above files can be corrupted if the host computer is not properly shut down, or a Windows™ error occurs on the host com-puter. If this has occurred, and the system still shows errors during bootup, contact Spex® Fluorescence Service for instructions on how to replace these files.
13: DataMax Initialization Files Introduction
This chapter provides reference information on the .INI file structure used for instru-ment configuration. If any corruption of these files is suspected or if any difficulties are experienced in using the software, consult with Spex® Fluorescence Service. All initialization files defining the hardware are contained in the DATAMAX\ISA_INI directory. The files covered in this section are: SAQ.INI defines host computer communication to the FluoroMax®-3 SPEX.INI defines paths for DataMax on the host computer ALLOBJCT.INI defines the filenames of all of the .INI files used MONOx.INI files defining the monochromators SCx.INI files defining various sample-compartment accessory configu-
rations ACQx.INI files defining the acquisition channels and detectors used Layout (.LAY) files defining spectrofluorometer configurations used In addition, there are three important files that are created to define the current system configuration in use: DATAMAX\ISASCAN.SET defines the software settings for DataMax during the
last session DATAMAX\ISASCAN.VW defines the view used during the last DataMax ses-
sion ISA_INI\DFLT.SET defines the hardware configuration used during the
last DataMax session

Fluoromax-3 v. 2.0 (19 Feb 2002) DataMax Initialization Files
13-2
Finally, two files specific to the FluoroMax®-P are given. These provide the instrumen-tal configuration, detectors, and parameters: PHOS.LAY provides the instrumental layout, including phosphorimeter compo-
nents necessary PHOS.INI defines acquisition channels and parameters for the instrument

Fluoromax-3 v. 2.0 (19 Feb 2002) DataMax Initialization Files
13-3
SAQ.INI SAQ.INI specifies the serial communications port used for communication between the host computer and the FluoroMax®-3. An incorrect port setting in this file may be the cause if the host computer does not communicate properly with the instrument. The COM-port setting for this file is specified for this file during the installation of the DataMax software. ; SAQ.ini file which defines the structures and the ; number of ports available ; SERIAL = 1 ; IEEE488 = 2 ; SCSI = 3 [INFO] NAME= SpectrAcq [COMMUNICATION] TYPE=1 CHAN_NUM=1 ; Specifies the controller type ; SPECTRAQ = 502 ; DATASCAN = 501 [CONTROLLER] TYPE=502 ; 2 CTI cards, 2 HV cards and a CCD controller [PORTS] NUM_MOT_CHANNEL_PORTS=8 NUM_ACQ_CHANNEL_PORTS=5 NUM_HV_CHANNELS=4 NUM_CONTROL_CHANNELS=2 NUM_LIGHT_CHANNELS=2 ; Number of ports is max(8,5,3) --> 8 ; mc_ports ==> 1..8 ; acq_ports ==> 1..5 ; hv_ports ==> 1..2 ; ; In api, would create 8 port objects with command channels ; equal to 0..7 ; mc_command_channels 0..7 ; acq_command_channels 0..4 ; hv_commmand_channels 0..1

Fluoromax-3 v. 2.0 (19 Feb 2002) DataMax Initialization Files
13-4
SPEX.INI SPEX.INI contains the path information for the DataMax software applications in-stalled on the host computer. These paths were defined when the DataMax software was installed on the host computer. [general] NAME=DataMax err=C:\Datamax ini=C:\Datamax\ISA_INI bmp=C:\Datamax\ISA_BMP SYSTEM= [rtd] app=C:\Datamax\rtd.exe dir=C:\Datamax [experiment] app=C:\Datamax\isascan.exe dir=C:\Datamax data=C:\Datamax\DATA ccdscr=C:\datamax\data\ [setup] app=C:\Datamax\setup_vs.exe [main] app=C:\Datamax\isamain.exe [spa] app=C:\Datamax\isa_spa.exe [Revision] Ver=2.2

Fluoromax-3 v. 2.0 (19 Feb 2002) DataMax Initialization Files
13-5
ALLOBJCT.INI ALLOBJCT.INI maps all of the necessary configuration (.INI) file labels to the ac-tual filenames stored in the ISA_INI subdirectory of DataMax. For example, note that CONTROLLER1 points to the file SAQ.INI, the file that was described earlier for host-slave communication. [CONTROLLER1] FILE=SAQ.INI [CONTROLLER2] FILE=TCONTROL.INI [CONTROLLER4] FILE=MW.INI [LS1] FILE=LS1.INI [LS2] FILE=LS.INI [MONO1] FILE=MONO1.INI [MONO2] FILE=MONO2.INI [MONO3] FILE= [MONO4] FILE= [SC1] FILE=SC1.INI [SC2] FILE=SC2.INI [SC3] FILE=SC3.INI [SC4] FILE=SC4.INI [SC5] FILE=SC5.INI [SC6]
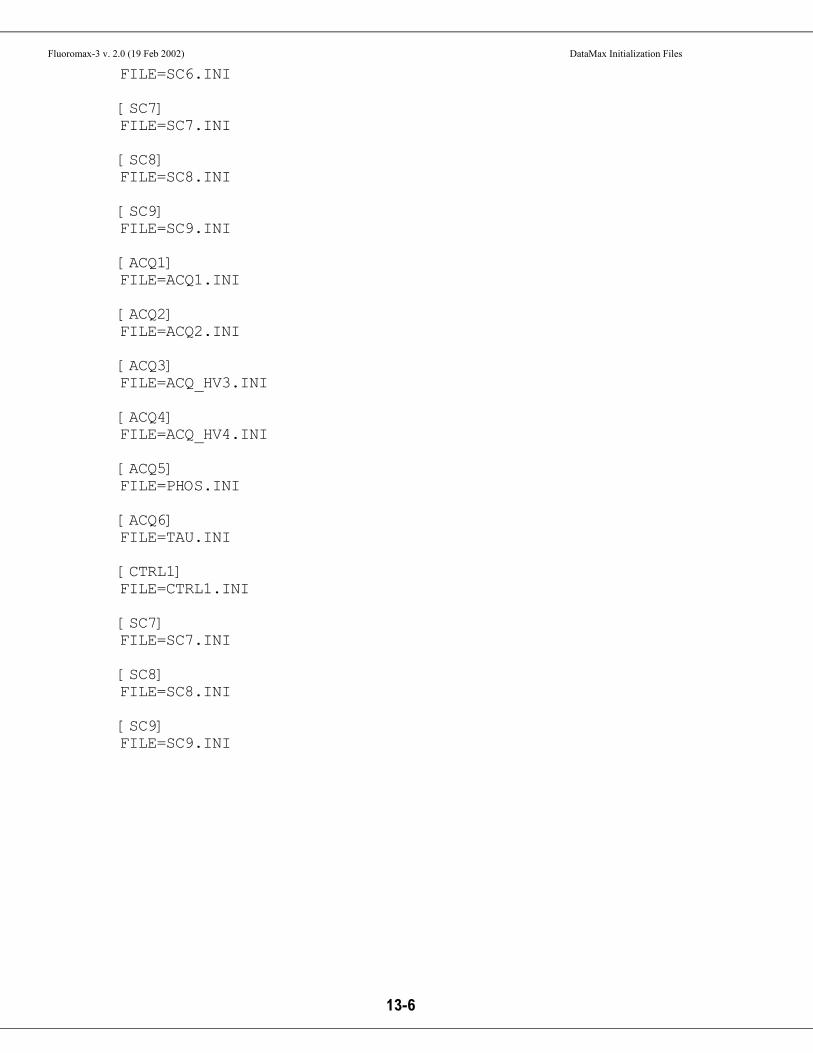
Fluoromax-3 v. 2.0 (19 Feb 2002) DataMax Initialization Files
13-6
FILE=SC6.INI [SC7] FILE=SC7.INI [SC8] FILE=SC8.INI [SC9] FILE=SC9.INI [ACQ1] FILE=ACQ1.INI [ACQ2] FILE=ACQ2.INI [ACQ3] FILE=ACQ_HV3.INI [ACQ4] FILE=ACQ_HV4.INI [ACQ5] FILE=PHOS.INI [ACQ6] FILE=TAU.INI [CTRL1] FILE=CTRL1.INI [SC7] FILE=SC7.INI [SC8] FILE=SC8.INI [SC9] FILE=SC9.INI

Fluoromax-3 v. 2.0 (19 Feb 2002) DataMax Initialization Files
13-7
MONOx.INI (MONO1.INI is shown as an example)
MONOx.INI files define the actual monochromators used for the excitation and emission monochromators. The drive type, slits, dispersion, and calibration offsets are specified in the file, among other entries. ; New 180F mono for Fluoromax-3 [MONO1] MODEL=180F(fluoromax3) TYPE=1 NUM_SHUTTERS=1 SHUTTER1=2,1 NUM_SLITS=2 SLIT1=17,2 SLIT2=17,3 LINEAR_DISPERSION=4.2 BASE_UNITS=1 BASE_GRATING=1200.000000 STEPS_PER_UNIT=16 MIN_STEP_RATE=1500 MAX_STEP_RATE=1500 RAMP_TIME=0 FOCAL_LENGTH=178.0 FOCAL_PLANE_ANGLE=0.000000 INPUT_EBERT_ANGLE=10.45 OUTPUT_EBERT_ANGLE=10.45 BACKLASH_AMOUNT=20 PREFERED_BACKLASH_DIRECTION=0 MIN_LIMIT=0 MAX_LIMIT=1000 BACKLASH_DIRECTION=0 CAL_TYPE=2 AUTO_CAL_OFFSET=-1.7706 [VISUAL] BITMAP1=SEMONO1.BMP BITMAP2=SEMONO2.BMP BITMAP3=SEMONO3.BMP BITMAP4=SEMONO4.BMP WIDTH=124 HEIGHT=136

Fluoromax-3 v. 2.0 (19 Feb 2002) DataMax Initialization Files
13-8
SCx.INI (SC7.INI is shown as an example)
SCx.INI files define configurations of the sample compartment using various auto-mated sample-compartment accessories. Examples of these are autopolarizers (as shown here), sample changers, and filter wheels. Some of these accessories also have calibration offsets included in the file. [SC7] MODEL=Fluoromax Sample Box DESC=Sample Compartment NAME=Polarizers/T-bath POLARIZER1=82,1 POLARIZER2=82,3 NUM_POLARIZERS=2 [VISUAL] BITMAP1=Sample1.BMP BITMAP2=Sample2.BMP BITMAP3=Sample3.BMP BITMAP4=Sample4.BMP WIDTH=120 HEIGHT=96

Fluoromax-3 v. 2.0 (19 Feb 2002) DataMax Initialization Files
13-9
ACQx.INI (ACQ1.INI is shown as an example)
ACQx.INI files define each acquisition channel and detector used on the system. The detector type, acquisition module type, gain levels, and high-voltage bias supply (if in-cluded) are defined in this file. [ACQ1] NAME=S Channel DETECTOR_TYPE=21 MIN_INTEGRATION_TIME=0 MAX_INTEGRATION_TIME=100000 [VISUAL] BITMAP1=PMTS.BMP BITMAP2=PMTS.BMP BITMAP3=PMTS.BMP BITMAP4=PMTS.BMP WIDTH=36 HEIGHT=36 [PMT] MODEL=Hamamatsu PMT DESC=Standard Photon counter DETECTOR_TYPE=21 MIN_INTEGRATION_TIME=0 MAX_INTEGRATION_TIME=100000 MIN_OP_V=0 MAX_OP_V=1200 [AMPLIFIER] MODEL=DM302 TYPE=302 CURRENT_GAIN=0 BASE_UNITS=12 NUM_GAINS=1 SCALE_FACTOR1=1.0000 OFFSET1=0.0000 VALID_UNITS=13,12 [POWER_SUPPLY]
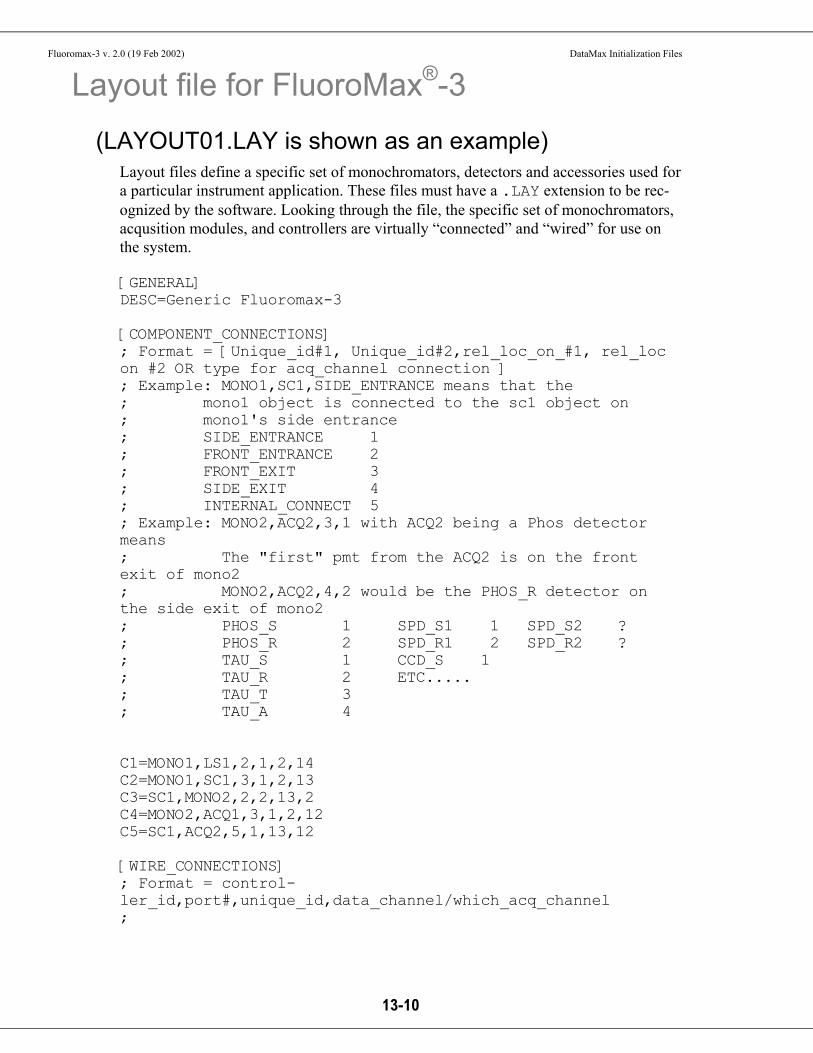
Fluoromax-3 v. 2.0 (19 Feb 2002) DataMax Initialization Files
13-10
Layout file for FluoroMax®-3 (LAYOUT01.LAY is shown as an example)
Layout files define a specific set of monochromators, detectors and accessories used for a particular instrument application. These files must have a .LAY extension to be rec-ognized by the software. Looking through the file, the specific set of monochromators, acqusition modules, and controllers are virtually “connected” and “wired” for use on the system. [GENERAL] DESC=Generic Fluoromax-3 [COMPONENT_CONNECTIONS] ; Format = [Unique_id#1, Unique_id#2,rel_loc_on_#1, rel_loc on #2 OR type for acq_channel connection ] ; Example: MONO1,SC1,SIDE_ENTRANCE means that the ; mono1 object is connected to the sc1 object on ; mono1's side entrance ; SIDE_ENTRANCE 1 ; FRONT_ENTRANCE 2 ; FRONT_EXIT 3 ; SIDE_EXIT 4 ; INTERNAL_CONNECT 5 ; Example: MONO2,ACQ2,3,1 with ACQ2 being a Phos detector means ; The "first" pmt from the ACQ2 is on the front exit of mono2 ; MONO2,ACQ2,4,2 would be the PHOS_R detector on the side exit of mono2 ; PHOS_S 1 SPD_S1 1 SPD_S2 ? ; PHOS_R 2 SPD_R1 2 SPD_R2 ? ; TAU_S 1 CCD_S 1 ; TAU_R 2 ETC..... ; TAU_T 3 ; TAU_A 4 C1=MONO1,LS1,2,1,2,14 C2=MONO1,SC1,3,1,2,13 C3=SC1,MONO2,2,2,13,2 C4=MONO2,ACQ1,3,1,2,12 C5=SC1,ACQ2,5,1,13,12 [WIRE_CONNECTIONS] ; Format = control-ler_id,port#,unique_id,data_channel/which_acq_channel ;

Fluoromax-3 v. 2.0 (19 Feb 2002) DataMax Initialization Files
13-11
; Example = CONTROLLER1,1,MONO1 means that mono1 object is connected to port#1 ; Rules need to be enforced so no two objects of the same type are ; connected to the same port# as this is physically impos-sible ; Example of parameter 4: ; CONTROLLER1,2,ACQ3,1 --> acq_channel3 connected to port 2 of controller1 of data ; channel type 1 ==> DATA_CHANNEL_S1 ; CONTROLLER1,1,HV2,ACQ1 -->HV2 is connected to port 1 of controller 1 and is ; associated with acq1 W1=CONTROLLER1,1,MONO1 W2=CONTROLLER1,2,MONO2 W3=CONTROLLER1,3,SC1 W4=CONTROLLER1,1,ACQ1,1 W5=CONTROLLER1,2,ACQ2,5 ; hv connections ;W6=CONTROLLER1,1,ACQ1,101 ;W7=CONTROLLER1,2,ACQ2,102 ; Mot_channels that are wired differently than expected ; W1=SC1,8,1,0 says that sc1's pre_sample(1) polarizer(8) ; is connected to command channel 0 rather than 2 which is ; command channel of the sample compartment alone [WIRE_EX] ;W1=SC1,8,1,0,CONTROLLER1 ;W2=SC1,8,3,1,CONTROLLER1 [CHANNEL_TYPE] ; Types are used to determine the function of a given compo-nent ; within this layout. i.e. - Mono1 is the first Excitation Mono and ; Acq channel 1 is the Signal Channel. MONO1=1 MONO2=3 SC1=5 ACQ1_1=1 ;ACQ1_2=101 ACQ2_1=5 ;ACQ2_2=102 ;Valid units to be used system wide for the [VALID_UNITS] WLD_UNITS=1,2,3,5

Fluoromax-3 v. 2.0 (19 Feb 2002) DataMax Initialization Files
13-12
SLIT_UNITS=14,15,33 TIME_UNITS=6,7 [VISUAL] BKG_BITMAP=FLMAX3.BMP BKG_HEIGHT=360 BKG_WIDTH=480 SCALE_FACTOR=0.65 MONO1_ORIENTATION=0 MONO2_ORIENTATION=0 SC1_ORIENTATION=0 ACQ1_1_ORIENTATION=2 ACQ2_1_ORIENTATION=2 LS1_ORIENTATION=2 ANCHOR_POSITION_X=80 ANCHOR_POSITION_Y=20

Fluoromax-3 v. 2.0 (19 Feb 2002) DataMax Initialization Files
13-13
Layout files for the FluoroMax®-P Phos.lay
The phos.lay file defines the instrumental layout for the FluoroMax®-P. This in-cludes the added phosphorimeter, i.e., the flash lamp and modules. [GENERAL] DESC=Phosphorimeter Layout [COMPONENT_CONNECTIONS] ; Format = [Unique_id#1, Unique_id#2,rel_loc_on_#1, rel_loc on #2 OR type for acq_channel connection ] ; Example: MONO1,SC1,SIDE_ENTRANCE means that the ; mono1 object is connected to the sc1 object on ; mono1's side entrance ; SIDE_ENTRANCE 1 ; FRONT_ENTRANCE 2 ; FRONT_EXIT 3 ; SIDE_EXIT 4 ; INTERNAL_CONNECT 5 ; Example: MONO2,ACQ2,3,1 with ACQ2 being a Phos detector means ; The "first" pmt from the ACQ2 is on the front exit of mono2 ; MONO2,ACQ2,4,2 would be the PHOS_R detector on the side exit of mono2 ; PHOS_S 1 SPD_S1 1 SPD_S2 ? ; PHOS_R 2 SPD_R1 2 SPD_R2 ? ; TAU_S 1 CCD_S 1 ; TAU_R 2 ETC..... ; TAU_T 3 ; TAU_A 4 C1=MONO1,LS1,2,1,2,14 C2=MONO1,SC1,3,1,2,13 C3=SC1,MONO2,2,2,13,2 C4=MONO2,ACQ5,3,1,2,12 C5=SC1,ACQ5,5,2,13,12 ;C6=SC1,CTRL1,1,1,13,15 [WIRE_CONNECTIONS] ; Format = control-ler_id,port#,unique_id,data_channel/which_acq_channel ; ; Example = CONTROLLER1,1,MONO1 means that mono1 object is connected to port#1 ; Rules need to be enforced so no two objects of the same type are

Fluoromax-3 v. 2.0 (19 Feb 2002) DataMax Initialization Files
13-14
; connected to the same port# as this is physically im-possible ; Example of parameter 4: ; CONTROLLER1,2,ACQ3,1 --> acq_channel3 con-nected to port 2 of controller1 of data ; channel type 1 ==> DATA_CHANNEL_S1 ; CONTROLLER1,1,HV2,ACQ1 -->HV2 is connected to port 1 of controller 1 and is ; associated with acq1 W1=CONTROLLER1,1,MONO1 W2=CONTROLLER1,2,MONO2 W3=CONTROLLER1,3,SC1 W4=CONTROLLER1,1,ACQ5,1 W5=CONTROLLER1,2,ACQ5,5 ; hv connections W6=CONTROLLER1,1,ACQ1,101 ;be sure to remove [Power_supply] section from phos.ini if no R HV ;W7=CONTROLLER1,2,ACQ2,102 ;W8=CONTROLLER2,1,CTRL1 ; Mot_channels that are wired differently than expected ; W1=SC1,8,1,0 says that sc1's pre_sample(1) polarizer(8) ; is connected to command channel 0 rather than 2 which is ; command channel of the sample compartment alone [WIRE_EX] ;W1=SC1,8,1,0,CONTROLLER1 ;W2=SC1,8,3,1,CONTROLLER1 [CHANNEL_TYPE] ; Types are used to determine the function of a given com-ponent ; withing this layout. i.e. - Mono1 is the first Excita-tion Mono and ; Acq channel 1 is the Signal Channel. MONO1=1 MONO2=3 SC1=5 ACQ5_1=17 ACQ5_2=101 ;ACQ2_1=5 ;ACQ2_2=102 ;Valid units to be used system wide for the [VALID_UNITS] WLD_UNITS=1,2,3,5 SLIT_UNITS=14,15,33

Fluoromax-3 v. 2.0 (19 Feb 2002) DataMax Initialization Files
13-15
TIME_UNITS=6,7 [VISUAL] BKG_BITMAP=FLMAX3.BMP BKG_HEIGHT=360 BKG_WIDTH=480 SCALE_FACTOR=0.65 MONO1_ORIENTATION=0 MONO2_ORIENTATION=0 SC1_ORIENTATION=0 ACQ5_1_ORIENTATION=2 ACQ5_2_ORIENTATION=2 LS1_ORIENTATION=2 ANCHOR_POSITION_X=80 ANCHOR_POSITION_Y=20
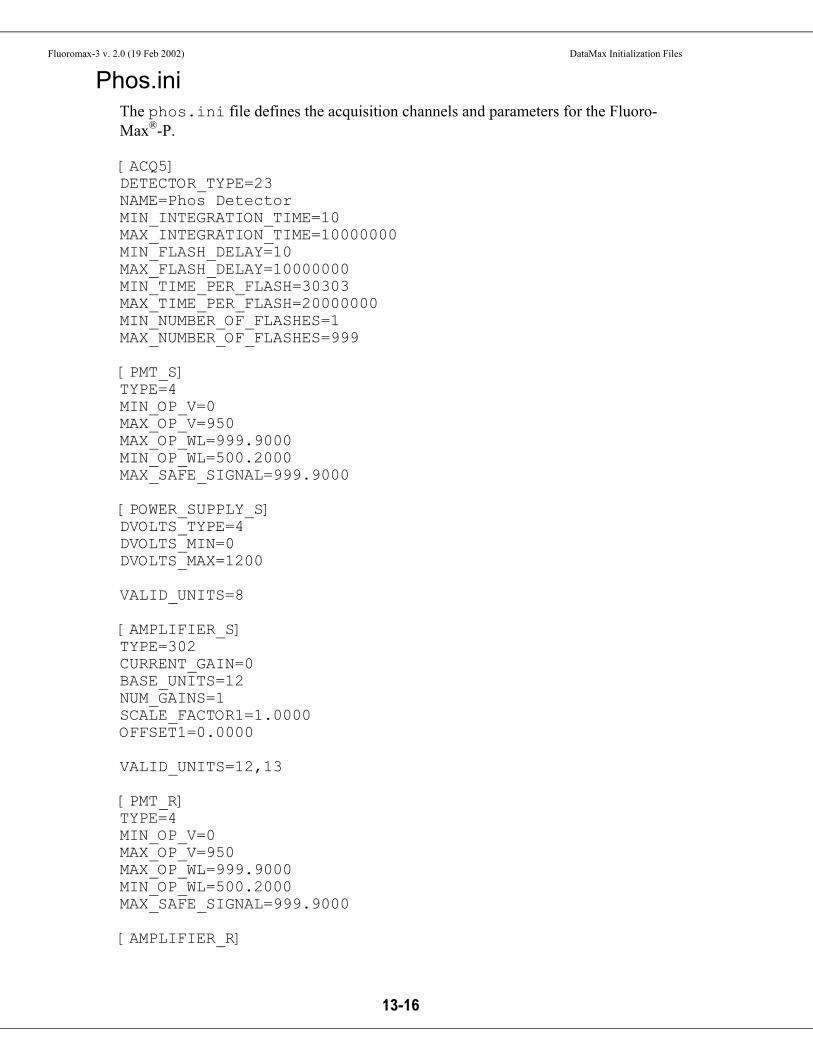
Fluoromax-3 v. 2.0 (19 Feb 2002) DataMax Initialization Files
13-16
Phos.ini The phos.ini file defines the acquisition channels and parameters for the Fluoro-Max®-P. [ACQ5] DETECTOR_TYPE=23 NAME=Phos Detector MIN_INTEGRATION_TIME=10 MAX_INTEGRATION_TIME=10000000 MIN_FLASH_DELAY=10 MAX_FLASH_DELAY=10000000 MIN_TIME_PER_FLASH=30303 MAX_TIME_PER_FLASH=20000000 MIN_NUMBER_OF_FLASHES=1 MAX_NUMBER_OF_FLASHES=999 [PMT_S] TYPE=4 MIN_OP_V=0 MAX_OP_V=950 MAX_OP_WL=999.9000 MIN_OP_WL=500.2000 MAX_SAFE_SIGNAL=999.9000 [POWER_SUPPLY_S] DVOLTS_TYPE=4 DVOLTS_MIN=0 DVOLTS_MAX=1200 VALID_UNITS=8 [AMPLIFIER_S] TYPE=302 CURRENT_GAIN=0 BASE_UNITS=12 NUM_GAINS=1 SCALE_FACTOR1=1.0000 OFFSET1=0.0000 VALID_UNITS=12,13 [PMT_R] TYPE=4 MIN_OP_V=0 MAX_OP_V=950 MAX_OP_WL=999.9000 MIN_OP_WL=500.2000 MAX_SAFE_SIGNAL=999.9000 [AMPLIFIER_R]

Fluoromax-3 v. 2.0 (19 Feb 2002) DataMax Initialization Files
13-17
TYPE=302 CURRENT_GAIN=0 BASE_UNITS=12 NUM_GAINS=1 SCALE_FACTOR1=1.0000 OFFSET1=0.0000 VALID_UNITS=12,13 [VISUAL] BITMAP1=PHOS.BMP BITMAP2=PHOS.BMP BITMAP3=PHOS.BMP BITMAP4=PHOS.BMP WIDTH=46 HEIGHT=46

Fluoromax-3 v. 2.0 (19 Feb 2002) DataMax Initialization Files
13-18

Fluoromax-3 v. 2.0 (11 Sep 2002) FluoroMax®-P Phosphorimeter Operation
14-1
14: FluoroMax®-P Phos-phorimeter Operation
Introduction The FluoroMax®-P includes a phosphorimeter, that is, a programmable pulsed source and selectable signal gating from the reference detector. Switching between the pulsed lamp and continuous lamp is computer-controlled. Apart from this, the FluoroMax®-P is identical in operation in all other respects to the FluoroMax®-3.

Fluoromax-3 v. 2.0 (11 Sep 2002) FluoroMax®-P Phosphorimeter Operation
14-2
Theory of operation A second source of illumination, a pulsed xenon lamp, is used for phosphorescence measurements. Samples are excited with pulsed light; the emitted phosphorescence is measured using an R928P photon-counting detector.
Sequence of data acquisition The illuminator housing, or flash lamp, operates at up to 25 Hz. The control module triggers each lamp pulse. When the start of the light output is detected, a signal is sent to the control module for timing purposes. The control module houses the signal-gating circuitry that intercepts the signal from the pulse-counting emission photomultiplier tube, collects a selected, time-delimited portion of the signal, and later passes it to the software. The maximum signal detectable per flash varies with the integration time:
Integration time Maximum signal (counts) per flash
100 µs 400 1 ms 4000 10 ms 40 000 100 ms 400 000 1 s 4 000 000
With, for example, 100 flashes of integrated over 10 ms each, the maximum detectable signal is:
100 flashes × 40 000 counts = 4 000 000 counts total A typical sequence of data-acquisition starts with a flash from the pulsed lamp, sensed by the control module as time t = 0. The light enters the excitation spectrometer, where it is dispersed. Monochromatic light from the spectrometer excites the sample. Lumi-nescence emission from the sample then passes through the emission spectrometer to the photomultiplier-tube detector. The control module includes a gate-and-delay gen-erator, allowing the signal at the detector to be integrated only during a specific period after the flash (the Delay After Flash), for a pre-determined length of time (the Sample Window). Any signal arriving before or after the gating is ignored. This sequence of ex-citation, delay, and collection is repeated for each lamp pulse. The total signal is accu-mulated for a pre-determined number of exciting pulses (flashes) and saved to disk. The data then can be manipulated using the Arithmetic menu.
Fluoromax-3 v. 2.0 (11 Sep 2002) FluoroMax®-P Phosphorimeter Operation
14-3
This sequence of excitation, delay, and sampling, is repeated for each lamp flash. The signal is accumulated for a predetermined number of excitation pulses, then DataMax collects the total signal. After collection, DataMax displays the intensity of the lumi-nescence as a function of time or wavelength. The x-axis is based on one of the four scan options: • Excitation • Emission • Synchronous • Phosphorescence delay
Phosphorimeter parameters Four DataMax parameters govern the sequence in a phosphorimeter experiment. These parameters automatically appear on the phosphorimeter experiment-acquisition dialog box. Delay after Flash
Sets the time, in ms, between the start of the lamp flash and the on-set of data-acquisition (opening of the Sample Window). Delay After Flash can range from 0–10 000 ms, in increments of 0.001 ms. Accuracy of Delay After Flash is better than ± 0.001 ms. Set Delay After Flash long enough so that fluorescence emission and lamp decay are complete, so that the resulting spectrum repre-sents phosphorescence only. The full-width at half-maximum lamp-pulse width is 3 µs, but there is a long decay time for the light out-put. Lamp intensity falls to less than 1% of peak output after 45 µs. Setting the delay to > 50 µs effectively removes any interference from the lamp. Delay After Flash can be varied with time to yield a decay curve. Spectra can be scanned to isolate different phosphorescing compo-nents based on the lifetime of the luminescent species in the sam-ple. Together, these two techniques can be used to create three-dimensional plots. For example, successive scans with varying de-lay times can be plotted. To record fluorescence and phosphorescence emission, set Delay After Flash to zero.
Sample Win-dow
Sets the duration of signal acquisition, in ms. The Sample Win-dow opens when the Delay after Flash ends. When the Sample Window opens, the signal is counted and integrated. After the Sample Window closes, any signal is ignored.
The Sample Window may be set from 0.01 to 10 000 ms. If the lifetime of the phosphorescence is known, set the Sample Window to 5–10 times the lifetime. If the phosphorescence lifetime is un-known, make the Sample Window a small fraction of the antici-pated lifetime, and then increase it until acceptable results are ob-

Fluoromax-3 v. 2.0 (11 Sep 2002) FluoroMax®-P Phosphorimeter Operation
14-4
served.
If the Sample Window is too long, the detector will record spuri-ous background signal. If the Sample Window is too short, com-ponents of the lifetime decay may be missed. With two or more species decaying simultaneously, try varying the Delay after Flash and the Sample Window.
Time per Flash Sets the total cycle length per flash, including on time, decay time, and dead time between flashes. The Time Per Flash is the recipro-cal of the repetition rate of the lamp pulses. The allowable repeti-tion rate is 0.03–25 Hz. The Time per Flash must be slow enough to let the Sample Window close before another flash begins. Ac-curacy of the repetition rate is ± 1 ms. The Time per Flash is gov-erned by
Time per Flash ≥ Delay after Flash + Sample Window + 20 ms
Number of Flashes
Sets the number of lamp pulses that contribute to each data point. The range for Number of Flashes is 1 to 999. The signal collected per flash is integrated over the total Number of Flashes before DataMax stores it. The more flashes accumulated, the higher the signal-to-noise ratio becomes.
For more information about DataMax phosphorimeter commands, consult the DataMax Operation Manual.

Fluoromax-3 v. 2.0 (11 Sep 2002) FluoroMax®-P Phosphorimeter Operation
14-5
Applications for the phosphorimeter Phosphorescence decay curve
Under the Exp Type... button in Collect, create a phosphorescence decay curve, as shown below. The decay signal, S, is the curved line, while the straight line, ln(S), indi-cating single-exponential decay, relates to the decay time.
Isolate components in a mixture based on lifetimes To the right are scans that isolate different phosphorescent components based on their lifetimes. For example, a sample containing two phosphorescent species with different lifetimes can be resolved into its components by varying the Delay After Flash parameter. The graphs shown here are a mixture of terbium and europium.

Fluoromax-3 v. 2.0 (11 Sep 2002) FluoroMax®-P Phosphorimeter Operation
14-6
Three-dimensional plots Using the phosphorescence delay curve with the Delay After Flash technique, a three-dimensional graph can be created, as shown to the right. This graph shows successive scans with varying time delays, segregating species into contours representing a particular slice of time.

Fluoromax-3 v. 2.0 (11 Sep 2002) FluoroMax®-P Phosphorimeter Operation
14-7
Operation of the phosphorimeter Start-up
Load an appropriate layout that includes the phosphorimeter.
DataMax features
Visual Instrument Setup Visual Instrument Setup includes symbols called Phos, indicating that the phosphorimeter is available.
Real Time Display Real Time Display adds a window called Phosphorimeter, showing variable parameters, but removes the Integration Time window.

Fluoromax-3 v. 2.0 (11 Sep 2002) FluoroMax®-P Phosphorimeter Operation
14-8
Run Experiment Five experiment types are available for the phosphorimeter: Phosphorescence excitation
Phosphorescence emission
Phosphorescence synchro-nous scan
These are similar to the standard excitation, emission, and synchronous scans. Among the changes are that the Integration Time field is removed, and instead are data-entry fields for Sample Window, Delay after Flash, Time per Flash, and Number of Flashes. These four fields are described above, in the Theory of Operation section, and shown below. They are also discussed in detail in the DataMax Operation Manual.
Above is an experiment window with a typical set of parameters for the emission of EuCl3, using the phosphorimeter.

Fluoromax-3 v. 2.0 (11 Sep 2002) FluoroMax®-P Phosphorimeter Operation
14-9
Phosphorescence decay by delay Phosphorescence decay by win-dow
These produce a decay of phosphorescence over time. Decay by delay varies the Delay after Flash in order to construct the decay curve. De-cay by window varies the length of the Sample Window while taking data.
Above is an experiment window showing typical parameters for the phosphorimeter decay of EuCl3.

Fluoromax-3 v. 2.0 (11 Sep 2002) FluoroMax®-P Phosphorimeter Operation
14-10
Processing phosphorimeter data For general information on processing data, see the DataMax Operation Manual. Of particular interest, however, for phosphorescence data is a routine called PHOS-FIT.AB, found in the GRAMS macro library. This macro tags two points on a scan, and finds the slope between them. If the natural logarithm is calculated of the decaying signal intensity, then the PHOSFIT.AB macro finds the slope of the line, which is the inverse of the lifetime, for single-exponential decay. Other parameters are also calcu-lated. Below is a screenshot from a phosphorimeter experiment measuring the decay of EuCl3. The curved line shows a linear-linear plot of signal intensity versus time, while the straight line is a logarithmic-linear plot of the same parameters.
Using the PHOSFIT.AB macro, two points on the logarithmic-linear plot are picked out below:
Log-linear plot
Linear-linear plot

Fluoromax-3 v. 2.0 (11 Sep 2002) FluoroMax®-P Phosphorimeter Operation
14-11
The negative inverse of the gradient, –8.834, is the lifetime of EuCl3 in milliseconds:
Thus the lifetime of EuCl3 phosphorescence is 0.113 ms, or 113 µs.

Fluoromax-3 v. 2.0 (11 Sep 2002) FluoroMax®-P Phosphorimeter Operation
14-12
Lamp replacement The xenon flash lamp typically has a half-intensity life of at least 10 million flashes. Follow the procedure below for replacement and alignment.
Hazards ! Xenon arc lamps are an explosion hazard. Wear goggles and protective clothing
when opening the lamp housing and when handling the lamp. ! The lamp power supply should not be connected to an AC power line while han-
dling lamp leads. Lethal high voltages may exist. ! The lamp will remain extremely hot for approximately one-half hour after it has
been turned off. Do not touch the lamp or the metal unit until the lamp has cooled.
! Never look directly at the xenon arc or its reflection. Intense radiation can per-manently damage eyes.
! Do not touch the focusing lens, back-scatter mirror, or the surface of the lamps. Fingerprints will be burned onto these surfaces when the lamp is ignited.
1 In DataMax, change from a steady-state layout to a phosphorimeter layout. The flip-mirror automatically rotates to the flash lamp, giving you more room to work.
Warning: Wear UV-protective goggles when replacing the lamp. The light from the flash lamp can damage the cornea.
Warning: High voltage exists within the FluoroMax®-P. To avoid fatal shocks, follow these precautions: Before removing the lamp cover, un-plug the FluoroMax®-P’s power cord, and wait at least 1 min while the internal capacitors discharge. Never operate the lamp with the cover removed!
Warning: Xenon lamps are an explosion hazard. Be sure that the poweris off, and all AC (mains) power is disconnected from the system. Readand follow all the cautions below:
!

Fluoromax-3 v. 2.0 (11 Sep 2002) FluoroMax®-P Phosphorimeter Operation
14-13
Warning: Never rotate the flip mirror inside the lamp housing manually.This can strip the gears in the gearbox.
2 Switch off and prepare the FluoroMax®-P. a Be sure that the FluoroMax®-P and the host computer are turned off.
b Remove the AC (mains) power cord from the FluoroMax®-P.
c Disconnect the RS-232 cable, optional trigger-box cable, power cord, and any other cables attached to the spectrofluorometer.
3 Remove the sample mount from the front of the FluoroMax®-P. a Remove the four screws that secure the sample mount to the instrument.
b Gently slide the sample mount out of the instrument. Some sample mounts have a 15-pin connector at the inside end for automated accessories.
4 Remove the instrument cover. a Remove the seven Phillips screws (two on each side, and three in the
back) from the cover.
b Lift the cover vertically off the instrument by grasping opposite corners of the cover and raising upward.
If the cover sticks, gently work each side upward until the cover slides smoothly off.
5 Remove the lamp-housing cover at the rear of the instrument. a Remove the two screws from the
lamp-housing cover.

Fluoromax-3 v. 2.0 (11 Sep 2002) FluoroMax®-P Phosphorimeter Operation
14-14
Note: If the lamp tilts during insertion, check the pins—they should be straight. If they are not straight, re-align the pins be-fore insertion.
Warning: Never touch the flash lamp’s glass bulb with bare hands. The oils from your hands can weaken the bulb and cause catas-trophic failure. Handle the flash lamp with tissues, cloth gloves, or soft cloths only.
b Gently rotate the lamp-housing cover with its cooling fans at-tached.
c Rotate the cover backwards, and set it behind the instrument so that electrical connections are not strained.
6 Remove the flash lamp. a Follow all safety precautions on the new lamp’s
box.
b Pull the old flash lamp out with a steady motion.
c Discard the old flash lamp in a safe and appropriate manner.
7 Insert the new flash lamp.
a Align the pins with the lamp socket. The cathode and anode should be vertical, as shown here.
b Push the lamp in firmly until it is seated securely and properly.
8 Replace the lamp-housing cover.
Fluoromax-3 v. 2.0 (11 Sep 2002) FluoroMax®-P Phosphorimeter Operation
14-15
9 Secure the two screws on the lamp-housing cover.
10 Reconnect all cables (power, accessories, etc.) to the FluoroMax®-P.

Fluoromax-3 v. 2.0 (11 Sep 2002) FluoroMax®-P Phosphorimeter Operation
14-16

FluoroMax-3 v. 2.0 (10 Sep 2002) Index
15-1
15: Index Key to the entries: Times New Roman font......subject or
keyword Arial font.............................command, menu
choice, or data-entry field
Arial Condensed Bold font ..dialog box Courier New font ......file name or
extension
1
180F .....................................................6-9–10 1908MOD ..............................................9-2–3 1,2-propanediol ........................................9-11
A
Absorption/Transmission Accessory .........7-3 About DataMax.........................................8-10 About Instrument Control Center ...............8-9 accessory
450-W xenon lamp ............................ 7-20 absorption/transmission accessory....... 7-3 autotitration injector........................... 7-18 cut-on filter ........................................ 7-10 cut-on filter holder ............................. 7-11 dual-position thermostatted cell holder7-14 external trigger accessory .........7-24, 7-26 fiber optic mount.................................. 7-9 four-position thermostatted cell holder7-12 HPLC flow cell .................................... 7-8 injector port........................................ 7-24 liquid nitrogen dewar........................... 7-6 liquid nitrogen dewar assembly ........... 7-6 micro cell (with Model 1923A adapter)7-8 micro cell (with Model 1924A adapter)7-8 microscope interface.......................... 7-19 microwell plate reader ....................... 7-22 Peltier thermocouple drive................. 7-21 polarizer ............................................. 7-23 quartz cuvette....................................... 7-8
reduced volume sample cell .................7-8 sample cell............................................7-8 scatter block assembly.................. 7-7, 9-2 solid sample holder.............................7-16 standard lamp assembly ............... 7-7, 9-2 temperature bath.................................7-25 upgrade to FluoroMax®-P ..................7-27
accuracy..................................................... 2-3 acquisition module .................................. 6-10 ACQx.INI .....................................13-1, 13-9 Add/Remove Programs ......................... 1-9 Add/Remove Programs Properties............ 1-9 Advanced… ........................................... 4-16 Alconox® ................................................... 5-1 Allen key ............................. 6-1, 6-3, 6-5, 6-7 ALLOBJCT.INI ...........................13-1, 13-5 anthracene................................................ 4-15 Apply ....................................................... 5-14 Arithmetic .... 5-11, 5-14, 9-6, 9-9, 9-14, 14-2 ASCII......................................................... 9-8 Autorun ..............................................1-7, 1-9 Autotitration Injector............................... 7-18
B
bandpass ....... 2-3, 5-6–7, 5-10, 6-6, 9-5, 10-2 batch scan ...........................................4-4, 4-7 Batch Scan… .......................................... 4-7 Binomial.................................................. 5-11 biological samples ..................................... 5-2 blank ....................................................... 9-6 Blank Subtraction.................................. 5-12 boot disk .................................................... 8-2
C
cables ... 1-4, 1-6–7, 6-2, 6-4–5, 7-25, 8-2, 14-13, 14-15
Calibrate..........................................3-9, 3-15 calibration.................................................. 3-3
excitation spectrometer ........................3-8 capillary cell .............................................. 5-2 CD-ROM............................................1-7, 1-9

FluoroMax-3 v. 2.0 (10 Sep 2002) Index
15-2
CE marking ............................................. 10-1 Collect ..........4-5, 4-7, 4-11, 4-13, 4-16, 9-12 COM port ..................................1-6, 8-2, 13-3 concentration curve................................... 4-9 Constant Wavelength Analysis ...4-1, 4-9, 5-3 Constant Wavelength Analysis button . 4-9 Cont Off/Cont On.................................... 4-2 contaminated water ............................... 8-6–7 Control Panel ............................................ 1-9 controller ...........2-2, 2-6, 6-8, 7-21, 7-25, 8-2 corrected data .......................................... 5-12 Correction .............................................. 5-13 CORRECTION...................................... 9-15 correction factor .. 5-12, 5-14, 7-7, 9-1–2, 9-5,
9-8–11, 9-15 correction-factor file ................................. 2-5 coverslip........................................... 5-2, 7-16 CTI board ................................................ 6-10 CTI card ............................................. 2-6, 6-8 current-acquisition module ..................... 6-10 current-input module................................. 2-5 cuvette ... 3-10, 5-1–2, 6-6, 7-3, 7-13, 7-15, 7-
21, 8-2, 8-6–8, 9-11 .CWA ......................................................... 4-9 CWA Data Display ..................................... 5-3 Czerny-Turner.................................. 2-3, 10-2
D
damage ........................................... 0-3, 1-4–5 danger........................................................ 0-3 dark counts ......... 2-4, 5-7, 8-1–2, 9-5–6, 10-2 Dark Offset ..................................... 5-12, 8-2 data
corrected............................................. 5-12 Data Acquisition Parameters.................. 9-15 DataMax...0-1, 1-4, 1-6–9, 2-2–3, 2-5–6, 4-1,
4-4–5, 4-9–10, 5-7–9, 5-12, 7-22, 7-27, 8-1, 8-9, 9-8, 10-4, 13-1, 13-3–5, 14-3–4, 14-7, 14-10
datamax directory .................................. 8-2 DataMax icon ............................................ 3-2 Delay after Flash ................. 14-2–6, 14-8–9 detector...2-1–5, 4-2, 4-9, 4-12–13, 4-15, 5-3,
5-7, 5-10, 5-12, 6-9–10, 7-4, 7-7, 8-1, 8-7, 9-1–2, 9-5–7, 10-1–2, 13-1–2, 13-9–10, 14–2, 14-4
Dewar flask ............................................... 7-6
DFLT.SET ..............................................13-1 discover scan ...............4-4, 4-7–8, 4-16, 4-17 Discover Scan… ............................4-7, 4-16 Discover Scan..........................................4-16 Discover Scan – Advanced Parameters 4-16–
17 dispersion.......................2-3, 5-10, 10-2, 13-7 dissolved solids..........................................5-2 DM302.....................................................6-10
E
emf spike ...................................................6-8 Emission Acquisition .3-4–5, 3-10–11, 4-6, 4-
12–14, 5-5, 9-6, 9-12 emission scan...................4-4, 4-10, 4-15, 8-2 End ............................................................9-6 Enter Correct Position ......................3-9, 3-15 EuCl3..................................................14-8–11 Excel® ........................................................4-9 Excitation Acquisition .........................3-4–5 Excitation Acquisition 3-5, 4-6, 4-14, 9-12–13 Excitation Position ..................................9-6 excitation spectrometer
calibration.............................................3-8 excitation scan ................................4-4, 7-3–4 exhaust fans ...............................................6-9 Exit ............................................................1-8 .exp .........................................................5-5 Exp Type… 3-4, 3-10, 4-6, 4-11, 4-14, 9-12,
14-5 Experiment… ...............4-5, 4-11, 4-13, 9-12 Experiment button................... 3-4, 3-10, 9-6 Experiment Name ...................................5-5
F
F-3000........................................................7-9 F-3004......................................................7-21 fast-Fourier transform........................See FFT feature pack ...............................................1-8 FFT..........................................................5-11 fiber-optic bundle ..................... 2-4, 7-9, 7-22 fiber-optic probe ......................................4-10 filter holder ........................................7-10–11 filters...........................................7-10–11, 8-2 Finish ........................................................1-9

FluoroMax-3 v. 2.0 (10 Sep 2002) Index
15-3
FL-1010 .............................................7-10–11 FL-1044 ...................................................7-23 flash lamp..2-1–2, 7-27, 8-3, 10-3, 13-13, 14-
1–2, 14-12, 14-14 FM-2003 ........................................ 7-12, 7-14 FM-2005 ..................................................7-27 focus
lamp ..................................................... 6-7 Functions ................................................5-14 fused-silica ..................................5-2, 7-6, 7-8
G
G factor ..................................................5-3–5 G Factor ....................................................5-5 GRAMS/32® ............................................5-11 gradient ..................................................14-11 grating ..2-3, 3-8, 3-15, 5-10, 5-12, 7-7, 7-10–
11, 9-1–2, 9-7, 10-2 grating factor............................... See G factor Grating/Turret .............................. 3-8–9, 3-15
H
halogen lamp...................................... 7-7, 9-2 Hardware Init. error ...................................8-2 hazard.....................................................14-12 hazardous condition ...................................0-3 Help ...........................................................8-9 host computer..0-1, 1-1, 1-3–4, 1-6–7, 1-9, 2-
1–2, 2-6, 3-2, 6-2, 7-22, 10-1–2, 13-1, 13-3–4, 14-13
hour meter .................................3-1, 3-17, 6-1
I
Increment..................................................9-6 INI..............................................See INI disk. INI disk ......................................................1-7 .INI.............................................. 13-1, 13-5 initialization files .....................................13-1 Injector Port .............................................7-24 Install Datamax ........................................1-8 Install… .....................................................1-9 installation..............................................1-7–9
Computer ............................................. 1-6
Instrument Control Center . 3-2, 4-1–3, 4-5, 4-7, 4-9–10, 4-16, 8-9
Instrument Control Center icon ................. 8-2 instrument disk ........................... See INI disk integration time4-12, 5-6, 5-7, 6-7, 10-2, 14-2
determining optimum ...........................5-7 Integration Time ............ 3-5, 3-11, 9-6, 14-8 Integration Time ...................................... 14-7 interface
system...................................................1-6 IR sensor.................................................... 8-2 IRR........................................................ 9-8–9 irradiance .................................... 9-2, 9-5, 9-8 ISA_INI directory................................. 13-1 isamain.ini......................................... 8-2 isascan.set................................8-2, 13-1 isascan.vw ..................................8-2, 13-1
K
kinetics................................................4-4, 4-9
L
lamp scan3-5, 3-9–10, 6-1, 6-6, 8-4–5, 8-9, 9-7
lamp.exp.......................................3-5, 3-17 lamp.spc................................................ 3-5 lamp-on indicator ...................................... 3-1 .LAY ............................................13-1, 13-10 layout ...... 3-2, 5-5, 8-1, 13-1–2, 13-10, 13-13 leveling feet ........................................1-5, 6-9 logarithm ............................................... 14-10 Lorentzian distribution .............................. 5-9
M
magnetic stirrer............ 2-4, 7-8, 7-12–15, 8-2 maintenance
FluoroMax®-P ..................................14-12 mask........................................................... 9-2 Math Functions ........................................ 5-14 matrix scan .........................................4-4, 4-7 Matrix Scan… .......................................... 4-7 maximum signal per flash ....................... 14-2 mcorrect..................... 5-12–14, 9-1–2, 9-9 meniscus .................................................... 8-7
FluoroMax-3 v. 2.0 (10 Sep 2002) Index
15-4
MgF2 ......................................................... 2-3 MicroMax ...........1-3, 2-4, 3-2, 4-4, 4-8, 7-22 microplate scan ......................................... 4-4 Microplate Scan… .................................. 4-8 Microscope Interface .............................. 7-19 microwell plate.......................................... 4-4 mm ............................................................ 7-8 Model 1908 ............................................... 9-2 Model 1908MOD...................................... 9-2 Model 1938 ............................................. 7-10 Model 1940 ............................................... 7-3 monitor........................................... 1-3, 1-6–7 monochromator 2-1–4, 2-6, 3-3–4, 3-8–10, 3-
14–16, 4-2–4, 5-10, 6-3, 6-6, 6-9, 8-1–2, 9-11, 13-1, 13-7, 13-10
monolayers................................................ 5-2 MONOx.INI................................... 13-1, 13-7 multiple-sample holder ............................. 2-4 Multiply ................................................... 5-14
N
neutral-density filter.................................. 9-2 New Polarization Sample ......................... 5-4 Nikon....................................................... 7-19 nitric acid .................................................. 5-1 nm ........................................................... 3-12 no trace view object .................................. 8-2 Number of Flashes...................... 14-4, 14-8 Number of Scans............................. 5-8, 9-6
O
offset ..................................................... 7-4–5 OK.. 3-4, 3-6, 3-9–12, 3-15, 4-6, 4-8, 4-12, 4-
14, 4-17, 9-12–13 Olympus.................................................. 7-19 optics ......................................................... 5-3 Options............................................ 3-6, 3-12 optimum
integration time .................................... 5-7 outliers..................................................... 5-11 overhead clearance.................................... 1-1
P
Peaks/Settings ........................................ 5-11
Peltier................................................4-4, 7-21 performance test report..............................3-3 Phos ........................................................14-7 phos.ini ...................................13-2, 13-16 phos.lay ...................................13-2, 13-13 PHOSFIT.AB .......................................14-10 phosphorescence..................... 7-6, 7-10, 7-27 phosphorescence decay curve..................14-5 phosphorescence synchronous scan ........14-8 phosphorimeter . 0-1, 8-1, 8-3, 10-1, 10-3, 13-
2, 13-13, 14-1, 14-3–5, 14-7–10 Phosphorimeter .......................................14-7 photobleach mode......................................2-4 photobleaching ..................... 2-3, 4-9, 5-9–10 photodecay.................................................4-4 photodiode .....2-2, 2-4–5, 3-4, 6-10, 9-10–11,
10-2 photomultiplier tube ...2-2, 2-4, 4-13, 4-15, 4-
17, 6-10, 9-3, 14-2 photon-counting module............................2-4 photon-pulse pile-up..................................2-5 plotter.........................................................0-1 polar scan...................................................4-4 Polar Scan….....................................4-8, 5-5 polarization ................................................5-3 Polarization ..............................................5-5 polarization scan.................................4-4, 4-8 polarizer.............................5-3, 5-5, 7-23, 8-1 poor resolution...........................................8-5 power supply 2-1, 2-6, 6-2, 6-8, 7-7, 8-1, 9-2,
9-5, 14-12 potassium bromide.....................................5-2 printer ............. 0-1, 1-3, 1-6–7, 1-9, 3-2, 10-1 Proceed to Acquisitions .........................5-3
Q
quantitative analysis ..................................4-9 quantum yield ...................................5-12, 9-1 quartz ...............................3-10, 5-2, 7-6, 7-16 Quick Polarization .....................................5-5
R
R ............................................ 3-6, 5-12, 9-11 R928P .......................2-4, 6-10, 9-5, 9-7, 10-2 radiometric correction ........................9-1, 9-8

FluoroMax-3 v. 2.0 (10 Sep 2002) Index
15-5
radiometric correction factors.......... 5-12, 9-1 Raman3-3, 3-10–11, 3-13, 3-16–17, 6-1, 6-6–
7, 8-2, 8-6–9, 10-2 Rayleigh scatter........................................3-13 Real Time Display 3-8, 3-14, 4-1–2, 5-7, 9-3,
9-11–13, 14-7 Real Time Display button ..........................4-2 reference detector 2-2, 2-5, 4-15, 5-12, 7-4, 8-
1, 9-11, 10-1, 14-1 reflectance plate .........................................9-2 relative humidity .............................. 1-2, 10-3 repeatability ...............................................2-3 repetition rate ...........................................14-4 resolution ...................................................2-3 rhodamine-B ............................................9-11 RS-232 ........................................... 6-2, 14-13 Run 3-4, 3-6, 3-12, 4-1, 4-4, 4-6, 4-8, 4-13, 4-
15, 9-14 Run Experiment .. 3-4, 3-9–10, 3-16, 4-1, 4-4,
4-7, 4-10, 4-16, 5-5, 5-7–8, 5-11, 5-13–14, 8-10, 9-6, 9-9, 9-12, 9-14, 14-8
Run Experiment button ...................... 4-5, 4-7 Run Installation Program ..........................1-9
S
S ....................... 3-11, 4-12, 4-15, 9-11, 14-5 S/N................................2-5, 5-6–8, 10-2, 14-4 S/R................... 4-15, 5-12, 7-3–5, 9-11, 9-13 sample preparation
biological samples ............................... 5-2 dissolved solids.................................... 5-2 small-volume sample ........................... 5-2 solid samples........................................ 5-2
sample chamber ..... 3-4, 3-10, 6-10, 7-25, 9-3 sample changer ................................ 3-3, 3-10 sample compartment2-2, 2-4, 3-4, 3-10, 6-10,
7-9–11, 7-21, 7-24, 9-3–5, 9-11, 10-3, 13-1, 13-8
sample mount.............................................6-2 sample platform .........................................2-4 sample turret ..........................................8-1–2 Sample Window .................. 14-2–4, 14-8–9 sampling module........................................7-6 SAQ.INI..............................13-1, 13-3, 13-5 Savitsky-Golay.......................................5-11 scanning, multiple times ............................5-8 scatter block ...............................................9-2
Scatter Block Assembly .....................7-7, 9-3 scatter plate................................................ 9-3 screwdriver ................................................ 6-1 SCx.INI........................................13-1, 13-8 Select Experiment Type 3-4, 3-10, 4-6, 4-11–
12, 4-14, 9-12 Select New Term File .............................. 5-14 Selected Signal ..................................... 9-13 serial number ........................................... 8-10 serial port................................................. 7-22 SETUP.EXE ............................................. 1-9 shutter ............... 2-3, 6-6, 6-9, 8-1, 9-11, 10-2 signal-to-noise ratio............................See S/N Signals.................................... 3-6, 3-11, 9-13 Signals... ............................... 3-6, 3-11, 9-13 slits2-3, 3-6, 3-12, 5-6, 5-9–10, 7-4, 8-1–2, 8-
5, 8-7–8, 9-3, 9-5, 9-11–13, 10-2, 13-7 Slits......................................... 3-6, 3-12, 9-13 Slits... ..................................... 3-6, 3-12, 9-13 slope....................................................... 14-10 small-sample volume................................. 5-2 smoothing .........................................5-6, 5-11 softkey ....................................................... 1-9 solid samples ............................................. 5-2 solid-sample holder ............................5-2, 8-2 specifications
computer.............................................10-4 software ..............................................10-4 spectrofluorometer system .............10-2–3
SPEX.INI.....................................13-1, 13-4 Spex® Fluorescence Service.. 1-6, 6-8, 8-1–2,
8-9–10, 9-2, 13-1 Spex® Fluorescence Applications ........... 4-12 spherical aberration ................................... 2-3 Start........................................................... 9-6 Start Acq .................................................. 5-4 stdlamp .................................................. 9-6 stdlamp2.........................................9-6, 9-9 stepper motor........................................... 6-10 support
technical ...............................................8-9 symbols...................................................... 0-3 Synchronous Acquisition ....................... 4-6 synchronous scan.................. 4-4, 7-4–5, 14-8 system controller ....................................... 2-1

FluoroMax-3 v. 2.0 (10 Sep 2002) Index
15-6
T
T-box.......................................7-9, 7-23, 9-11 technical support ....................................... 8-9 temperature bath..1-3, 3-2, 4-4, 7-12, 7-14, 7-
25 temperature scan ....................................... 4-4 Temperature Scan… ............................. 4-8 Term File................................................ 5-14 Term File*K ........................................... 5-14 throughput ................................................. 3-3 time-based scan......................................... 4-4 Time per Flash ............................. 14-4, 14-8 toolbar .............................................. 3-4, 3-10 TRIG-15/25 (trigger accessory) 1-6–7, 6-2, 6-
9, 7-24, 7-26, 14-13 triplet state................................................. 7-6 troubleshooting ......................................... 8-1 turret.......................................................... 2-4
U
Units ................................. 3-6, 3-12, 4-3, 8-2 Use Polarization Modes ........................ 5-3
V
Visual Instrument Setup . 3-6, 3-8–9, 3-12, 3-14–15, 4-1, 4-3, 5-7, 8-1, 14-7
Visual Instrument Setup button ................ 4-3
W
water.exp .................................. 3-11, 3-17 water.spc ........................................... 3-11 web site ..................................................... 8-9 Windows™ .........0-1, 1-7, 1-9, 2-6, 3-2, 10-4
X
xcorrect .................5-12–14, 9-1, 9-14–15 xenon lamp 2-1–2, 2-5–6, 3-1–5, 3-7, 3-9–10,
3-17, 5-12, 6-1–3, 6-5–8, 7-20, 7-27, 10-1–2, 14-12
XFER ...................................................... 9-13
Z
Zap ..........................................................5-11 Zeiss.........................................................7-19