Fluid Flow in Wood Fiber Network
58
LICENTIATE THESIS Luleå University of Technology Department of Applied Physics and Mechanical Engineering Division of Fluid Mechanics 2006:34|:402-757|: -c -- 06 ⁄34 -- 2006:34 Fluid Flow in Wood Fiber Networks Patrik Pettersson
Transcript of Fluid Flow in Wood Fiber Network

LICENTIATE T H E S I S
Luleå University of TechnologyDepartment of Applied Physics and Mechanical Engineering
Division of Fluid Mechanics
2006:34|: 402-757|: -c -- 06 ⁄34 --
2006:34
Fluid Flow in Wood Fiber Networks
Patrik Pettersson


Cover figure: Cross section view at the entrance of the Metso Contipress in the mill of Camsan Turkey.
FLUID FLOW IN WOOD FIBER NETWORKS
Copyright Patrik Pettersson (2006). This document is freely available at
http://epubl.ltu.se/1402-1757/2006/34
or by contacting Patrik Pettersson,
The document may be freely distributed in its original form including the currentauthor's name. None of the content may be changed or excluded withoutpermission from the author.
ISSN: 1402-1757ISRN: LTU-LIC—06/34--SE


i
PrefaceThe work presented in this thesis is a result of a collaboration between Luleå University ofTechnology and Metso Paper, located in Sundsvall, Sweden. The presented thesis gathersthe work done during the period March 2003- May 2006.I would first of all like to thank my supervisors Professor Staffan Lundström and Dr. TomasWikström for their grateful support, valuable discussions during this project and for theirslinguistic supports. Special thanks to my colleges and friends in the group AppliedMechanics at Metso, for theirs supports and valuable friendships. Special gratitude to Mrs.Britt-Louise Bjermqvist for her invaluable helps with the administration of this project andfor the linguistic revision of this thesis.I also would like to thanks all the people that have contributed to this work. Especial thanksto Mr. Sven-Erik Håkansson and Mrs. Berit Olausson. Sven who have been very helpfulwith the building and modification of the experimental equipment. Berit that have helpedme with the preparation and valuable morphological measurements of the pulp suspension.I also would like to thanks my friends at the Division of Fluid Mechanics for theircontribution to a friendly and inspiring environment during the time I spent in Luleå.Last, but certainly not least my wife and children, who have been very supportive andhelped me cope with the workload that this project has meant.
Patrik Pettersson
May 2006


iii
AbstractCellulose material is processed to pulp suspensions and MDF boards in order to produceproducts such as papers, magazines, laminate floors or door skins. A critical stage of theseprocesses is when the cellulose fiber networks are compressed to specific densities andwhen most of the fluid originally positioned between and inside the fibers is forced to leavethe network. The fiber network is then exposed to a drag force generated by the flow. Themagnitude of this force is dependent upon how easy the fluid can flow through the network,which is commonly described by its permeability. In addition to the permeability, whichrelates to the drag on each fiber, there is a solid network force. The response to this forcefrom the fiber network is often termed as the compressibility of it. Hence, to be able tomodel and predict the compression stage in cellulose material related processes these twomaterial properties must be known.
In this thesis two equipments to measure the permeability of MDF networks and pulpsuspensions are evaluated and a neat model for a part of the MDF-compression stage isdeveloped. A reference material consisting of spherical particles and relevant fiber networksare used as test objects for the equipments enabling a comparison to theoretical models andexisting experimental results. The outcome is that correct enough permeability data areobtained with respective equipment as long as Reynolds number is sufficiently low. Theequipments are then used to study different materials showing, for instance, that highlycompressed MDF-networks are strongly anisotropic as to permeability and that the testedhardwood pulps have an overall higher permeability compared to the softwood pulpsinvestigated. It was also found that the permeability of the pulps was not influenced bydifferent mechanical treatments of the fiber network, as long as the geometrical dimensionsof the fibers were constants.


v
Summary of PapersPaper I: Close to the finalization of the medium density fiberboard process, a fairly thick bed
of loosely entangled fibers is compressed in a belt-press to often less than a tenth ofits original unstressed thickness. This single unit operation is very important toconsider when the manufacturing process of the boards is to be optimized. Despitethis, there is a lack of knowledge of the interaction between the fiber mat strengthand how the fluid flows through it, i.e. de-aeration. Thus, it is of greatest importanceto find reliable methods for studying this stage of the manufacturing process.Following this quest, a method is developed with which the gas permeability of fibermats can be measured. The method offers the potential to measure the permeabilityat different flow rates and thus at arbitrary pressure gradients through the material.The method is successfully validated with a porous reference material consisting ofpolymer spheres, and it is shown that the flow follows Darcy’s law at the flowrates of interest. Finally, the method is demonstrated by a presentation ofpermeability measurements on fiber mats consisting of spruce fibers.
Paper II: When forming fiberboards a large amount of air is evacuated from the dryfiber mat and the fibers become subjected to forces generated by the flow. Ifthe forces become too high the fiber mat will burst and the process will bestopped resulting in economical losses. A model for the pressure field duringthe pressing has been derived, by starting from first principles. From thisactivity it has been shown that the velocity of the belt can be increased as longas the geometry of the press or the viscosity of the penetrating fluid are alteredin a prescribed manner. The pressure distribution will be unaffected byvariations to the basis weight of the fiber mat as long as it is matched with ashift to the density of the fibers. Furthermore, by deriving the pressure field asa function of boundary conditions it is shown that minor variations to thepressure at the nip may result in huge differences of the pressure at theentrance of the press. In a validating procedure it is, finally, shown that themodel parameters can be adjusted in a physical reasonable way to getacceptable agreement with experimental data.
Paper III: During the formation of pulp to paper, a large amount of water is added todilute the pulp in order to obtain a homogenous material. This water can bemechanically and/or thermodynamically removed by high energy consumingunits. The pulp suspension flows through various process equipment thatinfluences the pulp suspension by changing its properties before the pulpsuspension finally becomes paper. It is important to understand themechanisms behind the transport path of water in order to reduce the costs andto increase the production rate of pulp and paper. In order to describe the flowpath and the corresponding pressure drop in dewatering equipments in a pulpmill, the resistance to flow must be known. For networks with complexgeometry, a reliable method is to measure the resistance to flow at discretepoints and to adapt suitable resistance models to the results obtained.The objective of this work is to investigate how the history of pulpsuspensions affects their permeability. An equipment for measuringpermeability of various pulp suspensions at high basis weights is consequentlydeveloped and validated. Then the permeability of a number of virgin pulp

species is measured. Some of the suspensions are then circulated in a closedflow loop and the permeability is measured as a function of number of loops.The results from the two separate tests showed that a basis weight variationand a different process treatment of the pulp suspension did not influence thepermeability.

vii
Appended papersThis thesis is based on the following enclosed papers:
Paper I: PETTERSSON, P., T. S. LUNDSTROM,T. WIKSTRÖM (2006). "A method to measure thepermeability of dry fiber mat." Wood Fiber Sci. 38(3): 10.
Paper II: PETTERSSON, P., T. S. LUNDSTRÖM, T. WIKSTRÖM,E. WASSVIK (2006). "Modeling ofthe Pressure Distribution in a Belt Press during Manufacturing of Fiberboards."Submitted to Journal Wood Fiber Sci.
Paper III: PETTERSSON, P., T. WIKSTRÖM,T. S. LUNDSTRÖM (2006). "A method to measure thepermeability of pulp suspension at high basis weights." Submitted to Nordic PulpPaper Res. J.


Paper I


A METHOD TO MEASURE THE PERMEABILITY OF DRY FIBER MATS
Patrik PetterssonResearch Engineer
Metso Paper SundsvallSE-851 94 Sundsvall, Sweden
T. Staffan LundströmProfessor
Division of Fluid MechanicsLuleå University of Technology
SE-971 87 Luleå, Sweden
and
Tomas WikströmPhD
Metso Paper SundsvallSE-851 94 Sundsvall, Sweden
(Received May 2005)
ABSTRACT
Close to the finalization of the medium density fiberboard process, a fairly thick bed of looselyentangled fibers is compressed in a belt-press to often less than a tenth of its original unstressed thickness.This single unit operation is very important to consider when the manufacturing process of the boards isto be optimized. Despite this, there is a lack of knowledge of the interaction between the fiber mat strengthand how the fluid flows through it, i.e. de-aeration. Thus, it is of greatest importance to find reliablemethods for studying this stage of the manufacturing process. Following this quest, a method is developedwith which the gas permeability of fiber mats can be measured. The method offers the potential to measurethe permeability at different flow rates and thus at arbitrary pressure gradients through the material. Themethod is successfully validated with a porous reference material consisting of polymer spheres, and it isshown that the flow follows Darcy’s law at the flow rates of interest. Finally, the method is demonstratedby a presentation of permeability measurements on fiber mats consisting of spruce fibers.
Keywords: Medium density fiberboard, gas permeability, anisotropic permeability, experimental vali-dation, porous flow.
INTRODUCTION
This study covers a part of the manufacturingprocess of medium density fiberboard, (MDF).Close to the final formation, a fairly thick mat ofloosely entangled fibers is compressed in a belt-press to often less than a tenth of its originalunstressed thickness. During this process, a largeamount of air is forced through the porous matgenerating pressure on it due to a flow resistancebetween the air and fibers, a procedure oftentermed de-aeration. The magnitude of the forceis dependent on the permeability of the fiber
mat, the speed of the belt, the geometry of thebelt-press, and the potential for air to escape viapermeable belts. If the force generated by theairflow becomes too high, the fiber mat willbreak. In order to mimic the flow of air and thecorresponding pressure gradient, the resistanceto flow must be found. One reliable method fornetworks with complex geometry is to measurethe resistance to flow at discrete points and to fitsuitable resistance models to the results. Mea-surements of the resistance to flow of porousmaterials are, however, not straightforward. To
Wood and Fiber Science, 38(3), 2006, pp. 000 – 000© 2006 by the Society of Wood Science and Technology

start with, airflow through porous media doesnot generally follow Darcy’s law. There are atleast three possible reasons for this: 1) TheReynolds number, in many cases, becomes toohigh and inertia effects must be considered. In-ertia effect occurs when the flow regime is ap-proaching the transition region between laminarand turbulent flow. The inertia effect is usuallydealt with by using the Forchheimers Equation(Whitaker 1996) that may be written as follows:
−�p
�x=
�
kv + ��gv2 , (1)
where p is the pressure, v the superficial veloc-ity, μ the viscosity, k and � parameters of theporous media, and �g the fluid density. If � is setequal at zero, k becomes equal to the permeabil-ity K and the Darcy’s equation is found. Hence,in order to use Eq. (1), two material parametersmust be determined. 2) Besides inertia effects, ifthe pressure drop caused by the flow rate over-comes the fiber mat stress, the fiber mat maydeform. This phenomenon has been shown toresult in a linear pressure velocity relationshipup to a certain pressure difference, while abovethis pressure the velocity remains constant as thedriving pressure is increased (Belkacemi andBroadbent 1999). 3) The non-Darcian behaviorcan also be attributed to the molecular effectbeing important for gas flow at low pressures invery small pores. The effect is that measured gaspermeability is higher than liquid permeabilityin the same porous media (Bear 1972; Scheideg-ger 1972). The reason for this is that the meanfree path of the gas molecules approaches thedimensions of the pores. This results in a Knud-sen flow, implying that there is a slip betweenthe walls of the pores and the gas. That wouldresult in a too high measured flow rate for agiven pressure drop. For N2 at a pressure of oneatmosphere and a temperature of 300 K, themean free path is 22 nm (Thompson 1972).
There are a substantial number of publishedfindings on the permeability of liquids penetrat-ing fiber networks, while only a few studies con-sider characteristics of the flow of gas throughfiber networks. One technique often used with
liquids that also applies to gases is the parallelflow saturated technique, which is very simpleand has also proven to be reliable, (Lundström etal. 2000). One drawback that must be kept inmind, however, is that relatively large channelsmay be formed between the sealing and the fibermat leading to too high flow rates and incorrectpermeability values. Another disadvantage isthat errors in permeability values are obtained ifthe flow is not in the main permeability direc-tions (Lundström et al. 1998). Only a few studiesare available regarding gas flow. Sullivan andHertel (1940) estimate the permeability of glassfibers, while Bouazza and Vangpaisal (2003) fo-cus on clays. In both cases, the measurement iscarried out in a fixed control volume where thepressure drop is carefully measured at a constantflow rate. Yet another approach for determiningpermeability and often applied to fibrous mate-rial is to use dynamic compression equipment. Apermeability model has been established forpulp at low basis weight for this type of set-up(Buntain and Bickerton 2003). One uncertaintyin this kind of experiment is that the volumefraction in the suspension is not generally con-stant in the compression direction (Zhu et al.1995; Lu et al. 1998).
The objective of this paper is to present anevaluation of equipment that has been developedto measure the gas permeability of a porous ma-terial consisting of wood fibers, typically a fibermat. The equipment offers the potential to mea-sure the permeability in two independent direc-tions in order to classify the degree of anisotropyat different flow rates and different pressure gra-dients.
MATERIALS
Permeability measurements were carried outon two types of material: reference material ex-pandable polystyrene (EPS) spheres used to vali-date the permeability equipment, and fiber mats,which are the main constituents in the MDF ma-terial. The EPS material has the following ad-vantages when using it as a reference material:1) Its permeability is in the same range as thefiber network at high porosity; 2) It is stable
WOOD AND FIBER SCIENCE, JULY 2006, V. 38(3)2

under testing conditions; and 3) its permeabilitycan be estimated by analysis. To fulfill theserequirements, EPS spheres with a mean diameterof 0.62 mm, delivered by the Finnish companyStyroChem, were used. This polymer is made ofstyrene containing pentane as a blowing agent.An image analysis of the spheres was performedin order to estimate their diameter. The imageanalysis was conducted by examining thespheres in a microscope connected to the soft-ware “Image pro plus.” The analyzed image hada resolution of about 47 pixels per mm, depictedin Fig. 1. The categorization of single sphereswas accomplished by setting a threshold valuefor the roundness defined as:
r =Ss
2
4 � � � As. (2)
Here Ss describes the perimeter and As de-notes the cross-sectional area of the spheres, re-spectively. Hence, for a perfect spherical par-ticle, the roundness value is 1.0. The area in Fig.1 that deviates from spherical shape was ex-cluded in the analysis of the diameter of thespheres by setting the roundness value at 1.1. Byvarying the roundness value from 1.1 to 1.5, themean diameter changed by only 0.8%. Severalmethods were tested to determine the porosity ofthe EPS spheres under dry conditions. The po-rosity of a material is defined as the fraction of
the bulk volume of the porous sample that isoccupied by pore or void space. The methodsused when estimating the porosity of the EPSmaterial were based on the density method, whichyields the total porosity. The density method de-pends on the ratio between the bulk density ofthe sample and the density of the solid particles.The density of the EPS spheres, �s, was obtainedfrom the supplier, 1010 kg/m3; the bulk density,�c, was determined by measuring the mass of thespheres used in the measurement, (cf. Fig. 2).The total porosity is expressed as:
�s = 1 −�c
�s. (3)
Spruce chips from Östrand, Sweden, were de-generated in a burnisher equipment at the Tech-nology Center in Sundsvall, Sweden. The out-come from the equipment is fibers. Of impor-tance, the fibers are relatively long and strongly
FIG. 1. A part of the image used in the image analysis ofthe spheres. The length scale is 10 mm. The areas thatconsist of too densly packed spheres deviate from a spheri-cal shape and are excluded from the analysis by setting theroundness value at 1.1.
FIG. 2. Schematic sketches of the measuring cell forset-up. Index 1 and 2 denote the inlet and outlet, respec-tively. The pressure transducers located as illustrated in thesketch measure the pressure drop of the gas through theporous material. During the measurement, air is transportedin a tube out from the equipment where the flow rate and airpressure are measured in order to determine the mass flow.For the in-plane set-up, a pair of rubber cloths was placed inthe top and bottom position of the porous material. In thatset-up, the solid plates were exchanged to perforated plateswith holes of a diameter of 1 mm.
Pettersson et al.—PERMEABILITY OF DRY FIBER MATS 3

crimped, thus enabling entanglement to neigh-boring fibers as illustrated in Fig. 3. In order todetermine the geometrical parameters of the fi-bers forming the networks, an image processingwas performed by using Pulp Quality Monitor(PQM)TM equipment. This system gives the fi-ber diameter as an arithmetic mean value, whilethe fiber length is specified as a weighted aver-age length. The coarseness value is calculatedfrom the total measured fiber length and themass of the fiber sample. The resolution of theimage obtained was about 15 �m per pixel. Themorphological data of the measured spruce fi-bers are depicted in Table 1. The results from therefining illustrate that the outer mean diameterof the fibers is in the same range, except for thefibers that were degenerated one year later.
As for the bed of spheres, it is important todetermine the porosity of the fiber mat. This isnot straightforward since the fibers themselvesare porous, (cf. Fig. 4), i.e. a wood chip consistsof many hollow fibers. Hence, a number of cor-relation parameters have been presented for pulpsuspension; one important parameter is the totalporosity described by Wikström and Rasmuson1998 and Vomhoff and Norman 2001. The totalporosity is defined as the total volume of voids,i.e. both lumen volume and the free pore spaceoutside the fibers in relation to the total controlvolume, illustrated by Wikström and Rasmuson
(1998), compare Fig. 5, which may be expressedas:
�t = 1 −Vf
Vf + Vlu + Vg, (4)
where �t describes the total porosity for the fibermat, the fiber wall volume Vf, the free volumebetween the fibers Vg, and the lumen volumeinside the fibers Vlu. The total porosity for thefiber mats can also be expressed in terms of the
FIG. 3. A typical high porosity fiber mat with fibers thatare loosely entangled to each other. Length scale indicatesmm.
FIG. 4. Schematic picture of the internal structure of across-section of a wood chip displaying the fiber geometry,(with permission from Staffan Palovaara, SCA Research).The fibers are separated from each other in the burnisherequipment.
FIG. 5. Definition of the different volumes in a fibermat.
TABLE 1. The morphological data of the spruce fiber matsand the dryness value of the material at the time of themeasurements. Batch 4 denotes the measurement conductedmore than one year later compared to the other ones.
Batchno.
Average outerdiameter [�m]
Average fiberlength [mm]
Coarsenessvalue [mg/m]
Dryness[kg/kg]
1 29.0 1.80 0.50 0.932 29.3 1.84 0.43 0.933 28.5 1.85 0.37 0.934 32.18 2.14 0.64 0.91
WOOD AND FIBER SCIENCE, JULY 2006, V. 38(3)4

density method suggested by (Vomhoff andNorman 2001) as:
�t = 1 −w
h � �f, (5)
where w is the basis weight, h the thickness ofthe sample, and �f the fiber wall density.
MEASURING UNIT
To experimentally derive the permeability ofthe fiber mats, a permeability measurement unithas been developed which is designed for mea-surements of in-plane permeability as well asout-of-plane permeability, (Fig. 2). If the latterdirection coincides with one principal direction,the full 3D-permeability tensor can be derived.To determine the permeability for the porousmaterial, Darcys law is used:
�p
�x= −
�
kv , (6)
where v is the superficial velocity, μ is the dy-namic viscosity of the fluid, K represents theintrinsic permeability, and the gradient on theleft-hand side is the pressure drop of the fluid.Since air is a compressible fluid, it is necessaryto rewrite Darcys law by use of the equation ofstate:
pvAc = mRT , (7)
where R is the gas constant, T is the temperatureof the gas, p is the fluid pressure, Ac is the cross-sectional area of the cavity, and m the massflow. By integrating the combination of Darcy’slaw (Eq. 6) and the equation of state for air (Eq.7) in the flow direction and by assuming a ho-mogenous porosity profile, the gas permeabilityis expressed as:
K =2�mRTh
Ai�p12 − p2
2�. (8)
To derive the out-of-plane permeability, air isforced through a perforated plate placed at thebase of the measuring cell and into the fibernetwork by the means of an applied pressure
gradient, (cf. Fig. 2). The air is allowed to leavethe cell through a perforated top wall. Maximumvolume of the cavity is 0.19 m × 0.311 m × 0.4m where the last dimension denotes the height.In the current set-up, flowmeters (4 to 25 m3/h,or 30 to 390 m3/h) were connected externallywith the permeability equipment at the outlet bya tube with an accuracy of ±0.5% of the cali-brated span. In addition, a pressure transducerranging from 0 to 16 kPa was placed close to theflow gauges in order to determine the mass flow.Pressure transducers (0 to 20 kPa, or 0 to 200kPa) were also connected to the permeabilityequipment at the inlet position, marked as p1 inFig. 2; the sensitive one was used when possiblein order to reduce experimental error. The pres-sure transducer placed at the outlet had a rangeof 0 to 7.5 kPa, marked as p2 in Fig. 2. Themeasurement error of the pressure transducerswas ±0.2% of the calibrated span. The heightwas measured by a linear magnetic position sen-sor with a measuring length of 1.0 m. The maxi-mum deviation of the magnetic position sensorwas ± 0.05% of the calibrated span. The perme-ability measurements were conducted under sta-tionary conditions in the sense that a constantflow rate was applied through the fiber matwhile the height of the cavity was held constant.Since the permeability of the fiber mat isstrongly dependent on the porosity, additionalmeasurements were performed by lowering theupper plate. This procedure was repeated untilthe lowest possible volume of the cavity wasreached, with respect to the limit of the pressuretransducer, or until the maximum load from thecompression was achieved.
For the measurement of the in-plane perme-ability, the solid walls were replaced with per-forated plates, and rubber cloths were placed onthe top and bottom surfaces to prevent air fromleaving the cavity in the out-of-plane direction.Air was forced through the sample from the leftchamber to the corresponding right one, cf. (Fig.2) where the positions of the pressure transduc-ers can be spotted.
The systems presented have several sources oferror such as:
Pettersson et al.—PERMEABILITY OF DRY FIBER MATS 5
● Pressure losses through the sealing betweenthe piston and solid walls,
● Edge effects in the fiber mat closest to thesolid wall,
● Pressure, flow rate, and position transducers,● Non-uniform flow rate due to compression of
air,● Temperature variations inside the cavity due
to variation in temperature of the flowing gas.
Some of the sources are more difficult to esti-mate than others, but by studying their effects onthe permeability in Eq. (8), it is possible to dis-tinguish the most sensitive ones. By scrutinizingthe parameters, it is obvious that the inlet andoutlet pressure must be measured very accu-rately. In addition to this, a pressure loss testwithout fibers in the cavity was performed inorder to study how the flow resistance throughthe perforated walls influenced the permeability.It was shown that the pressure drop through thewalls was negligible.
A final remark on the performance of themeasurement is that a fiber bed with no con-straints would compress homogeneously. A hy-pothesis is that with constraints, for instance dueto friction at the side walls, an inhomogeneousmaterial may be obtained, the estimation of thepermeability due to that effect will be mislead-ing. Hence, during the permeability measure-ments, the applied force on the fiber bed waslogged showing that the reaction force from thebed towards the piston decreased during themeasurement, i.e. the fibers were redistributed.The permeability measurement was not estab-lished until force equilibrium was reached.
RESULTS AND DISCUSSION
Validation of permeability equipment
Measurements carried out in the out-of-planeset-up show that the apparent permeability of theEPS spheres is dependent on the Reynolds num-ber defined as:
Re =v � d � �g
�, (9)
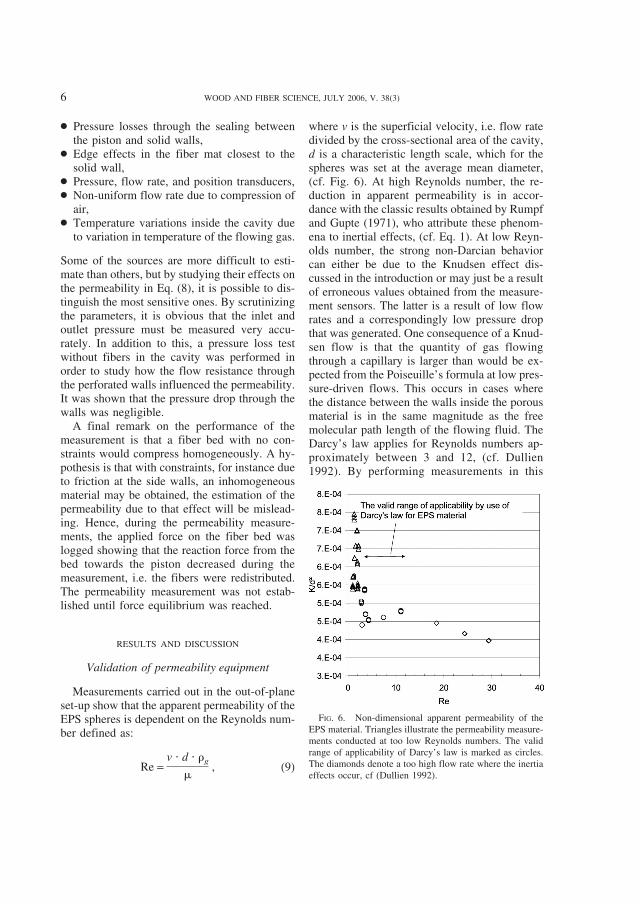
where v is the superficial velocity, i.e. flow ratedivided by the cross-sectional area of the cavity,d is a characteristic length scale, which for thespheres was set at the average mean diameter,(cf. Fig. 6). At high Reynolds number, the re-duction in apparent permeability is in accor-dance with the classic results obtained by Rumpfand Gupte (1971), who attribute these phenom-ena to inertial effects, (cf. Eq. 1). At low Reyn-olds number, the strong non-Darcian behaviorcan either be due to the Knudsen effect dis-cussed in the introduction or may just be a resultof erroneous values obtained from the measure-ment sensors. The latter is a result of low flowrates and a correspondingly low pressure dropthat was generated. One consequence of a Knud-sen flow is that the quantity of gas flowingthrough a capillary is larger than would be ex-pected from the Poiseuille’s formula at low pres-sure-driven flows. This occurs in cases wherethe distance between the walls inside the porousmaterial is in the same magnitude as the freemolecular path length of the flowing fluid. TheDarcy’s law applies for Reynolds numbers ap-proximately between 3 and 12, (cf. Dullien1992). By performing measurements in this
FIG. 6. Non-dimensional apparent permeability of theEPS material. Triangles illustrate the permeability measure-ments conducted at too low Reynolds numbers. The validrange of applicability of Darcy’s law is marked as circles.The diamonds denote a too high flow rate where the inertiaeffects occur, cf (Dullien 1992).
WOOD AND FIBER SCIENCE, JULY 2006, V. 38(3)6

range, the equipment can be validated by com-paring results to theoretically derived expres-sions for permeability. One such expression thathas been successfully validated with experi-ments is the one derived by Rumpf and Gupte(1971):
K =d2 � �s
5.5
5.6 � S, (10)
where d is the diameter of the spheres, �s is theporosity of the spheres, and S is a shape factorequal to one for a narrow distribution of diam-eters and equal to 1.05 for wider ones. Setting Sat 1.0, being the most appropriate presumptionfor the bed of spheres, yields a fit to the mea-sured permeability, (cf. Fig. 7).
Permeability of fiber mats
In order to evaluate the equipment for fibermats, the permeability was measured as a func-tion of time and Reynolds number. Regardingthe function of time, the permeability was prac-tically the same when the measurements werecarried out with more than one year’s interval ontwo different batches. The batches were formedand degenerated at the specific day when the
measurements were conducted, (cf. Fig. 8 andTable 1). This indicates that the permeabilityequipment is stable, and the procedure of form-ing the fiber mat has been similarly performed,i.e. the systematical errors have the same influ-ence on the permeability measurements on thedifferent fiber mats. A direct comparison be-tween the permeability measurements gives amaximum deviation of less than 8%. Unlike thepermeability measurement on spheres, the per-meability on fiber mats was unaffected by theReynolds number in the measured flow interval,(Fig. 9), i.e. Darcy’s law is due to that valid. TheReynolds number for the gas flowing throughthe fiber mat was defined in a similar procedureas for the EPS material, (cf. Eq. 9). The charac-teristic length scale was set at the average fiberdiameter obtained from the PQM measurement.
Results of the measured permeability for thefiber mat in the in-plane and in the out-of-planedirection are given in Fig. 10. It is shown that thepermeability of the spruce fiber mats has an an-isotropic behavior at low porosity as outlined byHåkanson et al. (2005) for similar material. In
FIG. 7. Comparison between measured permeabilityvalues of bed of EPS spheres and a theoretical model pro-posed by Rumpf and Gupte (1971), Eq. (10).
FIG. 8. Comparison between measured non-dimensionalpermeability of spruce fiber mats generated at different mo-ments. The materials were degenerated and formed at thetime just before each of the measurements.
Pettersson et al.—PERMEABILITY OF DRY FIBER MATS 7

order to find the level of anisotropy, the mea-sured permeability was fitted to the followingempirical equation, similar to the equation foundby Koponen (1998) for pulp suspensions:
k = D2 �C1
�e�C2��1−�t�� − 1�C3, (11)
where C1, C2 and C3 are empirical constants forthe wood fiber mats, (cf. Table 1), �t is the total
porosity of the fiber mat, and D is the diameterof the fiber. The percentage difference betweenthe in-plane and out-of-plane permeability is il-lustrated in the right-hand axis in Fig. 10. Themeasurement at high porosity should give thesame permeability since the fiber mat is formedin a procedure where the fibers are more or lessrandomized. Even though the forming of the fi-ber mat was performed in a similar procedure,an oriented fiber mat could have occurred, sincethe first permeability value was determined at alower porosity level than the actual forming one.At lower porosity, the difference between thein-plane and out-of-plane direction is around40%. A re-arranged fiber mat from a random toan oriented structure could explain the differ-ences in the results. If so, the differences shouldgo towards an asymptotic relationship since thepermeability is solely dependent on the geom-etry of the material (Scheidegger 1972). Thegeometrical dependency of the permeability isrelated to the square of a typical length scalesuch as the particle diameter. If the material isrearranged from a randomized to an orientatedfiber mat structure, the typical length scale in theflow direction would change. Consequently, theratio of the permeability in out-of plane and in-plane direction would go towards an asymptoticvalue.
CONCLUSIONS
A method has been developed with which thegas permeability of fiber mats can be measured.The equipment was successfully validated with aporous bed consisting of polymer spheres fol-lowing the results given by Rumpf and Gupte(1971). With the spheres, it was shown that theflow follows Darcy’s law in an intermediaterange of Reynolds numbers approximately be-tween 3 and 12. At higher Reynolds numbers,the apparent permeability decreased, which canbe related to inertia effects. At lower Reynoldsnumbers, the increased permeability can be ex-plained by the Knudsen effect, as pointed out byBear (1972) and Scheidegger (1972) or by ex-perimental errors.
None of these phenomena were observed in
FIG. 9. Non-dimensional permeability for the measuredfiber mats divided by the porosity. A least square fit of theplotted data illustrates the trend of each group respectively.The experimental data were collected in groups of differentvalues of porosity where the deviation in each group isillustrated in the legend. The graph shows that the perme-ability for the fiber mat is independent of the flow rate in themeasured range, i.e. no inertia effects.
TABLE 2. The empirical constants for the permeabilitymodel valid for the fiber mats depicted in FIG. 10 and theR2 value of the fitted modes.
Permeability model C1 C2 C3 R2
Spruce fiber; out-of-planedirection 0.148 8.168 1.691 0.948
Spruce fiber in-planedirection 0.414 15.259 0.981 0.979
WOOD AND FIBER SCIENCE, JULY 2006, V. 38(3)8

the fiber mat measurements. Regardless of thefiber volume fraction, the permeability was notinfluenced by Reynolds number at the conditiontested. The level of the measured fiber mat per-meability was about three levels of magnitudelower to two times higher than the measuredpermeability of the bed of spheres.
As final quality control of the method, thepermeability of fiber mat produced in the sameburnisher equipment was measured but sepa-rated by an interval of more than one year. Thepermeability of these fiber mats had practicallythe same permeability versus porosity relation-ship. This finding really ensures us that themethod has been valid for all experimental se-ries.
The permeability experiments for the in-planeand out-of plane direction indicated that the dis-tribution of fibers at high porosity is orientedmore or less randomly. A hypothesis is that thecompression of the fiber mat forces the fibers tore-arrange from a random to an oriented struc-ture. The structural changes inside the fiber mat
result in a network with an anisotropic behavior,which seems to be the case in the low porosityregion. Such behavior is outlined elsewhere (Hå-kanson et al. 2005) for a similar material.
In summary, the method developed is reliableand seems to produce results with high quality.This encouraged us to expand the experimentalstudy and deepen the analysis in order to presenta model of the de-aeration of the belt-press in aforthcoming paper.
NOMENCLATURE
A � The cross-sectional area [m2]C1, C2, C3 � Empirical constants for the perme-
ability model valid for fiber matsD � Fiber diameter [m]d � Sphere diameter [m]F � Applied force [N]h � Sample thickness [m]K � Intrinsic permeability [m2]k � Parameter in Forchheimers formu-
lation [m2]
FIG. 10. Non-dimensional plot of measured permeability on spruce fiber mats. Data points are from measurementperformed in in-plane and out-of-plane direction. The permeability model described in Eq. (11) has been used to determinethe percentage difference between the out-of-plane and in-plane differences. The empirical constants are given in Table 2.
Pettersson et al.—PERMEABILITY OF DRY FIBER MATS 9

m � Mass flow of the fluid [kg/s]p � Air pressure [Pa]R � Gas constant (air as an ideal gas R
� 287 at T � 300 K) [J/kg K]r � Roundness value of the spheresS � Shape factorT � Temperature of the gas [K]V � Volume [m3]w � Basis weight of fiber sample [kg/
m2]x � Measurement direction in the per-
meability equipment [m]
Greek
� � Parameter in Forchheimers formu-lation [1/m]
� � Total porosity of the measuredmaterial
μ � Dynamic viscosity [Pas]� � Density of the specific material
[kg/m3]�b, � Bulk density of fiber mat [kg/m3]�c � Bulk density of spheres [kg/m3]v � Superficial fluid velocity [m/s]
Index
c � cavityf � solid, i.e. fiber wallg � air
lu � lumens � spherest � fiber mat
REFERENCES
BEAR, J. 1972. Dynamics of fluids in porous media. Ameri-can Elsevier, New York, NY.
BELKACEMI, K., AND A. D. BROADBENT. 1999. Air flow
through textiles at high differential pressures. TextileRes. J. 69(1):52–58.
BOUAZZA, A., AND T. VANGPAISAL. 2003. An apparatus tomeasure gas permeability of geosynthetic clay liners.Geotextiles and Geomembranes 21:85–101.
BUNTAIN, M. J., AND S. BICKERTON. 2003. Compression flowpermeability measurement: A continuous technique,Elsevier Science Composite, Auckland, New Zealand.Part A 34:445–457.
DULLIEN, F. A. L. 1992. Porous media: Fluid transport andpore structure, Academic Press, San Diego, CA.
HÅKANSON, J. M., S. TOLL, AND T. S. LUNDSTRÖM. 2005.Liquid permeability of anisotropic fibre webs. TextileRes. J. 75(4):304–311.
KOPONEN, A. 1998. Simulations of fluid flow in porous me-dia by lattice-gas and lattice-boltzman method. ResearchReport 5. Department of Physics, University of Jyväs-kylä, Finland.
LU, W. M., Y. P. HUANG, AND K. J. HWANG. 1998. Methodsto determine the relationship between cake properties andsolid compressive pressure. Tamsui. Elsevier. Separationand Purification Technol. 13 1998:9–23.
LUNDSTRÖM, T. S., B. R. GEBART, AND E. SANDLUND. 1999.In-plane permeability measurements on fibre reinforce-ments by the multi-cavity parallel flow technique. Poly-mer Composites 20:146–154.
———, R. STENBERG, R. BERGSTRÖM, H. PARTANEN, AND P.A. BIRKELAND. 2000. In-plane permeability measure-ments: A Nordic round-robin study. Composites: Part A31:29–43.
RUMPF, H., AND A. R. GUPTE. 1971. Chem. Ing. Tech.43(6):367–375.
SCHEIDEGGER, A. E. 1972. The physics of flow through po-rous media, University of Toronto Press, Toronto,Canada.
SULLIVAN, R. R., AND K. L. HERTEL. 1940. The flow of airthrough porous media, J. Appl. Physics 11:761–765.
THOMPSON, P. A. 1972. Compressible-fluid dynamics. Mc-graw-Hill Book Company, New York, NY.
VOMHOFF, H., AND B. NORMAN. 2001. Method for the inves-tigation of the dynamic compressibility of wet fibre net-works. Nordic Pulp Paper Res. J. 16(1):57–62.
WIKSTRÖM, T., AND A. RASMUSON. 1998. Yield stress of pulpsuspensions. Nordic Pulp Paper Res. J. 13:243–250.
WHITAKER, S. 1996. The Forchheimer Equation: A theoret-ical development. Transport in Porous Media 25:27–61.
ZHU, S., H. R. PELTON, AND K. COLLVER. 1995. Mechanisticmodelling of fluid permeation through compressible fiberbeds. Chemical Eng. Sci. 50(22):3557–3572.
WOOD AND FIBER SCIENCE, JULY 2006, V. 38(3)10

Paper II


1
Modeling of the Pressure Distribution in a Belt Press duringManufacturing of Fiberboards
Patrik Pettersson*, PhD student, T. Staffan Lundström† , Professor,Tomas Wikström*, PhD and Elianne Wassvik† , PhD Student
*Metso Paper Sundsvall. SE-851 94 Sundsvall, Sweden†Division of Fluid Mechanics, Luleå University of Technology,
SE-971 87 Luleå, Sweden
Abstract
When forming fiberboards a large amount of air is evacuated from the dry fiber mat and thefibers become subjected to forces generated by the flow. If the forces become too high thefiber mat will burst and the process will be stopped resulting in economical losses. A modelfor the pressure field during the pressing has been derived, by starting from first principles.From this activity it has been shown that the velocity of the belt can be increased as long asthe geometry of the press or the viscosity of the penetrating fluid are altered in a prescribedmanner. The pressure distribution will be unaffected by variations to the basis weight of thefiber mat as long as it is matched with a shift to the density of the fibers. Furthermore, byderiving the pressure field as a function of boundary conditions it is shown that minorvariations to the pressure at the nip may result in huge differences of the pressure at theentrance of the press. In a validating procedure it is, finally, shown that the modelparameters can be adjusted in a physical reasonable way to get acceptable agreement withexperimental data.
Introduction
During the final stage of manufacturing of fiberboards, a fairly thick mat of looselyentangled fibers is compressed to often less than a tenth of its original thickness in a beltpress. Consequently, a large amount of air must be evacuated from the mat and the fibersbecome subjected to a force generated by the flow. This force is in most cases balanced bythe entanglement of the fibers and the friction between fibers and belts. However, it hasbeen shown that if the speed of the network through the belt becomes too high the fibernetwork will burst and the process will be stopped. This is a problem to overcome sinceincreasing the speed through the belt implies a higher overall efficiency of the process. Bystarting from first principles we will therefore derive models for the pressure field duringthe pressing.Multiphase flow, as the one described above, exists in several areas including ground waterflows, reservoir engineering, oil recovery, paper-making and composites manufacturing.The flow field is often very complex to describe but in some cases rather simplerelationships can be used. When one of two phases is a viscous and incompressibleNewtonian fluid and the other is a stationary solid, Darcy's law applies. The now classic lawstates that the rate of fluid flow is proportional to the pressure gradient in the fluid, and
2
holds true for low Reynolds number flow. The constant of proportionality involves theviscosity of the fluid and the permeability, which is a property of the porous medium itself.The permeability is thus a measure of how easily a Newtonian fluid will flow through theporous material (Bear 1972). Air flow through a porous media does not generally followDarcy’s law. A recent study, Pettersson (2006), shows, however, that the law works verywell for flow through fiberboard mats as long as Reynolds number is sufficiently low, i.e.less than about 2. Studies on the flow field in a belt press has (to the authors' knowledge)only been published in a few cases. However, the process has some similarities to the flowthat takes place in a press nip during dewatering of paper (Wahlström 1960); (Asklöf et al.1964) and (Kershaw 1972). A brief review of early models derived in this area tells us thattwo main methodologies have been applied considering the in-plane flow in the carrying feltand the transverse flow through the paper sheet, respectively (El-Hosseiny 1991). The feltmodels presented are invariably based on Darcy’s law and several are one-dimensional. Inmore up to date studies such models are developed to deal with two-dimensional multiphaseflow (Kataja et al. 1992) and (Zahrai et al. 1997). The derived equation then becomes toocomplex to allow for straight analysis and numerical methods must be applied to solve thephysical parameters. High-pressure gradients may furthermore result in a densification ofthe fiber mat, (Zhu et al. 1995) and (Lobosco et al. 2005). This phenomenon is, however,most important for flow transverse to the fiber mat where the pressure gradient is solelybalanced by the stiffness of the fiber mat. For in-plane flow, movements of the fiber mat arehindered by friction forces towards the carrying belt, felt or wire which will considerablyreduce the risk for densification. As stated above we will here derive analytical expressionsfor two-dimensional flows through a belt press. The technique will be similar to those usedto obtain the felt models but the geometry, the fluid and the boundary conditions will differ.The models derived are validated with full-scale experiments and are used to study howsome parameters influence the pressure distribution in the press. Finally, some conclusionsare presented.
Theory
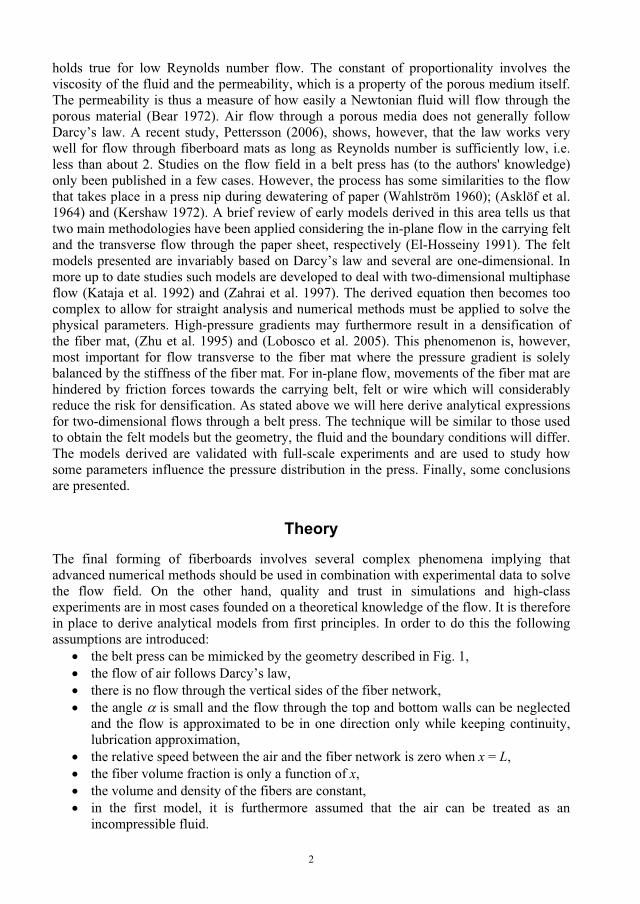
The final forming of fiberboards involves several complex phenomena implying thatadvanced numerical methods should be used in combination with experimental data to solvethe flow field. On the other hand, quality and trust in simulations and high-classexperiments are in most cases founded on a theoretical knowledge of the flow. It is thereforein place to derive analytical models from first principles. In order to do this the followingassumptions are introduced:
the belt press can be mimicked by the geometry described in Fig. 1,the flow of air follows Darcy’s law,there is no flow through the vertical sides of the fiber network,the angle is small and the flow through the top and bottom walls can be neglectedand the flow is approximated to be in one direction only while keeping continuity,lubrication approximation,the relative speed between the air and the fiber network is zero when x = L,the fiber volume fraction is only a function of x,the volume and density of the fibers are constant,in the first model, it is furthermore assumed that the air can be treated as anincompressible fluid.

3
FIG. 1. Simplified 2D-geometry of belt-press.
Now the one-dimensional form of Darcy´s law can be applied according to:
AQ
KU
Kxp (1)
where U is the superficial velocity, the dynamic viscosity of the fluid, K the permeability,Q the flow rate, A the total area perpendicular to the flow and the gradient on the left handside is the pressure drop that is to be derived. The area, A, is simply given by:
bL
xhhhhbA 211 (2)
where b is the width of the belt and the rest of the parameters are defined in Fig. 1. For anincompressible fluid the relative flow rate is directly given from the reduction in volumeexperienced by the fiber mat. Then, by applying the assumed boundary condition at theminimum height h2, the flow rate may be expressed in terms of geometrical parameters andthe horizontal velocity component of the belt V, as:
121max LxbVhh
LxLQQ . (3)
The pressure gradient is now simply given by combining (1), (2) and (3) to yield thefollowing relationship:
L
xhh
Lx
hh
KV
xp
12
12
11
11(4)
Hence, with the assumptions made, the pressure gradient in every position x is a directfunction of the velocity V. It now remains to choose a model for the permeability K. Themost frequently used one is the Cozeny-Karman equation. The equation does not haveproper micromechanical basis. However, it has turned out that it can portray K for a numberof materials as a function of fiber volume fraction f, fiber radius R and a non-dimensionalshape constant k in the following way:
Cf
fkRf
fK 2
32
2
3 11 . (5)
The constant C, having dimension [m2], is introduced to simplify upcoming discussions.The fiber volume fraction may in its turn be expressed in terms of the basis weight, w andthe density of the fibers, f according to:

4
.fh
wf (6)
As previously stated these equations are valid for incompressible fluids. Let us now insteadassume that the fluid follows the perfect gas law under isothermal conditions. The density ofthe gas then becomes a direct function of the local pressure. By furthermore following asmall volume of the fiber mat as it moves through the press and defining the mass flow overits boundaries, the subsequent equation results:
xhpup
LhhV 21 (7)
where u is the true homogenised velocity inside the fiber mat. By continuity it is also easilyrealized that u = U, cf. Eq. (1). By usage of this expression and Eq. (1), Eq. (7) now reads:
xx
pKh
xxppKh
pL
hhV
2
21
21 (8)
or by rearranging the terms:
xx
pKh
pLhh
V
2
21 12 . (9)
The term on the left-hand side is independent of x while the one on the right-hand side isstrongly non-linear since all parameters involved are functions of x. There is no obviousanalytical solution to this apparently neat expression and the equation must be solved withnumerical methods. Before doing that, let us examine Eq. (9) by including Eqs. (5) and (6):
x
xp
wh
phLhh
wCV
f
f
23
1
1
2 111
12 . (10)
Alterations to the parameters in the ratios on the left-hand side will only affect the result ifrespective ratio is changed with one exception h1. This height sets the scale of the problemand appears as well as a sole term in the right-hand side of the equation. Hence according tothe derivation presented the pressure field will be unaffected as long as the followingequalities are satisfied:
IIIIII
CLV
hh
CLV
hh
1
2
1
2 11 (11a)
andII
fI
f
ww , (11b)
where the superscripts I and II denote initial and modified case.

5
Verification and numerical results
In order to verify the numerical procedure simulations were performed for a reference case,Table 1, where the material used had been processed at up-to-date conditions.
TABLE 1. Parameters for the reference case.Geometry and conditions Material parametersh1 0.7 m
114.2 kg/m2
h2 0.055 m f 350 kg/m3
L 7.54 m C 7.4E-13 m2
V 0.5 m/s 1.0E-5 Pas
The simulations were carried out by usage of the subroutine bvp4c in Matlab 7.0.1. Thissubroutine is specially designed for boundary value problems and uses collocation withaccuracy of the fourth order, (Kincaid and Cheney 2002). An initial mesh of 200 points wasused but the subroutine continuously adapts the mesh to the solution. Also 100 and 400points were tested as initial guess for one of the cases. The same results were given whichverifies the numerical solution. To start with it is appropriate to study how variations inboundary conditions influence the results since these are not known beforehand. Notsurprisingly, the spatial pressure distribution was generally strongly dependent on theboundary conditions, Fig. 2, where the inlet boundary condition was altered. However, forlow inlet pressures the simulated results approached each other as the fibers moved into thewedge implying that the maximum pressure at the outlet has only a weak relation to the inletpressure.
x [m]0 2 4 6 8
p [
Pa]
1e+5
1e+6
1e+7
1e+8pin = 0.1 MPapin = 1.0 MPapin = 10 MPapin = 100 MPa
FIG. 2. Pressure as a function of position x and inlet boundary condition.
Following this observation and instead specifying the pressures at the outlet it can be shownthat minor variations to the outlet pressure may give devastating variations to the pressurenear the inlet, Fig. 3. In reality, such behavior implies that small variations to thepermeability of the fiber mat may give a noteworthy pulsating flow at the entrance of thebelt.

6
x [m]0 2 4 6 8
p[P
a]
1e+5
1e+6
1e+7
pout = 10.0 MPapout = 6.55 MPapout = 6.50 MPapout = 6.45 MPa
FIG. 3. Pressure as a function of position x and outlet boundary condition.
An additional verification process including two simulations was performed. By using theresults of the outlet pressure in the first simulation, where the inlet pressure was set, abackward calculating of the inlet pressure could be performed. The outcome of thesimulation returned to the same inlet value as was set for the first simulation. The pressuregradient, in its turn, responded dramatically to variations in inlet pressure for relatively lowpressures until its maximum was reached. For high pressures and close to the end of themodel the pressure gradient became independent of the inlet boundary condition, Fig. 4. Infact, the solution approached the one obtained for the incompressible fluid.
x [m]0 2 4 6 8
dp/d
x
[Pa/
m]
1e+4
1e+5
1e+6
1e+7
pin = 0.1 MPapin = 1.0 MPapin = 10 MPapin = 100 MPa
FIG. 4. Pressure drop as a function of position x and inlet boundary condition.
This verifies the numerical procedure, Fig. 5. Consequently, it seems like the numericalmodel used describes the derived equations in a proper way. It now remains to weight themodel against experiments to scrutinize the approximations made.

7
x0 2 4 6 8
devi
atio
n fro
m m
odel
1 %
0.01
0.1
1
10
100
1000
10000
pin = 0.1 MPapin = 1.0 MPapin = 10 MPapin = 100 MPa
FIG. 5. Percentage deviation from Eq. (4) regarding the pressure gradient. Whenincreasing the inlet pressure the solution approaches the incompressible theory.
Validation with full-scale experiments
Measurement of the spatial pressure distribution in a full-scale press has been carried out.The geometry of the press is in overall similar to the ideal model geometry used to deriveEq. (9) but differs as to the detailed geometry; cf. Figs. 1 and 6.
3°
503 320 320
r
Frame 1 Frame 2 Frame 3
Inlet
r A
1947(mm)
Heating plate section
A
3
1°3° 3°
1 2
Steel belt
Roller, r = 800 mm
FIG. 6. A sketch of the entrance of the press. The simulations were conducted from theinlet up to frame 3.
The pressure within the fiber mat is obtained by a press monitoring system called PressMan.It is a data acquisition system for in-situ monitoring of press variables as the mat moves intothe press. The dimensions of the logger used are: width 48 mm, length 385 mm, andthickness 9.5 mm, cf. Fig. 7. In this case a specially designed probe was attached to thelogger for contemporaneous measurements of the pressure and temperature inside the matduring pressing. The probe tip consists of a single tube and various probe lengths can beused in order to measure the pressure as a function of in-plane position perpendicular to theproduction direction. Measurements were performed with three different probe lengths, 350,600, 850 mm.

8
Temperature
A channel to build up air
Impermeableplates
Fiber mat
Probelength
Logger
FIG. 7. Schematic sketch of the Pressman equipment. The logger is attached to the centerof the edge of the fiber mat and follows the fiber mat through the entire press.
Results from the measurements indicate that the measurement is working as expected. Forthe measurements conducted on probe 850 mm a highest overall pressure was reached andcorresponding measurement conducted with a probe length of 350 mm, placed closest to theedge showed the lowest pressure. The panels were produced with fibers from poplar withinitial moisture content of 10 %. The measurements were repeated and showed similarresults. Results from the two-dimensional simulations were compared to the measurementconducted with a tip length of 850 mm, Fig. 8. At the entrance of the press the probe tip waspositioned at the center of the fiber mat height, the logger was attached to the probe andfollowed the mat through the entire press, and was subsequently removed at the outfeed ofthe press. The logger can store 1022 data readings, and the logging frequency can beselected in the interval 0.1-10 Hz. A higher resolution of the entrance is reached bychoosing a higher frequency. Not surprisingly the pressure increased as the fiber bed movedinto the press, Fig. 8 where the experiments are presented from the center of the cylindersup to frame 3; cf. Fig. 6.
Position in press [m]
0.0 0.5 1.0 1.5 2.0 2.5 3.0
p [
Pa]
0
5e+5
1e+6
2e+6
2e+6
r f= 800 kg/m3
r f= 1000 kg/m3
r f= 1200 kg/m3
r f= 1400 kg/m3
Experiments
FIG. 8. Validation as a function of position in press and density of the fibers.
For the validation, it is necessary to know the permeability of the fiber bed moving throughthe press, Eq. (9). This quantity is here measured as a function of fiber mat density with thesystem presented and validated in Pettersson et al. (2006). To be able to fit Eq. (5) to thedata obtained, in order to derive the constant C, the relation between packing density andeffective porosity of the hollow and encapsulated fibres must, however, be known. Since thefibers are porous themselves, Fig. 9, their density can increase as the fiber bed iscompressed.

9
FIG. 9. Schematic picture displaying fiber geometry of the internal structure of pinewoodchip in cross-section. Published with permission from Staffan Palovaara, SCAResearch.
Let us therefore determine C for four values of the fiber density: 800, 1000, 1200 and 1400kg/m3 all located between the bulk density of an undeformed fiber of about 450 kg/m³ andthe density of the fiber wall, 1550 kg/m³, Fig. 10 and Table 2.
TABLE 2. Results from the curve fitting to the permeability measurements.
f[kg/m3]
C * 1012
[m2] R²
800 3.78 0.981000 1.78 0.951200 1.03 0.921400 0.67 0.90
f
0.1 0.2 0.3 0.4 0.5
log
K
-11.8
-11.6
-11.4
-11.2
-11.0
-10.8
-10.6
-10.4
-10.2
-10.0
f = 800 kg/m3
f = 1000 kg/m3
f = 1200 kg/m3
f = 1400 kg/m3
f = 800 kg/m3
f = 1000 kg/m3
f = 1200 kg/m3
f = 1400 kg/m3
FIG. 10. The discrete points are experimental data on permeability as a function of fibervolume fraction and density of the fibers. The curves are the correspondingfittings to Eq (5).
Knowing C and the geometry of the belt and the processing condition, the pressuredistribution can be derived with Eq. (9) as long as the pressure is known at the inlet or at theoutlet. There is no obvious candidate so let us just set atmospheric pressure 0.1 MPa at theinlet of the model, Table 3.

10
TABLE 3. Parameters for validation.Geometry Material parametersh1 0.09 m
114.4 kg/m2
h2 0.0192 m f 800 - 1400 kg/m3
L 3.09 m C 7.4E-13 m2
V 0.125 m/s 1.8E-5 Pas
By doing this, the validation shows that the slim model proposed captures the centralcharacteristics of the pressure inside the fiber network but, that it gives considerably highervalues than what is obtained from experiments regardless of the density of the fibers, Fig. 8.There are three major reasons to this. The first explanation is simply that, in reality, the aircan also escape through the vertical sides of the press. Secondly, the belts have a highertemperature than the fiber mat. From being 80°C at the entrance the temperature increasesas the belts enter the heating plate section and reaches about 150°C at frame 3, Fig. 6. Sincethere is a flow of air through the bed it is likely that the heat is continuously transported intothe fiber bed affecting the glue material, lignin, inside the fibers which has a softeningtemperature of about 80-120 °C. This may result in a gradient in compliance of the fibermat and possibly a larger densification in the areas closest to the belts. If this is true, thepermeability will be considerably higher in the core of the fiber mat resulting in an overallhigher relative flow also in the main flow direction (Bear 1972). Thirdly, it is likely that fwill increase with f. The open spaces between the fibers will therefore not be condensed asfast as predicted for solid fibers. This may result in a lower reduction in permeability thanwhat is obtained from the curve fitting to the measured data, which was done for rathermodest fiber volume fractions. The last two reasons imply that the permeability is in overallhigher than what is obtained from the permeability measurements. Hence it is reasonable toset higher values on C than what is obtained from the permeability measurements. This isdemonstrated by increasing the value of this parameter with five and ten times for f = 1000kg/m3. The modeled pressure now approaches the experimentally derived ones, Fig. 11.
Position in press [m]
0.0 0.5 1.0 1.5 2.0 2.5 3.0
Pre
ssur
e
[Pa]
1e+5
2e+5
2e+5
3e+5
3e+5
4e+5
4e+5
Cnew = 10 * Cold ( f = 1000 kg/m3)
Cnew = 5 * Cold ( f = 1000 kg/m3)Experiment
FIG. 11. Comparison between experiments and pressure distribution when the fittingparameter is increased according to the relationships stated in the legend.

11
Conclusion
A model for the flow through a fiberboard belt press has been derived. By scrutinizing thederived equations it is shown that geometrical parameter, the velocity of the belt and theviscosity of the penetrating gas can be altered without affecting the pressure distribution,Eqs. (10-11). The pressure will also be unaffected by variations to the basis weight of thefiber network as long as it is matched with a shift to the density of the fibers. By derivingthe pressure field as a function of boundary conditions, it is shown that minor variations tothe pressure at the nip may result in huge differences of the pressure at the entrance of thepress which may give a pulsating flow at the end. In a validating procedure, it is shown thatthe model parameters can be adjusted in a physical reasonable style to get reasonableagreement with experimental data. It is, however, likely that modeling of the full 3D-flow,adding the temperature field and better describe the density of the fibers would sharpen ourpredictions even further.
Acknowledgement
The authors acknowledge the Swedish Research Council for financially backing-up thiswork.
12
Nomenclature
p Air pressure [Pa]U Superficial fluid velocity [m/s]u True fluid velocity inside the fiber mat, U* , [m/s]R Radius of the fiber [m]
Density of the fluid [kg/m³]K Permeability [m²]
Dynamic viscosity [Pas] Angle between the top and bottom wall in the press[rad]
x Distance in machine direction counted from the entrance[m]L Length of the model, [m]Q Flow rate of air, [m³]A Cross sectional area of the fiber mat, [m²]h Height of the fiber mat, [m]b Width of the press, [m]V Horizontal velocity of the belt press, [m/s]R Radius of the fibers,[m]k A non-dimensional shape constantC Constant in the Cozeny-Karman equation, a product ofk*R, [m²]w Basis weight, [kg/m²] Effective porosity
f Effective fiber volume fractionIndex1,2 Inlet and outlet respectivelyf fibersSuperscriptI, II Initial and modified case respectively
References
ASKLÖF, C. A., K. O. LARSSON, J. LINDEROTH,P. B. WAHLSTRÖM (1964). "Flow conditionsin a felt in a plain press nip." Pulp and Paper magazine Canada: 246-250.
BEAR, J. (1972). Dynamics of fluids in porous media. New York, Dover Publications Inc.EL-HOSSEINY, F. (1991). "Mathematical modeling of wet pressing of paper." Nordic Pulp
Paper Res. J. 1: 30-34.KATAJA, M., K. HILTUNEN,J. TIMONEN (1992). "Flow of water and air in a compressible
porous medium. A model of wet pressing of paper." J. Phys. D 25: 1053-1063.KERSHAW, T. N. (1972). "The three dimensions of water flow in press felts." Tappi J 55(6):
880-887.KINCAID, D.,W. CHENEY (2002). Numerical Analysis: Mathematics of Scientific
Computing. Third Edition. Brooks/Cole.LOBOSCO, V., B. NORMAN,S. ÖSTLUND (2005). "Modelling of forming and densification of
fibre mats in twin-wire formers." Nordic Pulp Paper Res. J. 20(1): 16-23.

13
PETTERSSON, P., T. S. LUNDSTROM, T. WIKSTROM (2006). "A method to measure thepermeability of dry fiber mat." Wood Fiber Sci. 38(3): 10.
WAHLSTRÖM, P. B. (1960). "A long term study of water removal and moisture distributionon a newsprint machine press section part 2." Pulp and Paper magazine of Canada:418-451.
ZAHRAI, S., F. H. BARK,D. M. MARTINEZ (1997). On the fluid mechanics of Twin-WireFormers. Department of Mechanics. Stockholm, Royal institute of Technology: 32.
ZHU, S., R. H. PELTON,K. COLLVER (1995). "Mechanistic modelling of fluid permeationthrough compressible fiber beds." Chem. Eng. Sci. 50: 3557-3572.


Paper III


1
A method to measure the permeability of pulp suspension at highbasis weights
Patrik Pettersson*, PhD student, Tomas Wikström*, PhD and T. Staffan Lundström†,Professor
*Metso Paper Sundsvall, SE-851 94 Sundsvall, Sweden†Division of Fluid Mechanics, Luleå University of Technology, SE-971 87 Luleå, Sweden
Abstract
During the formation of pulp to paper, a large amount of water is added to dilute the pulp inorder to obtain a homogenous material. This water can be mechanically and/orthermodynamically removed by high energy consuming units. The pulp suspension flowsthrough various process equipment that influences the pulp suspension by changing itsproperties before the pulp suspension finally becomes paper. It is important to understandthe mechanisms behind the transport path of water in order to reduce the costs and toincrease the production rate of pulp and paper. In order to describe the flow path and thecorresponding pressure drop in dewatering equipments in a pulp mill, the resistance to flowmust be known. For networks with complex geometry, a reliable method is to measure theresistance to flow at discrete points and to adapt suitable resistance models to the resultsobtained.The objective of this work is to investigate how the history of pulp suspensions affects theirpermeability. An equipment for measuring permeability of various pulp suspensions at highbasis weights is consequently developed and validated. Then the permeability of a numberof virgin pulp species is measured. Some of the suspensions are then circulated in a closedflow loop and the permeability is measured as a function of number of loops. The resultsfrom the two separate tests showed that a basis weight variation and a different processtreatment of the pulp suspension did not influence the permeability.
Introduction
During the formation of pulp to paper, a large amount of water is added to dilute the pulp inorder to obtain a homogenous material. The water is then mechanically and/orthermodynamically removed by high energy consuming units. To reduce the costs and toincrease the production rate of pulp and paper overall it is important to understand themechanisms behind the transport path of water. Removal of water has during decades beenan important topic to understand. Researchers have studied the effect of compressing thefiber network towards de-watering plates with and without felts. Wahlström (1960) andAsklöf et al. (1964) studied the removal of water by conducting a press study with felts andmany of their conclusions are still valid assumptions. The main objective of their work wasto investigate the factors governing the water removal and moisture distribution of a suctionpress. The governing material parameters when considering removal of water are thepermeability and compressibility of the suspension (Ingmansson et al. 1959) and (Vomhoff1998). In addition to the solid load the fiber network is exposed to a drag force generated bythe flow. The magnitude of this force is dependent upon how easy the fluid can flow

2
through the network, which is commonly described by the permeability. The solid loadresponse, in its turn, is often expressed with the compressibility of the fiber network. Thecompressibility effect of the fiber network becomes more pronounced when the surfaceweight increases. Higher surface weights are more likely found in the pulp mill, e.g.washing, rather than on the paper machine. For a quantitative analysis of the compressionpart of the web, the capillary and rheological properties must be known. A thoroughknowledge of the capillary structures of the web at different degrees of compression is thusnecessary for proper understanding of pressing.In order to describe the flow of water and the corresponding pressure gradient in a press nipin the pulp mill, the resistance to flow must be determined. For networks with complexgeometry, a reliable method is to measure the resistance to flow at discrete points and to fitsuitable resistance models to the results. Measurements of the resistance to flow of porousmaterials are, however, not straight forward. To start with, water flow through porous mediadoes not always follow the Darcy's law. There are at least two possible reasons for this. i) Inmany cases the Reynolds number becomes too high and inertia effects must be considered.The inertia effect is usually dealt with by using the Forchheimers Equation (Whitaker 1996;Ingmansson and Andews 1963) that may be written:
2vvkx
pg , (1)
where p is the pressure, v the superficial velocity, the viscosity, k and are parameters ofthe porous media, and g the fluid density. If is set equal to zero, k becomes equal to thepermeability K and the Darcy's equation is found. Hence, in order to use Eq. (1), twomaterial parameters must be determined. ii) Besides inertia effects, the pressure drop causedby the flow rate may overcome the fiber mat stress; the fiber mat may deform. Thisphenomenon has been shown to result in a linear pressure velocity relationship up to acertain pressure difference, while above this pressure the velocity remains constant as thedriving pressure is increased (Belkacemi and Broadbent 1999), (Zhu et al. 1995).Several methods for the experimental assessment of the permeability tensor have beenproposed since the first experiments by Darcy, (Sullivan and Hertel 1940; Ingmansson et al.1959; Lindsay 1990; Gebart and Lindström 1996; Weitzenböck et al. 1997; Lundstrom et al.2000 and Lundström et al. 2002). Most of the methods are based on either of the twofundamentally different principles: i) parallel flow, by which the liquid is made to flow in acontrolled direction through the porous sample (the Darcy experiment). ii) radial flow, bywhich the liquid is injected at a “point” and flows freely in all directions (usually in aplane). Either of these principles may be applied in a variety of ways, e.g. by pumping theliquid by a constant flow rate or by a constant pressure drop. Parallel flow measurementscan be carried out under steady state conditions (Lundstrom et al. 2000). One drawback withthis method is the porosity and consequently the permeability may differ near the walls of the cell as compared to that in the bulk. Another drawback isthat errors in the permeability values are obtained if the flow is not in the main permeabilitydirections. Yet another approach for determining permeability and often applied to fibrousmaterial is to use dynamic compression equipment (Buntain and Bickerton 2003). Thefibrous network respond is known in these kinds of experiments and the permeability can bedetermined from the hydro-dynamical pressure drop according to the Tezaghi´s principle,(Vomhoff 1998; Ingmansson et al. 1959). However, one uncertainty in this kind ofexperiment is that the volume fraction in the suspension is not generally constant in the

3
dewatering direction (Zhu et al. 1995; Lu. et al. 1998), especially when considering basisweights found in pulp mills.Several permeability models for pulp suspension can be found in the literature, amongothers is the experimental work conducted by Lindsay (1990) and Vomhoff (1998). Neitherof them tested the permeability at basis weights of 1 kg/m² or higher even though Lindsay(1990) measured the permeability at a basis weight that was almost 10 times higher thanVomhoff (1998). The Kozeny-Carman equation Eq.(2) has been proven to give pooragreement towards pulp suspension especially at high porosity values;
23120 1K Sa (2)
where a is the Kozeny constant, equal to 5.55 for cellulose fibers, S0 is the specific surfaceand is the total porosity of the pulp suspension. Ingmansson et al. (1959) showed that theKozeny constant varies with the porosity for cellulose material and modified relationship (2)accordingly to the following expression:
132
2/3201 111SC CK . (3)
In this equation the empirical parameters C1 and C2, have the values 3.5 and 57 respectively.However, the porosity in their study was based on the free liquid porosity outside the fibers.This kind of approach is only valid in the low consistency area in an actual press sequence.In the high consistency region the fibers deform themselves and the porosity within thefibers decreases as well. Vomhoff (1998) and Lindsay (1990) do consider total porosity ofthe fiber suspension and their models are therefore valid through the total pressingsequence.In this work a permeability-equipment that is based on Darcy's set-up is validated withknown results on pulp suspension and a porous bed consisting of spheres. The permeabilityof beds of spheres has been modeled by Rumpf and Gupte (1971) yielding the followingexpression as long as Reynolds number, Re, is reasonable low. They showed that Darcy'slaw was valid for Re less than 10:
S5.6D
K5.52
ss . (4)
The permeability is given as a function of the diameter of the spheres D, the porosity of thebed s and a shape factor S where S = 1.00 for a narrow distribution and 1.05 for a widerdistribution. To demonstrate the capacity of the equipment, the effect of the history of thepulp suspension on the permeability is investigated for several pulp suspensions.
Material
Permeability measurements were carried out on a reference material being expandablepolystyrene (EPS) spheres and pulp suspension of three types of wood species: EucalyptusGlobulus, baled and re-pulped hardwood Kraft pulp that is named as BHK pulp. Mixedtropical hardwood, baled and re-pulped hardwood Kraft pulp that is named as BMTH. Thethird pulp specie was a mixture of Scandinavian spruce/pine; two different batches wereused: one never dried pulp suspension and the other one was a baled and re-pulped that arenamed as SBSK and SBBSK respectively. The pulps originating from Brazil, Indonesia, andSweden respectively. All tested pulps were fully bleached.

4
Reference material
The EPS material was provided by StyroChem located in Finland and has the followingadvantages as a reference material: i) Its permeability is in the same range as the fibernetwork at high porosity; ii) It is stable under testing conditions, and iii) Its permeability canbe estimated by analysis. The polymer is made of styrene containing pentane as a blowingagent. An image analysis was performed in order to estimate the diameter of the spheres byexamining them in a microscope connected to the software “Image pro plus”. The meandiameter of the spheres was determined to 0.62 mm with a resolution of about 47 pixels permm, Figure 1. The automatic categorization of single spheres was accomplished by setting athreshold value for the roundness of the spheres to:
4 where1.1R
2
s
s
AS
R (5)
In this equation Ss describes the perimeter and As denotes the cross-sectional area of thespheres, respectively. Hence, for a perfect spherical particle, the roundness value is 1.0.
1 cm
Figure 1. A part of the image used in the image analysis of the spheres. The length scale is10 mm. The areas that consist of too densely packed spheres deviate from aspherical shape and are excluded from the analysis by setting the roundnessvalue at 1.1.
The included particles in the analyses are close to be spherically (circular in the 2D image)shaped. Hence clusters of more than one particle were excluded in the analyses. Therobustness of this method was tested by changing the roundness value from 1.1 to 1.5. Theresult was that the maximum variation of the diameter of the spheres was only 0.8 %.Determination of the porosity can be performed by a variety of methods (Scheidegger1974). In this case the volume inside the cavity is known. The EPS material wasconsequently put into the cavity and the void volume was filled with water at roomtemperature. The specimen was stirred with a stick, enabling trapped air inside the specimento be removed while the cavity was filled up with water. The void volume was thenobtained by measuring the amount of water added to the cavity.
Pulp suspensions
The geometrical parameters of the fibers in the pulp suspensions were measured with acommercial image processing equipment kajaaniFiberLab, (2004), Table 1. The resolutionof the image obtained was about 1 m per pixel for determining the fiber width and 10 mper pixel for the length of the fiber. In addition a coarseness value and the weight per meterfiber, were estimated.

5
Table 1. Fiber properties, from the kajaaniFiberLab equipment.
TestNo.
Averagefiber
width,[ m]
Lengthweightedaverage
fiberlength[mm]
Weightweightedaverage
fiber length,[mm]
Arithmeticaverage
fiber length,[mm]
Coarsenessvalue,
[mg/m]
FiberCurl,[%]
ScandinavianSoftwood
KraftSBBSK
1 24.40 2.25 2.78 1.50 0.159 16.3
2 26.15 2.26 2.85 1.44 0.146 12.2ScandinavianSoftwood
Kraft SBSK 3 25.95 2.25 2.82 1.45 0.143 13.5
MixedTropical
HardwoodKraft BMTH
4 16.10 0.91 1.06 0.76 0.069 13.7
5 15.60 0.80 0.88 0.715 0.059 17.8EucalyptusGlobulus
HardwoodKraft BHK 6 15.60 0.80 0.88 0.715 0.060 17.5
The fiber length is defined as the true length of the fiber along the centerline.
As for the bed of spheres, it is important to determine the porosity of the pulp suspension.This is not straightforward since the fibers themselves are porous, Figure 2.
Lumen volume, Vlu
Fiber wallvolume, Vfw
Pulp suspension
Free liquid volume, Vfl
Figure 2. Fiber suspensions with porous cellulose fibers like tubes with internal holes. Thephotograph illustrates the thickness direction of a paper.
There are at least two approaches to determine the fraction pore space for a material withdouble scale porosity such as wood fiber suspensions. One is to only take into account thespace between the fibers and treat the pores within the fibers as solid material. Thisapproach is used by Wikström (2002); (Grén and Hedström 1967); (Ingmansson andAndews 1963) according to:
fllufw
lufwe VVV
VV1 (6)

6
where e stand for the effective porosity of the pulp suspension, the fiber wall volume isrepresented by Vfw, the free volume between the fibers by Vli, and the lumen volume insidethe fibers by Vlu. The different volumes are illustrated in Figure 2. The advantage of thisstrategy is that at high porosity the effective porosity describes the actual volume where thefluid will flow. However, in dewatering equipment the pulp suspension often reaches lowporosities and the fibers start to deform and the free volume outside the fibers decreasestowards zero. Consequently the approach is not usable at low porosity. In this case it isbetter to use the total porosity as suggested by Lindsay (1990) and Vomhoff (1998). Theporosity is then determined by the density method (Scheidegger 1974);
ft h
w1 , (7)
where w is the basis weight, h the thickness of the pulp suspension, and f the fiber walldensity. This equation for the porosity is from now on used in this work.
Experimental
To experimentally derive the permeability of the pulp suspension, a permeabilitymeasurement unit has been developed and designed for measurements of out-of-planepermeability. The cavity has an inner diameter and a maximum stroke length of 0.1 and 0.3m respectively.The equipment is designed to let a pressure driven flow of water pass through the specimen,in the vertical direction from bottom to top, Figure 3. The fluid is entering and leaving themeasuring cell through permeable walls and on each side of the permeable wallsdistribution plates have been placed.
Distributing platefor outgoing fluid
Permeablesteel plates
T Flowdirection
+-
D/P Cell
Q
Outputcontrol
Tempsonicpositionsensor
MTS
Floatingmagnet
Flowmeter
Temperaturesensor PT 100
Pulpsuspension
Distributing platefor incoming fluid
Figure 3. A schematic picture of the permeability measurement systemThe permeability measurements of the pulp suspension were conducted at stationaryconditions, i.e. a constant flow rate was applied through the pulp suspension while theheight of the cavity was held constant. The Re number was much less than unity, typicallyin the order of 0.0001. For the EPS spheres the measurements were conducted at as lowflow rate as possible with respect to the pressure drop, i.e. Re < 1.7.Since the permeability of the pulp suspension is strongly dependent of the porosity,additional measurements were performed by decreasing the thickness of the pulp pad. Thisprocedure was repeated until the lowest possible volume of the cavity was reached, with

7
respect to the limit of the pressure transducer or until the maximum load from the hydraulicpress that was used to compress the suspension was achieved.The permeability was determined by use of the Darcy's law by integrating Eq. (8) in theflow direction and by assuming a homogeneous porosity profile;
vKx
p , (8)
where v is the superficial velocity, i.e. the total flow rate divided by the cross sectional area, is the dynamic viscosity of the fluid, K represents the intrinsic permeability, and the
gradient on the left-hand side is the pressure drop of the fluid through the porous material.The results from the Darcy's law state a linear pressure velocity relationship as long asinertia effects can be neglected. This is true as long as Re, based on a characteristic lengthscale of the material is below unity.The fluid flow and its pressure drop over the web and the actual thickness of the web areregistered by a computer, Figure 3. The flow rate is measured with an electromagnetic flowmeter DS21 made by ABB. This sensor measures a flow rate between 0 - 2 dm³/min,corresponding to a superficial flow velocity inside the cavity of 0 - 4.2 mm/s and with anaccuracy of 1 % of the maximum reading. The pressure drop is measured with a differentialpressure gauge, Rosemount transducer model 1151 (range of 0-11 kPa 0.05 %) while thethickness of the pulp suspension is measured with a magnetostrictive position sensor, MTSsensors, a range of 0 - 0.3 m, 0.08 mm. The temperature of the incoming fluid wasmeasured with a PT 100 sensor with an accuracy of 1 %. The temperature was measured inorder to use the correct viscosity when deriving the permeability.In the measurement procedure the pressure drop over the pulp suspension, the flow throughit and its thickness are measured. A sensitivity analysis of how these parameters influencethe permeability of the pulp suspension results in a 1 to 1 relation, i.e. 1 % variation in eachof the mentioned variables gives 1 % change in the measured permeability. Thetemperature, in its turn, affects the permeability indirectly by the viscosity of the fluid, and afirst estimate is that an alteration of 1 % is influencing the permeability by 0.5 %. The totalestimated error from the measurements conducted on 1 kg/m² is about 7 % at a porosity of0.5.All pulps were re-pulped and prepared according to SS-EN ISO 5263-1:2004. After re-pulping, the suspension was dewatered in Büchner funnels to the desired consistency. Theamount of pulp corresponding to the desired surface weight was gently placed into themeasuring cavity.The flow loop consists of a pump, dewatering press, dilution step and a tank. The pulp wasdewatered to a porosity value of about 0.6. After the dewatering process the pulp suspensionwas re-pulped to a porosity value of about 0.95 and run repeatedly in the loop. The pulp wasremoved from the system after different numbers of circulation and permeability tests wereconducted.

8
Results
The measurements of the bed of spheres follow Eq. (4) as well as measurements previouslydone in another equipment by Pettersson et al. (2006), Figure 4. A maximum deviation of 6% from the theoretical models is obtained which can be regarded as a very good result sincethe theoretically derived permeability in itself is dependent on two independentmeasurements: porosity of the bed and the image analysis of the dimensions of the spheres,Eq. (4). In addition the total estimated error in these measurements was about 5 %.
1E-10
2E-10
3E-10
4E-10
0.32 0.33 0.34 0.35 0.36 0.37 0.38Porosity
K, m
²
Figure 4. Results from verification of the equipment ,(diamonds), compared with previousresults by Pettersson et al. (2006),(triangles) and the theoretical modeldeveloped by Rumpf and Gupte (1971), Eq. (4), (regression line).
For the pulp suspensions a variation in Re showed only a small variation in permeabilitythat most likely is related to systematical errors or the hysteresis of the measurementsensors. According to Darcy's law, Eq. (8), the permeability should be independent of thebasis weight. A slight deviation from the true pulp thickness due to hysteresis etc., stronglyinfluences the calculated porosity, especially at small thicknesses. This is illustrated inFigure 5, and could be one explanation to the large scattering effect most apparent at lowporosities. The measurements performed on higher basis weights (2 kg/m²) give slightlylower results but are still inside the variation due to hysteresis. Similar results are shown tobe valid for BHK and SBSK pulps. The empirical determined constants for permeabilitymodel are given in Table 1.

9
0.000001
0.00001
0.0001
0.001
0.01
0.1
1
0.4 0.45 0.5 0.55 0.6 0.65 0.7 0.75 0.8 0.85 0.9 0.95 1
Porosity
K/d²
Figure 5. Measured non-dimensional permeability on SBBSK pulps at different basisweights. The squares illustrate the measurements conducted on a basis weight of1 kg/m², the triangles illustrate the measurements conducted on a basis weight of2 kg/m² and the solid line is representing the fitted permeability model. The barindicates how the hysteresis of the distance sensor influences the porosity of thepulp suspension.
The permeability results of the different types of pulp suspensions reveal that thepermeability on the Hardwood, BHK and BMTH, pulps is overall higher as compared to theSoftwood, SBSK and SBBSK, pulps especially at low porosities, see Figure 6 where theresults performed by Lindsay (1990) are plotted as regression lines.
0.000001
0.00001
0.0001
0.001
0.01
0.1
1
0.4 0.5 0.6 0.7 0.8 0.9 1
Porosity
K/d
²
SBBSK
SBSK
BMTH
BHK
Lindsay247 g/m²
Lindsay135 g/m²
Figure 6. Non-dimensional permeability results of the measured pulp suspensions.Hardwood pulps indicate to have a higher permeability compared to thesoftwood pulps. The experimental obtained transverse permeabilitymeasurements conducted by Lindsay (1990) are given as regression lines.

10
Table 2. The empirical determined constants for the tested pulps for the permeabilitymodel.
Pulps C1 C2 S0 R² max min
SBBSK 234.6 3389.0 1.50E+05 0.934 0.98 0.50SBSK 174.7 8718.0 1.54E+05 0.963 0.98 0,75BMTH 168.9 2429.2 2.48E+05 0.990 0.98 0.63BHK 189.4 1040.8 2.56E+05 0.966 0.96 0.67
The number of circulations in the flow loop did not influence the pulp as illustrated inFigure 7. The number of circulation the pulp was in the system before it was removed isfound in the legend, i.e. BMTH 0 was not circulated at all while BMTH 2 was circulatedabout 2 times etc.
1.0E-05
1.0E-04
1.0E-03
1.0E-02
1.0E-01
1.0E+00
0.6 0.65 0.7 0.75 0.8 0.85 0.9 0.95 1
Porosity
K/d
²
BMTH 0
BMTH 2
BMTH 5
BMTH 10
BMTH 20
Curve fittedmodel
Figure 7 Plotted permeability and fitted model for the mixed tropical hardwood pulp,BMTH. The results are not unambiguous between the different measurements.
In addition to the process history investigation of the BMTH pulp a morphological studywas carried out on the BHK pulp, Table 1. It was shown that by circulating the pulpsuspension in the circulation loop, the geometrical data of the pulp suspension did notchange. For the BHK pulp two permeability measurements were performed: a variation inbasis weight and a measurement of pulp that had circulated in the flow loop, Figure 8 wherethe names in the legend indicate numbers of circulation and the actual basis weight, [kg/m²]respectively. The results indicate that neither the basis weight nor the process historyinfluences the permeability. However, the results presented for BHK 1 is deviating from theother one.

11
0.00001
0.0001
0.001
0.01
0.1
1
0.65 0.7 0.75 0.8 0.85 0.9 0.95 1
Porosity
K/d
²
BHK 2:1
BHK 2:2
BHK 10:1
BHK 10:2
Curvefittedmodel
Figure 8. Plotted non-dimensional permeability and fitted model for the BHK pulp. By studyingthe results carried out on pulp that circulated a shorter time with the pulp that circulatedlonger time no variation is noticeable. A deviation is observed for one of the testconducted on a basis weight of 1 kg/m². The variation is probably related to somesystematical errors since the permeability results conducted on SBBSK and SBSK withvarying basis weights were not noticeable.
Finally the measurements carried out on the SBSK pulp also indicate that its permeability isindependent of the process treatment of the pulp suspension and also independent of a basisweight variation, since only small variation is noticeable, Figure 9.
0.00001
0.0001
0.001
0.01
0.1
1
0.7 0.75 0.8 0.85 0.9 0.95 1
Porosity
K/d
²
SBSK 0:2
SBSK 5:1
SBSK 20:1
Curve fittedmodel
Figure 9. Plotted non-dimensional permeability and fitted model for the SBSK pulp. Only asmall variation is noticeable.

12
Discussion
The objective of this work has been to study how the processing history of the pulpsuspension affects its permeability. An equipment for measuring permeability of variouspulp suspensions at high basis weights was developed and validated. In the validationprocess conducted by use of the EPS material, a deviation of at most 6 % from thetheoretical models developed by Rumpf and Gupte (1971) was obtained. This discrepancy isin the same order as the accuracy of the measuring system itself and the equipment istherefore successfully verified.The measurements performed on SBBSK, SBSK and BHK pulp considering a basis weightvariation indicate that the permeability is independent of the basis weight. This is trueexcept for one measurement on the BHK pulp that showed an overall higher permeability,Figure 8. Determining the permeability demands, especially for pulp suspension, is anextremely accurate experimental procedure. Such a methodology was applied here but stillerrors may be introduced. One explanation to the deviation that is more likely than others isrelated to the closing procedure. If the volume is decreased too fast, when reducing theporosity, internal channels can be created. Such channels may form in the fiber network ifthe hydrodynamic pressure is higher than the local network stress of the pulp suspension.The consequence from this is that a too high permeability is measured. A high pressure dropmay also, on a more global level, affect the permeability. At a certain level the pressure dropwill overcome the network stress and the assumption of a constant porosity profile is notvalid, consequently a too low permeability is obtained. Having a constant flow rate thiseffect is most pronounced at high basis weight and as shown in the measured porosity range,the permeability was independent of a basis weight variation. This fact indicates that thepressure drop in the measurements were small enough so that no compression of the fiberbed occurred during the permeability measurement.When drying pulp suspensions the geometry of the individual fibers may change, since thefiber wall can collapse which should influence the overall permeability of the network..However, the permeability was measured to be virtually independent of the number of loopswhich was confirmed by the fact that the morphological data obtained was almostunaffected by the number of loops. The permeability is a geometrical parameter describingthe ease the fluid can flow through a porous network and if the geometry of the individualfibers are not changed, the permeability should also be unchanged.A summary of the permeability measurements showed that the history of the pulp do notaffect its permeability and that the deviation was considered as systematical errors ratherthan related to the geometrical change of the fibers. However, in the dewatering processesof the pulp suspensions there are huge differences in the dewatering ability depending onwhat the pulp has been exposed for. Forthcoming study will focus on the compressibilityeffect of the pulp suspension in order to understand the dewatering phenomenon.
Acknowledgement
The authors acknowledge the Swedish Research Council for financially backing-up thiswork.

13
Nomenclature
C1, C2 Empirical constantD Diameter of the spheres, [m]d Diameter of the fibers [m] Total porositye Effective porositys Bed porosity of the EPS material
h Height of the fiber mat, [m]k, parameters of the porous mediaK Permeability [m²]
Dynamic viscosity [Pas]p Fluid pressure [Pa]R The Roundness value
Density of the fluid [kg/m³]f Fiber wall density [kg/m³]
So Specific length, [m]S Shape factor for the porous material
Superficial fluid velocity [m/s]Vfw, Vli, Vlu Fiber wall volume, Free liquid fluid and Lumen volume of the
pulp suspension respectively, [m³]w Basis weight, [kg/m²]x Distance in flow direction of the permeability cell [m]
References
ASKLÖF, C. A., K. O. LARSSON, J. LINDEROTH,P. B. WAHLSTRÖM (1964). "Flow conditionsin a felt in a plain press nip." Pulp and Paper magazine Canada: 246-250.
BELKACEMI, K.,A. D. BROADBENT (1999). "Air flow through textiles at high differentialpressures." Textile Res. J. 69(1): 52-58.
BUNTAIN, M. J.,S. BICKERTON (2003). "Compression flow permeability measurement: acontinous technique." Composites A 34: 445-457.
GEBART, B. R.,P. LINDSTRÖM (1996). "Measurement of In-plane permeability ofanisotropic fiber reinforcements." Polymer Composites 17(1): 43-51.
GRÉN, U.,B. HEDSTRÖM (1967). "Fluid flow and pressure drops in thick beds of Cellolosefibres." Svensk Papperstidn. 70: 339-346.
INGMANSSON, W. L.,B. D. ANDEWS (1963). "High velocity water flow through fiber mats."Tappi J 46(3): 150-155.
INGMANSSON, W. L., B. D. ANDREWS,R. C. JOHNSON (1959). "Internal pressuredistributions in compressible mats under fluid stress." Tappi J 42(10).
KAJAANIFIBERLAB (2004). Operating Manual W4230467 V3.5 EN, Metso Automation.LINDSAY, J. D. (1990). "The anisotropic permeability of paper." Tappi J: 223-229.LU., W. M., Y. P. HUANG,K. J. HWANG (1998). "Methods to determine the relationship
betwwn cake properties and solid compressive pressure." Separation and PurificationTechnology 13: 9-23.
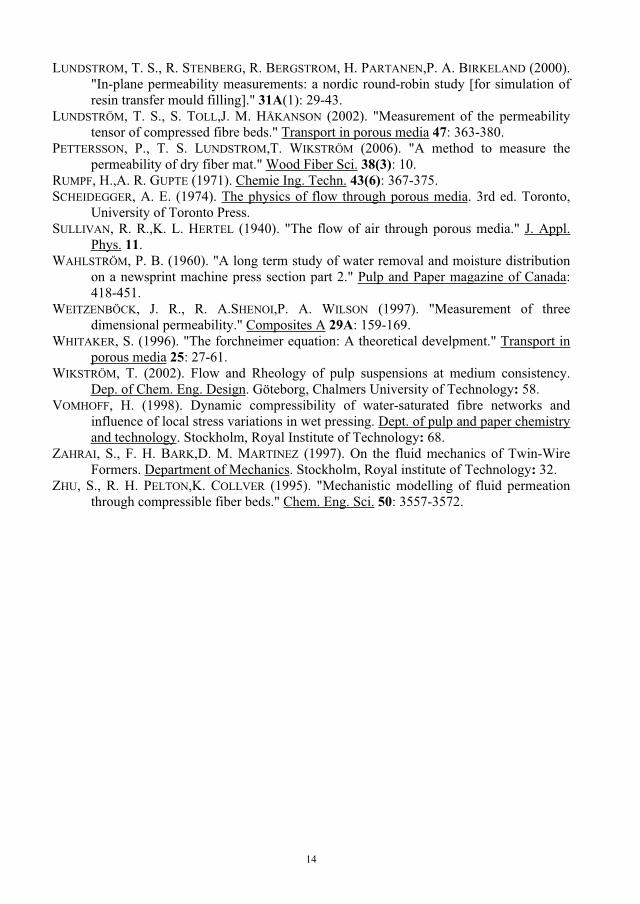
14
LUNDSTROM, T. S., R. STENBERG, R. BERGSTROM, H. PARTANEN,P. A. BIRKELAND (2000)."In-plane permeability measurements: a nordic round-robin study [for simulation ofresin transfer mould filling]." 31A(1): 29-43.
LUNDSTRÖM, T. S., S. TOLL,J. M. HÅKANSON (2002). "Measurement of the permeabilitytensor of compressed fibre beds." Transport in porous media 47: 363-380.
PETTERSSON, P., T. S. LUNDSTROM,T. WIKSTRÖM (2006). "A method to measure thepermeability of dry fiber mat." Wood Fiber Sci. 38(3): 10.
RUMPF, H.,A. R. GUPTE (1971). Chemie Ing. Techn. 43(6): 367-375.SCHEIDEGGER, A. E. (1974). The physics of flow through porous media. 3rd ed. Toronto,
University of Toronto Press.SULLIVAN, R. R.,K. L. HERTEL (1940). "The flow of air through porous media." J. Appl.
Phys. 11.WAHLSTRÖM, P. B. (1960). "A long term study of water removal and moisture distribution
on a newsprint machine press section part 2." Pulp and Paper magazine of Canada:418-451.
WEITZENBÖCK, J. R., R. A.SHENOI,P. A. WILSON (1997). "Measurement of threedimensional permeability." Composites A 29A: 159-169.
WHITAKER, S. (1996). "The forchneimer equation: A theoretical develpment." Transport inporous media 25: 27-61.
WIKSTRÖM, T. (2002). Flow and Rheology of pulp suspensions at medium consistency.Dep. of Chem. Eng. Design. Göteborg, Chalmers University of Technology: 58.
VOMHOFF, H. (1998). Dynamic compressibility of water-saturated fibre networks andinfluence of local stress variations in wet pressing. Dept. of pulp and paper chemistryand technology. Stockholm, Royal Institute of Technology: 68.
ZAHRAI, S., F. H. BARK,D. M. MARTINEZ (1997). On the fluid mechanics of Twin-WireFormers. Department of Mechanics. Stockholm, Royal institute of Technology: 32.
ZHU, S., R. H. PELTON,K. COLLVER (1995). "Mechanistic modelling of fluid permeationthrough compressible fiber beds." Chem. Eng. Sci. 50: 3557-3572.