Wood Fiber Polyamide Composites for Automotive Applications
100
Wood Fiber Polyamide Composites for Automotive Applications by Andrea Buchenauer A thesis presented to the University of Waterloo in fulfillment of the thesis requirement for the degree of Master of Applied Science in Chemical Engineering Waterloo, Ontario, Canada, 2016 © Andrea Buchenauer 2016
Transcript of Wood Fiber Polyamide Composites for Automotive Applications
Wood Fiber Polyamide Composites for Automotive Applications
by
Andrea Buchenauer
A thesis
presented to the University of Waterloo
in fulfillment of the
thesis requirement for the degree of
Master of Applied Science
in
Chemical Engineering
Waterloo, Ontario, Canada, 2016
© Andrea Buchenauer 2016

ii
Author’s Declaration
I hereby declare that I am the sole author of this thesis. This is a true copy of the thesis,
including any required final revisions, as accepted by my examiners.
I understand that my thesis may be made electronically available to the public.
iii
Abstract
The automotive industry is currently experiencing environmental, legislative, and
consumer pressure to improve the environmental sustainability of passenger vehicles. Just
one of the approaches being taken to address this issue is the reconsideration of materials
used in automotive application. The purpose of this thesis is to reduce the material weight
and increase the environmental sustainability of polyamide composites in automotive
parts. Specifically, an objective is to evaluate various types of polyamide and wood fiber
blends and compare the mechanical and thermal properties with the intention of replacing
glass fiber composite. The lower density of wood fibers could introduce weight savings that
would improve fuel efficiency.
Two industrial sources of natural wood fiber are considered. These fibers are
referred to as Suzano fiber and Woodforce fiber. The primary difference between these
fibers is the type of processing. The polyamides compared include PA 6,10, PA 10,10 and
recycled PA 6. Additionally, a hybrid blend of 30% PA 6,10 and 70% PA 6 is investigated.
Composites are prepared through twin screw extruding and injection molding. The
thermal and mechanical properties are measured through TGA, DSC, flexural tests, tensile
tests, and Izod impact tests.
Due to the high melt temperature of polyamide, one of the main challenges of
natural fibers is the thermal degradation that occurs. The use of ultraviolet light treatment
is briefly investigated on the wood fibers in consideration, however it determined to be
unnecessary for higher cellulose level fibers. In addition to comparing thermal behaviour
of composites, alternative options addressing the issues associated with thermal
degradation are explored through carbon fiber and odor adjusting additive.
Through thermal and mechanical comparisons, it was determined that the Suzano
fiber had the highest improvement of mechanical properties when compounded with each
polyamide. However, the disadvantage of the Suzano fiber is its ability to feed into the
iv
processing equipment. By replacing the Suzano fiber with cellulose, it was determined that
overall, the 20% cellulose level resulted in the most favourable combination of properties.
The blending of RPA 6 and PA 6,10 generally resulted in intermediate property
values however did not offer any significant advantages. The use of PA 6,10 is good for
sustainability because of its bio-content but must be balanced with the additional cost.

v
Acknowledgements
I’d like to express the deepest gratitude to my supervisor, Leonardo Simon, for all the support, guidance, and encouragement. Thank you so much for this opportunity. Special thanks to Ford Motor Company for funding my academic program and for providing use of their research facilities. I’d also like to thank the Ford Research and Innovation Team for all the help and training provided. Specifically, thanks to Alper Kiziltas for the direction with experimental planning. Many thanks to Ron Koslakiewicz, James Burkholder, and John Rizzo for the experimental assistance. Finally, I’d like to thank Professor Michael Pope and Professor Aiping Yu for generously giving their time to be part of my thesis Reading Committee.
vi
Table of Contents Author’s Declaration .................................................................................................................................... ii
Abstract ........................................................................................................................................................... iii
Acknowledgements ....................................................................................................................................... v
List of Figures .................................................................................................................................................. x
List of Tables ................................................................................................................................................. xii
1.0 Introduction ............................................................................................................................................. 1
1.1 Motivation and Objectives .............................................................................................................. 1
1.2 Scope ...................................................................................................................................................... 3
1.3 Thesis Layout ...................................................................................................................................... 4
2.0 Literature Review .................................................................................................................................. 5
2.1 Polyamide ............................................................................................................................................. 5
2.1.1 Types of Polyamide ................................................................................................................... 5
2.1.2 Reinforced Polyamide .............................................................................................................. 7
2.1.3 Polyamide Blends ...................................................................................................................... 8
2.2 Wood Fibers ........................................................................................................................................ 9
2.2.1 Components ................................................................................................................................. 9
2.2.2 Pulping Processes .................................................................................................................... 10
2.2.3 Thermal Stability ..................................................................................................................... 11
2.3 Natural Fiber Reinforcement ....................................................................................................... 12
2.3.1 Incentives and Disadvantages ............................................................................................. 12
2.3.2 Previous Work .......................................................................................................................... 13
vii
2.4 Ultraviolet Light Treatment ......................................................................................................... 14
2.5 Carbon Fiber ...................................................................................................................................... 15
3. 0 Experimental ........................................................................................................................................ 16
3.1 Materials ............................................................................................................................................. 16
3.1.1 Polyamides ................................................................................................................................. 16
3.1.2 Wood Fibers .............................................................................................................................. 16
3.1.3 Carbon Fiber .............................................................................................................................. 18
3.1.4 RP 17 ............................................................................................................................................ 18
3.2 Procedures ......................................................................................................................................... 19
3.2.1 Thermal stability...................................................................................................................... 19
3.2.2 Melting Point and Crystallinity ........................................................................................... 19
3.2.3 Morphology and Size .............................................................................................................. 21
3.2.4 Compounding ............................................................................................................................ 21
3.2.5 Injection Molding ..................................................................................................................... 22
3.2.6 Mechanical Properties ........................................................................................................... 22
3.2.7 Ultraviolet Treatment ............................................................................................................ 23
4.0 Thermal Stability of Wood Fibers ................................................................................................... 24
4.1 Introduction....................................................................................................................................... 24
4.2 Results and Discussion .................................................................................................................. 24
4.2.1 Weight Loss vs. Heating Rate ............................................................................................... 24
4.2.2 Kinetics of Thermal Degradation ....................................................................................... 26
4.2.3 Isothermal TGA ........................................................................................................................ 30
4.2.4 UV results ................................................................................................................................... 32
viii
5.0 Initial Fiber and Polyamide Compounding .................................................................................. 35
5.1 Introduction....................................................................................................................................... 35
5.2 Results and Discussion .................................................................................................................. 35
5.2.1 Twenty Percent Fiber Content ............................................................................................ 35
5.2.2 Added filler level for Suzano Fiber and Woodforce 2 ................................................. 38
6.0 Cellulose Compounding with a Polyamide Blend ...................................................................... 41
6.1 Introduction....................................................................................................................................... 41
6.2 Results and Discussion .................................................................................................................. 42
6.2.1 SEM Images ................................................................................................................................ 42
6.2.2 Mechanical Properties ........................................................................................................... 46
6.2.3 Thermal Properties ................................................................................................................. 51
6.3 Odor Additive - RP 17 ..................................................................................................................... 58
6.4 Carbon Fiber ...................................................................................................................................... 63
7.0 Conclusions ............................................................................................................................................ 68
8.0 Recommendations ............................................................................................................................... 70
References................................................................................................................................................. 71
Appendix A – Material Specifications ................................................................................................... 76
PA610 .......................................................................................................................................................... 76
PA1010 ....................................................................................................................................................... 77
Recycled PA 6 ........................................................................................................................................... 78
Cellulose ..................................................................................................................................................... 78
Carbon Fiber ............................................................................................................................................. 79
RP17 ............................................................................................................................................................ 80

ix
Appendix B – ANOVA Tables ................................................................................................................... 81
Appendix C – Equation Derivations ...................................................................................................... 83
Appendix D – Additional Experimental Data ..................................................................................... 85
x
List of Figures
Figure 1 - Example of PA from Single Monomer [10] ....................................................................... 5
Figure 2 - Example of PA from Two Monomers [10] ......................................................................... 6
Figure 3 - Polyamide Structure and Naming Convention [11] ....................................................... 6
Figure 4 - Aromatic Polyamide Miscibility Figure [22] .................................................................... 9
Figure 5 - Tensile Modulus of Nylon 6 and Carbon Fiber Composites [51] ............................. 15
Figure 6 - Woodforce Fiber Appearance ............................................................................................. 17
Figure 7 - CreaFill Cellulose Appearance ............................................................................................ 18
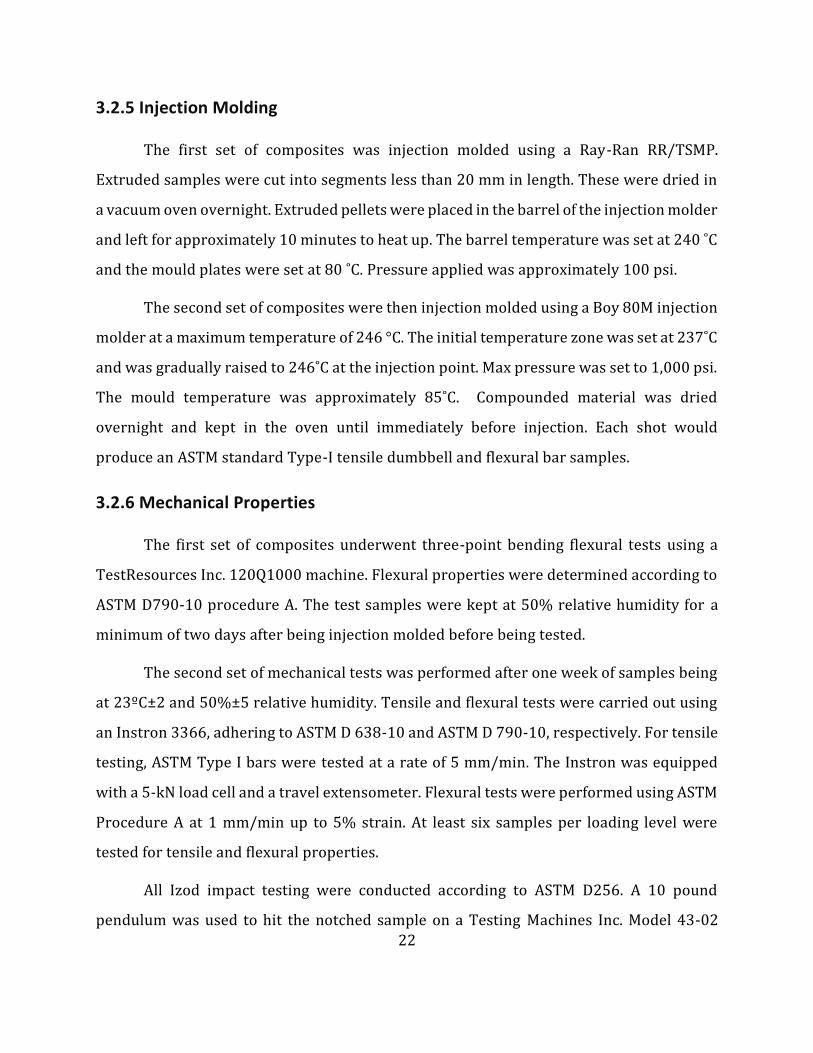
Figure 8 - UV Light Spectral Output *Reference*: Fusion Systems Inc ..................................... 23
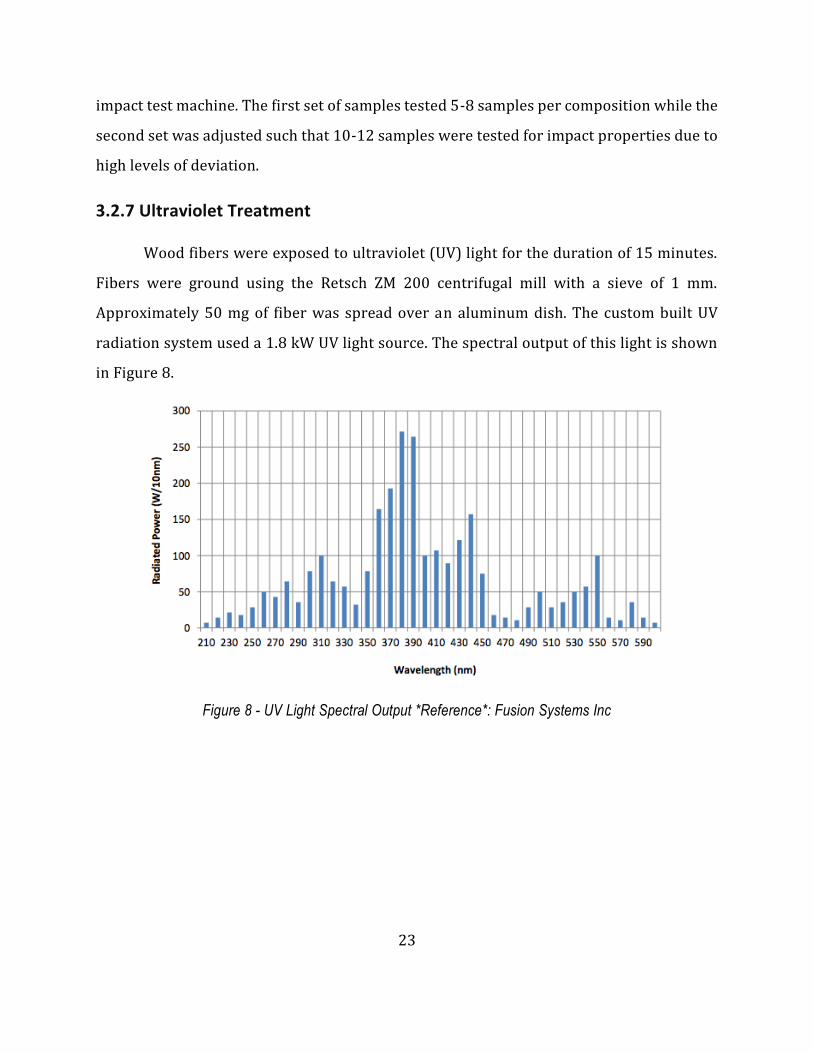
Figure 9 - Suzano Nitrogen TGA Curves .............................................................................................. 25
Figure 10 – Thermal stability measured as temperature to reach 5 wt.% loss vs. heating
rate ................................................................................................................................................................... 26
Figure 11 - TGA Curve of Suzano Fiber in Air as Example of Curve Shape .............................. 27
Figure 12 – Fiber Degradation Kinetics in Air: Activation Energy ............................................. 29
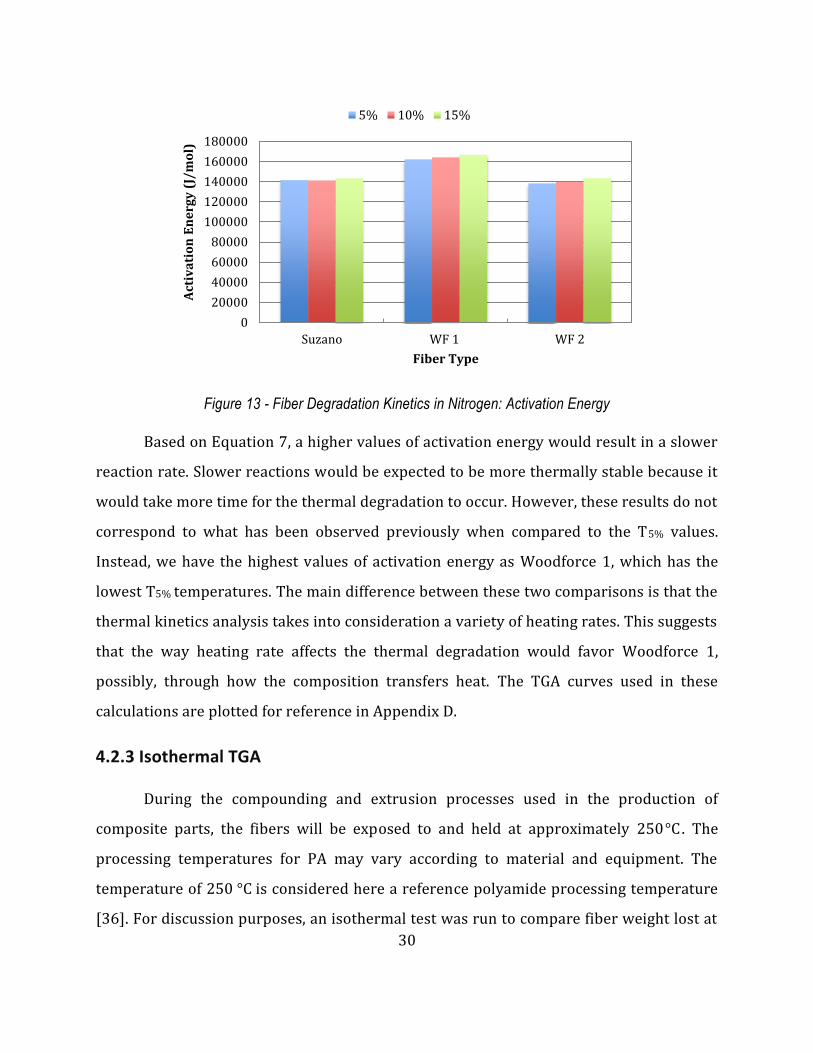
Figure 13 - Fiber Degradation Kinetics in Nitrogen: Activation Energy ................................... 30
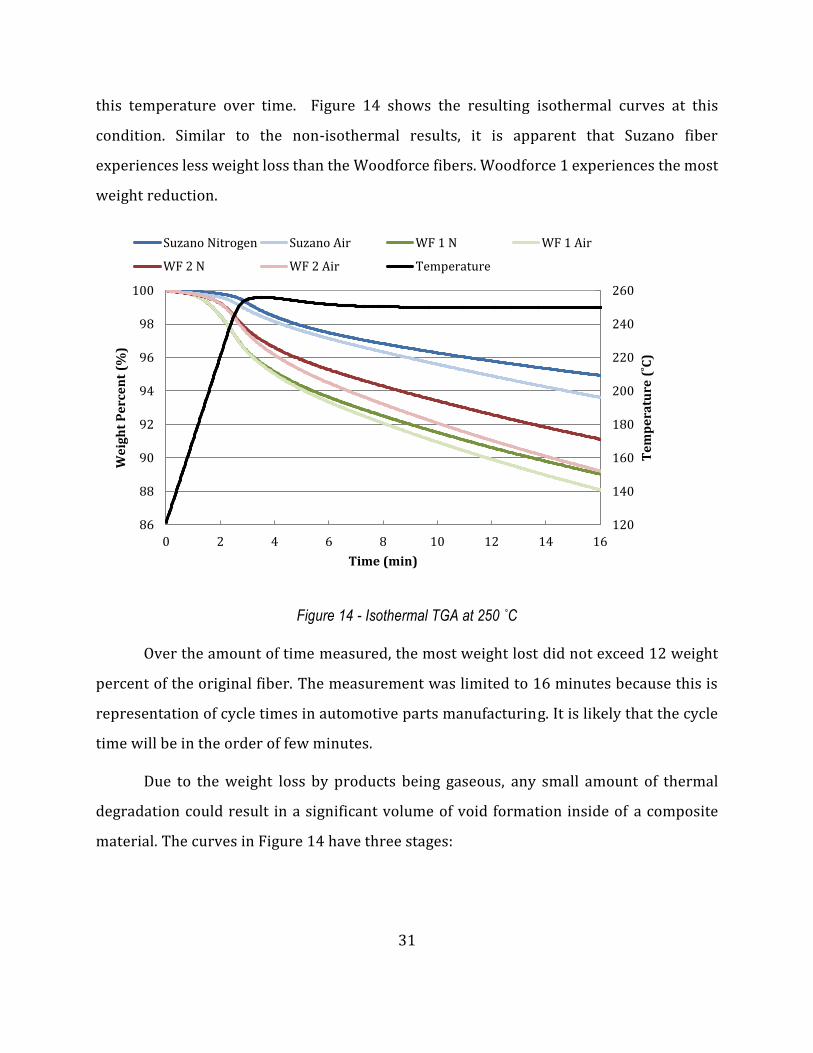
Figure 14 - Isothermal TGA at 250 ˚C ................................................................................................... 31
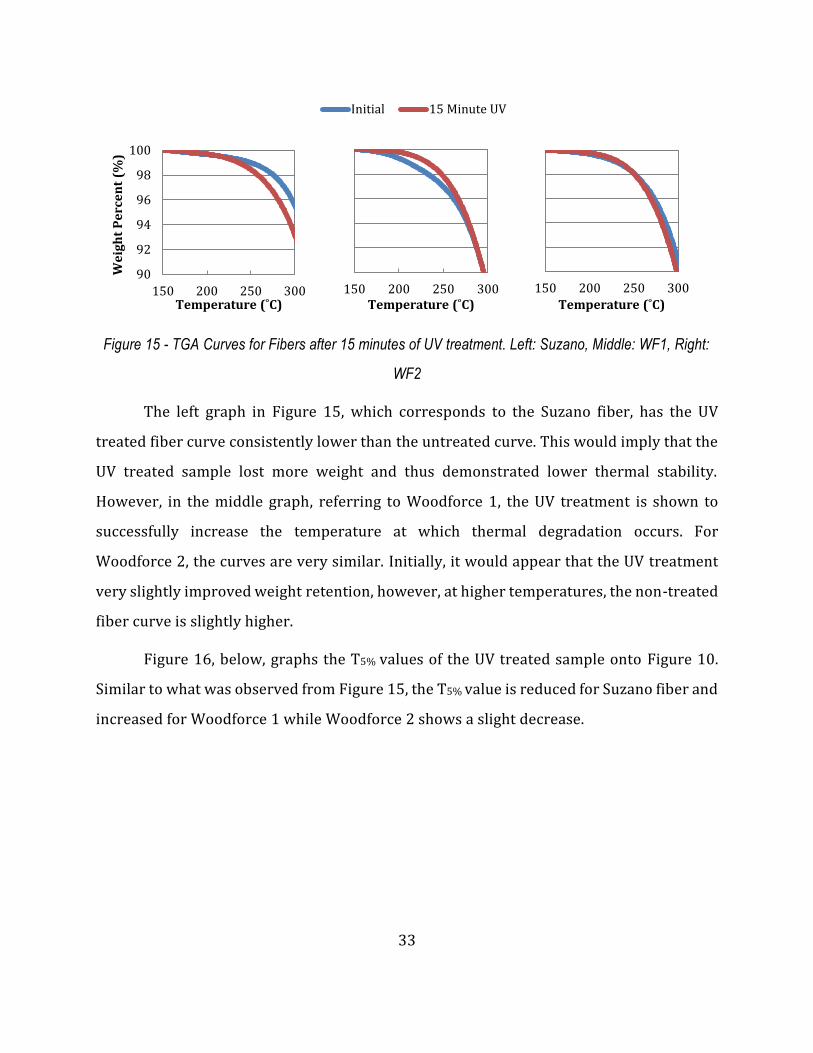
Figure 15 - TGA Curves for Fibers after 15 minutes of UV treatment. Left: Suzano, Middle:
WF1, Right: WF2 .......................................................................................................................................... 33
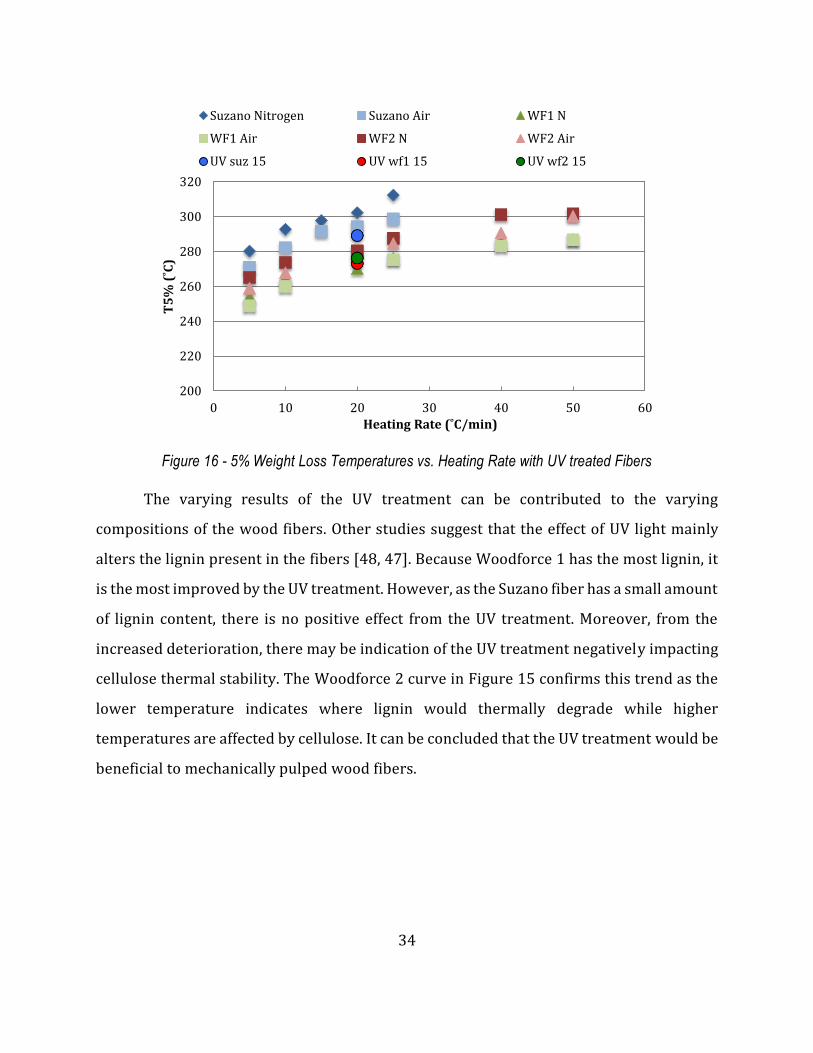
Figure 16 - 5% Weight Loss Temperatures vs. Heating Rate with UV treated Fibers ......... 34
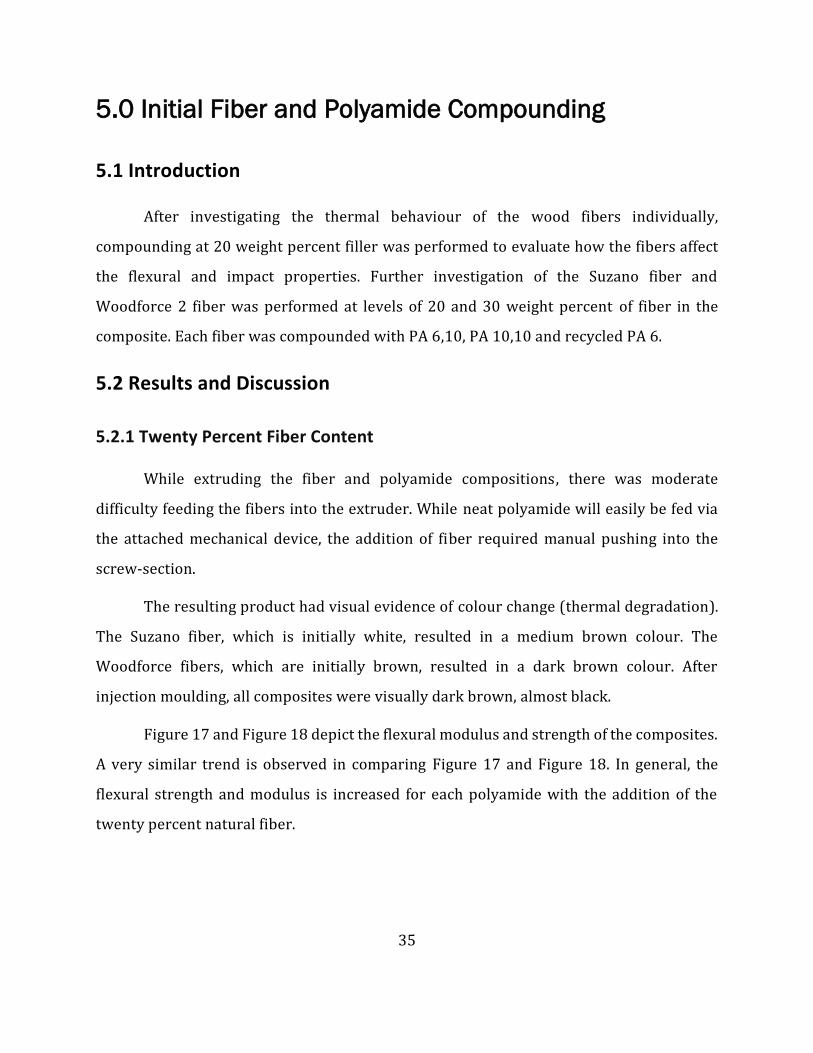
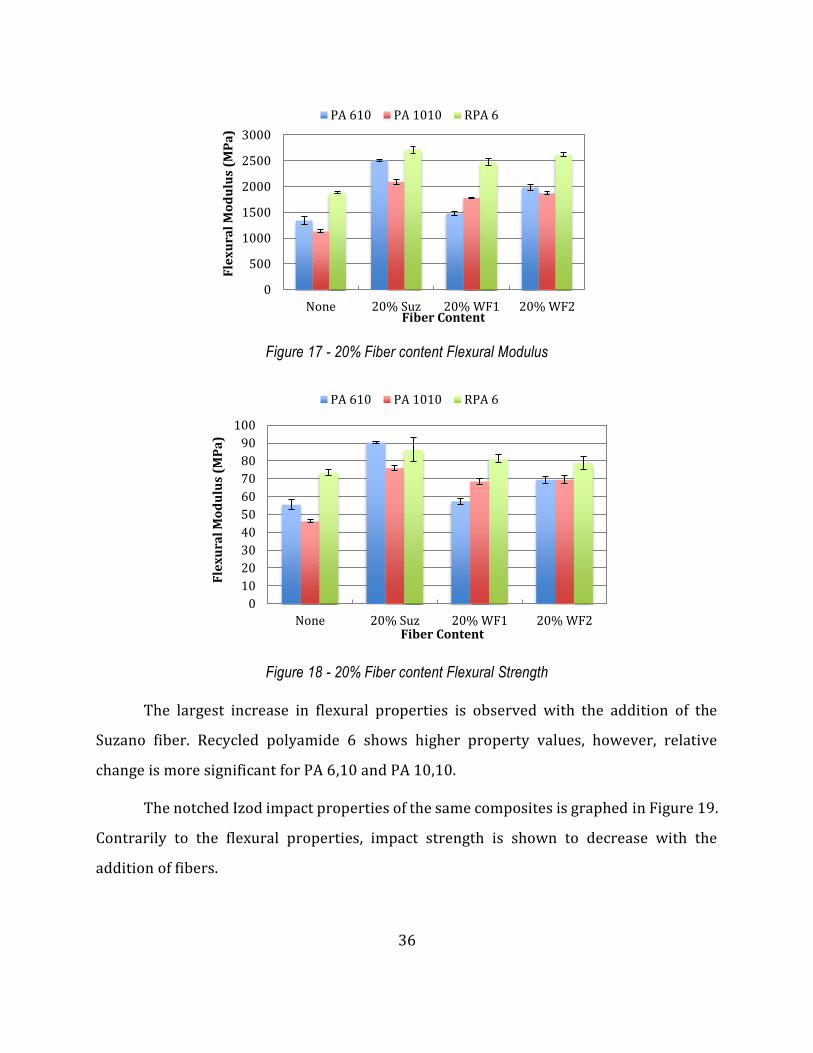
Figure 17 - 20% Fiber content Flexural Modulus ............................................................................ 36
Figure 18 - 20% Fiber content Flexural Strength............................................................................. 36
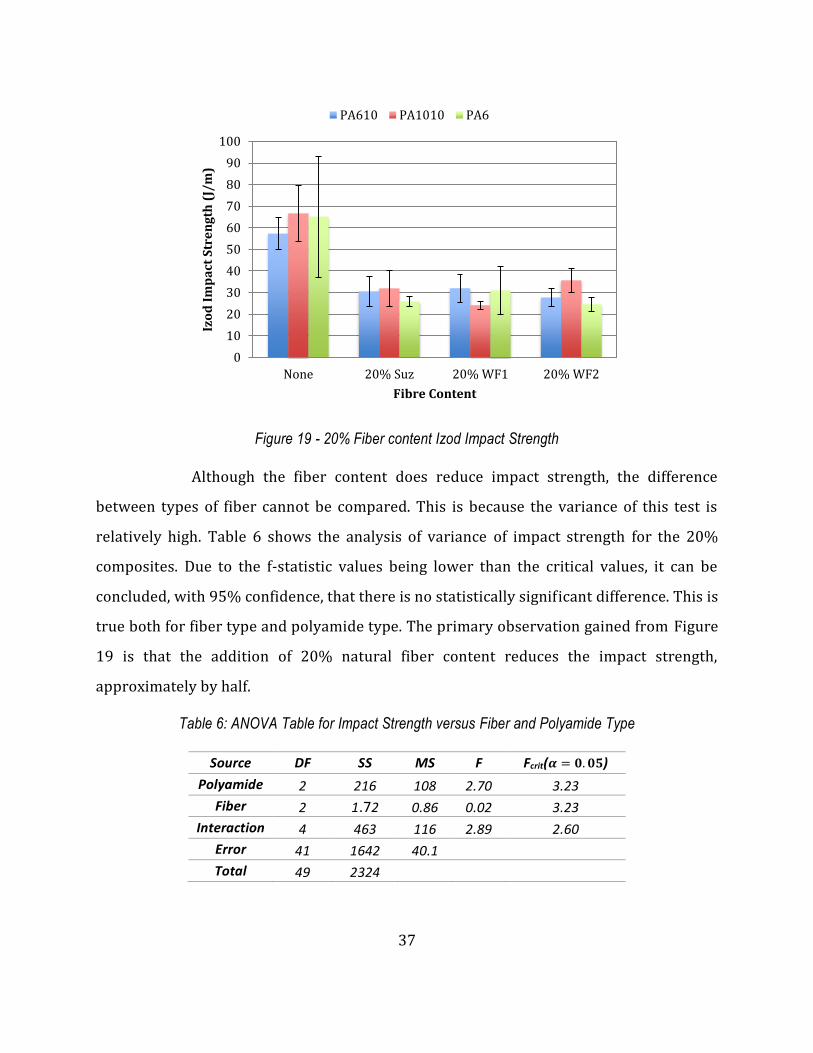
Figure 19 - 20% Fiber content Izod Impact Strength ..................................................................... 37
Figure 20 – 20% and 30% Fiber content Flexural Modulus ......................................................... 39
Figure 21 -20% and 30% Fiber content Izod Impact Strength .................................................... 40
Figure 22 - SEM of PA 610 with x800 magnification ....................................................................... 42
Figure 23 – SEM of RPA 6 with x800 magnification ........................................................................ 43
Figure 24 – SEM of PA Blend with x800 magnification .................................................................. 44
xi
Figure 25 - SEM of 20% Cellulose with x800 magnification ......................................................... 45
Figure 26 - Young's Modulus of Cellulose Filled PA Blends .......................................................... 47
Figure 27 – Tensile Stress at Maximum Load of Cellulose Filled PA Blends ........................... 47
Figure 28 - Flexural Modulus of Cellulose Filled PA Blends ......................................................... 48
Figure 29 - Stress at 5% Strain of Cellulose Filled PA Blends ...................................................... 49
Figure 30 - Notched Izod Impact Strength of Cellulose Filled PA Blends................................. 50
Figure 31 – DSC Cooling Curves ............................................................................................................. 51
Figure 32 – DSC Second Heating Curves .............................................................................................. 52
Figure 33 – Polypropylene Percent Crystallinity ............................................................................. 53
Figure 34 – Polyamide Crystallinity ...................................................................................................... 54
Figure 35 – TGA curves of neat polymers and composites ........................................................... 56
Figure 36 - Temperature of 2% Weight Loss of Cellulose Filled PA Blends ............................ 57
Figure 37 - TGA Ash Content at 600˚C of Cellulose Filled PA Blends ......................................... 58
Figure 38 - Flexural Modulus Comparison of RP17 ......................................................................... 59
Figure 39 - Stress at 5% Strain Comparison of RP17 ...................................................................... 60
Figure 40 – Young’s Modulus Comparison of RP17 ......................................................................... 61
Figure 41 - Tensile Stress at Maximum Load Comparison of RP17 ........................................... 61
Figure 42 – Izod Impact Strength Comparison of RP17 ................................................................. 62
Figure 43 - Flexural Modulus of Carbon Fiber Composites .......................................................... 64
Figure 44 - Stress at 5% Strain of Carbon Fiber Composites ....................................................... 64
Figure 45 - Young's Modulus of Carbon Fiber Composites ........................................................... 65
Figure 46 - Tensile Stress at Maximum Load of Carbon Fiber Composites ............................. 66
Figure 47 - Izod Impact Strength of Carbon Fiber Composites ................................................... 67
Figure 48 – Image J Ellipse Fit Results ................................................................................................. 88
Figure 49 – Image J Particle Analysis Histogram .............................................................................. 88
xii
List of Tables
Table 1: Thesis Layout ................................................................................................................................. 4
Table 2: Properties of Nylon 6 compared with 30% Glass Filled Composite [18] .................. 7
Table 3: Reference of 100% Crystalline Heat of Fusion [54] ....................................................... 20
Table 4: Extruder Temperature Profile ............................................................................................... 21
Table 5: Activation Energy of Fibers ..................................................................................................... 29
Table 6: ANOVA Table for Impact Strength versus Fiber and Polyamide Type ..................... 37
Table 7: Relative Increase of Properties with 20% Filler vs. Neat Polyamide [4] ................ 50
Table 8: Melt and Crystallization Enthalpies ..................................................................................... 52
Table 9: Crystallization and Melt Temperatures .............................................................................. 55
Table 10: Anova Table for 20% Suzano Fiber vs 20% WF2 Fiber .............................................. 81
Table 11: Anova Table for 30% Suzano Fiber vs 30% WF2 Fiber .............................................. 81
Table 12: Anova Table for 20% Suzano Fiber vs 30% Suzano Fiber ......................................... 81
Table 13: Anova Table for 20% WF2 Fiber vs 30% WF2 Fiber ................................................... 81
Table 14: ANOVA Table for RP17 content vs Flex Modulus .......................................................... 82
Table 15: ANOVA Table for RP17 content vs Stress at 5% Strain............................................... 82
Table 16: ANOVA Table for RP17 content vs Young's Modulus .................................................. 82
Table 17: ANOVA Table for RP17 content vs Tensile Stress at Maximum Load .................... 82
Table 18: ANOVA Table for RP17 content vs Impact Strength .................................................... 82
1
1.0 Introduction
1.1 Motivation and Objectives
Motivation
Since 1975, the national highway traffic safety administration (NHTSA), in the
United States, has held a corporate average fuel economy (CAFE) standard that requires
vehicle manufacturers to meet a minimum level of fuel economy across their assortment
of vehicles. From 1990 to 2010, the fuel economy for passenger cars was held at 27.5 miles
per gallon [1]. In 2010, a presidential memorandum was issued requesting strong action
be taken to address climate change and reduce oil consumption [2]. In response, the CAFE
standards were increased to be more demanding. Although already improved, goals for the
2017-2025 national program continue to challenge vehicle manufacturers. By 2017, the
estimated fleet-average requirement is expected to be around 35.1 mpg [2]. Agencies
predict that in order to meet these standards, the estimated cost of a vehicle will increase
by $1,800 USD. However, the improved fuel economy would save the consumer $3,400-
$5,000 over the lifetime of the vehicle [2]. From the manufacturing perspective, cost
savings, while still implementing new technologies is desired.
This heightened requirement for fuel economy has greatly sparked interest in light-
weighting. This concept originates fundamentally from Newton’s second law through the
understanding that it takes less energy to accelerate a lighter object. It is estimated that a
10% reduction in vehicle weight can improve the fuel economy by 6-8% [3]. Although the
majority of weight savings is focused on the heavier metal components, there is still
opportunity for improvement in polymer materials. In many non-structural parts of the
vehicle, polymer materials can replace metals without compromising on function while
delivering weight reduction. Moreover, hybrid assemblies integrating multi-material
2
component (metal, fiber, polymers…) have opened up new opportunities for integration of
function and light-weighting.
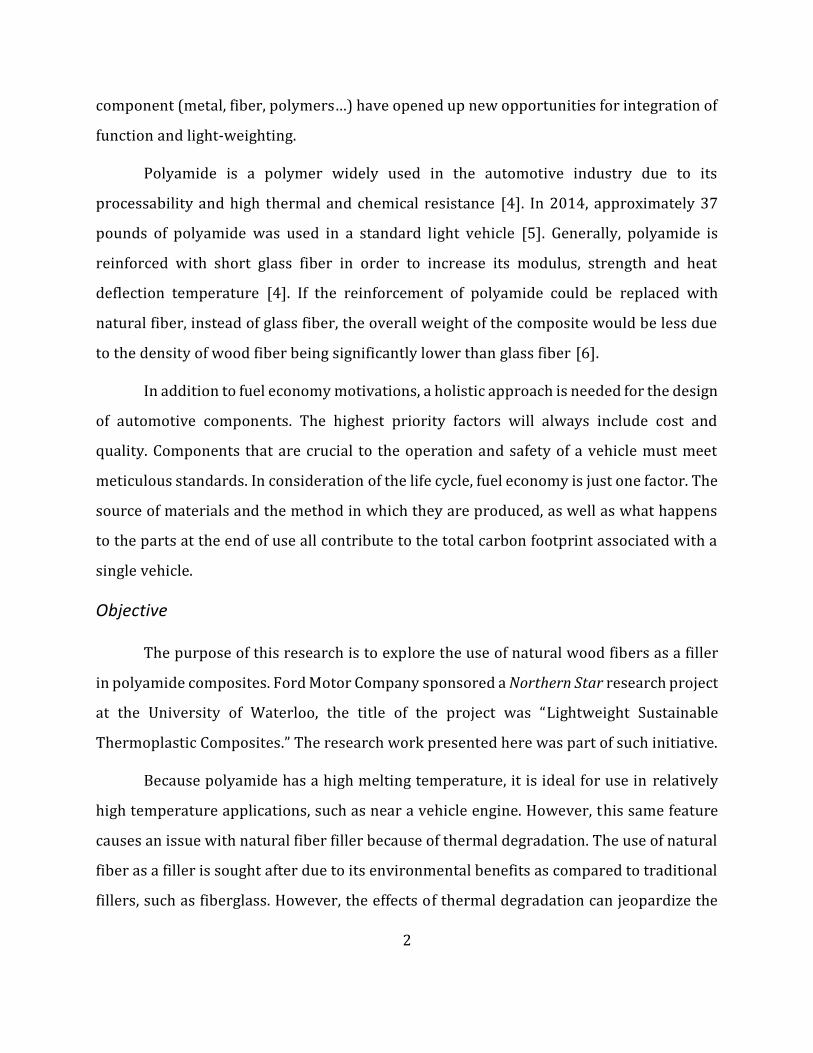
Polyamide is a polymer widely used in the automotive industry due to its
processability and high thermal and chemical resistance [4]. In 2014, approximately 37
pounds of polyamide was used in a standard light vehicle [5]. Generally, polyamide is
reinforced with short glass fiber in order to increase its modulus, strength and heat
deflection temperature [4]. If the reinforcement of polyamide could be replaced with
natural fiber, instead of glass fiber, the overall weight of the composite would be less due
to the density of wood fiber being significantly lower than glass fiber [6].
In addition to fuel economy motivations, a holistic approach is needed for the design
of automotive components. The highest priority factors will always include cost and
quality. Components that are crucial to the operation and safety of a vehicle must meet
meticulous standards. In consideration of the life cycle, fuel economy is just one factor. The
source of materials and the method in which they are produced, as well as what happens
to the parts at the end of use all contribute to the total carbon footprint associated with a
single vehicle.
Objective
The purpose of this research is to explore the use of natural wood fibers as a filler
in polyamide composites. Ford Motor Company sponsored a Northern Star research project
at the University of Waterloo, the title of the project was “Lightweight Sustainable
Thermoplastic Composites.” The research work presented here was part of such initiative.
Because polyamide has a high melting temperature, it is ideal for use in relatively
high temperature applications, such as near a vehicle engine. However, this same feature
causes an issue with natural fiber filler because of thermal degradation. The use of natural
fiber as a filler is sought after due to its environmental benefits as compared to traditional
fillers, such as fiberglass. However, the effects of thermal degradation can jeopardize the
3
structural integrity of a component. The ambition of this project is to find a solution that
increases the sustainability and environmental friendliness of a polyamide composite for
use in automotive applications. Through investigation of specific commercially available
products, the objective is to find a suitable combination of polyamide and natural fiber such
that it is stable at process temperatures and at the lowest cost.
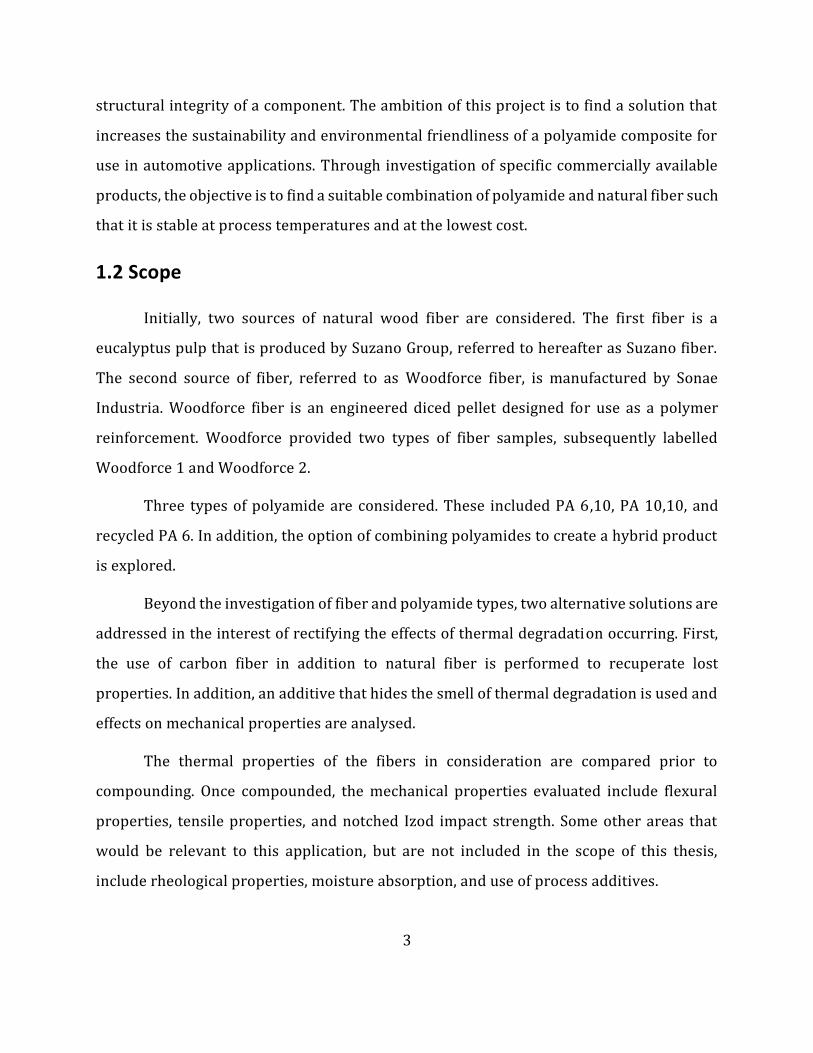
1.2 Scope
Initially, two sources of natural wood fiber are considered. The first fiber is a
eucalyptus pulp that is produced by Suzano Group, referred to hereafter as Suzano fiber.
The second source of fiber, referred to as Woodforce fiber, is manufactured by Sonae
Industria. Woodforce fiber is an engineered diced pellet designed for use as a polymer
reinforcement. Woodforce provided two types of fiber samples, subsequently labelled
Woodforce 1 and Woodforce 2.
Three types of polyamide are considered. These included PA 6,10, PA 10,10, and
recycled PA 6. In addition, the option of combining polyamides to create a hybrid product
is explored.
Beyond the investigation of fiber and polyamide types, two alternative solutions are
addressed in the interest of rectifying the effects of thermal degradation occurring. First,
the use of carbon fiber in addition to natural fiber is performed to recuperate lost
properties. In addition, an additive that hides the smell of thermal degradation is used and
effects on mechanical properties are analysed.
The thermal properties of the fibers in consideration are compared prior to
compounding. Once compounded, the mechanical properties evaluated include flexural
properties, tensile properties, and notched Izod impact strength. Some other areas that
would be relevant to this application, but are not included in the scope of this thesis,
include rheological properties, moisture absorption, and use of process additives.
4
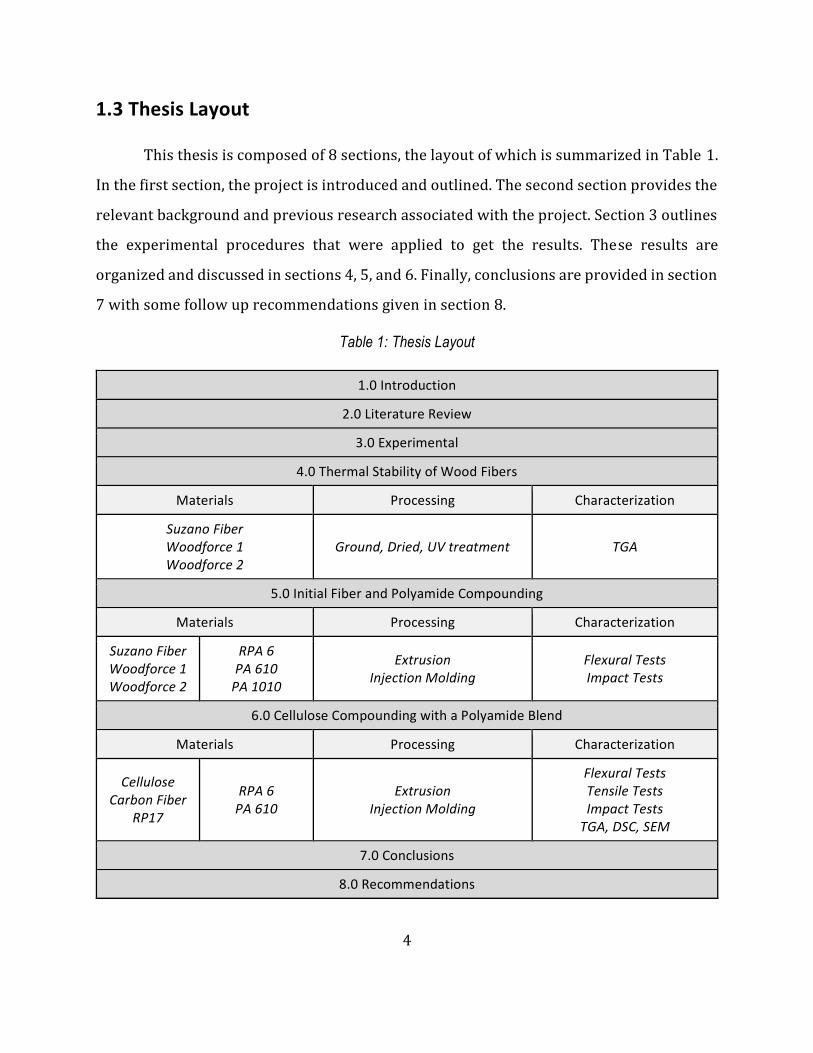
1.3 Thesis Layout
This thesis is composed of 8 sections, the layout of which is summarized in Table 1.
In the first section, the project is introduced and outlined. The second section provides the
relevant background and previous research associated with the project. Section 3 outlines
the experimental procedures that were applied to get the results. These results are
organized and discussed in sections 4, 5, and 6. Finally, conclusions are provided in section
7 with some follow up recommendations given in section 8.
Table 1: Thesis Layout
1.0 Introduction
2.0 Literature Review
3.0 Experimental
4.0 Thermal Stability of Wood Fibers
Materials Processing Characterization
Suzano Fiber Woodforce 1 Woodforce 2
Ground, Dried, UV treatment TGA
5.0 Initial Fiber and Polyamide Compounding
Materials Processing Characterization
Suzano Fiber Woodforce 1 Woodforce 2
RPA 6 PA 610
PA 1010
Extrusion Injection Molding
Flexural Tests Impact Tests
6.0 Cellulose Compounding with a Polyamide Blend
Materials Processing Characterization
Cellulose Carbon Fiber
RP17
RPA 6 PA 610
Extrusion Injection Molding
Flexural Tests Tensile Tests Impact Tests
TGA, DSC, SEM
7.0 Conclusions
8.0 Recommendations
5
2.0 Literature Review
2.1 Polyamide
2.1.1 Types of Polyamide
A polyamide is defined as any high molecular weight polymer that has amide
linkages along the backbone structure [7]. Polyamides are semi-crystalline polymers,
which mean they have some amount of crystalline structure and some amount of
amorphous chains [8]. Natural polyamides exist and are found in casein, soybean, and
peanut proteins [7]. However, the much broader use of the term polyamide tends to refer
specifically to the linear linkages, first synthesized by DuPont, who coined the name ‘Nylon’
to market their product under. The term nylon is used in this document as a common name
for polyamides.
There are two main categories of polyamides, which are determined by the number
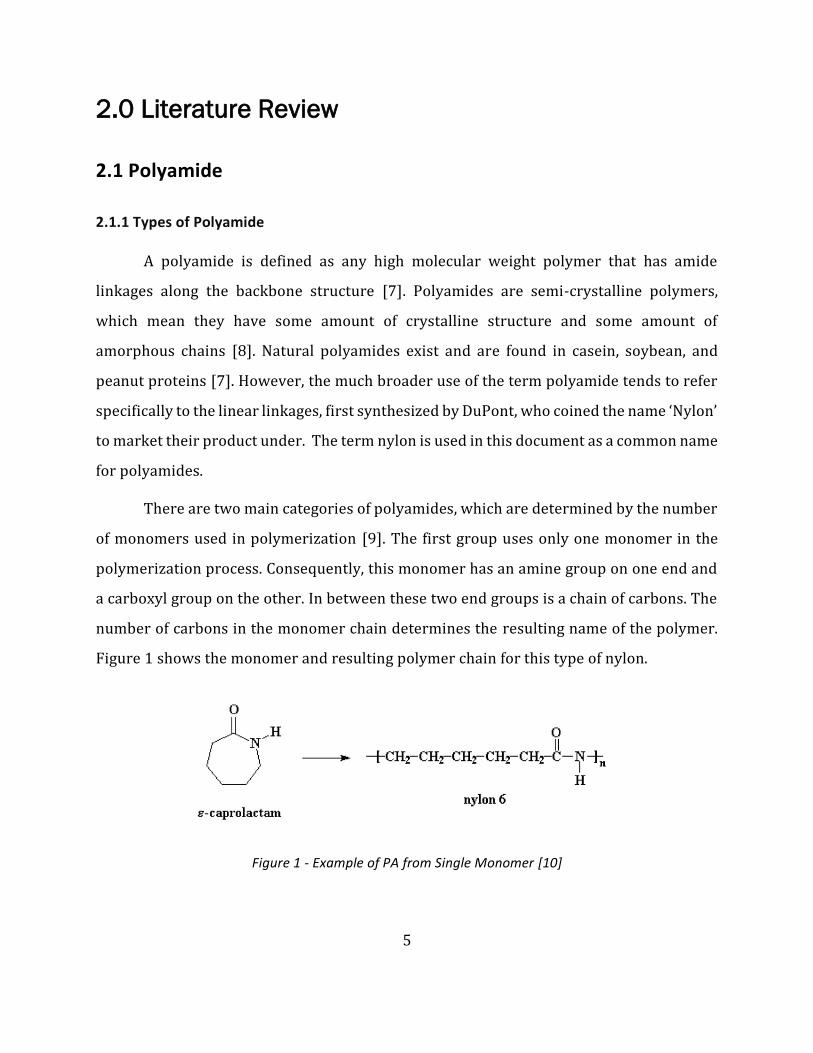
of monomers used in polymerization [9]. The first group uses only one monomer in the
polymerization process. Consequently, this monomer has an amine group on one end and
a carboxyl group on the other. In between these two end groups is a chain of carbons. The
number of carbons in the monomer chain determines the resulting name of the polymer.
Figure 1 shows the monomer and resulting polymer chain for this type of nylon.
Figure 1 - Example of PA from Single Monomer [10]
6
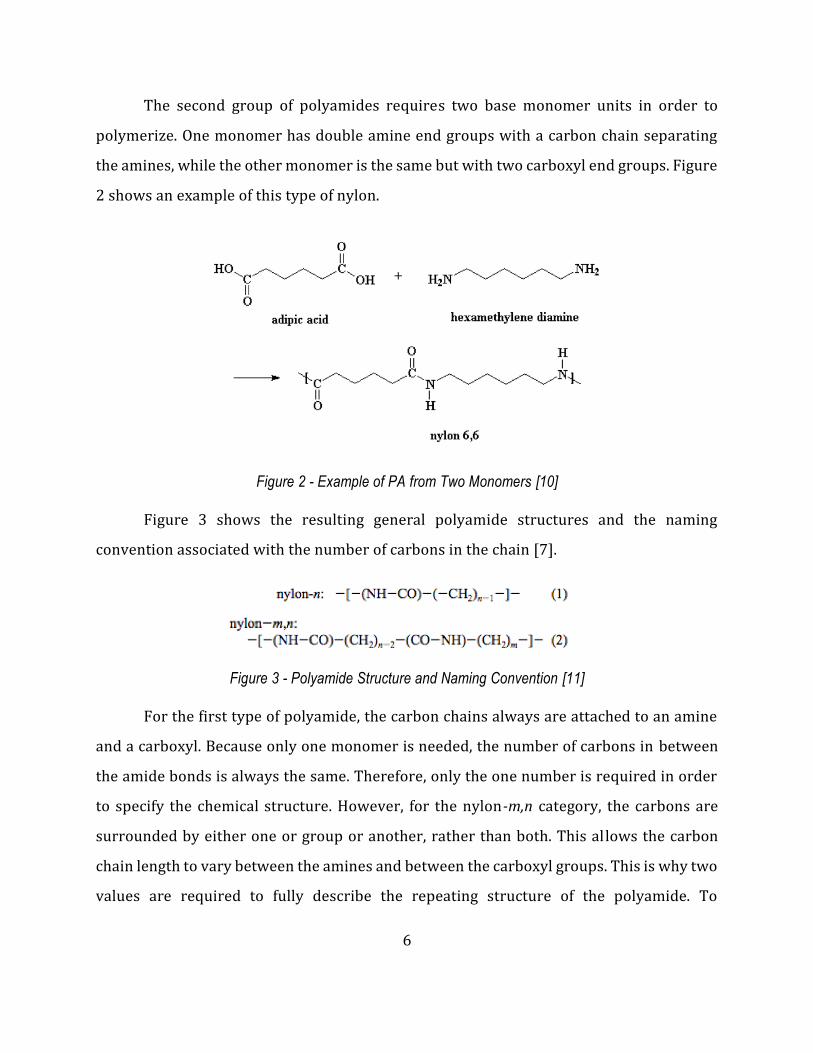
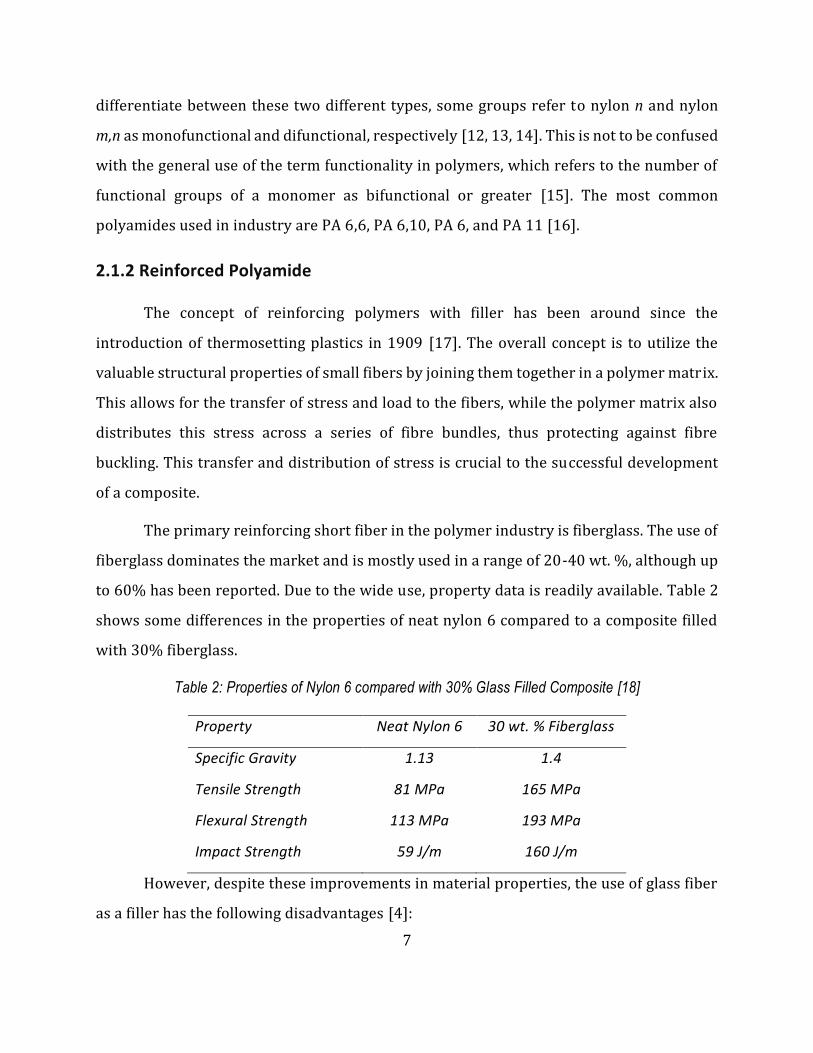
The second group of polyamides requires two base monomer units in order to
polymerize. One monomer has double amine end groups with a carbon chain separating
the amines, while the other monomer is the same but with two carboxyl end groups. Figure
2 shows an example of this type of nylon.
Figure 2 - Example of PA from Two Monomers [10]
Figure 3 shows the resulting general polyamide structures and the naming
convention associated with the number of carbons in the chain [7].
Figure 3 - Polyamide Structure and Naming Convention [11]
For the first type of polyamide, the carbon chains always are attached to an amine
and a carboxyl. Because only one monomer is needed, the number of carbons in between
the amide bonds is always the same. Therefore, only the one number is required in order
to specify the chemical structure. However, for the nylon-m,n category, the carbons are
surrounded by either one or group or another, rather than both. This allows the carbon
chain length to vary between the amines and between the carboxyl groups. This is why two
values are required to fully describe the repeating structure of the polyamide. To
7
differentiate between these two different types, some groups refer to nylon n and nylon
m,n as monofunctional and difunctional, respectively [12, 13, 14]. This is not to be confused
with the general use of the term functionality in polymers, which refers to the number of
functional groups of a monomer as bifunctional or greater [15]. The most common
polyamides used in industry are PA 6,6, PA 6,10, PA 6, and PA 11 [16].
2.1.2 Reinforced Polyamide
The concept of reinforcing polymers with filler has been around since the
introduction of thermosetting plastics in 1909 [17]. The overall concept is to utilize the
valuable structural properties of small fibers by joining them together in a polymer matrix.
This allows for the transfer of stress and load to the fibers, while the polymer matrix also
distributes this stress across a series of fibre bundles, thus protecting against fibre
buckling. This transfer and distribution of stress is crucial to the successful development
of a composite.
The primary reinforcing short fiber in the polymer industry is fiberglass. The use of
fiberglass dominates the market and is mostly used in a range of 20-40 wt. %, although up
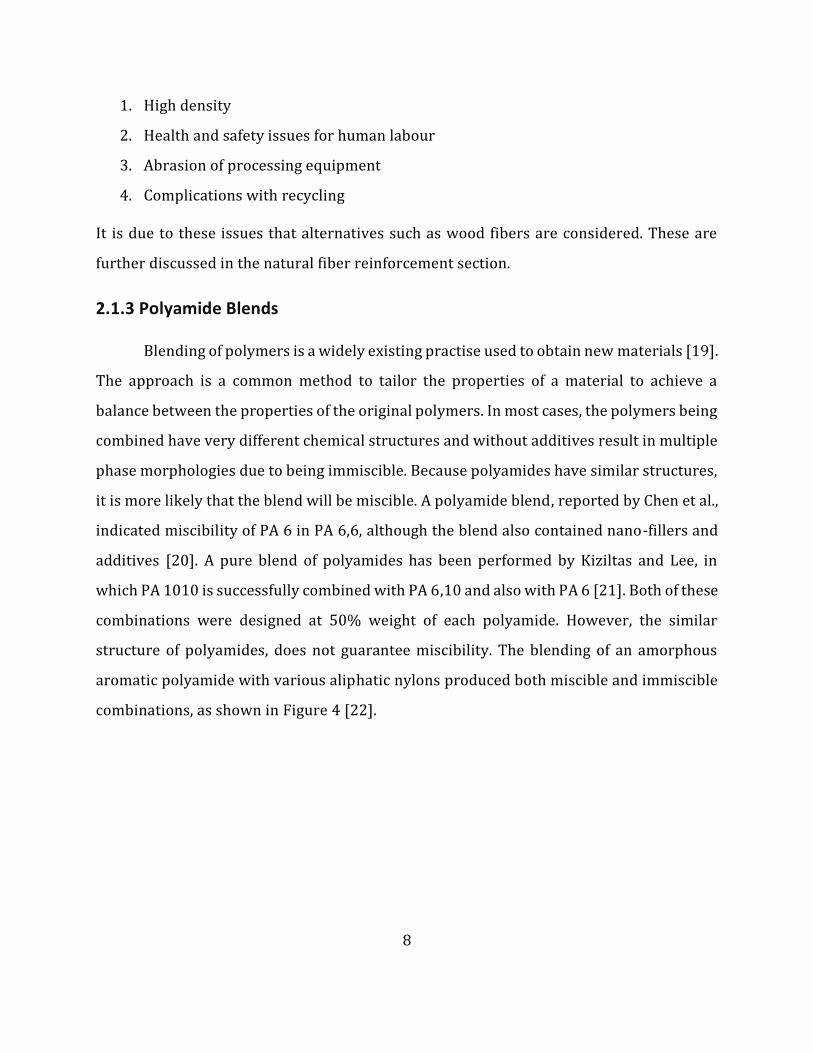
to 60% has been reported. Due to the wide use, property data is readily available. Table 2
shows some differences in the properties of neat nylon 6 compared to a composite filled
with 30% fiberglass.
Table 2: Properties of Nylon 6 compared with 30% Glass Filled Composite [18]
Property Neat Nylon 6 30 wt. % Fiberglass
Specific Gravity 1.13 1.4
Tensile Strength 81 MPa 165 MPa
Flexural Strength 113 MPa 193 MPa
Impact Strength 59 J/m 160 J/m
However, despite these improvements in material properties, the use of glass fiber
as a filler has the following disadvantages [4]:
8
1. High density
2. Health and safety issues for human labour
3. Abrasion of processing equipment
4. Complications with recycling
It is due to these issues that alternatives such as wood fibers are considered. These are
further discussed in the natural fiber reinforcement section.
2.1.3 Polyamide Blends
Blending of polymers is a widely existing practise used to obtain new materials [19].
The approach is a common method to tailor the properties of a material to achieve a
balance between the properties of the original polymers. In most cases, the polymers being
combined have very different chemical structures and without additives result in multiple
phase morphologies due to being immiscible. Because polyamides have similar structures,
it is more likely that the blend will be miscible. A polyamide blend, reported by Chen et al.,
indicated miscibility of PA 6 in PA 6,6, although the blend also contained nano-fillers and
additives [20]. A pure blend of polyamides has been performed by Kiziltas and Lee, in
which PA 1010 is successfully combined with PA 6,10 and also with PA 6 [21]. Both of these
combinations were designed at 50% weight of each polyamide. However, the similar
structure of polyamides, does not guarantee miscibility. The blending of an amorphous
aromatic polyamide with various aliphatic nylons produced both miscible and immiscible
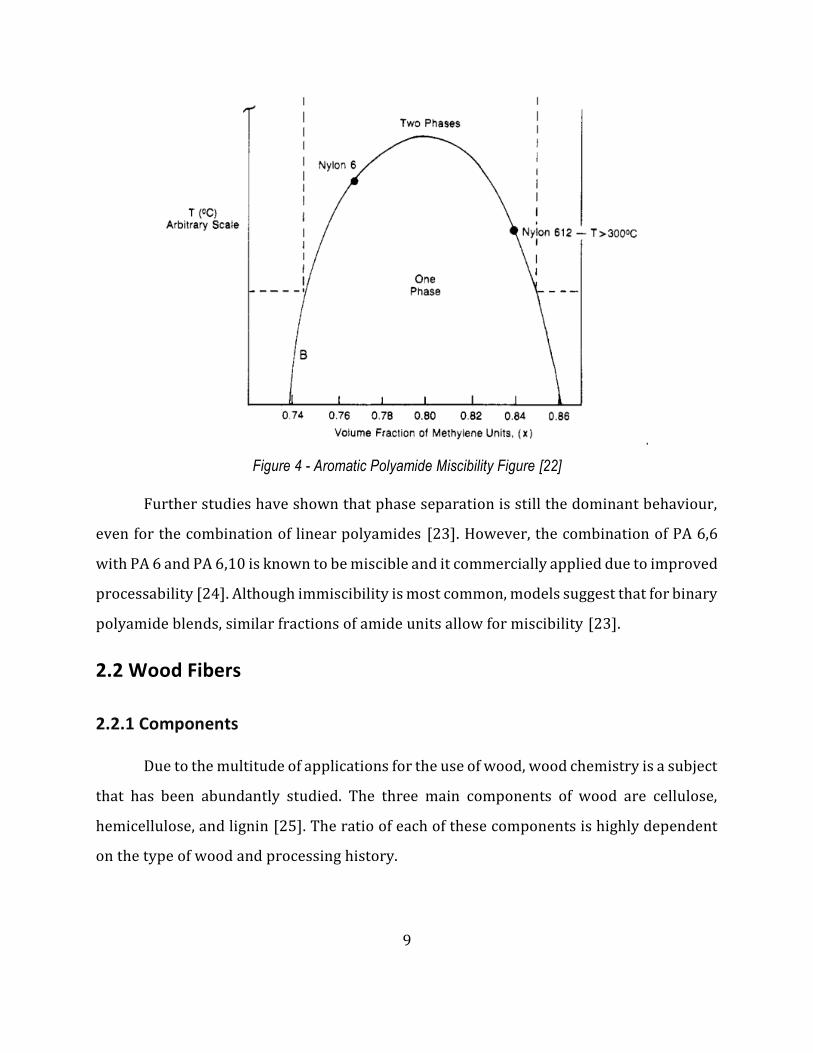
combinations, as shown in Figure 4 [22].
9
Figure 4 - Aromatic Polyamide Miscibility Figure [22]
Further studies have shown that phase separation is still the dominant behaviour,
even for the combination of linear polyamides [23]. However, the combination of PA 6,6
with PA 6 and PA 6,10 is known to be miscible and it commercially applied due to improved
processability [24]. Although immiscibility is most common, models suggest that for binary
polyamide blends, similar fractions of amide units allow for miscibility [23].
2.2 Wood Fibers
2.2.1 Components
Due to the multitude of applications for the use of wood, wood chemistry is a subject
that has been abundantly studied. The three main components of wood are cellulose,
hemicellulose, and lignin [25]. The ratio of each of these components is highly dependent
on the type of wood and processing history.
10
Cellulose is the main cell wall component, making up to 40-45% of the wood fiber.
Linear celluloses chains are stiff and straight which favours the organization of these
chains into bundles with crystalline order held by hydrogen bonds. The unorganized chains
also exist in disordered amorphous regions.
Hemicellulose consists mostly of sugars other than glucose, although not excluding
glucose [26]. The types of sugar present are strongly dependent on the tree type but can
be generalized between softwood and hardwood. Softwood trees, also known as
evergreens due to the retainment of leaves over the winter, has xylose as the principle
sugar making up the hemicellulose. Whereas the hemicellulose of hardwood trees has
mannose as its primary sugar structure. Other sugars present include glucose, galactose,
arabinose, and rhamnose. The degree of polymerization of hemicellulose is in the range of
100-200, while cellulose is around 7,000-10,000 repeating units [26]. The lower molecular
weight and amorphous structure makes hemicellulose more soluble and susceptible to
hydrolysis than cellulose [27].
Lignin occurs in wood fiber as approximately 20-30% of the weight composition. It
serves as the “matrix” between wood fibers, holding everything together [28]. It also acts
as a barrier to enzymatic degradation of the cell wall. Lignin has a very complicated
network structure.
2.2.2 Pulping Processes
The method in which wood is refined into compoundable wood fiber has a
significant effect on its composition and material properties. There are four general types
of pulping processes: chemical, semi-chemical, chemi-mechanical, and mechanical [27].
The two processes relevant to this thesis, based on the wood fibers in consideration, are
chemical pulping and mechanical pulping.
11
Chemical Pulping
Chemical pulping is the process that breaks down the chemical structure of lignin,
causing it to become soluble in liquid [27]. A common chemical pulping process is called
the Kraft process, which uses sodium hydroxide and sodium sulfide as the chemicals that
break down the lignin [29]. In 1996, about 75-80% of pulping in the United States is
performed with the Kraft method [27]. The removal of most lignin results in a high strength
pulp with only 3-5% lignin content. The pulp yield from this process ranges between 45-
70%, depending on how much bleaching is required [27]. Despite chemical recovery
methods, chemical pulping remains higher cost compared to mechanical pulping.
Mechanical Pulping
A mechanical puling process repeatedly compresses and decompresses fiber [30].
The most common method disintegrates wood chips between revolving metal disks. High
temperature and pressure is used to promote fiber liberation [27]. Because lignin is not
removed through any chemical solution, the yield for this process is between 92-96% [27].
However, the strength of the resulting pulp is lower than that of chemical pulping.
2.2.3 Thermal Stability
The thermal decomposition of wood fibers is a complex reaction with unknown
mechanisms. At lower-temperature thermal degradation, the decomposition of the
material is attributed to the following processes [26]:
1. Reduction in molecular weight
2. Appearance of free radicals
3. Elimination of water
4. Formation of carbonyl, carboxyl, and hydroperoxide groups (especially in air)
5. Evolution of carbon monoxide and carbon dioxide
12
Concerning pure cellulose, below 200°C it is difficult to distinguish between the effects of
temperature accelerating the regular aging reaction versus the onset of thermal
degradation [26]. However, above 200 °C, thermal degradation becomes more prominent.
Nevertheless, the main weight loss of cellulose does not occur until 315-400 °C [31].
2.3 Natural Fiber Reinforcement
2.3.1 Incentives and Disadvantages
Wood and natural fiber filled composites have been quite successful replacements
over traditional reinforcing fillers such as glass fibers and talc fillers. Fiber reinforcement
of thermoplastic polymers is known to improve tensile and flexural modulus and strength
while negatively affecting ductility and impact resistance [32]. Not only can this reduce the
overall cost of plastic components, but it can also add value to an agricultural product [33].
Some advantages of natural fibers include [34, 35]:
1. Being renewable
2. Low Cost
3. Low density
4. Safe processing
5. Recyclable at the end of the product life
Because natural fibers are grown, they act as carbon storage, thus reducing the
carbon footprint of a composite part. Additionally, the low cost and low density (compared
to glass) simultaneously reduces price and weight of the material. The use of natural fibers
in processing is not hazardous to workers or abrasive to the process equipment, as is the
case with glass fibers. This introduces more cost savings as mitigation of hazards is not
necessary and the equipment would last longer. However, there are also some challenges
that may arise with the use of natural fiber in general:
13
1. Seasonal production limitations
2. Availability globally varies
3. Nonhomogeneous properties
4. Poor thermal stability
5. High moisture absorbance
These disadvantages need to be addressed in order to achieve a commercially viable
product. Other applications for wood fiber have already addressed some of these issues.
For example, the paper industry is capable of handling the seasonal growth schedule and
producing a uniform, quality product. Wood pulp is a global commodity. The issue of
thermal degradation remains a challenge because the high processing temperatures during
manufacturing nylon parts can induce degradation reactions which results in voids
occurring in the composite [36]. These voids negatively impact mechanical properties due
to poor stress transfer [37, 38, 39]. Additionally, voids in a composite are potential failure
initiators and can propagate crack growth [38].
2.3.2 Previous Work
The use of cellulose fiber as a filler in nylon has been considerably investigated in
the past. In 1984, Klason et al. observed that cellulose fillers in PA 6 increased elastic
modulus but decreased strength and elongation. A considerable darkening of the
composite was also observed due to chemical degradation [40]. A study by Sears et al. has
compared a variety of wood cellulose pulps in a PA 6 matrix and found that the best results
come from the higher cellulose purity pulps [41]. Xu has performed an extensive study on
cellulose in both PA 6 and PA 6,6, looking at effects of molding procedure, processing
temperature, and thermal degradation [34]. Other natural fibers have also been considered
such as wheat straw [4, 36], kenaf, flax and hemp [42]. A recent study by Kiziltas et al. has
investigated the use of microcrystalline cellulose in PA 6 [43, 44]. Similar to this study,
Kiziltas et al. investigates cellulose filler in blends of PA 10,10 with PA 6 and PA 6,10 [21].
14
Many studies have used various means of reducing the polyamide melt temperature
in an effort to mitigate thermal degradation. Misra et al. lowered the melt temperature of
PA 6 with three percent lithium chloride salt. This reduced the melt temperature by 24 °C
and resulted in an increase of tensile modulus and strength using hemp fibers [45]. Another
study used a combination of lithium chloride salt as well as a plasticizer to reduce the melt
temperature for a composite containing wheat straw [4].
Without changing melt temperature, Sears et al. published a patent that changed the
extrusion process to minimize temperature, thus giving the degradation less energy to
proceed. They proposed an extrusion with initial temperatures just slightly above the
melting temperature of the polyamide and then lower intermediate temperatures as the
shear heating would maintain the melted state of the polyamide without needing the
additional heating from the extruder. This resulted in cellulose composites with reduced
discoloration [46].
Another approach taken to reduce thermal degradation is to try to increase the
thermal stability of the natural fiber. A study by Vedoy shows increase of the onset of
thermal degradation through silane modification and exposure to ultraviolet light [36]. The
use of ultraviolet light is discussed more in the next section.
2.4 Ultraviolet Light Treatment
The use of ultraviolet light to improve thermal stability is a new approach used by
Vedoy in the study of wheat straw fibers. It is reported that, for wheat straw fibers, 15
minutes of exposure to high power UV irradiation increases the temperature at which 2%
of weight is lost by 50 °C [36]. Studies of UV effects on wood suggest that the UV irradiation
alters or removes the lignin and hemicellulose present in natural fibers through complex
photochemical reactions [47]. It is also reported that long-term UV exposure significantly
reduces the amount of lignin present in wood [48].
15
2.5 Carbon Fiber
Modern carbon fiber was developed in the 1970s for use in aerospace industry [49].
However, the high cost kept its application limited to aerospace and high-end sporting
goods. Carbon fiber is considered the most promising candidate for future lightweight
materials due to its high stiffness and strength combined with the low density of the fiber
backbone. However, the high cost prevents the commercial use in cost competitive
applications. Even though it is currently not an economical option, a comparison of carbon
fiber development history to that of glass fiber indicates that there is potential for
technological improvements to allow for feasibility in the future [50].
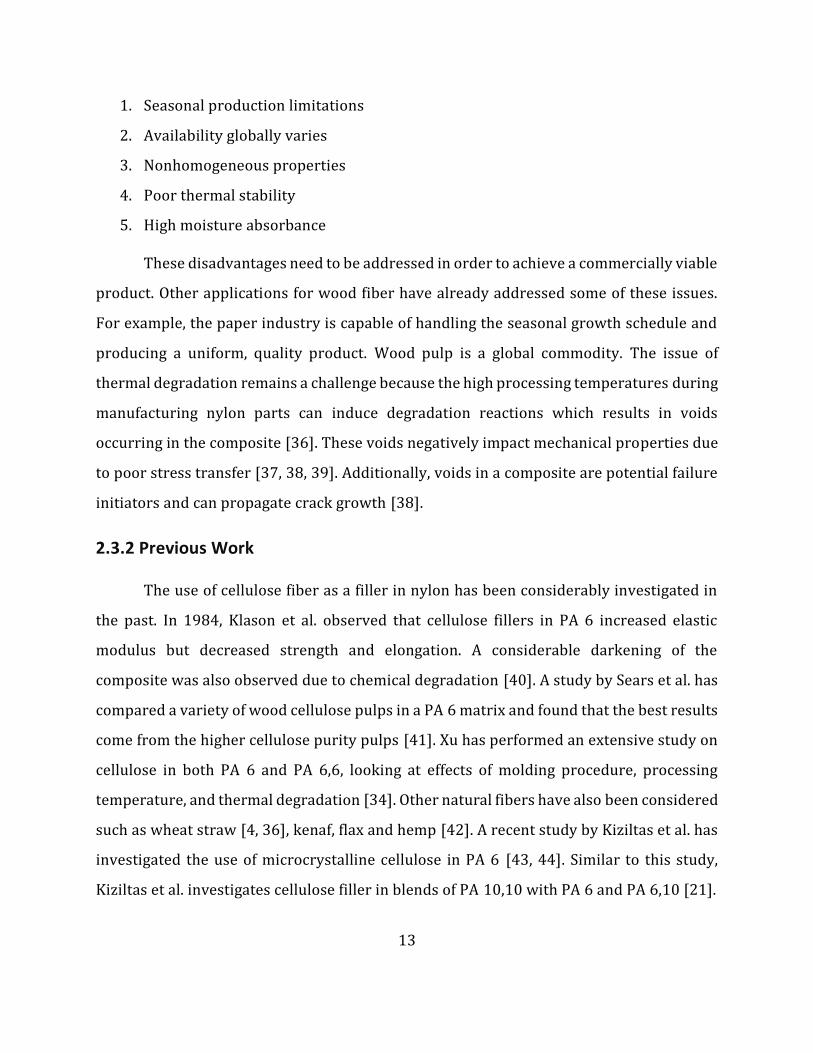
A study by Karsli and Aytac, demonstrated the increase of mechanical properties of
PA 6 as carbon fibers were added, up to 20 percent [51]. Figure 5, below, demonstrates the
increase in modulus and also shows that initial fiber length did not affect the modulus.
Figure 5 - Tensile Modulus of Nylon 6 and Carbon Fiber Composites [51]
The steady modulus in part B of Figure 5 is due to fiber breakage during the
extrusion and injection moulding process. Increased fiber filling leads to more interaction,
which causes breakage of the fibers. This leads to initial size differences of the fibers having
less effect on the material properties [52].
16
3. 0 Experimental
3.1 Materials
3.1.1 Polyamides
Industrial partners supplied the polyamides (PA) used in this research. The recycled
PA 6 was kindly supplied in the form of pellets from Wellman Plastics Recycling, LLC.
Differential scanning calorimetry (DSC) and scanning electron microscopy (SEM) analysis
showed that there are small amounts of another material identified as polypropylene
existing in the recycled PA 6. The PA 6,10 and PA10,10 were obtained from Vestamid by
Evonik Industries. The PA 6,10 is 62% renewable, while PA 10,10 is 100% renewable (bio-
based). Product specifications can be found in Appendix A.
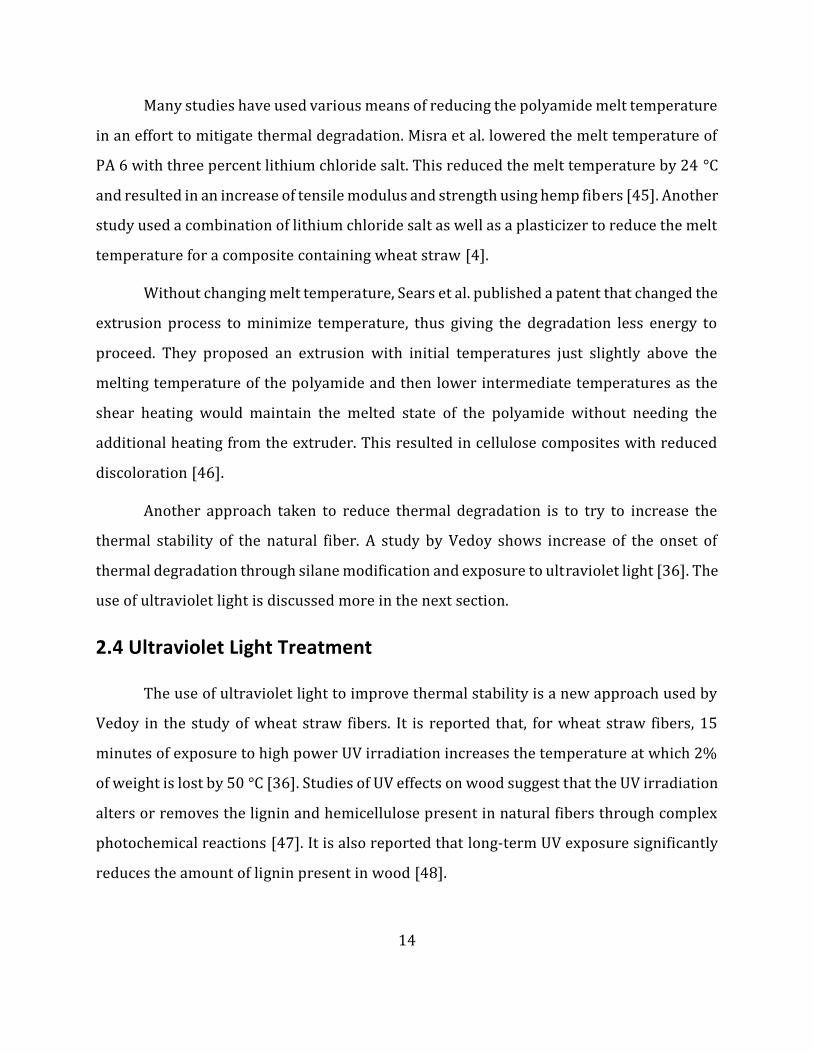
3.1.2 Wood Fibers
The wood fibers and cellulose were supplied from three commercial companies.
Woodforce provided two generations of wood fiber pellets, referred to in this thesis as
Woodforce 1 and Woodforce 2. The difference between these two generations is unknown
as the supplier did not disclose it. These fibers are known to be mechanically pulped and
come in the form of square pellets, as shown in Figure 6.
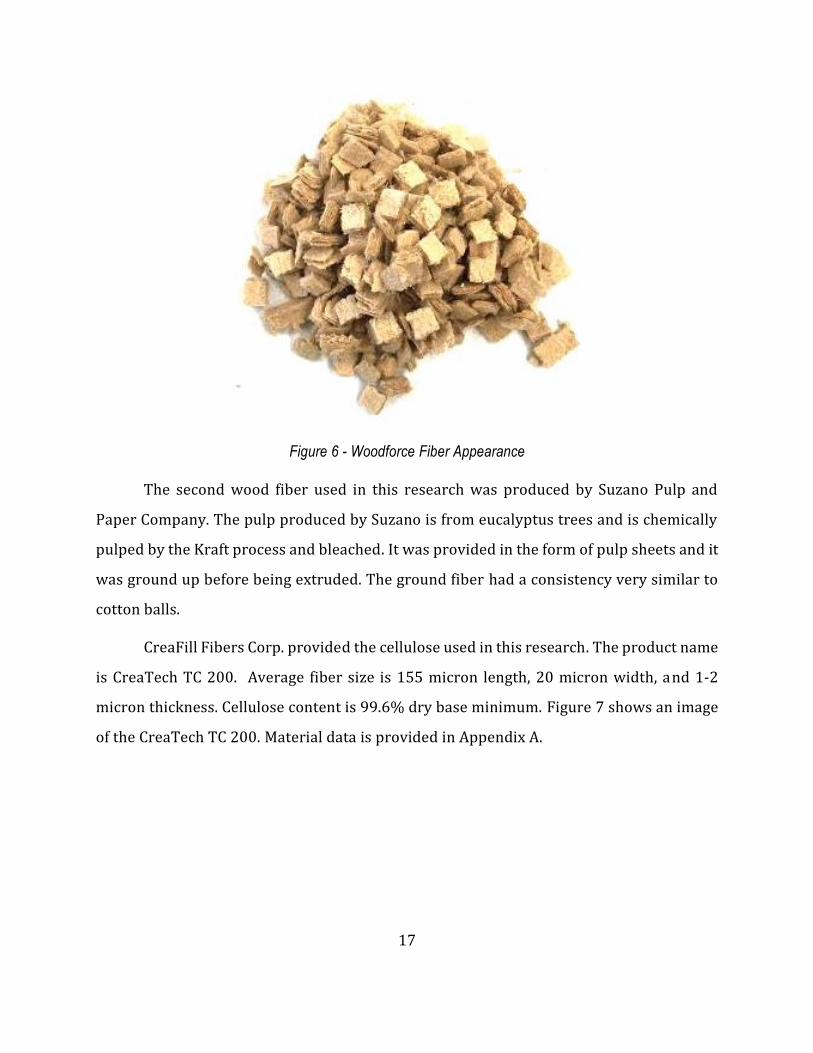
17
Figure 6 - Woodforce Fiber Appearance
The second wood fiber used in this research was produced by Suzano Pulp and
Paper Company. The pulp produced by Suzano is from eucalyptus trees and is chemically
pulped by the Kraft process and bleached. It was provided in the form of pulp sheets and it
was ground up before being extruded. The ground fiber had a consistency very similar to
cotton balls.
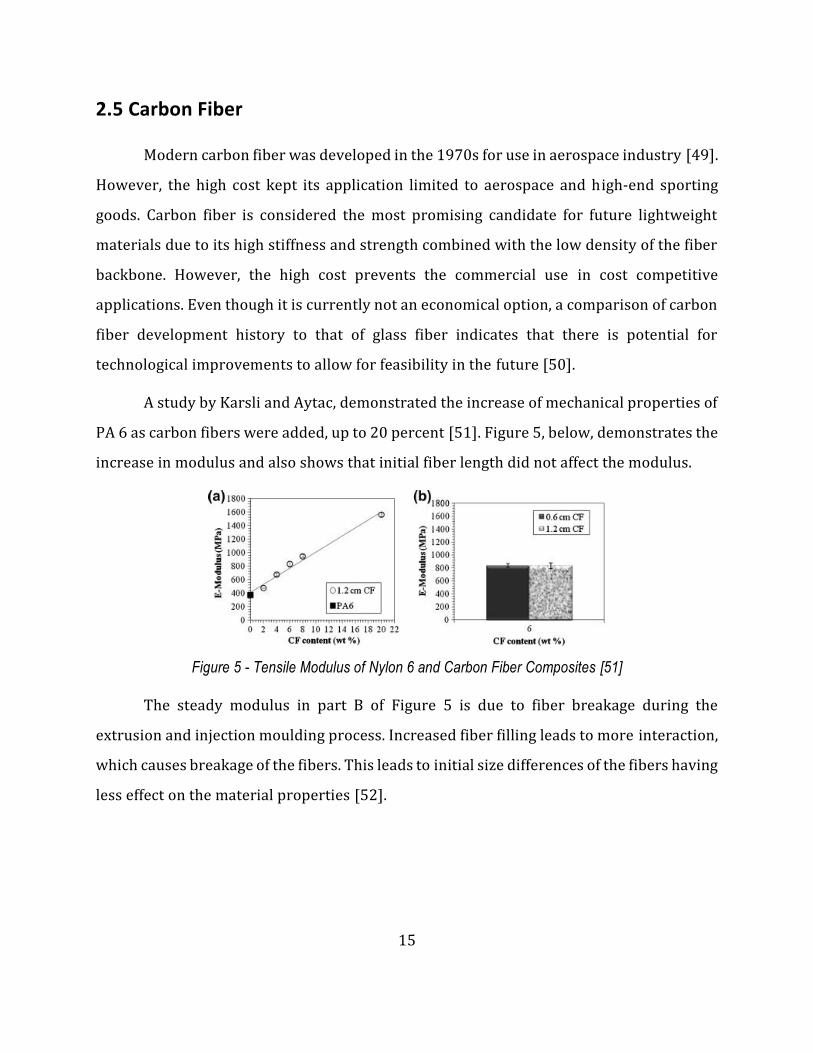
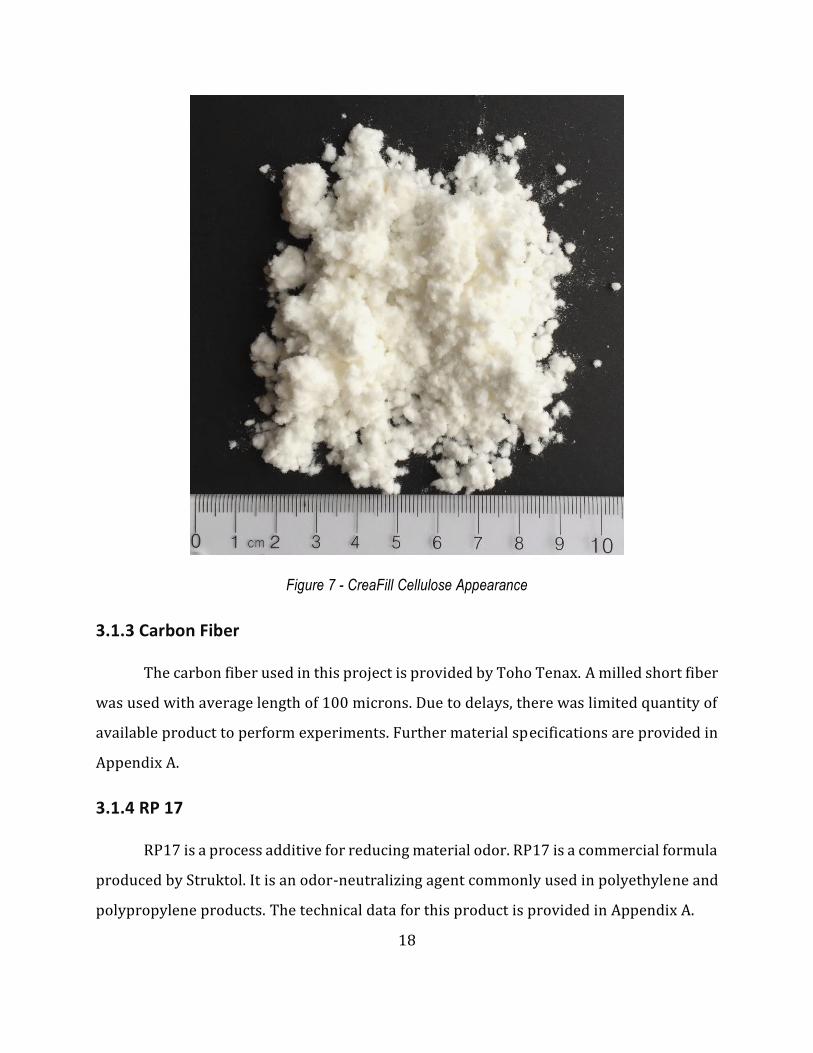
CreaFill Fibers Corp. provided the cellulose used in this research. The product name
is CreaTech TC 200. Average fiber size is 155 micron length, 20 micron width, and 1-2
micron thickness. Cellulose content is 99.6% dry base minimum. Figure 7 shows an image
of the CreaTech TC 200. Material data is provided in Appendix A.
18
Figure 7 - CreaFill Cellulose Appearance
3.1.3 Carbon Fiber
The carbon fiber used in this project is provided by Toho Tenax. A milled short fiber
was used with average length of 100 microns. Due to delays, there was limited quantity of
available product to perform experiments. Further material specifications are provided in
Appendix A.
3.1.4 RP 17
RP17 is a process additive for reducing material odor. RP17 is a commercial formula
produced by Struktol. It is an odor-neutralizing agent commonly used in polyethylene and
polypropylene products. The technical data for this product is provided in Appendix A.
19
3.2 Procedures
3.2.1 Thermal stability
Thermal gravimetric analysis (TGA) of the natural fibers was performed using TA
Instrument’s TGA Q500. A starting weight of 8-12 mg of fiber is heated from 25˚C to 600˚C
at heating rates varying from 5˚C/min to 50˚C/min. These heating conditions were
performed under nitrogen and air environments at a flow rate of 30 mL/min. Reaction
kinetics are evaluated through the variation of rates. The TGA data was used to measure
the thermal stability by calculating temperature of thermal degradation and activation
energy.
TGA of composites was performed on a Mettler Toledo analyzer on samples of about
10 mg. Samples were created by cutting up extra injection moulded bars into small chips,
approximately 2-3 mg each. These chips were obtained from multiple locations from
multiple bars in order to minimize possible effects of poor distribution. Each sample was
scanned from 25 °C to 600 °C at a heating rate of 10 °C/min under nitrogen with a flow rate
of 30 mL/min to avoid sample oxidation.
3.2.2 Melting Point and Crystallinity
Differential scanning calorimetry (DSC) was performed on a Mettler Toledo
Differential Scanning Calorimeter. Samples were prepared at approximately 10 mg weight,
in a similar fashion to the TGA sample preparation. The sample was first heated from 25 °C
to 300 °C at a rate of 20 °C/min to remove any thermal history, then held at 300 °C for 5
min, cooled from 300 °C to 0 C at a rate of -10 °C/min, held at 0 C for 5 min, and heated
again to 300 °C at 10 °C/min.
The DSC data was used to calculate melting and crystallization temperatures and
crystallinity. For a pure polymer, Equation 1 describes how the weight fraction of
crystallinity would be calculated [53].
20
𝑋𝑐 =Δ𝐻𝑓
Δ𝐻𝑓° [1]
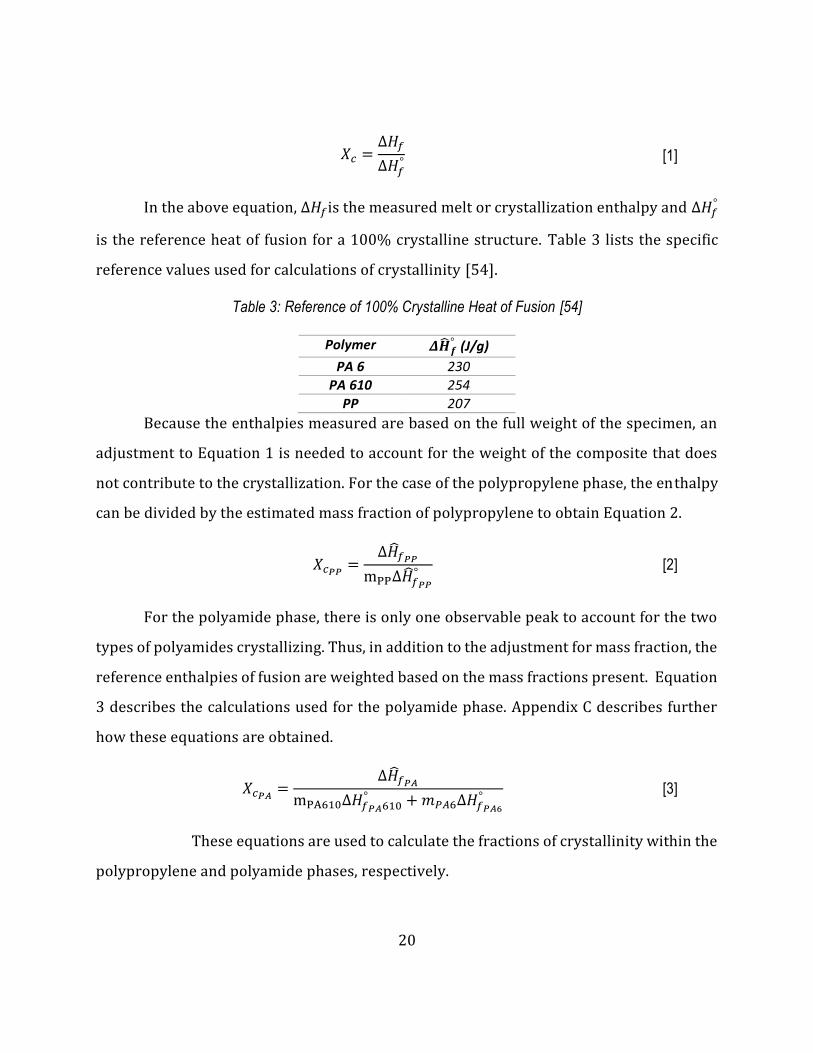
In the above equation, Δ𝐻𝑓is the measured melt or crystallization enthalpy and Δ𝐻𝑓°
is the reference heat of fusion for a 100% crystalline structure. Table 3 lists the specific
reference values used for calculations of crystallinity [54].
Table 3: Reference of 100% Crystalline Heat of Fusion [54]
Polymer 𝜟�̂�𝒇° (J/g)
PA 6 230
PA 610 254
PP 207
Because the enthalpies measured are based on the full weight of the specimen, an
adjustment to Equation 1 is needed to account for the weight of the composite that does
not contribute to the crystallization. For the case of the polypropylene phase, the enthalpy
can be divided by the estimated mass fraction of polypropylene to obtain Equation 2.
𝑋𝑐𝑃𝑃=
Δ�̂�𝑓𝑃𝑃
mPPΔ�̂�𝑓𝑃𝑃
° [2]
For the polyamide phase, there is only one observable peak to account for the two
types of polyamides crystallizing. Thus, in addition to the adjustment for mass fraction, the
reference enthalpies of fusion are weighted based on the mass fractions present. Equation
3 describes the calculations used for the polyamide phase. Appendix C describes further
how these equations are obtained.
𝑋𝑐𝑃𝐴=
Δ�̂�𝑓𝑃𝐴
mPA610Δ𝐻𝑓𝑃𝐴610° + 𝑚𝑃𝐴6Δ𝐻𝑓𝑃𝐴6
° [3]
These equations are used to calculate the fractions of crystallinity within the
polypropylene and polyamide phases, respectively.
21
3.2.3 Morphology and Size
Scanning electron microscopy (SEM) was applied to capture images of composite
surfaces. The machine used is a JEOL 6610 SEM. The surfaces studies were fractured from
the notched Izod impact tests. Surfaces were carbon coated prior to SEM imaging. The
micrograph images were used to evaluate the morphology of the samples, size and
distribution of phase.
3.2.4 Compounding
The first set of composites was extruded using a MiniLab Extruder Haake produced
by Thermo Electron Corporation. Both, fibers and polyamide, were reduced to smaller size
before extrusion using a Retsch ZM 200 centrifugal mill. A two-millimeter sieve was used
to reduce the side of the polyamide pellets and a one-millimeter sieve was used for the
fibers. The size reduction of the PA pellets and fibers allowed for better mixing and
dispersion prior to getting extruded. After being ground, material was dried overnight in a
vacuum oven at 50 ˚C. The extruder temperature was set to 240 ˚C with a screw speed of
60 RPM.
The second set of composites was extruded using a ThermoHaake Rheomex twin-
screw extruder. All material extruded was dried overnight in an oven at 70˚C. Maximum
screw temperature is 230 °C at the screw tip, with zones reduced by 5 ˚C every two zones
such that the first zone is 215 ˚C, as described in Table 4. Screw speed is controlled
manually but approximated to be 120 RPM. All samples were extruded twice in order to
ensure even distribution of cellulose and polyamide.
Table 4: Extruder Temperature Profile
Zone 1 2 3 4 5 6 7 Tip/die
T (°C) 215 215 220 220 225 225 230 230
22
3.2.5 Injection Molding
The first set of composites was injection molded using a Ray-Ran RR/TSMP.
Extruded samples were cut into segments less than 20 mm in length. These were dried in
a vacuum oven overnight. Extruded pellets were placed in the barrel of the injection molder
and left for approximately 10 minutes to heat up. The barrel temperature was set at 240 ˚C
and the mould plates were set at 80 ˚C. Pressure applied was approximately 100 psi.
The second set of composites were then injection molded using a Boy 80M injection
molder at a maximum temperature of 246 °C. The initial temperature zone was set at 237˚C
and was gradually raised to 246˚C at the injection point. Max pressure was set to 1,000 psi.
The mould temperature was approximately 85˚C. Compounded material was dried
overnight and kept in the oven until immediately before injection. Each shot would
produce an ASTM standard Type-I tensile dumbbell and flexural bar samples.
3.2.6 Mechanical Properties
The first set of composites underwent three-point bending flexural tests using a
TestResources Inc. 120Q1000 machine. Flexural properties were determined according to
ASTM D790-10 procedure A. The test samples were kept at 50% relative humidity for a
minimum of two days after being injection molded before being tested.
The second set of mechanical tests was performed after one week of samples being
at 23ºC±2 and 50%±5 relative humidity. Tensile and flexural tests were carried out using
an Instron 3366, adhering to ASTM D 638-10 and ASTM D 790-10, respectively. For tensile
testing, ASTM Type I bars were tested at a rate of 5 mm/min. The Instron was equipped
with a 5-kN load cell and a travel extensometer. Flexural tests were performed using ASTM
Procedure A at 1 mm/min up to 5% strain. At least six samples per loading level were
tested for tensile and flexural properties.
All Izod impact testing were conducted according to ASTM D256. A 10 pound
pendulum was used to hit the notched sample on a Testing Machines Inc. Model 43-02
23
impact test machine. The first set of samples tested 5-8 samples per composition while the
second set was adjusted such that 10-12 samples were tested for impact properties due to
high levels of deviation.
3.2.7 Ultraviolet Treatment
Wood fibers were exposed to ultraviolet (UV) light for the duration of 15 minutes.
Fibers were ground using the Retsch ZM 200 centrifugal mill with a sieve of 1 mm.
Approximately 50 mg of fiber was spread over an aluminum dish. The custom built UV
radiation system used a 1.8 kW UV light source. The spectral output of this light is shown
in Figure 8.
Figure 8 - UV Light Spectral Output *Reference*: Fusion Systems Inc
24
4.0 Thermal Stability of Wood Fibers
4.1 Introduction
To begin this research, the wood fibres, Woodforce 1, Woodforce 2, and Suzano fiber
are compared prior to compounding with polyamide. A thermal analysis is performed to
compare thermal properties before the extrusion process. Using a range of heating rates
allowed the calculation of thermal degradation kinetics. Also compared, is the
temperatures at which the fibers have lost 5 wt-% of their initial weight, referred to as T5%.
An isothermal test is run at 250˚C because this is the general processing temperature of
nylons in industry. Finally, fibers exposed to UV light for the duration of 15 minutes are
compared to the unexposed fibers for changes in thermal stability.
4.2 Results and Discussion
4.2.1 Weight Loss vs. Heating Rate
Figure 9 shows the TGA curve trend over the range of heating rates used. It can be
seen that the curves are all very similar with an offset in the drop of sample weight by
temperature. This offset is consistently in order of heating rate for all fibers observed. The
shift in the curve to the right is attributed to higher heating rates. At the widest range of
temperature difference, there is approximately a 50˚C difference in the temperature in
which the Suzano fiber reaches 50 wt-% of its original weight when comparing the heating
rates of 5˚C/min and 25˚C/min.

25
Figure 9 - Suzano Nitrogen TGA Curves
The observed curve shift is expected due to the limited control over the heating
environment. The thermocouple inside the TGA instrument cannot account for heat
transfer within the fiber sample. Additionally, a slower rate of temperature increase allows
for more time for the thermal degradation reaction to progress.
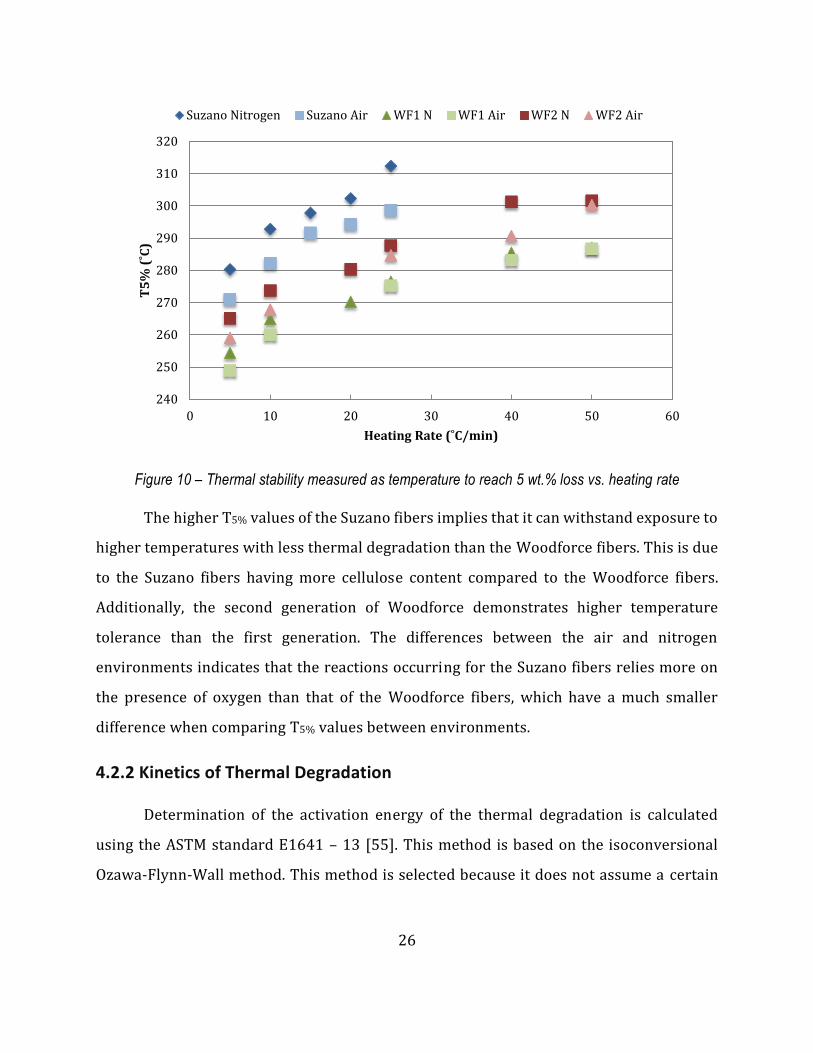
For each heating rate, the temperature at which the fiber has lost five percent of its
initial weight is shown in Figure 10. It can be observed that the Suzano fiber has the higher
T5% values for each heating rate followed by WF2 fibers in the middle and WF1 having the
lowest values. There is also an increase in temperature when comparing samples that were
heated in nitrogen as opposed to those heated in air.
0
10
20
30
40
50
60
70
80
90
100
150 200 250 300 350 400 450 500 550 600
Pe
rce
nt
(%)
Temperature (˚C)
5 C/ min 10 C / min 15 C / min 20 C / min 25 C / min
26
Figure 10 – Thermal stability measured as temperature to reach 5 wt.% loss vs. heating rate
The higher T5% values of the Suzano fibers implies that it can withstand exposure to
higher temperatures with less thermal degradation than the Woodforce fibers. This is due
to the Suzano fibers having more cellulose content compared to the Woodforce fibers.
Additionally, the second generation of Woodforce demonstrates higher temperature
tolerance than the first generation. The differences between the air and nitrogen
environments indicates that the reactions occurring for the Suzano fibers relies more on
the presence of oxygen than that of the Woodforce fibers, which have a much smaller
difference when comparing T5% values between environments.
4.2.2 Kinetics of Thermal Degradation
Determination of the activation energy of the thermal degradation is calculated
using the ASTM standard E1641 – 13 [55]. This method is based on the isoconversional
Ozawa-Flynn-Wall method. This method is selected because it does not assume a certain
240
250
260
270
280
290
300
310
320
0 10 20 30 40 50 60
T5
% (
˚C)
Heating Rate (˚C/min)
Suzano Nitrogen Suzano Air WF1 N WF1 Air WF2 N WF2 Air
27
specific reaction mechanism and has been used in literature to report kinetic parameters
of various natural fibers [56].
The fundamental rate equation that the method is based on is given in Equation 4.
𝑑𝛼
𝑑𝑡= 𝑘(𝑇)𝑓(𝛼) [4]
This states that the rate of thermal degradation (d/dt) is a function of temperature
(T) and conversion (). The conversion () used in this analysis is calculated as shown in
Equation 5.
𝛼 =𝑤𝑖𝑛𝑖𝑡𝑖𝑎𝑙 − 𝑤
𝑤𝑖𝑛𝑖𝑡𝑖𝑎𝑙 − 𝑤𝑓𝑖𝑛𝑎𝑙 [5]
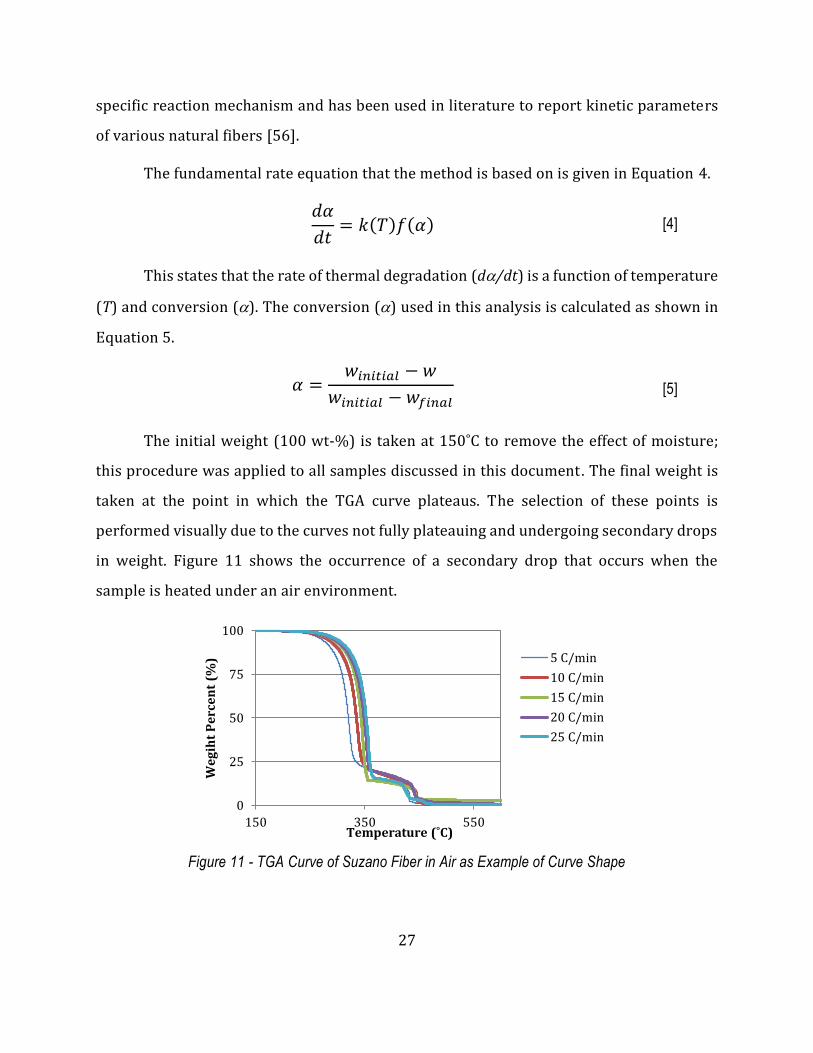
The initial weight (100 wt-%) is taken at 150˚C to remove the effect of moisture;
this procedure was applied to all samples discussed in this document. The final weight is
taken at the point in which the TGA curve plateaus. The selection of these points is
performed visually due to the curves not fully plateauing and undergoing secondary drops
in weight. Figure 11 shows the occurrence of a secondary drop that occurs when the
sample is heated under an air environment.
Figure 11 - TGA Curve of Suzano Fiber in Air as Example of Curve Shape
0
25
50
75
100
150 350 550
We
gih
t P
erc
en
t (%
)
Temperature (˚C)
5 C/min
10 C/min
15 C/min
20 C/min
25 C/min
28
The secondary thermal degradation is ignored in these calculations due to the onset
temperature range being higher than expected processing conditions.
The dependence of the reaction rate to temperature is described by the Arrhenius
equation, given in Equation 6.
𝑘(𝑇) = 𝐴𝑒𝑥𝑝 (−𝐸𝑎
𝑅𝑇) [6]
Additionally, the rate equation is transformed to change with temperature by
dividing both sides by the heating rate (). This can be done because the heating rate is
constant throughout the entire TGA curve. This results in Equation 7.
𝑑𝛼
𝑑𝑇=
𝐴
𝛽exp (−
𝐸𝑎
𝑅𝑇) 𝑓(𝛼) [7]
This equation is then integrated numerically and results in a linear relation between
the log of the heating rate versus the reciprocal of temperature at a desired conversion
amount. Plotting log(𝛽) versus (1/T) results in a linear relation in which that slope may be
used to calculate activation energy according to Equation 8. Many functions exist for the
approximation of the integral with respect to temperature. The approximation function
used by the ASTM standard used a table of integration constants that provide the variable
b and Equation 8, below.
𝐸𝑎 = −𝑅
𝑏× 𝑠𝑙𝑜𝑝𝑒 [8]
The ASTM standard recommends using a conversion of 5 wt-% but requires that
any amount chosen must be below 20 wt-%. In this analysis, 3 conversions were selected
in order for comparison of values. These conversions are 5, 10 and 15 wt-%. Note that this
approach considers the change in weight (wt-%) measured by TGA as an approximation of
chemical conversion assuming that the result of thermal degradation are volatile products.
Table 5 lists the calculated activation energies for each conversion.
29
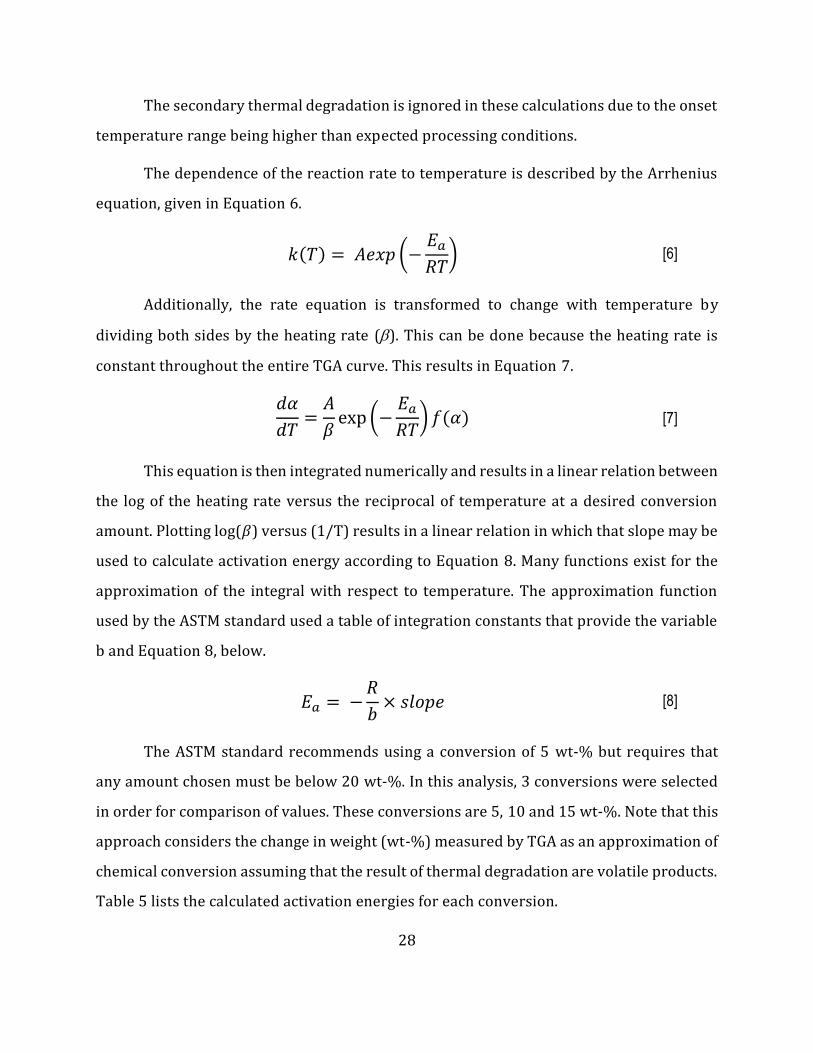
Table 5: Activation Energy of Fibers
Activation Energy (kJ/mol)
Conversion 5% 10% 15%
Air
Suzano 125.0 122.3 123.6
WF 1 135.9 143.4 149.3
WF 2 136.6 132.5 129.2
Nitrogen
Suzano 141.5 141.2 143.2
WF 1 162.2 164.2 166.5
WF 2 138.4 139.8 143.4
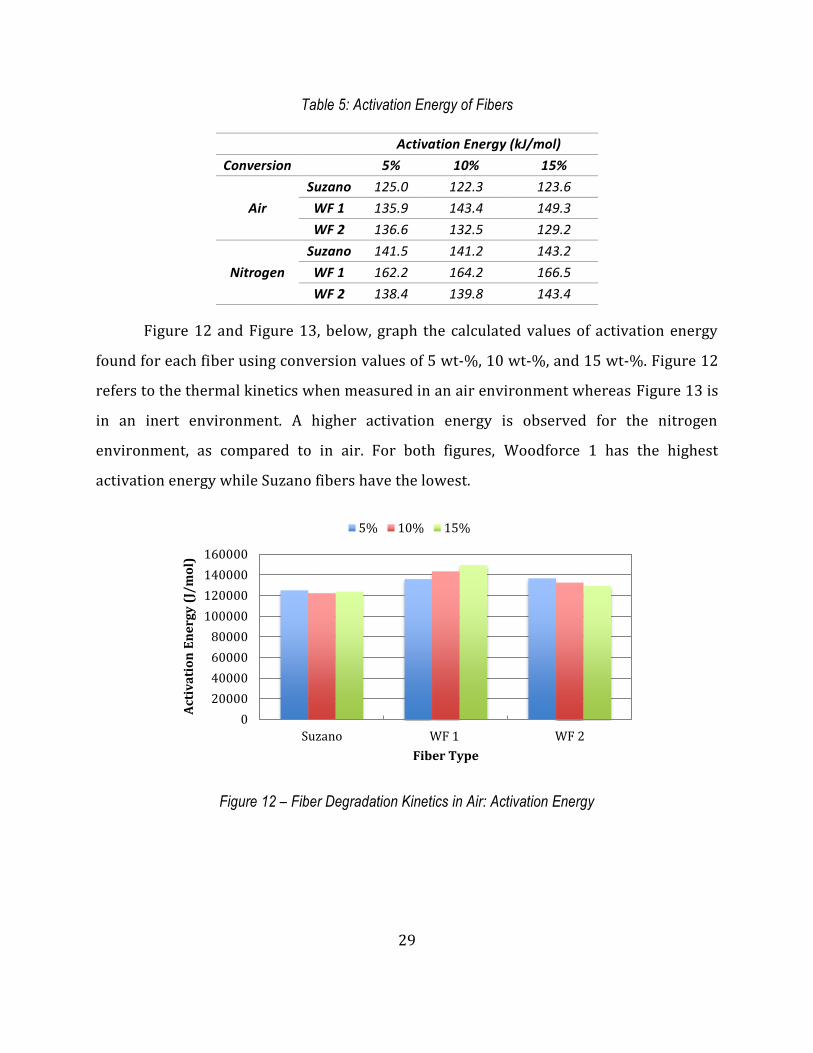
Figure 12 and Figure 13, below, graph the calculated values of activation energy
found for each fiber using conversion values of 5 wt-%, 10 wt-%, and 15 wt-%. Figure 12
refers to the thermal kinetics when measured in an air environment whereas Figure 13 is
in an inert environment. A higher activation energy is observed for the nitrogen
environment, as compared to in air. For both figures, Woodforce 1 has the highest
activation energy while Suzano fibers have the lowest.
Figure 12 – Fiber Degradation Kinetics in Air: Activation Energy
0
20000
40000
60000
80000
100000
120000
140000
160000
Suzano WF 1 WF 2
Act
iva
tio
n E
ne
rgy
(J/
mo
l)
Fiber Type
5% 10% 15%
30
Figure 13 - Fiber Degradation Kinetics in Nitrogen: Activation Energy
Based on Equation 7, a higher values of activation energy would result in a slower
reaction rate. Slower reactions would be expected to be more thermally stable because it
would take more time for the thermal degradation to occur. However, these results do not
correspond to what has been observed previously when compared to the T5% values.
Instead, we have the highest values of activation energy as Woodforce 1, which has the
lowest T5% temperatures. The main difference between these two comparisons is that the
thermal kinetics analysis takes into consideration a variety of heating rates. This suggests
that the way heating rate affects the thermal degradation would favor Woodforce 1,
possibly, through how the composition transfers heat. The TGA curves used in these
calculations are plotted for reference in Appendix D.
4.2.3 Isothermal TGA
During the compounding and extrusion processes used in the production of
composite parts, the fibers will be exposed to and held at approximately 250°C . The
processing temperatures for PA may vary according to material and equipment. The
temperature of 250 °C is considered here a reference polyamide processing temperature
[36]. For discussion purposes, an isothermal test was run to compare fiber weight lost at
0
20000
40000
60000
80000
100000
120000
140000
160000
180000
Suzano WF 1 WF 2
Act
iva
tio
n E
ne
rgy
(J/
mo
l)
Fiber Type
5% 10% 15%
31
this temperature over time. Figure 14 shows the resulting isothermal curves at this
condition. Similar to the non-isothermal results, it is apparent that Suzano fiber
experiences less weight loss than the Woodforce fibers. Woodforce 1 experiences the most
weight reduction.
Figure 14 - Isothermal TGA at 250 ˚C
Over the amount of time measured, the most weight lost did not exceed 12 weight
percent of the original fiber. The measurement was limited to 16 minutes because this is
representation of cycle times in automotive parts manufacturing. It is likely that the cycle
time will be in the order of few minutes.
Due to the weight loss by products being gaseous, any small amount of thermal
degradation could result in a significant volume of void formation inside of a composite
material. The curves in Figure 14 have three stages:
120
140
160
180
200
220
240
260
86
88
90
92
94
96
98
100
0 2 4 6 8 10 12 14 16
Te
mp
era
ture
(˚C
)
We
igh
t P
erc
en
t (%
)
Time (min)
Suzano Nitrogen Suzano Air WF 1 N WF 1 Air
WF 2 N WF 2 Air Temperature
32
Stage 1 – Heating: time approximately initial 2 minutes, this stage has minimal
weight loss, it may include drying of any moisture that could have been absorbed by
the sample during handling (samples were dried prior to analysis)
Stage 2 – Transition: time approximately 1-2 minutes, this is the onset of thermal
degradation, it is characterized by maximum slope (negative slope) indicating the
maximum rate of thermal degradation
Stage 3 – Continuous Degradation: this stage starts with an inflexion in the curve
after the transition stage, the rate of thermal degradation decreased significantly
and tends to steady-state, almost linear.
It demonstrates the importance in minimizing the amount of time that fibers are
exposed to high temperatures. Although compounding and injection moulding procedure
is not within the scope of this thesis, minimization of natural fiber residence time would
greatly improve the success of natural fiber composites. Additionally, the presence of air is
shown to reduce the fiber weight more quickly. If the isothermal parts of the curves could
be approximated as lines, the slopes of the fibers in air are consistently steeper. This
indicates an even greater dependence on the residence time of the fiber at high
temperatures. If the processes could be performed in an inert atmosphere, such as
nitrogen, the thermal degradation would be reduced.
4.2.4 UV results
Previous research in our laboratory by Vedoy has shown significant improvement
to thermal stability by exposure of natural fibers to ultraviolet light [36]; the thermal
stability of straw fibers was improved significantly by exposure of those fibers to UV light.
A similar method was used here in an attempt to improve the thermal stability of wood
fibers. Figure 15 depicts the resulting non-isothermal TGA cures measured with a heating
rate of 20°C / min with and without UV treatment
33
Figure 15 - TGA Curves for Fibers after 15 minutes of UV treatment. Left: Suzano, Middle: WF1, Right:
WF2
The left graph in Figure 15, which corresponds to the Suzano fiber, has the UV
treated fiber curve consistently lower than the untreated curve. This would imply that the
UV treated sample lost more weight and thus demonstrated lower thermal stability.
However, in the middle graph, referring to Woodforce 1, the UV treatment is shown to
successfully increase the temperature at which thermal degradation occurs. For
Woodforce 2, the curves are very similar. Initially, it would appear that the UV treatment
very slightly improved weight retention, however, at higher temperatures, the non-treated
fiber curve is slightly higher.
Figure 16, below, graphs the T5% values of the UV treated sample onto Figure 10.
Similar to what was observed from Figure 15, the T5% value is reduced for Suzano fiber and
increased for Woodforce 1 while Woodforce 2 shows a slight decrease.
Initial 15 Minute UV
90
92
94
96
98
100
150 200 250 300
We
igh
t P
erc
en
t (%
)
Temperature (˚C)150 200 250 300
Temperature (˚C)
150 200 250 300
Temperature (˚C)
34
Figure 16 - 5% Weight Loss Temperatures vs. Heating Rate with UV treated Fibers
The varying results of the UV treatment can be contributed to the varying
compositions of the wood fibers. Other studies suggest that the effect of UV light mainly
alters the lignin present in the fibers [48, 47]. Because Woodforce 1 has the most lignin, it
is the most improved by the UV treatment. However, as the Suzano fiber has a small amount
of lignin content, there is no positive effect from the UV treatment. Moreover, from the
increased deterioration, there may be indication of the UV treatment negatively impacting
cellulose thermal stability. The Woodforce 2 curve in Figure 15 confirms this trend as the
lower temperature indicates where lignin would thermally degrade while higher
temperatures are affected by cellulose. It can be concluded that the UV treatment would be
beneficial to mechanically pulped wood fibers.
200
220
240
260
280
300
320
0 10 20 30 40 50 60
T5
% (
˚C)
Heating Rate (˚C/min)
Suzano Nitrogen Suzano Air WF1 N
WF1 Air WF2 N WF2 Air
UV suz 15 UV wf1 15 UV wf2 15
35
5.0 Initial Fiber and Polyamide Compounding
5.1 Introduction
After investigating the thermal behaviour of the wood fibers individually,
compounding at 20 weight percent filler was performed to evaluate how the fibers affect
the flexural and impact properties. Further investigation of the Suzano fiber and
Woodforce 2 fiber was performed at levels of 20 and 30 weight percent of fiber in the
composite. Each fiber was compounded with PA 6,10, PA 10,10 and recycled PA 6.
5.2 Results and Discussion
5.2.1 Twenty Percent Fiber Content
While extruding the fiber and polyamide compositions, there was moderate
difficulty feeding the fibers into the extruder. While neat polyamide will easily be fed via
the attached mechanical device, the addition of fiber required manual pushing into the
screw-section.
The resulting product had visual evidence of colour change (thermal degradation).
The Suzano fiber, which is initially white, resulted in a medium brown colour. The
Woodforce fibers, which are initially brown, resulted in a dark brown colour. After
injection moulding, all composites were visually dark brown, almost black.
Figure 17 and Figure 18 depict the flexural modulus and strength of the composites.
A very similar trend is observed in comparing Figure 17 and Figure 18. In general, the
flexural strength and modulus is increased for each polyamide with the addition of the
twenty percent natural fiber.
36
Figure 17 - 20% Fiber content Flexural Modulus
Figure 18 - 20% Fiber content Flexural Strength
The largest increase in flexural properties is observed with the addition of the
Suzano fiber. Recycled polyamide 6 shows higher property values, however, relative
change is more significant for PA 6,10 and PA 10,10.
The notched Izod impact properties of the same composites is graphed in Figure 19.
Contrarily to the flexural properties, impact strength is shown to decrease with the
addition of fibers.
0
500
1000
1500
2000
2500
3000
None 20% Suz 20% WF1 20% WF2
Fle
xu
ral
Mo
du
lus
(MP
a)
Fiber Content
PA 610 PA 1010 RPA 6
0
10
20
30
40
50
60
70
80
90
100
None 20% Suz 20% WF1 20% WF2
Fle
xu
ral
Mo
du
lus
(MP
a)
Fiber Content
PA 610 PA 1010 RPA 6
37
Figure 19 - 20% Fiber content Izod Impact Strength
Although the fiber content does reduce impact strength, the difference
between types of fiber cannot be compared. This is because the variance of this test is
relatively high. Table 6 shows the analysis of variance of impact strength for the 20%
composites. Due to the f-statistic values being lower than the critical values, it can be
concluded, with 95% confidence, that there is no statistically significant difference. This is
true both for fiber type and polyamide type. The primary observation gained from Figure
19 is that the addition of 20% natural fiber content reduces the impact strength,
approximately by half.
Table 6: ANOVA Table for Impact Strength versus Fiber and Polyamide Type
Source DF SS MS F Fcrit(𝜶 = 𝟎. 𝟎𝟓)
Polyamide 2 216 108 2.70 3.23
Fiber 2 1.72 0.86 0.02 3.23
Interaction 4 463 116 2.89 2.60
Error 41 1642 40.1
Total 49 2324
0
10
20
30
40
50
60
70
80
90
100
None 20% Suz 20% WF1 20% WF2
Izo
d I
mp
act
Str
en
gth
(J/
m)
Fibre Content
PA610 PA1010 PA6
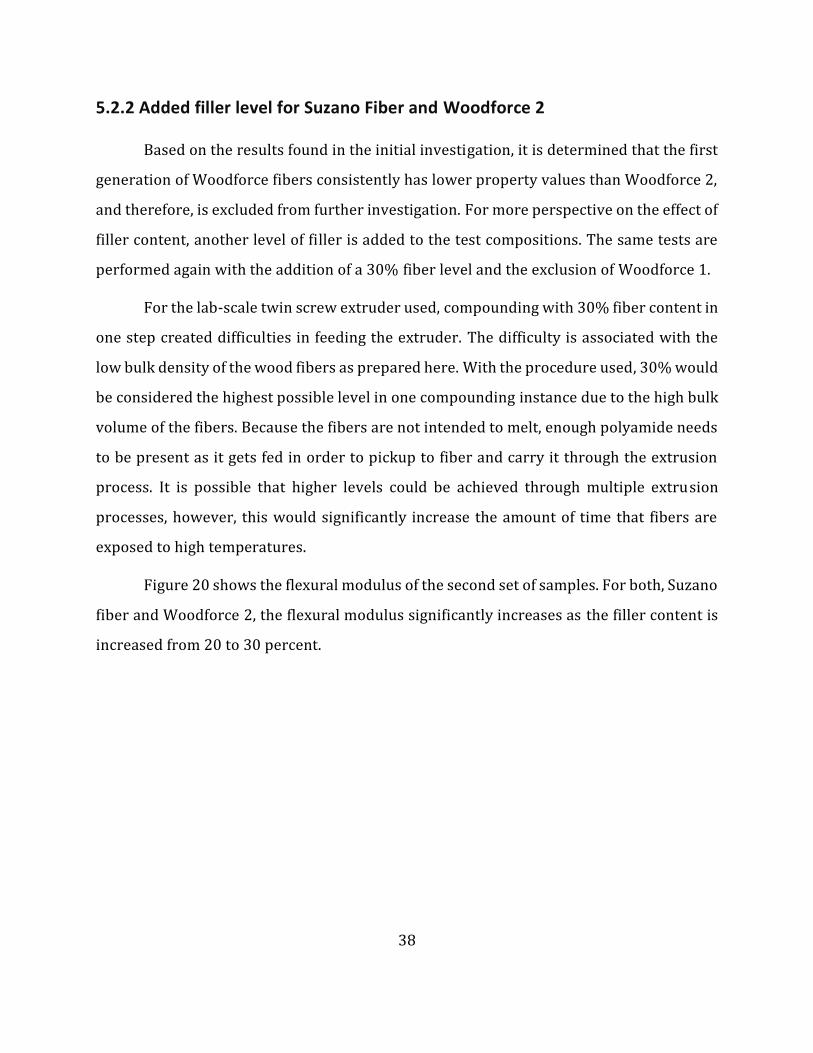
38
5.2.2 Added filler level for Suzano Fiber and Woodforce 2
Based on the results found in the initial investigation, it is determined that the first
generation of Woodforce fibers consistently has lower property values than Woodforce 2,
and therefore, is excluded from further investigation. For more perspective on the effect of
filler content, another level of filler is added to the test compositions. The same tests are
performed again with the addition of a 30% fiber level and the exclusion of Woodforce 1.
For the lab-scale twin screw extruder used, compounding with 30% fiber content in
one step created difficulties in feeding the extruder. The difficulty is associated with the
low bulk density of the wood fibers as prepared here. With the procedure used, 30% would
be considered the highest possible level in one compounding instance due to the high bulk
volume of the fibers. Because the fibers are not intended to melt, enough polyamide needs
to be present as it gets fed in order to pickup to fiber and carry it through the extrusion
process. It is possible that higher levels could be achieved through multiple extrusion
processes, however, this would significantly increase the amount of time that fibers are
exposed to high temperatures.
Figure 20 shows the flexural modulus of the second set of samples. For both, Suzano
fiber and Woodforce 2, the flexural modulus significantly increases as the filler content is
increased from 20 to 30 percent.
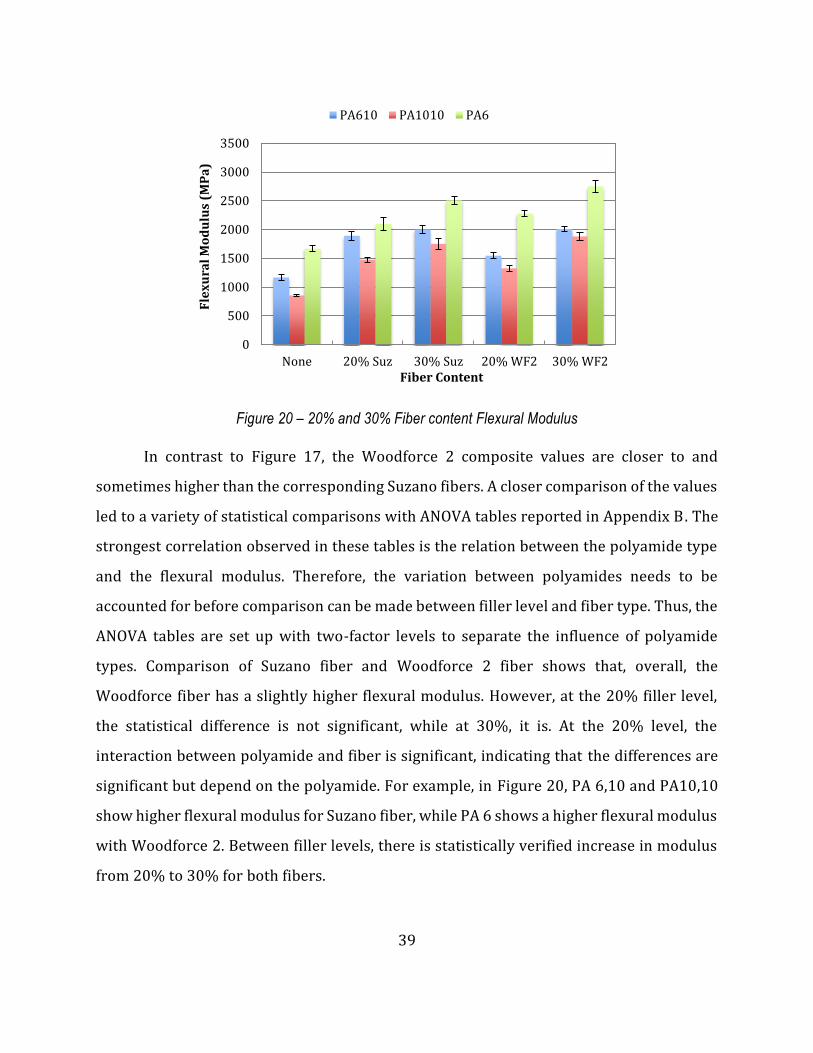
39
Figure 20 – 20% and 30% Fiber content Flexural Modulus
In contrast to Figure 17, the Woodforce 2 composite values are closer to and
sometimes higher than the corresponding Suzano fibers. A closer comparison of the values
led to a variety of statistical comparisons with ANOVA tables reported in Appendix B. The
strongest correlation observed in these tables is the relation between the polyamide type
and the flexural modulus. Therefore, the variation between polyamides needs to be
accounted for before comparison can be made between filler level and fiber type. Thus, the
ANOVA tables are set up with two-factor levels to separate the influence of polyamide
types. Comparison of Suzano fiber and Woodforce 2 fiber shows that, overall, the
Woodforce fiber has a slightly higher flexural modulus. However, at the 20% filler level,
the statistical difference is not significant, while at 30%, it is. At the 20% level, the
interaction between polyamide and fiber is significant, indicating that the differences are
significant but depend on the polyamide. For example, in Figure 20, PA 6,10 and PA10,10
show higher flexural modulus for Suzano fiber, while PA 6 shows a higher flexural modulus
with Woodforce 2. Between filler levels, there is statistically verified increase in modulus
from 20% to 30% for both fibers.
0
500
1000
1500
2000
2500
3000
3500
None 20% Suz 30% Suz 20% WF2 30% WF2
Fle
xu
ral
Mo
du
lus
(MP
a)
Fiber Content
PA610 PA1010 PA6
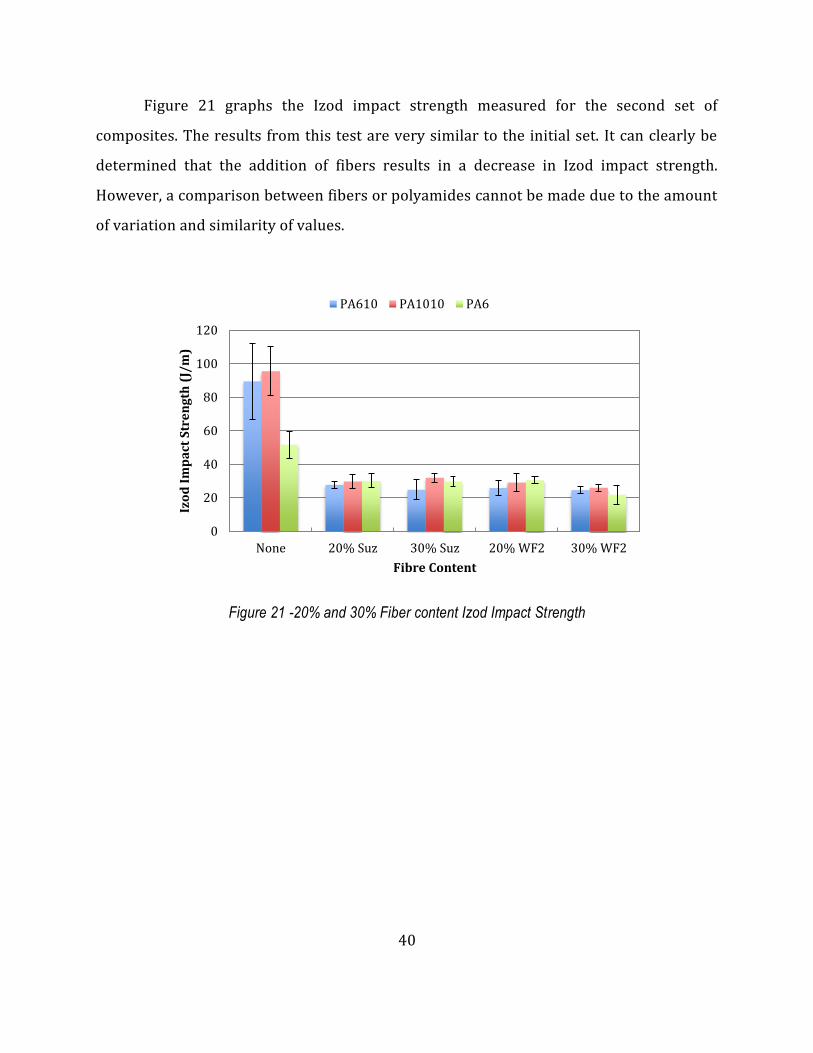
40
Figure 21 graphs the Izod impact strength measured for the second set of
composites. The results from this test are very similar to the initial set. It can clearly be
determined that the addition of fibers results in a decrease in Izod impact strength.
However, a comparison between fibers or polyamides cannot be made due to the amount
of variation and similarity of values.
Figure 21 -20% and 30% Fiber content Izod Impact Strength
0
20
40
60
80
100
120
None 20% Suz 30% Suz 20% WF2 30% WF2
Izo
d I
mp
act
Str
en
gth
(J/
m)
Fibre Content
PA610 PA1010 PA6
41
6.0 Cellulose Compounding with a Polyamide Blend
6.1 Introduction
Based on the results and thermal stability findings on the previous chapter, it is
determined that the Suzano fiber would be the most promising filler due to its higher
thermal stability. However, the current processing method for Suzano fiber does not result
in an easily compoundable product. At a lab scale, it is feasible to grind up the pulp sheet
resulting in loose fibers. The texture of these loose fibers does not feed easily into an
extruder. Therefore, in order to continue the experimentation process, CreaFill cellulose is
used as an alternative substitute for Suzano fiber. CreaFill comes in powder form and can
be more easily fed into an extruder.
In comparing the polyamides, there are advantages associated with each. Polyamide
10,10 and 6,10 are 100% and 62% biobased, respectively. Although the cost is higher, the
sustainable nature of the material has long term benefits. By investing in bio-based
materials now, the technology and cost will develop enough to eventually compete with
petroleum based polyamide. Additionally, there is indication in Figure 21 that the impact
strength of PA 6,10 and PA 10,10 is higher than recycled PA 6. However, RPA 6 is lower
cost than biobased materials. Because it is recycled, the composites produced creates a
demand for material that would otherwise go to a landfill. RPA 6 also showed a higher
flexural strength than the biobased polyamides. In this next section, a blend of PA 6,10 and
RPA 6 will be tested in order to form a hybrid of the aforementioned properties. PA 6,10 is
selected because it is more likely to be miscible with PA 6, as discussed previously.
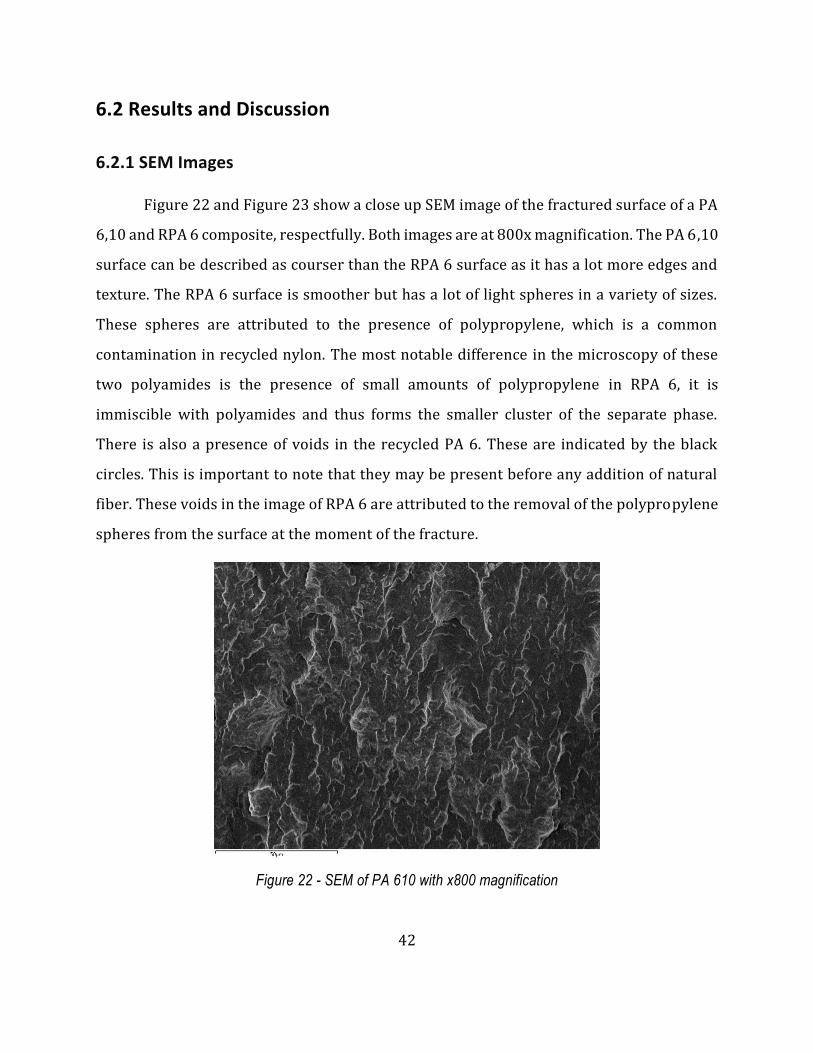
42
6.2 Results and Discussion
6.2.1 SEM Images
Figure 22 and Figure 23 show a close up SEM image of the fractured surface of a PA
6,10 and RPA 6 composite, respectfully. Both images are at 800x magnification. The PA 6,10
surface can be described as courser than the RPA 6 surface as it has a lot more edges and
texture. The RPA 6 surface is smoother but has a lot of light spheres in a variety of sizes.
These spheres are attributed to the presence of polypropylene, which is a common
contamination in recycled nylon. The most notable difference in the microscopy of these
two polyamides is the presence of small amounts of polypropylene in RPA 6, it is
immiscible with polyamides and thus forms the smaller cluster of the separate phase.
There is also a presence of voids in the recycled PA 6. These are indicated by the black
circles. This is important to note that they may be present before any addition of natural
fiber. These voids in the image of RPA 6 are attributed to the removal of the polypropylene
spheres from the surface at the moment of the fracture.
Figure 22 - SEM of PA 610 with x800 magnification
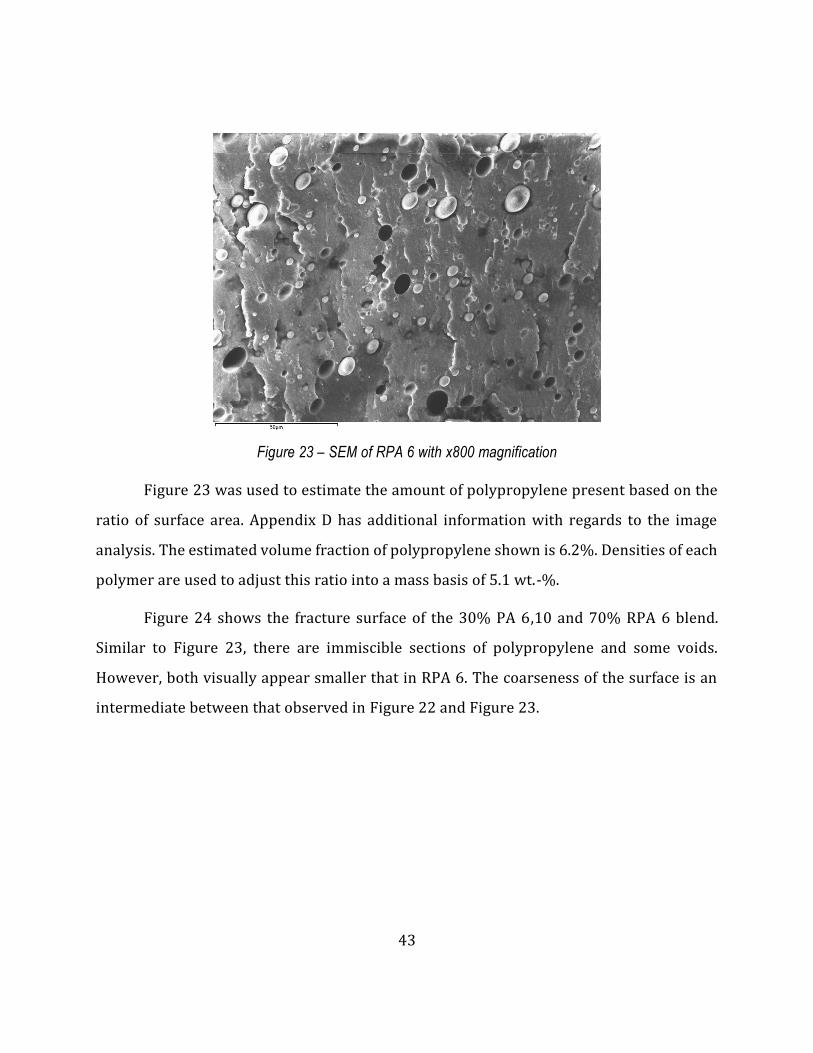
43
Figure 23 – SEM of RPA 6 with x800 magnification
Figure 23 was used to estimate the amount of polypropylene present based on the
ratio of surface area. Appendix D has additional information with regards to the image
analysis. The estimated volume fraction of polypropylene shown is 6.2%. Densities of each
polymer are used to adjust this ratio into a mass basis of 5.1 wt.-%.
Figure 24 shows the fracture surface of the 30% PA 6,10 and 70% RPA 6 blend.
Similar to Figure 23, there are immiscible sections of polypropylene and some voids.
However, both visually appear smaller that in RPA 6. The coarseness of the surface is an
intermediate between that observed in Figure 22 and Figure 23.
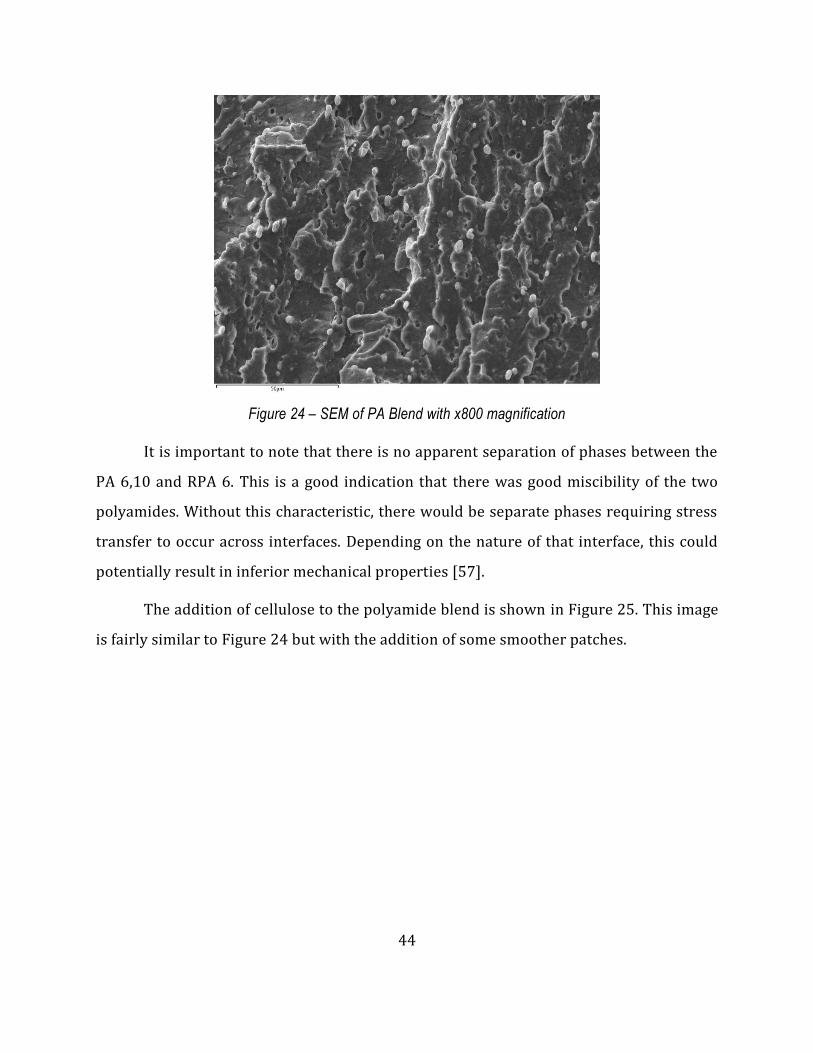
44
Figure 24 – SEM of PA Blend with x800 magnification
It is important to note that there is no apparent separation of phases between the
PA 6,10 and RPA 6. This is a good indication that there was good miscibility of the two
polyamides. Without this characteristic, there would be separate phases requiring stress
transfer to occur across interfaces. Depending on the nature of that interface, this could
potentially result in inferior mechanical properties [57].
The addition of cellulose to the polyamide blend is shown in Figure 25. This image
is fairly similar to Figure 24 but with the addition of some smoother patches.

45
Figure 25 - SEM of 20% Cellulose with x800 magnification
The presence of cellulose is known to increase the brittleness of a composite [43].
Because of this, an impact would have less energy dissipation throughout the composite
[58]. Thus, it is possible that the smoother sections observed in Figure 25 are due to more
localized fractures from lack of energy dissipation. It is possible that such localization of
the fracture could be triggered by concentration of fibers not well dispersed.
Additionally, the presence of cellulose would act as a nucleation point for the
crystallization of polyamide. This alters the morphology of the resulting crystalline
structure because it is unable to grow in three directions due to one direction being the
cellulose fiber. Instead, crystallization occurs normal to the surface, which creates a
morphology referred to as transcrystallization [4]. This change would also affect the
transfer of energy and result in the different fracture surface.
Another important characteristic of Fig 25, is the absence of any loose fibers. This
indicates that fiber pull out is not an issue for this composite. This is expected because
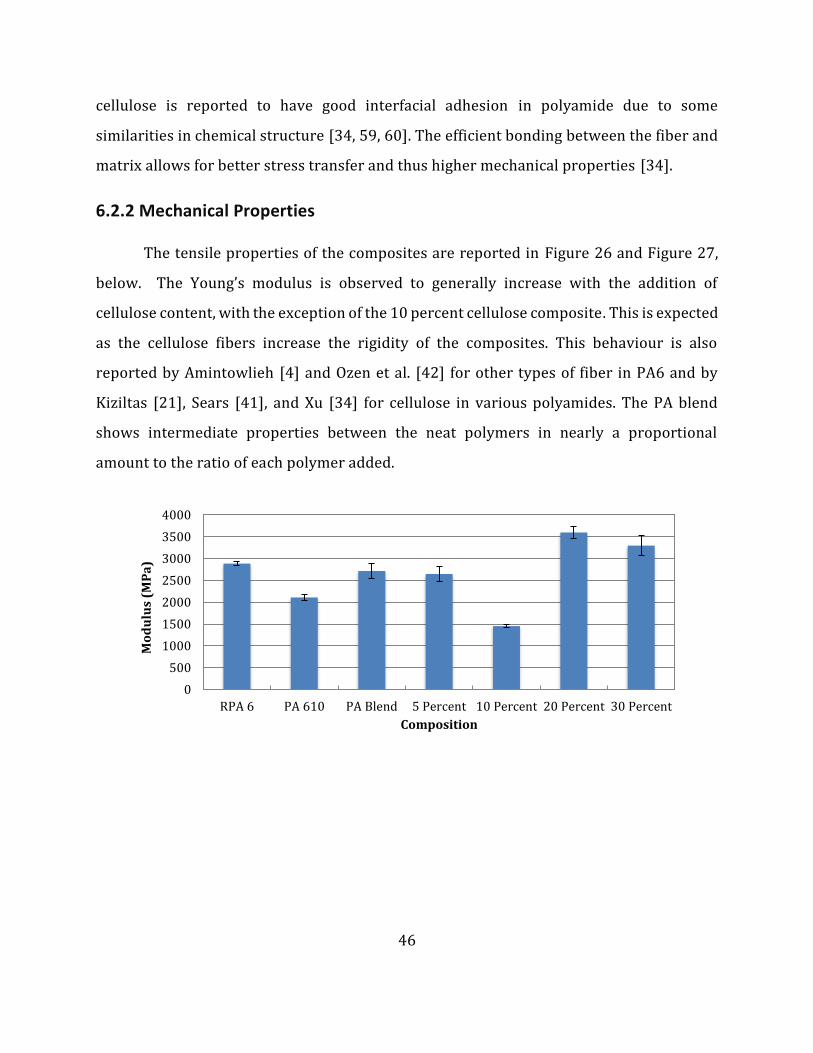
46
cellulose is reported to have good interfacial adhesion in polyamide due to some
similarities in chemical structure [34, 59, 60]. The efficient bonding between the fiber and
matrix allows for better stress transfer and thus higher mechanical properties [34].
6.2.2 Mechanical Properties
The tensile properties of the composites are reported in Figure 26 and Figure 27,
below. The Young’s modulus is observed to generally increase with the addition of
cellulose content, with the exception of the 10 percent cellulose composite. This is expected
as the cellulose fibers increase the rigidity of the composites. This behaviour is also
reported by Amintowlieh [4] and Ozen et al. [42] for other types of fiber in PA6 and by
Kiziltas [21], Sears [41], and Xu [34] for cellulose in various polyamides. The PA blend
shows intermediate properties between the neat polymers in nearly a proportional
amount to the ratio of each polymer added.
0
500
1000
1500
2000
2500
3000
3500
4000
RPA 6 PA 610 PA Blend 5 Percent 10 Percent 20 Percent 30 Percent
Mo
du
lus
(MP
a)
Composition

47
Figure 26 - Young's Modulus of Cellulose Filled PA Blends
Figure 27 – Tensile Stress at Maximum Load of Cellulose Filled PA Blends
The tensile strength, shown in Figure 27, indicates a decrease in tensile strength
with the addition of cellulose fibers. This is unexpected as tensile properties are generally
expected to increase with the addition of fiber content [61]. However, at 30% loading
dispersion of the fiber becomes more difficult and so this could be an effect of poor
distribution. At lower filler amounts, the tensile strength remains approximately the same.
The drop in tensile strength above 20% has also been reported in literature [43]. This is
due to the increased filler loading starting to interfere with the stress-transfer abilities of
the matrix.
The remarkably low Young’s modulus value for the 10 percent composite in Figure
26 indicates that there might have been an issue with the compounding of this set.
Although caution was taken to maintain consistent experimental parameters for all sets,
there are many possible errors that could occur. For example, it is possible that the raw
materials were not properly dried due to the sharing of laboratory space. Another
possibility is that the manual dial of the extruder speed could have been inconsistently
0
10
20
30
40
50
60
RPA 6 PA 610 PA Blend 5 Percent 10 Percent 20 Percent 30 Percent
Str
ess
(M
Pa
)
Composition
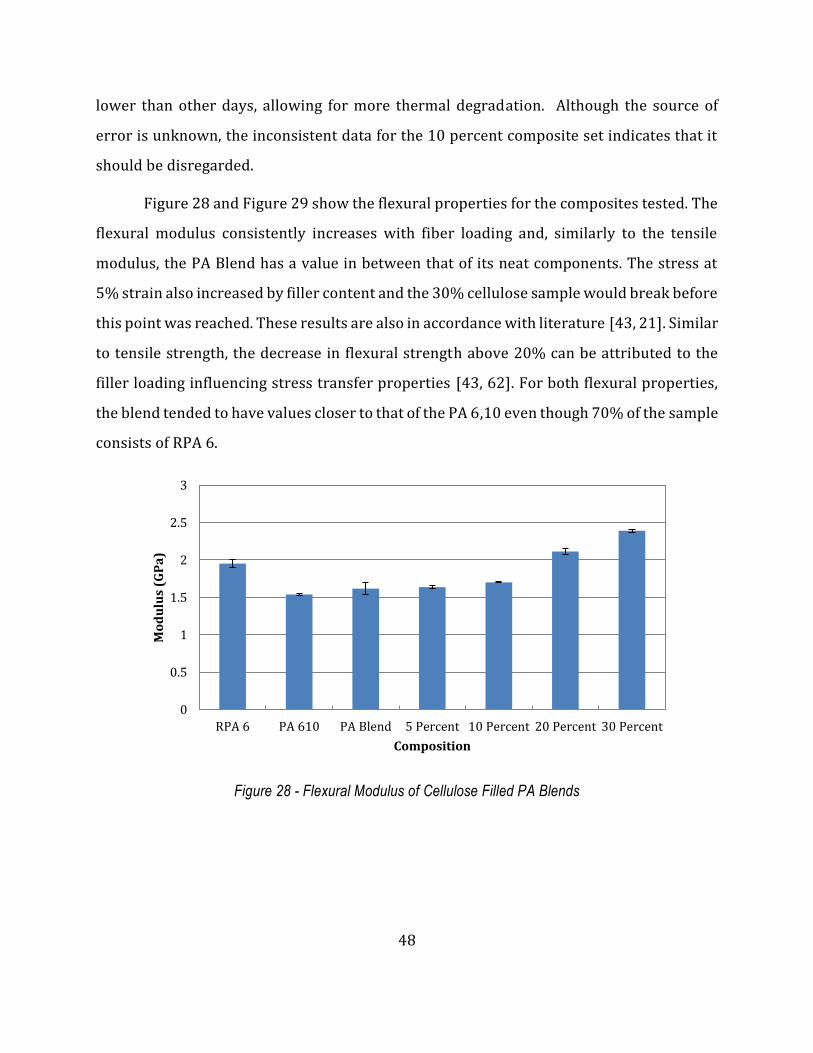
48
lower than other days, allowing for more thermal degradation. Although the source of
error is unknown, the inconsistent data for the 10 percent composite set indicates that it
should be disregarded.
Figure 28 and Figure 29 show the flexural properties for the composites tested. The
flexural modulus consistently increases with fiber loading and, similarly to the tensile
modulus, the PA Blend has a value in between that of its neat components. The stress at
5% strain also increased by filler content and the 30% cellulose sample would break before
this point was reached. These results are also in accordance with literature [43, 21]. Similar
to tensile strength, the decrease in flexural strength above 20% can be attributed to the
filler loading influencing stress transfer properties [43, 62]. For both flexural properties,
the blend tended to have values closer to that of the PA 6,10 even though 70% of the sample
consists of RPA 6.
Figure 28 - Flexural Modulus of Cellulose Filled PA Blends
0
0.5
1
1.5
2
2.5
3
RPA 6 PA 610 PA Blend 5 Percent 10 Percent 20 Percent 30 Percent
Mo
du
lus
(GP
a)
Composition
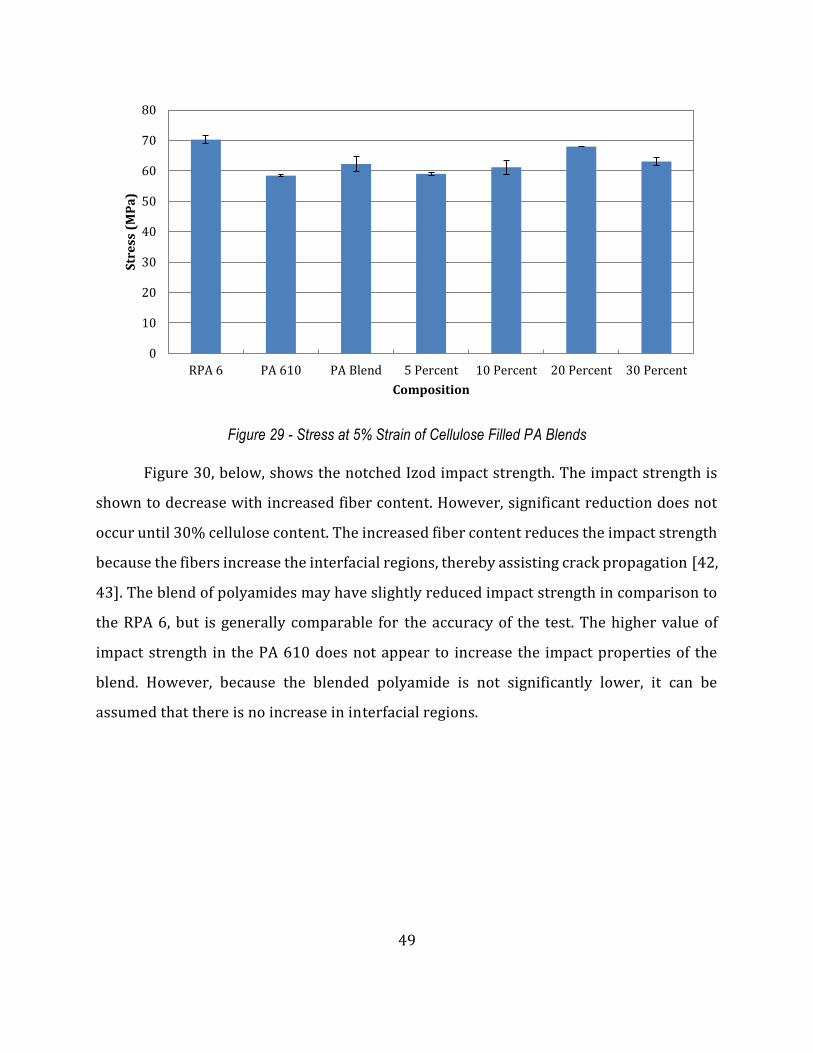
49
Figure 29 - Stress at 5% Strain of Cellulose Filled PA Blends
Figure 30, below, shows the notched Izod impact strength. The impact strength is
shown to decrease with increased fiber content. However, significant reduction does not
occur until 30% cellulose content. The increased fiber content reduces the impact strength
because the fibers increase the interfacial regions, thereby assisting crack propagation [42,
43]. The blend of polyamides may have slightly reduced impact strength in comparison to
the RPA 6, but is generally comparable for the accuracy of the test. The higher value of
impact strength in the PA 610 does not appear to increase the impact properties of the
blend. However, because the blended polyamide is not significantly lower, it can be
assumed that there is no increase in interfacial regions.
0
10
20
30
40
50
60
70
80
RPA 6 PA 610 PA Blend 5 Percent 10 Percent 20 Percent 30 Percent
Str
ess
(M
Pa
)
Composition
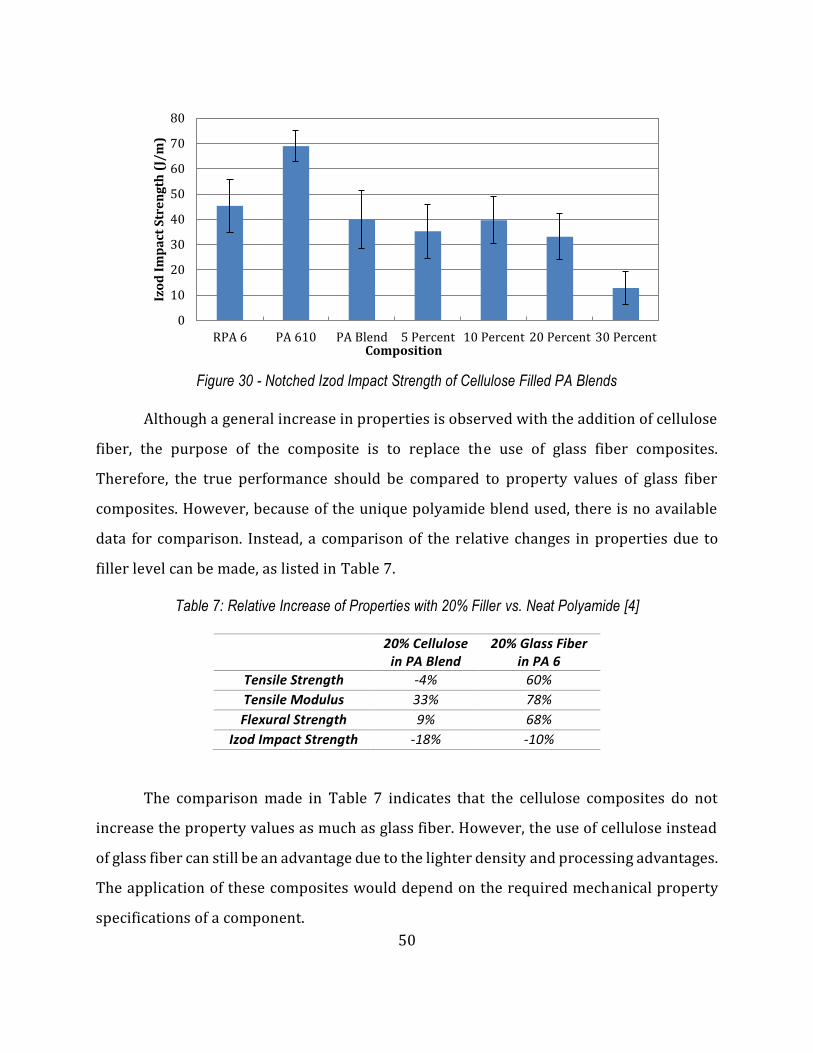
50
Figure 30 - Notched Izod Impact Strength of Cellulose Filled PA Blends
Although a general increase in properties is observed with the addition of cellulose
fiber, the purpose of the composite is to replace the use of glass fiber composites.
Therefore, the true performance should be compared to property values of glass fiber
composites. However, because of the unique polyamide blend used, there is no available
data for comparison. Instead, a comparison of the relative changes in properties due to
filler level can be made, as listed in Table 7.
Table 7: Relative Increase of Properties with 20% Filler vs. Neat Polyamide [4]
20% Cellulose in PA Blend
20% Glass Fiber in PA 6
Tensile Strength -4% 60%
Tensile Modulus 33% 78%
Flexural Strength 9% 68%
Izod Impact Strength -18% -10%
The comparison made in Table 7 indicates that the cellulose composites do not
increase the property values as much as glass fiber. However, the use of cellulose instead
of glass fiber can still be an advantage due to the lighter density and processing advantages.
The application of these composites would depend on the required mechanical property
specifications of a component.
0
10
20
30
40
50
60
70
80
RPA 6 PA 610 PA Blend 5 Percent 10 Percent 20 Percent 30 Percent
Izo
d I
mp
act
Str
en
gth
(J/
m)
Composition
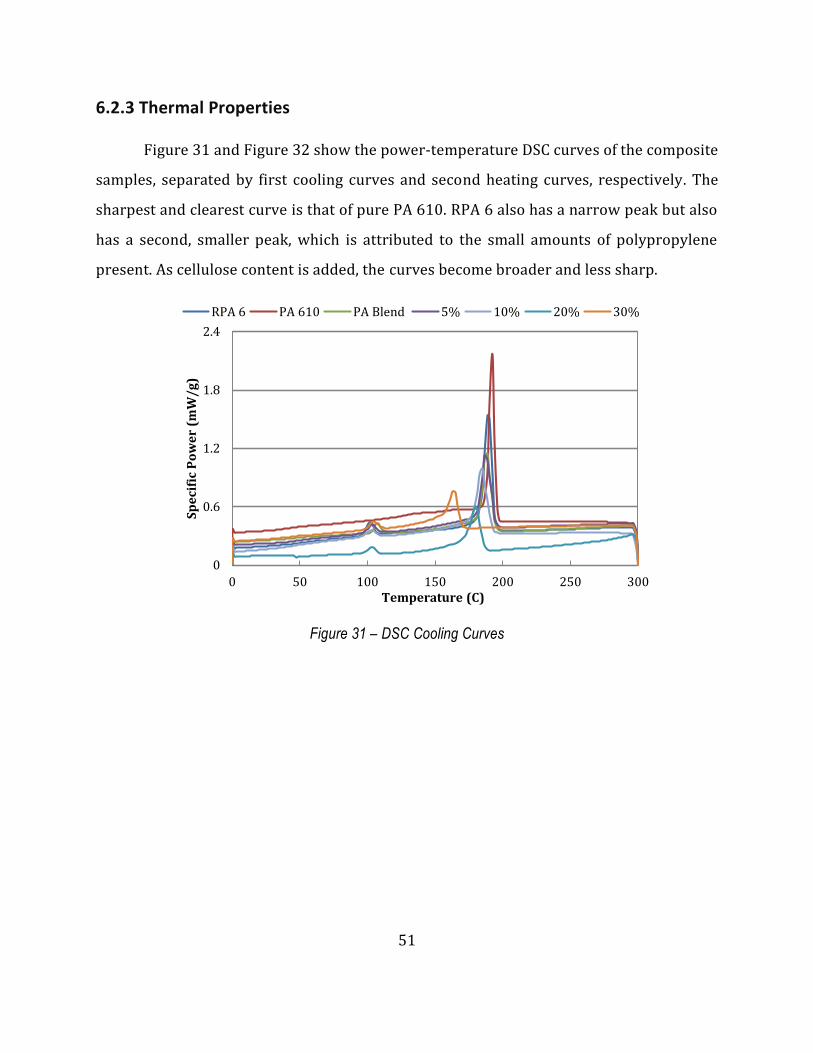
51
6.2.3 Thermal Properties
Figure 31 and Figure 32 show the power-temperature DSC curves of the composite
samples, separated by first cooling curves and second heating curves, respectively. The
sharpest and clearest curve is that of pure PA 610. RPA 6 also has a narrow peak but also
has a second, smaller peak, which is attributed to the small amounts of polypropylene
present. As cellulose content is added, the curves become broader and less sharp.
Figure 31 – DSC Cooling Curves
0
0.6
1.2
1.8
2.4
0 50 100 150 200 250 300
Sp
eci
fic
Po
we
r (m
W/
g)
Temperature (C)
RPA 6 PA 610 PA Blend 5% 10% 20% 30%
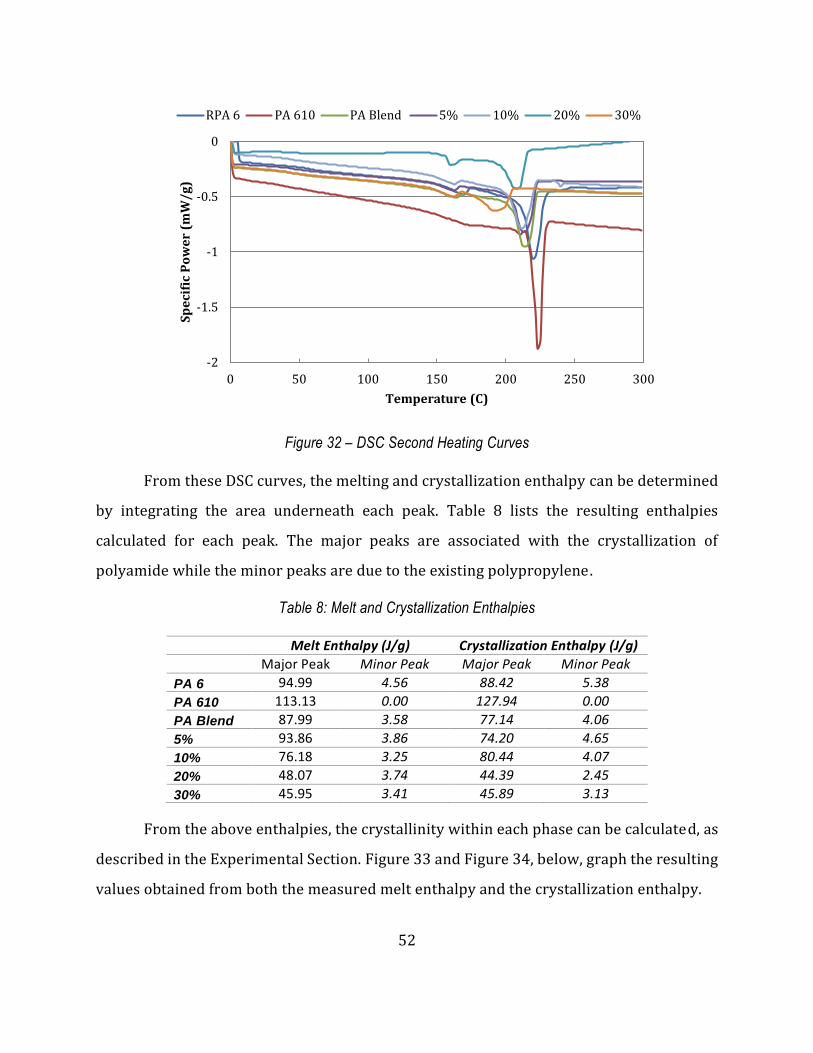
52
Figure 32 – DSC Second Heating Curves
From these DSC curves, the melting and crystallization enthalpy can be determined
by integrating the area underneath each peak. Table 8 lists the resulting enthalpies
calculated for each peak. The major peaks are associated with the crystallization of
polyamide while the minor peaks are due to the existing polypropylene.
Table 8: Melt and Crystallization Enthalpies
Melt Enthalpy (J/g) Crystallization Enthalpy (J/g)
Major Peak Minor Peak Major Peak Minor Peak
PA 6 94.99 4.56 88.42 5.38
PA 610 113.13 0.00 127.94 0.00
PA Blend 87.99 3.58 77.14 4.06
5% 93.86 3.86 74.20 4.65
10% 76.18 3.25 80.44 4.07
20% 48.07 3.74 44.39 2.45
30% 45.95 3.41 45.89 3.13
From the above enthalpies, the crystallinity within each phase can be calculated, as
described in the Experimental Section. Figure 33 and Figure 34, below, graph the resulting
values obtained from both the measured melt enthalpy and the crystallization enthalpy.
-2
-1.5
-1
-0.5
0
0 50 100 150 200 250 300
Sp
eci
fic
Po
we
r (m
W/
g)
Temperature (C)
RPA 6 PA 610 PA Blend 5% 10% 20% 30%
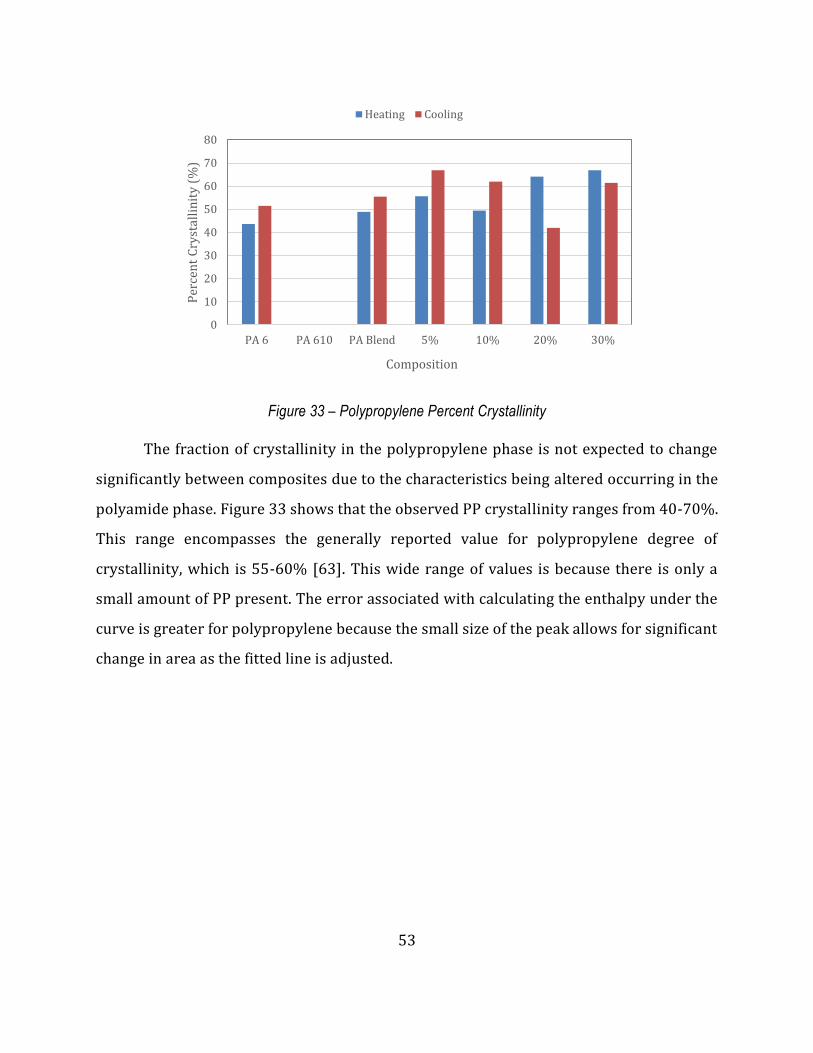
53
Figure 33 – Polypropylene Percent Crystallinity
The fraction of crystallinity in the polypropylene phase is not expected to change
significantly between composites due to the characteristics being altered occurring in the
polyamide phase. Figure 33 shows that the observed PP crystallinity ranges from 40-70%.
This range encompasses the generally reported value for polypropylene degree of
crystallinity, which is 55-60% [63]. This wide range of values is because there is only a
small amount of PP present. The error associated with calculating the enthalpy under the
curve is greater for polypropylene because the small size of the peak allows for significant
change in area as the fitted line is adjusted.
0
10
20
30
40
50
60
70
80
PA 6 PA 610 PA Blend 5% 10% 20% 30%
Per
cen
t C
ryst
alli
nit
y (
%)
Composition
Heating Cooling
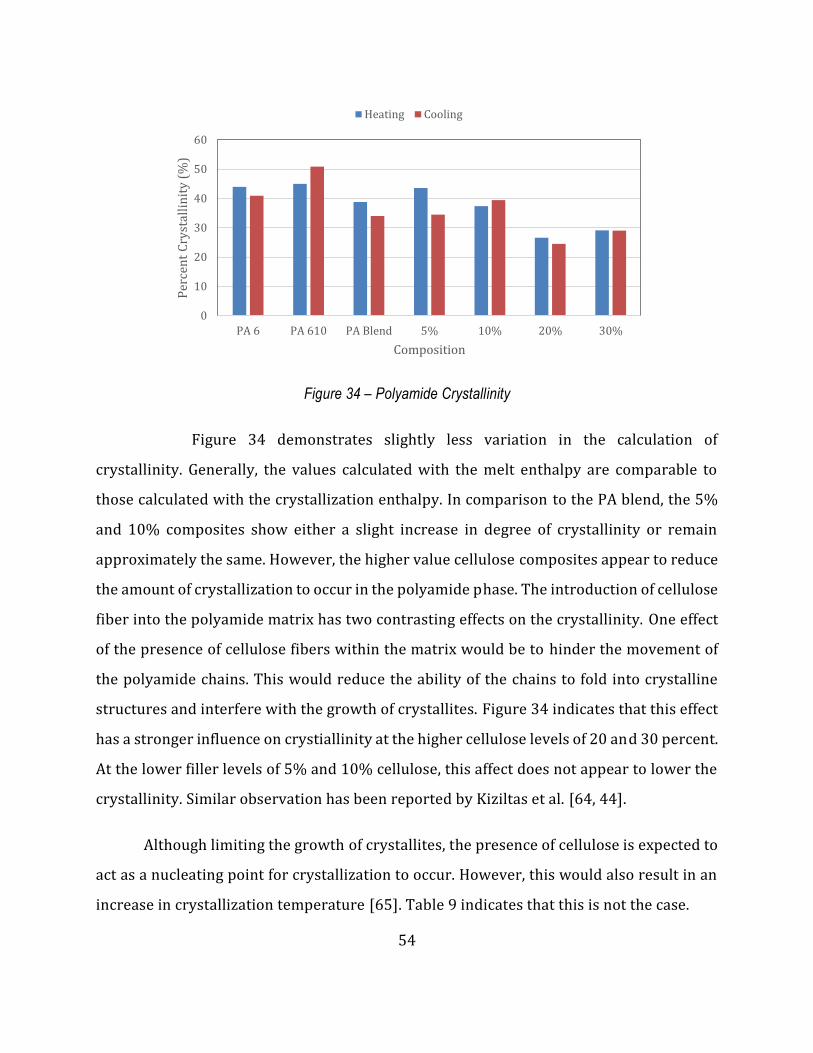
54
Figure 34 – Polyamide Crystallinity
Figure 34 demonstrates slightly less variation in the calculation of
crystallinity. Generally, the values calculated with the melt enthalpy are comparable to
those calculated with the crystallization enthalpy. In comparison to the PA blend, the 5%
and 10% composites show either a slight increase in degree of crystallinity or remain
approximately the same. However, the higher value cellulose composites appear to reduce
the amount of crystallization to occur in the polyamide phase. The introduction of cellulose
fiber into the polyamide matrix has two contrasting effects on the crystallinity. One effect
of the presence of cellulose fibers within the matrix would be to hinder the movement of
the polyamide chains. This would reduce the ability of the chains to fold into crystalline
structures and interfere with the growth of crystallites. Figure 34 indicates that this effect
has a stronger influence on crystiallinity at the higher cellulose levels of 20 and 30 percent.
At the lower filler levels of 5% and 10% cellulose, this affect does not appear to lower the
crystallinity. Similar observation has been reported by Kiziltas et al. [64, 44].
Although limiting the growth of crystallites, the presence of cellulose is expected to
act as a nucleating point for crystallization to occur. However, this would also result in an
increase in crystallization temperature [65]. Table 9 indicates that this is not the case.
0
10
20
30
40
50
60
PA 6 PA 610 PA Blend 5% 10% 20% 30%
Per
cen
t C
ryst
alli
nit
y (
%)
Composition
Heating Cooling
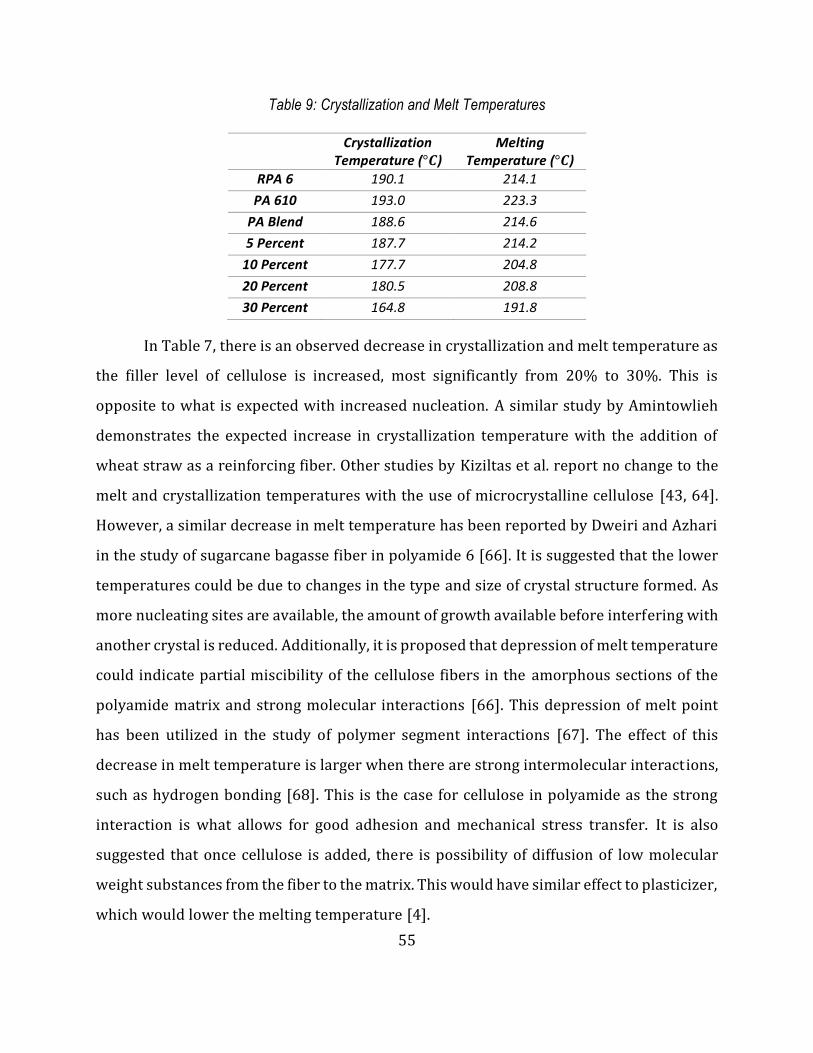
55
Table 9: Crystallization and Melt Temperatures
Crystallization Temperature (°𝑪)
Melting Temperature (°𝑪)
RPA 6 190.1 214.1
PA 610 193.0 223.3
PA Blend 188.6 214.6
5 Percent 187.7 214.2
10 Percent 177.7 204.8
20 Percent 180.5 208.8
30 Percent 164.8 191.8
In Table 7, there is an observed decrease in crystallization and melt temperature as
the filler level of cellulose is increased, most significantly from 20% to 30%. This is
opposite to what is expected with increased nucleation. A similar study by Amintowlieh
demonstrates the expected increase in crystallization temperature with the addition of
wheat straw as a reinforcing fiber. Other studies by Kiziltas et al. report no change to the
melt and crystallization temperatures with the use of microcrystalline cellulose [43, 64].
However, a similar decrease in melt temperature has been reported by Dweiri and Azhari
in the study of sugarcane bagasse fiber in polyamide 6 [66]. It is suggested that the lower
temperatures could be due to changes in the type and size of crystal structure formed. As
more nucleating sites are available, the amount of growth available before interfering with
another crystal is reduced. Additionally, it is proposed that depression of melt temperature
could indicate partial miscibility of the cellulose fibers in the amorphous sections of the
polyamide matrix and strong molecular interactions [66]. This depression of melt point
has been utilized in the study of polymer segment interactions [67]. The effect of this
decrease in melt temperature is larger when there are strong intermolecular interactions,
such as hydrogen bonding [68]. This is the case for cellulose in polyamide as the strong
interaction is what allows for good adhesion and mechanical stress transfer. It is also
suggested that once cellulose is added, there is possibility of diffusion of low molecular
weight substances from the fiber to the matrix. This would have similar effect to plasticizer,
which would lower the melting temperature [4].
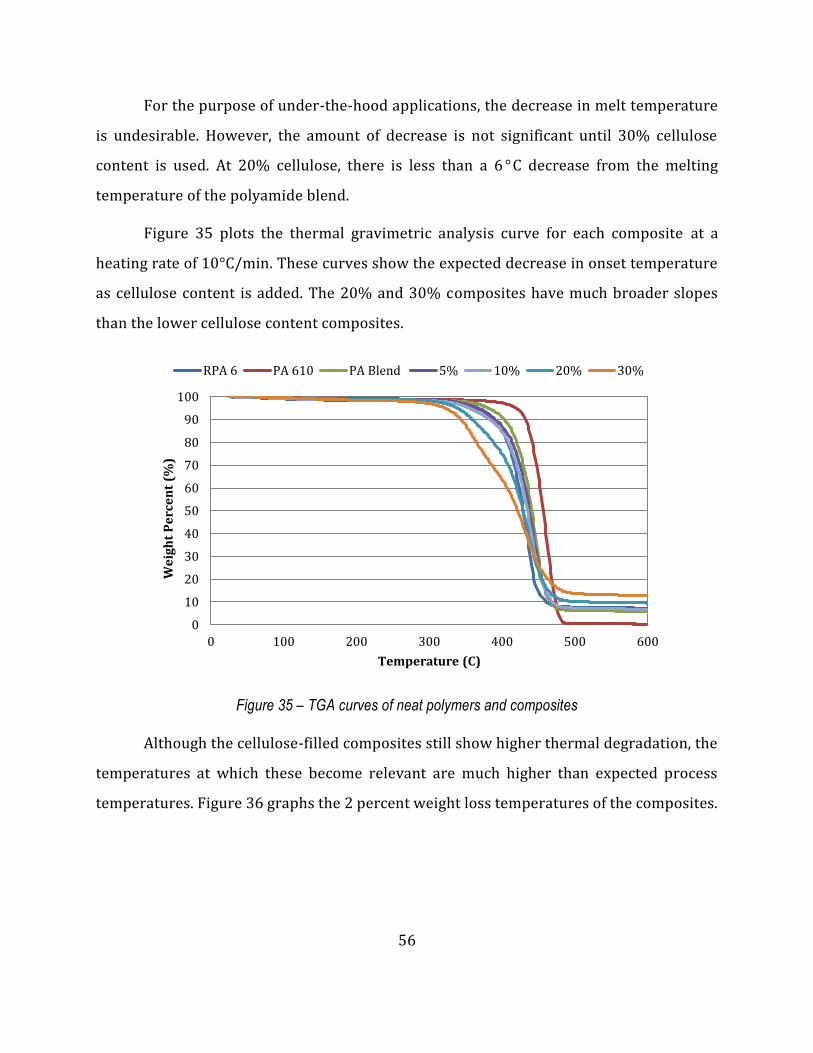
56
For the purpose of under-the-hood applications, the decrease in melt temperature
is undesirable. However, the amount of decrease is not significant until 30% cellulose
content is used. At 20% cellulose, there is less than a 6 °C decrease from the melting
temperature of the polyamide blend.
Figure 35 plots the thermal gravimetric analysis curve for each composite at a
heating rate of 10°C/min. These curves show the expected decrease in onset temperature
as cellulose content is added. The 20% and 30% composites have much broader slopes
than the lower cellulose content composites.
Figure 35 – TGA curves of neat polymers and composites
Although the cellulose-filled composites still show higher thermal degradation, the
temperatures at which these become relevant are much higher than expected process
temperatures. Figure 36 graphs the 2 percent weight loss temperatures of the composites.
0
10
20
30
40
50
60
70
80
90
100
0 100 200 300 400 500 600
We
igh
t P
erc
en
t (%
)
Temperature (C)
RPA 6 PA 610 PA Blend 5% 10% 20% 30%
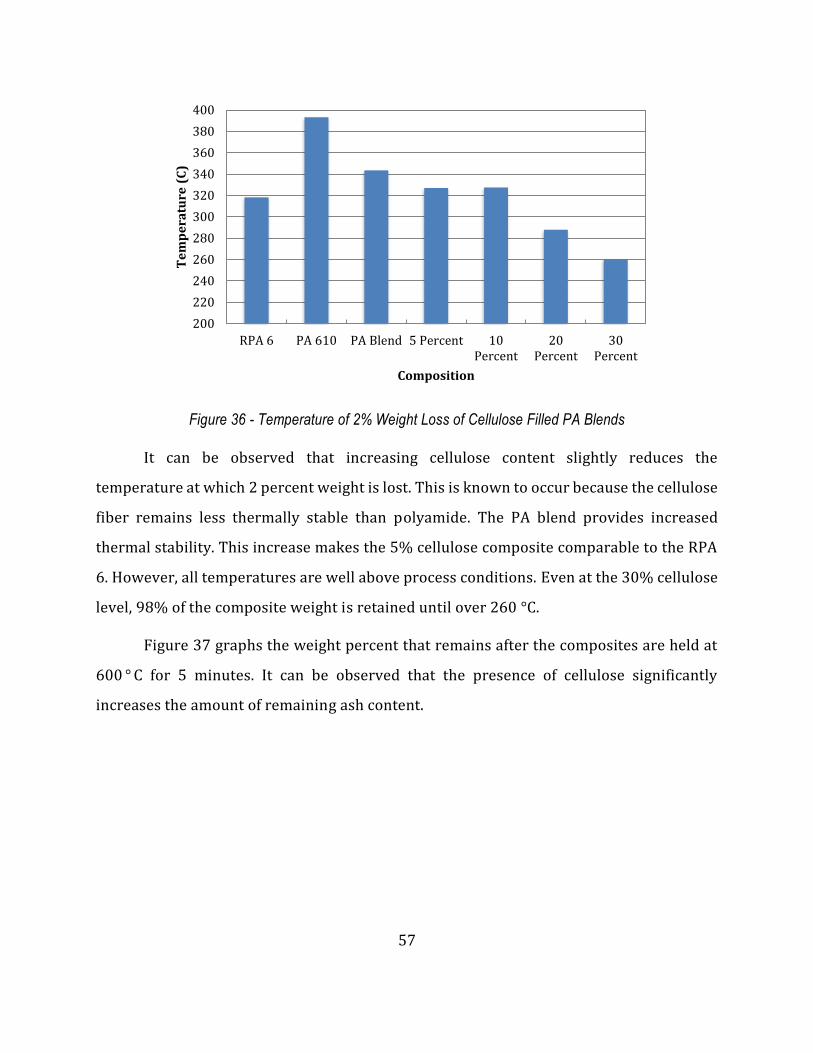
57
Figure 36 - Temperature of 2% Weight Loss of Cellulose Filled PA Blends
It can be observed that increasing cellulose content slightly reduces the
temperature at which 2 percent weight is lost. This is known to occur because the cellulose
fiber remains less thermally stable than polyamide. The PA blend provides increased
thermal stability. This increase makes the 5% cellulose composite comparable to the RPA
6. However, all temperatures are well above process conditions. Even at the 30% cellulose
level, 98% of the composite weight is retained until over 260 °C.
Figure 37 graphs the weight percent that remains after the composites are held at
600 ° C for 5 minutes. It can be observed that the presence of cellulose significantly
increases the amount of remaining ash content.
200
220
240
260
280
300
320
340
360
380
400
RPA 6 PA 610 PA Blend 5 Percent 10Percent
20Percent
30Percent
Te
mp
era
ture
(C
)
Composition
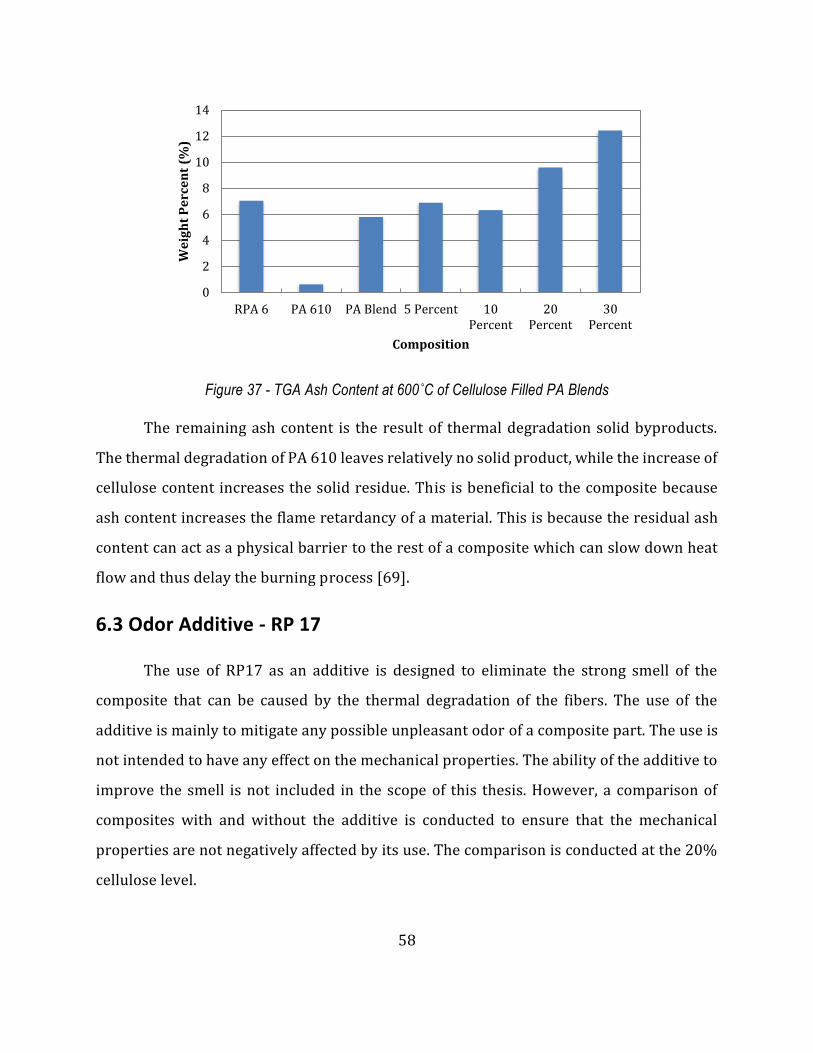
58
Figure 37 - TGA Ash Content at 600˚C of Cellulose Filled PA Blends
The remaining ash content is the result of thermal degradation solid byproducts.
The thermal degradation of PA 610 leaves relatively no solid product, while the increase of
cellulose content increases the solid residue. This is beneficial to the composite because
ash content increases the flame retardancy of a material. This is because the residual ash
content can act as a physical barrier to the rest of a composite which can slow down heat
flow and thus delay the burning process [69].
6.3 Odor Additive - RP 17
The use of RP17 as an additive is designed to eliminate the strong smell of the
composite that can be caused by the thermal degradation of the fibers. The use of the
additive is mainly to mitigate any possible unpleasant odor of a composite part. The use is
not intended to have any effect on the mechanical properties. The ability of the additive to
improve the smell is not included in the scope of this thesis. However, a comparison of
composites with and without the additive is conducted to ensure that the mechanical
properties are not negatively affected by its use. The comparison is conducted at the 20%
cellulose level.
0
2
4
6
8
10
12
14
RPA 6 PA 610 PA Blend 5 Percent 10Percent
20Percent
30Percent
We
igh
t P
erc
en
t (%
)
Composition
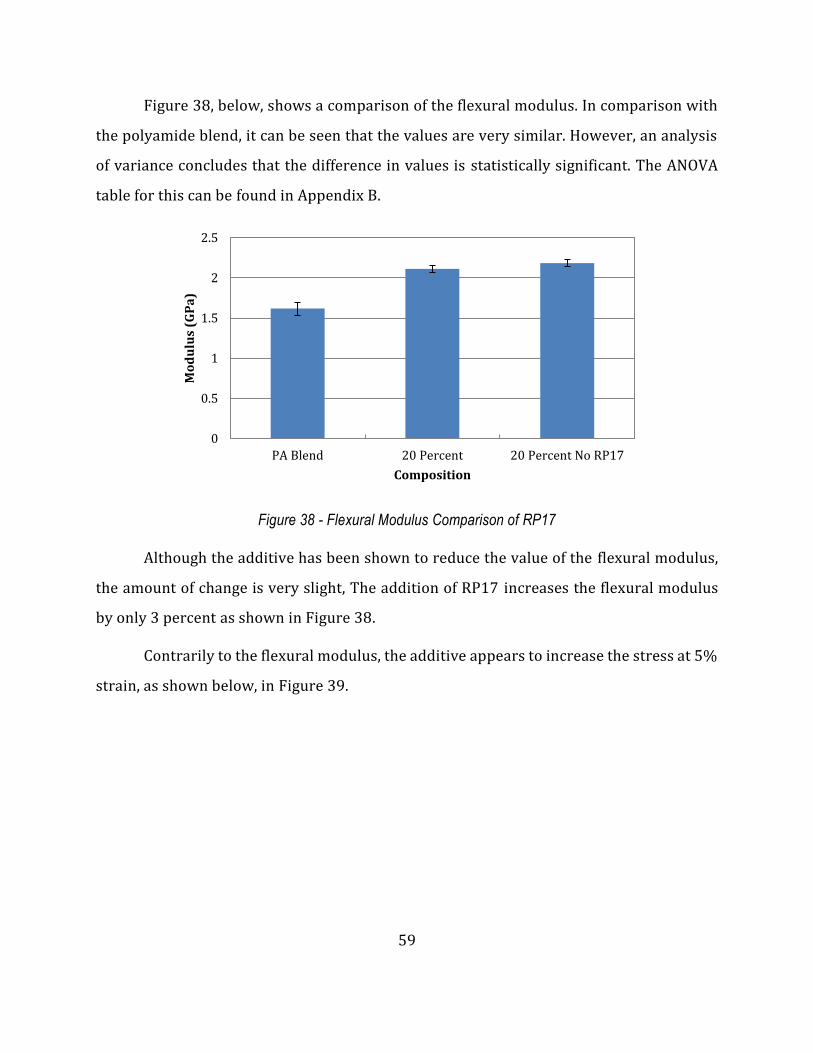
59
Figure 38, below, shows a comparison of the flexural modulus. In comparison with
the polyamide blend, it can be seen that the values are very similar. However, an analysis
of variance concludes that the difference in values is statistically significant. The ANOVA
table for this can be found in Appendix B.
Figure 38 - Flexural Modulus Comparison of RP17
Although the additive has been shown to reduce the value of the flexural modulus,
the amount of change is very slight, The addition of RP17 increases the flexural modulus
by only 3 percent as shown in Figure 38.
Contrarily to the flexural modulus, the additive appears to increase the stress at 5%
strain, as shown below, in Figure 39.
0
0.5
1
1.5
2
2.5
PA Blend 20 Percent 20 Percent No RP17
Mo
du
lus
(GP
a)
Composition
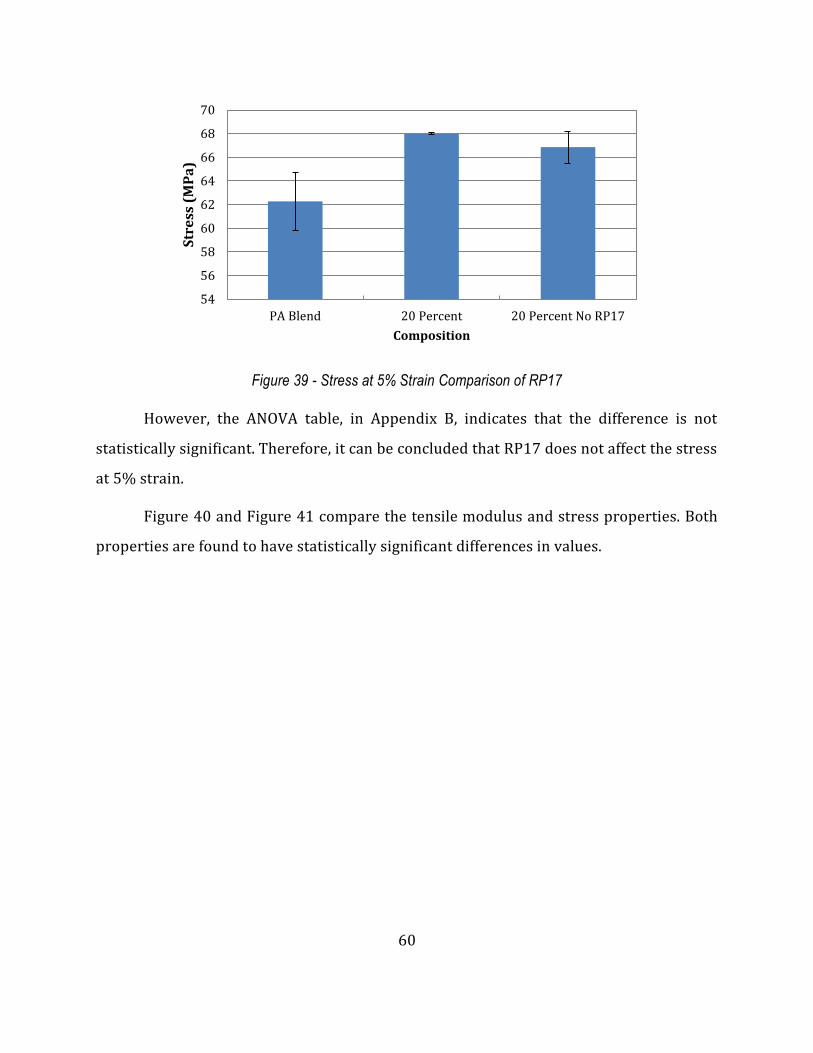
60
Figure 39 - Stress at 5% Strain Comparison of RP17
However, the ANOVA table, in Appendix B, indicates that the difference is not
statistically significant. Therefore, it can be concluded that RP17 does not affect the stress
at 5% strain.
Figure 40 and Figure 41 compare the tensile modulus and stress properties. Both
properties are found to have statistically significant differences in values.
54
56
58
60
62
64
66
68
70
PA Blend 20 Percent 20 Percent No RP17
Str
ess
(M
Pa
)
Composition
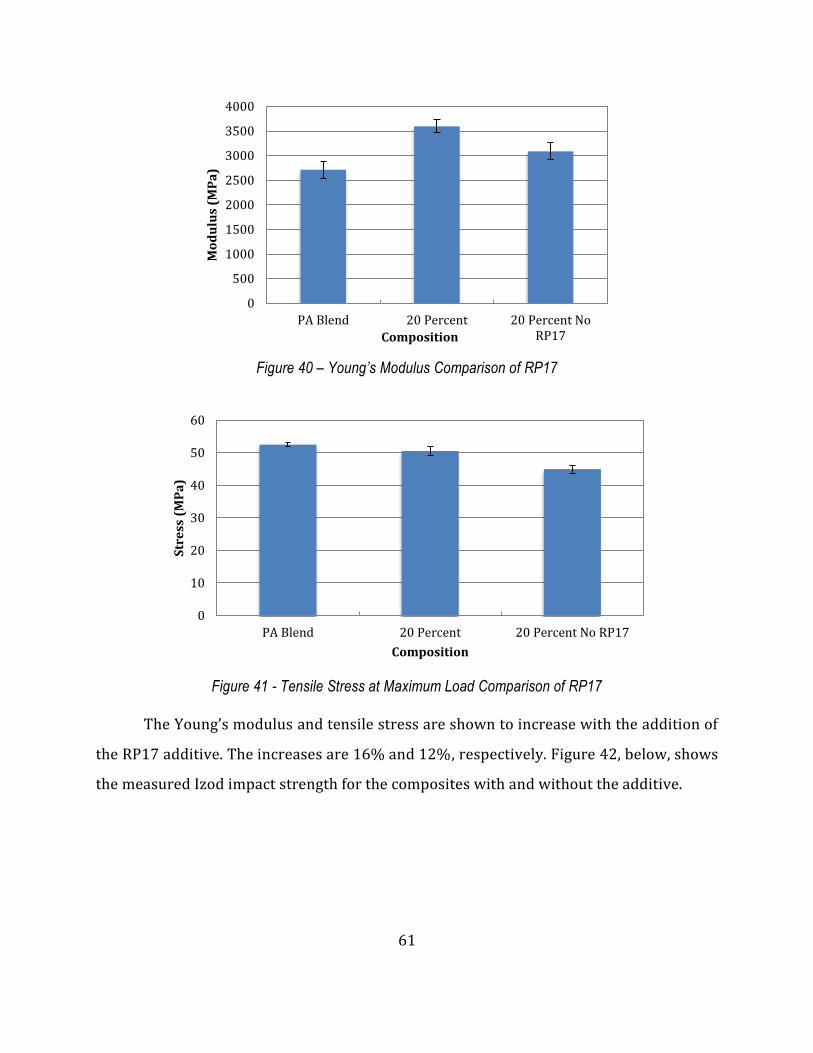
61
Figure 40 – Young’s Modulus Comparison of RP17
Figure 41 - Tensile Stress at Maximum Load Comparison of RP17
The Young’s modulus and tensile stress are shown to increase with the addition of
the RP17 additive. The increases are 16% and 12%, respectively. Figure 42, below, shows
the measured Izod impact strength for the composites with and without the additive.
0
500
1000
1500
2000
2500
3000
3500
4000
PA Blend 20 Percent 20 Percent NoRP17
Mo
du
lus
(MP
a)
Composition
0
10
20
30
40
50
60
PA Blend 20 Percent 20 Percent No RP17
Str
ess
(M
Pa
)
Composition
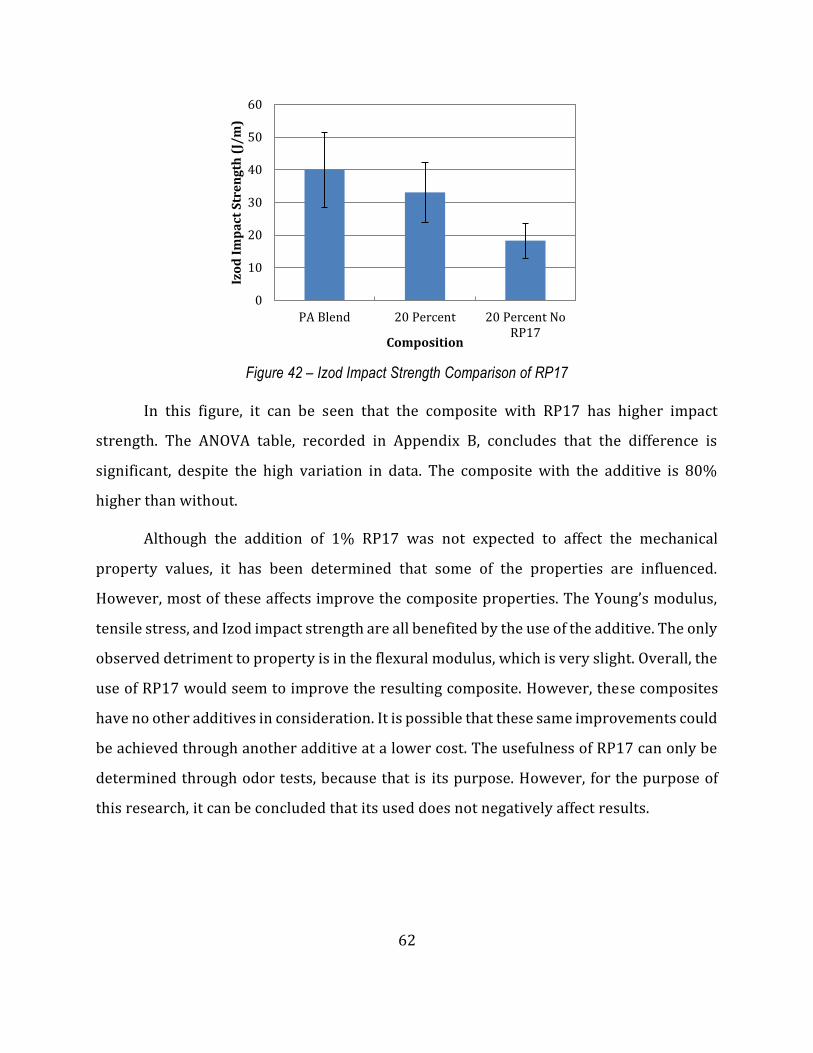
62
Figure 42 – Izod Impact Strength Comparison of RP17
In this figure, it can be seen that the composite with RP17 has higher impact
strength. The ANOVA table, recorded in Appendix B, concludes that the difference is
significant, despite the high variation in data. The composite with the additive is 80%
higher than without.
Although the addition of 1% RP17 was not expected to affect the mechanical
property values, it has been determined that some of the properties are influenced.
However, most of these affects improve the composite properties. The Young’s modulus,
tensile stress, and Izod impact strength are all benefited by the use of the additive. The only
observed detriment to property is in the flexural modulus, which is very slight. Overall, the
use of RP17 would seem to improve the resulting composite. However, these composites
have no other additives in consideration. It is possible that these same improvements could
be achieved through another additive at a lower cost. The usefulness of RP17 can only be
determined through odor tests, because that is its purpose. However, for the purpose of
this research, it can be concluded that its used does not negatively affect results.
0
10
20
30
40
50
60
PA Blend 20 Percent 20 Percent NoRP17
Izo
d I
mp
act
Str
en
gth
(J/
m)
Composition
63
6.4 Carbon Fiber
Carbon fiber is known to be a highly effective reinforcing filler but the high cost
prevents it feasibility for many applications. However, market forecasts compare the
history of carbon fiber to that of fiberglass [50]. The trend indicates that costs may reduce
enough to make carbon fiber a viable option in the future. Because of this, carbon fiber is
also considered in this research as an option to create a hybrid product containing both
cellulose and carbon fiber. In this investigation, hybrid composites are produced
containing both cellulose and carbon fiber. The 20% and 30% filler levels are investigated
by replacing part of the cellulose with carbon fiber to get a composite with 10% cellulose
and 10% carbon fiber, referred to as the 10%/10% mixture and another composite with
10% cellulose and 20% carbon fiber, referred to as the 10%/20% mixture.
The data obtained from the carbon fiber composites can be interpreted in two ways.
The first perspective considers a filler level and compares the differences between that
filler being all cellulose or a combination of cellulose and carbon fiber. For example, at the
20% filler level, a comparison of 20% cellulose versus 10%/10% mixture can be made. The
second option is to observe just the effects of adding more carbon fiber by only looking at
varying levels of carbon fiber content. In this case, the composites of interest would include
10% cellulose, 10%/10% mixture, and 10%/20% mixture.
Figure 43 shows the flexural modulus of the aforementioned composites. In
comparing the 20% cellulose to the 10%/10% mixture, the values are very similar,
showing no change to the modulus. At the 30% filler content, an increase is shown with the
use of carbon fiber.
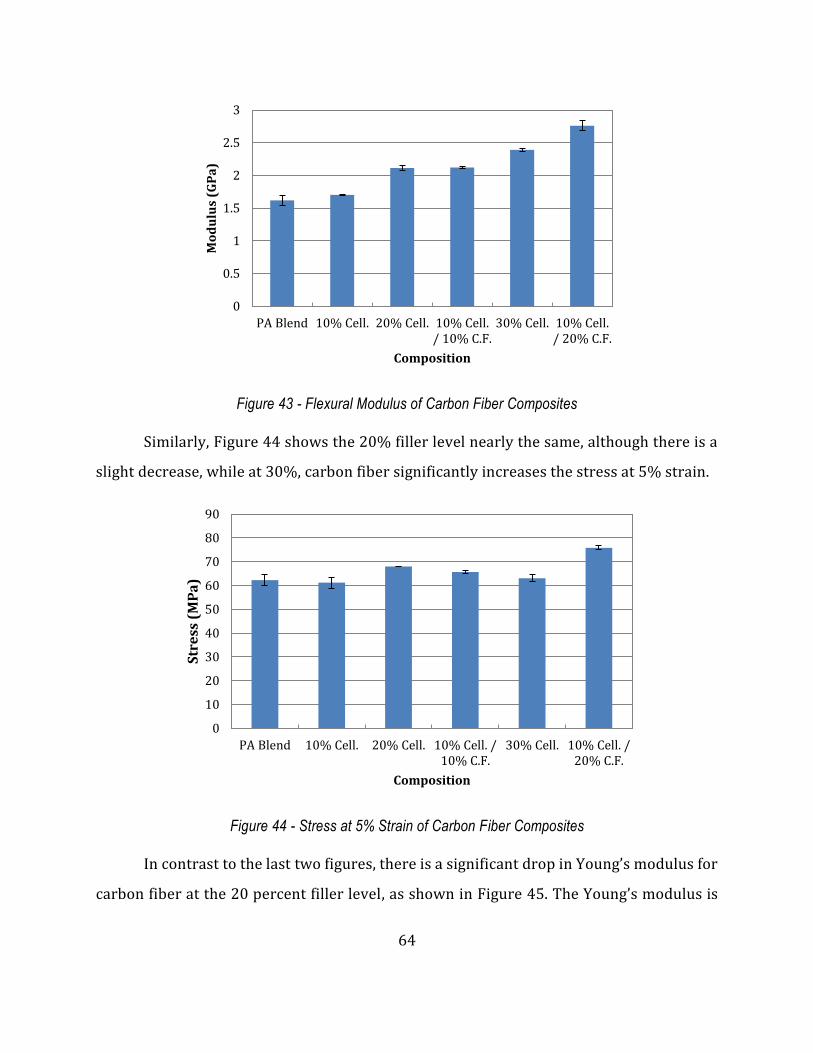
64
Figure 43 - Flexural Modulus of Carbon Fiber Composites
Similarly, Figure 44 shows the 20% filler level nearly the same, although there is a
slight decrease, while at 30%, carbon fiber significantly increases the stress at 5% strain.
Figure 44 - Stress at 5% Strain of Carbon Fiber Composites
In contrast to the last two figures, there is a significant drop in Young’s modulus for
carbon fiber at the 20 percent filler level, as shown in Figure 45. The Young’s modulus is
0
0.5
1
1.5
2
2.5
3
PA Blend 10% Cell. 20% Cell. 10% Cell./ 10% C.F.
30% Cell. 10% Cell./ 20% C.F.
Mo
du
lus
(GP
a)
Composition
0
10
20
30
40
50
60
70
80
90
PA Blend 10% Cell. 20% Cell. 10% Cell. /10% C.F.
30% Cell. 10% Cell. /20% C.F.
Str
ess
(M
Pa
)
Composition
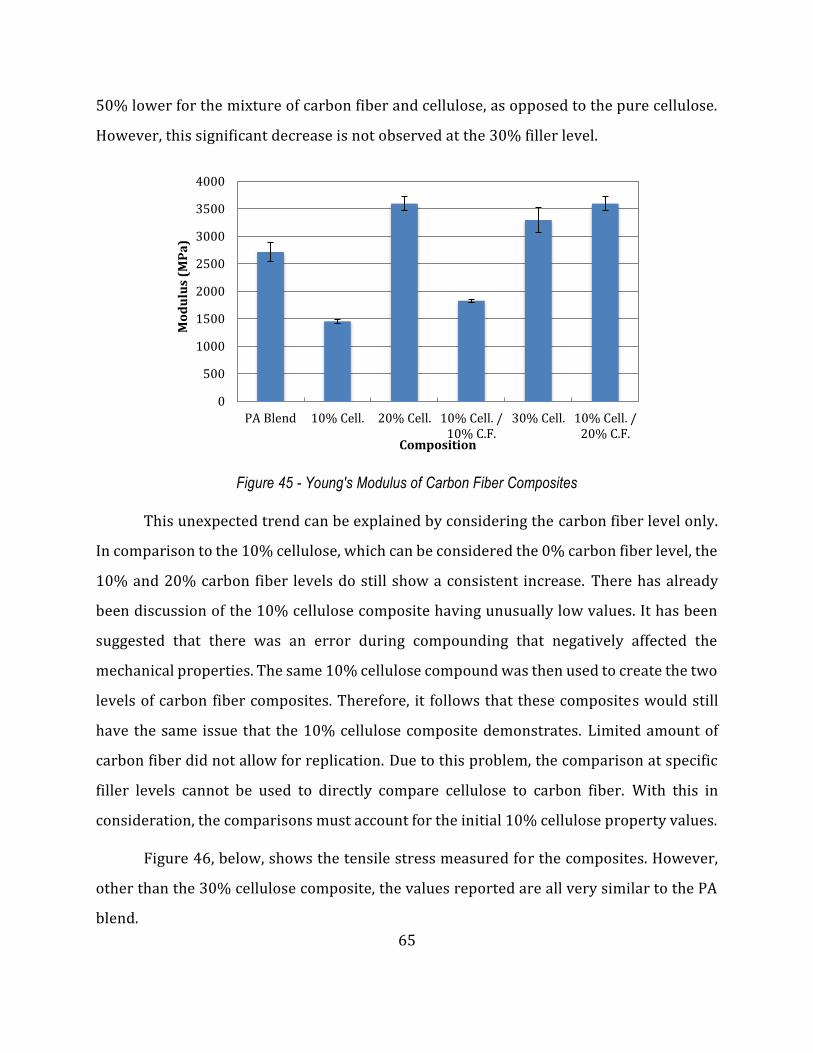
65
50% lower for the mixture of carbon fiber and cellulose, as opposed to the pure cellulose.
However, this significant decrease is not observed at the 30% filler level.
Figure 45 - Young's Modulus of Carbon Fiber Composites
This unexpected trend can be explained by considering the carbon fiber level only.
In comparison to the 10% cellulose, which can be considered the 0% carbon fiber level, the
10% and 20% carbon fiber levels do still show a consistent increase. There has already
been discussion of the 10% cellulose composite having unusually low values. It has been
suggested that there was an error during compounding that negatively affected the
mechanical properties. The same 10% cellulose compound was then used to create the two
levels of carbon fiber composites. Therefore, it follows that these composites would still
have the same issue that the 10% cellulose composite demonstrates. Limited amount of
carbon fiber did not allow for replication. Due to this problem, the comparison at specific
filler levels cannot be used to directly compare cellulose to carbon fiber. With this in
consideration, the comparisons must account for the initial 10% cellulose property values.
Figure 46, below, shows the tensile stress measured for the composites. However,
other than the 30% cellulose composite, the values reported are all very similar to the PA
blend.
0
500
1000
1500
2000
2500
3000
3500
4000
PA Blend 10% Cell. 20% Cell. 10% Cell. /10% C.F.
30% Cell. 10% Cell. /20% C.F.
Mo
du
lus
(MP
a)
Composition
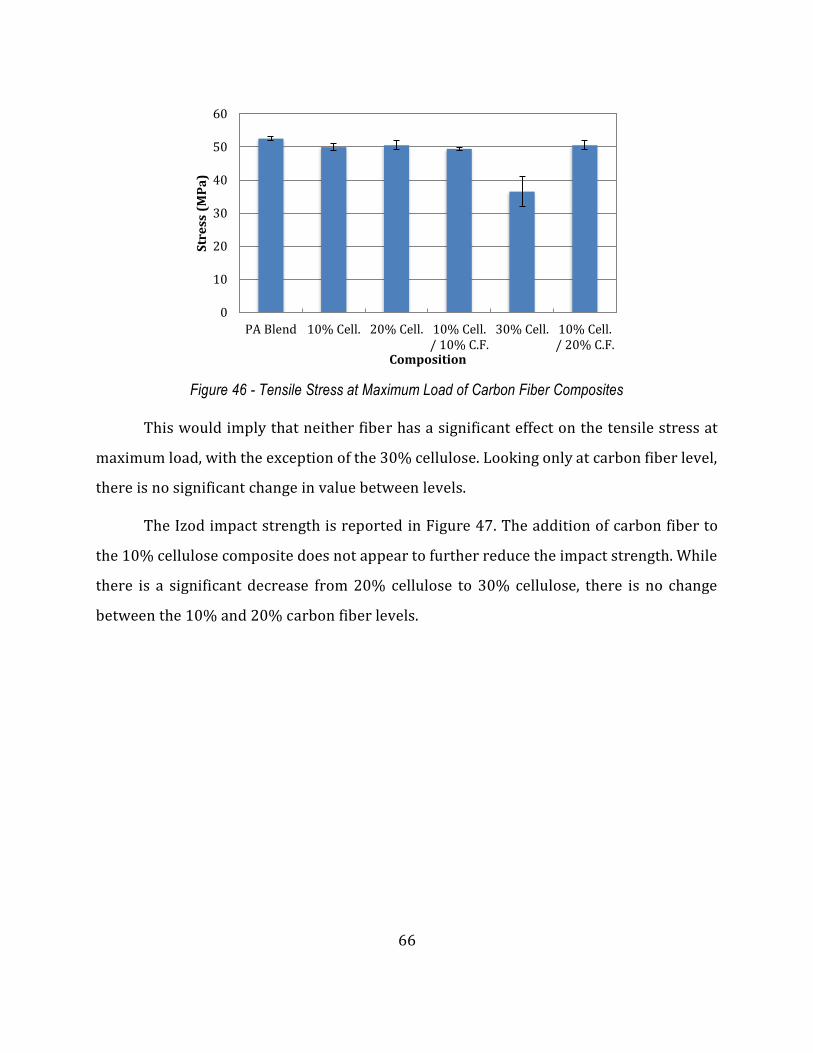
66
Figure 46 - Tensile Stress at Maximum Load of Carbon Fiber Composites
This would imply that neither fiber has a significant effect on the tensile stress at
maximum load, with the exception of the 30% cellulose. Looking only at carbon fiber level,
there is no significant change in value between levels.
The Izod impact strength is reported in Figure 47. The addition of carbon fiber to
the 10% cellulose composite does not appear to further reduce the impact strength. While
there is a significant decrease from 20% cellulose to 30% cellulose, there is no change
between the 10% and 20% carbon fiber levels.
0
10
20
30
40
50
60
PA Blend 10% Cell. 20% Cell. 10% Cell./ 10% C.F.
30% Cell. 10% Cell./ 20% C.F.
Str
ess
(M
Pa
)
Composition
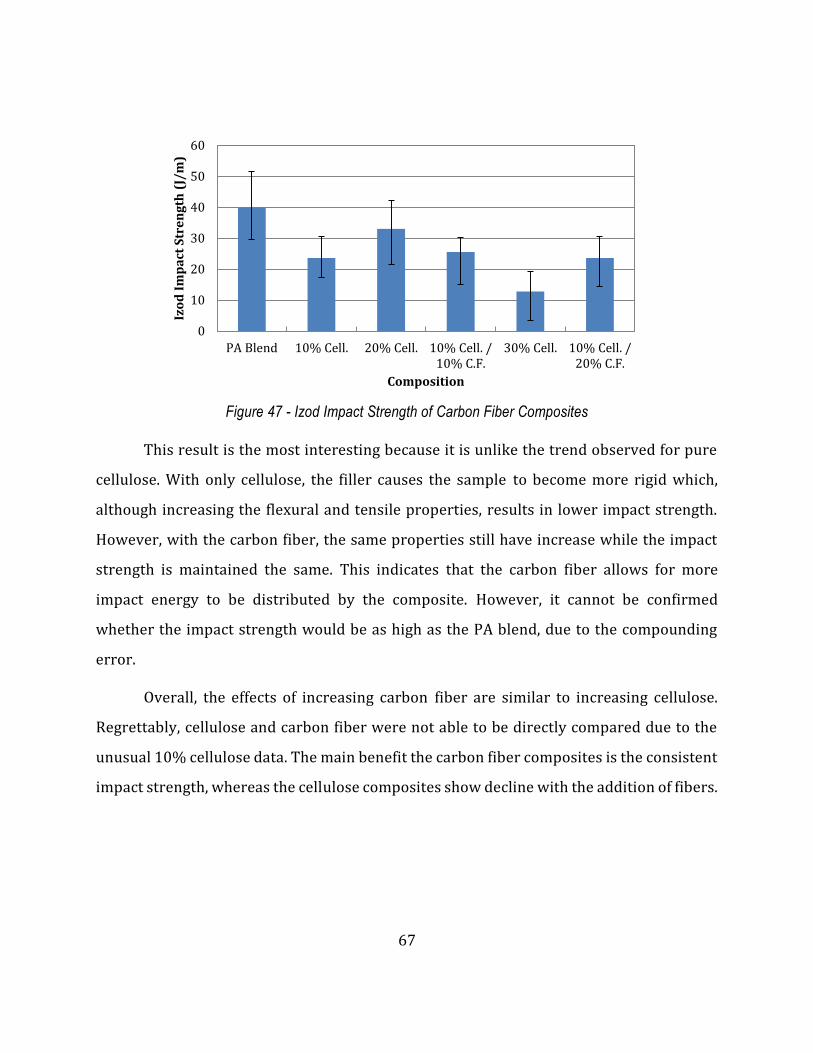
67
Figure 47 - Izod Impact Strength of Carbon Fiber Composites
This result is the most interesting because it is unlike the trend observed for pure
cellulose. With only cellulose, the filler causes the sample to become more rigid which,
although increasing the flexural and tensile properties, results in lower impact strength.
However, with the carbon fiber, the same properties still have increase while the impact
strength is maintained the same. This indicates that the carbon fiber allows for more
impact energy to be distributed by the composite. However, it cannot be confirmed
whether the impact strength would be as high as the PA blend, due to the compounding
error.
Overall, the effects of increasing carbon fiber are similar to increasing cellulose.
Regrettably, cellulose and carbon fiber were not able to be directly compared due to the
unusual 10% cellulose data. The main benefit the carbon fiber composites is the consistent
impact strength, whereas the cellulose composites show decline with the addition of fibers.
0
10
20
30
40
50
60
PA Blend 10% Cell. 20% Cell. 10% Cell. /10% C.F.
30% Cell. 10% Cell. /20% C.F.
Izo
d I
mp
act
Str
en
gth
(J/
m)
Composition

68
7.0 Conclusions
Through thermal and mechanical comparisons, it was determined that the Suzano
fiber had the highest improvement of mechanical properties when compounded with each
polyamide. This is due to the higher cellulose content as a result of the fiber’s processing
method. However, the disadvantage of the Suzano fiber is its ability to feed into the
processing equipment.
Further investigation into ultraviolet radiation as a method to increase thermal
stability was unsuccessful. Slight increase was observed for the fibers with less cellulose.
However, a decrease in thermal stability occurred for the higher cellulose content fiber.
Thus, it is concluded that UV treatment is more suitable for fibers with high amounts of
lignin.
Overall, the 20% cellulose level resulted in the most favourable combination of
properties. Although the 30% level has the highest flexural modulus, there is also abrupt
decrease in tensile stress and impact strength between the 20% and 30% filler levels.
Furthermore, 20% filler level showed the highest relative increase to the flexural stress at
5% strain and the Young’s Modulus. Poorer values at 30% cellulose content are attributed
to high filler levels causing fiber agglomeration. This results in ineffective stress transfer
within the matrix.
The relative changes in properties for 20% cellulose versus 20% glass fiber was
made compared to unfilled polyamide blend and polyamide 6, respectively. The
comparison between these relative amounts showed a greater increase in property values
for glass fiber. However, the relative increases for the 20% cellulose and its lower density
can still prove advantageous for applications that do not require the full capacity of glass
fiber composite properties.
The blending of RPA 6 and PA 6,10 generally resulted in intermediate property
values. The flexural modulus, melting temperature, and crystallization temperature had
69
intermediate values that tended toward the lower property value. The addition of PA 6,10
did not significantly improve the mechanical or thermal properties of RPA 6. From the
comparison of mechanical and thermal properties, the addition of PA 6,10 tends to be a
disadvantage. This is observed in the decrease of tensile modulus, flexural modulus, and
flexural stress. Additionally, the melt temperature of PA 6,10 is higher, which requires
more energy and would result in more thermal degradation. The use of PA 6,10 is good for
sustainability because of its bio-content but must be balanced with the additional cost.
Although the addition of carbon fiber does show relative increase to mechanical
properties, the amount of increase is comparable to that of the cellulose filler. Because
cellulose fiber is significantly cheaper and easier to process, the application of carbon fiber
filler is unnecessary. However, the preserving of impact strength while also improving
other mechanical properties is a significant advantage. Particular component
specifications would need to be considered in order to determine what levels of impact
strength would be acceptable.
70
8.0 Recommendations
It is shown that a 20% cellulose fiber composite could potentially be suitable for
under-the-hood applications. However, these composites have not shown property value
increase equivalent to glass fiber. It is recommended that natural fiber composites can be
used to replace glass fiber in components that do not require the full extent of fiberglass
material properties. Additionally, further testing of durability and other untested
properties must be performed in order to evaluate eligibility based on full component
specifications.
From the selection of commercially available wood fibers, it was shown that the
compounding of the Suzano fiber had the highest increase in material properties. However,
the original form of the fiber is difficult for compounding. Therefore, it is recommended
that a method of pre-processing the fiber be developed in order to enable easy
compounding with the polyamide.
It is recommended that the use of PA 6,10 in a polyamide blend be further analyzed
to justify its additional cost. It is concluded that the blending of PA 6,10 in PA 6 generally
decreases the desired properties. However, the incentive to use PA 6,10 is that it is partially
bio-based and has lower moisture absorption. The effect of moisture absorption on the
composites should be further investigated to determine if PA 6,10 could improve the
economic viability of its use.
Due to limited resources, the investigation of carbon fiber and cellulose hybrid
composites could not be directly compared to the cellulose composites. It is therefore
recommended that further investigation be performed when more material is available.
71
References
[1] National Highway Traffic Safety Administration, "Summary of Fuel Economy Performance," U.S. Departemetn of Transportation, Washington DC, 2014.
[2] Nation Highway Traffic Safety Administration, "Federal Register," National Archives and Records Administration, 2012.
[3] W. J. Joost, "Reducing Vehicle Weight and Improving U.S. Energy Efficiency Using Integrated Computational Materials Engineering," The Journal of The Minerals, Metals & Materials Society, vol. 64, no. 9, pp. 1032-1038, 2012.
[4] Y. Amintowlieh, "Nylon-6/Agricultural Filler Composites," University of Waterloo, p. Thesis, 2010.
[5] American Chemistry Council, "Plastics and Polymer Composites in Light Vehicles," Economics & Statistics Department, 2015.
[6] A. Abdal-hay, N. P. G. Suardana, D. Y. Jung, K.-S. Choi and J. K. Lim, "Effect of Diameters and Alkali Treatment on the," International Journal of Precision Engineering and Manufacturing, vol. 13, no. 7, pp. 1199-1206 , 2012.
[7] A. Michael and A. Irene, Handbook of Textile Processing Chemicals, Synapse Information Resources, Inc., 2013.
[8] W. Nelson, Nylon Plastics Technology, London: The Butterworth Group, 1976.
[9] L. Sperling, Introduction to Physical Polymer Science, 2nd Edition ed., Bethlehem, Pennsylvania: John Wiley & Sons, Inc., 1992.
[10] Department of Polymer Science, ""Nylon [Pictures Only]"," University of Southern Mississippi, 2005. [Online]. Available: http://pslc.ws/macrog/nylon.htm. [Accessed 23 November 2014].
[11] S. Dasgupta, W. B. Hammond and W. A. Goddard III, "Crystal Structures and Properties of Nylon Polymers from Theory," Journal of the American Chemical Society, vol. 118, no. 49, pp. 12291-12301, 1996.
[12] B. Majumdar, H. Keskkula and D. R. Pault , "Mechanical behaviour and morphology of toughened aliphatic polyamides," Polymer, vol. 35, no. 7, pp. 1399-1408, 16 April 1993.
[13] B. Majumdar, H. Keskkula and D. R. Paul, "Effectof the nature of the polyamide on the properties and morphology of compatibilized nylon/acrylonitrile-butadiene-styrene blends," Polymer, vol. 35, no. 25, pp. 5468-5477, 24 January 1994.
[14] T. Fornes and D. Paul, "Structure and Properties of NAnocomposites based on Nylon-11 and -12 Compared with Those Based on Nylon-6," Macromolecules, vol. 37, no. 20, p. 7698, 2004.
[15] G. Odian, Principles of Polymerization, Fourth Edition, New York: Wiley Interscience, 2004.
[16] D. E. Floyd, Polyamide Resins, New York: Reinhold Publishing Corporation, 1966.
72
[17] L. Hollaway, Handbook of Polymer Composites for Engineers, England: Woodhead Publishing Ltd, 1994.
[18] A. M. Shibley, Handbook of Composites, L. George, Ed., New York: Van Nostrand Reinhold Company Inc., 1982.
[19] W. Chow and Z. Mohd Izak, "Polyamide blend-based nanocompposites: A Review," eXPRESS Polymer Letters, vol. 9, no. 3, pp. 211-232, 2015.
[20] J. Chen, W. Wu, C. Chen and S. He, "Toughened Nylon66/Nylon6 Ternary Nanocompositesby Elastomers," Journal of Applied Polymer Science, vol. 115, pp. 588-598, 2010.
[21] A. Kiziltas and E. C. Lee, "Sustainable Composites Based on Polyamides and Cellulose Fibers," 2014.
[22] T. S. Ellis, "Miscibillity and Immiscibility of Polyamide Blends," Macromoleculs, vol. 22, no. 2, pp. 742-754, 1989.
[23] T. S. Ellis, "Mixing Relationships in Aliphatic Polyamide Blends," Polymer, vol. 33, no. 7, pp. 1470-1476, 1992.
[24] Rapra Review Reports, "Polyamides as Engineering Thermoplastic Materials," Rapra Technology Limited, Shropshire, 2000.
[25] T. Q. Hu, Characterization of lignocellulosic materials, Oxford: Blackwell, 2008.
[26] M. Lewin and I. S. Goldstein, Wood Structure and Composition, New York: Marcel Dekker, Inc., 1991.
[27] C. J. Biermann, Handbook of Pulp and Papermaking, Second Edition, Elsevier, 1996.
[28] O. Faruk and M. Sain, Biofiber Reinforcement in Composite Materials, Kidlington: Woodhead, 2015.
[29] H. Tran and E. Vakkilainnen, "The Kraft Chemical Recovery Process," Tappi, 2008. [Online]. Available: http://www.tappi.org/content/events/08kros/manuscripts/1-1.pdf. [Accessed 11 March 2016].
[30] A. Pearson, "A Unified Theory of Refining," in Pulp and Paper Technology Series, 1990, p. 128.
[31] H. Yang, R. Yan, H. Chen, D. H. Lee and C. Zheng, "Characteristics of Hemicellulose, Cellulose, and Lignin Pyrolysis," Fuel, pp. 1781-1788, 2006.
[32] R. Reixach, J. Puig, J. A. Mendex, J. Girones, F. X. Espinach, G. Arbat and P. Mutje, "Orange Wood Fiber Reinforced Polypropylene Composites: Thermal Properties," BioResources, pp. 2156-2166, 2015.
[33] R. M. Rowell, A. R. Sanadi, D. F. Caulfield and R. E. Jacobson, "Utilization of Natural Fibers in Plastic Composites: Problems and Opportunities," Lignocellulosic-Plastics Composites, p. 1997, 23-51.
[34] X. Xu, "Cellulose Fiber Reinforced Nylon 6 or Nylon 66 Composites," Georgia Institute of Technology, p. Thesis, 2008.
73
[35] D. N. Saheb and J. Jog, "Natural Fiber Polymer Composites: A Review," Advances in Polymer Technology, vol. 18, no. 4, pp. 351-363, 1999.
[36] D. R. L. Vedoy, "Development of Methodologes for Improving Thermal Stability of Plant Fibers for Application in Thermoplastic Composites," University of Waterloo, p. Thesis, 2012.
[37] H.-S. Yang, M. P. Wolcott, H.-S. Kim, S. Kim and H.-J. Kim, "Effect of different compatibilizing agents on the mechanical properties of lignocellulosic material filled polyethylene bio-composites," Composite Structures, vol. 79, no. 3, pp. 369-375, 2006.
[38] L. Liu, B.-M. Zhang, D.-F. Wang and Z.-J. Wu, "Effects of cure cycles on void content and mechanical properties of composite laminates," Compostive Structures, vol. 79, no. 3, pp. 303-309, 2006.
[39] C. Dong and I. J. Davis, "Flexural Properties of Wheat Straw Reinforced Polyester Composites," American Journal of Material Science, vol. 1, no. 2, pp. 71-75, 2011.
[40] C. Klason, J. Kubát and H. Strömvall, "The Efficiency of Cellulosic Fillers in Common Thermoplastics. Part 1. Filling without Processing Aids or Coupling Agents," International Journal of Polymeric Materials and Polymeric Biomaterials , vol. 10, no. 3, pp. 159-187, 1984.
[41] K. d. Sears and R. Jacobson, "Reinforcement of Engineering Thermoplastics with High Purity Wood Cellulose Fibers," International Conference on Woodfiber-Plastic Composites, pp. 27-34, 2001.
[42] E. Ozen, A. Kiziltas, E. E. Kiziltas and D. J. Gardner, "Natural Fiber Blend—Nylon 6 Composites," Polymer Composites, pp. 544-553, 2013.
[43] A. Kiziltas, D. J. Gardner, Y. Han and H.-S. Yang, "Mechanical Properties of Microcrystalline Cellulose (MCC) Filled Engineering Thermoplastic Composites," Journal of Polymers and the Environment, vol. 22, no. 3, pp. 365-372, 2014.
[44] A. Kiziltas, D. J. Gardner, Y. Han and H.-S. Yang, "Dynamic Mechanical behavior and thermal properties of microcrystalline cellulose (MCC)-filled nylon 6 composites," Thermochimica Acta, vol. 519, pp. 38-43, 2011.
[45] M. Misra, A. Mohanty, P. Tummala and L. Drzal, "Injection molded biocomposites from natural fibers and modified polyamide," in ANTEC, Chicago, 2004.
[46] K. D. Sears, R. E. Jacobson, D. F. Caulfield and J. Underwood, "Composites containing cellulosic pulp fibers and methods of making and using the same," US6270883 B1, 9 Oct 1998.
[47] U. Muller, M. Ratzsch, M. Schwanninger, M. Steiner and H. Zobl, "Yellowing and IR schanges of spruce wood as result of UV-irradiation," Journal of Photochemistry and Photobiology, vol. 69, no. 2, pp. 97-105, 2003.
[48] M. Deka, M. Humar, G. Rep, B. Kricej, M. Sentjurc and M. Petric, "Effects of UV light irradiation on colour stability of thermally modified, copper ethanolamine treated and non-modified wood: EPR and DRIFT spectroscopic studies," Wood Science Technology, vol. 42, no. 1, pp. 5-20, 2008.
74
[49] E. Fitzer and M. Heine, Fibre Reinforcements for Composite Materials, New York: Elsevier Science Publishers, 1988.
[50] A. Schiavo, "Carbon Fiber 2.0: Roadmap for Growth to 2020 and Beyond," in Automotive Composites Conference and Exhibition, Novi, 2015.
[51] N. G. Karsli and A. Aytac, "Tensile and thermomechanical properties of short carbon fiber reinforced polyamide 6 composites," Composites Part B: Engineering, vol. 51, pp. 270-275, 2013.
[52] S. Fua, B. Laukeb, E. Mäderb, C. Yuea and X. Hua, "Tensile properties of short-glass-fiber- and short-carbon-fiber-reinforced polypropylene composites," Composites Part A: Applied Science and Manufacturing, vol. 31, no. 10, pp. 1117-1125, 2000.
[53] Y. Kong and J. Hay, "The enthalpy of fusion and degree of crystallinity of polymers as measured by DSC," European Polymer Journal, vol. 39, no. 8, p. 1721–1727, 2003.
[54] TA Instruments, "Thermal Applications Note: Polymer Heats of Fusion," [Online]. Available: http://www.tainstruments.co.jp/application/pdf/Thermal_Library/Applications_Notes/TN048.PDF. [Accessed 30 March 2016].
[55] ASTM International, "Standard Test Method for Decomposition Kinetics by Thermogravimetry Using the Ozawa/Flynn/Wall Method," ASTM International, West Conshohocken, 2013.
[56] F. Yao, Q. Wu, Y. Lei, W. Guo and Y. Xu, "Thermal decomposition kinetics of natural fibers: Activation," Polymer Degradation and Stability, vol. 93, pp. 90-98, 2008.
[57] N. Zeng, S. L. Bai, C. G'Sell, J.-M. Hiver and Y. Mai, "Study on the microstructures and mechanical behaviour of compatibilized polypropylene/polyamide-6 blends," Polymer International, vol. 51, pp. 1439-1447, 2002.
[58] S.-L. Bai, G.-T. Wang, J.-M. Hiver and C. G'Sel, "Microstructures and mechanical properties of polypropylene/polyamide6/polyethelene-octene elastomer blends," Polymer, vol. 45, pp. 3063-3071, 2004.
[59] E. McHenry and Z. Stachurski, "Composite materials based on wood and nylon fibre," Composites Part A; Applied Science and Manufacturing , vol. 34, no. 2, pp. 171-181, 2003.
[60] M. Garcia-Ramirez, J. Cavaillé, D. Dupeyre and A. Péguy, "Cellulose-polyamide 66 blends. I. Processing and characterization," Journal of Polymer Science Part B: Polymer Physics, vol. 32, no. 8, pp. 1437-1448, 1994.
[61] H. Ku, H. Wang, N. Pattarachaiyakoop and M. Trada, "A review on the tensile properties of natural fiber reinforced polymer composites," Composites: Part B, vol. 42, pp. 856-873, 2011.
[62] A. Kiziltas, D. J. Gardner, Y. Han and H.-S. Yang, "Determining the Mechanical Properties of Microcrystalline Cellulose (MCC)-Filled PET-PTT Blend Composites," Wood and Fiber Science, vol. 42, no. 2, pp. 165-176, 2010.
[63] A. Rudin, The Elements of Polymer Science and Engineering, 2nd Edition ed., San Diego, CA: Academic Press, 1999, p. 380.
75
[64] A. Kiziltas, D. J. H. Y. Gardner and H.-S. Yang, "Thermal properties of microcrystalline cellulose-filled PET-PTT blend polymer composites," Journal of Thermal Analysis and Calorimetry, vol. 103, pp. 163-170, 2010.
[65] Y. Feng, X. Jin and J. Hay, "Effect of nucleating agent addition on crystallization of isotactic polypropylene," Journal of Applied Polymer Science, vol. 69, no. 10, p. 2089–2095, 1998.
[66] R. Dweiri and C. Azhari, "Thermal and Flow Property–Morphology Relationship ofSugarcane Bagasse Fiber-Filled Polyamide 6 Blends," Journal of Applied Polymer Science, vol. 92, pp. 3744-3754, 2004.
[67] P. C. Painter, S. L. Shenoy, D. E. Bhagwagar, J. Fishburn and M. M. Coleman, "Effect of Hydrogen Bonding on the Melting Point Depression in Polymer Blends Where One Component Crystallizes," Macromolecules, vol. 24, no. 20, pp. 5623-5629, 1991.
[68] M. Garcia-Ramirez, J. Cavaille, D. Dupeyre and A. Peguy, "Cellulose-Polyamide 66 Blends. Processing and Characterization," Journal of Polymer Science Part B: Polymer Physics, vol. 32, no. 8, pp. 1437-1448, 1994.
[69] H. Seefeldt, "Fire retardancy of wood-plastic composites," Thesis submitted to The Technical University of Berlin, 2012.
[70] RTP Company, "NYLON 6/12 (PA)," 2014. [Online]. Available: http://www.rtpcompany.com/products/product-guide/nylon-612-pa-polyamide-612/. [Accessed 20 November 2014].
[71] E. Bolton, "Development of Nylon," Industrial and Engineering Chemistry, vol. 35, no. 1, pp. 53-58, January 1942.
[72] H. Hager and J. Limper, "High-Tech Plastics from the Field," Evonik Science Newsletter, pp. 24-30.
[73] L. Shen, J. Haufe and M. K. Patel, "Product overview and market projection of emerging bio-based plastics," Group Science, Technology and Society, Netherlands, 2009.
[74] L. Trossarelli, "The History of Nylon," Turin University, 9 March 2002. [Online]. [Accessed 20 November 2014].
[75] R. P. Wool and X. S. Sun, Bio-Based Polymers and Composites, Elsevier Academic Press, 2005.
[76] E. o. D. i. C. Materials, Wilkins, Dick J., Philadelphia: ASTM Special Technical Publications, 1984.
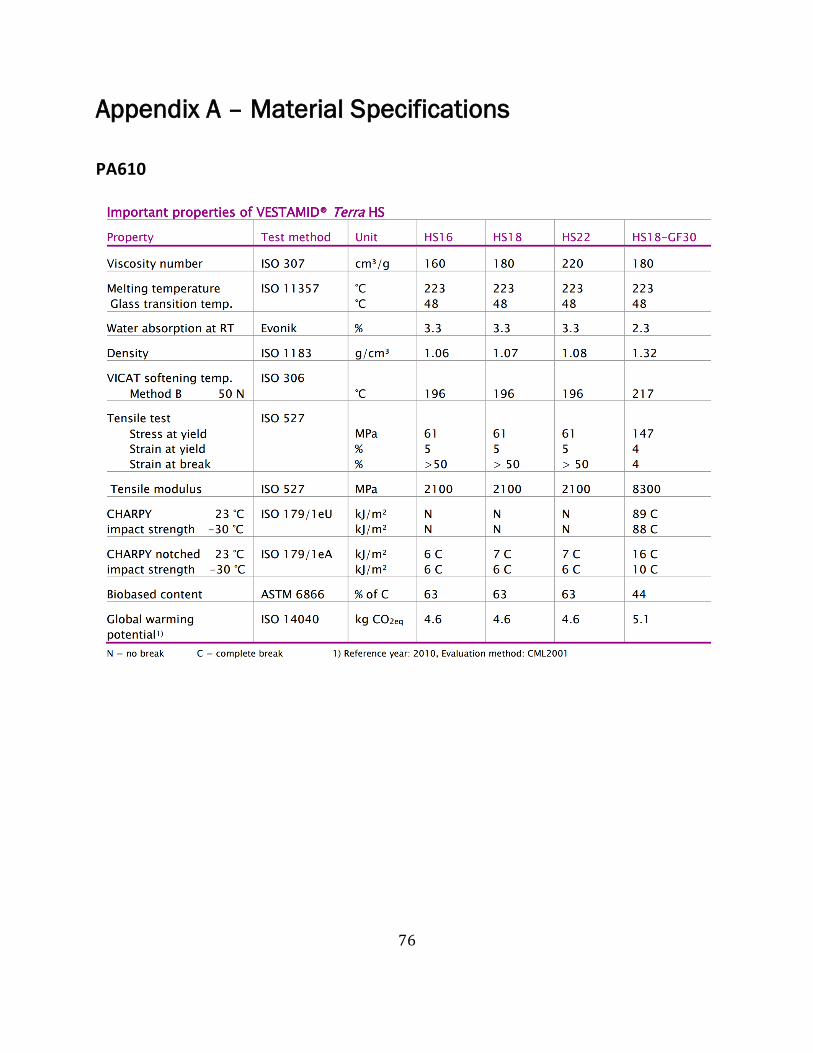
76
Appendix A – Material Specifications
PA610
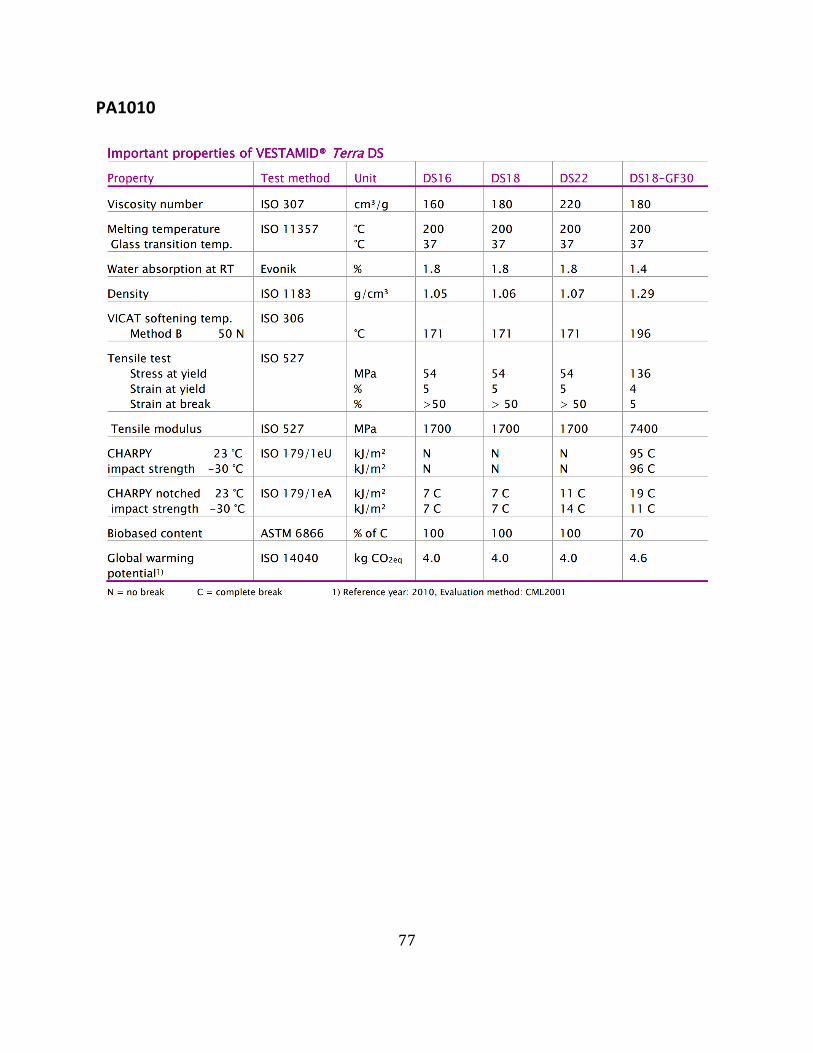
77
PA1010
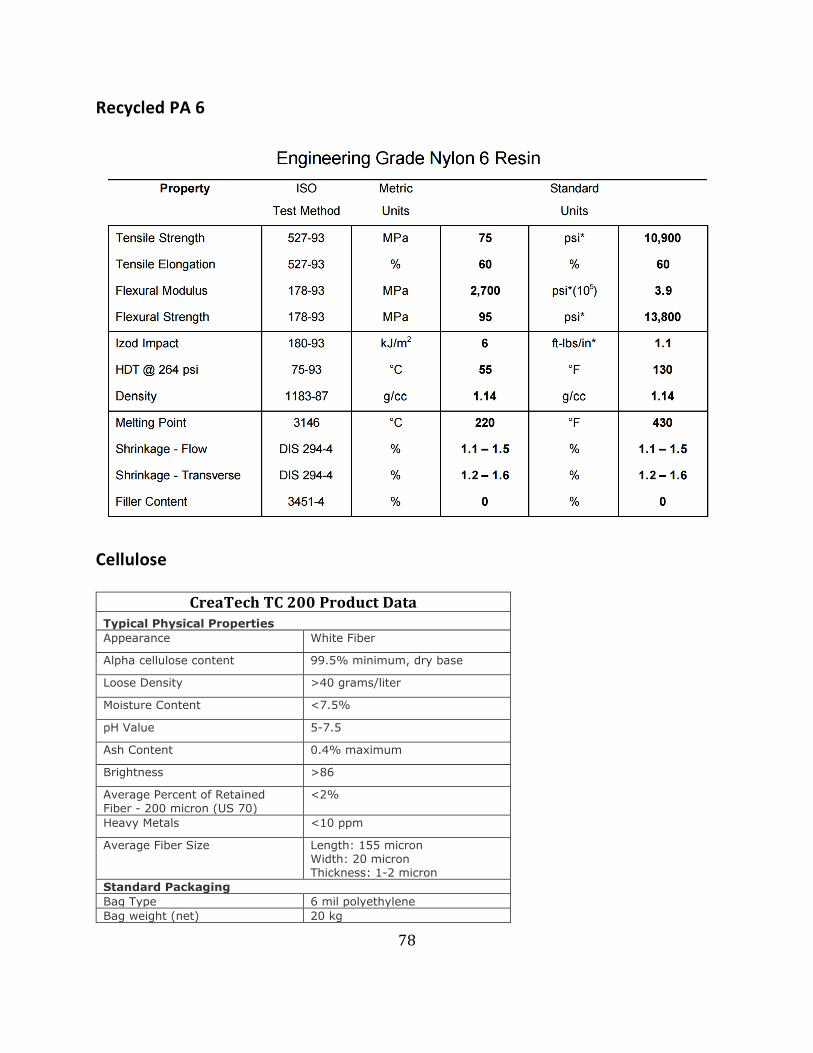
78
Recycled PA 6
Cellulose
CreaTech TC 200 Product Data Typical Physical Properties
Appearance White Fiber
Alpha cellulose content 99.5% minimum, dry base
Loose Density >40 grams/liter
Moisture Content <7.5%
pH Value 5-7.5
Ash Content 0.4% maximum
Brightness >86
Average Percent of Retained Fiber - 200 micron (US 70)
<2%
Heavy Metals <10 ppm
Average Fiber Size Length: 155 micron Width: 20 micron Thickness: 1-2 micron
Standard Packaging
Bag Type 6 mil polyethylene
Bag weight (net) 20 kg
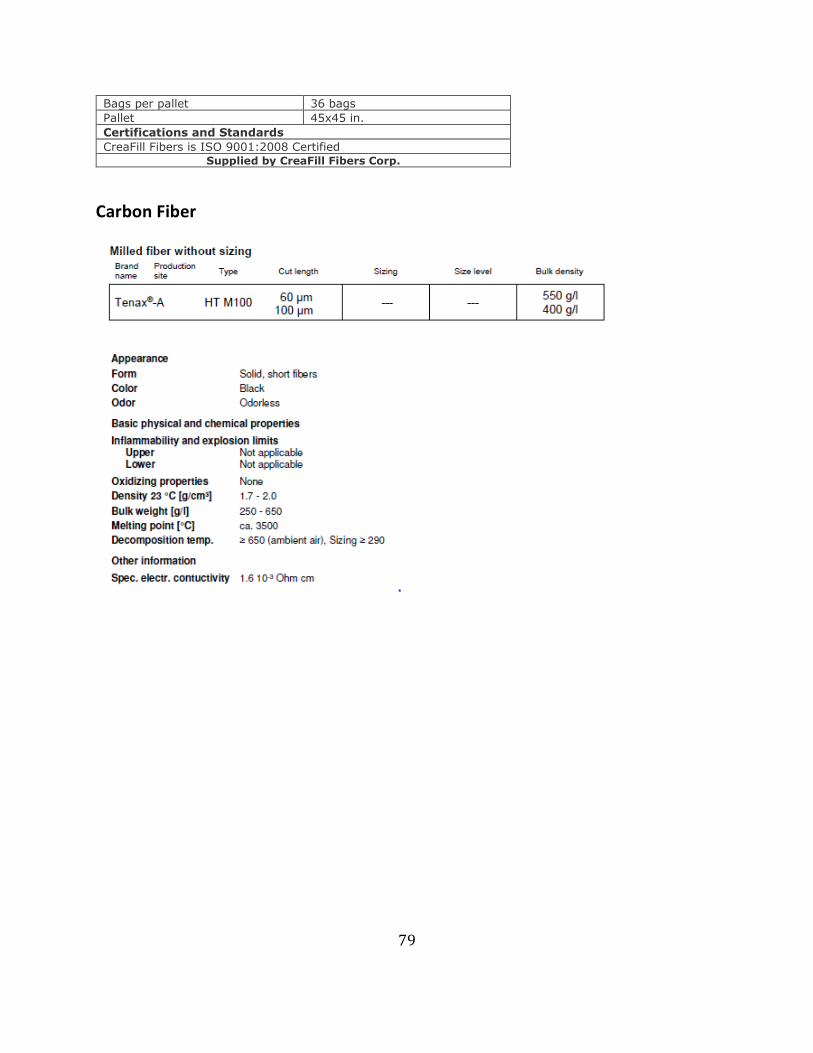
79
Bags per pallet 36 bags
Pallet 45x45 in.
Certifications and Standards
CreaFill Fibers is ISO 9001:2008 Certified Supplied by CreaFill Fibers Corp.
Carbon Fiber
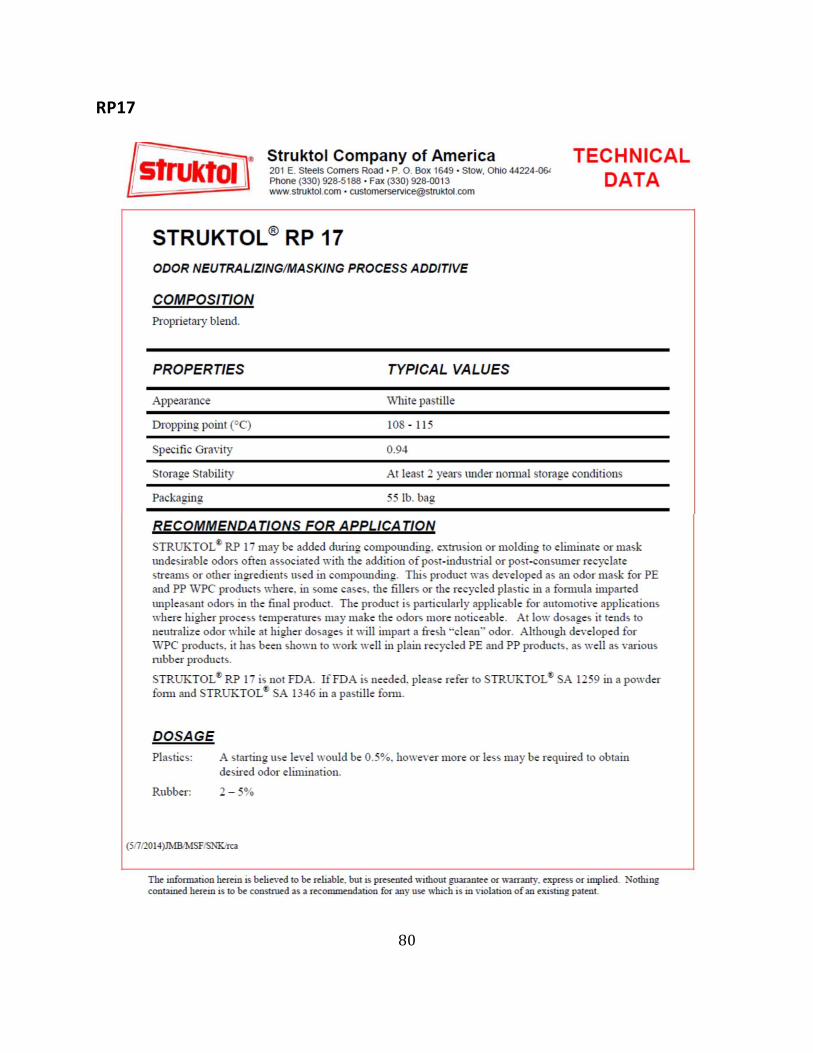
80
RP17
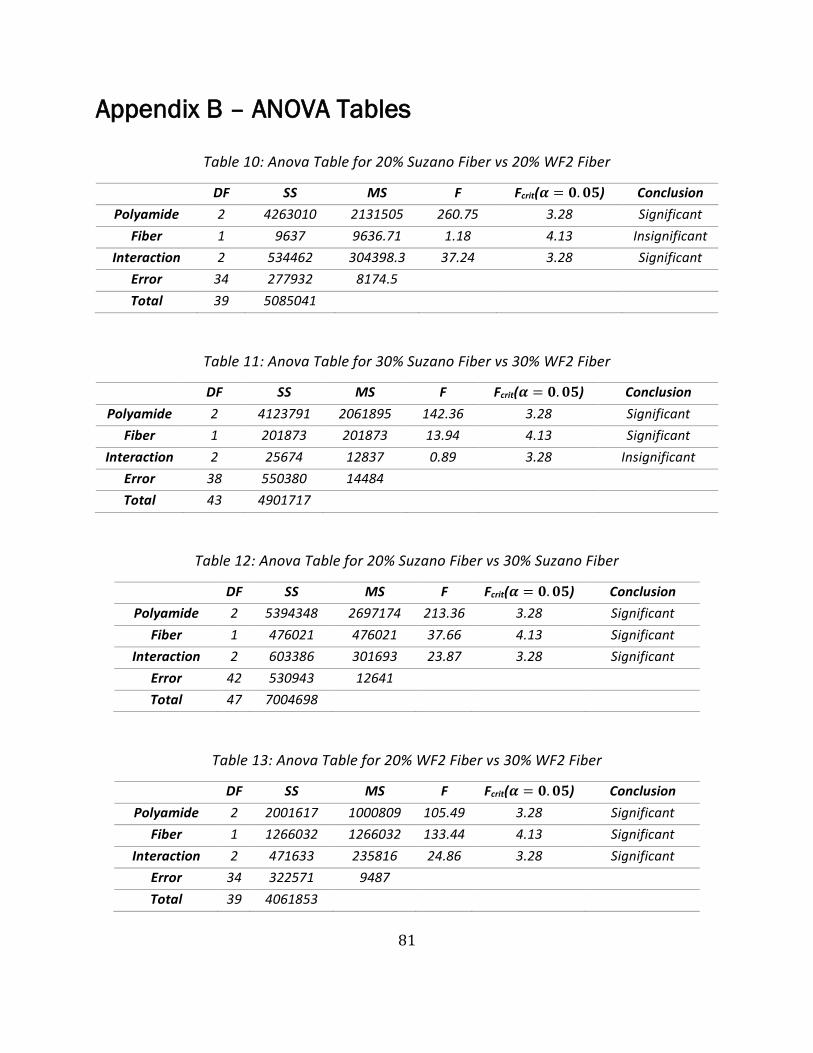
81
Appendix B – ANOVA Tables
Table 10: Anova Table for 20% Suzano Fiber vs 20% WF2 Fiber
DF SS MS F Fcrit(𝜶 = 𝟎. 𝟎𝟓) Conclusion
Polyamide 2 4263010 2131505 260.75 3.28 Significant
Fiber 1 9637 9636.71 1.18 4.13 Insignificant
Interaction 2 534462 304398.3 37.24 3.28 Significant
Error 34 277932 8174.5
Total 39 5085041
Table 11: Anova Table for 30% Suzano Fiber vs 30% WF2 Fiber
DF SS MS F Fcrit(𝜶 = 𝟎. 𝟎𝟓) Conclusion
Polyamide 2 4123791 2061895 142.36 3.28 Significant
Fiber 1 201873 201873 13.94 4.13 Significant
Interaction 2 25674 12837 0.89 3.28 Insignificant
Error 38 550380 14484
Total 43 4901717
Table 12: Anova Table for 20% Suzano Fiber vs 30% Suzano Fiber
DF SS MS F Fcrit(𝜶 = 𝟎. 𝟎𝟓) Conclusion
Polyamide 2 5394348 2697174 213.36 3.28 Significant
Fiber 1 476021 476021 37.66 4.13 Significant
Interaction 2 603386 301693 23.87 3.28 Significant
Error 42 530943 12641
Total 47 7004698
Table 13: Anova Table for 20% WF2 Fiber vs 30% WF2 Fiber
DF SS MS F Fcrit(𝜶 = 𝟎. 𝟎𝟓) Conclusion
Polyamide 2 2001617 1000809 105.49 3.28 Significant
Fiber 1 1266032 1266032 133.44 4.13 Significant
Interaction 2 471633 235816 24.86 3.28 Significant
Error 34 322571 9487
Total 39 4061853

82
Table 14: ANOVA Table for RP17 content vs Flex Modulus
DF SS MS F Fcrit(𝜶 = 𝟎. 𝟎𝟓) Conclusion
Factor 1 0.0129 0.0129 7.99 5.32 Significant
Error 8 0.0129 0.00162
Total 9 0.0258
Table 15: ANOVA Table for RP17 content vs Stress at 5% Strain
DF SS MS F Fcrit(𝜶 = 𝟎. 𝟎𝟓) Conclusion
Factor 1 3.08 3.08 1.53 5.32 Insignificant
Error 8 16.1 2.02
Total 9 19.2
Table 16: ANOVA Table for RP17 content vs Young's Modulus
DF SS MS F Fcrit(𝜶 = 𝟎. 𝟎𝟓) Conclusion
Factor 1 756584 756584 34.4 4.96 Significant
Error 10 219901 21990
Total 11 976485
Table 17: ANOVA Table for RP17 content vs Tensile Stress at Maximum Load
DF SS MS F Fcrit(𝜶 = 𝟎. 𝟎𝟓) Conclusion
Factor 1 91.6 91.6 56.6 4.96 Significant
Error 10 16.2 1.62
Total 11 108
Table 18: ANOVA Table for RP17 content vs Impact Strength
DF SS MS F Fcrit(𝜶 = 𝟎. 𝟎𝟓) Conclusion
Factor 1 982 982 15.7 4.49 Significant
Error 16 1000 62.5
Total 17 1982
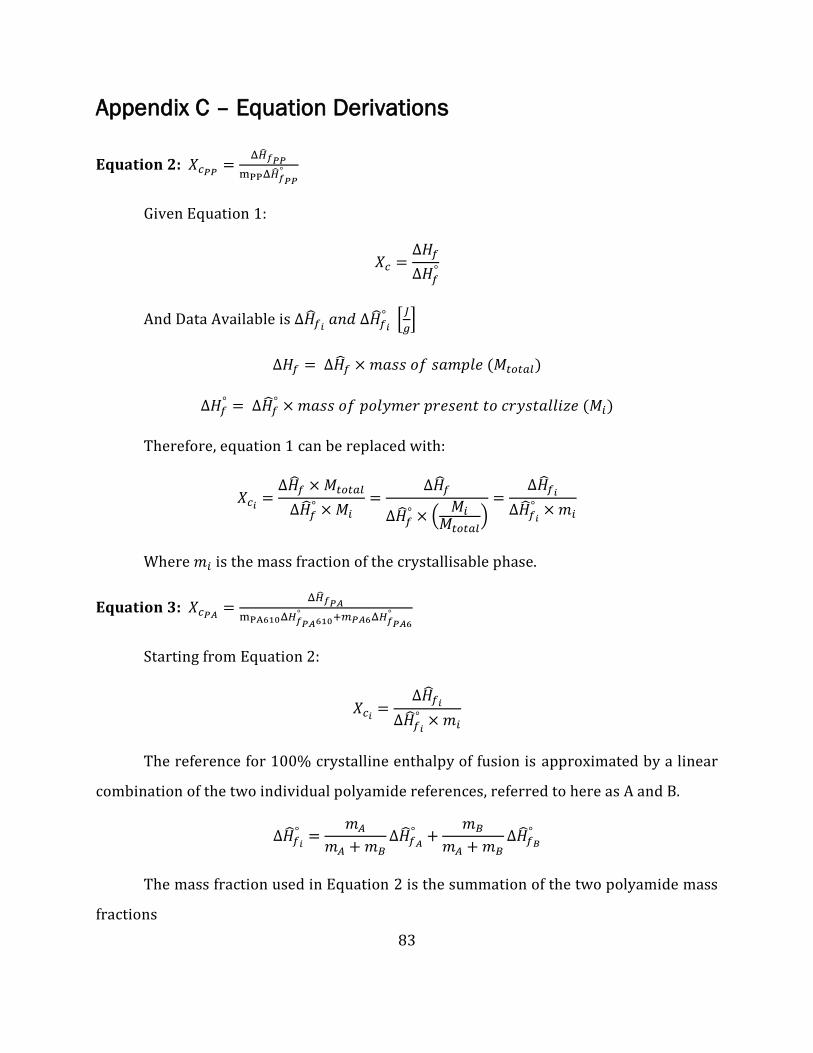
83
Appendix C – Equation Derivations
Equation 2: 𝑋𝑐𝑃𝑃=
Δ�̂�𝑓𝑃𝑃
mPPΔ�̂�𝑓𝑃𝑃°
Given Equation 1:
𝑋𝑐 =Δ𝐻𝑓
Δ𝐻𝑓°
And Data Available is Δ�̂�𝑓𝑖 𝑎𝑛𝑑 Δ�̂�𝑓𝑖
° [𝐽
𝑔]
Δ𝐻𝑓 = Δ�̂�𝑓 × 𝑚𝑎𝑠𝑠 𝑜𝑓 𝑠𝑎𝑚𝑝𝑙𝑒 (𝑀𝑡𝑜𝑡𝑎𝑙)
Δ𝐻𝑓° = Δ�̂�𝑓
° × 𝑚𝑎𝑠𝑠 𝑜𝑓 𝑝𝑜𝑙𝑦𝑚𝑒𝑟 𝑝𝑟𝑒𝑠𝑒𝑛𝑡 𝑡𝑜 𝑐𝑟𝑦𝑠𝑡𝑎𝑙𝑙𝑖𝑧𝑒 (𝑀𝑖)
Therefore, equation 1 can be replaced with:
𝑋𝑐𝑖=
Δ�̂�𝑓 × 𝑀𝑡𝑜𝑡𝑎𝑙
Δ�̂�𝑓° × 𝑀𝑖
=Δ�̂�𝑓
Δ�̂�𝑓° × (
𝑀𝑖
𝑀𝑡𝑜𝑡𝑎𝑙)
=Δ�̂�𝑓𝑖
Δ�̂�𝑓𝑖
° × 𝑚𝑖
Where 𝑚𝑖 is the mass fraction of the crystallisable phase.
Equation 3: 𝑋𝑐𝑃𝐴=
Δ�̂�𝑓𝑃𝐴
mPA610Δ𝐻𝑓𝑃𝐴610° +𝑚𝑃𝐴6Δ𝐻𝑓𝑃𝐴6
°
Starting from Equation 2:
𝑋𝑐𝑖=
Δ�̂�𝑓𝑖
Δ�̂�𝑓𝑖
° × 𝑚𝑖
The reference for 100% crystalline enthalpy of fusion is approximated by a linear
combination of the two individual polyamide references, referred to here as A and B.
Δ�̂�𝑓𝑖
° =𝑚𝐴
𝑚𝐴 + 𝑚𝐵Δ�̂�𝑓𝐴
° +𝑚𝐵
𝑚𝐴 + 𝑚𝐵Δ�̂�𝑓𝐵
°
The mass fraction used in Equation 2 is the summation of the two polyamide mass
fractions
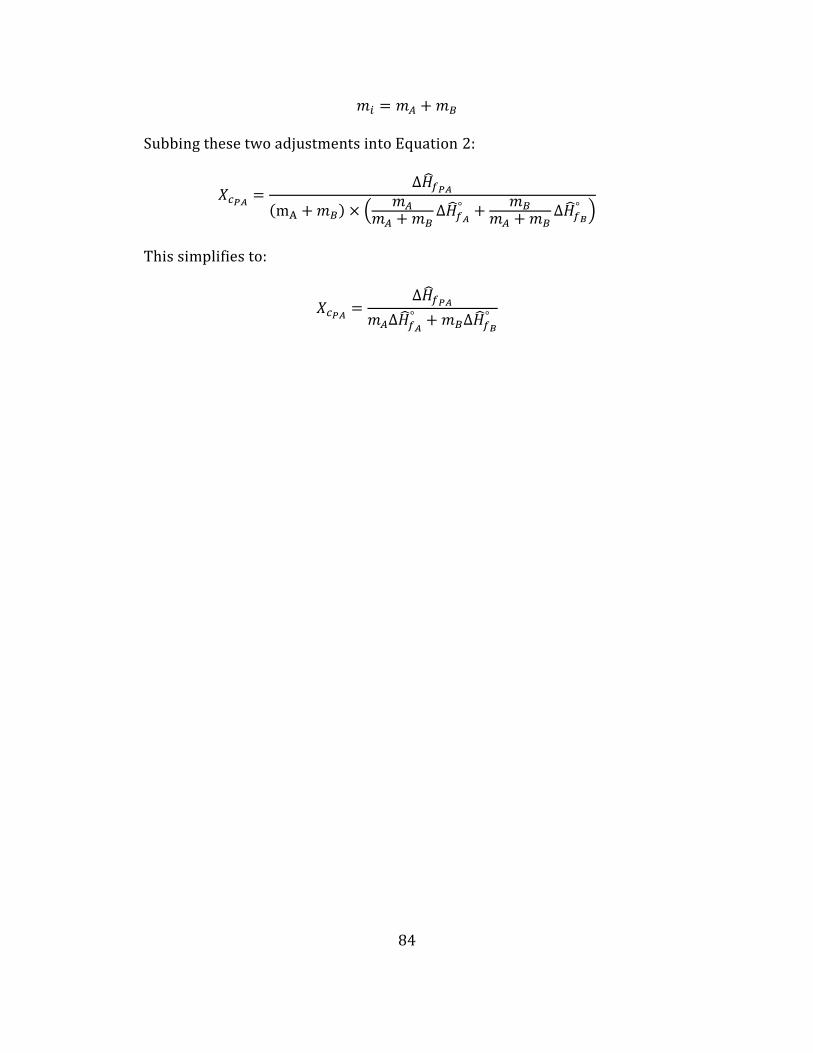
84
𝑚𝑖 = 𝑚𝐴 + 𝑚𝐵
Subbing these two adjustments into Equation 2:
𝑋𝑐𝑃𝐴=
Δ�̂�𝑓𝑃𝐴
(mA + 𝑚𝐵) × (𝑚𝐴
𝑚𝐴 + 𝑚𝐵Δ�̂�𝑓𝐴
° +𝑚𝐵
𝑚𝐴 + 𝑚𝐵Δ�̂�𝑓𝐵
° )
This simplifies to:
𝑋𝑐𝑃𝐴=
Δ�̂�𝑓𝑃𝐴
𝑚𝐴Δ�̂�𝑓𝐴
° + 𝑚𝐵Δ�̂�𝑓𝐵
°
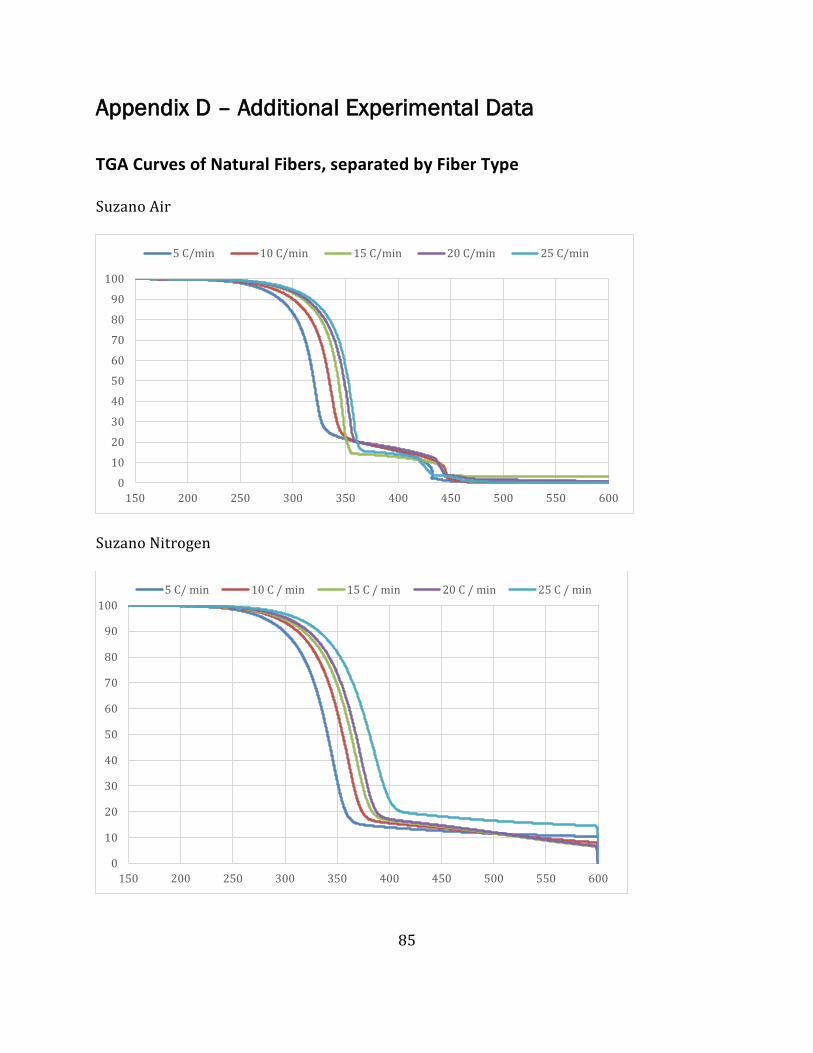
85
Appendix D – Additional Experimental Data
TGA Curves of Natural Fibers, separated by Fiber Type
Suzano Air
Suzano Nitrogen
0
10
20
30
40
50
60
70
80
90
100
150 200 250 300 350 400 450 500 550 600
5 C/min 10 C/min 15 C/min 20 C/min 25 C/min
0
10
20
30
40
50
60
70
80
90
100
150 200 250 300 350 400 450 500 550 600
5 C/ min 10 C / min 15 C / min 20 C / min 25 C / min

86
Woodforce 1 Air
Woodforce 1 Nitrogen
Woodforce 2 Air
0
10
20
30
40
50
60
70
80
90
100
150 200 250 300 350 400 450 500 550 600
5 C/min 10 C/min 25 C/min 40 C/min 50 C/min
0
10
20
30
40
50
60
70
80
90
100
0 100 200 300 400 500 600 700 800 900
5 C/min 10 C/min 25 C/min 40 C/min 50 C/min

87
Woodforce 2 Nitrogen
0
10
20
30
40
50
60
70
80
90
100
0 100 200 300 400 500 600 700 800 900
5 C/min 10 C/min 25 C/min 40 C/min 50 C/min
0
10
20
30
40
50
60
70
80
90
100
0 100 200 300 400 500 600 700 800 900
5 C/min 10 C/min 25 C/min 40 C/min 50 C/min

88
SEM Image Analysis
Figure 48, below, shows the particle analysis results of the Image J software.
Figure 48 – Image J Ellipse Fit Results
The pixel area of each fitted circle was added and compared to the total number of
pixels of the image. This ratio of 6.1% was then approximated to be the volume fraction of
polypropylene in the composite. Figure 49 shows a histogram of the approximate sizes of
each fitted particle.
Figure 49 – Image J Particle Analysis Histogram