Florida MPOAC Transportation Revenue Study
143
Florida MPOAC Transportation Revenue Study July 2012 Prepared for Florida Metropolitan Planning Organization Advisory Council
Transcript of Florida MPOAC Transportation Revenue Study

Florida MPOAC Transportation Revenue Study
July 2012
Prepared for
Florida Metropolitan Planning Organization Advisory Council


Florida MPOAC Transportation Revenue Study
Prepared for:
Florida Metropolitan Planning Organization Advisory Council Howard Glassman, Executive Director & Project Manager
Prepared by:
USF Center for Urban Transportation Research
Stephen L. Reich, Program Director, Associate in Research Janet L. Davis, Deputy Program Director, Associate in Research
Braden Sneath, Research Assistant
Final Report
July 2012
ii
Disclaimer
The contents of this report reflect the views of the authors, who are responsible for the facts
and the accuracy of the information presented herein. This document is disseminated under
the sponsorship of the Florida Metropolitan Planning Organization Advisory Council, which
assumes no liability for the contents or use thereof.

iii
Technical Report Documentation 1. Report No.
2. Government Accession No.
3. Recipient's Catalog No.
4. Title and Subtitle
Florida MPOAC Transportation Revenue Study
5. Report Date
July 2012
6. Performing Organization Code
7. Author(s)
Stephen L. Reich, Janet L. Davis, Braden Sneath
8. Performing Organization Report No.
9. Performing Organization Name and Address
Center for Urban Transportation Research University of South Florida 4202 East Fowler Avenue, CUT100 Tampa, FL 33620-5375
10. Work Unit No. (TRAIS)
11. Contract or Grant No.
FDOT BD DTRT07-G-0059
12. Sponsoring Agency Name and Address
Florida Metropolitan Planning Organization Advisory Council 605 Suwannee Street, MS 28B Tallahassee, FL 32399-0450
13. Type of Report and Period Covered
14. Sponsoring Agency Code
15. Supplementary Notes
16. Abstract
The report documents a 24-month effort by the 26 Metropolitan Planning Organizations in Florida to analyze and document the key funding issues for transportation in the state, identify potential sustainable funding sources, and formulate legislative remedies to funding deficiencies.
17. Key Words
Florida, Transportation, Funding
18. Distribution Statement
19. Security Classification (of this report)
Unclassified
20. Security Classification (of this page)
Unclassified
21. No. of Pages
143
22. Price

iv
Metric Conversion
SYMBOL WHEN YOU KNOW MULTIPLY BY TO FIND SYMBOL
LENGTH
in inches 25.4 millimeters mm
ft feet 0.305 meters m
yd yards 0.914 meters m
mi miles 1.61 kilometers km
VOLUME
fl oz fluid ounces 29.57 milliliters mL
gal gallons 3.785 liters L
ft3 cubic feet 0.028 cubic meters m3
yd3 cubic yards 0.765 cubic meters m3
NOTE: volumes greater than 1000 L shall be shown in m3
MASS
oz ounces 28.35 grams g
lb pounds 0.454 kilograms kg
T short tons
(2000 lb) 0.907
megagrams
(or "metric ton")
Mg (or "t")
TEMPERATURE (exact degrees)
oF Fahrenheit 5 (F-32)/9
or (F-32)/1.8 Celsius oC

v
Acknowledgments
The USF Center for Urban Transportation Research would like to acknowledge the following
individuals and organizations for their input, guidance, and efforts:
Mr. Howard Glassman, Executive Director, Florida Metropolitian Planning Oganization
Advisory Council (MPOAC)
Mayor Richard J. Kaplan, Lauderhill, Florida; Chair, Governing Board MPOAC;
Member Revenue Study Advisory Committee
Mr. Michael Howe, Executive Director, Sarasota/ Manatee Metropolitian Planning
Organization (MPO); Chairman, Transportation Revenue Study Advisory Committee
Deputy Mayor Susan Haynie, Boca Raton, Florida; Vice-Chair, Governing Board
MPOAC
Mr. T. J. Fish, Executive Director, Lake-Sumter MPO; Chairman, MPOAC Staff
Directors’ Advisory Committee
Ms. Mary Robinson, Staff Director, Bay County TPO, Florida-Alabama TPO, Okaloosa-
Walton TPO, West Florida RPC; Vice-Chairman, MPOAC Staff Directors’ Advisory
Committee
Mr. Jeff Kramer, Senior Research Associate, USF Center for Urban Transportation
Research (CUTR)
Mr. Wayne Malaney, Esq.
Ms. Rebecca Bosco, Program Assistant, CUTR
Special thanks to the members of the MPOAC Revenue Study Advisory Committee:
Ms. Lisa Bacot, Executive Director, Florida Public Transportation Association
Ms. Carrie Blanchard, Director of Research and Public Policy, Florida Chamber of
Commerce
Ms. Janet E. Bowman, Director of Legislative Policy & Strategies, Nature Conservancy
of Florida
Mr. Bob Burleson, Executive Director, Florida Transportation Builders’ Association
Mr. Casey Cook, Legislative Associate, Florida League of Cities
Mr. Tom DiGiacomo, Executive Director, Florida Transportation Commission
Ms. Susan Hann, American Public Works Association, Florida Chapter
Mr. Bill Johnson, Executive Director, Florida Airports Council
Mr. Eric Poole, Assistant Legislative Director, Florida Association of Counties
Ms. Mary Lou Rajchel, Chief Executive Officer, Florida Trucking Association
Mr. Michael Rubin, Vice President, Florida Ports Council
Mr. Matthew D. Ubben, President, Floridians for Better Transportation
Ms Sheri Coven, Director of Intergovernmental Affairs, Florida Regional Councils
Association

vi

vii
Table of Contents
Executive Summary ................................................................................................. xi
I. Introduction ......................................................................................................... 1
II. Federal Funding for Transportation ......................................................................... 3
Fuel Efficiency ............................................................................................... 5
National Funding Studies ................................................................................. 7
III. State Transportation Funding – Florida ................................................................ 11
State Tax Sources for State Use ..................................................................... 11
Transportation Revenues Used for Non-Transportation Purposes ......................... 14
Constitutional/Statutory Diversions ................................................................. 14
Highway and Transit Needs in Florida .............................................................. 16
Local Sources of Transportation Revenue ......................................................... 18
IV. Revenue Options Recommended for Legislative Action ........................................... 23
Allow up to 1-cent local option sales surtax ...................................................... 23
Increase local diesel fuel tax by 5 cents. .......................................................... 25
Index all state and local fuel taxes not currently indexed. .................................. 28
Increase 2-cent state motor fuel tax annually for 5 years (10 cents), indexed for inflation ...................................................................................................... 33
Return Motor Vehicle License Fee, Initial Vehicle Registration Fee, and Titling Fee increases to the STTF. .................................................................................. 36
Conduct a VMT study .................................................................................... 42
V. Other Revenue Options for Consideration .............................................................. 51
Impose a 6% state sales tax in lieu of both state fuel taxes, with a “floor” ........... 51
Create an independent State Toll Rate-Setting Commission to study, evaluate, and establish toll rates for State-owned toll facilities ............................................... 55
Create and fund Regional Transportation Financing Authorities ........................... 58
Institute a sales tax on motor vehicle parts and services .................................... 70
Shift sales tax on battery-electric vehicles to the STTF ...................................... 72
Implement a $10 county vehicle registration fee ............................................... 73
Expand the current alternative fuel decal program ............................................ 75
Invest $100 million of incremental revenue in new toll projects .......................... 77

viii
VI. Legislative Proposals – Draft Bill Language ........................................................... 81
LOCAL OPTION MUNICIPAL SALES TAX SURCHARGE ......................................... 82
INCREASE LOCAL OPTION DIESEL TAX FIVE CENTS PER GALLON ........................ 88
INDEX CONSTITUTIONAL, COUNTY, MUNICIPAL, 9TH CENT, AND LOCAL OPTION MOTOR FUEL AND DIESEL TAXES ................................................................... 91
INCREASE FUEL SALES TAX RATE 2 CENTS PER YEAR FOR 5 YEARS .................... 98
TRANSFER FEES AND SURCHARGES TO STTF FROM GR FUND ........................... 104
CONDUCT A VEHICLE MILES TRAVELED STUDY ............................................... 119
References ........................................................................................................... 123
ix
List of Figures
Figure 1. U.S. Transportation Investment by Sector ...................................................... 4
Figure 2. U.S. Highway Vehicle Miles Traveled, 1990–2010 ............................................ 5
Figure 3. Corporate Average Fuel Efficiency Standards – Light-Duty Vehicles, 1980–2016 . 7
Figure 4. Florida STTF Shares, FY 2010/11 ................................................................ 13
Figure 5. Variables Affecting Florida’s STTF Purchasing Power FY 1999/00 to FY 2019/20 . 14
Figure 6. Transportation Funds Used for Other Purposes .............................................. 16
Figure 7. Florida Metropolitan Area Transportation Shortfall Estimates ........................... 17
Figure 8. STTF Lost Purchasing Power FY 1999/00 to FY 2019/20 .................................. 18
Figure 9. Estimated Local Revenue Yields – Municipal Option Sales Tax .......................... 25
Figure 10. Estimated Local Revenue Yield – 5-Cent Local Diesel Tax Increase ................. 28
Figure 11. Estimated Revenue Yields from Indexing Local Option Fuel Taxes ................... 32
Figure 12. Estimated Revenue Yields from Indexing State Fuel Taxes for Local Use ......... 33
Figure 13. Estimated STTF Revenue Yields for Fuel Tax Increase – 2 Cents per Year for 5
Years ..................................................................................................... 36
Figure 14. Estimated STTF Revenue Yield – Return of Fees from General Revenue Fund ... 42
Figure 15. Florida Vehicle Miles and Inflation Projections .............................................. 44
Figure 16. Growth Rates of Tolls, Fuel Taxes, and Fees ................................................ 47
Figure 17. REC Projections – Percent Change VMT, Fuel Efficiency, and Motor Fuel Use ... 48
Figure 18. Fuel Cost and Inflation Comparison............................................................ 52
Figure 19. Estimated STTF Revenue Yield – Replace Existing Fuel Tax Rates with 6% Sales
Tax ....................................................................................................... 54
Figure 20. Pay–Go, Debt Financing, and Revolving Loan Program Comparison ............... 70
Figure 21. Estimated Revenue Impact – Shift Sales Tax on Selected Motor Vehicle Parts
and Services to STTF ............................................................................... 72
Figure 22. Estimated Local Revenue Yield – $10 Registration Fee Imposition ................. 75
Figure 23. Estimated STTF Revenue Impacts – Expand Alternative Fuel Decal Program ... 77
Figure 24. Florida Toll Collections Expressed in Motor Fuel Cents per Gallon Equivalents .. 78

x
List of Tables
Table 1. Overview of Federal Highway User Fees .......................................................... 3
Table 2. Transportation Funds Used for Non-Transportation Purposes ($ millions) ........... 15
Table 3. Transportation Taxes and Fees – Inflation Effects ........................................... 20
Table 4. MPOAC Revenue Study Selected Options ....................................................... 21
Table 5. Local Use Fuel Taxes and Inflation ................................................................ 30
Table 6. Florida Vehicle Fee Charges ......................................................................... 38
Table 7. Distribution of Revenues from 2009 Motor Vehicle Fee Increases ...................... 39
Table 8. Estimated VMT Rate in Lieu of Existing Revenue Sources ................................. 49
Table 9. Florida Toll Rates per Mile ........................................................................... 55
Table 10. Economic Impact Estimates per $1 billion of Highway Investment ................. 61
Table 11. State Bond Debt Outstanding and Competing Uses ....................................... 65
Table 12. Florida Debt Service as a Percentage of State Revenues ................................ 67

xi
Executive Summary
This report documents an effort led by Florida’s Metropolitan Planning Organizations (MPOs)
to assess transportation funding in Florida and to develop a series of legislative
recommendations. The effort spanned almost two years, culminating in the drafting of
legislation on six initiatives to address Florida’s transportation funding situation.
The Florida Metropolitan Planning Organization Advisory Council (MPOAC) is a statewide
transportation planning and policy organization created by the Florida legislature pursuant
to Section 339.175(11), Florida Statutes, to augment the role of individual MPOs in the
cooperative transportation planning process. The MPOAC assists MPOs in carrying out the
urbanized area transportation planning process by serving as the principal forum for
collective policy discussion.1
For several years, the MPOAC has been concerned with the level of funding for
transportation investments in Florida and embarked on legislative initiatives in 2008 and
2009 to have the issue addressed by a “blue ribbon” commission. These bills, while
sponsored by legislators, found little traction due, in part, to the political unwillingness to
propose additional public funding. In 2010, the organization took action to pursue an in-
depth examination of the state of transportation revenues with an eye towards
recommendations in the form of legislative actions. The Center for Urban Transportation
Research (CUTR) at the University of South Florida was engaged by the MPOAC after its
governing board decided to pool funds from each of the organizations to finance the effort.
Mr. Howard Glassman, Executive Director of the MPOAC, acted as the Project Manager.
A Revenue Study Advisory Committee was established that included the Florida Airports
Council, Florida Transportation Builders’ Association, Florida Chamber of Commerce, Florida
League of Cities, Floridians for Better Transportation, Florida Association of Counties, The
Nature Conservancy in Florida, Florida Trucking Association, Florida Ports Council, MPOAC
Governing Board, Florida Transportation Commission, American Public Works Association
(Florida Chapter), Florida Public Transportation Association, and Florida Regional Councils
Association. Mr. Michael Howe, Executive Director of the Sarasota-Manatee MPO, served as
the chair of the stakeholder group. The Committee deliberated at several key points in the
process before issues or recommendations were passed along to the MPO staff directors and
then to the MPOAC Governing Board. The Governing Board comprises an elected official
from each of Florida’s 26 MPOs.
1 http://www.mpoac.org/about/index.shtml

xii
A study process was developed along with a project schedule, as shown below. Briefings
and updates to the Study Advisory Committee, MPOAC Directors, and the MPOAC Governing
Board were provided separately on a quarterly basis during the conduct of the study. After
a “situational analysis” was performed, a white paper on recent funding trends, pressures
on funding sources, and estimations of Florida’s surface transportation needs was
developed. The paper can be accessed at http://www.mpoac.org/revenuestudy/
Situational_Analysis.pdf. The results of this phase of the study documented the stresses
being placed on the Federal Highway Trust Fund (HTF) and Florida’s State Transportation
Trust Fund (STTF).
According to the Florida Department of Transportation (FDOT), as of May 2011, the major
funding sources for the five-year work program were made up of:
State sources – 49 percent
Federal sources – 34 percent
Turnpike and tolls – 8 percent
Local and other funds – 5 percent
Right-of-way and state infrastructure bank bonds – 4 percent
Federal Surface Transportation Funding – 34 Percent of State Total in Florida
Over 90 percent of the revenues available for federal surface transportation funding comes
from the taxes on gasoline (18.4 cents per gallon) and diesel fuel (24.4 cents per gallon).
MPOAC SelectsEconomic Analysis
RSAC Recommends
Matrix of Options
Revenue Forecasts
MPOAC Revenue Study Process
Collect Needs Data
Analyze Trends White PaperFrame Current
Condition
Assess Stability/ Barriers
Inventory State Sources
New Sources i.e., VMT
“Laundry List”MPOAC Narrows Options
Project Revenue
Draft LegislationPrepare Report/
Presentations
MPOAC Review/ Approve
Final Report Publication
Presentations/ Education

xiii
These rates have not been adjusted since 1997.2 With heavy reliance of the HTF on these
sources, federal transportation receipts are driven by vehicle miles traveled (VMT) and
vehicle fleet efficiency, as both of these determine fuel use. The fact that the tax is
assessed on a per-gallon basis and is not automatically adjusted for inflation results in an
erosion of the buying power of the HTF as well.
Vehicle Miles Traveled The current recession has resulted in absolute decline in VMT for the first time in decades.
Increased fuel prices and high employment continue to keep the growth modest. Post-
recession, many planners do not expect a return to the
growth of the 1980s and 1990s, as the economic
recovery is predicted to be slow and the country has
reached a point of saturation for some factors that
drove annual VMT growth rates. The number of
vehicles registered already exceeds the number of
eligible drivers, and a stable work week has emerged
without appreciable additional free time to add to
leisure travel demand. The Federal Highway
Administration (FHWA) has been predicting modest
rates of growth for passenger vehicles, although truck
traffic growth rates are also estimated to increase.
Efficiency
The Corporate Average Fuel Efficiency (CAFE)
standards for passenger cars has remained at 27.5
miles per gallon (mpg) since 1985 and for light trucks
has risen modestly from 19.5 mpg to 23.1 mpg for the
same period. In 2010, both the Environmental Protection Agency (EPA) and the U.S.
Department of Transportation (DOT), through the National Highway Transportation Safety
Administration (NHTSA), published final rules affecting the light-duty vehicle and medium-
duty passenger vehicle (passenger vehicles from 8,500 to 10,000 pounds Gross Vehicle
Weight Rating) fleet efficiency.
Expressed in grams per mile, the new standards for greenhouse gases (GHG) will differ by a
vehicle’s size or “footprint” and are in place for the model year 2012 vehicle production run.
The new GHG standards average a CO2 emission rate of 250 grams per mile by model year
2016, with an estimated mpg equivalent of 35.5 for the combination of light-duty trucks and
passenger autos. Rules that would apply to 2017 and beyond are currently being formulated
2 In 1993, the Omnibus Budget Reconciliation Act increased the gas tax by 4.3 cents to 18.4 cents to reduce the federal deficit. The taxed decreased to 18.3 cents in 1996 due to the expiration of a 1/10
set-aside for leaking underground storage tanks. In 1997, the 1/10 set-aside was restored, with all of the 4.3 cents going to the Highway Trust Fund.
The effects of the
impacts of
VMT stagnation,
increased fleet fuel
efficiency, inflationary
pressures, and
authorization levels
have led to a precarious
situation for the federal
Highway Trust Fund.
xiv
and will include a similar approach for heavy-duty vehicles. Less fuel on a per-mile basis
will be consumed, resulting in fewer dollars per mile traveled going to the HTF.
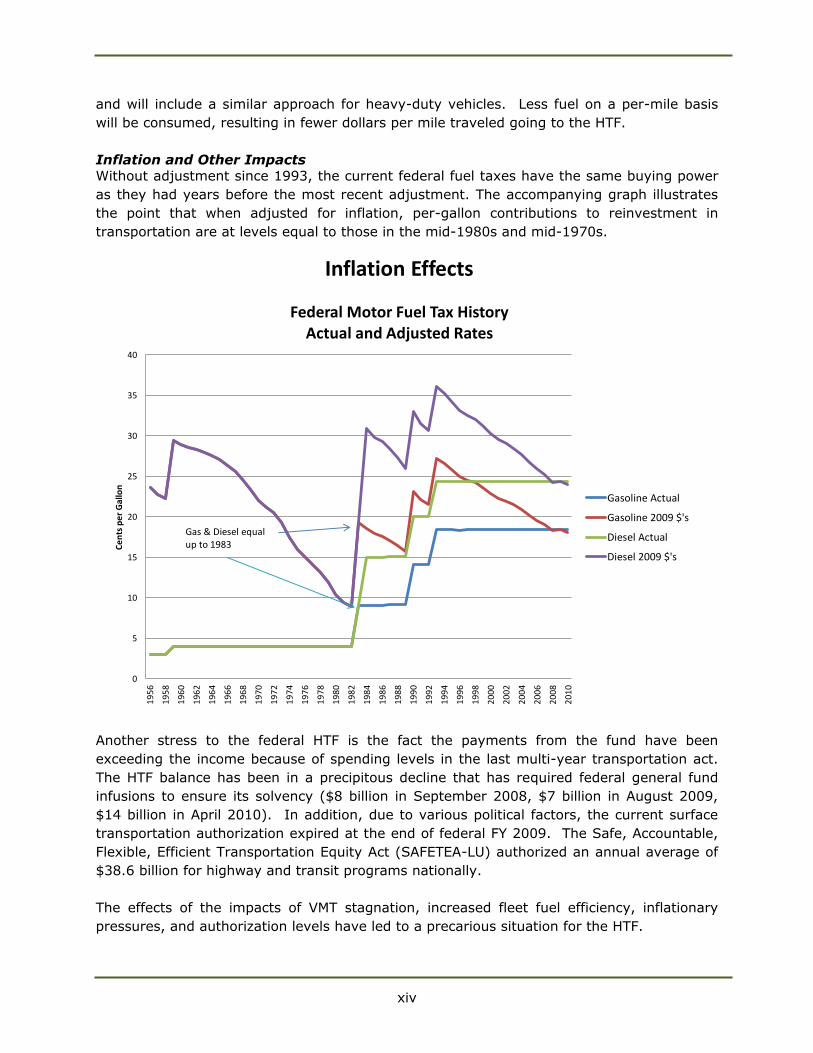
Inflation and Other Impacts Without adjustment since 1993, the current federal fuel taxes have the same buying power
as they had years before the most recent adjustment. The accompanying graph illustrates
the point that when adjusted for inflation, per-gallon contributions to reinvestment in
transportation are at levels equal to those in the mid-1980s and mid-1970s.
Another stress to the federal HTF is the fact the payments from the fund have been
exceeding the income because of spending levels in the last multi-year transportation act.
The HTF balance has been in a precipitous decline that has required federal general fund
infusions to ensure its solvency ($8 billion in September 2008, $7 billion in August 2009,
$14 billion in April 2010). In addition, due to various political factors, the current surface
transportation authorization expired at the end of federal FY 2009. The Safe, Accountable,
Flexible, Efficient Transportation Equity Act (SAFETEA-LU) authorized an annual average of
$38.6 billion for highway and transit programs nationally.
The effects of the impacts of VMT stagnation, increased fleet fuel efficiency, inflationary
pressures, and authorization levels have led to a precarious situation for the HTF.
0
5
10
15
20
25
30
35
40
19
56
19
58
19
60
19
62
19
64
19
66
19
68
19
70
19
72
19
74
19
76
19
78
19
80
19
82
19
84
19
86
19
88
19
90
19
92
19
94
19
96
19
98
20
00
20
02
20
04
20
06
20
08
20
10
Ce
nts
pe
r G
allo
n
Federal Motor Fuel Tax History Actual and Adjusted Rates
Gasoline Actual
Gasoline 2009 $'s
Diesel Actual
Diesel 2009 $'s
Gas & Diesel equalup to 1983
Inflation Effects

xv
State Transportation Funding – 48 Percent of State Total in Florida
In Florida, STTF receipts from fuel taxes make up 68 percent of the revenue portfolio; they
are indexed to offset the impacts of inflation each January. Based on movement in the
Consumer Price Index (CPI), Florida’s Highway Fuel Sales Tax (currently at 12.6 cents per
gallon) and the State Comprehensive Enhanced Transportation System (SCETS) Tax
(currently at 6.9 cents per gallon) are adjusted annually. The other major sources are not
adjusted annually, however, and their buying power diminishes over time.
The heavy reliance on a “cents per gallon” fuel tax is resulting in pressures on the STTF and
reductions in projected revenue because of an increasingly fuel-efficient vehicle fleet. While
vehicle miles traveled (VMT) are currently down, official projections for the post-recession
period are for a return to steady growth in Florida. This will result in VMT growing 82
percent for the period FY1999/00 to FY2019/20, while fuel tax revenues grow at an anemic
8 percent for the same period.
Although the study sponsors did not want to spend time on a new calculation of
transportation needs, CUTR researchers looked back at unfunded needs that had been
calculated in the Long Range Transportation Plans (LRTPs) for Florida’s metropolitan areas.
When the totals for these unfunded needs are converted to inflation-adjusted 2010 dollars,
the statewide metropolitan unfunded need is estimated at more than $3 billion annually.
Another approach was used by CUTR to provide context to the MPOAC without recalculating
a needs figure that would be not be realistic to fund and could be considered suspect. An
examination of investment levels was performed that looked at state transportation
33%
82%
25%
69%
57%
7% 8%
0%
10%
20%
30%
40%
50%
60%
70%
80%
90%
99/00 01/02 03/04 05/06 07/08 09/10 11/12 13/14 15/16 17/18 19/20
Pe
rce
nt
Incr
ea
se
Vehicle Miles Traveled (VMT)
Fuel Efficiency (CAFE Adjusted)
Inflation (CPI)
Highway Fuel Use (CAFE Adjusted)
State Transportation Trust Fund Pressures
xvi
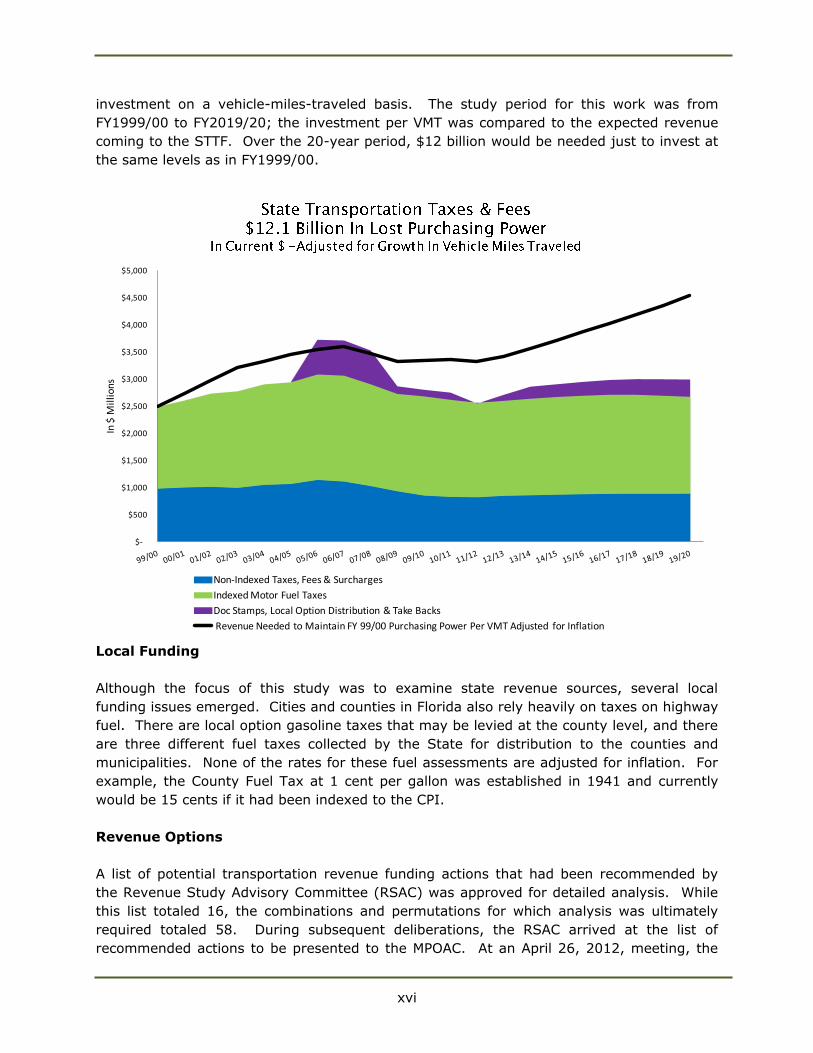
investment on a vehicle-miles-traveled basis. The study period for this work was from
FY1999/00 to FY2019/20; the investment per VMT was compared to the expected revenue
coming to the STTF. Over the 20-year period, $12 billion would be needed just to invest at
the same levels as in FY1999/00.
Local Funding
Although the focus of this study was to examine state revenue sources, several local
funding issues emerged. Cities and counties in Florida also rely heavily on taxes on highway
fuel. There are local option gasoline taxes that may be levied at the county level, and there
are three different fuel taxes collected by the State for distribution to the counties and
municipalities. None of the rates for these fuel assessments are adjusted for inflation. For
example, the County Fuel Tax at 1 cent per gallon was established in 1941 and currently
would be 15 cents if it had been indexed to the CPI.
Revenue Options
A list of potential transportation revenue funding actions that had been recommended by
the Revenue Study Advisory Committee (RSAC) was approved for detailed analysis. While
this list totaled 16, the combinations and permutations for which analysis was ultimately
required totaled 58. During subsequent deliberations, the RSAC arrived at the list of
recommended actions to be presented to the MPOAC. At an April 26, 2012, meeting, the
$-
$500
$1,000
$1,500
$2,000
$2,500
$3,000
$3,500
$4,000
$4,500
$5,000
In $
Mil
lio
ns
Non-Indexed Taxes, Fees & Surcharges
Indexed Motor Fuel Taxes
Doc Stamps, Local Option Distribution & Take Backs
Revenue Needed to Maintain FY 99/00 Purchasing Power Per VMT Adjusted for Inflation

xvii
MPOAC Staff Directors and Governing Board approved, with one dissenting vote, the
transmission of information to the Florida legislature and governor on the state’s unfunded
transportation needs and the 14 options to reduce the funding shortfall and endorsed the
top 6 revenue options for legislative action to implement those items.
The options for which legislation has been drafted and language included in this report are
described in the following paragraphs.
Allow up to a 1-Cent Municipal Optional Sales Tax Under current Florida statute, Charter Counties and those included in a Regional
Transportation Authority district may elect to impose up to a 1 percent sales tax on items
up to $5,000, with revenues available for transportation uses. This option would extend
that flexibility to cities with a population of 150,000 or more, but could not be duplicative of
any County transportation sales tax. For example, Miami-Dade County voters have
approved a 1/2 percent sales tax. If the City of Miami wanted to put this in place, it would
be limited to an additional 1/2 percent. In counties without a city with a population of
150,000, the option would be available to the largest municipality in that county based on
the latest available census. If fully implemented, it could generate approximately $830
million to cities in total. The legislative proposal would also make this option available to
any non-charter counties that are a part of an MPO.
Increase the Local Diesel Tax by 5-Cents
Local option tax rates are fixed in State law to provide diesel fuel tax rate consistency
among counties for purposes of administering the provisions of the International Fuel Tax
Agreement. The local option diesel tax rate is currently 7 cents per gallon, while the
statewide average for local option gasoline taxes has risen to 9.6 cents per gallon. There
has long been recognition that a higher per-gallon rate on diesel fuel is appropriate, as the
major users of the fuel are heavy trucks. For example, the federal tax is 18.4 cents per
gallon on gasoline and 24.4 cents on diesel fuel because of the differential of the demands
that are placed on the highway system by heavy trucks and light-duty vehicles. This option
would establish an additional 5-cent diesel fuel tax in each county, and the revenues would
be required to be expended on projects that serve or enhance commercial highway traffic.
This dedicated local source of funding could be used to encourage economic development
and improve existing commercial operations. It is estimated this would generate about $72
million per year to Florida’s counties.
Index All Fuel Taxes Not Currently Indexed
There are several different local option taxes levied on a per-gallon basis in addition to the
Constitutional Fuel Tax (2 cents per gallon), County Fuel Tax (1 cent per gallon), and
Municipal Fuel Tax (1 cent per gallon). The Constitutional, County, and Municipal taxes are
collected by the State for distribution to local governments. None of these or the local
option fuel tax is indexed to the CPI. This option would index them on the same basis as
the State Fuel Sales Tax and the SCETS, providing local governments with the same
inflation hedge enjoyed by the STTF and generating approximately $115 million annually for
investment in transportation infrastructure. Some of these user fees have not been
adjusted since the 1940s.

xviii
Implement 2-Cent Fuel Tax Increase per Year –
5 Years (10 Cents) Indexed for Inflation Implementation of this increase would raise the State Highway Fuels Sales Tax from the
current rate of 12.6 cents per gallon by 2 cents per year for the next 5 years, for a total 10-
cent increase. This tax is currently adjusted annually by the CPI, as is the SCETS tax, which
is currently at 6.9 cents per gallon. Additional revenues of approximately $183 million in
2013 growing to $1.17 billion by 2020 are forecasted for the STTF.
Return Motor Vehicle License and Registration and
Titling Fee Increases to the STTF This recommendation would redirect the increases in the fees that were enacted in 2009
from the State General Revenue Fund to the STTF. These fees historically have been
dedicated to the transportation system as a method to further the concept of user fees
supporting the transportation system. After a 20-year hiatus of fee adjustments (30 years
for registration fees), they were raised in 2009, with the incremental revenue being used to
help solve the general budget crisis due to the economic recession. With increasing
pressures on transportation funding sources coupled with growing needs, action was taken
in the 2012 session of the Florida legislature to restore a portion of these traditional STTF
funds. While most title fees will be remitted to the STTF, yielding about $200 million per
year, increases in the Motor Vehicle License Fee and Surcharge and the Initial Registration
Fee are recommended to be returned as well. The annual estimated revenue impact to the
STTF is $413 million
Conduct Vehicle Miles Traveled (VMT) Study This recommendation is to have the legislature commission and fund an extensive effort to
deal with the systemic issues of fuel taxes becoming less sustainable as a primary surrogate
for a transportation user fee. While fuel taxes served as an adequate substitute for a true
user fee for decades, significant increases in mandated vehicle fuel efficiency along with the
introduction of all-electric and plug-in hybrid vehicles are eroding transportation revenues.
It is recognized that there are significant concerns over the concept of charging users of the
highway system based on each mile traveled. These include the privacy of citizens, the cost
of implementing such a system, and institutional issues associated with revenue sharing.
This effort is intended to address these issues at a minimum, deploy a demonstration of the
concept, and develop a business plan and implementation roadmap to move Florida to a
VMT-based system.3
3 Board Meeting action on July 16, 2012 precluded the use of GPS technology in the tracking of VMT

1
I. Introduction
Planners and providers of transportation infrastructure and services have generally seen an
erosion of revenue and its “buying power” over at least the last decade. Stagnant or
declining traditional funding sources, increases in construction and fuel costs, and the
current recession are all among the factors placing increasing pressure on transportation
providers. These dynamics, when coupled with the lack of political willingness to adjust
traditional fuel taxes and fees, are causing dramatic reductions in capital investments and,
in some metropolitan areas, rollbacks in public transportation services.
For some time, Florida’s Metropolitan Planning Organization Advisory Council (MPOAC) has
been concerned with this issue and has, over the last several years, encouraged a
legislatively-sponsored effort to analyze the issue with an aim towards recommendations for
a path forward for adequate transportation funding in the state. Although the Florida
legislature took action to adjust some selected fees that provide funding to the State
Transportation Trust Fund (STTF), the MPOAC remains committed to trying to identify
sustainable solutions to the transportation funding dilemma.
The MPOAC requested that the Center for Urban Transportation Research (CUTR) at the
University of South Florida provide an analysis and staff assistance to help to develop a
series of revenue options.
Current Situation
Most urban and interregional highway corridors are expected to be heavily-congested during
peak periods by 2025, even after planned improvements are made. Many of the state’s
airports are projected to be operating at more than 80 percent of capacity, the point at
which expanded capacity should be under construction. Florida’s seaports must improve
waterside, terminal, and landside infrastructure to handle expected rapid growth in freight
and cruise passenger activity. Additionally, significantly more capacity is needed in rail and
urban transit systems to provide viable options for moving people and freight within and
between urban areas.
In recent years, the economic recession has taken a toll on revenues accruing to the STTF.
These revenue reductions, coupled with legislative actions to divert transportation revenues
to non-transportation purposes, have resulted in significant reductions to project
commitments in the Florida Department of Transportation (FDOT) five-year work program
(approximately $10 billion since 2006). Additionally, a significant share (approximately
33%) of Florida’s transportation revenues is automatically adjusted for inflation. However,
most transportation revenue sources (such as federal fuel taxes, local option fuel taxes,
motor vehicle license taxes/fees, and the documentary tax) are set at rates established in
law, and, therefore, lose buying power annually. While inflation results in increases in
certain FDOT revenues, it also causes costs to rise. If the costs of FDOT’s programs rise
proportionately to the rate of inflation, then FDOT will be losing ground, since not all
revenues are responsive to inflation. The combination of these issues disrupts the stability

2
of the five-year work program and hinders the ability to address significant transportation
backlog and meet future transportation needs.
Current revenue sources are not sufficient to fund long-term transportation needs. Potential
uncertainties in the long term could dramatically alter transportation revenues and, thus,
require structural changes in Florida’s overall revenue approach. These uncertainties include
the impact of:
a growing market for more fuel-efficient cars (hybrids, compressed natural gas,
electric, etc.)
significant price increases for fuel
the current lack of certainty of the federal role in transportation funding
public reluctance to accept additional user fees
national emphasis on alternative fuels and technologies
shifts in demographics that will impact revenues and the demand for transportation
services
changing public attitudes towards environmental sustainability
The policy issue that needs to be addressed in the long term is the need to evaluate
Florida’s future transportation revenue collection system and whether the basis for this
system should be supplemented or fundamentally changed.

3
II. Federal Funding for Transportation
Federal funding for transportation is derived from highway excise taxes on motor fuel and
truck-related taxes on truck tires, sales of trucks and trailers, and heavy vehicle use. Tax
revenues are deposited into either the Highway Account or the Mass Transit Account of the
Federal Highway Trust Fund (HTF) and then distributed to the states. The Federal Highway
Administration (FHWA) and the Federal Transit Administration (FTA) then distribute funds
from the Highway Account and the Mass Transit Account, respectively, to each state through
a system of formula grants and discretionary allocations. Revenues from the tax on
highway fuels represent 90 percent of the receipts that accrue to the HTF. Table 1 provides
further detail on tax rates and the account distribution of these tax revenues.
Table 1. Overview of Federal Highway User Fees
The federal role in the nation’s transportation infrastructure is very significant. According to
the Congressional Budget Office, federal investment in transportation infrastructure
(measured in constant dollars) peaked in 2003 and has declined or remained level year to
year since then. Federal funding for the nation’s highways represents 45 percent of all
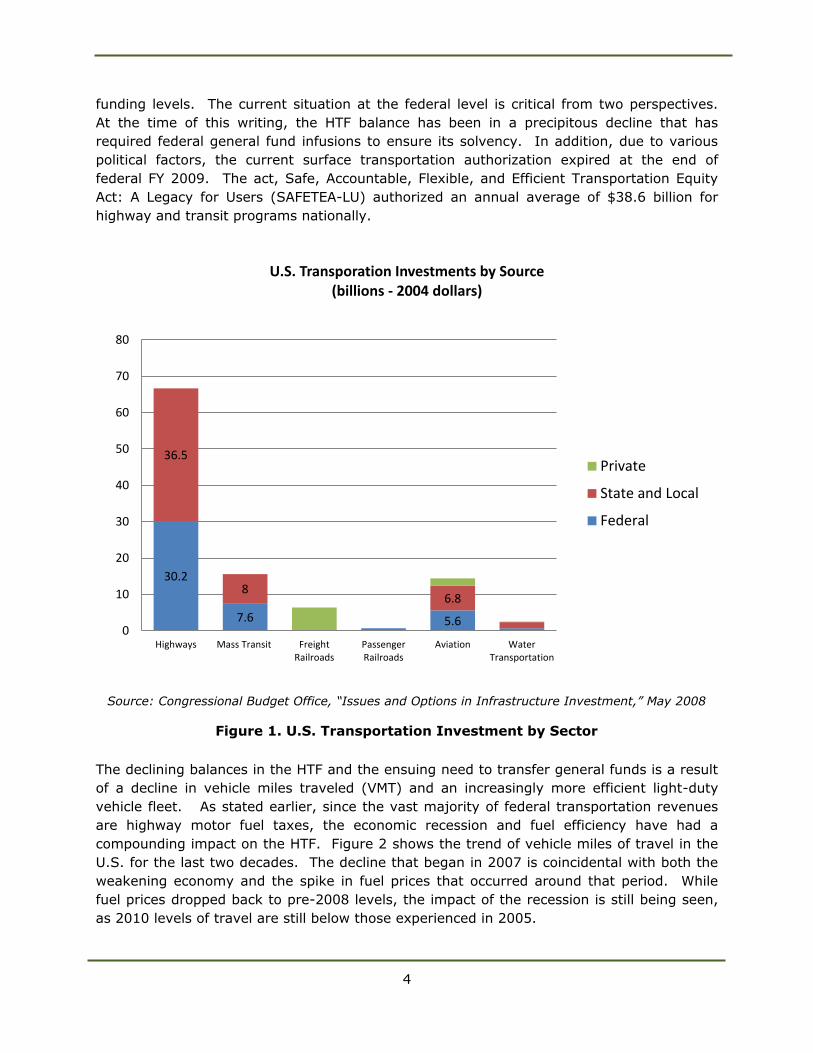
investment and is 49 percent for mass transit (Figure 1).The significance of these federal
funding ratios becomes more apparent as the health of the HTF is examined. The federal
surface transportation programs are funded through multi-year authorizations that are
subject to annual limitations through obligational limitations (in the case of highway
programs) and appropriations, even though the multi-year legislation establishes annual
Tax Rate
(Cents Highway Mass Underground
per Account Transit Storage Tanks General
User Fee Gallon) Fund Fund TF Fund
Gasoline 18.4 15.44 2.86 0.1 –
Diesel & Kerosene Fuel 24.4 21.44 2.86 0.1 –
Liquefied Petroleum Gas 18.3 16.17 2.13 – –
Liquefied Natural Gas 24.3 22.44 1.86 – –
Other Special Fuels 18.4 15.44 2.86 0.1 –
Compressed Natural Gas 18.3 15.43 2.86 – –
Distribution of Tax (Cents per Gallon)
Source: FHWA Office of Highway Policy Information, Highway Statistics 2007, Table FE‑21B, June 2009
Tires: (Proceeds to Highway Account)
Tax is imposed on tires sold by manufacturers, producers, or importers at the rate of $.0945 ($.04725 in the
case of a bias ply or super single tire) for each 10 pounds of the maximum rated load capacity over 3,500
pounds.
Truck and Trailer Sales: (Proceeds to Highway Account)
12 percent of retailer's sales price for tractors and trucks over 33,000 pounds gross vehicle weight (GVW) and
trailers over 26,000 pounds GVW. The tax applies to parts and accessories sold in connection with the vehicle
sale.
Heavy Vehicle Use: (Proceeds to Highway Account)
Annual tax: Trucks 55,000-75,000 pounds GVW, $100 plus $22 for each 1,000 pounds (or fraction thereof) in
excess of 55,000 pounds Trucks over 75,000 pounds; GVW, $550.
4
funding levels. The current situation at the federal level is critical from two perspectives.
At the time of this writing, the HTF balance has been in a precipitous decline that has
required federal general fund infusions to ensure its solvency. In addition, due to various
political factors, the current surface transportation authorization expired at the end of
federal FY 2009. The act, Safe, Accountable, Flexible, and Efficient Transportation Equity
Act: A Legacy for Users (SAFETEA-LU) authorized an annual average of $38.6 billion for
highway and transit programs nationally.
The declining balances in the HTF and the ensuing need to transfer general funds is a result
of a decline in vehicle miles traveled (VMT) and an increasingly more efficient light-duty
vehicle fleet. As stated earlier, since the vast majority of federal transportation revenues
are highway motor fuel taxes, the economic recession and fuel efficiency have had a
compounding impact on the HTF. Figure 2 shows the trend of vehicle miles of travel in the
U.S. for the last two decades. The decline that began in 2007 is coincidental with both the
weakening economy and the spike in fuel prices that occurred around that period. While
fuel prices dropped back to pre-2008 levels, the impact of the recession is still being seen,
as 2010 levels of travel are still below those experienced in 2005.
30.2
7.6 5.6
36.5
8 6.8
0
10
20
30
40
50
60
70
80
Highways Mass Transit FreightRailroads
PassengerRailroads
Aviation WaterTransportation
U.S. Transporation Investments by Source (billions - 2004 dollars)
Private
State and Local
Federal
Source: Congressional Budget Office, “Issues and Options in Infrastructure Investment,” May 2008
Figure 1. U.S. Transportation Investment by Sector

5
Source: U.S. Department of Transportation, Federal Highway Administration, Traffic Trends
Figure 2. U.S. Highway Vehicle Miles Traveled, 1990–2010
Fuel Efficiency
Concerns over emissions related to the burning of fossil fuels and their impact on the
generation of greenhouse gases (GHG), along with concerns over U.S. energy security, have
led to recent efforts to increase the efficiency of the transportation fleet. Again, given the
reliance on fuel taxes as the major federal transportation revenue source, the issue has
financing implications.
In 2008, the transportation sector in the U.S. consumed 28 percent of all of the energy used
nationally. Of that use, 84 percent of the energy to move passengers and goods was in the
form of gasoline and diesel, with the remainder comprising aviation jet fuel, natural gas,
and other alternative fuels. The portion of U.S. petroleum consumption used by
transportation had been growing over time as electric utilities and the industrial sector have
shifted from petroleum to other sources. These sources continue to overwhelmingly come
from fossil fuels, but the transportation sector is, by far, the leader in the consumption of
petroleum.
Fuel efficiency standards were established more than 30 years ago in the wake of the
petroleum crises of the 1970s. Corporate Average Fuel Efficiency (CAFE) standards were
1,500,000
1,700,000
1,900,000
2,100,000
2,300,000
2,500,000
2,700,000
2,900,000
3,100,000
3,300,000
19
90
19
91
19
92
19
93
19
94
19
95
19
96
19
97
19
98
19
99
20
00
20
01
20
02
20
03
20
04
20
05
20
06
20
07
20
08
20
09
20
10
VM
T -
Bill
ion
s U.S. Vehicle Miles Traveled

6
introduced in 1975 and have remained relatively unchanged for the last 25 years. The
standard for passenger cars has remained at 27.5 miles per gallon (mpg) since 1985, and
for light trucks it has risen modestly, from 19.5 mpg to 23.1 mpg for the same period.
In 2010, both the Environmental Protection Agency (EPA) and the U.S. Department of
Transportation (DOT) through the National Highway Transportation Safety Administration
(NHTSA) published final rules affecting the light-duty vehicle and medium-duty passenger
vehicle (passenger vehicles from 8,500 to 10,000 pounds Gross Vehicle Weight Rating
[GVWR]) fleet efficiency. The EPA, under its authority, has published GHG standards for
autos and light trucks, and NHTSA has issued complementary new CAFE standards.
Expressed in grams per mile, the new standards for GHGs will differ by a vehicle’s size or
“footprint” and are to be in place for the model year 2012 vehicle production run. The new
GHG standards average a CO2 emission rate of 250 grams per mile by model year 2016,
with an estimated mpg equivalent of 35.5 for the combination of light-duty trucks and
passenger autos. Rules that would apply to 2017 and beyond are currently being
formulated and will include a similar approach for heavy-duty vehicles, likely impacting
urban transit fleets.
Although in the early stages, comments are now being sought as input to the rules
proposal. Figure 3 shows the dramatic change that will occur as these new standards are
put in place, further effecting fuel tax collection rates.
The actual fuel efficiency of the fleet has historically been from 3 to 5 mpg lower than the
CAFE standards due to actual field conditions, vehicle maintenance issues, and the time it
takes for vehicle replacement to occur in the fleet. The current recession has had an
obvious impact on new light-duty vehicle sales, and the average age of the U.S. light-duty
fleet has increased from 8.4 years in 1995 to 10.2 years in 2009, according to the U.S.
Department of Energy’s Transportation Energy Book (July 2010). Some of this increase can
be attributed to increased useful life because of technological advances and because of
more multi-vehicle households. Review of sales trends indicates that as the economy
recovers, the vehicle replacement rate will increase with the new, more efficient
automobiles and light trucks. This could accelerate the vehicle efficiency impacts on motor
fuel tax revenues.
Emerging technologies such as plug-in hybrid electric vehicles, all-electric vehicles, and
alternatively-fueled vehicles are expected to contribute positively to the environmental and
energy security concerns of the nation but will also continue to erode the motor fuel tax as
it is currently administered as a viable long-term major funding mechanism. The situation
presented here must also be coupled with the fact that the current fuel tax at the federal
level is not adjusted for inflation and has not been adjusted since October 1993.
Like the STTF, the HTF has had its share of “raids.” Portions of both the federal gasoline
and diesel taxes were diverted to reduce the general fund deficit in 1990, 1993, 1995, and
1996.

7
Source: U.S, Department of Energy, Energy Data Book
Figure 3. Corporate Average Fuel Efficiency Standards –
Light-Duty Vehicles, 1980–2016
National Funding Studies
During the course of this work for the MPOAC, several high-profile efforts were conducted at
the national level. Among them, the following were reviewed in depth and their
recommendations shared with the RSAC and MPOAC:
“Report of the National Surface Transportation Policy and Revenue Study
Commission: Transportation for Tomorrow,” January 2008
Congress established the National Surface Transportation Policy and Revenue Study
Commission to thoroughly review the nation’s assets, policies, programs, and
revenue mechanisms and prepare a “conceptual plan” that would integrate all of the
elements and outline a vision for long-term transportation that would benefit the
nations and its citizens.
“National Surface Transportation Infrastructure Financing Commission (NSTIFC) Report” The United States Congress recognized the dangers of inattention and delay and
requested assistance in reviewing the way the federal government funds and
0.0
5.0
10.0
15.0
20.0
25.0
30.0
35.0
40.0
45.0
Mile
s p
er
Gal
lon
Corporate Average Fuel Efficiency Standards 1980 - 2016
Passenger Cars
Light Trucks

8
finances national surface transportation infrastructure. Congress established the
NSTIFC to embark on an investigative and analytical effort to assess the funding
crisis and make recommendations to address the growing transportation
infrastructure investment deficit. The Commission focused its work on highway and
transit infrastructure.
“Bipartisan Policy Center Report—Performance Driven: A New Vision for U.S.
Transportation Policy”
Under the National Transportation Policy Project (NTTP), the Bipartisan Policy Center
published a report in July 2009 summarizing findings of a conference on
performance-based federal surface transportation policy.
“Infrastructure 2010: Investment Imperative,” Urban Land Institute (ULI)
Since 2007, ULI has issued an annual report focused on the state of America’s
infrastructure systems—transportation, water, dams, and power. ULI’s 2010
publication focused on the necessity to treat infrastructure as investment.
The full reports can be accessed on-line, and a synthesis of these reports can be found in
the “Situational Analysis” conducted as a part of this study effort, which can be accessed at
the MPOAC website at http://www.mpoac.org/revenuestudy/Situational_Analysis.pdf.
Key findings and recommendations from these four national efforts include the following.
Findings
All levels of government (federal, state and local) are under-investing in
transportation.
1 cent of federal gasoline tax yields $1.4 billion per year.
1 cent of federal diesel tax yields $400 million per year.
The current tax system creates a faulty pricing mechanism giving weak price signals.
Federal spending per mile decreased 50% since 1950s.
Recommendations
Investments in transportation should be subject to performance measures.
An annual investment of $225 billion is needed for the next 50 years. (The current
investment level is at approximately 40% of this recommended level).
An independent federal commission should be established to set fuel tax, subject to
congressional veto.
HTF should be funded at $100 billion per year (currently $32 billion).
VMT pricing should be instituted.
Tolling should be increased. Tolling technology should be nationally standardized.
A 10-cent increase in gasoline tax and a 15-cent increase in diesel fuel tax should be
set.
The heavy vehicle use tax should be doubled.

9
VMT charges should be priced at 2.3 cents per mile for cars and 13.2 cents per mile
for heavy trucks.
Fuel tax should be eliminated with the implementation of VMT.
The Transportation Infrastructure Finance and Innovation Act (TIFIA) program
should be expanded to provide additional credit enhancements.
State Infrastructure Banks should be recapitalized at $500 million per year.
The Federal Private Activity Bond program should be expanded from $15 billion to
$30 billion.
A National Infrastructure Bank should be created.
The use of private-public partnerships should be expanded.

10

11
III. State Transportation Funding – Florida
In Florida, the STTF receipts from fuel taxes make up 68 percent of the revenue portfolio;
they are indexed to offset the impacts of inflation each January. Based on movement in the
Consumer Price Index (CPI), Florida’s Highway Fuel Sales Tax (currently 12.6 cents per
gallon) and the State Comprehensive Enhanced Transportation System (SCETS) Tax
(currently 6.9 cents per gallon) are adjusted annually. The other major sources are not
adjusted annually, however, and their buying power diminishes over time.
State Tax Sources for State Use
State Fuel Sales Tax The State Fuel Sales Tax is levied on highway fuels (not including alternative fuels) and
non-highway diesel fuels (levied on intrastate railroads, commercial vessels, construction
equipment, etc.). The highway fuel sales tax is currently 12.2 cents per gallon and is
adjusted annually with fluctuations in the CPI.
SCETS Tax The SCETS Tax rate in each county is equal to 2/3 of the total local option fuel taxes up to 4
cents per gallon. For example, in counties where 6 cents of Local Option Gas Tax is levied,
the SCETS Tax will equal 4 cents (i.e., 2/3 x 6 = 4). While the proceeds of the SCETS Tax
are not shared directly with local governments, they must be spent in the respective FDOT
District and, to the extent feasible, in the county in which they were collected. Like the
State Fuel Sales Tax, the SCETS Tax is adjusted with fluctuations in the CPI. Currently, the
SCETS Tax rate is 6.6 cents for diesel fuel and 5.6 to 6.8 cents for gasoline.
Aviation Fuel Tax Florida imposes a tax of 6.9 cents per gallon on aviation fuel. This fuel is used in aircraft
and also includes aviation gasoline and aviation turbine fuels and kerosene. The revenues
generated from this tax are limited to aviation projects only. The funds are deposited into
the Fuel Tax Collection Trust Fund and then distributed to the STTF.
Fuel Use Tax and Fee
The Fuel Use Tax is imposed by every state in the nation (via the International Fuel Tax
Agreement) on heavy vehicles engaged in interstate operations. The tax is based on fuel
consumed rather than fuel purchased in a state. The tax comprises an annual decal fee of
$4.00 plus a use tax based on the number of gallons consumed times the prevailing
statewide fuel tax rate.
Motor Vehicle License Tax
The Motor Vehicle License Tax is an annual tax for operating motor vehicles, mopeds,
motorized bicycles, and mobile homes. These taxes vary according to weight and type of
each vehicle. Pursuant to Article XII, Sec. 9 (d)(3) of the Florida Constitution, the first
proceeds of the tax are deposited to the Public Education Capital Outlay (PECO) Trust Fund
and, as directed by s. 320.08, F.S., the remaining revenues are deposited into the STTF and
the General Revenue (GR) Fund.

12
Initial Registration Fee
A one-time fee of $225 is charged for first-time registration of newly-purchased vehicles.
Of the proceeds of this fee, 44.5 percent are deposited to the STTF and the remaining 55.5
percent are deposited to the GR Fund.
Title Fee
A fee is charged to all motor vehicles when issuing a certificate of title. The fee ranges from
$49 to $70 depending on the type of title transaction. The proceeds of this fee are deposited
into the STTF or the state’s GR Fund as provided by statute.
Rental Car Surcharge A $2.00 per day surcharge is assessed on the first 30 days of car leases or rentals. Eighty
percent of these proceeds is deposited into the STTF, 15.75 percent is deposited to the
Tourism Promotional Trust Fund, and 4.25 percent is deposited to the International Trade
and Promotion Trust Fund.
State Documentary Stamp Tax The 2005 legislature enacted growth management legislation to address needed
infrastructure in Florida. This legislation broadened the distribution of revenues from the
documentary stamp tax on documents such as deeds, stocks and bonds, mortgages, etc.
The STTF receives a percentage of the collections from this tax, not to exceed $541.75
million annually. According to FDOT, the November 2009 Revenue Estimating Conference
estimated $56.80 million in distributions from the Documentary Stamp Tax to the STTF and
$77.85 million for FY 2010/11.
For FY 2010/11, the shares of these revenues as a portion of the STTF total are illustrated in
Figure 4.
While the hedge against inflation is better at the state level than for the federal
transportation revenue sources, it is important to note that the STTF makes up 48 percent
of the State’s transportation investment (the remaining 52% being made up of federal
funds, toll receipts, bond proceeds, and other sources), with 68 percent of that 48 percent
being indexed to the CPI. Stated differently, about 1/3 of the revenue sources for use by
FDOT are inflation-sensitive.
The heavy reliance on a cents-per-gallon fuel tax is resulting in pressures on the STTF and
reductions in projected revenue because of an increasingly fuel-efficient vehicle fleet. While
VMT have reduced in recent years, official projections for the post-recession period are for a
return to steady growth in Florida. If these projections are realized, it will result in VMT
growing 82 percent for the period FY 1999/00 to 2019/20, while fuel tax revenues grow at
an anemic 8 percent for the same period.

13
Source: Revenue Estimating Conference, August 2010
Figure 4. Florida STTF Shares, FY 2010/11
As discussed in the previous section on federal funding sources, the increasing CAFE
standards will have a significant negative revenue impact for transportation funds relying on
fuel taxes. At the time of this analysis, Florida’s Revenue Estimating Conference (REC) in
October 2011 had not yet factored the new regulations (which will increase the average
new, light-duty vehicle fleet efficiency) into the STTF revenue estimates. CUTR researchers
applied the new CAFE standards to the REC revenue estimates and calculated an estimated
additional $736 million loss from FY 2012/13 to FY 2019/20.
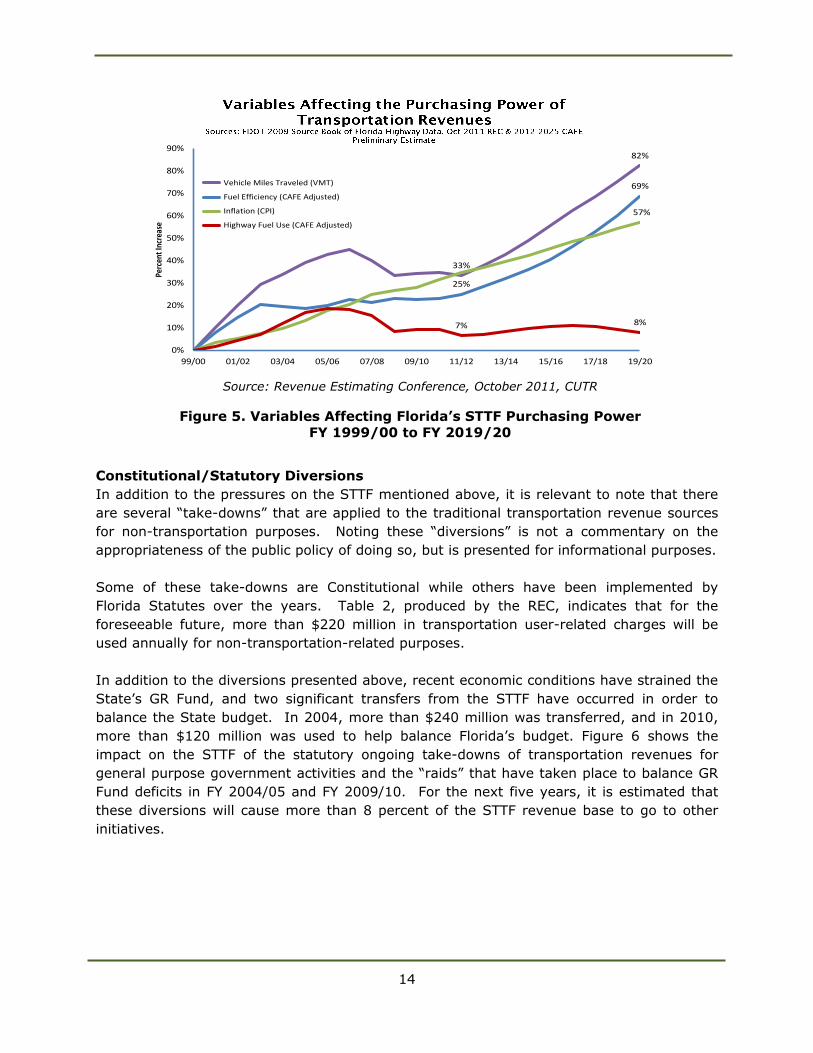
Figure 5 illustrates that Florida’s transportation needs are expected to grow in absolute
terms as indicated by the projected VMT. Fuel efficiency of the fleet is projected to increase
by 69 percent from 1999/00 to 2019/20, tempering revenue growth. In fact, fuel use is
projected to have grown only by 8 percent, on average, over the 1999/00 to 2019/20
period, and inflation will continue erode the purchasing power of revenue sources other than
fuel taxes.
42%
24%
2%
20%
4%
3%3%
2%
State Transportation Trust Revenue Sources - FY 2010 -11
Highway Fuels Sales Tax
SCETS Fuels Tax
Aviation Fuels Tax
Motor Vehicle License Fees
Rental Car Surcharge
Initial Registration Fee
Title Fees
Fuel Use Taxes and Fees
Local Option Fuel Tax
14
Transportation Revenues Used for Non-Transportation Purposes
Constitutional/Statutory Diversions
In addition to the pressures on the STTF mentioned above, it is relevant to note that there
are several “take-downs” that are applied to the traditional transportation revenue sources
for non-transportation purposes. Noting these “diversions” is not a commentary on the
appropriateness of the public policy of doing so, but is presented for informational purposes.
Some of these take-downs are Constitutional while others have been implemented by
Florida Statutes over the years. Table 2, produced by the REC, indicates that for the
foreseeable future, more than $220 million in transportation user-related charges will be
used annually for non-transportation-related purposes.
In addition to the diversions presented above, recent economic conditions have strained the
State’s GR Fund, and two significant transfers from the STTF have occurred in order to
balance the State budget. In 2004, more than $240 million was transferred, and in 2010,
more than $120 million was used to help balance Florida’s budget. Figure 6 shows the
impact on the STTF of the statutory ongoing take-downs of transportation revenues for
general purpose government activities and the “raids” that have taken place to balance GR
Fund deficits in FY 2004/05 and FY 2009/10. For the next five years, it is estimated that
these diversions will cause more than 8 percent of the STTF revenue base to go to other
initiatives.
33%
82%
25%
69%
57%
7% 8%
0%
10%
20%
30%
40%
50%
60%
70%
80%
90%
99/00 01/02 03/04 05/06 07/08 09/10 11/12 13/14 15/16 17/18 19/20
Perc
ent I
ncre
ase
Vehicle Miles Traveled (VMT)
Fuel Efficiency (CAFE Adjusted)
Inflation (CPI)
Highway Fuel Use (CAFE Adjusted)
Source: Revenue Estimating Conference, October 2011, CUTR
Figure 5. Variables Affecting Florida’s STTF Purchasing Power
FY 1999/00 to FY 2019/20

15
Table 2. Transportation Funds Used for Non-Transportation Purposes ($ millions)
Source: Statewide Revenue Estimating Conference, August 2010
Purpose 05/06 06/07 07/08 08/09 09/10 10/11 11/12 12/13 13/14 14/15 15/16 16/17 17/18 18/19 19/20
Education
(22% of MVL Fees - Article XII, Section
9(d)(3), Florida Constitution and Sections
320.08 & 320.20, F.S.) $118.9 $121.9 $114.8 $119.6 $119.6 $121.2 $121.2 $121.2 $121.2 $121.2 $121.2 $121.2 $121.2 $121.2 $121.2
General Revenue Service Charges &
Administrative Charges
(7.0/7.3%, Section 215.20, F.S. and various
other sections) $31.1 $30.3 $33.3 $29.7 $35.5 $35.9 $36.8 $37.7 $38.5 $39.2 $39.9 $40.5 $41.3 $41.8 $42.3
Tourism & Trade
(Rental Car Surcharge ($0.37) - Section
212.0606, F.S.) $27.9 $27.2 $28.0 $24.5 $23.0 $24.0 $25.1 $26.2 $27.2 $28.1 $29.0 $29.7 $30.5 $31.2 $32.0
DEP/GFC/FWCC
(Section 206.606, F.S.) $17.3 $19.7 $22.2 $22.2 $22.2 $22.2 $22.2 $22.2 $22.2 $22.2 $22.2 $22.2 $22.2 $22.2 $22.2
Agricultural Emergencies
(Sales Tax and SCETS Tax : 0.65% of net
revenues from motor fuel, Sections
206.606 and 206.608, F.S.) $9.2 $9.5 $9.6 $9.6 $9.9 $9.9 $10.4 $10.8 $11.3 $11.8 $12.3 $12.7 $13.2 $13.8 $14.3
Transfer to General Revenue 1
(Nonrecurring transfer to General
Revenue from STTF) $120.2
Total $204.4 $208.5 $207.9 $205.6 $330.3 $213.2 $215.7 $218.1 $220.3 $222.5 $224.6 $226.3 $228.4 $230.2 $232.11
One time transfer to General Revenue Fund from the State Transportation Trust Fund
Fiscal Year
16
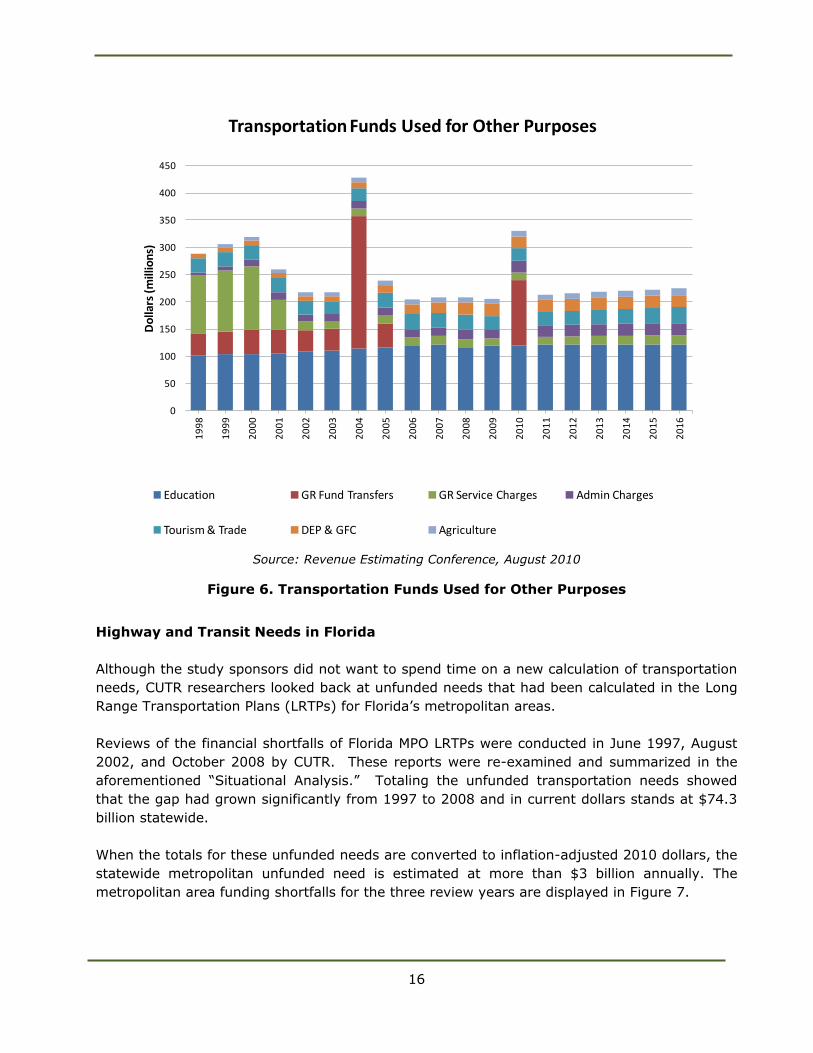
Source: Revenue Estimating Conference, August 2010
Figure 6. Transportation Funds Used for Other Purposes
Highway and Transit Needs in Florida
Although the study sponsors did not want to spend time on a new calculation of transportation
needs, CUTR researchers looked back at unfunded needs that had been calculated in the Long
Range Transportation Plans (LRTPs) for Florida’s metropolitan areas.
Reviews of the financial shortfalls of Florida MPO LRTPs were conducted in June 1997, August
2002, and October 2008 by CUTR. These reports were re-examined and summarized in the
aforementioned “Situational Analysis.” Totaling the unfunded transportation needs showed
that the gap had grown significantly from 1997 to 2008 and in current dollars stands at $74.3
billion statewide.
When the totals for these unfunded needs are converted to inflation-adjusted 2010 dollars, the
statewide metropolitan unfunded need is estimated at more than $3 billion annually. The
metropolitan area funding shortfalls for the three review years are displayed in Figure 7.
0
50
100
150
200
250
300
350
400
450
19
98
19
99
20
00
20
01
20
02
20
03
20
04
20
05
20
06
20
07
20
08
20
09
20
10
20
11
20
12
20
13
20
14
20
15
20
16
Do
llars
(m
illio
ns)
Transportation Funds Used for Other Purposes
Education GR Fund Transfers GR Service Charges Admin Charges
Tourism & Trade DEP & GFC Agriculture
Florida TransportationFund Diversion

17
Source: CUTR, 2010
Figure 7. Florida Metropolitan Area Transportation Shortfall Estimates
Another approach was used by CUTR to provide context to the MPOAC without recalculating a
needs figure that would be not be realistic to fund and could be considered suspect. An
examination of investment levels was performed that looked at state transportation investment
on a vehicle-miles-traveled basis. The study period for this work was from FY 1999/00 to
2019/20; the investment per VMT was compared to the expected revenue coming to the STTF.
Over the 20-year period, $12 billion would be needed just to invest at the same levels as in FY
1999/00.
The concept of “revenue restitution” has been used to describe filling the $12.1 billion, 20-
year, funding gap, i.e., not requesting additional revenue for investment, but merely trying to
maintain the investment levels on a vehicle-mile basis that were being made in 1999. The
RSAC, MPOAC Staff Directors’ Advisory Committee, and MPOAC Governing Board all focused
intently on this concept of achieving the investment levels of a decade ago.
The funding gap is illustrated in Figure 8.
29.8
35.4
42.7
50.8
62.5
74.3
0
10
20
30
40
50
60
70
80
2005 $'s 2010 $'s
$ B
illio
ns
Florida Metro Area Transportation Funding Shortfall Estimates
1997 Review
2002 Review
2008 Review

18
Source: Revenue Estimating Conference and CUTR, 2011
Figure 8. STTF Lost Purchasing Power FY 1999/00 to FY 2019/20
Local Sources of Transportation Revenue
State Tax Sources for Local Use The following motor fuel taxes are distributed to local governments.
Constitutional Fuel Tax – Set at 2 cents per gallon, this tax is distributed to counties
based on a constitutional formula. The county distribution factor is calculated using
population, area, and total tax collections. The priority for the proceeds of the
Constitutional Gas Tax is to meet the debt service requirements, if any, on local bond
issues. Any remaining resources are credited to the counties’ transportation trust
funds.
County Fuel Tax – Set at 1 cent per gallon, this tax is distributed by the same formula
as the Constitutional Gas Tax. Counties may use the revenues from this tax for
transportation-related expenses.
Municipal Fuel Tax – Set at 1 cent per gallon, revenues from this tax are transferred
into the Revenue Sharing Trust Fund for Municipalities where they are joined with other

19
non-transportation revenues. These revenues may be may be used for transportation-
related expenditures within incorporated areas and are distributed to municipalities by
statutory criteria.
Local Tax Sources State law authorizes local governments to enact the following local option taxes for
transportation purposes.
9th-Cent Fuel Tax – Originally called the 9th Cent tax when the state’s fuel taxes
totaled 8 cents, this tax may be levied in any county by an extraordinary vote (majority
plus 1) of its Board of County Commissioners. The tax proceeds can be shared with
cities within the county by agreement. A total of 51 counties in Florida currently levy
this tax.
Charter County and Regional Transportation System Surtax – This tax can be
levied in all 20 Charter Counties and any county that is consolidated with one or more
municipalities. The tax can be levied at a rate of up to 1 percent of taxable transactions
up to $5,000 (excludes fuel sales taxes) by countywide referendum. Permitted uses of
the revenues include financing the development, construction, and operation of fixed
guideway, rapid transit systems, bus systems, on-demand transportation services,
roads and bridges, and pledges to bonds issued for these purposes. The surtax is
currently levied in only Duval and Miami-Dade counties.
Local Option Fuel Tax – Counties are authorized to levy a fuel tax of up to 11 cents
per gallon of gasoline (but not diesel, which is standard in every county at 6 cents per
gallon). The tax proceeds must be shared with municipalities.
Other Funds
Local Expressway Authorities – Except for Florida’s Turnpike Enterprise, most of
Florida’s toll agencies are established within Florida Statutes, Chapter 348, Expressway
and Bridge Authorities, Parts I through X. Part I, entitled the “Florida Expressway Act
and Related Provisions,” details the power for any county or counties to establish an
expressway authority. It establishes the method for a county or number of contiguous
counties to create an expressway authority. Part I also specifies the board composition,
terms of board members, powers, and financing capabilities. It precludes the creation
of an expressway authority under Part I in a county where an authority has been
created under Parts II through IX (Brevard, Broward, Hillsborough, Orange, Pasco, St.
Lucie, Seminole, and Santa Rosa counties) or in a county with an authority created
under Chapter 349 (Duval County).
One significant difference between Part I authorities and the others is the explicit
permission to construct operate and maintain not only expressways, but also a “public
transportation facility.” The toll authorities operating in the Miami, Orlando, and Tampa
metropolitan areas were operating and maintaining transportation assets worth $4.4
billion in 2009, financed primarily through user fees.

20
Although the focus of this study was to examine state revenue sources, several local funding
issues emerged. As described above, cities and counties in Florida rely heavily on taxes on
highway fuel. There are local option gasoline taxes that may be levied at the county level, and
there are three different fuel taxes collected by the State for distribution to the counties and
municipalities. None of the rates for these fuel assessments are adjusted for inflation. For
example, the County Fuel Tax at 1 cent per gallon was established in 1941 and would be 15
cents if it had been indexed to the CPI.
Table 3. Transportation Taxes and Fees – Inflation Effects
The three fuel taxes collected by the State for distribution are show in the last three rows of
Table 3. The Municipal Fuel, Constitutional Fuel, and County Fuel Taxes were last adjusted in
1971, 1943, and 1941, respectively.
After six sessions of the Revenue Study Advisory Committee, examination of 58 potential
revenue options, and 7 presentations to both the MPOAC Staff Directors’ Advisory Committee
and MPOAC Governing Board, the MPOAC, at its April 26, 2012, meeting, voted to transmit
information to the Florida legislature and governor on 14 options and endorsed 6 of them for
initiation of legislative action (Table 4). The remainder of this report describes the options in
detail and includes draft legislative language to implement these first six options.
% Rate
Increase
Needed
Inflation
Adjusted
Rate
Rate
Increase
Needed
State Fuel Use 12.3 per gal 2011 0 224.9 $1.00 0% 12.3 0.0
SCETS 6.8 per gal 2011 0 224.9 $1.00 0% 6.8 0.0
Off Highway 12.0 per gal 2011 0 224.9 $1.00 0% 12.0 0.0
Federal Highway Fuel 18.4 per gal 1997 14 160.5 $0.71 40% 25.8 7.4
Federal Highway Diesel 24.4 per gal 1997 14 160.5 $0.71 40% 34.2 9.8
Local Option Fuel 12.0 per gal 1993 18 144.5 $0.64 56% 18.7 6.7
Title Fee various one time 1991 20 136.2 $0.61 65% various various
Aviation Fuel 6.9 per gal 1990 21 130.7 $0.58 72% 11.9 5.0
Initial Registration Fee $100.00 one time 1990 21 130.7 $0.58 72% $172.07 $72.07
Rental Car Surcharge $2.00 per day 1990 21 130.7 $0.58 72% $3.44 $1.44
MVL Fees various annual 1983 28 99.6 $0.44 126% various various
Municipal Fuel 1.0 per gal 1971 40 40.5 $0.18 455% 5.6 4.6
Constitutional Fuel 2.0 per gal 1943 68 17.3 $0.08 1200% 26.0 24.0
County Fuel 1.0 per gal 1941 70 14.7 $0.07 1430% 15.3 14.3
Inflation
Adjusted
Value of
$1.00
To Restore Original Purchasing Power
Purchasing Power Calculations for Non-Indexed Taxes & Fees Are Calculated Using April 2011 CPI Index of 224.9.
The 2010 General Revenue Surcharges imposed on MVL Fees, Initial Registation Fees, Title Fees and Rental Car Surcharges are excluded from
this analysis since they did not impact the purchasing power of the respective share of revenues directed to the State Transportation Trust Fund.
Transportation Taxes and Fees
Purchasing Power Value Lost Due to Inflation
Rate Increases Required to Restore Lost Purchasing PowerTable Excludes the Surcharges to General Revenue Enacted in 2009
Tax/Fee
Rate (to
STTF)
Unit of
Measure
Last STTF
Rate
Increase
Years
Since
Last
Increase
CPI-U
Index
Level

21
Table 4. MPOAC Revenue Study Selected Options
Revenue Option 8-Year Total
($millions)
Annual Average
($millions)
Allow up to 1-cent local option sales surtax (local). $6,637 $830
Increase local diesel fuel tax by 5 cents (local). $576 $72
Index all fuel taxes not currently indexed (local). $918 $115
Implement 2-cent state motor fuel tax annually for 5 years (state). $6,424 $803
Return MVL license fee and initial registration fee increases to STTF (from GR - state).
$3,301 $413
Conduct a VMT study. – –
Impose 6% state sales tax in lieu of both state fuel taxes (state). $1,087 $136
Study, evaluate, and establish toll rates for State-owned facilities. – –
Create and fund Regional Transportation Financing Authorities. $3,200 $400
Institute sales tax on motor vehicle parts/services (from GR to STTF). $5,331 $666
Shift sales tax on battery-electric vehicles (from GR to STTF). $73 $9
Implement $10 county vehicle registration fee (local). $1,242 $155
Expand current alternative fuel decal program (state). $204 $26
Invest $100 million of incremental revenue in new toll projects. $2,450 $306

22

23
IV. Revenue Options Recommended for
Legislative Action
This section describes in detail the 14 options selected by the MPOAC for presentation to the
Florida legislature and the Florida governor.
Allow up to 1-cent local option sales surtax
Recommendation: Allow cities and consortiums of cities over 150,000 or the largest
municipality in a county to impose up to a 1-cent local option sales surtax (not to exceed 1-
cent city and charter county tax combined).
Rationale
Under current Florida Statute, charter counties and those included in a Regional Transportation
Authority district may elect to impose a 1 percent sales tax on items up to $5,000, with
revenues being available for transportation uses. This option would extend that flexibility to
cities with a population of 150,000 or more but could not be duplicative of any County
transportation sales tax. For example, Miami-Dade County voters approved a 1/2 percent
sales tax. If the City of Miami wanted to put this 1-cent tax in place, it would be limited to an
additional 1/2 percent. In counties without a city of a population of 150,000, the option would
be available to the largest municipality in that county based on the latest available census. If
fully implemented, it could generate approximately $830 million to cities in total.
Discussion
An optional municipal sales tax for transportation would give the residents of municipalities the
ability to approve tax increases for urban transportation solutions that lack the support of
suburban and rural residents who reside in unincorporated areas.
Municipal transportation needs sometimes differ from those of unincorporated county areas.
Large municipalities often identify transit options as the most viable solution to growing urban
transportation needs, whereas unincorporated suburban and rural areas more frequently
identify road and highway improvements as the transportation priority. As a result of these
differing perceptions of transportation needs, countywide referendums that propose urban
transit solutions face a greater risk of voter opposition than if the referendum were limited to
the urban municipalities. For example, in 2011, a 1/2 percent sales tax referendum in
Hillsborough County, which designated 75 percent of the proceeds to be used for light rail and
other urban transit projects and 25 percent for road and highway improvements, was
defeated, while it was supported by a majority of residents within the city of Tampa.
Estimates of revenue generated should be considered as an approximation due to limited
available data on the level of sale taxes within each county that is attributable to sales within
the municipal boundaries. Sales tax revenues can vary significantly in counties, depending
upon where a majority of sales taxes are collected. For example, sales tax revenues in
unincorporated Orange County are much higher than in Orlando due to sales tax collections at
amusement parks, while Tallahassee appears to have a higher per-capita sales tax collection

24
rate than the surrounding county. Residents from unincorporated areas would be subject to
the tax when making purchases within municipal boundaries. While the assessment of a
different sales tax rate within a city and the surrounding county may result in some changes in
purchasing behaviors, the impact should not be material due to the small incremental
difference.
It is proposed that the sum of this municipal surtax and a charter county surtax would not
exceed 1 percent in total. For example, currently, Miami-Dade and Jacksonville-Duval counties
assess a 1/2 percent charter county surtax. Thus, any tax imposed by a city within these
counties would be limited to an additional 1/2 percent. This recommendation also assumes the
current limitation of surtaxes of up to $5,000 on purchases would be retained.
Based on the 2010 Census, 69 municipalities would qualify for the local option municipal sales
tax surcharge—in 11 municipalities with populations in excess of 150,000 and in the largest
municipality in 58 counties that do not have a city with a population of 150,000 or more.
There are two municipalities with populations greater than 150,000 in both Miami-Dade County
(Miami, Hialeah) and Broward County (Ft. Lauderdale, Pembroke Pines). In addition, it is
proposed that municipalities within a county could form consortia to propose jointly a municipal
sales tax surcharge, either with an existing eligible municipality or if their combined population
exceeds the 150,000 threshold.

25
Revenue Option: 1-Cent Local Option Municipal Sales Tax
8-Year Total: $6,637 million (max)
Annual Average: $830 million (max)
Figure 9. Estimated Local Revenue Yields* – Municipal Option Sales Tax
*The MPOAC Revenue Study calculations were prepared using Florida REC data and assumptions as of
October 2011. Subsequent REC estimations may result in changes to the funding levels generated by
this option. Accordingly, the revenue estimates displayed above should be considered approximate
funding levels for the purpose of evaluating additional revenue alternatives.
Increase local diesel fuel tax by 5 cents.
Recommendation: Increase the local diesel fuel tax by 5 cents per gallon, to be applied
equally in all counties consistent with the International Fuel Tax Agreement and to encourage
economic development and enhance commercial traffic for the purpose of investments in
projects.
Rationale Local option tax rates are fixed in State law to ensure diesel-fuel tax rate consistency among
counties for purposes of administering the provisions of the International Fuel Tax Agreement.
The local option diesel tax rates are currently 7 cents per gallon, while the statewide average
for local option gasoline taxes has risen to 9.6 cents per gallon. There has long been
100REVENUE STUDY ADVISORY COMMITTEE
72 76 81 85 90 94 99 104
68 73 77 81 85 90 94 9967 71 76 80 84 88 92 97 44 47 50 53 55 58 61 64
40 43
46 48 50 53 55
58
36 38
41 43
45 47
49 52
34 37
39 41
43 45
48 50
31 33
35 37
39 41
43 45
30 31
33 35
37 39
41 43
28 30
32 34
36 37
39 41
25 27
29 30
32 33
35 37
24 26
27 29
30 32
33 35
19 20
21 23
24 25
26 27
160 170
181 190
199 209
220
231
$679$722
$770$808
$849$891
$936$982
$0
$100
$200
$300
$400
$500
$600
$700
$800
$900
$1,000
2012-13 2013-14 2014-15 2015-16 2016-17 2017-18 2018-19 2019-20
One Cent Local Option Municipal Sales Tax For Cities With Population > 150,000 and Largest City in County
Approximate Net Revenue - In $ Millions
Tampa Jacksonville-Duval (1/2¢) Orlando Fort Lauderdale
West Palm Beach St. Petersburg Miami (1/2¢) Tallahassee
Pembroke Pines Ocala Lakeland Gainesville
Hialeah All Other

26
recognition that a higher rate per gallon on diesel fuel is appropriate, as the major users of the
fuel are heavy trucks. For example, the federal tax is 18.4 cents per gallon for gasoline and
24.4 cents for diesel because of the distinction in the demands placed on the highway system
by heavy trucks versus light-duty vehicles. This option would establish an additional 5-cent
diesel fuel tax in each county, and the revenues would be required to be expended on projects
that serve or enhance commercial highway traffic. This dedicated local source of funding could
be used to encourage economic development and improve existing commercial operations. It
is estimated to generate about $72 million per year to Florida’s counties.
Discussion
International Fuel Tax Every state in the nation now imposes a fuel use tax via the International Fuel Tax Agreement
on heavy vehicles that engage in interstate operations. This agreement is designed to ensure
that each state receives taxes based on fuel consumed rather than fuel purchased in the state.
Previously, operators of such vehicles were able to buy fuel (often at lower prices) in a
neighboring state and use the fuel on Florida's roads. Thus, Florida's roads experienced
uncompensated damage, and the state's retail fuel outlets, particularly those in the northern
tier, were deprived of sales that otherwise might have occurred. For the provisions of this
agreement to be administered efficiently both for the state and for commercial interests, the
state’s diesel fuel tax rate needs to be consistent in all counties. Accordingly, the 1990
legislature equalized all optional taxes on diesel fuel so that interstate truckers, who pay fuel
taxes based on miles driven in the state, would be subject to standardized tax rates.
Local Option Tax Rates
Two local option fuels taxes are authorized under s. 206.41, F.S., the 9th-Cent Fuel Tax and
the 1-Cent to 11-Cents Local Option Fuel Tax. The 1-cent 9th-Cent Fuel Tax may be imposed
by each county on motor fuel and is so named because it was in addition to the 8 cents in
state fuel taxes in place when adopted in 1972. Counties may impose this tax by
extraordinary vote of the Board of County Commissioners, and the proceeds may be shared
with cities in whatever proportion agreed upon. Presently, 51 counties have implemented the
9th-Cent Fuel Tax on gasoline and gasohol. The diesel tax rate is set in statute at 1 cent per
gallon for all 67 counties.
The 1-Cent to 11-Cents Local Option Fuel Tax, originally set at a maximum of 6 cents per
gallon, was later increased to 11 cents. Beginning in 1985, up to 6 cents could be levied at
the option of a county's governing body for a maximum period of 30 years, with proceeds
required to be shared with municipalities. This tax may be imposed by a majority vote of the
Board of County Commissioners or a countywide referendum initiated by either the County
Commission or municipalities representing more than 50 percent of the county's population. In
1993, the Florida legislature authorized an additional 5-Cent Local Option Fuel Tax, for which
an extraordinary vote of the County Commission or a countywide referendum initiated by the
commission is required.

27
As with the 9th-Cent Fuel Tax, the legislature chose to equalize the Local Option Fuel Tax on
diesel fuel in 1990, reaching 6 cents per gallon on January 1, 1993. However, 5-cent increase
to the local option tax in 1993 was not applied to diesel fuel.
As of 2011, 20 counties impose the maximum of 12 cents per gallon in local option taxes, 29
counties impose between 7 and 11 cents, 15 counties impose 6 cents, and 1 county imposes 5
cents. The 2011 statewide average local option tax on gasoline and gasohol is 9.6 cents per
gallon. However, since the 5-cent increase was not limited to motor fuels only, the tax rate for
diesel remains standard in all counties at 7 cents per gallon.
Maintenance and Repair Costs Caused by Heavy Trucks
The federally-mandated maximum weight for the Interstate Highway System is 80,000 pounds
gross vehicle weight. In addition, as of July 1, 2010, trucks weighing up to 88,000 pounds can
travel on specific non-interstate routes in Florida. There is a variety of public policy issues and
trade-offs that must be considered when establishing maximum truck weights for the state’s
roads and highways, such as commercial benefits, air quality and fuel use impacts,
transportation safety, and roadway costs of maintenance and repair. Certain of these issues
point towards the benefits of higher weight standards, while others would argue for lower
maximum weights. It is generally accepted that one of the adverse consequences of higher
vehicle weight maximums and heavy trucks, in general, is with the cost of roadway
maintenance and repair, in particular, pavement fatigue and structural fatigue on bridges.
Several revenue measures are used to align the taxes and fees paid by trucks with the
associated costs to maintain and repair highways and bridges. These include substantially
higher vehicle registration fees, federal truck tire excise taxes, and a 6-cents-higher federal tax
rate for diesel fuel. Accordingly, it could be argued that an increase in the local option diesel
fuel tax rate is justified to defray the associated maintenance and repair costs incurred by
heavy trucks, particularly in light of the 2010 increase in weight limits for certain non-
interstate roads.
Projects to Enhance Commercial Traffic By undertaking transportation improvements that enhance commercial traffic, the
recommended 5-cents-per-gallon increase will provide local governments with a dedicated
source of transportation funding that can potentially be used as an additional tool to promote
economic development and to improve the business climate for existing commercial interests.

28
Revenue Option: 5-Cent Local Diesel Tax, Dedicated to Projects that
Encourage Economic Development and Enhance Commercial Traffic
8-Year Total: $576 million
Annual Average: $72 million
Figure 10. Estimated Local Revenue Yield* – 5-Cent Local Diesel Tax Increase
*The MPOAC Revenue Study calculations were prepared using Florida REC data and assumptions as of
October 2011. Subsequent REC estimations may result in changes to the funding levels generated by
this option. Accordingly, the revenue estimates displayed above should be considered approximate
funding levels for the purpose of evaluating additional revenue alternatives.
Index all state and local fuel taxes not currently indexed.
Recommendation: Index state fuel excise taxes for local use and local option gas taxes.
Rationale
In addition to the State taxes mentioned previously, there are myriad local option taxes levied
on a per-gallon basis as well as the Constitutional Fuel Tax (2 cents per gallon), County Fuel
Tax (1 cent per gallon), and Municipal Fuel Tax (1 cent per gallon). The Constitutional,
County, and Municipal taxes are all collected by the State for distribution to local governments.
None of these or the local option fuel taxes are indexed to the CPI. This option would index
them on the same basis as the State Fuel Sales Tax and the SCETS, providing local
governments with the same inflation hedge enjoyed by the STTF, and would generate
approximate $115 million annually for investment in transportation infrastructure. Some of
these user fees have not been adjusted since the 1940s.
$63$65
$69$72
$74 $76 $78 $80
$0
$10
$20
$30
$40
$50
$60
$70
$80
$90
2012-13 2013-14 2014-15 2015-16 2016-17 2017-18 2018-19 2019-20
Increase the Standardized Local Option Diesel Fuel Tax 5 CentsRevenues Dedicated to Freight-Related Projects
In $ millions
Apply the 5 Cents Local Option Fuel Tax to Diesel - Standardized In All Counties
MPOAC REVENUE STUDY

29
Discussion
State motor fuel taxes for State use are currently indexed annually to compensate for
increases in the general CPI (CPI–All). However, State motor fuel taxes collected for local use
and local option fuel taxes are not indexed. Thus, the purchasing power of local fuel tax
revenues is reduced over time due to the effects of inflation. Nearly 1/3 of all Florida counties
currently assess the maximum local option tax rates and, therefore, can no longer increase
their tax to compensate for inflation-driven higher transportation costs. Indexing the fuel tax
revenues that are used by local governments will partially offset expected declines in their real
dollar value in future years (although future vehicle fuel efficiency increases would continue to
reduce local government fuel tax revenue collections, when measured in relation to the amount
of VMT, due to less fuel consumption and fuel taxes collected per vehicle miles traveled).
State Fuel Taxes for Local Use
Fuel excise taxes totaling 4 cents per gallon are distributed to local governments. Two cents of
this tax, called the Constitutional Fuel Tax, is levied under s. 9(c)(4) of Article XII of the
revised State Constitution of 1968, which also contains its distribution formula. The first call on
the proceeds is to meet debt service requirements, if any, on local bond issues backed by the
tax proceeds. The balance, called the 20 percent surplus and the 80 percent surplus, is
credited to the counties’ transportation trust funds. The third cent is the County Fuel Tax. It is
levied under s. 206.41, F.S., and distributed by the same formula as the Constitutional Fuel
Tax. The fourth cent, the Municipal Fuel Tax, is also levied under s. 206.41, F.S. Revenues
from this tax are transferred into the Revenue Sharing Trust Fund for Municipalities, joined
with other non-transportation revenues, and distributed in accordance with criteria contained
in Chapter 218, F.S.
Local Option Tax Rates
Two local option fuel taxes are authorized under s. 206.41, F.S. These are the 9th-Cent Fuel
Tax and the 1 Cent to 11 Cents Local Option Fuel Tax.
The 1-penny 9th-Cent Fuel Tax, which is so named because it was in addition to the 8 cents in
state fuel taxes in place when adopted in 1972, may be imposed by each county on motor fuel.
Counties may impose this tax by extraordinary vote of the Board of County Commissioners,
and the proceeds may be shared with cities in whatever proportion agreed upon. Presently, 51
counties in Florida have implemented the 9th-Cent Fuel Tax on gasoline and gasohol. The
diesel tax rate is set in State statute at 1 cent per gallon for all 67 counties.
The 1-Cent to 11-Cents Local Option Fuel Tax, which was originally set at a maximum of 6
cents per gallon, was later increased to 11 cents. Beginning in 1985, up to 6 cents could be
levied at the option of a county's governing body for a maximum period of 30 years, with
proceeds required to be shared with municipalities. This tax may be imposed by a majority
vote of the Board of County Commissioners or a countywide referendum initiated by either the
County Commission or municipalities representing more than 50 percent of the county's
population. In 1993, the legislature authorized an additional 5 cents Local Option Fuel Tax, for
which an extraordinary vote of the County Commission or a countywide referendum initiated
by the Commission is required.
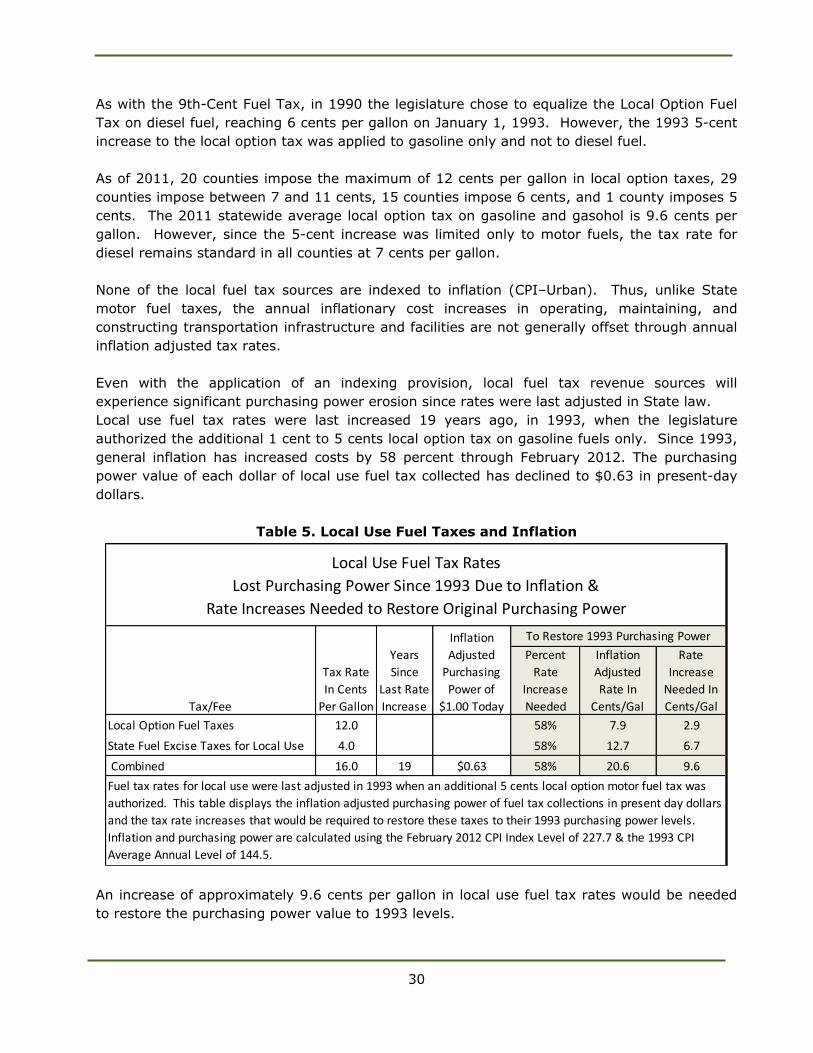
30
As with the 9th-Cent Fuel Tax, in 1990 the legislature chose to equalize the Local Option Fuel
Tax on diesel fuel, reaching 6 cents per gallon on January 1, 1993. However, the 1993 5-cent
increase to the local option tax was applied to gasoline only and not to diesel fuel.
As of 2011, 20 counties impose the maximum of 12 cents per gallon in local option taxes, 29
counties impose between 7 and 11 cents, 15 counties impose 6 cents, and 1 county imposes 5
cents. The 2011 statewide average local option tax on gasoline and gasohol is 9.6 cents per
gallon. However, since the 5-cent increase was limited only to motor fuels, the tax rate for
diesel remains standard in all counties at 7 cents per gallon.
None of the local fuel tax sources are indexed to inflation (CPI–Urban). Thus, unlike State
motor fuel taxes, the annual inflationary cost increases in operating, maintaining, and
constructing transportation infrastructure and facilities are not generally offset through annual
inflation adjusted tax rates.
Even with the application of an indexing provision, local fuel tax revenue sources will
experience significant purchasing power erosion since rates were last adjusted in State law.
Local use fuel tax rates were last increased 19 years ago, in 1993, when the legislature
authorized the additional 1 cent to 5 cents local option tax on gasoline fuels only. Since 1993,
general inflation has increased costs by 58 percent through February 2012. The purchasing
power value of each dollar of local use fuel tax collected has declined to $0.63 in present-day
dollars.
Table 5. Local Use Fuel Taxes and Inflation
An increase of approximately 9.6 cents per gallon in local use fuel tax rates would be needed
to restore the purchasing power value to 1993 levels.
Percent
Rate
Increase
Needed
Inflation
Adjusted
Rate In
Cents/Gal
Rate
Increase
Needed In
Cents/Gal
Local Option Fuel Taxes 12.0 58% 7.9 2.9
State Fuel Excise Taxes for Local Use 4.0 58% 12.7 6.7
Combined 16.0 19 $0.63 58% 20.6 9.6
Local Use Fuel Tax Rates
Lost Purchasing Power Since 1993 Due to Inflation &
Fuel tax rates for local use were last adjusted in 1993 when an additional 5 cents local option motor fuel tax was
authorized. This table displays the inflation adjusted purchasing power of fuel tax collections in present day dollars
and the tax rate increases that would be required to restore these taxes to their 1993 purchasing power levels.
Inflation and purchasing power are calculated using the February 2012 CPI Index Level of 227.7 & the 1993 CPI
Average Annual Level of 144.5.
Rate Increases Needed to Restore Original Purchasing Power
Tax/Fee
Tax Rate
In Cents
Per Gallon
Years
Since
Last Rate
Increase
Inflation
Adjusted
Purchasing
Power of
$1.00 Today
To Restore 1993 Purchasing Power

31
In addition to lost purchasing power due to the effects of inflation, significant motor vehicle
fuel efficiency increases have resulted in significant declines in the amount of fuel consumed
per VMT and, consequently, in the amount of local government fuel tax revenues received per
VMT. The average fuel efficiency of vehicles has increased nearly 40 percent since 1991, from
16.4 mpg in 1991 to 22.7 mpg today. Based on current assumptions of the REC, fuel
efficiencies will increase an additional 10 percent to 24.4 mpg during the current decade.
While not the sole measure of transportation funding needs, VMT can be used as a reliable
general benchmark. As more vehicle miles are traveled on state highways, the funding needs
for maintenance and rehabilitation increase, as do the needs to build additional lane miles of
highway capacity and new roadway alignments to accommodate this growing traffic demand.
It is anticipated that Florida and the rest of the nation ultimately will migrate to a
transportation revenue collection system that is based in part or entirely on VMT charges in
lieu of assessing fuel taxes. However, this migration will likely require many years and
additional technology improvements to ensure reliability, reduce administrative and collection
costs, and overcome privacy concerns.
The indexing of local use fuel taxes should be considered as a minimal interim tax measure to
partially offset real dollar revenue losses used to pay for transportation costs until such time as
a more precise VMT user-fee process is implemented.

32
Revenue Option: Index Local Option Fuel Taxes
(9th Cent and 1¢–11¢ Local Option Taxes)
8-Year Total: $619 million
Annual Average: $77 million
Figure 11. Estimated Revenue Yields* from Indexing Local Option Fuel Taxes
*The MPOAC Revenue Study calculations were prepared using Florida REC data and assumptions as of
October 2011. Subsequent REC estimations may result in changes to the funding levels generated by
this option. Accordingly, the revenue estimates displayed above should be considered approximate
funding levels for the purpose of evaluating additional revenue alternatives.
$13
$29
$46
$66
$86
$106
$126
$146
$0
$20
$40
$60
$80
$100
$120
$140
$160
2012-13 2013-14 2014-15 2015-16 2016-17 2017-18 2018-19 2019-20
1.h. Index Local Option Fuel Taxes
REVENUE STUDY ADVISORY COMMITTEE

33
Revenue Option: Index State Fuel Excise Taxes for Local Use
(2¢ Constitutional, 1¢ County, 1¢ Municipal)
8-Year Total: $299 million
Annual Average: $37 million
Figure 12. Estimated Revenue Yields* from
Indexing State Fuel Taxes for Local Use
*The MPOAC Revenue Study calculations were prepared using Florida REC data and assumptions as of
October 2011. Subsequent REC estimations may result in changes to the funding levels generated by
this option. Accordingly, the revenue estimates displayed above should be considered approximate
funding levels for the purpose of evaluating additional revenue alternatives.
Increase 2-cent state motor fuel tax annually for 5 years (10 cents), indexed for
inflation
Recommendation: Increase the state motor fuel sales tax by 10 cents—2 cents per year for 5
years, indexed to the CPI.
Rationale
Implementation would raise the State Highway Fuels Sales Tax from the current rate of 12.6
cents per gallon by 2 cents per year for each of the next 5 years, for a total 10-cent increase.
This tax is currently adjusted annually by the CPI, as is the SCETS Tax, which is currently at
6.9 cents per gallon. Additional forecast revenues of approximately $183 million in 2013,
growing to $1.177 billion in 2020, would be generated for the STTF.
$6
$14
$22
$32
$41
$51
$61
$71
$0
$10
$20
$30
$40
$50
$60
$70
$80
2012-13 2013-14 2014-15 2015-16 2016-17 2017-18 2018-19 2019-20
1.g. Index Constitutional, County & Municipal Motor Fuel Taxes (4¢/gal) - $ to Local Gov'ts
REVENUE STUDY ADVISORY COMMITTEEREVENUE STUDY ADVISORY COMMITTEE

34
Discussion
A significant increase in fuel taxes is necessary to restore transportation funding to a level
needed to meet basic transportation funding requirements. This fuel tax increase is needed to
offset the continuing decline in fuel tax revenue collections, when measured in relation to the
amount of VMT. This decline is the result of significantly-improved motor vehicle fuel
efficiencies that have occurred since the existing fuel tax base rates were established in 1991
and expected additional future fuel efficiency improvements due to fleet turnover (scrapping
less efficient older vehicles and substituting more efficient new vehicles), additional auto
industry technology improvements, and pending federal fuel efficiency standards that have
been agreed to by the auto industry. With the exception of inflation indexing, the base fuel tax
rate was last adjusted in 1991. When measured per VMT, the recommended 10-cent fuel tax
increase can be justified solely to restore revenues lost due to improved fuel efficiencies from
1991 through 2020.
While motor fuel sales taxes are indeed a tax, they are also in the general sense a “user fee.”
Motorists pay these taxes on the fuel they use while driving on the state’s roads and highways.
Ultimately, Florida and the rest of the nation will likely migrate away from motor fuel taxes as
a means for raising transportation revenues to a more precise user fee that is based on VMT.
Of the various existing transportation revenue sources, motor fuel sales taxes most closely
replicate the VMT user-fee concept, with the difference being that motor fuel taxes are affected
by vehicle fuel efficiency and vehicle miles traveled, while VMT user fees are based solely on
the number of vehicle miles traveled. Accordingly, adjusting the fuel sales tax appears to be
an equitable interim method to restore revenues to meet transportation funding needs.
In recognition of the challenging economic times and to give motorists an opportunity to adjust
to the higher tax rate, it was determined that the 10-cent fuel tax increase should be phased
in, with increments of 2 cents per gallon per year over 5 years.
The State of Florida currently assesses two highway motor fuel taxes, the Highway Fuels Sales
Tax (12.6 cents per gallon, effective January 1, 2012) and the SCETS Tax (6.9 cents per
gallon, effective January 1, 2012). The revenues derived from these respective taxes are
allocated to FDOT Districts using differing statutory formulas. Both the enactment of the
SCETS Tax and the current indexing provisions for both taxes were established in 1991. Both
taxes, which are indexed to inflation (CPI–Urban), are adjusted each January 1 in accordance
with statutory formula. Thus, annual increases in the tax rates generally offset inflationary
cost increases in operating, maintaining, and constructing transportation infrastructure and
facilities. However, significant motor vehicle fuel efficiency increases have resulted in
corresponding declines in the amount of fuel consumed per VMT and, consequently, in the
amount of fuel tax revenues collected per VMT.
While not the sole measure of transportation funding needs, VMT is used as a reliable
benchmark. As more vehicle miles are traveled on state highways, funding needs for
maintenance and rehabilitation increase, as does the need to build additional lane miles of
highway capacity and new roadway alignments to accommodate growing traffic demand. The
average fuel efficiency of vehicles has increased nearly 40 percent since 1991, from 16.4 mpg
35
in 1991 to 22.7 mpg today. Stated another way, to drive 10,000 miles, the average motorist
today uses 170 fewer gallons of motor fuel (440 gallons) when compared to the average
motorist in 1991 (610 gallons); thus, the State collects less in fuel taxes.
The current REC assumes that fuel efficiencies will increase an additional 10 percent to 24.4
mpg during the current decade. Further, the pending federal fuel efficiency standards, if
adopted, could increase fuel efficiencies to nearly 28 mpg by the year 2020, reducing fuel
consumption further. By 2020, motor vehicle fuel efficiencies could increase by as much as 70
percent over the levels that existed in 1991 when the base (non-inflation adjusted) tax rates
were established for the Motor Fuels Sales and SCETS taxes. Should these additional fuel
efficiency improvements materialize, fuel taxes would need to be increased by 11.5 cents per
gallon to restore the 1991 VMT funding levels from this transportation revenue source.
The trend towards more fuel-efficient vehicles is accelerating. According to WardsAuto Fuel-
Economy Index, U.S. new light vehicles achieved record fuel-efficiency in March 2012. Cars
and light trucks sold in that month had a combined 24.1 mpg rating, a 1 percent improvement
over the record set in February and a 6 percent increase over March 2011. Small car sales
now account for 20.9 percent of new light vehicle sales. This recent acceleration in the
purchase of more fuel-efficient vehicles will likely reduce fuel tax collections from the levels
currently projected by the REC, resulting in less transportation funding at state and local
levels.
It is anticipated that Florida and the rest of the nation will ultimately migrate to a
transportation revenue collection system that is based in part or entirely on a VMT charge in
lieu of assessing fuel taxes. However, this migration will likely require many years and
additional technology improvements to ensure reliability, reduce administrative and collection
costs, and overcome privacy concerns. Thus, the increase in fuel taxes would be considered as
an interim, general user-fee tax measure to pay for transportation costs until such time that a
more precise VMT user-fee process is implemented.

36
Revenue Option: Increase State Motor Fuel Sales Tax by 10 Cents—
2 Cents per Year for 5 Years, Indexed for Inflation
8-Year Total: $6,424 million
Annual Average: $803 million
Figure 13. Estimated STTF Revenue Yields* for Fuel Tax Increase –
2 Cents per Year for 5 Years
*The MPOAC Revenue Study calculations were prepared using REC data and assumptions as of October
2011. Subsequent REC estimations may result in changes to the funding levels generated by this option.
Accordingly, the revenue estimates displayed above should be considered approximate funding levels for
the purpose of evaluating additional revenue alternatives.
Return Motor Vehicle License Fee, Initial Vehicle Registration Fee, and Titling Fee
increases to the STTF.
Recommendation: Redirect the 2009 General Revenue Motor Vehicle License Fee, Title Fee,
and Initial Registration Fee surcharges from the GR Fund to the STTF.
Rationale
This recommendation would redirect the increases in the fees that were enacted in 2009 from
the State GR Fund to the STTF. These fees historically have been dedicated to the
transportation system as a method to further the concept of user fees supporting the
transportation system. After a 20-year hiatus of fee adjustments (30 years for registration
Ten Cents Motor Fuels Tax Increase
MPOAC REVENUE STUDY
$183
$378
$588
$814
$1,052 $1,095
$1,136 $1,177
$0
$200
$400
$600
$800
$1,000
$1,200
$1,400
2012-13 2013-14 2014-15 2015-16 2016-17 2017-18 2018-19 2019-20
Two Cents Per Year For 5 Years - STTF$millions
Ten Cents State Motor Fuels Sales Tax Increase - 2 Cents Per Year For 5 Years - Indexed

37
fees), they were raised in 2009, with the incremental revenue being used to help solve the
general budget crisis due to the economic recession. With increasing pressures on
transportation funding sources, coupled with growing needs, the Florida legislature took action
in the 2012 session to restore a portion of these traditional STTF funds. While most Title Fees
will be remitted to the STTF, yielding about $200 million per year to the STTF beginning in FY
2014, the Motor Vehicle License (MVL) Fee and Surcharge increases along with the Initial
Registration Fee increase are recommended to be returned as well. The annual estimated
revenue impact to the STTF is $413 million.
Discussion
In the past, MVL Fees, Title Fees, and Initial Registration Fees were considered to be
transportation funding sources. However, the base MVL Fees had remained unchanged for
nearly 30 years (since 1983). Likewise, Title Fees and Initial Registration Fees remained static
for over 20 years (since 1990 and 1991). These fees and associated surcharges were
increased substantially by the 2009 legislature; however, the revenues from these fee
increases were distributed primarily to the GR Fund rather than the STTF. This action was
taken to partially offset significant revenue declines from traditional GR tax sources as a result
of the serious economic downturn. However, as general economic conditions return to more
normal levels, these fee increases and surcharges should be distributed to the STTF to restore
a portion of the inflation adjusted purchasing power that has been lost over the last 20 to 30
years. The 2012 legislature began this process by redirecting most of the Title Fee increases
capped at $200 million per year to be used for specific transportation purposes beginning in FY
2013/14.
Title Fees
The State issues titles or certificates of ownership for each vehicle registered in the state. The
Title Fee prior to 2009 was set at $24, except for “for hire” vehicles, where the Title Fee was
set at $3. An amount equal to $21 of each applicable Title Fee was distributed to the STTF
with the balance deposited into the GR Fund. In 2009, all vehicle Title Fees were increased $46
each to $70 per vehicle and $49 for “for hire” vehicles. In 2012, the Florida legislature
amended s. 319.32, F.S., to distribute an additional $47 of each Title Fee, except for “for hire”
vehicles, to the STTF. In the first year (FY 2012/13), these proceeds must be returned to the
GR Fund. Thereafter, all proceeds in excess of $200 million per year must be returned to the
GR Fund. The $200 million is allocated as follows: $10 million per year for 30 years to a
Seaport Investment Program, $35 million per year for 30 years to Florida’s Turnpike Enterprise
to fund projects that will create or facilitate access to the existing turnpike system, $10 million
to the Transportation Disadvantaged Trust Fund, $10 million to the Small County Outreach
Program, and, the remainder to be used “… annually for transportation projects within this
state for existing or planned strategic transportation projects which connect major markets
within this state or between this state and other states, which focus on job creation, and which
increase this state’s viability in the national and global markets.”
MVL Fees
Currently, the State assesses MVL fees (license taxes) at varying rates for automobiles, trucks,
motorcycles, trailers, and special-purpose vehicles. These rates vary from $3.50 for a small
private-use trailer under 500 lbs to $1,322 for a heavy truck weighing 72,000 lbs or more.

38
The rate differentials are generally based on vehicle weight. This methodology is consistent
with various studies that have shown that heavy vehicles result in considerably greater outlays
for roadway maintenance and rehabilitation than light-weight vehicles. In 2009, s. 320.08,
F.S., was amended to increase the annual MVL license taxes by 35 percent, with the additional
revenue deposited into the GR Fund. The increase varied depending on the current flat rate
based on the weight of the vehicle.
Table 6. Florida Vehicle Fee Charges
MVL Surcharges
In addition, the State imposes a number of surcharges on top of MVL base fee rates. These
consist of a $4 surcharge on all MVL fees (320.0804, F.S.), a $5.50 surcharge on all MVL fees
(320.08046, F.S.), and, a $10 additional surcharge on commercial vehicles having a gross
vehicle weight of 10,000 pounds or more (320.0801, F.S.). Currently, the combined annual
surcharges are $19.50 on commercial vehicles having a gross vehicle weight of 10,000 pounds
and $9.50 for all other vehicles. Prior to the 2009 legislative changes, these MVL surcharges
totaled $8 for commercial vehicles over 10,000 lbs and $3 for all other vehicles, with all funds
distributed to the STTF except for $0.58 to the GR Fund and $0.42 to the Department of
Prior
Rate
Revised
Rate
Rate
Increase Percent
Motor Vehicle License Fees - Automobiles
Net weight less than 2500 lbs $14.50 $19.50 $5.00 34%
Net weight of 2500 lbs less than 3500 lbs $22.50 $30.50 $8.00 36%
3500 pounds or more $32.50 $44.00 $11.50 35%
Motor Vehicle License Fees - Trucks
Net weight less than 2000 lbs $14.50 $19.50 $5.00 34%
Net weight of 2000 lbs less than 3000 lbs $22.50 $30.50 $8.00 36%
3000 pounds or more less than 5000 lbs $32.50 $44.00 $11.50 35%
Motor Vehicle License Fees - Heavy Trucks
5001 to 5999 lbs $45.00 $60.75 $15.75 35%
6000 to 7999 lbs $65.00 $87.75 $22.75 35%
8000 to 9999 $76.00 $103.00 $27.00 36%
10,000 to 14,999 lbs $87.00 $118.00 $31.00 36%
15,000 to 19,999 lbs $131.00 $177.00 $46.00 35%
20,000 to 26,000 lbs $186.00 $251.00 $65.00 35%
44,000 to 54,999 lbs $572.00 $773.00 $201.00 35%
72,000 lbs or more $979.00 $1,322.00 $343.00 35%
Initial Vehicle Registation Fee $125.00 $225.00 $100.00 80%
Title Fee $24.00 $70.00 $46.00 192%
2009 Vehicle Fee Surcharges
State of Florida
Fee
All Fee Increases Dedicated to Highway Safety & General Revenue Funds

39
Juvenile Justice. In 2009, MVL surcharges were increased by a combined $11.50 for
commercial vehicles over 10,000 lbs and $6.50 for all other vehicles. With the exception of a
$0.58 increase (to $1) distributed to the Department of Juvenile Justice, the revenues
generated from these surcharge increases were deposited into the GR Fund.
Initial Application for Motor Vehicle Registration Fee The State assesses, with certain exemptions, an additional Initial Vehicle Registration Fee for
the registration of each additional vehicle in Florida (s. 320.072, F.S.). This fee is $225, with
$125 distributed to the GR Fund and $100 to the STTF. Prior to 2009, the fee totaled $100, all
of which was distributed to the STTF.
2009 Vehicle Fee Rate and Surcharge Increases With Florida’s economy struggling and State general revenue collections in decline, the 2009
Florida legislature imposed surcharges and rate increases on various motor vehicle fees. The
additional proceeds were primarily distributed to the GR Fund or the Highway Safety and
Operating Trust Fund. These fee and surcharge increases included Title Fees, MVL Fees, Initial
Vehicle Registration Fees, driver’s license fees, and various other administrative and
transaction charges.
Table 7. Distribution of Revenues from 2009 Motor Vehicle Fee Increases
Total revenue to the GR Fund from all 2009 fee increases, including driver’s license fees,
increased $841.3 million (677%) between FY 2008/09 (prior to rate increases) and FY 2010/11
2008-09 2010-11 Diff % Change
GR 124.2$ 965.5$ 841.3$ 677.4%
HSOTF 226.4$ 351.8$ 125.4$ 55.4%
STTF 701.6$ 665.9$ (35.7)$ -5.1%
TDTF 19.7$ 20.1$ 0.4$ 2.0%
DOETF 119.2$ 121.2$ 2.0$ 1.7%
Other 191.5$ 82.4$ (109.1)$ -57.0%
Total 1,382.6$ 2,206.9$ 824.3$ 59.6%
Compares full fiscal years before and after implementation
Source: Highway Safety Revenue Estimating Conference
Funds:
1. GR – General Revenue
2. HSOTF – Highway Safety Operating Trust Fund
3. STTF – State Transportation Trust Fund
4. TDTF – Transportation Disadvantaged Trust Fund
5. DOETF – Department of Education Trust Fund
Approximate Impact of 2009 Legislation
Motor Vehicle License and Fee Revenue Distributions
6. Other Funds – Roll up of all other revenues collected by DHSMV and
distributed to funds other than those specifically l isted

40
(the first full year after rate increases). Distributions to the STTF during this same period of
time experienced a $35.7 million (5.1%) decline.
Historically, with the exception of a portion of MVL Fees that is dedicated to education funding
pursuant to the State Constitution and the $1 surcharge shared between the GR Fund and the
Department of Juvenile Justice, the fees and surcharges assessed on vehicle purchases and
registrations have been considered transportation user fees and have been distributed to the
STTF for the purpose of maintaining and improving the transportation systems used by these
vehicles. However, due to the economic recession and substantial downturn in the Florida’s
general revenue collections, coupled with the fact that these fees had not been adjusted for
inflation for many years, the fees and surcharges were increased, and the additional revenue
was dedicated to general government purposes.
Anticipated Impact of Fuel Efficient Vehicle Purchases on MVL Fees
MVL Fees are assessed based on vehicle weight. Changes in the mix of motor vehicles towards
lighter-weight vehicles with lower annual MVL Fees will have an added impact on
transportation revenue collections. Federal fuel-efficiency standards and higher fuels prices
are encouraging the development and sale of lighter-weight vehicles. In 2009, the private
vehicle fleet consisted of 7 percent light autos ($19.50), 44 percent medium autos ($30.50),
34 percent heavy autos ($44.00), and 15 percent light trucks (trucks and autos have the same
weight classifications and fees). MVL revenue collections will likely decline as the mix of
vehicles trends towards the lower weight classifications.
Lost Purchasing Power
Prior to the 2009 rate changes, MVL Fee base rates were last increased in 1983 and in 1992
when a $2.00 surcharge was added. Since 1983, general inflation costs as measured by the
CPI-U have increased by 127 percent, while the 1992 surcharge increased the revenue
collected on each vehicle registration by roughly 10 percent. Thus, today’s purchasing power
for each MVL Fee is less than one-half the level in 1983.
The current Title Fee rate is $70. In 2009, the Florida legislature increased the Title Fee by
$46, a 192 percent rate increase. The current Initial Vehicle Registration fee rate is $225. This
fee was increased in 2009 by $125, a 125 percent increase. As with MVL Fees, the proceeds
from these rate increases are deposited in the GR Fund. While the STTF share of Title Fees
($21) has not changed since 1991, inflation has increased by 67 percent. Its share of the
Initial Registration Fee is $100 and represents a 54 percent increase since 1990. In contrast,
the CPI-U inflation index from 1990 through February 2012 has increased 74 percent.
From the perspective of the fee payer, the inflation-adjusted cost of MVL Fees continues to be
substantially less than in 1983, when the fee was last increased prior to 2009. However, both
the Initial Vehicle Registration and Title Fee increases in 2009 were greater than the
inflationary increases since their rates were last adjusted.
In all instances, the STTF’s share of fee rate adjustments has not keep up with the rate of
inflation or transportation costs. Thus, the purchasing power value of these fees in terms of
maintaining and improving the state transportation system has declined.
41
As with motor fuel taxes, vehicle fees are, in a general sense, a user fee. Vehicles are generally
purchased to be used on the state’s roadways, and vehicle fees are assessed to pay for a portion of
the costs of maintaining and expanding the state’s transportation systems.
Transportation revenues have increased over time in conjunction with the increase in the
number of motor vehicles registered and titled in the state. However, the STTF share of these
fees has not increased. Thus, while revenues have increased with the growth in the total
number of vehicles registered in the state, the purchasing power of transportation revenue
derived from each fee has declined due to the effects of inflation. These circumstances have
been a significant factor contributing to the state’s growing transportation funding shortfall and
resultant increases in traffic congestion. The combined result is that the STTF today receives
only 53 cents in purchasing power for each dollar in transportation fees when adjusted for
inflation since the base rate for each fee was last increased.
Given the inflation-adjusted lost purchasing power of the transportation share of MVL fees over
the last three decades and the growing backlog of transportation needs occurring, in part, due
to this circumstance, it would be appropriate public policy to transfer the GR surcharges to the
STTF once the current economic crisis has passed.

42
Revenue Option: Redirect Remaining 2009 General Revenue Motor Vehicle License
Tax, Title Fee, Initial Registration Fee, and Surcharges to the STTF
8-Year Total: $3,301 million
Annual Average: $413 million
Figure 14. Estimated STTF Revenue Yield* – Return of Fees from
General Revenue Fund
*The MPOAC Revenue Study calculations were prepared using Florida REC data and assumptions as of
October 2011. Subsequent REC estimations may result in changes to the funding levels generated by
this option. Accordingly, the revenue estimates displayed above should be considered approximate
funding levels for the purpose of evaluating additional revenue alternatives.
Conduct a VMT study4
Recommendation: Conduct a VMT study and develop a “user-fee business plan” to guide the
implementation of a mileage-based transportation funding mechanism.
4 Board Meeting action on July 16, 2012 precluded the use of GPS technology in the tracking of VMT
$252 $257 $263 $271 $278 $285 $291 $297
$106 $112 $117 $122 $126 $127 $127 $130$0 $6$12 $18 $24 $25 $26 $31
($358) ($375) ($392) ($411) ($428) ($437) ($444) ($457)
$358 $375 $392 $411 $428 $437 $444 $457
-$600
-$400
-$200
$0
$200
$400
$600
2012-13 2013-14 2014-15 2015-16 2016-17 2017-18 2018-19 2019-20
Return Transportation Fees to STTFIn $ millions
MVL Fees & Surcharges Initial Registration Fee Title Fee
All Fees GR All Fees STTF
MPOAC REVENUE STUDY

43
Rationale
This recommendation is to have the Florida legislature commission and fund an extensive
effort to deal with the systemic issues of fuel taxes becoming less sustainable as a primary
surrogate for a transportation user fee. While fuel taxes served as an adequate substitute for
a true user fee for decades, significant increases in mandated vehicle fuel efficiency and the
introduction of all-electric and plug-in hybrid vehicles is eroding transportation revenues.
It is recognized that there are significant concerns over the concept of charging highway
system users based on each mile traveled. These include the privacy of citizens, the cost of
implementing such a system, and institutional issues associated with revenue sharing. This
effort is intended to address these issues at a minimum, deploy a demonstration of the
concept, and develop a business plan and implementation roadmap to move Florida to a VMT-
based system.
Discussion VMT charges are considered by many economists to be the fairest and most equitable method
of paying for transportation services, since the payment (charge per vehicle mile traveled) is
directly matched to the benefit (miles traveled on the transportation system). Further, the
current system of revenue collection for transportation purposes is no longer viable as a stable
source of generating revenues commensurate with the cost of providing transportation services
and improvements.
As one of the Sunbelt states, Florida has experienced fairly recent and rapid growth in its
population and even faster VMT growth, much of which occurred after the original Interstate
Highway System network was established. This has placed continuous pressure on Florida’s
elected officials to find revenue sources and develop financing strategies to accommodate
ever-increasing transportation demand levels.
VMT reflects the demand for transportation capacity and, as such, is a reasonable high-level
indicator of statewide changes in demand for transportation funding. As VMT increases, the
State must either invest more in transportation resources to increase capacity to accommodate
this increased demand, implement traffic management techniques, or accept the economic and
social consequences of degraded transportation services.
Transportation revenues have experienced a significant deterioration in purchasing power and
in their ability to meet ongoing needs due to motor vehicle efficiency improvements and higher
motor fuel prices, which encourage the migration to more efficient, lighter-weight vehicles.
These trends are expected to accelerate in the future with the continued erosion of purchasing
power from non-inflation adjusted revenue sources, the adoption of additional motor vehicle
efficiency technologies and lighter-weight materials, and the greater acceptance of alternative
fuel vehicles such as compressed natural gas (CNG), primarily in fleet-ownership; liquid natural
gas (LNG) for long-haul trucking in lieu of diesel fuel; and both plug-in hybrids and eventually
all-electric or battery-electric vehicles that use centrally-generated electricity in lieu of motor
fuels for all or a portion of their vehicle miles traveled fuel needs.

44
As stated in a recent report prepared by the Reason Foundation:
Legislators should become familiar with the emerging “managed lanes network”
in Southeast Florida, being developed incrementally by FDOT, MDX and FTE.
Details of how this network should be governed and managed are under study,
thanks to a Federal Highway Administration grant, under its Value Pricing
Program, to FDOT District 6. Such networks offer great potential for congestion
relief and region-wide express-bus/bus rapid transit in urban areas, and may be
worth considering for Florida’s other large urban areas in coming years. Managed
lanes and urban toll expressways should be considered building blocks toward
future highway finance based largely on miles traveled, rather than fuel
consumed, as the fuel tax declines as a sustainable funding source.
Figure 15. Florida Vehicle Miles and Inflation Projections
Deficiencies with Current Transportation Tax Revenue Collection System
As is discussed throughout this report, transportation revenues from Florida’s existing tax and
fee collection systems are failing to keep pace with increased costs and increased
infrastructure needs. Furthermore, current trends point to the acceleration of these trends.
More than 60 percent of State transportation revenues are derived from taxes on motor fuels.
However, as vehicles become more efficient, less fuel is consumed and less fuel taxes are
collected. The fuel efficiency of Florida’s motor vehicle fleet has increased 28 percent over the
40%
32%
85%
0%
10%
20%
30%
40%
50%
60%
70%
80%
90%
100%
Per
cen
t In
crea
se
Vehicle Miles (VMT) Inflation (CPI) Revenue Needed (VMT x Inflation)
45
past two decades as the result of such things as ongoing advances in vehicle aerodynamics,
internal combustion engine technologies, rolling resistance of tires, use of lighter-weight
materials, and the development of hybrid vehicles.
The various motor vehicle-related fees and taxes are not indexed to offset the effects of
inflation; thus, the purchasing power of these revenue sources declines over time. Further,
since motor vehicle license fees are primarily weight-based fees, the trend towards lighter-
weight vehicles will result in declining revenues from this source unless current schedules are
altered.
These trends are expected to accelerate in the future with continued efficiency advances in
new vehicles, as today’s older, less efficient vehicles are replaced by these more efficient new
vehicles and with the expected transition to vehicles that operate on alternative fuels, such as
partially electric (plug-in hybrids), all-electric, and CNG.
The proposed changes to the federal fuel efficiency standards that would require fleet vehicle
efficiencies to average 53.5 mpg on vehicles sold by 2025 could potentially double existing
vehicle fuel efficiencies over time, cutting in half the fuel tax revenues collected per vehicle
mile traveled.
Equity and Fairness
Florida’s existing transportation tax and fee structure generally follows a “user-benefit”
concept, in that most transportation revenues are paid by motorists through taxes on motor
fuels or various fees related to the purchase and registration of motor vehicles. While this
structure is equitable in the general sense that the costs of transportation are paid for by
transportation-related taxes and fees, it is less equitable from the standpoint of the individual
user. For example, an individual who drives a highly-efficient vehicle will consume less fuel
per mile traveled and, accordingly, contribute less in fuel taxes to pay for transportation costs.
While such an outcome may be considered appropriate public policy from the standpoint of
encouraging reduced fuel consumption through marginally increasing the cost of fuel for
inefficient vehicles, it is not as equitable as a VMT system from a user-benefit standpoint,
where both motorists would pay the same amount for using the state’s roads and highways.
These inequities may also have social considerations: while new vehicles generally provide
greater fuel efficiencies, many low-income individuals, by necessity, own older vehicles that
are less fuel efficient and, thus, more costly to operate.
Existing Florida VMT-Like Revenue Collection Systems (Tolls & Managed Lanes)
Florida currently operates two modes of transportation revenue collection that are, in essence,
VMT pricing systems:
Toll collection, where the motorist pays for the cost of the roadway based primarily on
distance traveled and frequency of usage.

46
Interstate Highway System managed lanes, such as I-95 in South Florida, where
variable per-mile fees are charged based on the level of traffic congestion on “non-
tolled” lanes.
Due to Florida’s extensive system of toll facilities and its leadership role in managed lanes,
Florida motorists have acquired a level of acceptance with mileage-based transportation fees.
Transportation Revenues from Tolls and Managed Lanes – VMT tolling has proven to be a
viable means of generating transportation revenues. The state’s toll agencies currently collect
in excess of $1.2 billion annually, an amount that is equivalent to the revenue that would be
collected from nearly 13 cents in motor fuel sales taxes. In fact, toll revenues and toll-backed
revenue bonds have contributed significantly in addressing the state’s transportation
infrastructure needs, helping to partially offset the existing deficiencies in the current
transportation revenue collection system. Revenues collected from VMT-like tolled and
managed lane facilities have grown more rapidly that other state transportation revenue
sources.
Toll collections are tied to vehicle miles traveled, and toll rates are frequently adjusted in line
with increases in inflation. VMT-like tolls have generally out-performed fuel tax collections and
vehicle licenses and fees in keeping up with the state’s transportation revenue needs. In fact,
toll revenue collections have exceeded the combined effects of VMT growth and inflation and
have played an important role in partially offsetting the inability of fuel taxes and license fees
to keep up with growing transportation needs and higher costs.
Based on the State’s experience to date with VMT-like toll revenue collection, it would appear
that the migration towards a broader VMT revenue collection system would be warranted,
particularly one that is indexed to accommodate inflationary price increases. According to the
REC, motor fuel tax collections are projected to significantly underperform the expected growth
in future vehicle miles traveled as Florida’s economy recovers and as motorists adjust to higher
fuel prices by purchasing more efficient vehicles.
All Electronic Toll (AET) Collection – Florida’s toll agencies have taken a leadership role in
converting their facilities from using traditional toll collection methods to AET. As a result of
this process, many of the disadvantages of collecting revenue based on a per-vehicle-mile-
traveled basis are eliminated. Under AET, toll booths are not used to collect tolls; rather, the
motorist’s system usage and corresponding toll charge data are collected either electronically
via transponders or through video photos of vehicle license plates. Revenue is collected from
customers via monthly billings, credit card charges, or replenished accounts. AET provides
motorists with a travel experience on a tolled facility identical to that on a non-tolled highway.
Many of the public policy, administrative, and enforcement issues related to electronic and
video collection methods are similar to those issues that the State must address in
implementing a more comprehensive VMT revenue collection system statewide. Since these
issues have, in good part, been evaluated, debated, and codified into State statute, this
transition from traditional toll collection to AET should, in many ways, serve as a stepping
stone towards toward the adoption of a VMT revenue collection system in some broader form.

47
In many respects, Florida may have a head start in developing a statewide VMT revenue
collection system and in working through the many public policy considerations that such a
system entails.
Figure 16. Growth Rates of Tolls, Fuel Taxes, and Fees
Implementation Planning
An ultimate VMT revenue collection methodology will likely be national in scope and may take
many years to implement. However, the transition to VMT charges also will likely be
incremental in nature as each State addresses various public policy issues related to privacy
concerns, costs of administration, and public acceptance. Further, each state will need to
develop state-specific policies in a number of areas, such as the distribution of funds between
state and local governments and transportation agencies; congestion management pricing
alternatives; establishing rate structures for various vehicle types and weights and for various
transportation systems and facilities; establishing appropriate inflationary cost rate adjustment
mechanisms; ensuring efficient administration and overhead processes; developing revenue
collection enforcement measures; and other considerations.
Approximate VMT Rates
The REC projects that motorists will travel approximately 200 billion miles on Florida’s
highways, roads, and streets in FY 2012/13. Therefore, a 1-cent-per-mile VMT charge, if
assessed on all vehicle miles traveled in the state, would generate $2 billion. State
transportation revenue collections from all sources for FY 2012/13 are projected to total $2.78
108%
62%
21%
0%
20%
40%
60%
80%
100%
120%
98/99 99/00 00/01 01/02 02/03 03/04 04/05 05/06 06/07 07/08 08/09 09/10
Tolls Are Growing Faster than State Transportation RevenuesPercent Growth from 1999 to 2010
Tolls
State Fuel Taxes
Vehicle Licenses & Fees

48
billion, with revenues for state motor fuel taxes equal to $1.79 billion. Thus, if applied to all
vehicle travel, a VMT charge of 1.39 cents per mile would be needed to substitute for all
current revenue sources, and a charge of 0.89 cents per mile would be required to offset motor
fuel tax collections. A VMT charge of roughly 2 cents per mile would be equal to the sum of all
state transportation revenues and all local highway fuel taxes. As with current fuel tax rates,
the annual VMT rate would need to be indexed to preserve future purchasing power.
Figure 17. REC Projections – Percent Change VMT,
Fuel Efficiency, and Motor Fuel Use
-1.0%
3.2%
3.8%
4.3%4.6%
4.2%
4.1%
3.9% 4.0%
1.6%2.7%
2.6%3.0%
3.5%
4.5%4.8%
5.3%
-2.6%
0.4%
1.1% 1.2% 1.0%
0.2%
-0.4%-0.9%
-1.3%
-3.5%
-2.5%
-1.5%
-0.5%
0.5%
1.5%
2.5%
3.5%
4.5%
5.5%
11/12 12/13 13/14 14/15 15/16 16/17 17/18 18/19 19/20
Vehicle Miles (VMT) Fuel Efficiency Motor Fuel Use

49
Table 8. Estimated VMT Rate in Lieu of Existing Revenue Sources
It is recommended that the legislature authorize and appropriate funds to study, evaluate, and
develop a business plan for the implementation of a VMT-based transportation revenue
collection system for the State of Florida, overseen by the appropriate State entity and using
appropriate professional expertise.
The State’s current VMT-like activities, as well as prospective approaches for statewide
implementation, should be evaluated with the objective of developing a business plan to guide
in the implementation of mileage based transportation funding mechanism(s) within the state.
2012-13
Total Florida VMT (In millions of miles traveled) 200,728
Total Gross Revenue From $0.01 Per Mile VMT Rate ($ Millions) 2,007.3$
A. Total State Transportation Tax Revenue to STTF - All Sources 2,780.1$
Equivalent Per-Mile VMT Rate 0.014$
B. Motor Fuel Taxes Only to STTF 1,789.1$
Equivalent Per-Mile VMT Rate 0.009$
C. Total Local Motor Fuel Taxes - estimated* 1,132.7$
Equivalent Per-Mile VMT Rate 0.006$
Equivalent Per-Mile VMT Rates
Rates Needed In Lieu of Existing Revenue Sources
* "Total Local Motor Fuel Taxes" includes the four cents Consitutional, County and
Municipal fuel taxes assessed by the State and distributed to local goverments.

50
51
V. Other Revenue Options for Consideration
While the MPOAC recommended the options described in the previous chapter be considered as
soon as possible, they also directed that information on the eight revenue options included in
this section also be forwarded to policy makers.
Impose a 6% state sales tax in lieu of both state fuel taxes, with a “floor”
Recommendation: Impose a 6% state sales tax on motor fuels in lieu of both the Motor Fuel
Sales Tax and SCETS Tax and retain the existing state motor fuels and SCETS tax mechanisms
to serve as a floor.
Rationale
The State Highway Fuels Sales Tax and the SCETS cents-per-gallon taxes would be replaced
with a simple 6% sales tax on the retail price of motor fuels. FDOT research has shown that
Floridians believe that the fuel taxes they pay increase as the cost of motor fuel increases. This
option examined the implications of establishing a percentage-based state motor fuel tax. The
issue with this approach is that retail fuel prices inherently fluctuate, and revenue forecasting
would become problematic as would revenue collection. Huge windfalls could occur in times of
rapidly-rising pump prices, and the STTF could be cash-starved when prices fall. To protect
the STTF from dramatic declines, this option requires a “floor” to be established that is based
on the current tax along with indexing provisions. Based on the economic forecasts used at the
time of the MPOAC study, this recommendation could generate an estimated additional $136
million per year, but according to the October 2011 State projections, it wanes as the existing
fuel sales tax and SCETS tax adjust upwards because of future inflation and the associated CPI
adjustments that would take place. Actual additional revenue collections would be dependent
on the future price of motor fuels and, therefore, highly variable.
Present Situation The State assesses two fuel sales taxes on motor fuels, the Motor Fuel Sales Tax and the
SCETS Tax, both of which are adjusted annually based on changes in the CPI (CPI–U).
Motor Fuel Sales Tax
The State's fuel taxes were substantially restructured in 1983, when a 4-cents-per-gallon
excise tax was replaced by the State’s general sales tax of 5 percent. The 1983 legislated
average price of all motor and special fuel was initially set using $1.148 per gallon as the price
of fuel, which, at the 5 percent general sales tax rate, resulted in a fuel tax of 5.7 cents per
gallon.
In 1985, the Florida legislature installed a "floor" beneath this tax, thereby preventing it from
falling below its initially calculated level of 5.7 cents per gallon, regardless of downward gas
price movements. The 1990 legislature made several changes to the sales tax and, effective
January 1, 1991, raised the rate of the tax to 6 percent from 5 percent in keeping with the
increase to the state general sales tax rate and adjusted the “floor” from 5.7 cents per gallon
to 6.9 cents per gallon, thereby regaining parity with the state's general sales tax rate.
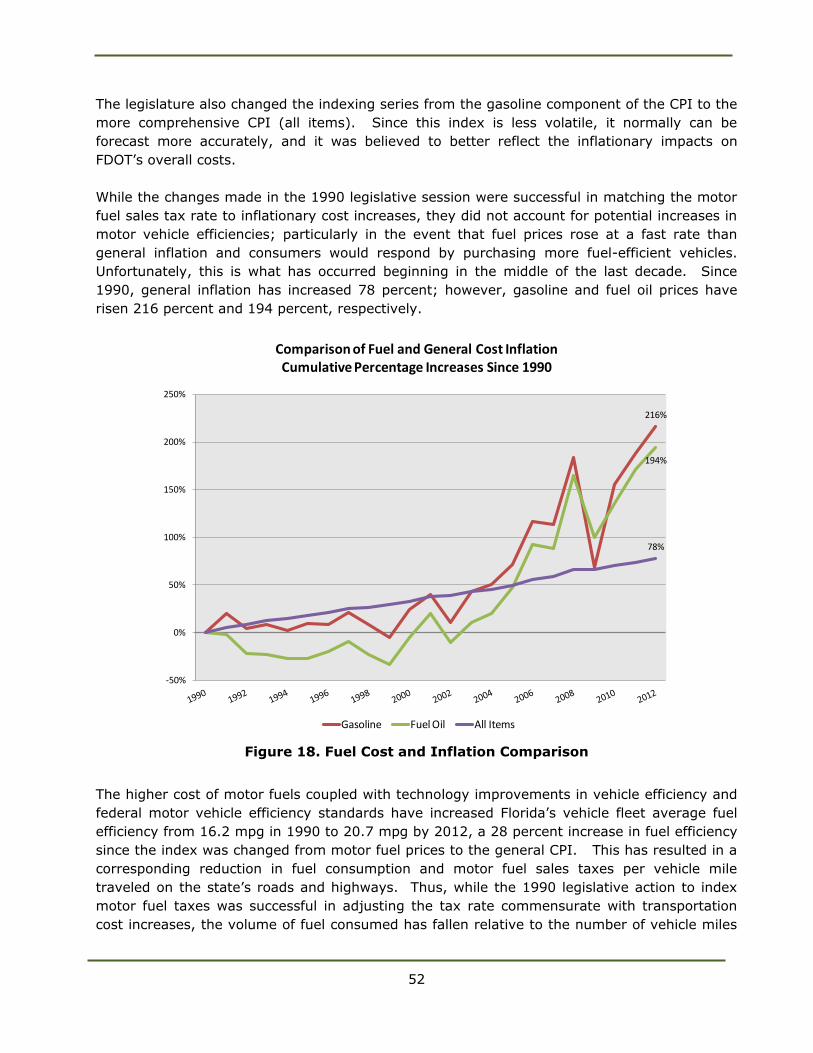
52
The legislature also changed the indexing series from the gasoline component of the CPI to the
more comprehensive CPI (all items). Since this index is less volatile, it normally can be
forecast more accurately, and it was believed to better reflect the inflationary impacts on
FDOT’s overall costs.
While the changes made in the 1990 legislative session were successful in matching the motor
fuel sales tax rate to inflationary cost increases, they did not account for potential increases in
motor vehicle efficiencies; particularly in the event that fuel prices rose at a fast rate than
general inflation and consumers would respond by purchasing more fuel-efficient vehicles.
Unfortunately, this is what has occurred beginning in the middle of the last decade. Since
1990, general inflation has increased 78 percent; however, gasoline and fuel oil prices have
risen 216 percent and 194 percent, respectively.
Figure 18. Fuel Cost and Inflation Comparison
The higher cost of motor fuels coupled with technology improvements in vehicle efficiency and
federal motor vehicle efficiency standards have increased Florida’s vehicle fleet average fuel
efficiency from 16.2 mpg in 1990 to 20.7 mpg by 2012, a 28 percent increase in fuel efficiency
since the index was changed from motor fuel prices to the general CPI. This has resulted in a
corresponding reduction in fuel consumption and motor fuel sales taxes per vehicle mile
traveled on the state’s roads and highways. Thus, while the 1990 legislative action to index
motor fuel taxes was successful in adjusting the tax rate commensurate with transportation
cost increases, the volume of fuel consumed has fallen relative to the number of vehicle miles
216%
194%
78%
-50%
0%
50%
100%
150%
200%
250%
Comparison of Fuel and General Cost InflationCumulative Percentage Increases Since 1990
Gasoline Fuel Oil All Items

53
traveled and, accordingly, motor fuel tax revenues have not kept up with transportation
funding demands.
The current Motor Fuel Sales Tax rate for calendar year 2012 is 12.6 cents per gallon. This is
an increase of 5.7 cents per gallon over the 1990 base rate of 6.9 cents per gallon, and it
reflects the cumulative impact of CPI indexing adjustments since 1991. Since motor fuel
prices have increased at a much faster rate than general inflation, the Motor Fuel Sales Tax
rate no longer corresponds to the State's 6 percent general sales tax rate. The current Motor
Fuel Sales Tax rate for calendar year 2012 is equal to a sales tax rate of 3.5 percent, using the
October 2011 REC assumption for the average Florida pump price per gallon of $3.63. An
additional tax increase of approximately 9.0 cents per gallon would be needed to restore the
Motor Fuel Sales Tax to its original 6 percent rate on the price of motor fuels.
SCETS Tax
The 1990 Florida legislature, in addition to raising the fuel sales tax rate, also levied an
additional excise tax, the SCETS Tax, on all highway fuels, effective January 1, 1991. The
SCETS tax differs from the Motor Fuel Sales Tax in that its proceeds must be spent in the FDOT
transportation district in which it was collected and, to the extent feasible, in the county from
which it was collected. The rate of the tax on gasoline varied by county and was initially set at
2/3 of the total local option fuel tax rate that existed in each county, not to exceed 4 cents per
gallon. Thus, the SCETS tax is set at the maximum rate in any county that assesses a local
option fuel tax of 6 cents per gallon or more.
Currently, every county is at the maximum SCETS tax rate with the exception of one, which
assesses 5 cents per gallon in local option fuel taxes. For consistency purposes in
administering the diesel fuel use tax provisions of the International Fuel Tax Agreement, the
SCETS tax on diesel fuel is imposed at the maximum rate in all Florida counties. Like the
Motor Fuel Sales Tax, the SCETS Tax is indexed to the general rate of inflation (CPI–All). The
SCETS Tax rate on gasoline is currently 6.9 cents per gallon, with the exception of one county,
which is at 5.8 cents per gallon. The diesel rate is 6.9 cents per gallon in all counties.
Similar to the Motor Fuel Sales Tax, revenues derived from the SCETS Tax relative to vehicle
miles traveled (transportation demand) have declined over time due to greater fuel efficiencies
in the state’s vehicle fleet, resulting in fewer gallons of motor fuel purchased per vehicle mile
of travel.
It is anticipated that Motor Fuel Sales and SCETS tax revenues relative to vehicle miles
traveled will continue to decline as a result of expected continuing high fuel costs, as motorists
replace existing vehicles with more fuel efficient models and as further technology
improvements and new federal CAFÉ standards drive additional fuel efficiencies. As a result,
the capacity for Motor Fuel Sales and SCETS tax revenues to adequately fund the demand for
future transportation maintenance and improvement needs will continue to erode unless the
tax rates are increased or structural changes made to the current transportation taxation
system.
Originally, the Motor Fuel Sales Tax was enacted to mirror the 6 percent state general sales
tax, and the SCETS Tax was assessed over and above this amount to enhance the state’s

54
transportation system. The above recommendation combines the Motor Fuel Sales and SCETS
taxes for purposes of assessing the 6 percent general state sales tax rate against the price of
motor fuels. This recommendation would help to offset the reductions in tax revenue
collections that have resulted from vehicle fuel efficiency improvements. Shifting from the
current CPI adjusted fuel sales tax to a 6 percent sales tax would increase the current fuel tax
rates when fuel prices exceed approximately $3.20 per gallon. It is recommended that the
existing CPI-adjusted tax mechanisms should be retained in law as a “floor” to protect against
declining revenues in the event fuel prices fall below this amount. Surveys have indicated that
most consumers already believe motor fuels are already subject to a 6 percent state sales tax
on the price of motor fuels.
Revenue Option: Apply 6 Percent State Sales Tax in Lieu of
Existing State Fuel Sales and SCETS Taxes; Use Existing Tax Rates as a “Floor”
8-Year Total: $1,087 million
Annual Average: $136 million
Figure 19. Estimated STTF Revenue Yield* – Replace Existing Fuel Tax Rates with 6% Sales Tax
*The MPOAC Revenue Study calculations were prepared using Florida REC data and assumptions as of
October 2011. Subsequent REC estimations may result in changes to the funding levels generated by
this option. Accordingly, the revenue estimates displayed above should be considered approximate
funding levels for the purpose of evaluating additional revenue alternatives.
$69
$101
$128
$145$150
$140
$115
$46
$0
$20
$40
$60
$80
$100
$120
$140
$160
2012-13 2013-14 2014-15 2015-16 2016-17 2017-18 2018-19 2019-20
State Sales Tax with Existing Fuel Tax Rates as a "Floor” Net Revenue – In $ millions
6.b 6% Sales Tax to Replace Motor Fuel Sales & SCETS Taxes
MPOAC REVENUE STUDY

55
Create an independent State Toll Rate-Setting Commission to study, evaluate, and
establish toll rates for State-owned toll facilities
Recommendation: Create an independent State Toll Rate-Setting Commission to study,
evaluate, and establish toll rates for State-owned toll facilities based upon criteria established
by the governor and the Florida legislature. The Florida Transportation Commission (FTC)
could serve at the State Toll Rate-Setting Commission in Florida.
Rationale This recommendation is not a revenue generation action per se, but could result in more
market-based toll rates being established for State toll facilities. The research conducted for
the revenue study indicates that toll facilities operated by the State are underpriced when
compared to those under the management of local expressway authorities, particularly in
Florida’s urban areas. This recommendation would legislatively charge the FTC as the
independent state toll rate-setting body to study, evaluate, and establish toll rates for State-
owned facilities based on criteria established by the governor and the Florida legislature. This
is a policy recommendation with no estimated revenue forecasts.
Discussion The State of Florida presently owns and operates the Florida Turnpike system and four
additional tolled facilities: Pinellas Parkway, Beachline East, Alligator Alley, and Sunshine
Skyway Bridge. The tolls on many of these State-owned facilities are significantly lower than
the rates established for similar facilities in Florida. As a result, the financial capacity of many
of these facilities may be underused.
Table 9. Florida Toll Rates per Mile
Due to restricted toll rate-setting policies and the resulting limitation on toll revenues, toll
agencies have not developed new projects and capacity expansions as rapidly as needed or as
could be accomplished using market-based toll rates. Florida’s toll agency long range
transportation plans and studies have identified nearly $30 billion in potential projects that are
in various stages of feasibility assessment and development. While not all of these projects
Cash Electronic
Cash
¢/mile
Electronic
¢/mile
Regional Toll Authorities 11 152.9 $23.55 $21.25 15.4 13.9 ¢ 2.4
Turnpike Regional Facilties 7 140.0 $13.50 $11.75 9.6 8.4 ¢ 14.6
Turnpike Mainline 3 320.0 $22.95 $17.90 7.2 5.6 ¢ 18.7
FDOT Owned Toll Facilities 4 125.6 $5.10 $4.35 4.1 3.5 ¢ 18.5
TOTALS 25 738.5 $65.10 $55.25 8.8 7.5 ¢ 10.3
Ave. Years
Since Last Toll
Increase
Comparative Passenger Car Toll Rates &
Florida Toll Roads
Average Number of Years Since Last Toll Rate IncreaseAs of December 31, 2010
Tolling Agency Number
of
Facilities
Total
Length
(CL Miles)
Total Facility Tolls Average Rate Per Mile

56
will be undertaken once all necessary feasibility studies and applicable federal, state, and local
planning and public approval processes have been completed, they are, nevertheless,
indicative of the level of participation that toll agencies can play in meeting the state’s
transportation infrastructure shortfall.
Toll agencies function as business enterprises. While customers have access to non-tolled
alternative routes, they choose to pay an added toll to save time, reduce travel distance, or
experience a high level of service. Each time a customer uses a toll road, he/she must decide
if the time, fuel, wear and tear, and other savings or benefits will be greater than the cost of
the toll charged. Similarly, each toll agency determines the appropriate toll rate to charge on
its facility for operations and maintenance, to repay sums borrowed to build the facility, and to
plan for and develop additional capacity and expansion improvements to meet anticipated
future needs as its customer base grows. Thus, market-based decisions are being made by
customers when choosing to use a tolled road, and market-based decisions are made by toll
agencies in setting toll rates in response to the demand.
Significant variances in toll rates for urban expressways can result within the same urban
areas, even though these expressways often serve the same customers. Wide discrepancies
between toll rates charged by various toll agencies can be largely attributed to their respective
governing structures and decision-making processes for setting toll rates.
Regional toll authority governing boards achieve some degree of independence from immediate
political pressures when setting toll rates on facilities under their jurisdiction. The role of an
authority has been defined as follows:
[The primary mandate of an authority is] … to develop revenue-producing
facilities in an atmosphere insulated from political pressures…. It should be
structured so as to encourage independence in decision-making from elected
officials … and to think in long-range terms not limited by the next election….
Authorities operate … free from political compromise, public pressure, and
bureaucratic red tape.5
Over time, the Florida legislature has developed and codified in State statute the current
organizational structure for the regional toll authorities. This structure has been designed to
strike a balance between the concept of a truly independent authority as described above and
one that answers solely to State- or locally-elected officials. This has been achieved by
establishing governing boards for these organizations that include representation from both
arenas. Accordingly, as mentioned previously, all regional toll authority governing boards
include local elected officials and a representative of FDOT as ex-officio voting members.
The governing boards of regional toll authorities comprise a mixture of local elected officials,
representatives of the community who are appointed by the governor and the area FDOT
5 Mitchell, Jerry, Public Authorities and Public Policy: The Business of Government, 1992.

57
District Secretary. Community representatives are usually appointed to four-year terms on a
revolving basis. This structure ensures that regional toll authorities remain sensitive to local-
area acceptance of toll rates and communicate to the community the long-term benefits that
will be derived in terms of new capacity or expressway improvements when toll rate increases
are contemplated. These tasks are accomplished while also providing a balance between
community representation and the interests of State and local elected officials.
On the other hand, FDOT and Florida’s Turnpike Enterprise do not operate under a semi-
independent environment. Rather, they answer directly to the governor and the Florida
legislature. This can result in an influence from immediate political pressures when setting toll
rates. It is natural for there to be some degree of public opposition to any toll rate increase,
regardless of its justification and merits. When toll rate increases are proposed by a state
agency, they in essence become “the governor’s toll rate increase” or “the legislature’s toll rate
increase.” As a result, toll rates can remain unchanged or toll increases can be set
substantially below market rates for reasons of political expediency, in spite of identified long-
term transportation needs or local business market conditions that would dictate otherwise.
Currently, toll rates on many FDOT toll facilities are lower than statewide and national
averages, which has resulted in less financing capacity to improve or expand these tolled
systems. Consequently, greater capital contributions in the form of departmental grants or
State appropriations must be sought when undertaking toll road improvements, and FDOT’s
toll facilities contribute less than regional toll authorities towards financing the state’s
transportation needs in relative terms.
In 2007, Florida Statutes were amended and directed FDOT to index toll rates on existing toll
roads and bridges to the annual CPI or similar inflation indicators no more frequently than once
per year, but no less frequently than once every five years. According to the statutes, the
indexing of toll rates must occur on or before June 30, 2012. As a result, FDOT is proposing
to adopt a toll rate adjustment policy for all FDOT and Turnpike toll roads and bridges that
provides toll increases on July 1, 2012, commensurate with an 11.7 percent increase in
inflation over the past five years, annual inflation adjustments for electronic toll collection, and
periodic five-year inflation adjustments for cash toll collections. However, even with these toll
rate adjustments, many State-owned toll facilities will not be priced at market rates,
particularly in Florida’s urban areas. Further, some degree of independence in establishing and
setting toll rates may also is an important consideration in the State’s efforts to expand its
managed lanes and major bridge reconstruction programs.
Accordingly, it is recommended that the governor and Florida legislature consider creating an
independent State Toll Rate-Setting Commission to study, evaluate, and establish toll rates for
State-owned toll facilities based upon criteria established by the governor and the Florida
legislature. The FTC is an option to consider for this purpose, as its members possess some
independence from the political process, similar to that of the regional toll authority board
members.

58
Create and fund Regional Transportation Financing Authorities
Recommendation: Create and fund Regional Transportation Financing Authorities (RTFA) with
incremental new revenue sources.
Rationale This legislative option would allow the creation of RTFAs with the support of $100 million
annually in new incremental revenues, if some of the revenue raising options are adopted.
RFTAs would serve as regional transportation financing entities and would be established with
provisions to incur debt outside of the State’s debt service cap and limitations. RTFAs could
assist in “buying down” the capital cost of revenue generating projects and the future revenue
streams pledged towards paying off bonds and providing other types of loans and credit
enhancements to encourage a higher level of transportation funding. These entities would not
compete with existing agencies to operate transportation facilities; rather, they would act as
financiers for regional transportation investments in projects that are user-fee based or that
have a dedicated revenue source for repayment.
Discussion The purpose of establishing regional transportation financing entities is to provide increased
capacity and greater flexibility to State and local agencies to finance necessary transportation
infrastructure projects, while also preserving the integrity of the existing State bond policies
and practices. Debt financing is frequently the most appropriate mechanism to pay for new
highway and transit alignments and significant capacity improvements to highways, bridges,
and transit facilities. Debt financing is consistent with “user pay–user benefit” principles for
projects that provide additional capacity for the benefit of future users or that extend the
useful life of existing facilities.
However, the State’s debt policies and management practices, while are entirely appropriate
for managing recurring statewide fixed assets needs at the lowest possible cost of capital
(interest cost), serve to limit the ability to undertake many necessary transportation
infrastructure improvements. Further, with the State’s debt service benchmark target/cap, tax-
supported transportation debt issues must compete with other priorities for the State’s limited
bonding capacity.
The 2012 Florida legislature placed a cap on the total level of debt and debt-like issuance that
FDOT may undertake, limiting the future use of debt financing as a method of paying for
transportation improvements. This cap is comprehensive and covers bonds issued directly for
FDOT projects, FDOT participation in public-private partnerships (P3) initiatives through
availability payments or other debt-like arrangements, and FDOT’s risk-sharing participation
agreements with regional transportation authorities.
Establishing RTFAs, funded with non-State tax and revenue sources and outside of the State’s
debt policies, will provide greater financial capacity and flexibility to complete large
transportation improvements and new facilities and alignments on a more-timely basis, while
allowing the State to preserve its existing debt financing practices and policies.
59
This is a conceptual recommendation, acknowledging the variety of public policy issues that
must be considered in its implementation. It is anticipated each RTFA will identify revenue
sources during the development process.
Regional Transportation Finance Authority Purpose The purpose of establishing regional transportation financing entities is to provide increased
capacity and greater flexibility to State and local agencies to finance important transportation
infrastructure projects, while also preserving the integrity of the existing State bond policies
and practices. An RTFA would operate without the State debt service target and cap
limitations, credit rating requirements, and long-term debt management practices. It is
contemplated the RTFAs would be funded from dedicated funding sources that do not fall under
the definition of state revenues.
Debt Financing and the Principle of “User Benefit–User Pay” Many economists believe a public policy of “user benefit–user pay” is the most equitable
method for financing public capital outlays and collecting fees for their use. Accordingly, fixed
assets that have a long useful life are often financed using debt with maturity terms that are
up to or equal in length to the life of the asset. Under this approach, the cost of the asset is
spread out over its useful life through monthly debt service payments.
This approach is much like the process of using a mortgage to pay for the cost of building a
new house or adding rooms to an existing house. The monthly mortgage payments serve as
the “user fee” and are paid overtime as the occupant (user) benefits from residing in the
house. Most would consider it to be an unreasonable burden to require homeowners to pay
the full cost of their home in advance of its use. By this same reasoning, in many instances, it
can be considered an unreasonable burden to require an existing taxpayer to pay for
investments in new transportation facilities and major improvements to existing facilities when
these investments are primarily for the benefit of future transportation users.
Truth in Bonding Statement
Debt financing as a means to pay for infrastructure costs is often viewed unfavorably due to
the added interest cost. For example, when proposing to debt-finance capital projects, State
agencies are normally required to prepare a Truth in Bonding Statement (s.216.0442, F.S.).
This statement requires the State agency to provide information on the amount to be financed,
the term of the issue, the expected rate of interest, and the sum of interest payments over the
life of the debt. This final requirement—to report the sum of interest payments—can be
misleading, since the amount reported does not discount the cost of the future interest
payments by an appropriate discount rate to adjust to present-day value and when the
corresponding savings and benefits that are expected to be derived from the capital asset that
the debt is being used to invest in are not taken into account.
Benefits of Debt Financing for Transportation Infrastructure
Debt financing permits a substantially higher level of investment to happen in the near term
rather than gradually over time as with traditional “pay-as-you-go” strategies. This is
particularly true during periods of low interest rates. Each $1 of recurring revenue will
generate $15 to $18 of bond proceeds for infrastructure investment. The economic benefits of

60
having these infrastructure improvements sooner rather than later, coupled with the inflation
cost savings of building now rather than waiting, are offsets to the financing costs associated
with debt financing.
Debt financing more precisely matches the cost of the project with the users of the project
over time. A new facility or additional capacity on an existing facility will have an economic life
of many decades. From a strictly equitable basis, it is not appropriate for today’s taxpayers to
pay the full cost for improvements that will benefit future users of the facility. Transportation
infrastructure is a capital investment, not unlike the purchase of a house, which is a personal
capital investment. A homeowner borrows the money to pay for the house (mortgage) and
pays for the use of the house each month through mortgage payments for principal and
interest. Debt financing of transportation capital projects is based on the same principal.
The interest earned on public-sector debt is exempt from federal income taxes, and the
interest cost to a public agency when using debt financing is relatively low in comparison to
private-sector debt. This provision is somewhat analogous to the home mortgage example,
where the interest cost on the home mortgage is tax-deductible.
There are a number of cost savings and economic benefits that are realized when
transportation projects are built sooner, using debt financing, rather than at a later time under
“pay-as-you-go” financing. In general, the benefits of building transportation sooner are:
Employment and general economic activity (including tax revenues) derived from
higher levels of construction activity.
Construction inflation cost avoidance.
Right-of-way land appreciation cost avoidance.
User savings (general public and commercial) in time, fuel, vehicle wear, and insurance
costs.
Economic preservation, efficiency, and growth in transportation-reliant businesses, such
as manufacturing, tourism, distribution, agriculture, and on-site service providers.
Economic development potential arising from reduced commuting times and commercial
traffic capacity improvements.
While it can be difficult to quantify the economic values of each specific transportation
improvement, many studies have been undertaken using various forms of analysis. These
studies reflect the nationwide impacts that would be less at the state and local levels, since a
portion of the economic activity occurs elsewhere.
A 2007 analysis performed by FHWA indicates that a $1 billion investment in highway
expenditures creates approximately 30,000 jobs (person years of employment) and generates
in excess of $1 billion in total employment income, taking into account supporting industries
and induced employment.

61
Table 10. Economic Impact Estimates
per $1 billion of Highway Investment
According to the FHWA Strategic Plan, dated March 2010, since the inception of the Interstate
Highway System, U.S. industries have realized production cost savings averaging 18 cents
annually for every dollar invested in the road network. The Strategic Plan further states:
Although the impact of highway investment on productivity has declined
coincident with the decline in national productivity growth since the early
1970s, results suggest that highway infrastructure investments more than
pay for themselves in terms of industry cost savings.
One U.S. DOT study determined that every dollar invested in the nation's highway system
yielded $5.70 in economic benefits from reduced delays, improved safety, reduced vehicle
operating costs, and other benefits. Another U.S. DOT report found that, for every $1 billion
invested in infrastructure improvements, economic activity was stimulated by $2.6 billion.
These increases in economic activity and job creation result in higher public-sector tax and fee
revenues, which partially mitigate the total cost of the transportation investments.
Highway construction is commodity price-sensitive and relies heavily on petroleum-based
products such as asphalt and energy-intensive diesel fuel used in earthmoving equipment,
Jobs Created:
With 7%
Right of
Way Cost
With No
Right of
Way Cost
Construction Oriented 9,536 10,300
Supporting Industries 4,324 4,675
Induced Employment 13,962 15,094
Total Jobs 27,822 30,069
Employment Income: ($ Mill ions)
Construction Oriented $394.8 $426.8
Supporting Industries $175.1 $189.3
Induced Employment $492.1 $532.0
Total Income $1,062.0 $1,148.1
Jobs Created and Employment Income
$ One Billion in Highway Expenditures in 2007
The 1997 FHWA report also refers to a total of 37,500 jobs supported by
the investment of $1 bill ion in federal highway funds. This number
includes a 20% state match of funds and thus measures the impact of
$1.25 bill ion in total highway spending.
FHWA measures jobs created in terms of person years of employment.
Source: Federal Highway Administration (FHWA) for 2007
62
cranes, generators, air compressors, etc. As a result, future construction costs may increase
at rates higher than the general inflation rate should oil prices continue to increase.
Historically, property costs for right-of-way acquisition have risen at annual rates far in excess
of the general rate of inflation or interest costs on debt financing. In the late 1980s, FDOT
conducted a survey of land appreciation rates in each FDOT District and found that property
cost increases of 12–15 percent were not uncommon. This occurred particularly in urban
settings and areas experiencing rapid growth, where land appreciation and the potential for
business damages were the greatest.
Current Transportation Debt Financing Programs in Florida
Florida currently has in place a number of debt financing programs to pay for transportation
needs that are described below. However, the ability to issue additional debt or to participate
with private-sector entities, local governments, and transportation authorities in traditional
risk-sharing arrangements will be curtailed due to the limitations of both the State’s debt
policies and practices and the recently-enacted statutory cap for FDOT debt and debt-like
issuances.
Right-of-Way Acquisition and Bridge Construction Bonds Historically, land acquisition costs have been found to increase at a higher rate than general
inflation, particularly in urban areas. For example, a 1989 study conducted by Ernst and Young
for the FTC determined that right-of-way costs were increasing at a 13 percent annual
compound rate at that time. These findings served as a catalyst for the creation of the Right-
of-Way Acquisition and Bridge Construction bonding program by the Florida legislature in 1990
as well as various advanced right-of-way acquisition initiatives by FDOT. The Florida legislature
recognized the cost saving advantages of debt financing for right-of-way purchases.
The legislature further recognized the “user benefit–user pay” principle of debt financing for
transportation projects in approving the issuance of bonds for bridge construction beginning in
1994. Right-of-way is most often purchased to expand the capacity of an existing roadway or
facility or to construct a new facility. Debt financing allows these capacity-related costs to be
borne over time by the future users who benefit from the improvements. Similarly, new
bridges and replacements or expansions of existing bridges that extend their functional or
structural life are appropriately debt-financed so that these costs spread out over time for
future users to pay rather than being paid in full by today’s users through higher
transportation taxes or through the deferral of other transportation needs.
Bonds issued for these purposes are general obligation (full faith and credit) bonds authorized
under an amendment to the State Constitution approved by Florida voters in 1988. Through
June 30, 2011, $2.2 billion in bonds have been issued, with tentative plans to issue an
additional $700 million over the next six years.
GARVEE Bonds Grant Anticipation Revenue Vehicles (GARVEE) Bonds is a federal transportation debt-financing
program consistent with the user benefit–user pay concept. GARVEE bonds permit the State
63
to issue debt to advance federal-aid transportation projects with debt service payments being
made from the State’s apportionments of future-year federal-aid highway funds.
Section 215.616, F.S., authorizes the issuance of GARVEE bonds. Annual debt service is
capped at 10 percent of annual federal highway apportionments, and bond terms are limited to
12 years. As stated in the FDOT 2011 Bond Update Report:
GARVEE bond advantages include: allows multi-year funding of commitments
with sources other than federal grants while preserving access to the federal-
aid which would be applicable to the project over a period of years;
maximizes scarce revenues to meet the cash flow needs of transportation
infrastructure; allows for the acceleration of needed projects; and enhances
positive economic growth with improved highway and intermodal
transportation facilities.
FDOT has tentative plans to issue up to $350 million in GARVEE bonds during the next six
years. Unfortunately, similar plans in prior years have not materialized and, to date, no bonds
have been issued under the GARVEE Statute. Furthermore, since GARVEE bonds fall under the
State’s bonding cap for taxable debt, they must compete with other statewide needs during
more normal economic times and cannot be issued during periods of economic downturns,
when the State’s bond cap has been exceeded.
Public-Private Partnership (P3) Initiatives Florida, like many states, has recently looked at undertaking P3 projects, whereby private-
sector financing is used to supplement public debt. While the private-sector financing costs
(taxable debt) typically are greater than tax-exempt public debt, these added costs are often
determined to be outweighed by the benefits and cost savings that are realized when private-
sector financing is used to meet critical infrastructure needs. Florida has entered into P3
agreements to construct reversible lanes on I-595 in Broward County and the Port of Miami
tunnel project.
Typically, the private-sector party agrees to build, operate, maintain, and finance a high-cost
toll project while the State agrees to make “availability payments” to provide a guaranteed
revenue stream to the private-sector entity for purposes of securing financing. However,
under the State’s debt policy, availability payments are deemed to be tax-supported debt
obligations of the State and, accordingly, are included when calculating the State’s debt ceiling.
These payments are also included in the calculations for FDOT’s recent enacted debt cap. The
State currently reports $1.694 billion in P3 obligations.
Since P3 availability payments are considered as tax-supported debt, this financing alternative
loses many of its inherent benefits as a State financing alternative. They use the State’s
limited tax-supported debt bonding capacity rather than supplementing it, when at least a
portion of the costs of P3 project could have been financed using revenue bonds that are not
included in the State’s tax-supported debt ceiling calculations. These limitations argue for the
development of an alternative mechanism whereby P3 projects can be pursued without
triggering the State bond ceiling provisions.

64
“Pay-As-You-Go” Funding
Many transportation capacity improvements are funded using the “pay-as-you-go” method.
One reason this approach is taken is a belief by many that it reflects appropriate conservative
fiscal policy, when it would be more appropriate to fund many capacity projects with debt
issuance. “Pay-as-you-go” may not be the most appropriate financing option in instances
where the State is undertaking substantial infrastructure improvements to accommodate
future demand growth. This is particularly true during periods when the cost of debt is low
relative to anticipated future inflation.
When using “pay-as-you-go,” projects frequently must be constructed incrementally. Since
funds are not available to widen an entire congested corridor, individual sections are widened
over time as new funding becomes available. This approach delays the time needed to
ultimately reduce congestion within the corridor, and it results in additional construction-
related traffic delays and business damages as sections of the corridors are continuously under
construction. Delaying needed transportation infrastructure until sufficient pay-as-you-go
funds become available or using a piecemeal approach in widening congested corridors can
result in significant negative consequences for all motorists, greater business damages for the
State’s existing commercial enterprises, and restrict future economic growth and development.
State Debt Policies and Practices
The State’s debt policies, while appropriate for purposes of maintaining an ongoing fixed-asset
debt financing program for general government purposes, serve to limit otherwise appropriate
uses of debt financing to pay for transportation needs. The State maintains a designated
benchmark debt ratio for proposed and outstanding tax- supported bonds of a 6 percent target
and a 7 percent cap of pledged annual State revenues. Under this policy, the issuance of new
general obligation debt is limited when future debt service payments are projected to exceed 6
percent and generally curtailed if they exceed 7 percent.
Many of the State’s primary revenue sources, such as sales taxes and corporate income taxes,
are closely correlated to the health of the economy. Thus, the State has supplemented these
bond policies by setting aside funding reserves in a “rainy day fund” to help pay for recurring
costs in the event an economic downturn results in a significant State revenue loss.
As stated in the State of Florida 2010 Debt Affordability Study, prepared by the Division of
Bond Finance: “Maintaining adequate reserves, developing a structurally balanced budget, and
not relying on one-time revenue sources are critical factors the rating agencies will be
evaluating when determining the State’s future ratings.”
The State has benefited from the twin policies of fiscal discipline and conservative debt
issuance practice, both by lowering its borrowing costs through the ability to annually issue
bonds with strong credit ratings and by possessing a greater degree of flexibility to weather
severe economic downturns when compared to many other state governments.
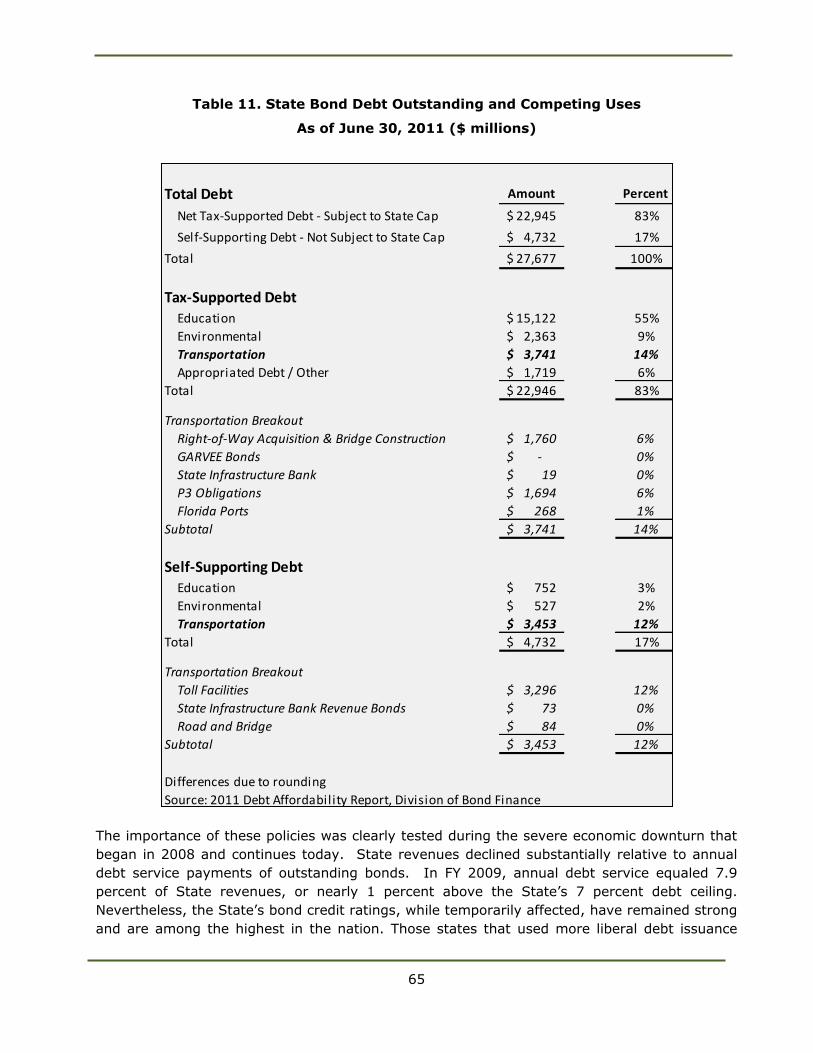
65
Table 11. State Bond Debt Outstanding and Competing Uses
As of June 30, 2011 ($ millions)
The importance of these policies was clearly tested during the severe economic downturn that
began in 2008 and continues today. State revenues declined substantially relative to annual
debt service payments of outstanding bonds. In FY 2009, annual debt service equaled 7.9
percent of State revenues, or nearly 1 percent above the State’s 7 percent debt ceiling.
Nevertheless, the State’s bond credit ratings, while temporarily affected, have remained strong
and are among the highest in the nation. Those states that used more liberal debt issuance
Total Debt Amount Percent
Net Tax-Supported Debt - Subject to State Cap 22,945$ 83%
Self-Supporting Debt - Not Subject to State Cap 4,732$ 17%
Total 27,677$ 100%
Education 15,122$ 55%
Environmental 2,363$ 9%
Transportation 3,741$ 14%
Appropriated Debt / Other 1,719$ 6%
Total 22,946$ 83%
Transportation Breakout
Right-of-Way Acquisition & Bridge Construction 1,760$ 6%
GARVEE Bonds -$ 0%
State Infrastructure Bank 19$ 0%
P3 Obligations 1,694$ 6%
Florida Ports 268$ 1%
Subtotal 3,741$ 14%
Education 752$ 3%
Environmental 527$ 2%
Transportation 3,453$ 12%
Total 4,732$ 17%
Transportation Breakout
Toll Facilities 3,296$ 12%
State Infrastructure Bank Revenue Bonds 73$ 0%
Road and Bridge 84$ 0%
Subtotal 3,453$ 12%
Differences due to rounding
Source: 2011 Debt Affordability Report, Division of Bond Finance
State of Florida Debt Outstanding
Tax-Supported Debt
Self-Supporting Debt
In $ Millions
As of June 30, 2011
Compteting Uses of State Bonded Debt

66
policies, lower reserves, or a reliance on debt to pay for recurring operating needs endured
greater financial hardship during this economic downturn than did Florida. Thus, one
advantage of the debt management and fiscal policies adopted by the State is that they allow
Florida to maintain a strong credit rating (AAA/Aa1), thereby lowering the State’s debt service
costs. This is a valuable asset when managing an ongoing fixed asset program, which is
dependent upon annual bond issuances.
More importantly, the State’s debt policies have ensured that appropriate fiscal discipline is
maintained with respect to the State’s budgeting process. They serve to minimize unsound
practices, such as issuing bonds to pay for recurring operating costs or issuing bonds in a
fashion that limits the State’s future bonding capacity to pay for future fixed-asset needs.
Accordingly, bonds are generally issued for fixed periods of 30 years or less and with level debt
service payments that allow additional bonding capacity to be created as State tax revenues
grow and as older bond issues mature.
Limitations of State Debt Policies
The State’s debt policies and practices have been demonstrated to serve Florida well, both for
purposes of long-range financial management and, in particular, during periods of severe
economic downturn. However, they limit the amount of debt financing that may be used for
transportation capacity improvements in instances where it may be the most appropriate
financing method, when other factors are taken into account, such as cost savings, commercial
and economic benefits, accelerated construction schedules, and the appropriate matching of
transportation costs and use.
While the bond cap is an integral component of the State debt policy for maintaining strong
credit ratings, it results in competition among various State programs for limited tax-supported
debt financing capacity. Transportation must compete for scarce bonding capacity with other
critical State needs. While many studies indicate that debt-financed transportation
improvements will “pay for themselves” in terms of economic benefits, it is difficult for these
projects to secure a portion of the limited tax-supported debt capacity when competing against
other State fixed asset needs, such as education financing. Further, the State’s ability to issue
tax-supported bonds for any purpose is limited during periods of time when the general
revenues of the State decline and the benchmarks have been breached.
Application of State Bond Practices to Self-Supporting Debt Self-supporting debt is distinguished from tax-supported debt in that it does not carry a pledge
of the full faith and credit of the State of Florida, and its debt service obligations are generally
paid from internally-generated revenues or fees. Examples include toll roads and college
dormitories.
Self-supporting debt is not included in the calculations of the State’s bond target and cap.
However, with few exceptions, most of the State’s other conservative debt practices are
applied to self-supporting debt. With respect to self-supporting debt, the State appears to
follow the practice of preserving debt capacity for future applications when a more appropriate
public policy may be to use higher levels of debt financing today to secure the economic
benefits associated with the capital improvement and attendant revenues.
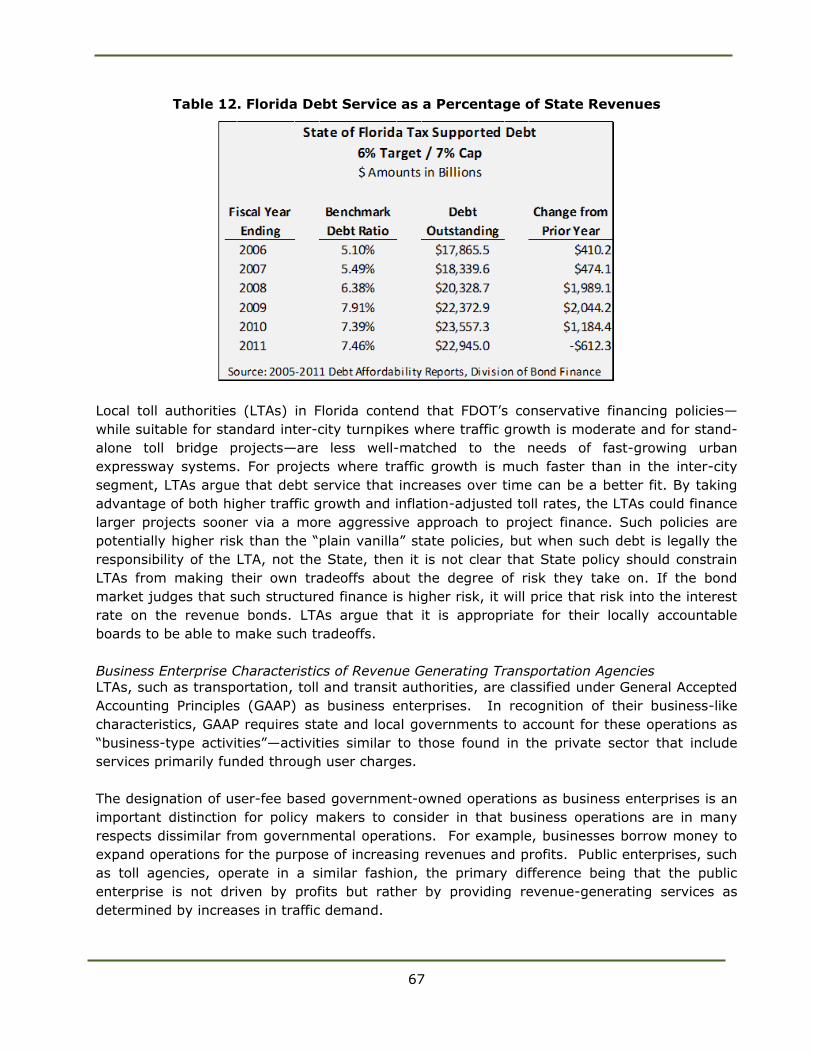
67
Table 12. Florida Debt Service as a Percentage of State Revenues
Local toll authorities (LTAs) in Florida contend that FDOT’s conservative financing policies—
while suitable for standard inter-city turnpikes where traffic growth is moderate and for stand-
alone toll bridge projects—are less well-matched to the needs of fast-growing urban
expressway systems. For projects where traffic growth is much faster than in the inter-city
segment, LTAs argue that debt service that increases over time can be a better fit. By taking
advantage of both higher traffic growth and inflation-adjusted toll rates, the LTAs could finance
larger projects sooner via a more aggressive approach to project finance. Such policies are
potentially higher risk than the “plain vanilla” state policies, but when such debt is legally the
responsibility of the LTA, not the State, then it is not clear that State policy should constrain
LTAs from making their own tradeoffs about the degree of risk they take on. If the bond
market judges that such structured finance is higher risk, it will price that risk into the interest
rate on the revenue bonds. LTAs argue that it is appropriate for their locally accountable
boards to be able to make such tradeoffs.
Business Enterprise Characteristics of Revenue Generating Transportation Agencies
LTAs, such as transportation, toll and transit authorities, are classified under General Accepted
Accounting Principles (GAAP) as business enterprises. In recognition of their business-like
characteristics, GAAP requires state and local governments to account for these operations as
“business-type activities”—activities similar to those found in the private sector that include
services primarily funded through user charges.
The designation of user-fee based government-owned operations as business enterprises is an
important distinction for policy makers to consider in that business operations are in many
respects dissimilar from governmental operations. For example, businesses borrow money to
expand operations for the purpose of increasing revenues and profits. Public enterprises, such
as toll agencies, operate in a similar fashion, the primary difference being that the public
enterprise is not driven by profits but rather by providing revenue-generating services as
determined by increases in traffic demand.
68
According to GAAP Section 80.20.35.b:
Proprietary Funds are used to account for a government's ongoing
organizations and activities that are similar to businesses found in the private
sector. These funds are considered self-supporting in that the services
rendered by them are generally financed through user charges or on a cost
reimbursement basis.
Enterprise Funds – used to account for any activity for which a fee is charged
to external users for goods or services. Activities are required to be reported
as enterprise funds, in the context of the activity's principal revenue sources,
if any one of the following criteria is met:
The activity is financed with debt that is secured solely by pledge of the
net revenues from fees and charges of the activity,
Laws or regulations require that the activity's costs of providing
services, including capital costs (such as depreciation or debt service),
be recovered with fees and charges, rather than with taxes or similar
revenues, or
The pricing policies of the activity establish fees and charges designed
to recover its costs, including capital costs (such as depreciation or debt
service).
It is appropriate to maintain a long-range debt financing program that is measured and takes
into consideration the preservation of debt issuing capacity for future needs for general
government purposes. However, for enterprise purposes, circumstances will arise in which it is
a more appropriate public policy to maximize available bonding capacity in the near term,
understanding that the facilities that are being constructed will generate and grow revenues
over time.
Transportation improvements frequently do not lend themselves to the incremental
improvements that can be made under a measured long-range debt management approach.
Sometimes it is counterproductive to expand highway capacity within a congestion corridor in a
piecemeal fashion, as this serves only to increase the duration of construction, adding to
construction-related traffic delays as well as additional business damages. Initial large debt
outlays may be required to complete a facility, such as a tolled highway that is forecast to
generate a growing stream of future revenue that can be adjusted to correspond with inflation
increases. Under these circumstances, greater flexibility to match costs and future revenues is
warranted by using more flexible debt structures and terms.
While many of the State’s debt policies and practices are necessary and desirable for general
State financing purposes, they have the effect of restricting otherwise appropriate methods for
financing transportation capacity improvements. Accordingly, it is recommended that the
legislature explore the creation of RTFAs.

69
Regional Transportation Finance Authorities
The recently-enacted legislation limiting FDOT’s participation in debt financing and debt-like
programs should serve as a catalyst for establishing a transportation financing mechanism that
does not impact the State’s debt management policies and practices. It is contemplated that
RTFAs would operate independent of the State and would not rely on State tax revenues in any
capacity that would limit the State’s tax-supported bonding capacity.
The general purpose of the RTFAs will be to provide financial assistance in various forms to the
governmental agencies and public-private ventures within the state to assist their efforts to
debt-finance appropriate transportation projects, thereby accelerating project schedules,
avoiding inflationary and land appreciation cost increases, and providing cost savings to
motorists and commercial interests as well as related economic benefits.
Potential RTFA Applications – It is contemplated that RTFAs could provide a variety of financial services to state and local transportation agencies, many of which mirror or could take the
place of existing State debt financing programs. This would have the advantage of freeing up State tax-supported bonding capacity for other uses. These activities may include:
Issue GARVEE-like bonds to advance state and local transportation project construction
schedules, repaid from future federal, state or local transportation appropriations.
Provide subordinated or below market rate loans to assist in financing revenue-
generating projects with characteristics similar to existing State Infrastructure Bank
(SIB) loans.
Enter into P3 agreements where warranted.
Provide short-term construction loans to toll agencies to defer long term financing until
after project completion.
Provide a source of funding to advance purchase rights-of-way where property
appreciation is anticipated to be greater than financing costs.
Issue debt supported with revenue streams from outstanding loan agreements to
leverage financing capacity, similar to existing SIB bonds.
Enter into risk-sharing agreements, where appropriate, to maximize the bonding
capabilities of governmental entities.
Enter into multi-agency financing agreements to develop and pay for significant regional
transportation facilities.
Provide “seed money” for the development of new toll facilities – similar to the existing
Toll Facilities Revolving Trust Fund Program.
Advance-purchase right-of-way for new alignments and capacity expansions in existing
corridors, similar to the existing Right-of-Way Acquisition and Bridge Construction Trust
Fund Program.
Figure 20 illustrates the cumulative transportation project financing potential over 10 years for
two debt financing alternatives, compared to the “pay-as-you-go” option. Each approach is
capitalized at $100 million per year in recurring non-state revenues. The “Pay-Go” approach
uses FDOT’s cash flow management practices, the “Bonded Projects” approach assumes a
combination of debt financing and cash is used directly for project costs, and the “Loan
Program” approach assumes a revolving loan program, similar to the SIB, where debt proceeds

70
are loaned to and repaid by transportation agencies. In Year One, both debt financing
approaches would allow approximately $750 million in new construction starts, compared to
approximately $240 million in cash-flowed “pay-as-you-go” projects. By Year 10, a revolving
loan program would finance approximately $3.2 billion in projects, compared to $1.4 billion in
bond/cash financed projects and $1.1 billion using “pay-as-you-go.”
It is contemplated that RTFAs would use a variety of approaches based upon the financing
requirements of individual projects and the financial needs of the respective transportation
agencies and in accordance with established debt management policies and practices.
Figure 20. Pay–Go, Debt Financing, and Revolving Loan Program Comparison
Institute a sales tax on motor vehicle parts and services
Recommendation: Shift the sales tax on vehicle accessories, parts, repairs, and service from
the GR Fund to the STTF.
Rationale
A number of states dedicate a portion of their motor vehicle-related sales tax collections to
transportation funding. This recommendation is to dedicate the revenues collected from the
State’s existing 6 percent general sales tax on vehicle accessories, parts, repairs, and service
to the STTF. The GR Fund currently receives these proceeds and would suffer a loss of
revenue. This would, however, provide an additional $666 million of transportation-related
revenues to the STTF.
$0
$500
$1,000
$1,500
$2,000
$2,500
$3,000
$3,500
Yr 1 Yr 2 Yr 3 Yr 4 Yr 5 Yr 6 Yr 7 Yr 8 Yr 9 Yr 10
In $
Mil
lio
ns
Pay Go Projects Bonded Projects Loan Program Projects
Regional Transportation Financing Authority (RTFA)"Pay Go", Debt Financing & Revolving Loan Program Comparison
Cumulative Dollar Value of New Project StartsEach Capitalized at $100 Million Per Year
30 Year Term, 5% IR, 2X DS Coverage Ratio, 2% Fund Balance IR

71
A number of states dedicate a portion of their motor vehicle sales tax collections or impose
additional vehicle excise taxes for funding transportation. This recommendation is to dedicate a
portion of the revenues collected from the State’s existing 6 percent general sales tax on
motor vehicles to be used for transportation rather than for general government purposes. It
is understood that this action would be difficult to accomplish under current economic
circumstances and State revenue limitations. It should be considered in the event future
economic conditions permit this action.
Discussion The precedent exists in many states that use a portion of motor vehicle sales taxes to fund
their transportation programs. A number of states consider sales and other excise taxes on
motor vehicles to be a form of user-fee for funding transportation needs. Since general sales
taxes are paid on the purchase price of a motor vehicle, there exists a rational nexus between
the levy of this tax and its use for transportation purposes.
Currently, 10 states dedicate a portion of the state sales tax collections on motor vehicle sales
to their transportation funds, including Arizona, California, Indiana, Kansas, Massachusetts,
Mississippi, New York, Pennsylvania, Utah, and Virginia. In addition, 12 states levy additional
excise taxes on motor vehicle sales for transportation purposes, including Connecticut, Iowa,
Kansas, Maryland, Michigan, Minnesota, Missouri, North Carolina, Nebraska, Oklahoma, South
Dakota, and Virginia. Furthermore, most states supplement their transportation programs with
general revenue funds.
Dedicating a portion of Florida’s motor vehicle sales taxes, sales tax collections on vehicle
accessories, parts, repairs, and service could be used as an additional source of transportation
funding.
Shifting a portion of the sales taxes collected on activities related to the sale and maintenance
of motor vehicles would result in a corresponding reduction in general revenue. Accordingly,
this recommendation would be difficult to implement during periods of time when the State is
experiencing shortfalls in general revenue collections. Nonetheless, this approach would be
reasonable and justifiable from the user-benefit concept when more favorable economic
conditions return to the State.

72
Revenue Option: Shift Sales Tax Collections on Vehicle Parts,
Repairs, Services, and Accessories to the STTF
8-Year Total: $5,331 million
Annual Average: $666 million
Figure 21. Estimated Revenue Impact* – Shift Sales Tax on
Selected Motor Vehicle Parts and Services to STTF
*The MPOAC Revenue Study calculations were prepared using Florida REC data and assumptions as of
October 2011. Subsequent REC estimations may result in changes to the funding levels generated by
this option. Accordingly, the revenue estimates displayed above should be considered approximate
funding levels for the purpose of evaluating additional revenue alternatives.
Shift sales tax on battery-electric vehicles to the STTF
Recommendation: Shift the State general use sales tax revenues on electric vehicles from the
GR Fund to the STTF.
Rationale
Battery-electric vehicles (BEV) do not use traditional motor fuels and, therefore, users do not
contribute to the STTF to compensate for the use of the highway system. This option would
establish the precedent that BEV sales taxes would be remitted to the STTF rather than to the
57
$544 $584 $618 $649 $681 $715 $751 $789
($544) ($584) ($618) ($649) ($681) ($715) ($751) ($789)
-$1,000
-$800
-$600
-$400
-$200
$0
$200
$400
$600
$800
$1,000
2012-13 2013-14 2014-15 2015-16 2016-17 2017-18 2018-19 2019-20
Shift Sales Tax On Vehicle Parts, Repairs, Services & AccessoriesTo STTF from GR
In $ millions
Shift Accessories, Parts, Repairs & Services - STTF
Shift Accessories, Parts, Repairs & Services - GR
MPOAC REVENUE STUDY

73
GR Fund before their sales grow to a point that general revenues would be harmed
substantially and to ensure that users pay their “fair share.” Sales forecasts vary widely for
these newly-introduced vehicles, and projections indicate that, on average, about $9 million
per year in revenue could be realized by the STFF under this option.
Discussion This recommendation would ensure that BEVs pay their “fair share” of the cost of maintaining
and improving the state’s transportation systems without imposing an additional tax burden on
the purchasers of such vehicles. All-electric vehicles do not use motor fuels and, accordingly,
do not pay motor fuel taxes. BEVs are defined as those vehicles that operate using 100
percent electric power. Examples of current BEVs include the Nissan Leaf, Tesla, and Fisker;
not included are hybrid vehicles such as the Chevrolet Volt or Toyota Prius, which are also
powered with an internal combustion engine.
Since BEV sales are currently relatively small, the impact to the GR Fund would also be
relatively minor. Sales growth is expected to increase incrementally from the current small
base, allowing for gradual adjustments in GR collections.
While forecasts on consumer purchase patterns vary widely, it is currently estimated for the
purposes of this study that Florida BEV sales may reach 2,400 in FY 2012/13, growing to 4,500
by FY 2019/20. Accordingly, the State general sales tax revenues from BEV sales are
calculated at $5.2 million for FY 2012/13, growing to $11.2 million in FY 2019/20. Actual BEV
sales volumes and the associated general sales tax collections could vary considerably from
these estimates based on fuel prices, customer acceptance, vehicle costs, and the rate of
battery technology enhancements.
The deposit of sales tax proceeds from the sale of BEVs would be considered a one-time
payment for operation on state roads and highways for the life of the vehicle. Shifting the
sales tax on BEV sales from the GR Fund to the STTF will initially result in a minimal revenue
impact. BEV sales should increase gradually over time as battery technologies improve and
costs decline: however, the exact rate of change cannot be determined.
Implement a $10 county vehicle registration fee
Recommendation: Establish an optional county vehicle registration fee for public
transportation at $10 per vehicle, which each county can elect to implement, that is targeted
for public transit (operating or capital) and creates a bondable revenue stream.
Rationale
Under this option, counties could elect to institute a $10 annual fee for each vehicle registered
in that county with the revenues targeted for public transportation purposes and be a
“bondable” revenue stream. The County Vehicle Registration Fee, if adopted by all counties,
would generate approximately $155 million per year. Annual fee collections range from $19
million in Miami-Dade County to under $100,000 in a number of the state’s smaller counties.
74
Discussion
MVL Fees are the third largest state transportation funding source, comprising 19 percent of
Florida’s state transportation taxes and fees. While local governments currently may impose
local option motor fuel taxes, no similar provision is available for MVL Fees. MVL Fee rates for
private automobiles and light trucks currently range from $19.50 to $44.00 annually. As these
fees are assessed according to the vehicle’s weight, rates are considerably higher for heavy
trucks.
The 2009 Florida legislature increased MVL fees by approximately 35 percent. Prior to this rate
increase, MVL fees were last adjusted in 1983. Thus, from an inflation-adjusted perspective,
the 2009 fee increases reflected only about 1/4 of the general rate of inflation increase of 130
percent. In all vehicle weight categories, the combined 2009 increase and the assessment of a
$10 county optional motor vehicle decal fee would continue to result in fee rates that are below
the growth in the general rate of inflation since 1983.
The County Vehicle Registration Fee, if adopted by all counties, would generate approximately
$143 million per year. This amount would change over time based of the number of vehicles
registered. Annual fee collections range from an estimated $18.5 million in Miami-Dade
County to under $100,000 in a number of the state’s smaller counties.
It is recommended that this fee be targeted for public transportation purposes within each
county, either to assist in covering operating costs or for capital outlays. Further, it is
recommended that the fee be drafted in legislation to permit it to remain in place for an
extended time period, such as a minimum of 30 years, thereby allowing it to be used as a
debt-service pledge on local bond issues. It is contemplated that adoption of the fee will
require an extraordinary vote of the County Commission or a countywide referendum initiated
by the Commission, as is currently required to implement the 1 to 5 cent local option motor
fuel tax.
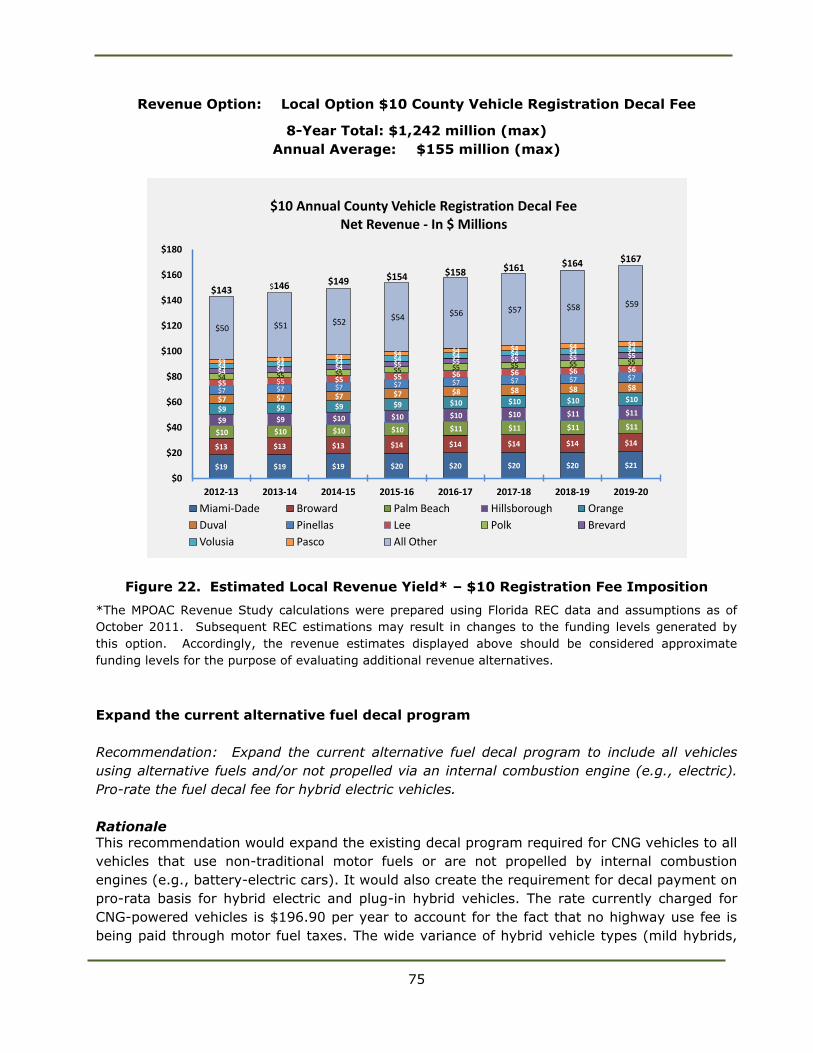
75
Revenue Option: Local Option $10 County Vehicle Registration Decal Fee
8-Year Total: $1,242 million (max)
Annual Average: $155 million (max)
Figure 22. Estimated Local Revenue Yield* – $10 Registration Fee Imposition
*The MPOAC Revenue Study calculations were prepared using Florida REC data and assumptions as of
October 2011. Subsequent REC estimations may result in changes to the funding levels generated by
this option. Accordingly, the revenue estimates displayed above should be considered approximate
funding levels for the purpose of evaluating additional revenue alternatives.
Expand the current alternative fuel decal program
Recommendation: Expand the current alternative fuel decal program to include all vehicles
using alternative fuels and/or not propelled via an internal combustion engine (e.g., electric).
Pro-rate the fuel decal fee for hybrid electric vehicles.
Rationale This recommendation would expand the existing decal program required for CNG vehicles to all
vehicles that use non-traditional motor fuels or are not propelled by internal combustion
engines (e.g., battery-electric cars). It would also create the requirement for decal payment on
pro-rata basis for hybrid electric and plug-in hybrid vehicles. The rate currently charged for
CNG-powered vehicles is $196.90 per year to account for the fact that no highway use fee is
being paid through motor fuel taxes. The wide variance of hybrid vehicle types (mild hybrids,
65REVENUE STUDY ADVISORY COMMITTEE
$19 $19 $19 $20 $20 $20 $20 $21
$13 $13 $13 $14 $14 $14 $14 $14
$10 $10 $10 $10 $11 $11 $11 $11 $9 $9 $10 $10 $10 $10 $11 $11 $9 $9 $9 $9 $10 $10 $10 $10 $7 $7 $7 $7 $8 $8 $8 $8 $7 $7 $7 $7 $7 $7 $7 $7 $5 $5 $5 $5 $6 $6 $6 $6 $4 $5 $5 $5 $5 $5 $5 $5
$4 $4 $4 $5 $5 $5 $5 $5
$4 $4 $4 $4 $4 $4 $4 $4
$3 $3 $4 $4 $4 $4 $4 $4
$50 $51 $52 $54 $56 $57 $58 $59
$0
$20
$40
$60
$80
$100
$120
$140
$160
$180
2012-13 2013-14 2014-15 2015-16 2016-17 2017-18 2018-19 2019-20
$10 Annual County Vehicle Registration Decal FeeNet Revenue - In $ Millions
Miami-Dade Broward Palm Beach Hillsborough Orange
Duval Pinellas Lee Polk Brevard
Volusia Pasco All Other
$143 $146 $149 $154 $158 $161 $164 $167
MPOAC REVENUE STUDY

76
full hybrids, plug-in hybrids) and the rapidly-developing technology could create
implementation and consumer communication challenges. If implemented, current estimates
indicate an expanded decal program could generate up to $40 million annually by 2020.
Discussion Vehicles, such as plug-in hybrid and all battery-electric vehicles use less or no motor fuel and,
consequently, contribute less in motor fuel taxes towards the maintenance and improvement
of transportation facilities. With future cost reductions and efficiency improvements, the
percentage of alternative fuel vehicle purchases could potentially increase significantly,
resulting in lower motor fuel tax collections. This recommendation will help to mitigate the
potential revenue loss; however, it may be difficult and costly to administer fairly.
Currently, the alternative fuel decal program applies only to motor vehicles using CNG. The
rates currently charged for CNG vehicles, $196.90 for 2012, are reasonable when compared to
state motor fuels taxes paid based on the average miles traveled per vehicle. These rates are
adjusted annually in accordance with statutory formula.
However, the alternative fuel decal is not assessed on all electric vehicles. Further, many
hybrid vehicles used substantially less motor fuel than do internal combustion engine vehicles.
Thus, hybrids and battery-electric vehicles do not pay the same share of the costs for
maintaining and improving the state’s transportation system as do internal combustion engine
vehicles.
Total hybrid sales reached the 2 million mark nationwide by 2009. It is forecast that 1.6
million hybrids will be sold annually in 2016. The growth in BEVs is expected to be significantly
slower, with sales of 2,700 in 2010, growing to 65,000 by 2016. Using proportional estimates,
there are currently 160,000 hybrid vehicles and, perhaps, 1,000 all-electric vehicles operating
in Florida today.
Hybrid vehicles have different motor fuel efficiencies, depending upon vehicle type, hybrid
characteristics, and usage. Generally, the increase in fuel efficiency of hybrids (over
comparable internal combustion vehicles) is approximately 20 percent for mild hybrids, 30
percent for full hybrids, and 45 percent for plug-in hybrids. These efficiencies may change
over time, particularly with improvements in battery technologies.
Plug-in hybrids and BEVs use generated electricity as a partial or full fuel source. It can be
argued that these vehicles pay various state and local excise taxes on electricity consumption
and, thus, should not be required to pay an additional fuel decal fee. However, taxes imposed
on electricity consumption are used for other governmental purposes, while fuel taxes are
traditionally considered a user-fee to pay for the cost of the transportation system. Therefore,
the application of the full decal fee to BEVs and pro-rated fees for hybrids, based on type,
would ensure the operators of these vehicles contribute an appropriate share of the
transportation costs.
An expanded alternative fuel decal program would initially generate approximately $11 million,
growing to $40 million in FY 2019/2020. These estimates are subject to significant adjustment

77
based upon potential cost and efficiency improvements and customer acceptance of alternative
fuel vehicles.
Revenue Option: Expand Alternative Fuel Decal Program to Electric,
Hybrid, and Other Vehicles that Use Non-Traditional Fuels
8-Year Total: $204 million
Annual Average: $26 million
Figure 23. Estimated STTF Revenue Impacts* –
Expand Alternative Fuel Decal Program
*The MPOAC Revenue Study calculations were prepared using Florida REC data and assumptions as of
October 2011. Subsequent REC estimations may result in changes to the funding levels generated by
this option. Accordingly, the revenue estimates displayed above should be considered approximate
funding levels for the purpose of evaluating additional revenue alternatives.
Invest $100 million of incremental revenue in new toll projects
Recommendation: Increase the levels of State funding invested in Florida’s Turnpike Enterprise
and Regional Expressway Authorities to leverage new toll project revenues and increase total
transportation infrastructure financing capacity. Use incremental new revenue.
$11
$15
$19
$23
$27
$32
$36
$41
$-
$5
$10
$15
$20
$25
$30
$35
$40
$45
2012-13 2013-14 2014-15 2015-16 2016-17 2017-18 2018-19 2019-20
Expand Current Alternative Fuel Decal ProgramPro Rated for Hybrid Electric - $ Millions
Mild HEV Full HEV PHEV (Plug In) BEV (Battery)
MPOAC REVENUE STUDY

78
Rationale
Like the RTFA option, this recommendation is a suggested use of incremental revenue raised
by implementation of the other options and prescribes an annual investment of $100 million
each year in Florida’s Turnpike Enterprise and expressway authorities across the state. This
investment would leverage new toll project revenues and increase total transportation
financing capacity. Each $1 of recurrent toll revenue will generate $15–$18 in bond proceeds
for infrastructure investment. The economic benefits of having projects implemented sooner
rather than later, coupled with the inflation cost savings of building now rather later, are
offsets to the financing costs associated with issuing debt. The 2012 Florida legislature has
taken an initial step in this direction by allocating $35 million per year for 30 years to Florida’s
Turnpike Enterprise to pay for turnpike system feeder roads and access projects.
Discussion Florida’s tolled highways have expanded rapidly in past decades primarily due to the State’s
policy of assisting toll road development and construction through direct appropriations and
grants (capital contributions), subordinated loans, financial covenants, and guarantees. This
has resulted not only in significant contributions to the State Highway System in terms of
building new highways and adding lanes to existing highways, but also in accelerating toll
highway projects, which, in turn, has accelerated toll revenue collections and the ability to
reinvest these higher toll revenues on yet additional transportation infrastructure projects.
Figure 24. Florida Toll Collections Expressed in
Motor Fuel Cents per Gallon Equivalents
7.47.9
8.48.7
9.310.0
10.811.4 11.8 12.0
12.5
0.50.9
1.31.9
2.63.4
4.0 4.4 4.55.1
0
1
2
3
4
5
6
7
8
9
10
11
12
13
14
99/00 00/01 01/02 02/03 03/04 04/05 05/06 06/07 07/08 08/09 09/10
Florida Toll Revenue CollectionsConverted into Equivalent Pennies Per Gallon of Motor Fuel Tax
Pennies Per Gallon Equivalent
Cumulative Increase

79
Toll agencies have contributed substantially towards addressing the state’s transportation
funding needs. This is apparent when converting annual toll revenue collections into the
equivalent number of cents per gallon that motor fuel taxes would need to be increased to
generate the same amount of transportation funding. In 10 years, toll revenues increased the
equivalent of over 5 cents per gallon of fuel tax proceeds, from 7.5 cents in 2000 to 12.5 cents
by 2010. In FY 2009/10, toll revenue collections ($1.15 billion) exceeded the State’s Highway
Fuels Sales Tax collections ($1.10 billion).
Over the years, Florida has developed and implemented a variety of financial guarantees and
covenants to maximize the potential bonding capacity of toll agencies for new facilities and
capacity expansion. The State has also provided more than $3 billion in grants and loans to
enhance the financial feasibility of toll projects. This has consisted of approximately $1.3
billion in loans, mainly through a number of loan programs created to encourage the
development of toll facilities and $1.7 billion in direct grants (capital contributions).
As a result of these various initiatives, Florida toll agencies have completed more than 100
significant toll facility projects, with an original cost of nearly $14 billion and a present-day
value of nearly $30 billion. From 2000 through 2010, toll agencies completed or began
construction on 17 major new expressways and extensions at a cost of nearly $4.5 billion,
adding 96 additional centerline miles to the State Highway System and representing 87
percent of all centerline miles added during this period of time. During this decade, toll
agencies invested an additional $2.7 million in 12 major lane-widening and capacity
improvement projects. Toll agencies added 545 lane miles to their facilities, an amount equal
to the total number of lanes miles added to the Interstate Highway System. Thus, toll agency
contributions have doubled the increases in capacity on state’s limited access highways over
what could be accomplished otherwise.
Much of Florida’s Turnpike System and most expressway authority facilities are located in
densely-populated urban areas where capacity expansion is more costly, primarily due to
higher right-of-way costs and corridor limitations that require more costly engineering and
design solutions.
Regional expressway authorities invested heavily during the period from 2000 through 2009 in
transportation improvements. These investments resulted in a 185 percent increase in the
asset value of their systems and facilities.
Investing in toll facilities creates a “virtuous cycle” of future toll revenues and future
transportation investments. The combination of direct grants, subordinated loans, and
various financial covenants and guarantees have permitted toll agencies to build projects much
earlier than would have been possible without this support. This, in turn, permitted these toll
facilities to generate additional toll revenues sooner and to accelerate their traffic and toll
revenue growth profiles. Accordingly, the higher traffic volumes on toll highways increased
toll revenue collections that, in turn, are reinvested to fund additional capacity improvements
and system expansions.

80
The value of investing transportation funds on toll facilities to build projects more quickly and
generate toll revenues sooner can be seen by comparing of the growth rates of state
transportation and toll revenues demonstrates this effect. In FY 2009/10, toll revenue
collections ($1.15 billion) exceeded the State’s Highway Fuels Sales Tax collections ($1.10
billion).
Future Toll Agency Contributions A 2010 Internet survey of the various plans and feasibility studies of Florida’s Turnpike
Enterprise and regional expressway authorities indicated that 90 potential projects with a
combined estimated cost of $30 billion were in various stages of feasibility assessment and
development. While not all of the projects under development will ultimately be completed,
they provide an indication of the potential role of toll agencies in meeting the state’s unfunded
transportation needs. Toll agencies can make a substantial contribution towards addressing the
current backlog of unfunded transportation needs as well as future needs should the State
elect to increase the level of toll road investment.
Toll agency investments result in additional miles of new highways and greater capacity on
existing facilities. This, in turn, increases traffic using toll facilities, thereby reducing traffic
and the need to add lanes on other state highways, particularly in urban areas where highway
construction is very expensive. However, in recent years, there has been a drop-off in the
level of State investment in toll roads. This is due, in part, to current economic circumstances.
It is also the result of an apparent shift in State policy with respect to toll agency investing. As
a result, while Florida’s toll agencies will continue to make above-average level of contributions
to the State Highway System and will generate toll revenues at higher rates than those of
transportation taxes and fees, their future contributions will be less than their full potential.
The Florida legislature addressed this issue to some extent in its 2012 session by authorizing
the transfer of $35 million per year for 30 years to Florida’s Turnpike Enterprise to pay for the
costs of feeder roads and access to the Florida turnpike system. However, recent trends have
been to withdraw State financial support and eliminate funding in programs designed to assist
regional expressway authorities. The recent policies to reduce financial participation, thereby
maximizing the financial capabilities of expressway authorities, may, in the long run, result in a
greater demand on the state’s limited transportation resources to undertake costly urban
highway capacity projects.
Both Florida’s Turnpike Enterprise and the regional expressway authorities serve important
roles in the development of the state’s highway transportation systems. These toll facilities
often serve to reduce congestion on the Interstate Highway System and reduce the level of
State investment needed to accommodate urban traffic congestion. Accordingly, in the event
that future transportation revenues are increased, it is recommended that the levels of State
funding invested in Florida’s Turnpike Enterprise and regional expressway authorities should be
increased as well to leverage new project toll revenues and increase total transportation
infrastructure financing capacity.

81
VI. Legislative Proposals – Draft Bill Language
One of the important elements of the MPOAC effort that was stressed by its leadership from
the outset was that this project should result not only in documentation of the issues, but in a
set of legislative proposals. This section includes draft bills to implement the six revenue
recommendations that have been made by the MPOAC.

82
LOCAL OPTION MUNICIPAL SALES TAX SURCHARGE
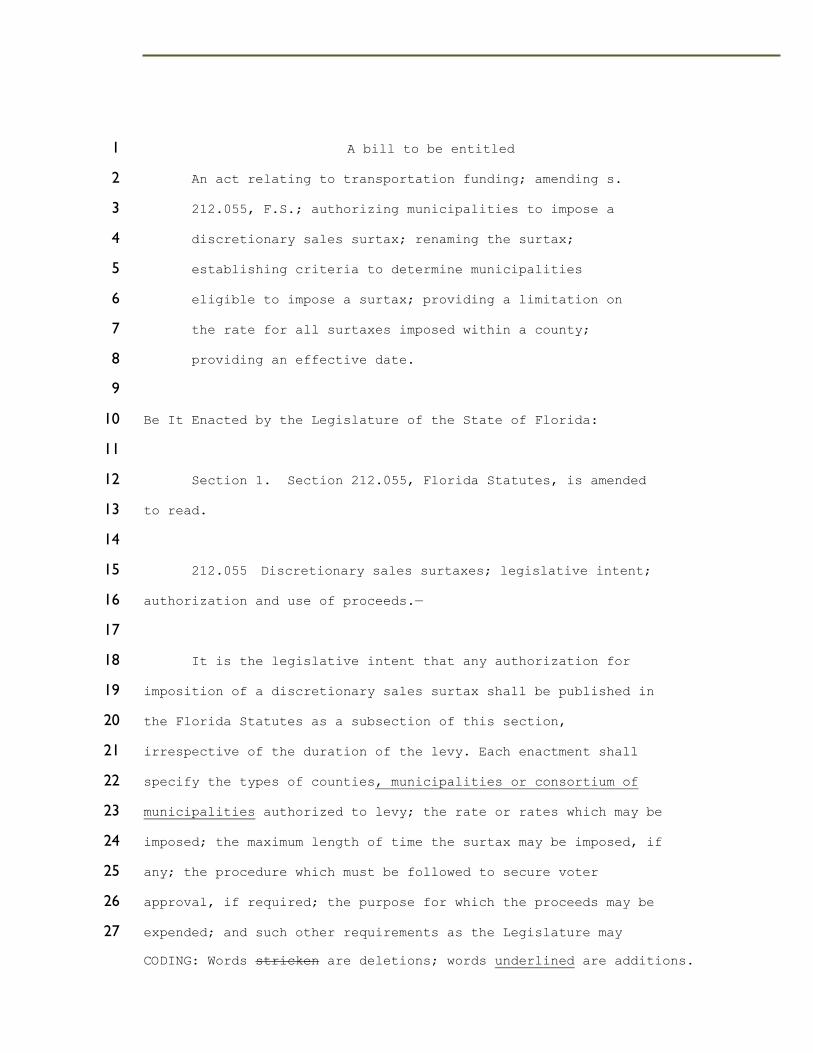
CODING: Words stricken are deletions; words underlined are additions.
A bill to be entitled 1
An act relating to transportation funding; amending s. 2
212.055, F.S.; authorizing municipalities to impose a 3
discretionary sales surtax; renaming the surtax; 4
establishing criteria to determine municipalities 5
eligible to impose a surtax; providing a limitation on 6
the rate for all surtaxes imposed within a county; 7
providing an effective date. 8
9
Be It Enacted by the Legislature of the State of Florida: 10
11
Section 1. Section 212.055, Florida Statutes, is amended 12
to read. 13
14
212.055 Discretionary sales surtaxes; legislative intent; 15
authorization and use of proceeds.— 16
17
It is the legislative intent that any authorization for 18
imposition of a discretionary sales surtax shall be published in 19
the Florida Statutes as a subsection of this section, 20
irrespective of the duration of the levy. Each enactment shall 21
specify the types of counties, municipalities or consortium of 22
municipalities authorized to levy; the rate or rates which may be 23
imposed; the maximum length of time the surtax may be imposed, if 24
any; the procedure which must be followed to secure voter 25
approval, if required; the purpose for which the proceeds may be 26
expended; and such other requirements as the Legislature may 27

CODING: Words stricken are deletions; words underlined are additions.
provide. Taxable transactions and administrative procedures shall 28
be as provided in s. 212.054. 29
(1) CHARTER COUNTY, COUNTY WITHIN A METROPOLITAN PLANNING 30
ORGANIZATION, MUNICIPAL AND REGIONAL TRANSPORTATION SYSTEM 31
SURTAX.— 32
(a) Each charter county that has adopted a charter, each 33
county the government of which is consolidated with that of one 34
or more municipalities, and each county that is a member of a 35
metropolitan planning organization designated pursuant to s. 36
339.175(2),each county that is within or under an interlocal 37
agreement with a regional transportation or transit authority 38
created under chapter 343 or chapter 349, each municipality that 39
has the largest population of any municipality within each 40
county, each municipality that has a population of 150,000 or 41
greater and each consortium of municipalities that have a 42
combined population of 150,000 or greater, may levy a 43
discretionary sales surtax, subject to approval by a majority 44
vote of the electorate of the county, municipality or consortium 45
of municipalities, or by a charter amendment approved by a 46
majority vote of the electorate of the county. 47
(b) The rate for all surtaxes approved under this section 48
within each county shall not exceed be up to 1 percent. In the 49
event the discretionary sales surtax is levied by a consortium of 50
municipalities located in more than one county the amount of the 51
overall tax adopted shall be equally divided and that portion 52
thereafter attributed to each county regardless of the 53
comparative area each municipality makes up of the overall 54
geographic area of the consortium. 55

CODING: Words stricken are deletions; words underlined are additions.
(c) The proposal to adopt a discretionary sales surtax as 56
provided in this subsection and to create a trust fund within for 57
the county, consortium or municipal accounts shall be placed on 58
the ballot in accordance with law at a time to be set at the 59
discretion of the governing body or in the case of a consortium 60
by agreement of the respective city councils. 61
(d) Proceeds from the surtax shall only be applied to as 62
many or as few of the uses enumerated below in whatever 63
combination the commission of a charter county, the city 64
commission, the county commission and metropolitan planning 65
organization having jurisdiction in a non-charter county or the 66
respective governing bodies of a consortium deems appropriate: 67
1. Deposited by the county in the into the related trust 68
fund and shall be used for the purposes of development, 69
construction, equipment, maintenance, operation, supportive 70
services, including a countywide bus system, on-demand 71
transportation services, and related costs of a fixed guideway 72
rapid transit system; 73
2. Remitted by the governing body of the county, consortium 74
or municipality to an expressway, transit, or transportation 75
authority created by law or a metropolitan planning organization 76
designated pursuant to s. 339.175(2), to be used, at the 77
discretion of such authority or organization, for the 78
development, construction, operation, or maintenance of roads or 79
bridges within in the geographic area of the county, consortium 80
or municipality, for the operation and maintenance of a bus 81
system, for the operation and maintenance of on-demand 82
transportation services, for the payment of principal and 83

CODING: Words stricken are deletions; words underlined are additions.
interest on existing bonds issued for the construction of such 84
roads or bridges, and, upon approval by the county, consortium or 85
city commission, such proceeds may be pledged for bonds issued to 86
refinance existing bonds or new bonds issued for the construction 87
of such roads or bridges; 88
3. Used by the county, consortium, a metropolitan planning 89
organization designated pursuant to s. 339.175(2) or municipality 90
for the planning, development, construction, operation, and 91
maintenance of roads and bridges within in the geographic area of 92
the county, consortium or municipality; for the expansion, 93
operation, and maintenance of bus and fixed guideway systems; for 94
the expansion, operation, and maintenance of on-demand 95
transportation services; and for the payment of principal and 96
interest on bonds issued for the construction of fixed guideway 97
rapid transit systems, bus systems, roads, or bridges; and such 98
proceeds may be pledged by the governing body of the county, 99
consortium or city for bonds issued to refinance existing bonds 100
or new bonds issued for the construction of such fixed guideway 101
rapid transit systems, bus systems, roads, or bridges and no 102
more than 25 percent used for nontransit uses; and 103
4. Used by the county, consortium or municipality for the 104
planning, development, construction, operation, and maintenance 105
of roads and bridges within in the geographic area of the 106
county, consortium or municipality; for the planning, 107
development, expansion, operation, and maintenance of bus and 108
fixed guideway systems; for the planning, development, 109
construction, operation, and maintenance of on-demand 110
transportation services; and for the payment of principal and 111

CODING: Words stricken are deletions; words underlined are additions.
interest on bonds issued for the construction of fixed guideway 112
rapid transit systems, bus systems, roads, or bridges; and such 113
proceeds may be pledged by the governing body of the county, 114
consortium or municipality for bonds issued to refinance existing 115
bonds or new bonds issued for the construction of such fixed 116
guideway rapid transit systems, bus systems, roads, or bridges. 117
Pursuant to an interlocal agreement entered into pursuant to 118
chapter 163, the governing body of the county may distribute 119
proceeds from the tax to a consortium levying a discretionary 120
sales surtax pursuant to this section, a municipality, or an 121
expressway or transportation authority created by law to be 122
expended for the purpose authorized by this paragraph. Any county 123
that has entered into interlocal agreements for distribution of 124
proceeds to one or more municipalities in the county shall revise 125
such interlocal agreements no less than every 5 years in order to 126
include any municipalities that have been created since the prior 127
interlocal agreements were executed. 128
(e) As used in this subsection, the term “on-demand 129
transportation services” means transportation provided between 130
flexible points of origin and destination selected by individual 131
users with such service being provided at a time that is agreed 132
upon by the user and the provider of the service and that is not 133
fixed-schedule or fixed-route in nature. 134
135
Section 2. This act shall take effect July 1, 2013. 136
137

CODING: Words stricken are deletions; words underlined are additions.
INCREASE LOCAL OPTION DIESEL TAX FIVE CENTS PER GALLON
206.87(1)(c) – Increases the local option diesel fuel tax from 6 cents to 11 cents.
Provides that 45% (5 cents) shall be used either to enhance commercial traffic or
encourage economic development.

CODING: Words stricken are deletions; words underlined are additions.
A bill to be entitled 1
An act relating to economic development and 2
infrastructure development for transportation; amending 3
s. 206.87, F.S.; increasing the local option fuel tax on 4
diesel; specifying uses for the tax increase; providing 5
an effective date. 6
7
Be It Enacted by the Legislature of the State of Florida: 8
9
Section 1. Paragraph (c) of subsection (1) of section 10
206.87, Florida Statutes, is amended to read: 11
12
206.87 Levy of tax. — 13
(1) 14
(a) An excise tax of 4 cents per gallon is hereby imposed 15
upon each net gallon of diesel fuel subject to the tax under 16
subsection (2), except alternative fuels which are subject to the 17
fee imposed by s. 206.877. 18
(b) An additional tax of 1 cent per net gallon shall be 19
imposed by each county on each net gallon of diesel fuel, which 20
shall be designated as the “ninth-cent fuel tax.” This tax shall 21
be used as provided in s. 336.021. 22
(c) An additional tax of 11 6 cents per net gallon shall be 23
imposed on diesel fuel by each county, which shall be designated 24
as the “local option fuel tax.” This tax shall be levied and used 25
as provided in s. 336.025. To the maximum extent feasible, From 26
these funds county and municipal governments shall use 45 percent 27
of the moneys received under this paragraph for transportation 28
CODING: Words stricken are deletions; words underlined are additions.
expenditures that enhance and improve commercial transportation 29
traffic or to study and promote commercial transportation 30
infrastructure projects that will address or encourage economic 31
development. 32
(d) An additional tax designated as the State Comprehensive 33
Enhanced Transportation System Tax is imposed on each net gallon 34
of diesel fuel in each county, at a rate equal to the maximum 35
rate provided in s. 206.41(1)(f). This tax shall be used as 36
provided in s. 206.608. 37
(e)1. An additional tax is imposed on each net gallon of 38
diesel fuel, which tax is on the privilege of selling diesel fuel 39
and which is designated the “fuel sales tax,” at a rate 40
determined pursuant to this paragraph. Before January 1 of 1997 41
and of each year thereafter, the department shall determine the 42
tax rate applicable to the sale of diesel fuel applicable for the 43
forthcoming 12-month period beginning January 1, rounded to the 44
nearest tenth of a cent, by adjusting the initially established 45
tax rate of 6.9 cents per gallon by the percentage change in the 46
average of the Consumer Price Index issued by the United States 47
Department of Labor for the most recent 12-month period ending 48
September 30, compared to the base year average, which is the 49
average for the 12-month period ending September 30, 1989. 50
However, the tax rate shall not be lower than 6.9 cents per 51
gallon. 52
53
Section 2. This act shall take effect July 1, 2013. 54
55

CODING: Words stricken are deletions; words underlined are additions.
INDEX CONSTITUTIONAL, COUNTY, MUNICIPAL, 9TH CENT, AND LOCAL
OPTION MOTOR FUEL AND DIESEL TAXES
SECTION ONE – MOTOR FUEL TAXES
206.41(1) (d) & (e) – This language was taken from 2007 proposed HB 527 and
updated to reflect action by the 2013 legislature.
206.41(1) (h) – Creates a new tax entitled the “constitutional, county and municipal
fuel index tax” in order to assess a single CPI adjustment on the existing 4 cents of
excise taxes without imposing separate CPI adjustments and to be consistent with
the comparable index on diesel fuels in section 2 below. The proceeds from this new
tax are then distributed proportionately to the current excise taxes.
SECTION TWO – DIESEL TAXES
206.87(1)(a) – Indexes the 4 cents excise tax (diesel equivalent to constitutional,
county and municipal taxes).
206.87(1)(b) – Indexes the 9th-cent fuel tax.
206.87(1)(c) – Indexes the local option diesel fuel tax (at the current 6 cents per
gallon rate).

CODING: Words stricken are deletions; words underlined are additions.
A bill to be entitled 1
An act relating to indexing fuel prices; amending s. 2
206.41, F.S.; authorizing counties to adopt an ordinance 3
adjusting the rate of the ninth-cent motor fuel tax and 4
the local option motor fuel tax,; authorizing the 5
department to index the sum of the constitutional, county 6
and municipal fuel taxes; providing requirements for 7
imposing the rate changes; providing requirements for 8
distribution of tax proceeds; amending s. 206.87, F.S.; 9
directing the department to annually adjust the rate of 10
the diesel fuel excise tax, ninth-cent diesel fuel tax 11
and local option diesel fuel tax based on the percentage 12
change in the Consumer Price Index; providing an 13
effective date. 14
. 15
Be It Enacted by the Legislature of the State of Florida: 16
17
Section 1. Paragraphs (d)and(e) of subsection (1) of 18
section 206.41, Florida Statutes, are amended, to read: 19
20
206.41 State taxes imposed on motor fuel.— 21
(1) The following taxes are imposed on motor fuel under the 22
circumstances described in subsection (6): 23
24
25
(d) Ninth-cent Fuel Tax 26
1. An additional tax of 1 cent per net gallon may be 27
imposed by each county on motor fuel, which shall be designated 28
CODING: Words stricken are deletions; words underlined are additions.
as the “ninth-cent fuel tax.” This tax shall be levied and used 29
as provided in s. 336.021. 30
2. Beginning July 1, 2013, and of each year thereafter, 31
a county may, by ordinance, provide that the tax rate set forth 32
in subparagraph 1. be adjusted by the percentage change in the 33
average of the Consumer Price Index issued by the United States 34
Department of Labor for the most recent 12-month period ending 35
September 30, compared to the average for the base year, which is 36
the 12-month period ending September 30, 2012, and rounded to the 37
nearest tenth of a cent. In no event shall the rate set be less 38
than the rate for the prior year. 39
3. In 2013 any rate change adopted by a county pursuant to 40
this paragraph must be adopted no later than September 30, and in 41
any subsequent year the rate change made pursuant to this 42
paragraph must be adopted by the county no later than July 1, if 43
the county intends to begin collecting the new tax rate on 44
January 1 of the following year. 45
4. Within 10 days after adopting an ordinance authorizing 46
the indexing of the tax, the county shall furnish a certified 47
copy of the ordinance to the Department of Revenue. 48
5. As soon as practical thereafter, the department shall 49
notify each terminal supplier, position holder, wholesaler, and 50
importer that the newly adopted tax rate shall be applicable for 51
the 12-month period beginning January 1 of the following year. 52
(e) 53
1. An additional tax of between 1 cent and 11 cents per net 54
gallon may be imposed on motor fuel by each county, which shall 55

CODING: Words stricken are deletions; words underlined are additions.
be designated as the “local option fuel tax.” This tax shall be 56
levied and used as provided in s. 336.025. 57
2. Beginning July 1, 2013, and each year thereafter, a 58
county may, by ordinance, provide that the tax rate set forth in 59
subparagraph 1. be adjusted by the percentage change in the 60
average of the Consumer Price Index issued by the United States 61
Department of Labor for the most recent 12-month period ending 62
September 30, compared to the average for the base year, which is 63
the 12-month period ending September 30, 2012, and rounded to the 64
nearest tenth of a cent. In no event shall the rate set be less 65
than the rate for the prior year. 66
3. In 2013 any rate change adopted by a county pursuant to 67
this paragraph must be adopted no later than September 30,and in 68
any subsequent year the rate change made pursuant to this 69
paragraph must be adopted by the county no later than July 1, if 70
the county intends to begin collecting the new tax rate on 71
January 1 of the following year. 72
4. Within 10 days after adopting an ordinance authorizing 73
the indexing of the tax, the county shall furnish a certified 74
copy of the ordinance to the Department of Revenue. 75
5. As soon as practical thereafter, the department shall 76
notify each terminal supplier, position holder, wholesaler, and 77
importer that the newly adopted tax rate shall be applicable for 78
the 12-month period beginning January 1 of the following year. 79
(h) 1. An additional tax is imposed on each net gallon of 80
motor fuel, which is designated the “CCM indexed fuel tax,” at a 81
rate determined pursuant to this paragraph. 82

CODING: Words stricken are deletions; words underlined are additions.
2. Before November 15, 2013, and November 15, of each year 83
thereafter, the department shall calculate a tax rate, by 84
multiplying the sum of the tax rates established in paragraphs 85
(a), (b) and (c) by the percentage change in the average of the 86
Consumer Price Index issued by the United States Department of 87
Labor for the most recent 12-month period ending September 30, 88
compared to the base year average. The base year average shall be 89
the average for the 12-month period ending September 30, 2012. 90
The resulting product, rounded to the nearest one tenth of a 91
cent, shall be the rate applicable to the sale of fuel for the 92
12-month period beginning January 1 the following year. However, 93
the tax rate shall not be less than zero cents per gallon. 94
3. As soon as practical thereafter, the department shall 95
notify each terminal supplier, position holder, wholesaler, and 96
importer that the newly adopted tax rate shall be applicable for 97
the 12-month period beginning January 1 of the following year. 98
4. The proceeds from this tax shall be distributed as 99
follows: 50 percent in the same manner as proceeds distributed in 100
paragraph (a), 25 percent in the same manner as proceeds 101
distributed in paragraph (b) and 25 percent in the same manner 102
as proceeds distributed in paragraph (c). 103
104
Section 2. Paragraphs (a), (b) and (c) of subsection (1) of 105
section 206.87, Florida Statutes, are amended to read: 106
107
206.87 Levy of tax.— 108
(1) 109
(a) Excise Tax 110
CODING: Words stricken are deletions; words underlined are additions.
1. An excise tax of 4 cents per gallon is hereby imposed 111
upon each net gallon of diesel fuel subject to the tax under 112
subsection (2), except alternative fuels which are subject to the 113
fee imposed by s. 206.877. 114
2. Before January 1 of 2014 and of each year thereafter, 115
the department shall determine the tax rate applicable to the 116
sale of diesel fuel pursuant to this paragraph for the 117
forthcoming 12-month period beginning January 1, rounded to the 118
nearest tenth of a cent, by adjusting the initially established 119
tax rate of 4.0 cents per gallon by the percentage change in the 120
average of the Consumer Price Index issued by the United States 121
Department of Labor for the most recent 12-month period ending 122
September 30, compared to the average for the base year. The base 123
year shall be the 12-month period ending September 30, 2012. 124
However, the tax rate shall not be lower than 4.0 cents per 125
gallon. 126
(b) Ninth-Cent Fuel Tax 127
1. An additional tax of 1 cent per net gallon shall be 128
imposed by each county on each net gallon of diesel fuel, which 129
shall be designated as the “ninth-cent fuel tax.” 130
2. Before January 1 of 2014 and of each year thereafter, 131
the department shall determine the tax rate applicable to the 132
sale of diesel fuel for the forthcoming 12-month period beginning 133
January 1, rounded to the nearest tenth of a cent, by adjusting 134
the initially established tax rate of 1.0 cent per gallon by the 135
percentage change in the average of the Consumer Price Index 136
issued by the United States Department of Labor for the most 137
recent 12-month period ending September 30, compared to the base 138
CODING: Words stricken are deletions; words underlined are additions.
year average. The base year average shall be the average for the 139
12-month period ending September 30, 2012. However, the tax rate 140
shall not be lower than 1.0 cent per gallon. This tax shall be 141
used as provided in s. 336.021. 142
(c) Local Option Fuel Tax 143
1. An additional tax of 6 cents per net gallon shall be 144
imposed on diesel fuel by each county, which shall be designated 145
as the “local option fuel tax.” 146
2. Before January 1 of 2014 and of each year thereafter, 147
the department shall determine the tax rate applicable to the 148
sale of diesel fuel for the forthcoming 12-month period beginning 149
January 1, rounded to the nearest tenth of a cent, by adjusting 150
the initially established tax rate of 6.0 cents per gallon by the 151
percentage change in the average of the Consumer Price Index 152
issued by the United States Department of Labor for the most 153
recent 12-month period ending September 30, compared to the base 154
year average. The base year average shall be the average for the 155
12-month period ending September 30, 2012. However, the tax rate 156
shall not be lower than 6.0 cents per gallon. This tax shall be 157
levied and used as provided in s. 336.025. 158
159
Section 3. This act shall take effect July 1, 2013. 160
161

98
INCREASE FUEL SALES TAX RATE 2 CENTS PER YEAR FOR 5 YEARS
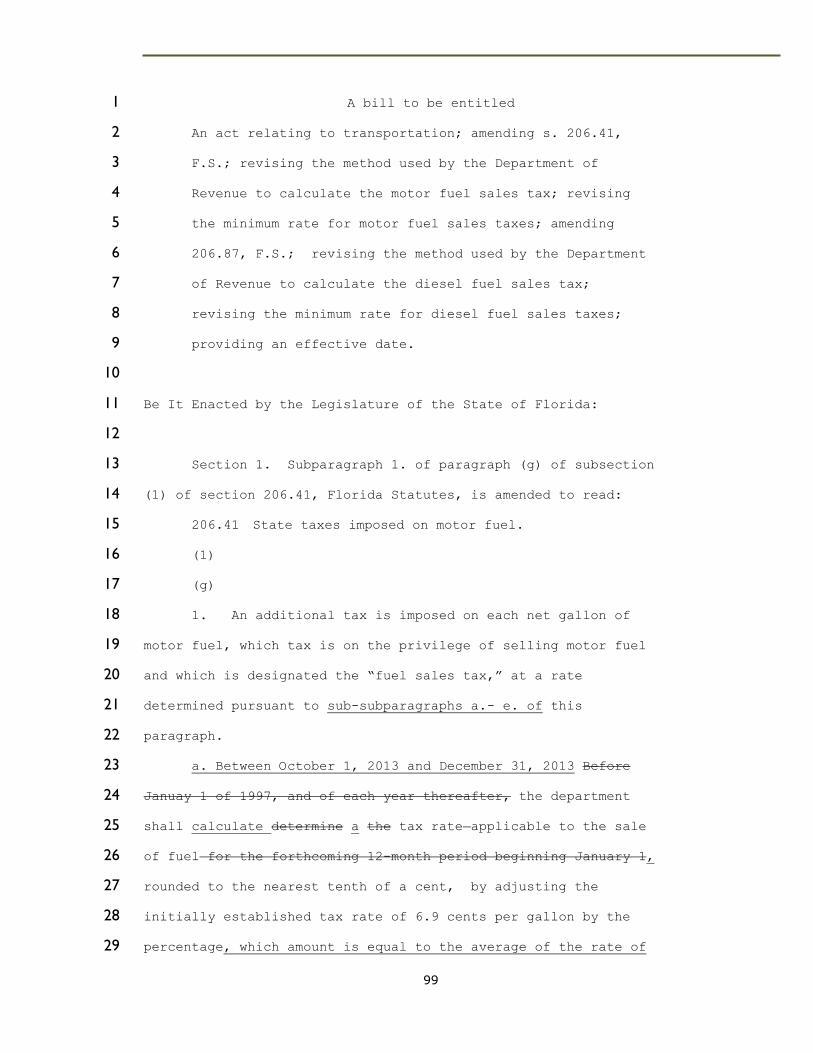
99
A bill to be entitled 1
An act relating to transportation; amending s. 206.41, 2
F.S.; revising the method used by the Department of 3
Revenue to calculate the motor fuel sales tax; revising 4
the minimum rate for motor fuel sales taxes; amending 5
206.87, F.S.; revising the method used by the Department 6
of Revenue to calculate the diesel fuel sales tax; 7
revising the minimum rate for diesel fuel sales taxes; 8
providing an effective date. 9
10
Be It Enacted by the Legislature of the State of Florida: 11
12
Section 1. Subparagraph 1. of paragraph (g) of subsection 13
(1) of section 206.41, Florida Statutes, is amended to read: 14
206.41 State taxes imposed on motor fuel. 15
(1) 16
(g) 17
1. An additional tax is imposed on each net gallon of 18
motor fuel, which tax is on the privilege of selling motor fuel 19
and which is designated the “fuel sales tax,” at a rate 20
determined pursuant to sub-subparagraphs a.- e. of this 21
paragraph. 22
a. Between October 1, 2013 and December 31, 2013 Before 23
Januay 1 of 1997, and of each year thereafter, the department 24
shall calculate determine a the tax rate applicable to the sale 25
of fuel for the forthcoming 12-month period beginning January 1, 26
rounded to the nearest tenth of a cent, by adjusting the 27
initially established tax rate of 6.9 cents per gallon by the 28
percentage, which amount is equal to the average of the rate of 29

100
change in the average of the Consumer Price Index issued each 30
month by the United States Department of Labor for the most 31
recent 12-month period ending September 30, compared to the base 32
year average, which is the average for the 12-month period ending 33
September 30, 1989, and then adding 2 cents. However, the tax 34
rate shall not be lower than 6.9 cents per gallon. 35
b. After October 1, 2014 and before December 31, 2014, 36
and between the same days through 2017, the department shall 37
calculate a tax rate applicable to the sale of fuel, rounded to 38
the nearest tenth of a cent, by adjusting the tax rate per gallon 39
in effect at the time of the calculation by a percentage, which 40
amount is equal to the average of the percent rate of change in 41
the Consumer Price Index issued each month by the United States 42
Department of Labor for the most recent 12-month period ending 43
September 30th compared to the average of the percent rate of 44
change in the Consumer Price Index issued each month by the 45
United States Department of Labor for the 12-month period ending 46
September 30th of the next most recent year and then adding 2 47
cents. 48
c. The tax rate applicable to the sale of fuel for the 49
12-month period beginning January 1, 2014, shall be equal to the 50
amount calculated pursuant to sub-subparagraph a. of this 51
paragraph. The tax rate applicable to the sale of fuel for the 52
12-month period beginning January 1, 2015 and for each succeeding 53
calendar year through and including the 2018 calendar year, shall 54
be an amount equal to the amount calculated by the department 55
under subparagraph b. of this paragraph. 56
d. Between October 1, 2018 and December 31, 2018, and 57
between the same day in all subsequent years, the department 58

101
shall calculate a tax rate applicable to the sale of fuel, 59
rounded to the nearest tenth of a cent, by adjusting the tax rate 60
per gallon in effect at the time of the calculation by a 61
percentage, which amount is equal to the average of the percent 62
rate of change in the Consumer Price Index issued each month by 63
the United States Department of Labor for the most recent 12-64
month period ending September 30th compared to the average of the 65
percent rate of change in the Consumer Price Index issued each 66
month by the United States Department of Labor for the 12-month 67
period ending September 30th of the next most recent year. 68
e. The applicable tax rate for any 12-month period 69
beginning January 1 shall not be lower than the tax rate for the 70
preceding 12-month period. 71
72
Section 2. Subparagraph 1. of paragraph (e) of subsection (1) of 73
section 206.87, Florida Statutes, is amended to read: 74
75
206.87 Levy of tax.— 76
(1) 77
(e) 78
1. An additional tax is imposed on each net gallon of 79
diesel fuel, which tax is on the privilege of selling diesel fuel 80
and which is designated the “fuel sales tax,” at a rate 81
determined pursuant to sub-subparagraphs a.- e. of this 82
paragraph. 83
a. Between October 1, 2013 and December 31, 2013 Before 84
Januay 1 of 1997, and of each year thereafter, the department 85
shall calculate determine the a diesel fueltax rate applicable to 86
the sale of fuel for the forthcoming 12-month period beginning 87
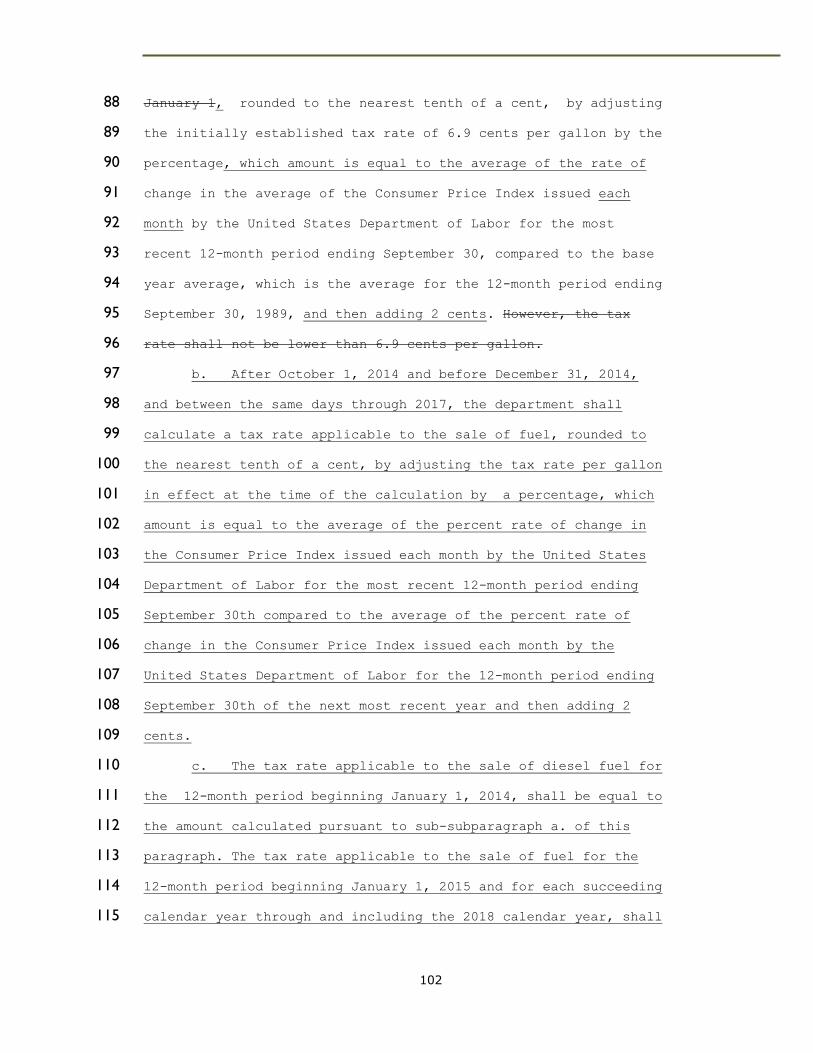
102
January 1, rounded to the nearest tenth of a cent, by adjusting 88
the initially established tax rate of 6.9 cents per gallon by the 89
percentage, which amount is equal to the average of the rate of 90
change in the average of the Consumer Price Index issued each 91
month by the United States Department of Labor for the most 92
recent 12-month period ending September 30, compared to the base 93
year average, which is the average for the 12-month period ending 94
September 30, 1989, and then adding 2 cents. However, the tax 95
rate shall not be lower than 6.9 cents per gallon. 96
b. After October 1, 2014 and before December 31, 2014, 97
and between the same days through 2017, the department shall 98
calculate a tax rate applicable to the sale of fuel, rounded to 99
the nearest tenth of a cent, by adjusting the tax rate per gallon 100
in effect at the time of the calculation by a percentage, which 101
amount is equal to the average of the percent rate of change in 102
the Consumer Price Index issued each month by the United States 103
Department of Labor for the most recent 12-month period ending 104
September 30th compared to the average of the percent rate of 105
change in the Consumer Price Index issued each month by the 106
United States Department of Labor for the 12-month period ending 107
September 30th of the next most recent year and then adding 2 108
cents. 109
c. The tax rate applicable to the sale of diesel fuel for 110
the 12-month period beginning January 1, 2014, shall be equal to 111
the amount calculated pursuant to sub-subparagraph a. of this 112
paragraph. The tax rate applicable to the sale of fuel for the 113
12-month period beginning January 1, 2015 and for each succeeding 114
calendar year through and including the 2018 calendar year, shall 115
103
be an amount equal to the amount calculated by the department 116
under subparagraph b. of this paragraph. 117
d. Between October 1, 2018 and December 31, 2018, and 118
between the same days in all subsequent years, the department 119
shall calculate a tax rate applicable to the sale of diesel fuel, 120
rounded to the nearest tenth of a cent, by adjusting the tax rate 121
per gallon in effect at the time of the calculation by a 122
percentage, which amount is equal to the average of the percent 123
rate of change in the Consumer Price Index issued each month by 124
the United States Department of Labor for the most recent 12-125
month period ending September 30th compared to the average of the 126
percent rate of change in the Consumer Price Index issued each 127
month by the United States Department of Labor for the 12-month 128
period ending September 30th of the next most recent year. 129
e. The applicable tax rate for any 12-month period 130
beginning January 1 shall not be lower than the tax rate for the 131
preceding 12-month period. 132
133
134
135
Section 3. This act shall take effect July 1, 2013. 136
137

104
TRANSFER FEES AND SURCHARGES TO STTF FROM GR FUND

105
A bill to be entitled 1
An act relating to transportation funding; amending s. 2
319.32, F.S.; removing exception on fees charged on a 3
certificate of title for a motor vehicle for hire from 4
deposits into the State Transportation Trust Fund; 5
removing provision requiring excess deposits into the 6
State Transportation Trust Fund be paid to the General 7
Revenue Fund; amending s. 320.072, F.S.; removing 8
provision to distribute a portion of the initial 9
application for registration fee to the General Revenue 10
Fund; instructing the Department of Revenue or its agent 11
to remit all monies collected pursuant to this section, 12
less refunds, to the State Transportation Trust Fund; 13
amending 320.08, F.S., deleting provisions to deposit a 14
portion of annual license taxes into the General Revenue 15
Fund; amending s. 320.081, F.S., removing provision to 16
deposit a percentage of the additional surcharge on each 17
commercial motor vehicle into the General Revenue Fund ; 18
amending s. 320.084, F.S., increasing the amount and 19
revising the distribution of the license fee surcharge 20
under s. 320.08; amending s. 320.084046, F.S., 21
decreasing the amount and revising the distribution of 22
the license fee surcharge under s. 320.08; providing an 23
effective date. 24
25
Be It Enacted by the Legislature of the State of Florida: 26
27
Section 1. Paragraph (a) of subsection (5) of section 28
319.32, Florida Statutes, is amended to read: 29

106
30
319.32 Fees; service charges; disposition.— 31
(5)(a) Forty-seven dollars of each fee collected, except for fees charged on a certificate 32
of title for a motor vehicle for hire registered under s. 320.08(6), for each applicable original 33
certificate of title and each applicable duplicate copy of a certificate of title, after deducting the 34
service charges imposed by s. 215.20, shall be deposited into the State Transportation Trust Fund. 35
Deposits to the State Transportation Trust Fund pursuant to this paragraph may not exceed $200 36
million in any fiscal year and any collections in excess of that amount during the fiscal year shall 37
be paid into the General Revenue Fund. 38
39
Section 2. Subsection (4) of section 320.072, Florida Statutes, 40
is amended to read: 41
42
320.072 Additional fee imposed on certain motor vehicle 43
registration transactions.— 44
(4) A tax collector or other authorized agent of the 45
department shall promptly remit 44.5 percent of all moneys 46
collected pursuant to this section, less any refunds granted 47
pursuant to subsection (3), to the department to be deposited 48
into the State Transportation Trust Fund. The remaining 55.5 49
percent shall be deposited into the General Revenue Fund. 50
51
Section 3. Subsections (1)-(9) and (12)-(15) of Section 52
320.08, Florida Statutes, are amended to read: 53
54
320.08 License taxes.— Except as otherwise provided herein, 55
there are hereby levied and imposed annual license taxes for the 56
operation of motor vehicles, mopeds, motorized bicycles as 57

107
defined in s. 316.003(2), tri-vehicles as defined in s. 316.003, 58
and mobile homes, as defined in s. 320.01, which shall be paid to 59
and collected by the department or its agent upon the 60
registration or renewal of registration of the following: 61
(1) MOTORCYCLES AND MOPEDS.— 62
(a) Any motorcycle: $13.50 flat, of which $3.50 shall be 63
deposited into the General Revenue Fund. 64
(b) Any moped: $6.75 flat, of which $1.75 shall be 65
deposited into the General Revenue Fund. 66
(c) Upon registration of any motorcycle, motor-driven 67
cycle, or moped there shall be paid in addition to the license 68
taxes specified in this subsection a nonrefundable motorcycle 69
safety education fee in the amount of $2.50. The proceeds of such 70
additional fee shall be deposited in the Highway Safety Operating 71
Trust Fund to fund a motorcycle driver improvement program 72
implemented pursuant to s. 322.025, the Florida Motorcycle Safety 73
Education Program established in s. 322.0255, or the general 74
operations of the department. 75
(d) An ancient or antique motorcycle: $8.50 flat, of which 76
$3.50 shall be deposited into the General Revenue Fund. 77
(2) AUTOMOBILES OR TRI-VEHICLES FOR PRIVATE USE.— 78
(a) An ancient or antique automobile, as defined in s. 79
320.086, or a street rod, as defined in s. 320.0863: $10.25 flat, 80
of which $2.75 shall be deposited into the General Revenue Fund. 81
(b) Net weight of less than 2,500 pounds: $19.50 flat, of 82
which $5 shall be deposited into the General Revenue Fund. 83
(c) Net weight of 2,500 pounds or more, but less than 3,500 84
pounds: $30.50 flat, of which $8 shall be deposited into the 85
General Revenue Fund. 86

108
(d) Net weight of 3,500 pounds or more: $44 flat, of which 87
$11.50 shall be deposited into the General Revenue Fund. 88
(3) TRUCKS.— 89
(a) Net weight of less than 2,000 pounds: $19.50 flat, of 90
which $5 shall be deposited into the General Revenue Fund. 91
(b) Net weight of 2,000 pounds or more, but not more than 92
3,000 pounds: $30.50 flat, of which $8 shall be deposited into 93
the General Revenue Fund. 94
(c) Net weight more than 3,000 pounds, but not more than 95
5,000 pounds: $44 flat, of which $11.50 shall be deposited into 96
the General Revenue Fund. 97
(d) A truck defined as a “goat,” or any other vehicle if 98
used in the field by a farmer or in the woods for the purpose of 99
harvesting a crop, including naval stores, during such harvesting 100
operations, and which is not principally operated upon the roads 101
of the state: $10.25 flat, of which $2.75 shall be deposited into 102
the General Revenue Fund. A “goat” is a motor vehicle designed, 103
constructed, and used principally for the transportation of 104
citrus fruit within citrus groves or for the transportation of 105
crops on farms, and which can also be used for the hauling of 106
associated equipment or supplies, including required sanitary 107
equipment, and the towing of farm trailers. 108
(e) An ancient or antique truck, as defined in s. 320.086: 109
$10.25 flat, of which $2.75 shall be deposited into the General 110
Revenue Fund. 111
(4) HEAVY TRUCKS, TRUCK TRACTORS, FEES ACCORDING TO GROSS 112
VEHICLE WEIGHT.— 113

109
(a) Gross vehicle weight of 5,001 pounds or more, but less 114
than 6,000 pounds: $60.75 flat, of which $15.75 shall be 115
deposited into the General Revenue Fund. 116
(b) Gross vehicle weight of 6,000 pounds or more, but less 117
than 8,000 pounds: $87.75 flat, of which $22.75 shall be 118
deposited into the General Revenue Fund. 119
c) Gross vehicle weight of 8,000 pounds or more, but less 120
than 10,000 pounds: $103 flat, of which $27 shall be deposited 121
into the General Revenue Fund. 122
(d) Gross vehicle weight of 10,000 pounds or more, but less 123
than 15,000 pounds: $118 flat, of which $31 shall be deposited 124
into the General Revenue Fund. 125
(e) Gross vehicle weight of 15,000 pounds or more, but less 126
than 20,000 pounds: $177 flat, of which $46 shall be deposited 127
into the General Revenue Fund. 128
(f) Gross vehicle weight of 20,000 pounds or more, but less 129
than 26,001 pounds: $251 flat, of which $65 shall be deposited 130
into the General Revenue Fund. 131
(g) Gross vehicle weight of 26,001 pounds or more, but less 132
than 35,000: $324 flat, of which $84 shall be deposited into the 133
General Revenue Fund. 134
(h) Gross vehicle weight of 35,000 pounds or more, but less 135
than 44,000 pounds: $405 flat, of which $105 shall be deposited 136
into the General Revenue Fund. 137
(i) Gross vehicle weight of 44,000 pounds or more, but less 138
than 55,000 pounds: $773 flat, of which $201 shall be deposited 139
into the General Revenue Fund. 140

110
(j) Gross vehicle weight of 55,000 pounds or more, but less 141
than 62,000 pounds: $916 flat, of which $238 shall be deposited 142
into the General Revenue Fund. 143
(k) Gross vehicle weight of 62,000 pounds or more, but less 144
than 72,000 pounds: $1,080 flat, of which $280 shall be deposited 145
into the General Revenue Fund. 146
(l) Gross vehicle weight of 72,000 pounds or more: $1,322 147
flat, of which $343 shall be deposited into the General Revenue 148
Fund. 149
(m) Notwithstanding the declared gross vehicle weight, a 150
truck tractor used within a 150-mile radius of its home address 151
is eligible for a license plate for a fee of $324 flat if: 152
1. The truck tractor is used exclusively for hauling 153
forestry products; or 154
2. The truck tractor is used primarily for the hauling of 155
forestry products, and is also used for the hauling of associated 156
forestry harvesting equipment used by the owner of the truck 157
tractor. 158
Of the fee imposed by this paragraph, $84 shall be deposited into 159
the General Revenue Fund. 160
(n) A truck tractor or heavy truck, not operated as a for-161
hire vehicle, which is engaged exclusively in transporting raw, 162
unprocessed, and nonmanufactured agricultural or horticultural 163
products within a 150-mile radius of its home address, is 164
eligible for a restricted license plate for a fee of: 165

111
1. If such vehicle’s declared gross vehicle weight is less 166
than 44,000 pounds, $87.75 flat, of which $22.75 shall be 167
deposited into the General Revenue Fund. 168
2. If such vehicle’s declared gross vehicle weight is 169
44,000 pounds or more and such vehicle only transports from the 170
point of production to the point of primary manufacture; to the 171
point of assembling the same; or to a shipping point of a rail, 172
water, or motor transportation company, $324 flat, of which $84 173
shall be deposited into the General Revenue Fund. 174
Such not-for-hire truck tractors and heavy trucks used 175
exclusively in transporting raw, unprocessed, and nonmanufactured 176
agricultural or horticultural products may be incidentally used 177
to haul farm implements and fertilizers delivered direct to the 178
growers. The department may require any documentation deemed 179
necessary to determine eligibility prior to issuance of this 180
license plate. For the purpose of this paragraph, “not-for-hire” 181
means the owner of the motor vehicle must also be the owner of 182
the raw, unprocessed, and nonmanufactured agricultural or 183
horticultural product, or the user of the farm implements and 184
fertilizer being delivered. 185
(5) SEMITRAILERS, FEES ACCORDING TO GROSS VEHICLE WEIGHT; 186
SCHOOL BUSES; SPECIAL PURPOSE VEHICLES.— 187
(a) 188
1. A semitrailer drawn by a GVW truck tractor by means of a 189
fifth-wheel arrangement: $13.50 flat per registration year or any 190
part thereof, of which $3.50 shall be deposited into the General 191
Revenue Fund. 192

112
2. A semitrailer drawn by a GVW truck tractor by means of a 193
fifth-wheel arrangement: $68 flat per permanent registration, of 194
which $18 shall be deposited into the General Revenue Fund. 195
(b) A motor vehicle equipped with machinery and designed 196
for the exclusive purpose of well drilling, excavation, 197
construction, spraying, or similar activity, and which is not 198
designed or used to transport loads other than the machinery 199
described above over public roads: $44 flat, of which $11.50 200
shall be deposited into the General Revenue Fund. 201
(c) A school bus used exclusively to transport pupils to 202
and from school or school or church activities or functions 203
within their own county: $41 flat, of which $11 shall be 204
deposited into the General Revenue Fund. 205
(d) A wrecker, as defined in s. 320.01(40), which is used 206
to tow a vessel as defined in s. 327.02(39), a disabled, 207
abandoned, stolen-recovered, or impounded motor vehicle as 208
defined in s. 320.01(38), or a replacement motor vehicle as 209
defined in s. 320.01(39): $41 flat, of which $11 shall be 210
deposited into the General Revenue Fund. 211
(e) A wrecker that is used to tow any nondisabled motor 212
vehicle, a vessel, or any other cargo unless used as defined in 213
paragraph (d), as follows: 214
1. Gross vehicle weight of 10,000 pounds or more, but less 215
than 15,000 pounds: $118 flat, of which $31 shall be deposited 216
into the General Revenue Fund. 217
2. Gross vehicle weight of 15,000 pounds or more, but less 218
than 20,000 pounds: $177 flat, of which $46 shall be deposited 219
into the General Revenue Fund. 220

113
3. Gross vehicle weight of 20,000 pounds or more, but less 221
than 26,000 pounds: $251 flat, of which $65 shall be deposited 222
into the General Revenue Fund. 223
4. Gross vehicle weight of 26,000 pounds or more, but less 224
than 35,000 pounds: $324 flat, of which $84 shall be deposited 225
into the General Revenue Fund. 226
5. Gross vehicle weight of 35,000 pounds or more, but less 227
than 44,000 pounds: $405 flat, of which $105 shall be deposited 228
into the General Revenue Fund. 229
6. Gross vehicle weight of 44,000 pounds or more, but less 230
than 55,000 pounds: $772 flat, of which $200 shall be deposited 231
into the General Revenue Fund. 232
7. Gross vehicle weight of 55,000 pounds or more, but less 233
than 62,000 pounds: $915 flat, of which $237 shall be deposited 234
into the General Revenue Fund. 235
8. Gross vehicle weight of 62,000 pounds or more, but less 236
than 72,000 pounds: $1,080 flat, of which $280 shall be deposited 237
into the General Revenue Fund. 238
9. Gross vehicle weight of 72,000 pounds or more: $1,322 239
flat, of which $343 shall be deposited into the General Revenue 240
Fund. 241
(f) A hearse or ambulance: $40.50 flat, of which $10.50 242
shall be deposited into the General Revenue Fund. 243
(6) MOTOR VEHICLES FOR HIRE.— 244
(a) Under nine passengers: $17 flat, of which $4.50 shall 245
be deposited into the General Revenue Fund; plus $1.50 per cwt, 246
of which 50 cents shall be deposited into the General Revenue 247
Fund. 248
114
(b) Nine passengers and over: $17 flat, of which $4.50 249
shall be deposited into the General Revenue Fund; plus $2 per 250
cwt, of which 50 cents shall be deposited into the General 251
Revenue Fund. 252
(7) TRAILERS FOR PRIVATE USE.— 253
(a) Any trailer weighing 500 pounds or less: $6.75 flat per 254
year or any part thereof, of which $1.75 shall be deposited into 255
the General Revenue Fund. 256
(b) Net weight over 500 pounds: $3.50 flat, of which $1 257
shall be deposited into the General Revenue Fund; plus $1 per 258
cwt, of which 25 cents shall be deposited into the General 259
Revenue Fund. 260
(8) TRAILERS FOR HIRE.— 261
(a) Net weight under 2,000 pounds: $3.50 flat, of which $1 262
shall be deposited into the General Revenue Fund; plus $1.50 per 263
cwt, of which 50 cents shall be deposited into the General 264
Revenue Fund. 265
(b) Net weight 2,000 pounds or more: $13.50 flat, of which 266
$3.50 shall be deposited into the General Revenue Fund; plus 267
$1.50 per cwt, of which 50 cents shall be deposited into the 268
General Revenue Fund. 269
(9) RECREATIONAL VEHICLE-TYPE UNITS.— 270
(a) A travel trailer or fifth-wheel trailer, as defined by 271
s. 320.01(1)(b), that does not exceed 35 feet in length: $27 272
flat, of which $7 shall be deposited into the General Revenue 273
Fund. 274
(b) A camping trailer, as defined by s. 320.01(1)(b)2.: 275
$13.50 flat, of which $3.50 shall be deposited into the General 276
Revenue Fund. 277
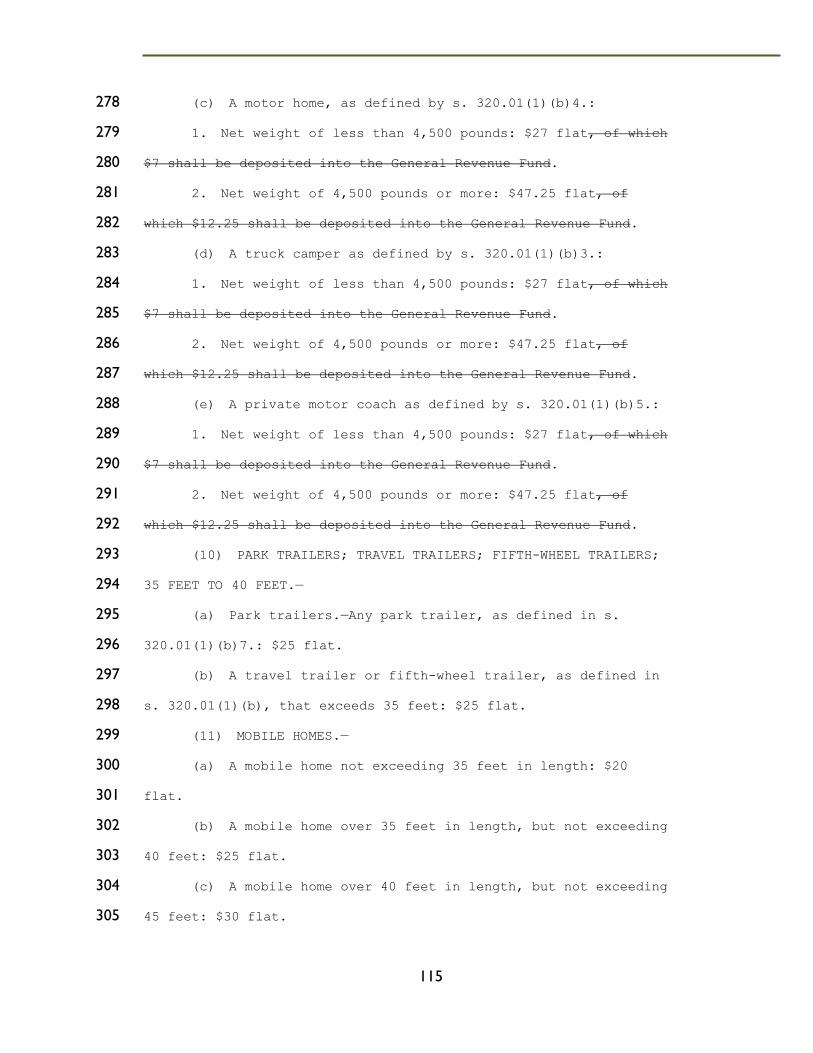
115
(c) A motor home, as defined by s. 320.01(1)(b)4.: 278
1. Net weight of less than 4,500 pounds: $27 flat, of which 279
$7 shall be deposited into the General Revenue Fund. 280
2. Net weight of 4,500 pounds or more: $47.25 flat, of 281
which $12.25 shall be deposited into the General Revenue Fund. 282
(d) A truck camper as defined by s. 320.01(1)(b)3.: 283
1. Net weight of less than 4,500 pounds: $27 flat, of which 284
$7 shall be deposited into the General Revenue Fund. 285
2. Net weight of 4,500 pounds or more: $47.25 flat, of 286
which $12.25 shall be deposited into the General Revenue Fund. 287
(e) A private motor coach as defined by s. 320.01(1)(b)5.: 288
1. Net weight of less than 4,500 pounds: $27 flat, of which 289
$7 shall be deposited into the General Revenue Fund. 290
2. Net weight of 4,500 pounds or more: $47.25 flat, of 291
which $12.25 shall be deposited into the General Revenue Fund. 292
(10) PARK TRAILERS; TRAVEL TRAILERS; FIFTH-WHEEL TRAILERS; 293
35 FEET TO 40 FEET.— 294
(a) Park trailers.—Any park trailer, as defined in s. 295
320.01(1)(b)7.: $25 flat. 296
(b) A travel trailer or fifth-wheel trailer, as defined in 297
s. 320.01(1)(b), that exceeds 35 feet: $25 flat. 298
(11) MOBILE HOMES.— 299
(a) A mobile home not exceeding 35 feet in length: $20 300
flat. 301
(b) A mobile home over 35 feet in length, but not exceeding 302
40 feet: $25 flat. 303
(c) A mobile home over 40 feet in length, but not exceeding 304
45 feet: $30 flat. 305
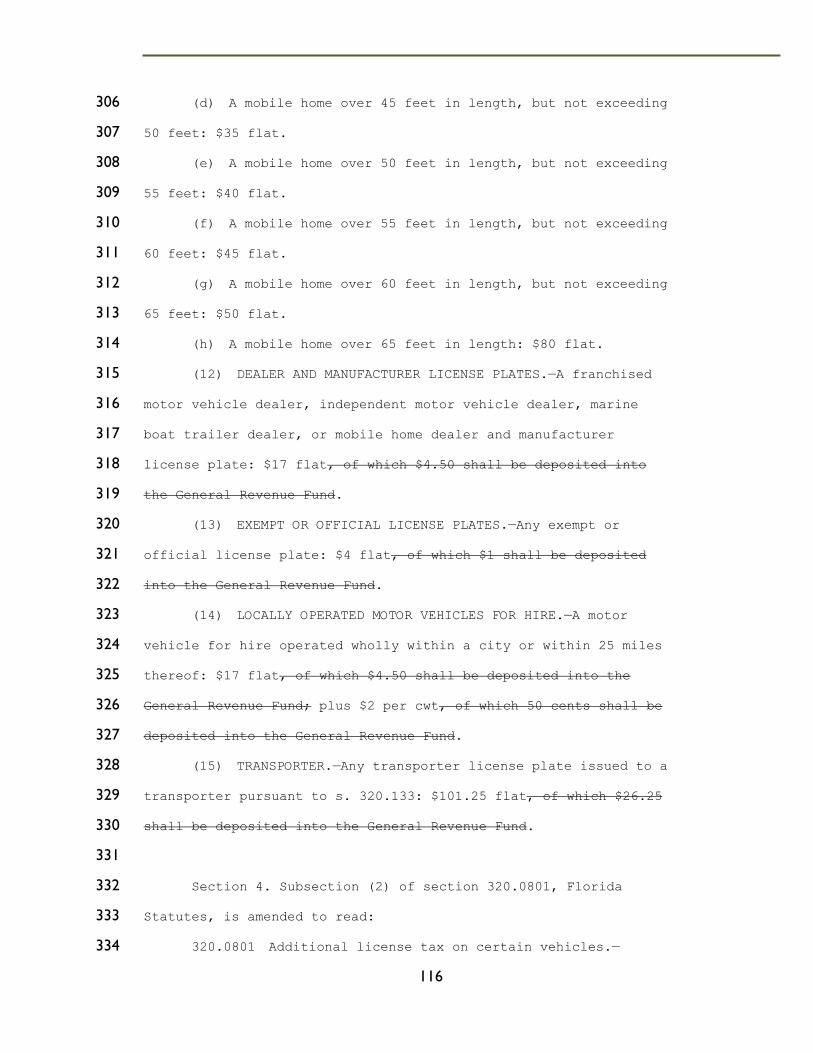
116
(d) A mobile home over 45 feet in length, but not exceeding 306
50 feet: $35 flat. 307
(e) A mobile home over 50 feet in length, but not exceeding 308
55 feet: $40 flat. 309
(f) A mobile home over 55 feet in length, but not exceeding 310
60 feet: $45 flat. 311
(g) A mobile home over 60 feet in length, but not exceeding 312
65 feet: $50 flat. 313
(h) A mobile home over 65 feet in length: $80 flat. 314
(12) DEALER AND MANUFACTURER LICENSE PLATES.—A franchised 315
motor vehicle dealer, independent motor vehicle dealer, marine 316
boat trailer dealer, or mobile home dealer and manufacturer 317
license plate: $17 flat, of which $4.50 shall be deposited into 318
the General Revenue Fund. 319
(13) EXEMPT OR OFFICIAL LICENSE PLATES.—Any exempt or 320
official license plate: $4 flat, of which $1 shall be deposited 321
into the General Revenue Fund. 322
(14) LOCALLY OPERATED MOTOR VEHICLES FOR HIRE.—A motor 323
vehicle for hire operated wholly within a city or within 25 miles 324
thereof: $17 flat, of which $4.50 shall be deposited into the 325
General Revenue Fund; plus $2 per cwt, of which 50 cents shall be 326
deposited into the General Revenue Fund. 327
(15) TRANSPORTER.—Any transporter license plate issued to a 328
transporter pursuant to s. 320.133: $101.25 flat, of which $26.25 329
shall be deposited into the General Revenue Fund. 330
331
Section 4. Subsection (2) of section 320.0801, Florida 332
Statutes, is amended to read: 333
320.0801 Additional license tax on certain vehicles.— 334
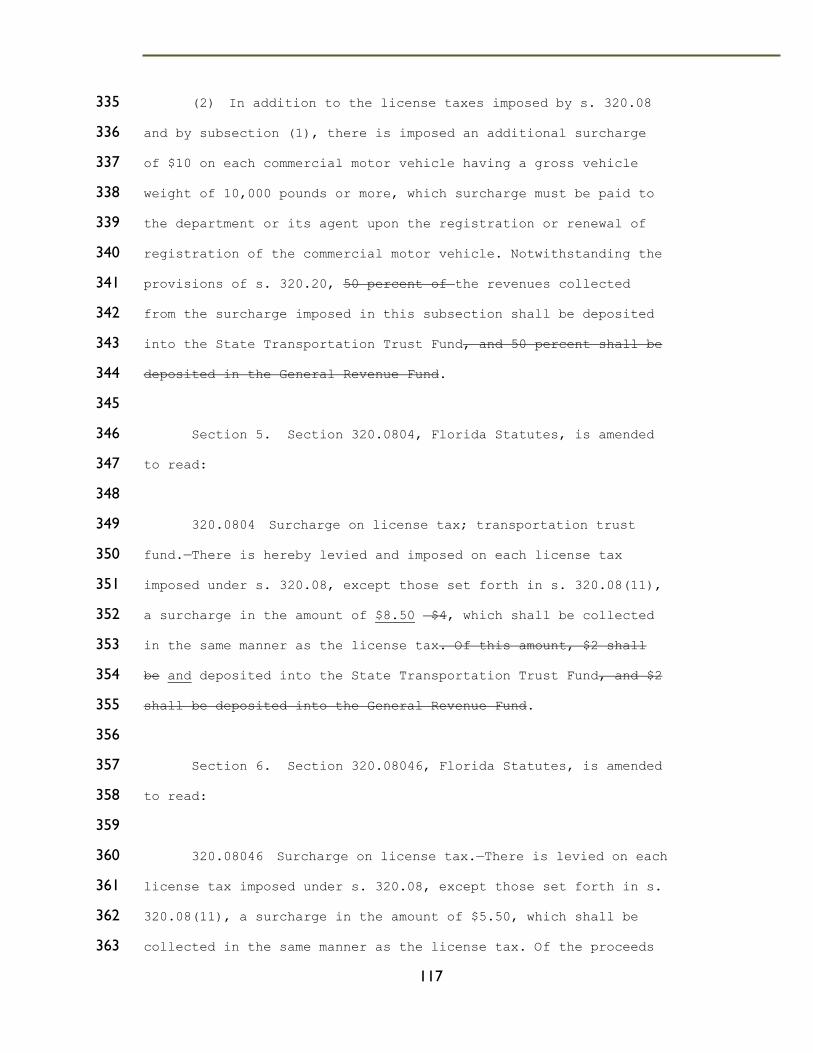
117
(2) In addition to the license taxes imposed by s. 320.08 335
and by subsection (1), there is imposed an additional surcharge 336
of $10 on each commercial motor vehicle having a gross vehicle 337
weight of 10,000 pounds or more, which surcharge must be paid to 338
the department or its agent upon the registration or renewal of 339
registration of the commercial motor vehicle. Notwithstanding the 340
provisions of s. 320.20, 50 percent of the revenues collected 341
from the surcharge imposed in this subsection shall be deposited 342
into the State Transportation Trust Fund, and 50 percent shall be 343
deposited in the General Revenue Fund. 344
345
Section 5. Section 320.0804, Florida Statutes, is amended 346
to read: 347
348
320.0804 Surcharge on license tax; transportation trust 349
fund.—There is hereby levied and imposed on each license tax 350
imposed under s. 320.08, except those set forth in s. 320.08(11), 351
a surcharge in the amount of $8.50 $4, which shall be collected 352
in the same manner as the license tax. Of this amount, $2 shall 353
be and deposited into the State Transportation Trust Fund, and $2 354
shall be deposited into the General Revenue Fund. 355
356
Section 6. Section 320.08046, Florida Statutes, is amended 357
to read: 358
359
320.08046 Surcharge on license tax.—There is levied on each 360
license tax imposed under s. 320.08, except those set forth in s. 361
320.08(11), a surcharge in the amount of $5.50, which shall be 362
collected in the same manner as the license tax. Of the proceeds 363
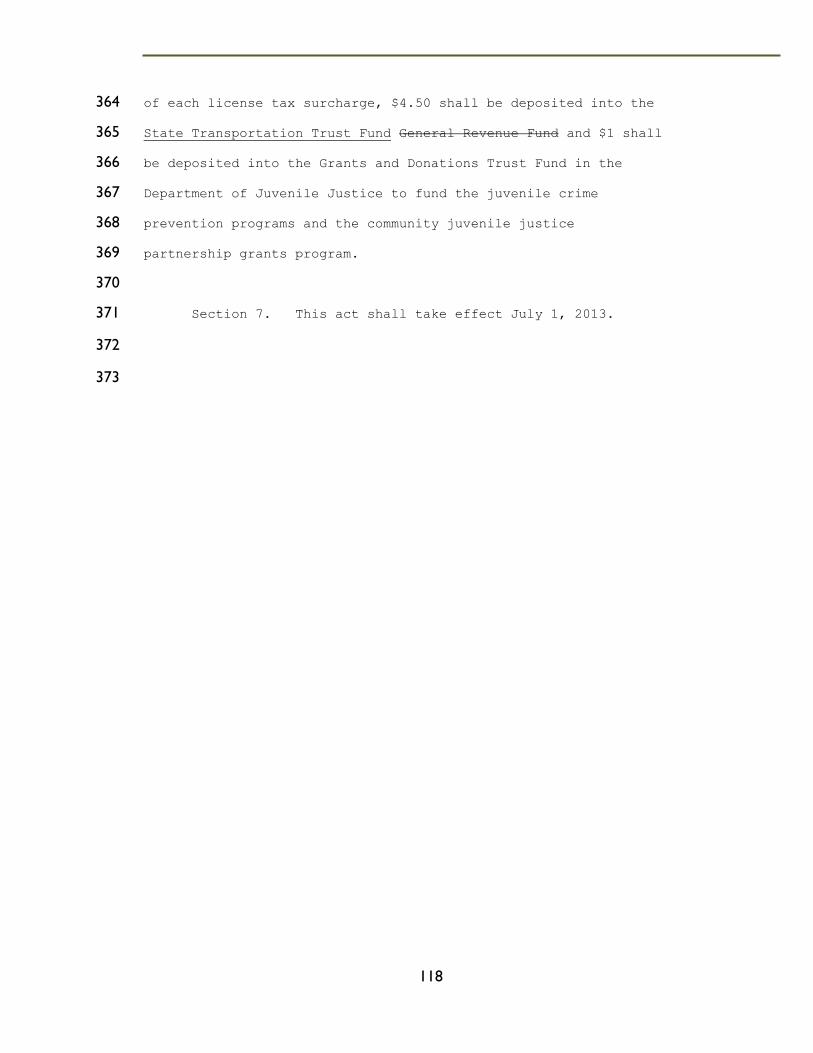
118
of each license tax surcharge, $4.50 shall be deposited into the 364
State Transportation Trust Fund General Revenue Fund and $1 shall 365
be deposited into the Grants and Donations Trust Fund in the 366
Department of Juvenile Justice to fund the juvenile crime 367
prevention programs and the community juvenile justice 368
partnership grants program. 369
370
Section 7. This act shall take effect July 1, 2013. 371
372
373

119
CONDUCT A VEHICLE MILES TRAVELED STUDY

120
A bill to be entitled 1
An Act relating to transportation funding; directing the Department of 2 Transportation to commission a study of the Vehicle Miles Traveled 3 concept for the purpose of charging and collecting a user fee to be 4 used for transportation purposes; providing an effective date. 5
6 Be It Enacted by the Legislature of the State of Florida: 7
8
The legislature recognizes that the existing fuel tax system 9
used to derive revenues for the funding of transportation 10
projects in this state is no longer adequate to meet the 11
state’s needs . To this end the legislature directs the 12
department to conduct an extensive study on the use of charging 13
drivers based on the vehicle miles traveled as a source for 14
transportation funding. The Legislature recognizes that over 15
time there the current fuel tax system has become increasingly 16
less sustainable as the primary transportation funding source. 17
While current fuel tax programs have served as a true user fee 18
for decades, significant increases in mandated vehicle fuel 19
efficiency, the introduction of all electric and hybrid 20
vehicles has significantly eroded the transportation revenues 21
derived from these fees. The Legislature also recognizes that 22
there are real concerns over the concept of charging users of 23
the highway system based on each mile traveled. The concerns 24
primarily involve citizens’ privacy. Other issues include the 25
cost of implementing such a system and institutional issues 26
associated with revenue sharing. It is, therefore, the intent 27
of this Legislature that this study will, at a minimum, address 28
these issues. To accomplish this task the department shall 29
establish a pilot project to assist in analyzing the concept 30

121
and in developing a business plan for transitioning Florida to 31
a vehicle miles traveled based system. 32
33
Section 1. A new section is created to read: 34
Vehicle Miles Traveled Pilot Project and Study- 35
36
(1)The Department of Transportation, its staff, or others 37
conducting the study to be done pursuant to this section shall 38
furnish the Governor, President of the Senate, Speaker of the 39
House of Representatives, Florida Department of Transportation, 40
and Metropolitan Planning Organization Advisory Council a written 41
study containing recommendations, including facts supporting the 42
recommendations 43
44
(2)The study shall examine the types of vehicles being operated 45
on Florida’s state and local highways and recommend an 46
appropriate charge for various modes, including, among others, 47
all private use vehicles, motorcycles, light trucks, all 48
commercial vehicles, and private vehicles towing boats or 49
trailers, taking into consideration vehicle weight, number of 50
axels, type of roadway being used and other factors determined to 51
be relevant. The study shall also examine the purpose of the 52
trips being taken by the drivers of the vehicle, such as going to 53
work, doing errands, vacation driving, transportation of 54
commodities, commercial and business purposes and like 55
categories. Public and private vehicles shall be included. 56
57
(3)The pilot project shall be conducted within the department’s 58
district which has the greatest diversity of traffic and 59

122
combination of rural and urban roadways. Further, the pilot 60
project will use a minimum of three vendors who have the 61
capabilities to operate and administer a vehicle mile traveled 62
program. There must be an inter-operability component offered by 63
each of the vendors chosen for the pilot program. In addition, 64
the vendors must have sophisticated privacy protections. Each 65
vendor shall also be required to submit a business model for 66
implementation of a statewide system for implementing, charging 67
and collecting a vehicle miles traveled transportation funding 68
program. The pilot project shall be conducted over the course of 69
a six month period, once it is in place. In addition to the 70
tracking of the miles traveled by the vehicles, an extensive 71
survey shall be conducted of the private and public operators to 72
examine privacy concerns, glitches with billing software and 73
statements, backroom operations and any other appropriate areas. 74
75
(4)The pilot project shall in all ways be operated as if the 76
program were in place. However, all statements shall be limited 77
to a history of miles traveled by each vehicle and no actual 78
charges shall be due from the participants in the pilot program. 79
80
(5) The study shall be completed and the recommendations 81
submitted no later than December 31, 2013. 82
83
Section 2. This act shall take effect upon becoming law. 84
85
123
References
Boos, M., and Moruza, A. (2008). Vehicle Miles Traveled (VMT) Tax: An Alternative To the
Gas Tax for Generating Highway Revenue. Virginia Department of Transportation
Congressional Budget Office. (2008). Issues and Options in Infrastructure Investment.
Florida Department of Transportation (FDOT). (May 2011). Transportation Funding Sources.
Office of Financial Development.
FDOT. (May 2006). SIS Multi-modal Unfunded Needs Plan.
FDOT Department of Revenue, Motor Fuel Consumption Data, 2009 Florida Motor Gasoline
and Diesel Fuel Report.
FDOT. Florida VMT. Office of Policy Planning, November 22, 2010.
FDOT. (2010) Florida Highway Data Source Book, Florida Public Road Mileage Reports.
Florida Revenue Estimating Conference. (August 2010, October 2011). Transportation
Revenue Actual and Forecast Revenue by Revenue Source.
Kramer, J., and Bond, A. (2008). 2008 Review of Florida’s MPO Long Range Transportation
Plans. Center for Urban Transportation Research (CUTR), University of South Florida.
Kramer, J., and Mierzejewski, E. (2002). 2002 Review of Florida’s Twenty-Five Long Range
Transportation Plans. CUTR.
Marshall, M., and Mierzejewski, E. (1997). A Review of the Long-Range Transportation Plans
of Florida’s Metropolitan Planning Organizations.” CUTR.
National Surface Transportation Policy and Revenue Study Commission. (2007).
Transportation for Tomorrow.
National Surface Transportation Infrastructure Financing Commission. (2009). Paying Our
Way—A New Framework for Transportation Finance.
National Transportation Policy Project. (2009). Performance Driven: A New Vision of U.S.
Transportation Policy.
Urban Land Institute. (2010). Infrastructure 2010.
U.S. Department of Energy. (2010). Transportation Energy Data Book, Energy Efficiency,
and Renewable Energy.
U.S. Department of Transportation, Federal Highway Administration. (2010.) Traffic Trends.
August.
WardsAuto Fuel Economy Index (2011). Whitty, J. (2007). Oregon’s Mileage Fee Concept
and Road User Fee Pilot Program. Oregon Department of Transportation.
Zaragoza, D., and Mierzejewski, E. (1997). Financial Shortfalls of Florida MPO Long Range
Transportation Plans. CUTR.