Floods of 1952 in California - USGS · FLOODS OF 1952 IN CALIFORNIA By S. E. Rantz and Harlowe M....
52
Floods of 1952 in California FLOOD OF JANUARY 1952 [N THE SOUTH SAN FRANCISCO BAY REGION ?y S. E. RANTZ >NOWMELT FLOOD OF 1952 IN KERN RIVER, TULARE ,AKE, AND SAN JOAQUIN RIVER BASINS fy H. M. STAFFORD LOO D S OF 1952 JEOLOGICAL SURVEY WATER-SUPPLY PAPER 1260-D ^repared in cooperation with the U. S. bureau of Reclamation, the Corps of Engineers, the Department of Public Forks of California, and with other gencies within the State STITED STATES GOVERNMENT PRINTING OFFICE, WASHINGTON : 1956
Transcript of Floods of 1952 in California - USGS · FLOODS OF 1952 IN CALIFORNIA By S. E. Rantz and Harlowe M....

Floods of 1952 in CaliforniaFLOOD OF JANUARY 1952[N THE SOUTH SAN FRANCISCO BAY REGION?y S. E. RANTZ
>NOWMELT FLOOD OF 1952 IN KERN RIVER, TULARE ,AKE, AND SAN JOAQUIN RIVER BASINSfy H. M. STAFFORD
' LOO D S OF 1952
JEOLOGICAL SURVEY WATER-SUPPLY PAPER 1260-D
^repared in cooperation with the U. S. bureau of Reclamation, the Corps of Engineers, the Department of Public Forks of California, and with other gencies within the State
STITED STATES GOVERNMENT PRINTING OFFICE, WASHINGTON : 1956
UNITED STATES DEPARTMENT OF THE INTERIOR
Fred A. Seaton, Secretary
GEOLOGICAL SURVEY
Thomas B. Nolan, Director
For sale by the Superintendent of Documents, U. S. Government Printing Office Washington 25, D. C. - Price 45 cents (Paper cover)

PREFACE
This report on the flood of January 1952 in the south San Fran cisco Bay region and on the snowmelt flood of 1952 in the Kern Ri- ver, Tulare Lake, and San Joaquin River basins was prepared by :he Geological Survey, Water Resources Division, C. G. Paulsen, :hief, under the general direction of J. V. B. Wells, chief, Sur face Water Branch, and under the general supervision of R. C. Briggs, district engineer.
Basic records of discharge in the areas covered by this report ire collected in cooperation with the Department of Public Works >f California, through the State engineer; the Corps of Engineers, department of the Army; the Bureau of Reclamation, Department >f the Interior; the city of San Francisco; the Turlockand Modesto rrigation districts; Alameda County Flood Control and Water Con* tervation District; and licencees of the Federal Power Commis sion.
Several individuals and organizations contributed to this report. ?he Corps of Engineers furnished the information and statistics on lood damage. In part 1, a summary of the meteorological con* litions associated with the flood-producing storm was furnished >y Don L. Jorgensen, research forecaster, U. S. Weather Bureau; ecords of reservoir contents during the flood period and supple- aentary precipitation records were furnished by the Santa Clara falley Water Conservation District, the San Francisco Water De- artment, and the San Jose Water Works. In part 2, the records Dr Kern River near Bakersfield were furnished by the Kern Coun- r Land Company.
Ill


CONTENTS
PageAbstract .............................................. 531Flood of January 1952 in the south San Francisco Bay
region, by S. E. Rantz .................... 531Introduction......................................... 531Description of the region ............................. 532General description of the flood ....................... 538Flood damage ....................................... 535Meteorology and precipitation......................... 535
Meteorology, by Don L. Jorgensen, U. S. WeatherBureau .................................. 535
Precipitation..................................... 537Stages and discharges at stream-gaging stations ........ 537
Explanation of data................................ 537Sequel Creek at Sequel ............................ 540San Lorenzo River at Big Trees .................... 541Pescadero Creek near Pescadero................... 542San Francisquito Creek at Stanford University ....... 543Stevens Creek near Cupertino ...................... 544Guadalupe River:
Alamitos Creek near Edenvale .................. 545Los Capitancillos Creek at Guadalupe ............ 546Los Gatos Creek below Los Gatos .... ........... 547
Guadalupe River at San Jose ....................... 548Saratoga Creek at Saratoga...................... 549
Coyote Creek near Madrone........................ 550Coyote Creek near Edenvale ....................... 551Alameda Creek near Niles ......................... 552San Lorenzo Creek at Hayward ..................... 553
Peak discharge...................................... 554Hydrograph characteristics .......................... 556
Snowmelt flood of 1952 in Kern River, Tulare Lake, and San Joaquin River basins, by Harlowe M.Stafford ................................. 562
Introduction ........................................ 562Description of basins ................................ 562Description of the flood .............................. 565
Antecedent conditions ............................. 565Flood runoff. ..................................... 566Extent and character of flooding .................... 569
Flood damage....................................... 572Index ................................................. 575
VI
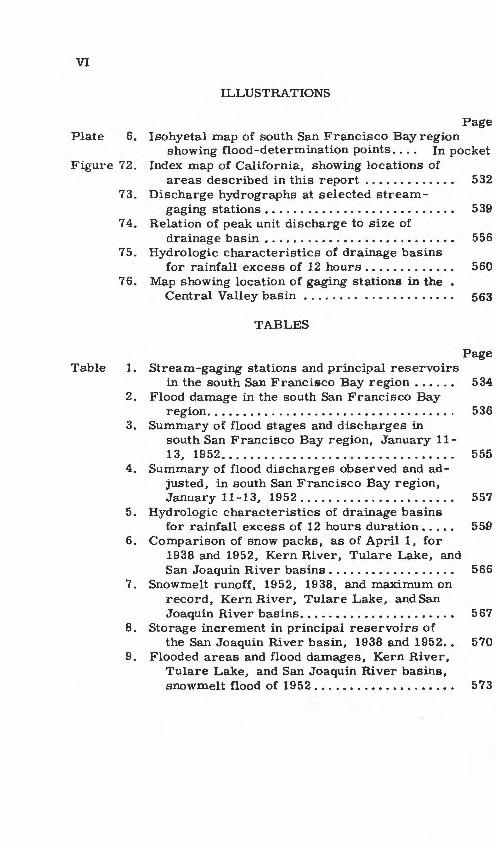
ILLUSTRATIONS
Page Plate 6. Isohyetal map of south San Francisco Bay region
showing flood-determination points. ... In pocket Figure 72. Index map of California, showing locations of
areas described in this report ............. 53273. Discharge hydrographs at selected stream-
gaging stations........................... 53974. Relation of peak unit discharge to size of
drainage basin ........................... 55675. Hydrologic characteristics of drainage basins
for rainfall excess of 12 hours ............. 56076. Map showing location of gaging stations in the .
Central Valley basin ........ ............. 563
TABLES
Page Table 1. Stream-gaging stations and principal reservoirs
in the south San Francisco Bay region ...... 5342. Flood damage in the south San Francisco Bay
region................................... 5363. Summary of flood stages and discharges in
south San Francisco Bay region, January 11-13, 1952................................. 555
4. Summary of flood discharges observed and ad justed, in south San Francisco Bay region, January 11-13, 1952 ...................... 557
5. Hydrologic characteristics of drainage basinsfor rainfall excess of 12 hours duration..... 55fl
6. Comparison of snow packs, as of April 1, for1938 and 1952, Kern River, Tulare Lake, and San Joaquin River basins .................. 566
7. Snowmelt runoff, 1952, 1938, and maximum on record, Kern River, Tulare Lake, and San Joaquin River basins...................... 567
8. Storage increment in principal reservoirs ofthe San Joaquin River basin, 1938 and 1952. . 570
9. Flooded areas and flood damages, Kern River, Tulare Lake, and San Joaquin River basins, snowmelt flood of 1952 .................... 573

FLOODS OF 1952
FLOODS OF 1952 IN CALIFORNIA
By S. E. Rantz and Harlowe M. Stafford
,ABSTRACT
Two major floods occurred in California in 1952. The first was the flood of January 11-13 In the south San Francisco Bay region that resulted from heavy rains whichbegan on the morning of January 11 and ended about noon January 13. This flood was notable for the magnitude of the peak discharges, although these discharges were reduced by the controlling effect of reservoirs for conservation and flood-control purposes. The flood damage was thereby reduced, and no lives -were lost; damage, nevertheless, amounted to about $1,400,000.
The second flood was due, not to the immediate runoff of heavy rain, but to the melting of one of the largest snow packs ever recorded in the Sierra Nevada range. In the spring and summer of 1952, flood runoff occurred on all the major streams draining the Sierra Nevada. In the northern half of the Central Valley vasin--the Sacramento River basin--flood volumes and maximum daily discharges '"ere not exceptional, and flood damage was not appreciable. However, in the southern half, which is formed by the Kern River, Tulare Lake, and San Joaquin River basins, new records for snow melt runoff were established for some streams; vut for below-normal temperatures and shorter, less warm hot spells, record flood discharges would have occurred on many others. In the three basins an area of 200,000 acres, largely cropland, was inundated, and damage was esti mated at $11,800,000.
FLOOD OF JANUARY 1952 IN THE SOUTH SAN FRANCISCOBAY REGION
By S. E. Rantz
Introduction
The flood of January 1952 in the south San Francisco Bay re gion was the result of a storm that centered near the summit of the ^anta Cruz Mountains, where rainfall total exceeded 8 inches. Al-hough peak discharges in January 1952 exceeded those previously
""ecorded only at very few of the gaging stations in the area, a com parison on an area-wide basis of the 1952 flood with previous "loods is difficult to make, owing to modifying effect of the larger "lumber of regulating reservoirs now in existence, and to the facthat only three gaging stations in the area were in operation before
1930.531

532 FLOODS OF 1952 IN CALIFORNIA
The report presents data on stages and discharges at 14 gagir? stations, an analysis of flood damages, a brief analysis of the char acteristics of the flood hydrographs, and other data pertaining to the flood.
Description of the Region
The region of the flood discussed in this report (fig. 72) com prises the drainage basins on the east side of San Francisco Br.y south of San Lorenzo Creek, on the west side of the bay, south of
EXPLANATION
I
Figure 72. --Index map of California, showing location of the areas described in this report.

FLOODS IN SOUTH SAN FRANCISCO BAY REGION 533
San Francisquito Creek, and the contiguous basins of Soquel Creek, San Lorenzo River, and Pescadero Creek that drain directly into the Pacific Ocean. The streams and their gaging stations and prin cipal reservoirs are shown on plate 6. Table 1 lists these gaging stations and reservoirs and the numbers and letters that identify them on plate 6.
The three Pacific Ocean basins drained by Soquel Creek, San Lorenzo River, and Pescadero Creek, are classified as "mountain and foothill" areas, their slopes being greater than 200 feet per mile. Utilization of the waters of these streams is of relatively minor importance. By contrast, water for irrigation is a prime necessity in the highly developed Santa Clara Valley, which is the valley floor of all the streams draining into San Francisco Bay that are delineated on the map, except for those of Alameda and San Lorenzo Creek basins, and is highly developed agriculturally. The many reservoirs shown on the map (pi. 6) are primarily for conservation purposes, but the larger ones also have an important flood-control function. The gaging stations in the Santa Clara Val ley are, in general, at the mouths of canyons from which the streams debouch onto the valley floor. A notable exception is the station on Guadalupe River at San Jose, which is out on valley floor proper. Of the two basins not a part of Santa Clara valley, Ala meda Creek above the Niles gaging station drains an area that is about 85 percent mountain and foothill terrain, and virtually all of the San Lorenzo Creek drainage basin above the Hayward gaging station is in that category. There is little utilization of San Lo renzo Creek water, but Calaveras Reservoir in the Alameda Creek basin stores water for municipal use by the city of San Francisco.
Elevations in the south San Francisco Bay region range from slightly above sea level to more than 4,000 feet and topography has a marked influence on rainfall distribution and intensity. Average annual precipitation has a range of from about 14 inches in the val ley to more than 60 inches in mountainous areas. There is often a marked relationship over large areas between storm precipi tation and average annual precipitation. With rare exceptions, vir tually all the precipitation occurs between mid-October and the latter part of April. Snow rarely falls in measurable quantities except at the highest altitudes. There is no record of floods that have been augmented to any appreciable extent by melting snow.
General Description of the Flood
The flood of January 11-13, 1952 caused considerable damage in the south San Francisco Bay region, particularly in the drain age basins of Alameda Creek and Guadalupe River. Flood condi tions in the Guadalupe River basin were considerably alleviated,

534 FLOODS OF 1952 IN CALIFORNIA
££"o ^
M QJ
Q- ^rt g
0) > .S ,-J
C rt SH i _. 0) cr P SI in inh Q> Q) «-«
C X ° co0) S-i*c o *-Sij-s.
s->
1f*0)in0)
P?
C!£ fc <- «.CUD O C *^
§ § 28rt rt rt cr^ g "in .3
X C co0) O
*§ 6 "Q.*-" C
gaging station
8rt0)uw
eg o o co o o « eg03 oocgmo t~ ^f
rt< eg 03 co co pN
CO 03 0) i-l O O
^ coi-nc-coo m mrH i-l i-t «H W ^l1
. . ,^J WOQWfeOQWfoO
tlO r ^ ^ ^
"H C r^ C C 3 5
cj aj^'rtaa^'rtasrt
sfcg c~i-nococo c
ooco c-comcgco 1-1 c1-1 1-1
^es.^ ^ u,co «-« 03 c
ii it ' 0) '
! ' H a !! ! 0 -a 3 '
w » § S 1 |l
1 -1 § * 11 ti § :g.^^ 5 5 |£ -. J, ca Sisg « g o" g| 5
sill If I! 11 s 'Ort^cu U'^.^jO) ^)a) >U"^oCJ ^ O'.M^J" °ri i^i i fl^ H ^^^ ^^ in -iH O _ ^ C x^ PH
fcjjjjo D3"u2^" +Sin tt>UU^oJ fc Coj^in 'Q,O d,^Ji ^"^ ^ *r1 rt ^ uj O ^ "£|i 3*^ r ' O ^ ^ ^"t ' lH Clt3 r^r^ *rrtQ . O . 1 ^ _^ ft-. C fl\ |H VM / Vj,/ ^V
^ tO ^3 » * IT H
0*rt<£ ^S * -2 OO 3cocnCL, en co < >J >J O
o o o oCO O CO Om o LO co^j*" in 03 coeg t> 03 03
o co co oeg 03 03 o
r+~^K "a K "a W
§.sg^O C O C rt
0 0
D ^ O5 CO CO
^ (M CD
3 »~^ C1*! CO ^
?» a 1M 1 js&S -o S 55! W^ rt -a <" *. rt S W t, rti_» ^ ^ flJ T?rt s s S S S c IS ol> ¥ ^ ^* o"^ Q) O N^ F-i ^ ^ C«rf r "\ r "> »tt Q) w v-/ tl3 0) O ^> O-* "t^ "K c! *J^ o o c3 o o £ 5,/3 O O ^J W

FLOODS IN SOUTH SAN FRANCISCO BAY REGION 535
however, by the modifying effect of storage reservoirs on the trib utary streams and on Coyote Creek. Virtually the entire flow of Coyote Creek was stored in Coyote and And erson Reservoirs. The effect of this storage in reducing potential flood damage in north western Santa Clara County becomes evident when it is realized that the only divide between Coyote Creek and Guadalupe River in their roughly parallel courses through the city of San Jose to San Francisco Bay is formed by the leveelike banks of silt that had been deposited by the streams at high stages.
Rain began to fall on the morning of January 11; it increased in intensity during that afternoon and night but slackened by noon of January 12. Streams began to rise on the afternoon of January 11; they rapidly peaked during the morning hours of January 12 and spread over the lowlands. Many highways were closed by slides and floodwater. In the towns of Campbell, Milpitas, San Jose, and Santa Clara, hundreds of basements and lower floors were flooded. Alviso, at the mouth of Guadalupe River, was inundated to depths ranging from 6 inches to 10 feet, causing all but about 50 of the town's 700 population to leave. In the Pleasanton area of Alameda Creek basin, many people were forced to leave their water-logged homes and farms. Floodwaters were slow in receding because the rain^which stopped on the 13th, began again on January 14 and continued for the next few days.
Flood Damage
No loss of life was attributable to the flood, but damage amount ed to about $1,400,000. Table 2 summarizes the damage by type and by drainage basin.
Meteorology and Precipitation
Meteorology
[Prepared by Don L. Jorgensen !_/]
The heavy rains in the San Francisco Bay region during the llth and 12th of January 1952 resulted from a storm that moved southward out of the Gulf of Alaska. On the morning of the llth this storm was centered about 300 miles west of Portland, Oreg., with the storm front extending southward just off the coast of northern California. By the evening of the llth the front had moved inland over Oregon and extreme northern California, and had become nearly stationary in the vicinity of the San Francisco
I/ Research forecaster, U. S. Weather Bureau.

Ul
CO
O
5
Tab
le 2
. --
Flo
od d
amag
e in
sou
th S
an F
ranci
sco B
ay r
egio
n
[Fig
ure
s co
mpil
ed b
y C
orp
s of
Engin
eers
; da
mag
e sl
igh
t in
bas
ins
not
list
ed]
Dra
inag
e b
asin
Ste
vens
Cre
ek -
--
Gua
dalu
pe R
iver
a/
Sar
atoga
Cre
ek -
-
Ala
med
a C
reek
--
San
Lore
nzo
Cre
ek
To
tal --
----
--
Ag
ricu
ltu
ral
$9,0
00
113,
000
70,0
00
635,
000
41,0
00
868,
000
Res
iden
tial
$24,
000
1,00
0
24,0
00
49,0
00
Co
mm
erci
al
and
indust
rial
$2,5
00
200,
000
10,0
00
49,0
00
15,0
00
276,
500
Lev
ee
$2,0
00
45,0
00
10,0
00
57,0
00
Hig
hway
$37,
000
68,0
00
5,5
00
110,
500
Rai
lro
ad
$2,0
00
5,0
00
1,50
0
8,5
00
Uti
liti
es
5,0
00
5,0
00
3,5
00
13,5
00
To
tal
$18,
500
b 38
0,00
0
81
,00
0
831,0
00
76
,00
0
b 1,3
87,
000
s § Ul
CO en
to S
O
> r H- * *i o
a In
clud
es t
he f
ollo
win
g tr
ibuta
ry b
asin
s:
Ala
mit
os
Cre
ek,
Los
Cap
itan
cill
os
Cre
ek,
and
Los
Gat
os
Cre
ek.
Incl
udes
expen
dit
ure
of
$4,
000
by A
mer
ican
Red
Cro
ss f
or
rem
ov
al o
f pe
ople
fro
m f
lood
ed a
reas.

FLOODS IN SOUTH SAN FRANCISCO BAY REGION 537
Bay region. Early on the 12th the storm center had moved to a point just off the coast of central California. Under the influence of this center and a deep trough in the upper atmosphere, further development occurred along the quasi-static nary front. The re sulting storm moved onto the coast on the 12th just to the north of San Francisco. Strong onshore flow of the convectively unstable air brought heavy rainstorms to coastal sections from the San Francisco Bay region southward.
Precipitation
Rainstorms began in the San Francisco Bay region in the early morning of January 11 and lasted until about noon of January 13. In general, however, about 85 percent of the precipitation fell dur ing the 24-hour period ending at 9 a.m. on January 12. Strongly influenced orographically, the storm total ranged from 3 inches on the valley floor to more than 8 inches in the Santa Cruz Moun tains. Observed maximum hourly precipitation ranged from 0. 3 to 0.7 inch over most of the region, but reached 1.64 inches at Boulder Creek in the San Lorenzo River basin.
The isohyetal map (pi. 6) is a generalized picture of the areal distribution of the precipitation of January 11-13. The isohyets are drawn on the basis of records for 81 precipitation stations, 56 of which are operated by the U. S. Weather Bureau, and on the ^asis of the shape of the normal-annual isohyets for the region.
Stages and Discharges at Stream-Gaging Stations
Explanation of Data
Detailed records of discharge for the gaging stations in the south San Francisco Bay region appear on the following pages, ^or each station, the records include a description of the gaging station, daily mean discharge and total runoff for the 3-day period January 11-13, 1952, and gage height and discharge at 2-hour in- 'erals for this period.
The description of the station gives information on the location, *ize of drainage area, type and completeness of gage-height rec- >rd, definition of the stage-discharge relation, the maximum stage >nd discharge during the present flood and previous maxima of *ecord, and other pertinent information.
A summary table gives the daily discharge for each day in the period January 11-13, the mean discharge for the period, and to- 'al runoff--both in inches and in acre-feet--for the period. A

538 FLOODS OF 1952 IN CALIFORNIA
table of gage height and discharge at indicated time gives the gage height and discharge at 2-hour intervals during the period. Ar the peak occurred on January 12 at all the stations, the detailed discharge for the 3-day period is sufficient to delineate the flood hydrograph, although the streams were still comparatively high at the end of January 13.
Figure 73 presents discharge hydrographs at selected gaging stations for the 3-day period. The hydrographs are for unregu lated flow (see section "Peak discharge" for further discussion of hydrograph preparation). The recessions in discharge have not been shown beyond midnight of January 13, because rain which began again on January 14 caused the streams to rise once more.

FLOODS IN SOUTH SAN FRANCISCO BAY REGION 539
Si 9y m3u-0 8
San Lorenzo Riverat Big Trees
(110 square miles)
Los Gatos Creekbelow Los Gatos
(43.6 square miles)
(
San Lorenzo Creek at Hayward
38.0 square miles)
Pescadero Creek --^near Pescadero (46.2 square miles)
JANUARY 1952
Figure 73. Discharge hydrographs at selected stream-gagingstations.

540 FLOODS OF 1952 IN CALIFORNIA
Sequel Creek at Soquel, Calif.
Location. --Lat 36°59'29", long 121°57'17", in NEi sec. 10, T. US., R 1 W., on left bank 0. 2 mile upstream from highway bridge in town of Soquel.
Drainage area. --40. 4 sq mi.
Gage-height record. --Water-stage recorder graph.
Discharge record. --Stage-discharge relation defined by current-meter measurements below 2,100 cfs and extended to peak stage by loga rithmic plotting.
Maxima. --January 1952; Discharge, 4, 910 cfs 5:30 a. m. Jan. 12 (ga^e height, 11.63 ft).
May to December 1951: Discharge, 3, 500 cfs Dec. 28, 1951 (gr<?e height, 10.58 ft), from rating curve extended above 2, 100 cfs as er- plained above.
Remarks. --Small diversions above station for irrigation.
Mean discharge and runoff, January 11-13, 1952
Daily discharge, in cfs, January 11 ...... 555Daily discharge, in cfs, January 12 ...... 2, 290Daily discharge, in cfs, January 13 ...... 678Mean discharge, in cfs, for period, ...... 1, 170Runoff, in acre-feet .................... 6, 990Runoff, in inches. ...................... 3. 24
Gage height, in feet, at
and discharge in cubic feet per second, indicated time, 1952
Hour
2468
10N2468
1012
Gage height
Dis charge
January 114.724.734.744.734.734.724.714.765.808.109.569.90
126127129127127126124131340
1,3802,4602,800
Gage height
Dis charge
January 1210. 1811.3011.0010.309.779.108.327.877.637.417.788.00
3,0804,4204,0003,2002,6702,0801,5201,2401,100
9751,1901.320
Gage height
Dis charge
January 137.547.327.166.986.786.656.506.406.306.206.136.08
1,040930850760662610550510480450429414

FLOODS IN SOUTH SAN FRANCISCO BAY REGION
San Lorenzo River at Big Trees, Calif.
541
vocation. --Lat 37001'40", long 122003'30", in Canada del Rincon Grant, Santa Cruz County, on right bank 0. 5 mile south of Big Trees station on Southern Pacific Railroad, 1. 6 miles downstream from Zayante Creek, and 4 miles north of Santa Cruz.
)rainage area. --110 sq mi.
rage-height record. --Water-stage recorder graph.
discharge record. --Stage-discharge relation defined by current-meter measurements below 11,000 cfs and a slope-area determination of 24, 000 cfs for the flood of Feb. 27, 1940.
laxima. --January 1952; Discharge, 14, 900 cfs 3 a. m. Jan. 12 (gage height, 16.85 ft).
1937 to December 1951: Discharge, 24, 000 cfs Feb. 27, 1940 (gage height, 21.1 ft), by slope-area determination.
.emarks. Many small diversions above station for domestic supply.
Mean discharge and runoff, January 11-13, 1952
Daily discharge, in cfs, January 11 ...... 1, 610Daily discharge, in cfs, January 12 ...... 6, 400Daily discharge, in cfs, January 13 ...... 1, 890Mean discharge, in cfs, for period. ...... 3, 300Runoff, in acre-feet................... 19, 640Runoff, in inches. ...................... 3. 35
Gage height, in feet, and discharge in cubic feet per second, at indicated time, 1952
Hour
2468
10N2468
1012
Gage height
Dis charge
January 113.573.563.563.573.543.523.524.106.909.70
11.0013.40
415412412415406400400582
1,7904,0205,4608.800
Gageheight
Dis charge
January 1216.4816.1313.6512.2511.3810.469.508.998.578.528.628.50
14,20013,5009,1907,1105,9304,8303,8203,3402,S902,9503,0302.930
Gageheight
Dis charge
January 138.157.857.557.307.106.906.736.576.376.236.136.00
2,6502,4202,2002,0301,9101,7901,6901,5901,4801,4201,3601.300

542 FLOODS OF 1952 IN CALIFORNIA
Pescadero Creek near Pescadero, Calif.
Location. --Lat 37°15'40". long 122 0 19'40", in SW^ sec. 6, T. 8 S., R. 4 W., on left bank at downstream side of highway bridge, 3. 0 miles east of Pescadero and 6. 0 miles upstream from mouth.
Drainage area. 46. 2 sq mi.
Gage-height record. --Water-stage recorder graph.
Discharge record. --Stage-discharge relation defined by current-meter measurements below 1, 400 cfs and extended to peak stage by loga rithmic plotting.
Maxima. - -January 1952: Discharge, 2,860 cfs 4:45 a.m. Jan. 12 (gag height, 14.16 ft).
April to December 1951: Discharge, 2,310 cfs Dec. 4, 1951 (gag height, 12. 73 ft), from rating curve extended above 1, 400 cfs as explained above.
Remarks. --No regulation or diversion.
Mean discharge and runoff, January 11-13, 1952
Daily discharge, in cfs, January 11 ...... 305Daily discharge, in cfs, January 12 ...... 2, 000Daily discharge, in cfs, January 13 ...... 877Mean discharge, in cfs, for period. ...... 1, 060Runoff, in acre-feet.................... 6, 310Runoff, in inches. ...................... 2. 56
Gage height, in feet, and discharge in cubic feet per second, at indicated time, 1952
Hour
2468
10N2468
1012
Gage height
Dis charge
January 113.813.783.773.753.743.733.733.884.907.308.709.54
133130129127126125125141264680
1,0001,230
Gage height
Dis charge
January 1211. 1513.8513.9513.5512.8512.4212.0011.2510.5010.3010.3510.07
1,7502,7402,7802,6202,3502,2002,0501,7901,5201,4601,4801.390
Gage height
Dis charge
January 139.829.429.038.638.287.937.637.377.156.876.726.55
1,3201,2001,090
984897815749694650594566535

FLOODS IN SOUTH SAN FRANCISCO BAY REGION 543
San Francisquito Creek at Stanford University, Calif.
Location. --Lat 37 025'20", long 122 011'25", on right bank, in Rinconada del Arroyo de San Francisquito Grant, at golf course, 0. 8 mile down stream from confluence with Los Trancos Creek and 1.2 miles west of Stanford University post office, Santa Clara County.
Drainage area. --37. 7 sq mi.jage-height record. --Water-stage recorder graph.Discharge record. --Stage-discharge relation defined by current-meter
measurements below 810 cfs and extended to peak stage by logarithmic plotting.
Maxima. --January 1 -13, 1952: Discharge, 1,610 cfs 10a.m. Jan. 12 (gage height, 6. 40 ft).
1931-41, 1950 to December 1951: Discharge, 3, 650 cfs Nov. 18, 1950 (gage height, 10.4 ft), from rating curve extended above 810 cfs as explained above.
Iemarks. --Flow regulated by storage at Searsville Reservoir (capacity, 952 acre-ft). About 900 acre-ft diverted annually to Los Trancos and Lagunita Canals for irrigation on the Stanford University campus below gaging station.
Mean discharge and runoff, January 11-13, 1952
Daily discharge, in cfs, January 11 ...... 344Daily discharge, in cfs, January 12 ...... 1, 020Daily discharge, in cfs, January 13 ...... 353Mean discharge, in cfs, for period. ...... 572Runoff, in acre-feet.................... 3, 410Runoff, in inches....................... 1. 69
Gage height, in feet, at
and discharge in cubic feet per second, indicated time, 1952
Hour
2468
10N2468
1012
Gage height
Dis charge
January 111.551.541.551.551.551.571.743.924.304.354.815.85
62616262626483
587720739920
1,360
Gage height
Dis charge
January 125.355.005.155.506.405.354.904.654.454.484.334.20
1,140998
1,0601,2101,6101,140
956856777788731684
Gage height
Dis charge
January 134.013.833.653.513. 163.112.552.462.412.372.492.63
617556498453352339212193184177199228

544 FLOODS OF 1952 IN CALIFORNIA
Stevens Creek near Cupertino, Calif.
Location. --Lat 37°18'20", long 122°04 t25" ) in SW£ sec. 22, T. 7 S., R. 2 W., on left bank, on downstream side of county highway bridge, 0. 6 mile downstream from Stevens Creek Dam and 2. 5 miles southwe of Cupertino.
Drainage area. 18.1 sq mi.
Gage-height record. --Water-stage recorder graph.
Discharge record. --Stage-discharge relation defined by current-meter measurements below 560 cfs and estimates of flow over Stevens Cree Dam.
Maxima. - -January 1952: Discharge, 1,110 cfs 8:30 a.m. Jan. 12 (gage height, 5. 82 ft).
1930 to December 1951: Discharge, 2, 390 cfs Feb. 28, 1940 (gage height, 7. 05 ft), from rating curve extended by logarithmic plotting above 350 cfs.
Remarks. --Flow regulated by Stevens Creek Reservoir (usable capacity 4,000 acre-ft).
Mean discharge and runoff, January 11-13, 1952
Daily discharge, in cfs, January 11 ...... 23Daily discharge, in cfs, January 12 ...... 540Daily discharge, in cfs, January 13 ...... 325Mean discharge, in cfs, for period. ...... 296Runoff, in acre-feet .................... 1, 760Runoff, in inches....................... 1.82
Gage height, in feet, at
and discharge in cubic indicated time, 1952
feet per second,
Hour
2468
10N2468
1012
Gage height
Dis charge
January 111.561.561.561.561.561.561.581.632.012.082.392.55
7.17.17.17.17.17.17.98.8
344080
108
Gageheight
Dis charge
January 122.553.505.605.715.555,234.774.544.364.354.354.21
108334926
1,010890684510464433433433413
Gage height
Dis charge
January 134.063.973.803.703.553.483.413.323.243.153.053.03
392382366356340330321311290263 '234228

FLOODS IN SOUTH SAN FRANCISCO BAY REGION 545
Alamitos Creek near Edenvale, Calif.
Location. --Lat 37°14'20", long 121 052'15", in SW^ sec. 16, T. 8 S., R. IE., on left bank 0. 4 mile upstream from confluence with Los Capitancillos Creek and 4 miles southwest of Edenvale.
"" "ainage area. --35. 0 sq mi.Gage-height record. --Water-stage recorder graph until 1 a.m. Jan. 12,
when gaging station washed out. Hydrograph for period 1 a. m. Jan. 12 to 12 p. m. Jan. 13 constructed on basis of 3 discharge measurements and comparison with records for nearby streams.
Flscharge record. --Stage-discharge relation defined by current-meter measurements below 1, 400 cfs and extended to peak stage by log arithmic plotting.
I taxima. - -January 1952: Discharge, 2,000 cfs 1 a.m. Jan. 12 (gage height, 5. 2 ft, datum used before Jan. 12, 1952).
1930 to December 1951: Discharge, 2, 670 cfs Dec. 27, 1931 (gage height, 6. 60 ft), from rating curve extended above 1, 800 cfs by logarithmic plotting.
F.emarks. --Flow regulated by Almaden Reservoir (capacity, 2, 000 acre-ft) and Calero Reservoir (capacity, 9,213 acre-ft).
Mean discharge and runoff, January 11-13, 1952
Daily discharge, in cfs, January 11 ...... 195Daily discharge, in cfs, January 12 ...... 1, 390Daily discharge, in cfs, January 13 ...... 410Mean discharge, in cfs, for period. ...... 665Runoff, in acre-feet .................... 3, 960Runoff, in inches. ...................... 2.12
Gage height, in feet,at
and discharge in cubic indicated time, 1952
feet per second,
Hour
2468
10N2468
1012
Gage height
Dis charge
January 111.851.851.851.851.851.851.871.932.904.004.725.0
1818181818181922
140500892
1,300
Gage height
Dis charge
January 121,9501,8401,7301,6201,5201,4001,3001,2001,1001,000
910820
Gage height
Dis charge
January 13730640550460300340300270250240230220

546 FLOODS OF 1952 IN CALIFORNIA
Los Capitancillos Creek at Guadalupe, Calif.
Location.--Lat 37°13'05", long 121°54'35", in SW^ sec. 19, T. 8 S., R. IE., on left bank 0. 5 mile northwest of Guadalupe and 3. 5 miles ui- stream fron confluence with Alamitos Creek.
Drainage area. 12. 6 sq mi.
Gage-height record. --Water-stage recorder graph.
Discharge record. --Stage-discharge relation defined by current-meter measurements below 530 cfs and extended to peak stage by logarithm! plotting.
Maxima. --January 1952; Discharge, 1, 330 cfs 2 a. m. Jan. 12 (gage height, 4. 22 ft).
1930 to December 1951: Discharge, 1,160 cfs Dec. 28, 1931 (gage height, 4. 05 ft), from rating curve extended above 840 cfs by logarithmic plotting.
Remarks. --Flow regulated by Guadalupe Reservoir (capacity, 3, 500 acre-ft).
Mean discharge and runoff, January 11-13, 1952
Daily discharge, in cfs, January 11 ...... 205Daily discharge, in cfs, January 12 ...... 538Daily discharge, in cfs, January 13 ...... 129Mean discharge, in cfs, for period. ...... 291Runoff, in acre-feet .................... 1, 730Runoff, in inches. ...................... 2. 57
Gage height, in feet, at
and discharge in cubic indicated time, 1952
feet per second,
Hour
2468
10N2468
1012
Gage height
Dis charge
January 11.91.91.91.91.93.95
1.001.402.623. 113.223.70
1515151516182265
404656716
1,000
Gage height
Dis charge
January 124.223.633.253.012.822.612.442.312.232.232.202.08
1,330958732600500400326278249249238199
Gage height
Dis charge
January 132.041.961.901.851.801.761.721.681.641.601.581.58
188166151140129121114107100939090

FLOODS IN SOUTH SAN FRANCISCO BAY REGION 547
Los Gatos Creek below Los Gatos, Calif.
Location. --Lat 37°14', long 121°58', in Rinconada de Los Gatos Grant, on left bank 350 ft downstream from Cypress Road Bridge and 0.9 mile northeast of railroad station in Los Gatos, Santa Clara County.
Drainage area. --43. 6 sq mi.
Gage-height record. --Water-stage recorder graph.
Discharge record. --Stage-discharge relation defined by current-meter measurements below 2, 600 cfs and extended to peak stage by log arithmic plotting.
Maxima. --January 1952: Discharge, 5,800 cfs 1 a.m. Jan. 12 (gage height, 10.0 ft).
1930 to December 1951: Discharge, 7, 110 cfs Feb. 27, 1940 (gage height, 14. 71 ft, site and datum then in use), from rating curve extended above 2, 300 cfs by logarithmic plotting.
Remarks. Flow regulated by Austrian Reservoir (capacity, 6, 000 acre- ft) and several small reservoirs above station. Several diversions above station for irrigation.
Mean discharge and runoff, January 11-13, 1952
Daily discharge, in cfs, January 11 ...... 874Daily discharge, in cfs, January 12 ...... 2, 820Daily discharge, in cfs, January 13 ...... 975Mean discharge, in cfs, for period. ...... 1, 560Runoff, in acre-feet .................... 9, 260Runoff, in inches. ...................... 3. 98
Gage height, in feet, at
and discharge in cubic indicated time, 1952
feet per second,
Hour
2468
10N2468
1012
Gage height
Dis charge
January 112.592.622.642.622.612.732.853.955.396.507.908.40
8084878483
102125472
1,4202,2403,5804,200
Gage height
Dis charge
January 129.507.146.566.095.584.954.393.98.3.733.943.943.53
5,4804,1903,6503,2702,9302,5502,0701,7601,5901,7301,7301,460
Gage height
Dis charge
January 133.283.143.002.862.752.652.552.452.382.302.232.18
1,3001,2101, 1301,050
992938885835800760725700

548 FLOODS OF 1952 IN CALIFORNIA
Guadalupe River at San Jose, Calif.
Location. --Lat 37 020'00", long 121°54'00", at San Jose, Santa Clara County, on right bank 100 ft downstream from Los Gatos Creek.
Drainage area. 131 sq mi.
Gage-height record. --Water-stage recorder graph.
Discharge record. --Stage-discharge relation defined by current-meter measurements below 4, 800 cfs and extended to peak stage by log arithmic plotting.
Maxima. --January 1952: Discharge, 8,000 cfs 4 a.m. Jan. 12 (gage EeigHt, 15.20 ft).
1930 to December 1951: Discharge, 8,680 cfs Feb. 27, 1940 (gage height, 11.88 ft), from rating curve extended by logarithmic plotting- above 3, 200 cfs.
Remarks. Flow regulated by several reservoirs (combined capacity, 21, 000 acre-ft). Small diversions above station.
Mean discharge and runoff, January 11-13, 1952
Daily discharge, in cfs, Daily discharge, in cfs.
January 11 ...... 586January 12 ...... 4,910
Daily discharge, in cfs, January 13 ...... 1» 890Mean discharge, in cfs, for period. ...... 2, 460Runoff, in acre-feet ................... .14, 650Runoff, in inches. ...................... 2.10
Gage height, in feet, at
and discharge in cubic indicated time, 1952
feet per second,
Hour
2468
10N2468
1012
Gage height
Dis charge
January 113.653.623.613.743.813.903.924.505.407.009.00
11.20
24222234446167
200500
1,3002,6104,280
Gage height
Dis charge
January 1212. 1015.2014.4913. 1812.2211.5410.9011. 1710.7110.3510. 149.81
5,0008,0007,2905,9805,1004,5504,0404,2603,8903,6003,4303,180
Gage height
Dis charge
January 139.509.008.508.207.927.777.427.217.056.906.806.65
2,9602.6102,2602,0601,8901,8001,5901,4701,3801,3001,2401, 160

FLOODS IN SOUTH SAN FRANCISCO BAY REGION 549
Saratoga Creek at Saratoga, Calif. [Shown as Campbell Creek on some maps]
Location. --Lat 37°15'15", long 122°02'25", in Quito Grant, on right bank ' 0.5 mile southwest of Saratoga, Santa Clara County.
Drainage area. --8.8 sq mi, approximately.
Gage-height record. --Water-stage recorder graph.
Discharge record. --Stage-discharge relation defined by current-meter measurements below 320 cfs and extended to peak stage by logarithmic plotting.
Maxima.--January 1952: Discharge, 1, 430 cfs 1:30 a. m. Jan. 12 (gage height, 4. 63 ft).
1933 to December 1951: Discharge, 2, 540 cfs Feb. 27, 1940 (gage height, 5. 35 ft), from rating curve extended above 510 cfs by logarithmic plotting.
Remarks. --Diversion and regulation above station by San Jose Water Works; negligible during high-water periods.
Mean discharge and runoff, January 11-13, 1952
Daily discharge, in cfs, January 11 ...... 136Daily discharge, in cfs, January 12 ...... 387Daily discharge, in cfs, January 13 ...... 168Mean discharge, in cfs, for period. ...... 230Runoff, in acre-feet .................... 1, 370Runoff, in inches....................... 2.92
Gage height, in feet, at
and discharge in cubic feet per second, indicated time, 1952
Hour
2468
10N2468
1012
Gage height
Dis charge
January 111.801.801.801.801.821.882.152.723.033.063.254.01
27272727283256155250261335778
Gage height
Dis charge
January 124.203.793.473.293.153.103.053.003.033.052.992.95
940614435351295275257239250257236222
Gage height
Dis charge
January 132.882.862.832.822.812.782.752.712.682.652.632.61
200194185182179171163153145138134129

550 FLOODS OF 1952 IN CALIFORNIA
Coyote Creek near Madrone, Calif.
Location. --Lat 37°10'06", long 121°38 1 55", near southeast corner of Laguna Seca Grant on right bank 1. 2 miles downstream from Anderson Dam at mouth of canyon, and 1. 8 miles northeast of Madrone, Santa Clara County.
Drainage area. --194 sq mi.
Gage-height record. --Water-stage recorder graph.
Discharge record. --Stage-discharge relation defined by current-meter measurements.
Maxima. --January 13-15, 1952: Discharge, 56 cfs 3 a. m. Jan. 12 (gage height, 2. 44 ft).
1902-12, 1916 to Jan. 12, 1952: Discharge, 25, 000 cfs Mar. 7, 1911 (discharge figure furnished by Duryea, Haehl & Oilman, con sulting engineers).
Remarks. --Flow regulated by Coyote Reservoir (capacity, 24,560 acre- ft) and Anderson Reservoir (capacity, 75, 000 acre-ft).
Mean discharge and runoff, January 11-13, 1952
Daily discharge, Daily discharge,Daily discharge, in cfs, Mean discharge, in cfs, Runoff, in acre-feet . ..
in cfs, January 11 ...... 50in cfs, January 12 ...... 16
13 26
157 Runoff, in inches. ...................... 0. 02
January 11 January 12 January 13 for period.
Gage height, in feet, at
and discharge in cubic feet per second, indicated time, 1952
Hour
2468
10N2468
1012
Gage height
Dis charge
January 112.402.402.402.402.402.402.402.402.402.402.402.40
505050505050505050505050
Gage height
Dis charge
January 122.432.112.031.981.971.942.072.062.052.052.052.05
5416106.56.05.0
131211111111
Gage height
Dis charge
January 132.052.052.052.052.052.052.052.132.132. 132.132.13
111111111111111717171717
FLOODS IN SOUTH SAN FRANCISCO BAY REGION 551
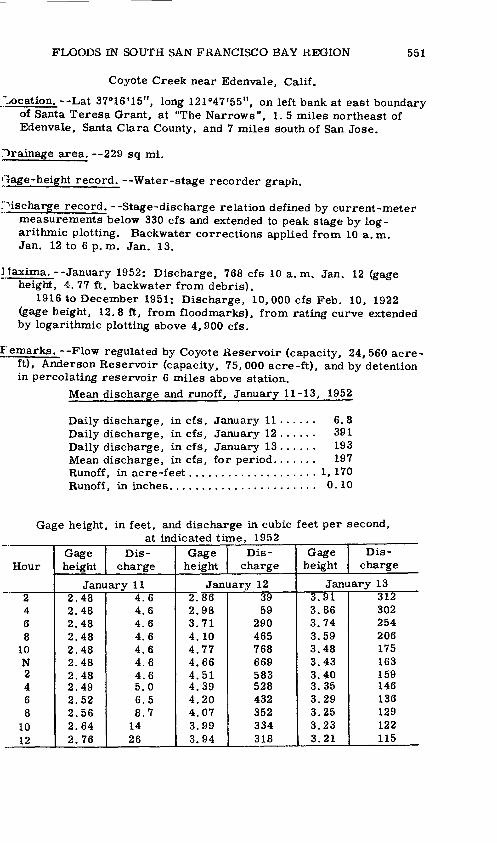
Coyote Creek near Edenvale, Calif.
location. --Lat 37°16 I 15", long 121°47'55", on left bank at east boundary of Santa Teresa Grant, at "The Narrows", 1. 5 miles northeast of Edenvale, Santa Clara County, and 7 miles south of San Jose.
Drainage area. 229 sq mi.
Gage-height record. --Water-stage recorder graph.
Discharge record. --Stage-discharge relation defined by current-meter measurements below 330 cfs and extended to peak stage by log arithmic plotting. Backwater corrections applied from 10 a. m. Jan. 12 to 6 p.m. Jan. 13.
] Taxima. - -January 1952: Discharge, 768 cfs 10 a.m. Jan. 12 (gage height, 4. 77 ft, backwater from debris).
1916 to December 1951: Discharge, 10, 000 cfs Feb. 10, 1922 (gage height, 12.8 ft, from floodmarks), from rating curve extended by logarithmic plotting above 4,900 cfs.
remarks. --Flow regulated by Coyote Reservoir (capacity, 24,560 acre- ft), Anderson Reservoir (capacity, 75, 000 acre-ft), and by detention in percolating reservoir 6 miles above station.
Mean discharge and runoff, January 11-13, 1952
Daily discharge, in cfs, January 11 ...... 6. 8Daily discharge, in cfs, January 12 ...... 391Daily discharge, in cfs, January 13 ...... 193Mean discharge, in cfs, for period. ...... 197Runoff, in acre-feet.................... 1, 170Runoff, in inches. ...................... 0.10
Gage height, in feet, at
and discharge in cubic indicated time, 1952
feet per second,
Hour
2468
10N2468
1012
Gage height
Dis charge
January 112.482.482.482.482.482.482.482.492.522.562.642.76
4.64.64.64.64.64.64.65.06.58.7
1426
Gage height
Dis charge
January 122.862.983.714.104.774.664.514.394.204.073.993.94
3959
290465768669583528432352334318
Gage height
Dis charge
January 133.913.863.743.593.483.433.403.353.293.253.233.21
312302254206175163159146136129122115

552 FLOODS OF 1952 IN CALIFORNIA
Alameda Creek near Niles, Calif.
Location. --Lat 37035'15", long 121 057'35", in Arroyo de la Alameda Grant, on right bank 0. 2 mile downstream from railroad bridge and 1.2 miles northeast of Niles, Alameda County.
Drainage area. 633 sq mi.
Gage-height record. --Water-stage recorder graph.
Discharge record. --Stage-discharge relation defined by current-meter measurements below 8, 700 cfs and extended to peak stage by log arithmic plotting.
Maxima. - -January 1952: Discharge, 18,500 cfs 4:30 p.m. Jan. 12 height, 13.92 ft).
1916 to December 1951: Discharge, 15,100 cfs Nov. 19, 1950 (gage height, 12.5 ft), from rating curve extended above 8, 700 cfs as explained above.
Remarks. --Flow partly regulated by Calaveras Reservoir (usablecapacity, 96, 800 acre-ft, most of which is diverted for San Francisc water supply).
Mean discharge and runoff, January 11-13, 1952
Daily discharge, in cfs, January 11 ...... 940Daily discharge, in cfs, January 12 ...... 13, 800Daily discharge, in cfs, January 13 ...... ? > 640Mean discharge, in cfs, for period. ...... 7, 460Runoff, in acre-feet .................... 44, 390Runoff, in inches....................... 1.31
Gage height, in feet, at
and discharge in cubic feet per second, indicated time, 1952
Hour
2468
10N2468
1012
Gage height
Dis charge
January 113.713.713.713.713.703.703.704.024.635.75
--
174174174174170170170300682
1,600*4, 000*6, 800
Gage height
Dis charge
January 1210. 1610.5710.7111.3011.6612.5313.3613.9013.3212.9412.3211.55
9,85010, 80011,10012,40013,20015,20017,20018,50017, 10016,20014,70012,900
Gage height
Dis charge
January 1310.9710.439.979.479. 128.848.688.468.238.067.887.74
11, 60010, 4009,4308,3307,5606,9506,6006, 1205,6605,3204,9604,680
* Interpolated.
FLOODS IN SOUTH SAN FRANCISCO BAY REGION
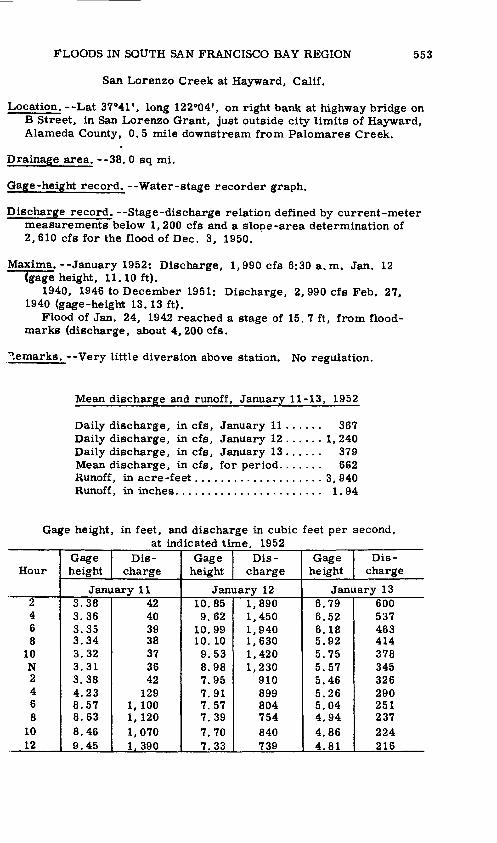
San Lorenzo Creek at Hayward, Calif.
553
Location. Lat 37°41', long 122°04', on right bank at highway bridge on B Street, in San Lorenzo Grant, just outside city limits of Hayward, Alameda County, 0.5 mile downstream from Palomares Creek.
Drainage area. --38. 0 eq mi.
Gage-height record. --Water-stage recorder graph.
Discharge record. --Stage-discharge relation defined by current-meter measurements below 1, 200 cfs and a slope-area determination of 2, 610 cfs for the flood of Dec. 3, 1950.
Maxima. --January 1952; Discharge, 1, 990 cfs 6:30 a. m. Jan. 12 (gage height, 11.10 ft).
1940, 1946 to December 1951: Discharge, 2, 990 cfs Feb. 27, 1940 (gage-height 13.13 ft).
Flood of Jan. 24, 1942 reached a stage of 15. 7 ft, from flood- marks (discharge, about 4, 200 cfs.
Remarks. --Very little diversion above station. No regulation.
Mean discharge and runoff, January 11-13, 1952
Daily discharge, in cfsDaily discharge, in cfsDaily discharge, in cfs
January 11 ...... 367January 12 ...... 1, 240January 13 ...... 379
Mean discharge, in cfs, for period....... 662Runoff, in acre-feet.................... 3, 940Runoff, in inches....................... 1. 94
Gage height, in feet, and discharge in cubic feet per second, at indicated time, 1952
Hour
2468
10N2468
1012
Gage height
Dis charge
January 113.383.363.353.343.323.313.384.238.578.638.469.45
42403938373642
1291, 1001, 1201,0701,390
Gageheight
Dis charge
January 1210.859.62
10.9910. 109.538.987.957.917.577.397.707.33
1,8901,4501,9401,6301,4201,230
910899804754840739
Gage height
Dis charge
January 136.796.526.185.925.755.575.465.265.044.944.864.81
600537463414378345326290251237224216

554 FLOODS OF 1952 IN CALIFORNIA
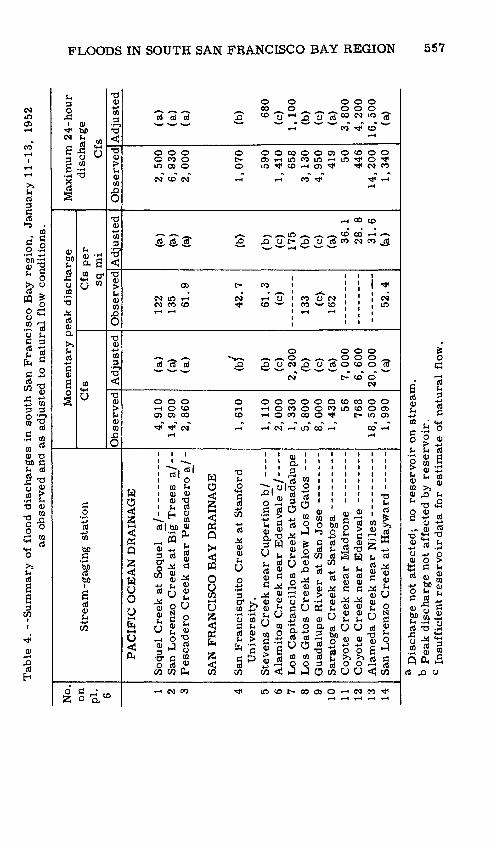
Peak Discharge
The flood of January 11-13, 1952 was notable for the peak dis charges it produced on the streams in the south San Francisco Bay region. Double peaks, caused by a lull in the rainfall, occurred in the northernmost basins, San Francisquito, Alameda, and San Lorenzo Creeks, and probably on Stevens Creek. The greater peak discharges all occurred some hours after the lesser ones. These peak, or maximum, discharges, all of which occurred on January 12, are summarized in table 3, along with those previ ously known.
Many of the peak discharges were smaller than they might otherwise have been, because of the regulating effect of the mairT conservation and flood-control reservoirs in the region. Where- ever possible, the discharges that were affected by the regulation were adjusted on the basis of change of reservoir content, in order to provide the figures of hypothetical unregulated discharge thst are listed in table. A complicating factor in making the adjust ments was the fact that at each reservoir, observations of stage had been made only once daily. This deficiency in reservoir data was overcome by drawing for each reservoir a synthetic hydro- graph.representing stored inflow. .Each synthetic hydrograpJa was drawn so that it met the following two requirements: (1) its shap^ resembled that of a hydrograph for a nearby unregulated stream of similar size, (2) the daily volumes of stored inflow indicated by the hydrograph equalled the daily changes in reservoir content.
Having prepared these synthetic reservoir hydrographs of stored inflow, it was possible to adjust the gaging-station hydro- graphs of observed discharge. Where a gaging station was im mediately downstream from a reservoir, theordinates of the res ervoir hydrograph were added to those of the gaging station to give the hypothetical hydrograph of unregulated discharge at the gaging station. Gaging-station records so treated were those for Staverrs Creek and Coyote Creek near Madrone. Stevens Creek Reservoir filled at some time between the start of the storm and the time of peak discharge, and the peak discharge of Stevens Creek ap parently was unaffected by the regulation. Coyote Reservoir, how ever, stored nearly all the flow of Coyote Creek above the ME - drone gaging station.
Where a gaging station was some distance downstream from a reservoir, an additional adjustment for channel storage was mac'e on the basis of channel dimensions and rate of change of stage. Gaging-station records requiring this type of treatment were thojre for Los Capitancillos Creek and Alameda Creek. Adjusted dis charge for the station on Coyote Creek near Edenvalewsis computed

Tab
le 3
. --
Su
mm
ary
of
flo
od
dis
ch
arg
es
in s
ou
th S
an F
rancis
co B
ay r
egio
n,
Cali
forn
ia f
or
the
flo
od
of
Jan
uary
195
2
[AH
p
eak
dis
charg
es
in 1
953
com
pu
ted
fro
m e
stab
lish
ed
sta
ge-d
isch
arg
e r
ela
tip
n]
No.
on pi.
6 1 2 3 4 5 6 7 8 9 10
11
12
13
14
Str
eam
and
pla
ce o
f d
eter
min
atio
n
PA
CIF
IC O
CE
AN
DR
AIN
AG
E
Pesc
ad
ero
Cre
ek n
ear
Pesc
adero
---
----
--
SA
N F
RA
NC
ISC
O B
AY
DR
AIN
AG
E
San
Fra
ncis
quit
o C
reek
at
Sta
nfo
rd U
niv
ers
ity
Dra
inag
e are
a
(sq m
i)
40
.4
110 46
.2
37.7
18.1
35.0
1
2.6
43.6
13
1 8.8
19
4 22
9 63
3 38
.0
Peri
od
of
reco
rd
19
51
-52
1
93
7-5
2
19
51
-52
19
31
-41
, 1
95
0-5
2
19
30
-52
1
93
0-5
2
19
30
-52
1
93
0-5
2
19
30
-52
1
93
3-5
2
19
02
-12
, 1
91
6-5
2
19
16
-52
1916-5
2
1940
, 1
94
6-5
2
Max
imum
flo
od
pre
vio
usl
y k
now
n
Dat
e
Dec
. 28,
1951
F
eb.
27,
1940
D
ec.
4,
1951
Nov.
18,
1950
F
eb.
28,
1940
D
ec.
27,
1931
D
ec.
28,
1931
F
eb.
27,
1940
F
eb.
27,
1940
F
eb.
27,
1940
M
ar.
7,
1911
F
eb.
10,
1922
N
ov.
19,
1950
F
eb.
27,
1840
Ja
n.
24,
1942
Gag
e hei
ght
(fee
t)
10.5
8
21.
1 12.7
3
10.4
7.0
5
6.6
0
4.0
5
b 14.7
1
11.8
8
5.3
5
12.8
12.5
13
. 13
15.7
Dis
ch
arg
e
L (c
fs)
3,5
00
24,0
00
2,3
10
3,6
50
a 2,
390
2,6
70
1,1
60
7, 1
10
a 8,6
80
2,5
40
c 2
5,0
00
10,0
00
a 15.1
00
2,9S
O
4,2
00
Cfs
per
sq m
i
86.6
21
8 50.0
96.8
13
2 76.3
9
2.1
16
3 66.3
28
9 12
9 43.7
23.9
78.7
11
1
Max
imum
duri
ng
pre
sen
t fl
oo
d
Tim
e on
Jan
uary
li
Gag
e h
eig
ht
(fee
t)
11
.63
16.8
5
14.
16
6.4
0
5.8
2
5.2
4
.22
1
0.0
15.2
0
4.6
3
2.4
4
4.7
7
13
.92
1
1.1
0
Dis
ch
arg
e
(cfs
)
4,9
10
14,9
00
2,8
60
1,6
10
1,1
10
a 2
,00
0
a 1,
330
5
,80
0
a 8,0
00
1,4
30
a 56
a
768
a 18,5
00
1,9
90
Cfs
per
sq m
i
122
135 61.9
42.7
61.3
57.1
10
6 13
3 61
.1
162
.3
3.4
29
2
52.4
r o o a C/3
C/3
O a H
8 C/3
O 55
O o 82a
Reg
ula
ted.
Sit
e an
d dat
um
then
in
use
. 0
Dis
ch
arg
e f
igu
re f
urn
ish
ed b
y D
ury
ea,
Hae
hl
& O
ilm
an,
consu
ltin
g e
ng
ineers
.

556 FLOODS OF 1952 IN CALIFORNIA
from a correlation with peak discharges for the station near Ma- drone, using discharge records that antedate the construction of the reservoirs. No extrapolation was required in this correlation. Unregulated flow of the Alamitos Creek and Guadalupe River gag ing stations was not computed because of the complexity of the reservoir system above those gaging stations. Reservoirs on San Francisquito and Los Gatos Creeks were filled before the start of the storm and had no regulating effects, therefore, on these streams. No great accuracy is claimed for the adjusted dis charges of table 4, but they do indicate the order of magnitude of the unregulated peak discharges of the various streams.
Because of their usefulness in hydrograph analysis, maximum 24-hour discharges, both observed and adjusted, are tabulated in table 4. On figure 74, peak discharges for the January flood, ex pressed in cubic feet per second per square mile, are plotted a- gainst the corresponding drainage areas. Although the plotted points indicate a trend, they are scattered widely, undoubtedly a result of the complex interaction of the effects due to differences in amount of precipitation over the region and those due to the differences in hydrologic characteristics of the individual basins.
Hydrograph Characteristics
A detailed rainfall-runoff analysis of the flood of January 11-13, 1952, is beyond the scope of this report. However, examination of the basic data discloses certain storm and basin character istics.
DISCHARGE, IN CUBIC FEET PER SECOND PER SQUARE MILE 5 58 £ S S S 3 888 S 1
<\ T?IA7
5.
1
6<V
4.
,*8
3.4
*2
^
1J,
Nature]
umbers
*12
XPLANATION
or adjusted p
ogulated peak
conform to tho 3 and plate 6
eak
se
43
\3
6 7 8 9 10 15 20 30 40 50 60 70 80 100 150 200 300 400 500 600 800 1«
DRAINAGE AREA, IN SQUARE MILES
Figure 74. --Relation of peak unit discharge to size of drainagebasin.
Tab
le 4
. --
Sum
mar
y o
f fl
ood
dis
char
ges
in
south
San
Fra
nci
sco B
ay r
egio
n,
Januar
y 1
1-1
3,
1952
as
obse
rved
and
as
adju
sted
to
nat
ura
l fl
ow c
on
dit
ion
s.
No.
on
pi.
6 1 2 3 4 5 6 7 8 9 10 11 12 1 q
1 0 14
Str
eam
-gag
ing s
tati
on
PA
CIF
IC O
CE
AN
DR
AIN
AG
E
.o
oq
uel
v^r
eek
at o
oq
uel
a/
San
Lo
ren
zo C
reek
at
Big
Tre
es
a/-
-P
esca
der
o C
reek
near
Pes
cader
o a
/ -
SAN
FR
AN
CIS
CO
BA
Y D
RA
INA
GE
San
Fra
nci
squit
o C
reek
at
Sta
nfo
rdU
niv
ersi
ty.
Ste
ven
s C
reek
near
Cuper
tino b
/ --
--A
lam
itos
Cre
ek n
ear
Eden
val
e c/-
---
Lo
s C
apit
anci
llos
Cre
ek a
t G
uad
alupe
Lo
s G
ato
s C
reek
bel
ow L
os
Gat
os
---
Guad
alupe
Riv
er a
t S
an J
ose
--
----
--O
«-»
i-**
* 4-
*-*
** "
» f~
* /-
v/-v
1 «4-
C«
n 4
-rt,
***
**
^(i
/"*
«*
"»*
"» 1
v\r\n
*
"K
ftr\
*3
* *
-*.
**
**
Coy
ote
Cre
ek n
ear
Eden
val
e --
----
--A
1
r* w
i r\A
r*
f^viein]
v^ein
v*
TV
T4
1 *-
» «
San
Lo
ren
zo C
reek
at
Hay
war
d -
----
-
Mo
men
tary
pea
k d
isch
arg
e
Cfs
Obse
rved
4,9
10
14
,90
02,8
60
1,6
10
1, 1
102,0
00
1,3
30
5,8
00
8,0
00
1,4
30 56 768
18,5
00
1,9
90
Adju
sted
(a)
(a)
(a)
(b/
(b)
(c)
2,2
00
(b)
(c)
<a)
7,0
00
6,6
00
20,0
00
(a)
Cfs
per
sq
mi
Ob
serv
ed
122
135 61.9
42
.7
61
.3(c
)
133 (c)
162 52.4
Adju
sted
(a)
(a)
(a)
(b)
(b)
(c)
175
(b)
(c)
(a) 36
. 1
28.
8o
1
Col.
b
(a)
Max
imu
m 2
4-h
our
dis
char
ge
Cfs
Obse
rved
2,5
00
6,9
30
2,0
00
1,0
70
590
1,4
10
658
3,1
30
4,9
50
419 50
446
14,2
00
1,3
40
Ad
just
ed
(a)
(a)
(a)
(b) 68
0(c
)1,
100
(b)
(c)
(a)
3,8
00
4,2
00
16
,50
0
<a)
S § CO » i
2 8 CO o a o
o s Ed 8 e i en
en
a D
isch
arge
not
affe
cted
; no
rese
rvo
ir o
n st
ream
.b
Pea
k d
isch
arge
not
affe
cted
by
rese
rvoir
.c
Insu
ffic
ien
t re
serv
oir
dat
a fo
r es
tim
ate
of n
atu
ral
flow
.

558 FLOODS OF 1952 IN CALIFORNIA
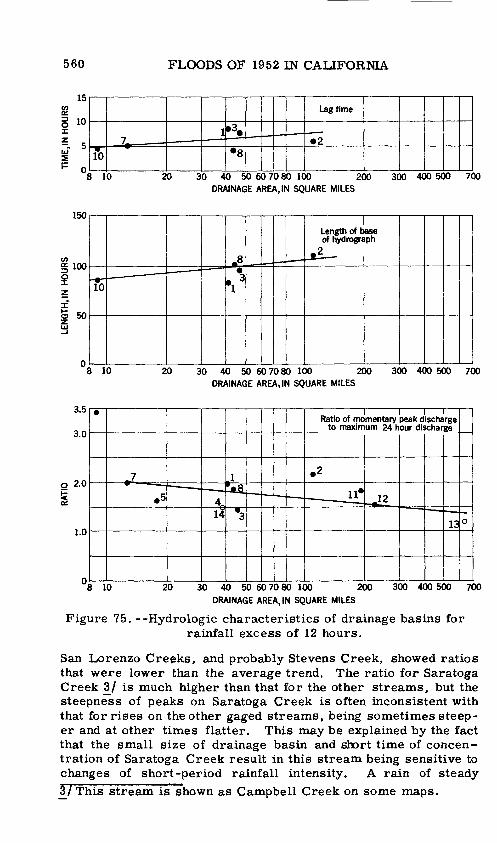
Three elements roughly define the hydrographs of direct run off that resulted from the rainfall excess: lag time; length, in time, of the base of the hydrograph; and the ratio of the momentary peak discharge to the maximum 24-hour discharge (adjusted for regu lation, if necessary).
Lag time is defined as the time elapsing between the center of mass of rainfall excess and the occurrence of the peak discharge. The rainfall excess, which is defined as the volume of rainfall a- vailable for direct runoff, fell mainly during a 12-hour period, with the center of mass of this rainfall excess reached about 9 p. m. on January 11; hence, lag time is readily deter mined. The second element, length of the base of the hydrograph, can be measured directly from the hydrograph after an arbitrary separation of base flow has been made. The third element, the ratio of the momen tary peak, discharge to the maximum 24-hour discharge, entails a determination of the maximum 24-hour period, as it rarely coin cides with' the calendar day. This last factor is important in the San Francisco Bay region, because the small size of the drainage basins resulted in a large part of the rainfall excess running off within a period of 24 hours. This is true, to a degree, even in the comparatively large drainage basin of Alameda Creek, be cause the extremely dendritic stream pattern there reduces the travel time of direct runoff, and thereby partly compensates for the disparity in size of the basin. Total discharges were used in computing the ratios, because the refinement of separating base flow from total flow did not appear to be warranted. (Further discussions of this ratio as pertaining to California streams may be found in Water-Supply Papers 843 and 1137-F. 2j
Table 5 summarizes the three hydrograph characteristics dis cussed in the previous paragraph, and on figure 75 they are plot ted against the corresponding drainage areas. Neither lag time nor length of base of the hydrograph was computed for those ba sins that were very highly regulated or experienced double peaks. In computing the length of the base of the hydrograph, use was made of the normal recession curves for the gaging stations, be cause none of the streams had receded to base flow before the start of the rains of January 14-17. Ratios of momentary peak discharge to maximum 24-hour average discharge were computed for all stations, except those on the highly regulated streams Alamitos Creek and Guadalupe River. As expected, those streams that experienced double peaks, San Francisquito, Alameda, and
£/ McGlashan, H. D. , and Briggs, R. C., 1939, Floods of De cember 1937 in northern Calif.: U. S. Geol. Survey Water-Sup ply Paper 843, p. 321-324, 341-345; U. S. Geol. Survey, 1953, Floods of 1950 in the Central Valley basin, Calif.: U. S. Geol. Survey Water-Supply Paper 1137-F, p. 767-774.

Tab
le 5
.--H
ydro
logic
char
acte
rist
ics
of d
rain
age
bas
ins
in s
outh
San
Fra
nci
sco
Bay
reg
ion,
for
rain
fall
ex
cess
of
12 h
ou
rs d
ura
tion,
as d
eriv
ed f
rom
flo
od o
f Ja
nu
ary
11-
13,
1952
.
No.
on Pi. 6
Str
eam
-gag
ing s
tati
on
Dra
inag
ear
ea(s
q m
i)
Lag
tim
e (h
ours
)
Len
gth
of b
ase
of h
yd
rog
rap
h(h
ours
)
Rat
io o
f m
om
enta
ry
peak
to
max
imum
24-h
our
dis
char
ge
CQ CO O CJ H
ffl
PA
CIF
IC O
CE
AN
DR
AIN
AG
E
1 Soquel Creek at Soquel --------------
40.4
2 Sa
n Lo
renz
o River
at Big Tre
es -
-----
110
3 Pe
scad
ero Creek nea
r Pe
scad
ero --
---
46. 2
SAN
FR
AN
CIS
CO
BA
Y D
RA
INA
GE
4 S
an F
ranci
squ
ito
Cre
ek a
t S
tanf
ord
37.
7 U
niv
ersi
ty.
5 S
teve
ns C
reek
nea
r C
uper
tino -
----
---
18.
16
Ala
mit
os
Cre
ek n
ear
Eden
vale
----
----
35
. 0
7 L
os
Cap
itan
cill
os
Cre
ek a
t G
uada
lup
e--
12.
68
Los
Gat
os C
reek
bel
ow L
os
Gato
s---
--
43.
6G
uada
lupe
Riv
er a
t S
an J
ose
--
----
---
131
10 S
arat
og
a C
reek
at
Sara
tog
a--
----
----
- 8.
811
Coy
ote
Cre
ek n
ear
Mad
rone
---
----
---
194
12 C
oyot
e C
reek
nea
r E
den
val
e --
----
---
229
13 A
lam
eda
Cre
ek n
ear
Nil
es -
----
----
--
633
14 S
an L
ore
nzo
Cre
ek a
t H
ayw
ard
----
---
38. 0
8.5
6.0
7.7
5
(a)
(b)
(b)
5.0
4.0
(b)
4.5 (b)
(b)
(a)
(a)
84 108 96 (a)
(b)
(b)
(b)
102
(b) 84
(b
) (b
) (a
) (a
)
1.9
62
.15
1.4
3
1.50
1.6
3(b
)2
.00
1.85
(b)
3.41
84
57
21
1,
1,
1.
1.4
9
CO O
O W w o V-H i en CD
a N
ot c
ompu
ted;
hydro
gra
ph h
as d
oubl
e pe
ak,
k T
oo h
ighl
y re
gula
ted f
or
reli
able
est
imat
e.
560
10
10
5
°llo
\ _____ ' 1
'"^_k 8
.. . *
Lag time
" 2
J 10 20 30 40 50 60 70 80 100 200 300 400 500 7(DRAINAGE AREA, IN SQUARE MILES
8 10 20 30 40 50 60 70 80 100 200 300 400 500 700 DRAINAGE AREA, IN SQUARE MILES
I III Ratio of momentary peak discharge
to maximum 24 hour discharge
8 10 20 30 40 50 607080 100 200 DRAINAGE AREA, IN SQUARE MILES
Figure 75. --Hydrologic characteristics of drainage basins for rainfall excess of 12 hours.
San Lorenzo Creeks, and probably Stevens Creek, showed ratios that were lower than the average trend. The ratio for Saratoga Creek 3/ is much higher than that for the other streams, but the steepness of peaks on Saratoga Creek is often inconsistent with that for rises on the other gaged streams, being sometimes steep er and at other times flatter. This may be explained by the fact that the small size of drainage basin and short time of concen tration of Saratoga Creek result in this stream being sensitive to changes of short-period rainfall intensity. A rain of steady3/This stream is shown as Campbell Creek on some maps.

FLOODS IN SOUTH SAN FRANCISCO BAY REGION 561
intensity will cause a flat peak, whereas a short interval of high- intensity rainfall, during a period of steady rain, will result in a sharply peaked hydrograph. In the larger drainage basins with longer times of concentration, the effect of a short interval of in tense rainfall is modified.
It is emphasized that the hydrograph characteristics discussed are those for a rainfall excess of 12 hours duration, as interpret ed from the records of a single flood. For a precise study, it would be necessary to divide the 12-hour duration period into shorter intervals, the records for many floods would have to be studied, and other basin parameters would have to be introduced- as for example, basin slope or a factor representing basin shape. The sketchy analysis used in this report does, however, give a generalized picture of the behavior of the streams in the region under a storm of the type described.

562 FLOODS OF 1952 IN CALIFORNIA
SNOWMELT FLOOD OF 1952 IN KERN RIVER, TULARE LAKE, AND SAN JOAQUIN RIVER BASINS
By Harlowe M. Stafford
Introduction
The snowmelt flood of .1952 in south-central California occurred in part of the same area (fig. 72) as the floods of November-De cember 1950, which are described in Water-Supply Paper 1137-F, Floods of November-December 1950 in the Central Valley basin, California, 4/ The cause of this flood was, however, quite dif ferent. Whereas the cause of the floods of 1950 was a series of heavy storms that brought rain, rather than snow, to unusually high altitudes in the Sierra Nevada, that of the flood of 1952 was the melting of an unusually heavy snow pack.
All the gaging stations listed in this report were also a source of data for Water-Supply Paper 1137-F. 4_/ For convenience, the reference numbers assigned to the gaging stations in table 7 and on the map (figure 76) for this report conform to those in tables 6 and 8 and plate 15 of Water-Supply Paper 1137-F 5_/.
The report contains no detailed records of discharge at individ ual gaging stations or tabulation of momentary peak discharges as commonly presented in flood reports. The discharge is expressed largely in terms of volume of runoff and the maximum daily dis charge during the 4-month period from April 1 to July 31; com parisons of these figures are made with those of other years of high runoff from snowmelt. Figure 75 shows the location of the area described in this report.
Description of Basins
The Kern River, Tulare Lake, and San Joaquin River basins occupy the southern part of the Central Valley basin of California, which lies between the crest of the Sierra Nevada on the east and crests of the coastal ranges on the west. The Tulare Lake basin lies between the Kern River basin on the south and the San Joaquin River basin on the north. Its principal streams, named in south to north order, are the Tule, Kaweah, and Kings Rivers.
4/ U. S. Geol. Survey, 1953, Floods of November-December 1950 in the Central Valley basin, California: U. S. Geol. Survey Water- Supply Paper 1137-F. p. 505-789. 5/ Idem. p. 742, 743, and 768.

FLOODS IN SAN JOAQUIN RIVER BASIN 563
Numbers refer to data in tail* 7
Outline of Central Valley basin
Figure 76. --Map showing location of gaging stations and outline of Central Valley basin.
The North and South Forks of the Kern River rise in the Sierra Nevada at an altitude of 14,000 feet near Mt. Whitney and drain the upper Kern River basin, about 2, 400 square miles of the west slope of the Sierra, above the foothill line east of Bakersfield. These streams flow south to join at a point downstream from Kern- villeand within the reservoir formed by the partly completed (1952) Isabella Dam. From their juncture the main stem flows westward through a narrow canyon to emerge onto the valley floor within 18 miles of Bakersfield. Thence, the river flows southwesterly, over the valley floor for about 39 miles to Buena Vista Lake, a natural sump now modified by cross levees. The bed of the lake is cultivated when not inundated for streamflow storage purposes. Flow into the lake is artificially controlled. Floodwaters not stored in the lake for later irrigation use are diverted into Buena Vista Channel through which they may flow northwesterly through Sand

564 FLOODS OF 1952 IN CALIFORNIA
Ridge to Tulare Lake. Floodwaters may also reach Tulare Lake via Goose Lake Slough, a distributary channel of Kern River down stream from Bakersfield.
Tule River drains an area of about 390 square miles on the low er slope of the Sierra Nevada to the west of the upper Kern River basin. The main stream is formed by the confluence of the North and Middle Forks about 10 miles northeast of the point where it emerges from the foothills at Porterville. The South Fork joins the main stream 6 miles east of this point. Floodwaters flow westward across the valley through old delta channels to Tulare Lake.
Kaweah River drains a mountainous area of about 520 square miles east of the foothills north and west of and separated from the upper Kern River basin by a secondary ridge paralleling the main crest of the Sierra Nevada. Its headwaters rise in glacial lakes at an altitude of more than 12, 000 feet. The main stream is formed about 10 miles upstream from the head of its delta by the confluence of the North, Middle, and South Forks near the town of of Three Rivers. Below the foothills it divides into several dis tributaries that cross the delta fan and enter Tulare Lake.
The headwaters of the Kings River rise in lakes and snowfielda at altitudes of as much as 14,000 feet, and drain a mountain area of about 1,700 square miles, north of the upper Kaweah River ba sin. The South and Middle Forks unite at an altitude of about 2,200 feet, and the North Fork joins the main stream at an altitude of about 1, 000 feet just upstream from the eastern end of Pine Flat Reservoir. Near the town of Piedra and about 4 miles downstream from the partly completed (1952) Pine FlatDam, the river emerges from the foothills onto the valley floor, where it has built up a large delta. At a point about 25 miles south of the city of Fresno the river divides, part flowing northerly (as Kings River North) through James bypass and Fresno Slough to the San Joaquin River, and part flowing south (as Kings River South) to Tulare Lake. The Corps of Engineers has constructed control works and levees in the vicinity of the division point.
Little runoff reaches the bed of Tulare Lake except in years of exceptionally large flow. In order to facilitate farming the lake bed, a network of levees has been constructed to confine the water to as small an area as possible. Inflow amounting to 5, 000 acre- feet can be stored between the leeves of the inlet channels. Inflow in excess of this amount will breach these levees and flood one or more of the cells within the network of levees in the lake bed. Part of the water stored is pumped out again for irrigation, and the remainder evaporates.

S65
San Joaquin River rises in the Sierra Nevada northwest of the Kings River basin at altitudes above 10,000 feet, flows southwest erly until it emerges from the foothills onto the valley floor, thence westerly to a point midway on the valley floor near the town of Men- dota, where it turns northwesterly to the delta and its confluence with Sacramento River at the head of Suisun Bay. At the edge of the foothills Millerton Lake, a reservoir formed by the construc tion of Friant Dam in 1941, affords storage capacity of 520,000 acre-feet. Above the reservoir the river drains a mountain area of about 1, 600 square miles, and an aggregate of about 338,000 acre-feet of storage space is provided in five upstream reservoirs operated for power. Below Friant Dam the principal tributaries rise in the Sierra Nevada and enter the main stem from the east. From south to north they are: Fresno, Chowchilla, Merced, Tuo- lumne, Stanislaus, Calaveras, and Mokelumne Rivers. The prin cipal reservoirs in the mountains and foothills provide usable storage capacity of about 281, 000 acre-feet on Merced River, 646,000 on Tuolumne River, 162,000 on Stanislaus River, and 349, 000 on Mokelumne River.
Description of the Flood
Antecedent Conditions
During the 1951-52 water year, precipitation in all the Central Valley basin was consistently greater than normal throughout the the winter. Widespread storms began in October and occurred intermittently until the end of March. The largest storms came in December and January. Most of the storms brought abnormally cold air and produced snow down to and below an altitude of 1, 000 feet. Very little of this snow melted and a very large snow pack accumulated over the entire mountain area.
On April 1, 1952, the accumulated snow pack was 260 percent of normal in the Kern River basin, from 190 percent (Kings River) to 265 percent (Tule River) in the Tulare Lake basin, and from 180 percent (Merced and Tuolumne Rivers) to 200 percent (Stani slaus and Mokelumne Rivers) in the San Joaquin River basin. As shown in table 6, this snow pack, in all basins, exceeded that ex isting on the same date in 1938, which had been the greatest pack on record since the beginning of the California Cooperative Snow Surveys record in 1930. Moreover, examination of available rec ords of snowfall at stations in these basins indicates that the 1952 snow pack equalled or exceeded the pack that caused the great snowmelt floods of 1906.

566 FLOODS OF 1952 IN CALIFORNIA
Thus, in April of 1952 enough snow had accumulated to cause the greatest snowmelt flood on record. That such a flood did not occur was largely due to the temperature pattern during the snow- melt period. Weather continued to be cold; temperatures from April through July were generally below normal-in June about 5° below normal. Moreover, the occasional intervals of hot weather that usually cause the peak flows during the period of the snowmelt runoff were short and not as hot as usual.
Table 6. --Comparison of snow packs existing on April 1 for the years 1938 and 1952 in the Kern River, Tulare Lake, and San Joaquin River basins expressed in percent of normal computed for the 62-year period 1880-1951, inclusive.
[Data from State Division of Water Resources, California Cooperative SnowSurveys]
Drainage basin
Tule River--------------------------- --
San Joaquin River:
Average snow pack in basin (percent)
1952
260
195 265 220 190
190 180 180 200 200
1938
205
155 180 155 155
170 140 150 170 155
Flood Runoff
As it occurred, the volume of the April-July runoff approached closely that of 1938, and on Kern, Kaweah, Stanislaus, and Moke- lumne Rivers exceeded it (see table 7). However, in no case where the period of the record includes the year 1906 did the 1952 snowmelt runoff exceed that of 1906. Figure 76 shows the location of the gaging stations listed in table 7.
As shown in table 7, the maximum daily discharge during the April-July runoff period was greater than the corresponding dis* charge in 1938 on the Kern, Kaweah, and Mokelumne Rivers. However, on those streams where the period of the record in cludes the year 1906, the maximum daily discharge during the snowmelt period did not exceed that of 1906.

Tab
le I
. --S
no
wm
elt
runoff
du
rin
g t
he
per
iod A
pri
l 1-J
uly
31
for
the
years
195
2 an
d 1
938
and
for
the
year
of
gre
ate
st s
no
wm
elt
floo
d on
record
.K
ern R
iver
, T
ula
re L
ake,
an
d S
an J
oaq
uin
Riv
er b
asin
s.
No.
* on
F
ig.
7(
30 QC ob
37 39
44 49 50 57 79 80 88 98 114
115
Str
eam
and
gag
ing
sta
tion
KE
RN
RIV
ER
BA
SIN
Ker
n R
iver
nea
r B
aker
sfie
ld a
/---
-
TU
LA
RE
LA
KE
BA
SIN
Sou
th F
ork
Tule
Riv
er n
ear
Su
cces
sK
awea
h R
iver
nea
r T
hre
e R
iver
s --
Kin
gs
Riv
er a
t P
ied
ra ---
----
-
SA
N J
OA
QU
IN R
IVE
R B
AS
IN
San
Jo
aqu
in R
iver
bel
ow K
erck
ho
ffpow
erhouse
.S
an J
oaq
uin
Riv
er b
elow
Fri
ant
--
San
Jo
aqu
in R
iver
near
Ver
nal
is -
--M
erce
d R
iver
at
Bag
by -
----
-- --
Mer
ced
Riv
er a
t E
xch
equer
-- ---
---
Tu
olu
mn
e R
iver
above
La
Gra
nge
Dam
, nea
r L
a G
range.
Sta
nis
lau
s R
iver
bel
ow M
elones
pow
erhouse
.M
okel
um
ne
Riv
er n
ear
Mokel
um
ne
Hil
l.M
okel
um
ne
Riv
er a
t L
anch
a P
lana
Per
iod
of
record
1893
-195
2
1 oni
-"^
9X
£71/1
*J
&
1932
-52
1903
-52
10Q
C
1Q
CO
LO
W
X i
J*J
&
19
37
,19
43
-52
1907
-52
19
22
,19
30
-52
1922
-52
1916
-52
1896
-195
2
1931
-52
1928
-52
f 19
04-5
2
Run
off
in 1
,000
acre
-ft
.
1952 1,1
20
115 38
588
2 20
0
c 1,8
30
cdl,
730
c 4,5
10
1,0
90
c 1,0
50
c 1,7
30
c 1,3
20
c 81
9
c737
1538 96
2
1 9Q
i&y
40
562
2<*9
n,
O£u
--
C2
.34
0c6,
160
el,
230
c 1,2
00
c 1,9
00
cl,
310
c 72
7
c65
1
Max
imu
m r
ecord
1,3
90 40 814
2 98
0
c 1,8
30
2^,5
40c
6,1
60
e 1
,23
0c
1,2
00
2,6
80
c 1,3
20
c 81
9
f 1
,02
0
Yea
r
1906
1906
19
3819
06
1906
1952
1911
1938
1938
1938
1906
1952
1952
1906
1907
Max
imu
m d
aily
dis
char
ge
19
52
Cfs 8,3
60
Q C
f\oo
U
330
5,1
70
b 15,5
00
c 15,0
00
cd
9,5
20
c 33,7
00
9,6
60
c 9,9
30
c 11,3
00
c 11,6
00
c 7,3
50
c 5
,11
0
Dat
e
May
31
A n
r>
9t\
jVp
I .
£t\
j
Apr.
6
May
27
Ju
ne
6
June
6
Jun
e 18
June
1M
ay
28M
ay
31M
ay
16
May
28
May
31
June
11
1938
Cfs 7,3
00
1,3
00
364
5,1
30
99
nnn
£t£t
t o
uu
--
c 17,7
00
c 47
, 60
0e
12,3
00
c 12,0
00
c 19,0
00
c 13,7
00
c 5,6
20
c4,
850
Dat
e
Jun
e 4
May
15
Apr.
25
Jun
e 3
June
4
--
May
15
Jun
e 7
May
15
Jun
e 2
Jun
e 5
May
15
Jun
e 7
May
16
Max
imu
m r
eC
fs 9,5
00
2ao
n,
Q£
\J
575
7,2
60
24
90
0
c 15,0
00
23,1
00
c 47,6
00
e 15,9
00
c 12,0
00
20,2
00
c 13,7
00
c 8,
720
f 9,0
00
Yea
r
1906
1 Q
99
1^6
3
1937
1906
1 Q
ftfi
lyut
)
1952
1911
1938
1935
1938
1906
1938
1943
1906
cord Dat
e
June
21
Ap
r.
6 A
pr.
2
May
28
Ju
ne
20
June
6
June
13Ju
ne
7A
pr.
8
June
2Ju
ne
13
May
15
June
1
June
12
r o o d S w H-1 S!
a R
ecord
s fu
rnis
hed
by K
ern C
ount
y L
and C
o.b
Aff
ecte
d b
y r
egula
tion a
fford
ed b
y 1
50,
000
acre
-ft
of s
tora
ge
spac
e beh
ind t
he
pan
tly c
om
ple
ted
in
1952
Pin
e F
lat
Dam
.c
Aff
ecte
d b
y s
tora
ge
regula
tion.
d In
cludes
div
ersi
on t
o F
riant-
Kern
and
Mad
era
Can
als.
e S
tati
on a
t K
ittr
idge.
' R
ecord
s fo
r st
atio
n n
ear
Cle
men
ts u
sed
for
per
iod
19
04-2
6.*
Ref
eren
ce n
um
ber
s co
nfo
rm w
ith
those
on
pla
te
15 a
nd t
able
6 o
f W
ater
-Supply
Pap
er 1
137-F
(19
53).

568 FLOODS OF 1952 IN CALIFORNIA
On the Kern River, the volume of the April-July runoff that passed the site of Isabella Dam was 954,000 acre-feet, and .the maximum daily discharge was 8,000 cfs on May 30: At the statior near Bakersfield, the maximum daily discharge was 8, 360 cfs ar compared to a discharge of 7,300 cfs in 1938and9,500 cfs in 1906.
At the Tule River station near Porterville (upstream from the South Fork), the maximum daily discharge during the snowmelt period was 860 cfs on April 25. This was exceeded by the dis charge of 1, 300 cfs in 1938, of 2, 780 cfs in 1906, and by the rec ord discharge of 2, 820 cfs in 1923.
Because a snowmelt runoff could occur on the Kings River on a scale as great or greater than that of 1938, when a maximum daily discharge of 22,800 cfsandan April-July volume of 2,320,000 acre-feet were recorded at Piedra, the Corps of Engineers stored water in partly completed Pine Flat Reservoir to limit damage downstream as much as possible. Of 150,000 acre-feet of storage space available on April 1, about 130,000 acre-feet was used in controlling theoutflowto a maximum daily discharge of 15,500 cfs on June 6. Inflow to the reservoir reached a maximum of 18, 400 cfs on May 28. If the storage facilities of the reservoir had not been used the Corps of Engineers estimated that instead of 250,000 acre-feet, about 320,000 acre-feet of runoff from Kings River would have entered Tulare Lake. The maximum daily flow to Tu- lare Lake was about 3, 600 cfs and to San Joaquin River, about 4, 600 cfs.
On San Joaquin River, the regulation of snowmelt runoff by Millerton Lake was such that the maximum daily outflow from the reservoir, including diversions to the Madera and Friant-Kern Canals, did not exceed the 9,520 cfs on June 18. At the station below Kerckhoff powerhouse, upstream from the reservoir, the maximum daily discharge was 15,000 cfs on June 6. In 1938, be fore the construction of Friant Dam, the maximum daily discharge below Friant during the snowmelt period was 17, 700 cfs.
On Merced River, the maximum daily inflow to Lake McClur? was 9,660 cfs and occurred on May 28. Maximum daily outflov from the reservoir was 9, 930 cfs, on May 31; in 1938 the corres ponding discharge was 12, 000 cfs on June 2.
On April 1 there was a total of 370,000 acre-feet of space avail able in the foothill and mountain reservoirs of the Tuolumne River basin. Of this total, 100,000 acre-feet of space in Don Pedro Reservoir was reserved for flood control. In view of the large April 1 snow pack, flood-control space was held also in Hetch Hetchy Reservoir by the City of San Francisco. As recorded st

FLOODS IN SAN JOAQUIN RIVER BASIN 569
the station near La Grange, the maximum daily outflow from Don Pedro Reservoir occurred on May 16 and was 11,300 cfs. The corresponding outflow during the 1938 snowmelt floods was 19,000 cfs. The record daily discharge near La Grange of 20,200 cfs was established during the snowmelt floods of 1906, before construction of the existing reservoirs.
On Stanislaus River, the maximum daily discharge below Me- lones Dam was 11,600 cfs as compared with a discharge of 13,700 cfs during the 1938 snowmelt period. The runoff volume for the period April through July, totaling 1,320,000 acre-feet, was slightly greater than that of 1938.
Although there was more than 180,000 acre-feet of combined storage space in Salt Springs and Pardee reservoirs on April 1, snowmelt flows of Mokelumne River exceeded downstream channel capacities. Salt Springs Reservoir filled about July 10 and Pardee Reservoir about July 4. Pardee Reservoir was operated for flood control purposes by the East Bay Municipal Utility District. As recorded at the Lancha Plana gaging station, the maximum daily outflow from Pardee Reservoir was 5, 110 cfs on June 11. The corresponding discharge in 1938 was 4, 850 cfs and occurred on May 16. In 1906, before the upstream reservoir development, the maximum daily discharge of snowmelt runoff at the station near Clements was 9,000 cfs. Total April-July volume of runoff at Lancha Plana in 1952 was 737, 000 acre-feet and exceeded that of 1938 by 86,000 acre-feet. In 1906, the corresponding volume near Clements was 1,020,000 acre-feet.
An indication of the effectiveness of the principal reservoirs in the San Joaquin River basin in regulating the large April-July vol umes of snowmelt runoff both in 1938 and in 1952 is shown by the data in table 8.
Extent and Character of Flooding
Damaging floods occurred along lower reaches of Kern River, principally along upper Goose Lake Slough and in Buena Vista Lake. Although floodwaters were stored in the lake and dams constructed across outlets of the river impounded water for future irrigation use in the Sand Ridge area, a total of 30, 700 acres of agricultural lands--in native pasture or planted to cotton, alfalfa, and grain- was flooded; this total includes about 23,500 acres in Buena Vista Lake, 200 acres along Goose Lake Slough, and 7, 000 acres that were intentionally flooded in the Sand Ridge area. Several county roads were washed out by flows in Goose Lake Slough, and one road was damaged near Tulare Lake.

570 FLOODS OF 1952 IN CALIFORNIA
Table 8. --Storage increment in principal reservoirs of the San Joaquin River basin during snowmelt period April 1-July 31, for the years 1938 and 1952.
Tributary basin
Upper San Joaquin River
Reservoir
Lake McClure -------------
Storage increment April 1-July 31
(acre -feet)
1938 195264,100 63,900 69,300 77,500 83,900 124,800
__ 159,900
49,700 14,500
1,700 14,900 224,100 248,800 25,300 110,700
10,900 55,900
86,500 108,700 71,800 72,600
Upstream from the Tulare Lake area, about 300 acres of agri cultural lands were flooded by Tule River water augmented by water from Kaweah River via Elk Bayou. Minor flooding occurred on Kings River as the result of a levee break upstream from Crescent weir, and on Kings River North about 5, 100 acres were inundated within the levees. About 1,100 acres of crop lands along the Kings River downstream from the town of Laton suffered damage from seepage produced by the continuous high flows.
Major flooding occurred in the Tulare Lake area. Flood-waters from Kings, Kaweah, and Tule Rivers began entering Tulare Lake early in the snowmelt period, and water in the lake reached a max imum of about 500,000 acre-feet on or about June 20. As estimated by the Corps of Engineers, total volume of inflow to the lake during the snowmelt period amounted to 490,000 acre-feet. The corre sponding inflow in 1938 was 850, 000 acre-feet. A total of 72,70C acres of agricultural lands in Tulare Lake was flooded. Of this total, crops had been harvested on 14,700 acres before inundation. Levee failures within Tulare Lake occurred from March until June 2.
Below Friant Dam on the San Joaquin River about 2, 500 acres of pasture and crop lands were flooded; in addition, 400 acres of crop lands were affected by water seeping through levees and canal banks along the river for about 15 miles upstream from Mendota Dam. Maximum releases from Millerton Lake in combination with a maximum inflow of about 4, 600 cfs of Kings River water via

FLOODS IN SAN JOAQUIN RIVER BASIN 571
Fresno Slough produced a peak of about 8, 800 cfs near Mendota on May 29. Downstream from Mendota Dam^inflow from the prin cipal tributaries produced flows in excess of channel capacity at nearly all points along the lower San Joaquin River. Near Ver- nalis, and downstream from the confluence of Stanislaus River, the maximum daily discharge of 33, 700 cfs on June 1 was only 3,900 cfs less than the corresponding discharge in 1938 on June 7. Be tween Mendota and the San Joaquin River delta, 77, 600 acres of agricultural lands were flooded in scattered areas inadequately protected by levees and in normal overflow areas. About 65,700 acres of the flooded area was native pastureland and the remain der was cropland. An additional 10, 600 acres of cropland was damaged by seepage through and under the levees, owing to the long duration of the period of high flows. Major levee breaks oc curred near Dos Palos, in the reach between the Tuolumneand Stanislaus Rivers, and in Reclamation District 2075 downstream from the Stanislaus River. A large recreational area between the levees near Mossdale, many residential properties, and several miles of paved county roads were flooded.
About 2, 600 acres of crop and pastureland and a county road were flooded, when overbankflow inundated bottomland along both banks of the Merced River in a narrow strip extending from the vicinity of Livingston to the mouth of the river.
Aside from the flooding of about 500 acres of river bottom land near its mouth and seepage damage to 190 acres of cropland below Tuolumne City bridge, flows from the Tuolumne River added sub stantially to the flooding along the San Joaquin River.
On the Stanslaus River, the flooded area extended from the vi cinity of Oakdale to the San Joaquin River. It included about 4,100 acres of river bottom lands, of which 1, 300 acres were in culti vated crops and the remainder in pasture. Near the mouth of the river about 1, 200 acres were severely affected by seepage of wa ter through the levee.
Agricultural lands flooded along Mokelumne River included about 3,900 acres near the confluence of the Cosumnes and Moke lumne Rivers; 650 acres, inundated by a levee break, near Locke- ford; and 640 acres in a narrow belt along the river between the towns of Lockeford and Lodi. Waste-disposal works of several wineries along the river were damaged by floodwaters.

572 FLOODS OF 1952 IN CALIFORNIA
Flood Damage
During and immediately following the 1952 gnowmelt floods, the Corps of Engineers began a survey of flood damage. This sur vey, which required approximately three months to complete, in cluded the collecting of all available reports of damage by other agencies, and the making of personal interviews with many proper ty owners and the personnel of local organizations, public utilities, and private firms that had suffered damage. The data on flood damage were embodied in a report presented by the Sacramento District, Corps of Engineers, entitled, "Report of 1952 Snow-Melt Floods, Sacramento-San Joaquin River Basins, California and Great Basin, California, Nevada, and Utah. "
Table 9 as taken from that report gives the flooded areas and the flood damage in the Kern River, Tulare Lake, and San Joaquin River basins under four categories of damage. In these three ba sins, damage incurred as a result of the 1952 snowmelt floods in cluded the flooding of 200, 900 acres and amounted to a total of $11,828,000 distributed as follows:
Type of damage Amount Percent of total
Agricultural $10,113,000 85.5 Residential 8,000 . 1 Commercial and 25,000 .2
industrial. Public institutions, 1,682,000 14.2
and public andprivate utilities.
Total: $11,828,000 100.0

Tab
le 9
. --
Flo
od
ed a
reas
and
flo
od d
amag
es,
Ker
n R
iver
, T
ula
re L
ake,
an
d S
an J
oaq
uin
Riv
er b
asin
s,sn
owm
elt
floo
d of
195
2.
[Com
pile
d by
Co
rps
of
En
gin
eers
]
Bas
in a
nd s
trea
m
KE
RN
RIV
ER
BA
SIN
TU
LA
RE
LA
KE
BA
SIN
SAN
JO
AQ
UIN
RIV
ER
BA
SIN
San
Joa
quin
Riv
er:
Mer
ced
R.
to T
uolu
mne
Riv
er- --
T
uolu
mne
R.
to S
tan
isla
us
Riv
er-
Tota
l,
San
Joa
quin
Riv
er b
asin
---
To
tal,
K
ern R
iver
, T
ula
re L
ake,
an
d Sa
n Jo
aqui
n R
iver
bas
ins
Flo
oded
ar
ea
(acr
es)
a 30
, 70
0
300
5,20
0 72
,700
78,2
00
2,50
0 60
, 90
0 8
,10
0
3,30
0 5,
300
2,60
0 (d
) 4,
100
5,20
0
92,0
00
200,
900
Dir
ect
floo
d da
mag
e
Agri
cult
ura
l
$1
,21
0,0
00
40,0
00
136,
000
6,8
77,0
00
b 7,0
53,0
00
60, 0
00
728,
000
139,
000
150,
000
414,
000
71,0
00
14,0
00
204,
000
70,0
00
e 1
,85
0,0
00
$1
0,1
13
,00
0
Com
mer
cial
an
d in
dust
rial 0 0 0 0 0 0
$6, 0
00 0 0
14,0
00 0 0 0
5,00
0
25,0
00
$25,
000
Publi
c in
stit
uti
ons
and
uti
liti
es
$5,0
00
17,0
00
63,0
00
1,4
18,0
00
1,4
98,0
00
10,0
00
31,0
00
2,0
00
13
,000
26
,000
3,
000 0
84,0
00
10,0
00
179,
000
$1
,68
2,0
00
Tota
l
$1
,21
5,0
00
57,0
00
199,
000
8,2
95
,00
0
8,5
51
,00
0
70,0
00
765,
000
141,
000
163,
000
c 46
2,00
0 74
,000
14
,000
28
8, 0
00
85,
000
c 2
,06
2,0
00
$11,8
28,0
00
r o 8 I SO
a In
clud
es 2
3, 5
00 a
cres
in
Bue
na V
ista
Lak
e.b
Incl
ud
es $
127,
000
seep
age
dam
age.
c In
clud
es $
8,00
0 re
sid
enti
al d
amag
e.d
Nom
inal
.e
Incl
udes
$81
0,00
0 se
epag
e da
mag
e.tn
-d C
O


INDEX
Page Abstract.......................... 531Alameda Creek near Niles .......... 552Alamitos Creek near Edenvale ...... 545Antecedent conditions, snowmelt
flood. ....................... 565
Big Trees, San Lorenzo River at.... 541
California, index map of..........Characteristics of drainage basins. Coyote Creek near Edenvale ......Coyote Creek near Madrone ......Cupertino, Stevens Creek near ....
Damage, flood...................Damage, snowmelt flood. .........Description of basins, snowmelt
flood......................Description of the flood ..........Description of the region .........Description of the snowmelt flood.. Discharges at gaging stations .....Discharge hydrographs at selected
stations ...................
Edenvale, Coyote Creek near . ., Explanation of data. ............Extent and character of flooding
(snowmelt flood). .........Edenvale, Alamitos Creek near .
Flood damage ....................Flood damage, snowmelt flood .....Flood, description of..............Flood of 1952, San Joaquin River
basin. ......................Flood of 1952, South San Francisco
Bay region. .................Flood runoff. .....................
Gaging stations, stages anddischarges at .........
Guadalupe, Los Capitancillos Creek at..............
Guadalupe River at San Jose .
Hay ward, San Lorenzo Creek at....Hydrograph characteristics ........Hydrographs, discharge at selected
stations ....................Hydrologic characteristics of
drainage basins. .............
532560551550544
535572
562533532565537
539
551537
569545
535572533
562
531566
537
546548
553556
539
560
Page Index map of California ........... 532Introduction, snowmelt flood ...... 562Introduction, south San Francisco
Bay region................. 531Isohyetal map of south San Francisco
Bay region................. pocket
Kern River basin, snowmelt flood of 1952 in. ................ 562
Los Capitancillos Creek atGuadalupe.................. 546
Los Gatos Creek below Los Gatos.. 547
Madrone, Coyote Creek near ...... 550Map of California, index .......... 532Map of south San Francisco
Bay region................. pocketMeteorology..................... 535
Niles, Alameda Creek near ....... 552
Peak discharge ..................Pescadero Creek near Pescadero .. Precipitation..................
Relation of peak unit dischargeto size of drainage basin. ....
Runoff, flood ....................
San Francisquito Creek at Stanford University. .................
San Joaquin River basin, snowmelt flood of 1952 in. ............
San Jose, Guadalupe River at. .....San Lorenzo Creek at Hayward ....San Lorenzo River at Big Trees . . .Saratoga Creek at Saratoga........Snowmelt flood of 1952 in San
Joaquin River basin.........Soquel Creek at Soquel. ...........South San Francisco Bay region,
flood of Jan. 1952...........Stages and discharges at stream-
gaging stations .............Stanford University, San
Francisquito Creek at.......Stevens Creek near Cupertino .....
554542537
556566
543
562548553541549
562540
531
537
543544
Tulare Lake basin, snowmelt flood of 1952 in. ................. 562
575
AU. S. GOVERNMENT PRINTING OFFICE : 1956 O -386773