Flights-to-Safety - | nbb.be · Baele, Bekaert, Inghelbrecht, Wei Flights-to-Safety. Motivation...
31
Transcript of Flights-to-Safety - | nbb.be · Baele, Bekaert, Inghelbrecht, Wei Flights-to-Safety. Motivation...

MotivationIdenti�cation Flight-to-Safety
AggregationComovementConclusions
Flights-to-Safety
Lieven Baele (Tilburg University)
Geert Bekaert (Columbia University)
Koen Inghelbrecht (University College Ghent)
Min Wei (Federal Reserve Board)
NBB Conference on �Endogenous Risks� - October 2012
Baele, Bekaert, Inghelbrecht, Wei Flights-to-Safety
MotivationIdenti�cation Flight-to-Safety
AggregationComovementConclusions
What is Flight-to-Safety?
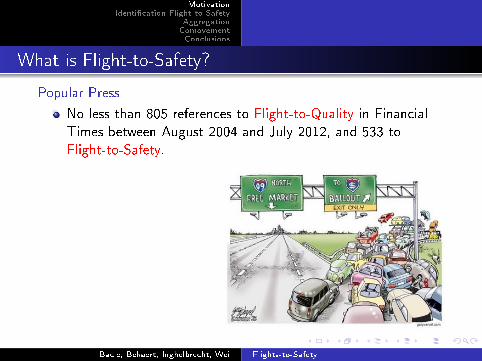
Popular Press
No less than 805 references to Flight-to-Quality in FinancialTimes between August 2004 and July 2012, and 533 toFlight-to-Safety.
Baele, Bekaert, Inghelbrecht, Wei Flights-to-Safety
MotivationIdenti�cation Flight-to-Safety
AggregationComovementConclusions
What is Flight-to-Safety?
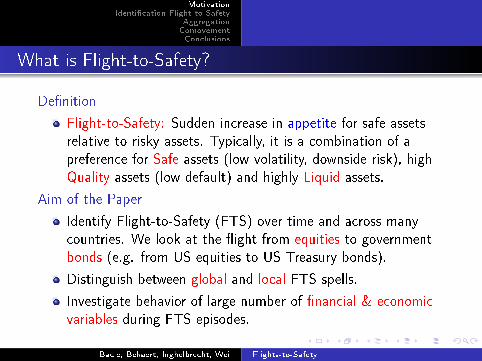
De�nition
Flight-to-Safety: Sudden increase in appetite for safe assetsrelative to risky assets. Typically, it is a combination of apreference for Safe assets (low volatility, downside risk), highQuality assets (low default) and highly Liquid assets.
Aim of the Paper
Identify Flight-to-Safety (FTS) over time and across manycountries. We look at the �ight from equities to governmentbonds (e.g. from US equities to US Treasury bonds).
Distinguish between global and local FTS spells.
Investigate behavior of large number of �nancial & economicvariables during FTS episodes.
Baele, Bekaert, Inghelbrecht, Wei Flights-to-Safety
MotivationIdenti�cation Flight-to-Safety
AggregationComovementConclusions
Overview of ApproachesDataFTS Dummy Threshold ModelOrdinal ApproachRegime-Switching FTS Model
FTS Diagnostics
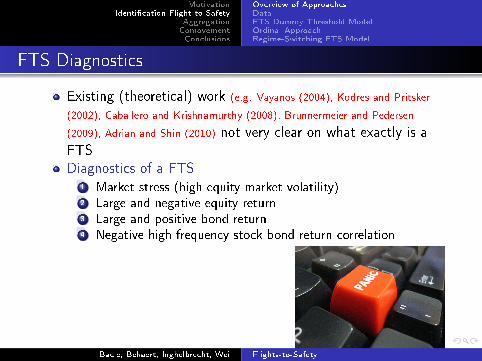
Existing (theoretical) work (e.g. Vayanos (2004), Kodres and Pritsker
(2002), Caballero and Krishnamurthy (2008), Brunnermeier and Pedersen
(2009), Adrian and Shin (2010) not very clear on what exactly is aFTSDiagnostics of a FTS
1 Market stress (high equity market volatility)2 Large and negative equity return3 Large and positive bond return4 Negative high-frequency stock-bond return correlation
Baele, Bekaert, Inghelbrecht, Wei Flights-to-Safety
MotivationIdenti�cation Flight-to-Safety
AggregationComovementConclusions
Overview of ApproachesDataFTS Dummy Threshold ModelOrdinal ApproachRegime-Switching FTS Model
Overview of Approaches
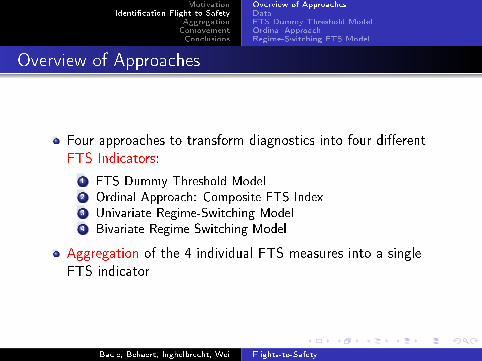
Four approaches to transform diagnostics into four di�erentFTS Indicators:
1 FTS Dummy Threshold Model2 Ordinal Approach: Composite FTS Index3 Univariate Regime-Switching Model4 Bivariate Regime-Switching Model
Aggregation of the 4 individual FTS measures into a singleFTS indicator
Baele, Bekaert, Inghelbrecht, Wei Flights-to-Safety
MotivationIdenti�cation Flight-to-Safety
AggregationComovementConclusions
Overview of ApproachesDataFTS Dummy Threshold ModelOrdinal ApproachRegime-Switching FTS Model
Data
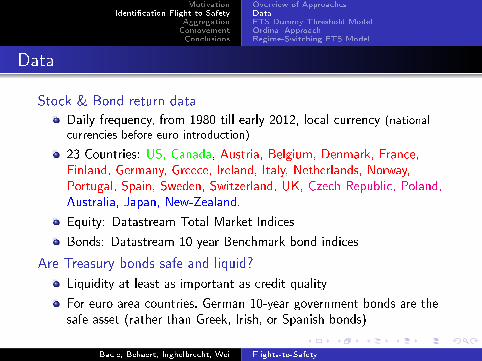
Stock & Bond return data
Daily frequency, from 1980 till early 2012, local currency (nationalcurrencies before euro introduction)
23 Countries: US, Canada, Austria, Belgium, Denmark, France,Finland, Germany, Greece, Ireland, Italy, Netherlands, Norway,Portugal, Spain, Sweden, Switzerland, UK, Czech Republic, Poland,Australia, Japan, New-Zealand.
Equity: Datastream Total Market Indices
Bonds: Datastream 10-year Benchmark bond indices
Are Treasury bonds safe and liquid?
Liquidity at least as important as credit quality
For euro area countries, German 10-year government bonds are thesafe asset (rather than Greek, Irish, or Spanish bonds)
Baele, Bekaert, Inghelbrecht, Wei Flights-to-Safety
MotivationIdenti�cation Flight-to-Safety
AggregationComovementConclusions
Overview of ApproachesDataFTS Dummy Threshold ModelOrdinal ApproachRegime-Switching FTS Model
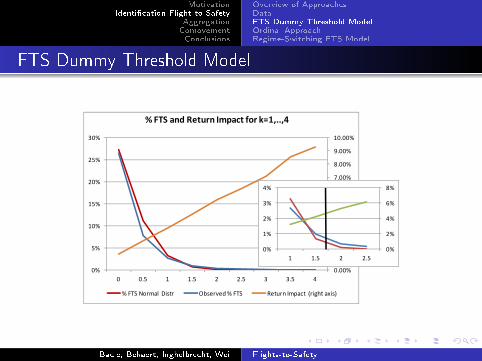
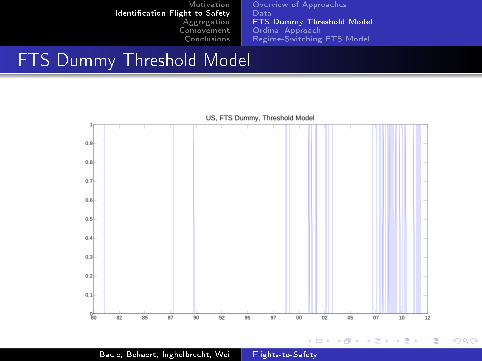
FTS Dummy Threshold Model
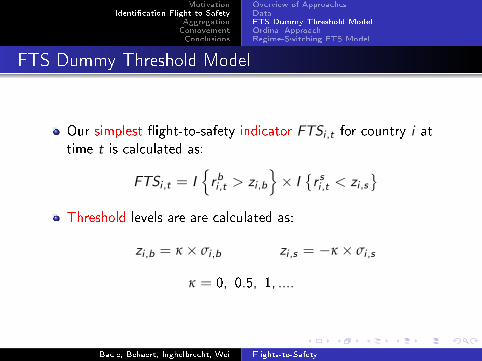
Our simplest �ight-to-safety indicator FTSi ,t for country i attime t is calculated as:
FTSi ,t = I{rbi ,t > zi ,b
}× I
{r si ,t < zi ,s
}Threshold levels are are calculated as:
zi ,b = κ × σi ,b zi ,s = −κ × σi ,s
κ = 0, 0.5, 1, ....
Baele, Bekaert, Inghelbrecht, Wei Flights-to-Safety
MotivationIdenti�cation Flight-to-Safety
AggregationComovementConclusions
Overview of ApproachesDataFTS Dummy Threshold ModelOrdinal ApproachRegime-Switching FTS Model
FTS Dummy Threshold Model
�����
�����
�����
�����
�����
�����
����
����
�����
�����
������
��
��
���
���
���
���
���
� ��� � ��� � ��� � ��� �
������������ ����������� ���������
� ��� ������ ����� �������� � ��� ��!�" #�$�%� &��'(� �)��*
��
��
��
�
��
��
��
��
��
��
� ��� � ���
Baele, Bekaert, Inghelbrecht, Wei Flights-to-Safety
MotivationIdenti�cation Flight-to-Safety
AggregationComovementConclusions
Overview of ApproachesDataFTS Dummy Threshold ModelOrdinal ApproachRegime-Switching FTS Model
FTS Dummy Threshold Model
80 82 85 87 90 92 95 97 00 02 05 07 10 120
0.1
0.2
0.3
0.4
0.5
0.6
0.7
0.8
0.9
1US, FTS Dummy, Threshold Model
Baele, Bekaert, Inghelbrecht, Wei Flights-to-Safety
MotivationIdenti�cation Flight-to-Safety
AggregationComovementConclusions
Overview of ApproachesDataFTS Dummy Threshold ModelOrdinal ApproachRegime-Switching FTS Model
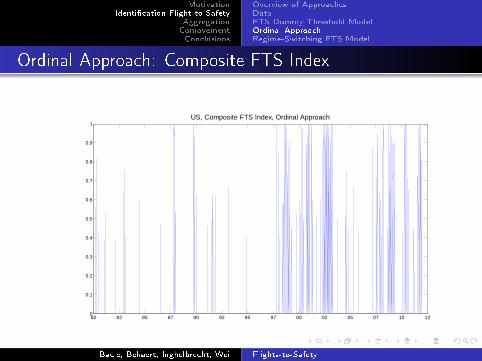
Ordinal Approach: Composite FTS Index (see Holo, Kremer, Lo Duca (2012))
Consider 6 indicators that increase with the likelihood of FTS:
rb,t − rs,t and [rb,t −MA(rb,t)]− [rs,t −MA(rs,t)]short-term σs,t and (short-term σs,t − long-term σs,t)minus short-term ρs,b,t and (long-term ρs,b,t −short-termρs,b,t )
For each indicator, rank from low to high, and replace eachobservation by its rank divided by total number of observations(i.e. si (t) = ri (t)/T )
0.95 means that only 5 percent of observations have higherlink with FTS
Aggregate the individual measures si ,t into a composite FTSindicator CFTSIt (simple average)
Baele, Bekaert, Inghelbrecht, Wei Flights-to-Safety
MotivationIdenti�cation Flight-to-Safety
AggregationComovementConclusions
Overview of ApproachesDataFTS Dummy Threshold ModelOrdinal ApproachRegime-Switching FTS Model
Ordinal Approach: Composite FTS Index
Caveat: Index cannot be interpreted as a probability
Solution:
1 Select observations matching minimal FTS criteria (i.e.rb,t − rs,t > 0, short-term σs,t < σs , short-term ρs,b,t < 0, ...)
2 Collect value of composite FTS index for those observationsand take mininum as threshold
3 FTS probability{= 0 if index < threshold
= 1− proportion false positives if index > threshold
Proportion of False Positives: % of observations with ordinal number >threshold not matching minimal FTS criteria
Baele, Bekaert, Inghelbrecht, Wei Flights-to-Safety
MotivationIdenti�cation Flight-to-Safety
AggregationComovementConclusions
Overview of ApproachesDataFTS Dummy Threshold ModelOrdinal ApproachRegime-Switching FTS Model
Ordinal Approach: Composite FTS Index
80 82 85 87 90 92 95 97 00 02 05 07 10 120
0.1
0.2
0.3
0.4
0.5
0.6
0.7
0.8
0.9
1US, Composite FTS Index, Ordinal Approach
Baele, Bekaert, Inghelbrecht, Wei Flights-to-Safety
MotivationIdenti�cation Flight-to-Safety
AggregationComovementConclusions
Overview of ApproachesDataFTS Dummy Threshold ModelOrdinal ApproachRegime-Switching FTS Model
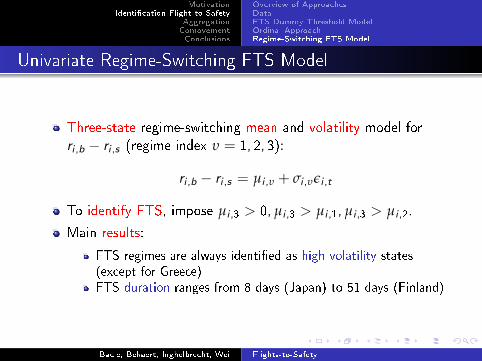
Univariate Regime-Switching FTS Model
Three-state regime-switching mean and volatility model forri ,b − ri ,s (regime index υ = 1, 2, 3):
ri ,b − ri ,s = µi ,υ + σi ,υεi ,t
To identify FTS, impose µi ,3 > 0, µi ,3 > µi ,1, µi ,3 > µi ,2.
Main results:
FTS regimes are always identi�ed as high volatility states(except for Greece)FTS duration ranges from 8 days (Japan) to 51 days (Finland)
Baele, Bekaert, Inghelbrecht, Wei Flights-to-Safety
MotivationIdenti�cation Flight-to-Safety
AggregationComovementConclusions
Overview of ApproachesDataFTS Dummy Threshold ModelOrdinal ApproachRegime-Switching FTS Model
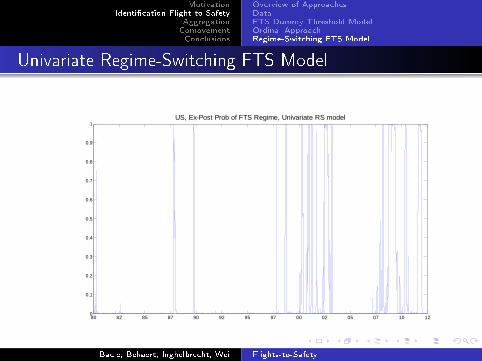
Univariate Regime-Switching FTS Model
80 82 85 87 90 92 95 97 00 02 05 07 10 120
0.1
0.2
0.3
0.4
0.5
0.6
0.7
0.8
0.9
1US, Ex-Post Prob of FTS Regime, Univariate RS model
Baele, Bekaert, Inghelbrecht, Wei Flights-to-Safety
MotivationIdenti�cation Flight-to-Safety
AggregationComovementConclusions
Overview of ApproachesDataFTS Dummy Threshold ModelOrdinal ApproachRegime-Switching FTS Model
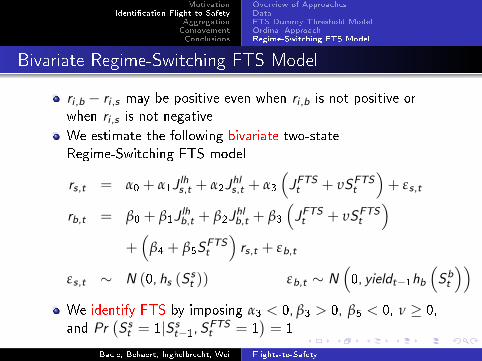
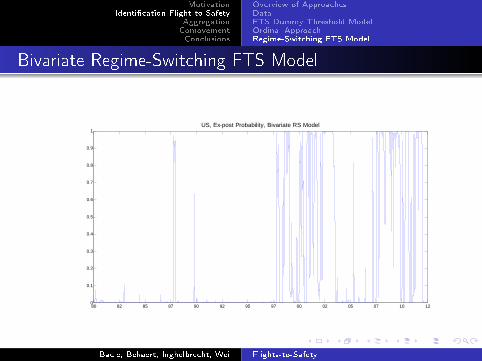
Bivariate Regime-Switching FTS Model
ri ,b − ri ,s may be positive even when ri ,b is not positive orwhen ri ,s is not negative
We estimate the following bivariate two-stateRegime-Switching FTS model
rs,t = α0 + α1Jlhs,t + α2J
hls,t + α3
(JFTSt + υSFTS
t
)+ εs,t
rb,t = β0 + β1Jlhb,t + β2J
hlb,t + β3
(JFTSt + υSFTS
t
)+(
β4 + β5SFTSt
)rs,t + εb,t
εs,t ∼ N (0, hs (Sst )) εb,t ∼ N
(0, yieldt−1hb
(Sbt
))We identify FTS by imposing α3 < 0, β3 > 0, β5 < 0, ν ≥ 0,and Pr
(S st = 1|S s
t−1, SFTSt = 1
)= 1
Baele, Bekaert, Inghelbrecht, Wei Flights-to-Safety
MotivationIdenti�cation Flight-to-Safety
AggregationComovementConclusions
Overview of ApproachesDataFTS Dummy Threshold ModelOrdinal ApproachRegime-Switching FTS Model
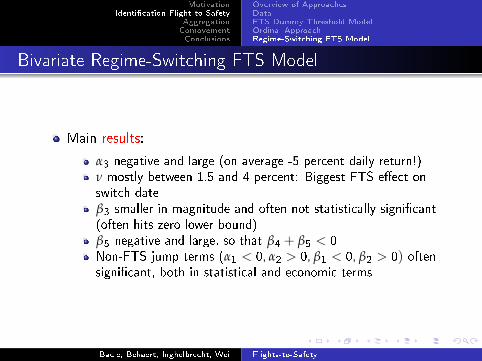
Bivariate Regime-Switching FTS Model
Main results:
α3 negative and large (on average -5 percent daily return!)ν mostly between 1.5 and 4 percent: Biggest FTS e�ect onswitch dateβ3 smaller in magnitude and often not statistically signi�cant(often hits zero lower bound)β5 negative and large, so that β4 + β5 < 0Non-FTS jump terms (α1 < 0, α2 > 0, β1 < 0, β2 > 0) oftensigni�cant, both in statistical and economic terms
Baele, Bekaert, Inghelbrecht, Wei Flights-to-Safety
MotivationIdenti�cation Flight-to-Safety
AggregationComovementConclusions
Overview of ApproachesDataFTS Dummy Threshold ModelOrdinal ApproachRegime-Switching FTS Model
Bivariate Regime-Switching FTS Model
80 82 85 87 90 92 95 97 00 02 05 07 10 120
0.1
0.2
0.3
0.4
0.5
0.6
0.7
0.8
0.9
1US, Ex-post Probability, Bivariate RS Model
Baele, Bekaert, Inghelbrecht, Wei Flights-to-Safety
MotivationIdenti�cation Flight-to-Safety
AggregationComovementConclusions
Aggregation MethodsAggregate FTS MeasuresGlobal versus Local FTS
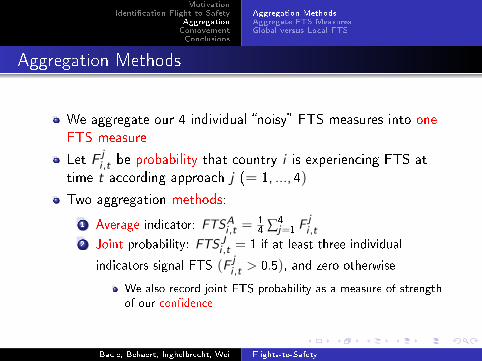
Aggregation Methods
We aggregate our 4 individual �noisy� FTS measures into oneFTS measure
Let F ji ,t be probability that country i is experiencing FTS at
time t according approach j (= 1, ..., 4)
Two aggregation methods:
1 Average indicator: FTSAi ,t =
14 ∑4
j=1 Fji ,t
2 Joint probability: FTSJi ,t = 1 if at least three individual
indicators signal FTS (F ji ,t > 0.5), and zero otherwise
We also record joint FTS probability as a measure of strengthof our con�dence
Baele, Bekaert, Inghelbrecht, Wei Flights-to-Safety
MotivationIdenti�cation Flight-to-Safety
AggregationComovementConclusions
Aggregation MethodsAggregate FTS MeasuresGlobal versus Local FTS
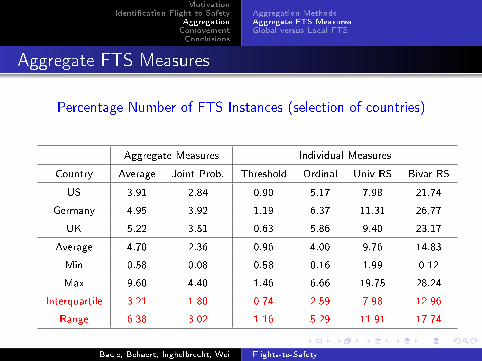
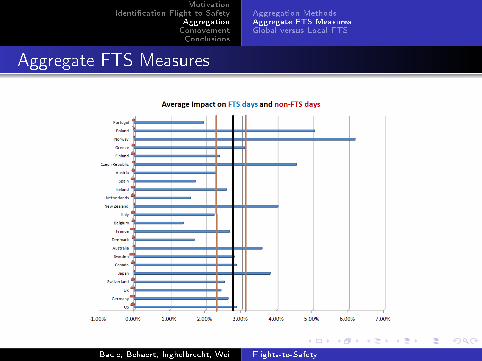
Aggregate FTS Measures
Percentage Number of FTS Instances (selection of countries)
Aggregate Measures Individual Measures
Country Average Joint Prob. Threshold Ordinal Univ RS Bivar RS
US 3.91 2.84 0.90 5.17 7.98 21.74
Germany 4.95 3.92 1.19 6.37 11.31 26.77
UK 5.22 3.51 0.63 5.86 9.40 23.17
Average 4.70 2.36 0.96 4.00 9.76 14.83
Min 0.58 0.08 0.58 0.16 1.99 0.12
Max 9.60 4.40 1.46 6.66 19.75 28.24
Interquartile 3.21 1.80 0.74 2.59 7.98 12.96
Range 6.38 3.02 1.16 5.29 11.91 17.74
Baele, Bekaert, Inghelbrecht, Wei Flights-to-Safety
MotivationIdenti�cation Flight-to-Safety
AggregationComovementConclusions
Aggregation MethodsAggregate FTS MeasuresGlobal versus Local FTS
Aggregate FTS Measures
Baele, Bekaert, Inghelbrecht, Wei Flights-to-Safety
MotivationIdenti�cation Flight-to-Safety
AggregationComovementConclusions
Aggregation MethodsAggregate FTS MeasuresGlobal versus Local FTS
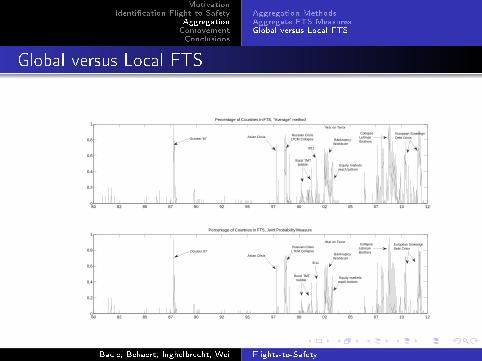
Global versus Local FTS
80 82 85 87 90 92 95 97 00 02 05 07 10 120
0.2
0.4
0.6
0.8
1Percentage of Countries in FTS, "Average" method
80 82 85 87 90 92 95 97 00 02 05 07 10 120
0.2
0.4
0.6
0.8
1Percentage of Countries in FTS, Joint Probability Measure
October '87
October '87
Asian Crisis
Asian Crisis
Russian CrisisLTCM Collapse
Russian CrisisLTCM Collapse
9/11
9/11
Burst TMTbubble
Burst TMTbubble
BankruptcyWorldcom
BankruptcyWorldcom
Equity marketsreach bottom
Equity marketsreach bottom
War on Terror
War on Terror
CollapseLehmanBrothers
CollapseLehmanBrothers
European SovereignDebt Crisis
European SovereignDebt Crisis
Baele, Bekaert, Inghelbrecht, Wei Flights-to-Safety

MotivationIdenti�cation Flight-to-Safety
AggregationComovementConclusions
OverviewApproachStress IndicatorsFinancial EnvironmentReal Economy
FTS and Financial and Economic Environment
Examine comovement of FTS and �nancial/economic environment:
1 Alternative stress indicators
1 Stock volatility (VIX)2 Sentiment indicators (Baker-Wurgler, Michigan, Ifo, OECD)3 Safe haven currencies (yen, Swiss franc)
2 Financial returns
1 Stock portfolios (industry, style)2 Bond portfolios (cash, goverment, corporate)3 Commodity prices (precious metals, oil, agricultural, etc)
3 Real economy
1 Contemporaneous and future economic variables (outputgrowth, in�ation, unemployment, etc)
2 Expectations about economic variables (from Survey ofProfessional Forecasters)
Baele, Bekaert, Inghelbrecht, Wei Flights-to-Safety
MotivationIdenti�cation Flight-to-Safety
AggregationComovementConclusions
OverviewApproachStress IndicatorsFinancial EnvironmentReal Economy
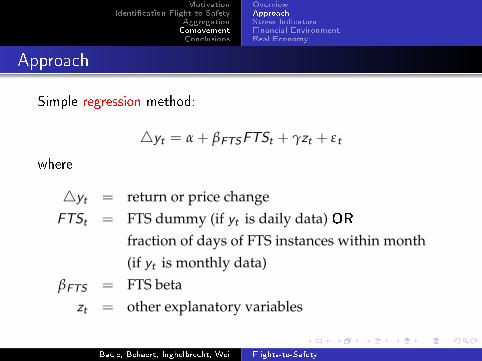
Approach
Simple regression method:
4yt = α + βFTSFTSt + γzt + εt
where
4yt = return or price changeFTSt = FTS dummy (if yt is daily data) OR
fraction of days of FTS instances within month(if yt is monthly data)
βFTS = FTS betazt = other explanatory variables
Baele, Bekaert, Inghelbrecht, Wei Flights-to-Safety
MotivationIdenti�cation Flight-to-Safety
AggregationComovementConclusions
OverviewApproachStress IndicatorsFinancial EnvironmentReal Economy
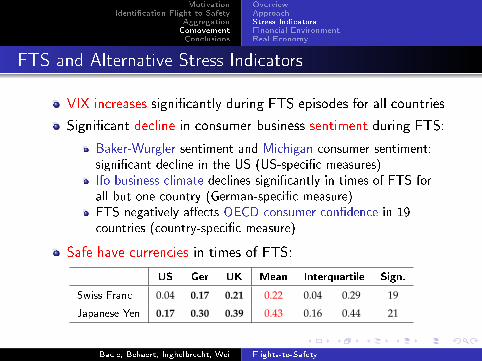
FTS and Alternative Stress Indicators
VIX increases signi�cantly during FTS episodes for all countries
Signi�cant decline in consumer-business sentiment during FTS:
Baker-Wurgler sentiment and Michigan consumer sentiment:signi�cant decline in the US (US-speci�c measures)Ifo business climate declines signi�cantly in times of FTS forall but one country (German-speci�c measure)FTS negatively a�ects OECD consumer con�dence in 19countries (country-speci�c measure)
Safe have currencies in times of FTS:
US Ger UK Mean Interquartile Sign.
Swiss Franc 0.04 0.17 0.21 0.22 0.04 0.29 19
Japanese Yen 0.17 0.30 0.39 0.43 0.16 0.44 21
Baele, Bekaert, Inghelbrecht, Wei Flights-to-Safety

MotivationIdenti�cation Flight-to-Safety
AggregationComovementConclusions
OverviewApproachStress IndicatorsFinancial EnvironmentReal Economy
FTS and Stock Portfolios
FTS beta of industry and style portfolios, controlling for normalbeta risk (world and local market return):
Baele, Bekaert, Inghelbrecht, Wei Flights-to-Safety
MotivationIdenti�cation Flight-to-Safety
AggregationComovementConclusions
OverviewApproachStress IndicatorsFinancial EnvironmentReal Economy
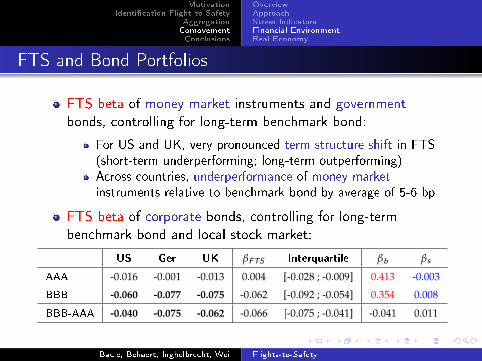
FTS and Bond Portfolios
FTS beta of money market instruments and governmentbonds, controlling for long-term benchmark bond:
For US and UK, very pronounced term structure shift in FTS(short-term underperforming; long-term outperforming)Across countries, underperformance of money marketinstruments relative to benchmark bond by average of 5-6 bp
FTS beta of corporate bonds, controlling for long-termbenchmark bond and local stock market:
US Ger UK βFTS Interquartile βb βs
AAA -0.016 -0.001 -0.013 0.004 [-0.028 ; -0.009] 0.413 -0.003
BBB -0.060 -0.077 -0.075 -0.062 [-0.092 ; -0.054] 0.354 0.008
BBB-AAA -0.040 -0.075 -0.062 -0.066 [-0.075 ; -0.041] -0.041 0.011
Baele, Bekaert, Inghelbrecht, Wei Flights-to-Safety
MotivationIdenti�cation Flight-to-Safety
AggregationComovementConclusions
OverviewApproachStress IndicatorsFinancial EnvironmentReal Economy
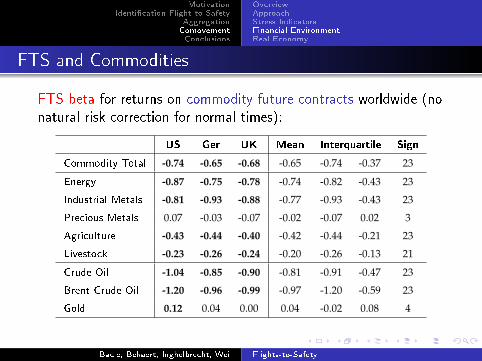
FTS and Commodities
FTS beta for returns on commodity future contracts worldwide (nonatural risk correction for normal times):
US Ger UK Mean Interquartile Sign
Commodity Total -0.74 -0.65 -0.68 -0.65 -0.74 -0.37 23
Energy -0.87 -0.75 -0.78 -0.74 -0.82 -0.43 23
Industrial Metals -0.81 -0.93 -0.88 -0.77 -0.93 -0.43 23
Precious Metals 0.07 -0.03 -0.07 -0.02 -0.07 0.02 3
Agriculture -0.43 -0.44 -0.40 -0.42 -0.44 -0.21 23
Livestock -0.23 -0.26 -0.24 -0.20 -0.26 -0.13 21
Crude Oil -1.04 -0.85 -0.90 -0.81 -0.91 -0.47 23
Brent Crude Oil -1.20 -0.96 -0.99 -0.97 -1.20 -0.59 23
Gold 0.12 0.04 0.00 0.04 -0.02 0.08 4
Baele, Bekaert, Inghelbrecht, Wei Flights-to-Safety
MotivationIdenti�cation Flight-to-Safety
AggregationComovementConclusions
OverviewApproachStress IndicatorsFinancial EnvironmentReal Economy
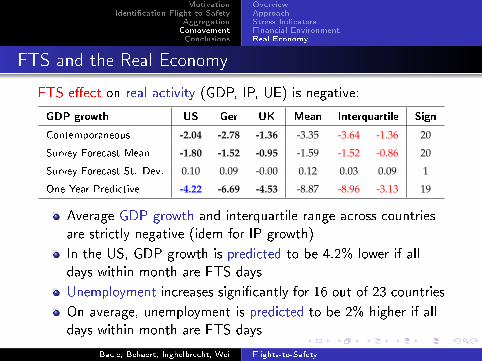
FTS and the Real Economy
FTS e�ect on real activity (GDP, IP, UE) is negative:
GDP growth US Ger UK Mean Interquartile Sign
Contemporaneous -2.04 -2.78 -1.36 -3.35 -3.64 -1.36 20
Survey Forecast Mean -1.80 -1.52 -0.95 -1.59 -1.52 -0.86 20
Survey Forecast St. Dev. 0.10 0.09 -0.00 0.12 0.03 0.09 1
One Year Predictive -4.22 -6.69 -4.53 -8.87 -8.96 -3.13 19
Average GDP growth and interquartile range across countriesare strictly negative (idem for IP growth)
In the US, GDP growth is predicted to be 4.2% lower if alldays within month are FTS days
Unemployment increases signi�cantly for 16 out of 23 countries
On average, unemployment is predicted to be 2% higher if alldays within month are FTS days
Baele, Bekaert, Inghelbrecht, Wei Flights-to-Safety
MotivationIdenti�cation Flight-to-Safety
AggregationComovementConclusions
OverviewApproachStress IndicatorsFinancial EnvironmentReal Economy
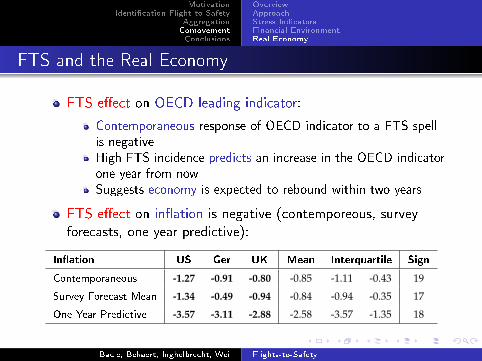
FTS and the Real Economy
FTS e�ect on OECD leading indicator:
Contemporaneous response of OECD indicator to a FTS spellis negativeHigh FTS incidence predicts an increase in the OECD indicatorone year from nowSuggests economy is expected to rebound within two years
FTS e�ect on in�ation is negative (contemporeous, surveyforecasts, one year predictive):
In�ation US Ger UK Mean Interquartile Sign
Contemporaneous -1.27 -0.91 -0.80 -0.85 -1.11 -0.43 19
Survey Forecast Mean -1.34 -0.49 -0.94 -0.84 -0.94 -0.35 17
One Year Predictive -3.57 -3.11 -2.88 -2.58 -3.57 -1.35 18
Baele, Bekaert, Inghelbrecht, Wei Flights-to-Safety

MotivationIdenti�cation Flight-to-Safety
AggregationComovementConclusions
SummaryFurther Research
Conclusions
We have identi�ed FTS in 23 countries using only data onequity and bond returns.
FTS characteristics: positive (negative) bond (stock) returns,negative stock-bond correlation and large stock volatility.
We show that:
FTS episodes comprise less than 5% of the sample and includemajor market crashes.FTS events are mostly country-speci�c and less than 30% canbe characterized as global.FTS episodes coincide with increases in the VIX, decreases insentiment and appreciations of yen and Swiss franc.Most �nancial returns (stocks, money market, corporatebonds, commodities) have a negative FTS beta.Both real activity and in�ation decrease immediately (and yearafter) following a FTS spell.
Baele, Bekaert, Inghelbrecht, Wei Flights-to-Safety
MotivationIdenti�cation Flight-to-Safety
AggregationComovementConclusions
SummaryFurther Research
Further Research
Relax independence assumption in aggregation method
Understand better the persistence in FTS identi�ed by theregime-switching models
Identi�cation of FTS: Alternative regime-switching model ondiagnostic measures (i.e. bond minus stock return, stock-bondreturn correlation, stock return volatility) directly
Additional �nancial and economic indicators: stock and bondilliquidity; term structure (level, slope, curvature); monetarypolicy stance
Is there anything predicting a FTS incidence?
...
Baele, Bekaert, Inghelbrecht, Wei Flights-to-Safety


![[Inghelbrecht, Desire-Emille] [Vaughan Williams] [GERSHWIN]](https://static.fdocuments.net/doc/165x107/61f6c4f3ffbad9610637d28e/inghelbrecht-desire-emille-vaughan-williams-gershwin.jpg)