images, and science data. documenting your flights, … · Safety glasses, Drone(s), Extra...
48
Plan, Fly, Review: Documenting Drone Data Get organized so you can learn something from every UAV flight. Learn best practices for documenting your flights, images, and science data.
Transcript of images, and science data. documenting your flights, … · Safety glasses, Drone(s), Extra...

Plan, Fly, Review: Documenting Drone Data
Get organized so you can learn something from every UAV flight. Learn best practices for documenting your flights, images, and science data.

To find the control panel, be sure you are in the GoToMeeting application (not your browser)
Type your messageSelect recipients
Click send
If you closed your control panel, click the orange arrow, or choose View > Control Panel
GoToMeeting Tips

The Earth Science Information Partners (ESIP) Federation: Our community spans the range from researchers and instrument builders, to data providers and stewards, to communicators and educators.
Our common interest: Promote the use and understanding of Earth Science data.

ESIP’s Education Committee includes curriculum developers, instructors, evaluators, and educators who focus on the use of Earth Science data for learning.

Two Webinars and a Workshop


Clarifying what we mean by recreational
drones
“Recreational drones”
❏ weigh less than a half pound
❏ do not need to be registered with the Federal Aviation
Administration (FAA)
❏ usually cost less than $100
❏ can be considered as “toys”
❏ can not range beyond controller’s sight

Everyone involved in
flying recreational
drones should visit
http://knowbeforeyoufly.org/

Sample Activity Idea:
What payload can my UAV carry?
Materials: Set of washers or bolts String Balance, or a food or postal scale
Small sensors that measure environmental conditions such as temperature, air pressure, and location are becoming widely available. Can your drone carry these into flight?
Design and conduct an experiment to find a practical limit on the payload mass your UAV can carry. Consider the Sample Data Table at right: expand as necessary to capture data from multiple trials. Use graphics, videos, or photographs to document your results.
Sample Data Table
UAV onlyUAV +
Payload #1UAV +
Payload #2
Mass
Ability to launch
(good, fair, poor, fail)
Ability to maneuver(good, fair, poor, fail)
Payload mass

How to use them to collect images or other data
How professionals are using them in various fields
In after-school clubs
In science classes / sessions

Please respond to our 3-question survey.
Click the live link in the Chat pane of GoToMeeting Control Panel, or type in this URL:
After you click Submit, click the See previous responses link to see all answers
http://goo.gl/forms/evBbHncYvi

Shelley Olds

Question:STEM science & engineering: Will flying quadcopters really benefit my students? How?
(Please share your thoughts in the chat window)

STEM science & engineering:
Will flying drones really benefit my students?
Some thoughts...
❏ Experience new perspectives and new challenges : Merges science, technology, and data science
❏ Build critical thinking skills by asking questions, brainstorming ideas, planning & carrying out investigations, analyzing & explaining the data
❏ Work in a team: each person has a role❏ Provide hands on experiences about science and
reproducibility of results - translates to abstract thinking❏ Fail safely and learn from every flight

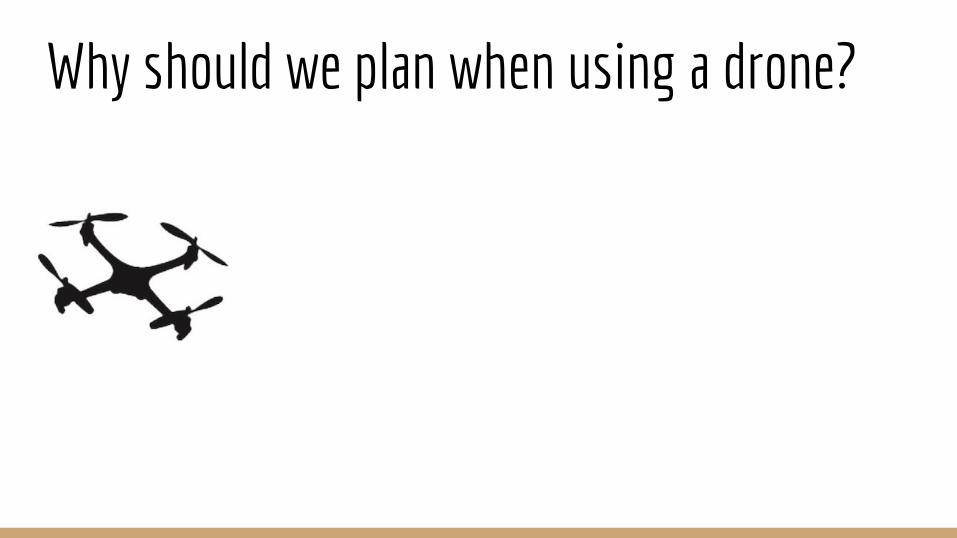
Why should we plan when using a drone?

Drone cameras can generate mountains of dataStatic images:
1 drone 5 minutes of flight 1 image per minute 20 flights
100 images
X

Video:
1 drone5 minutes of flight24 frames per second20 flights
2400 images
X
Drone cameras can generate mountains of data

Before going outside: Ask questions -> Make a planNGSS: Ask questions and define problems
Pick a question that you want to try answering with your drone.
NGSS: Developing and using modelsDraw a diagram illustrating your hypothesis.
NGSS: Planning and carrying out investigations.
What do you want to accomplish this flight session?
Where do you plan to fly?Know Before You Fly & B4UFly http://knowbeforeyoufly.org/
What equipment do you need? ● Safety glasses, ● Drone(s), ● Extra batteries, ● Repair kit, ● Hand-held camera, other sensors,● Science notebook / Log-book, etc.
Science Teams: pilot / spotter / data recorder

Question:When your students conduct a science / engineering investigation, research
project, what information do you always have them include?
(Please respond in the chat window)

Being a scientist is ... … being able to reproduce results
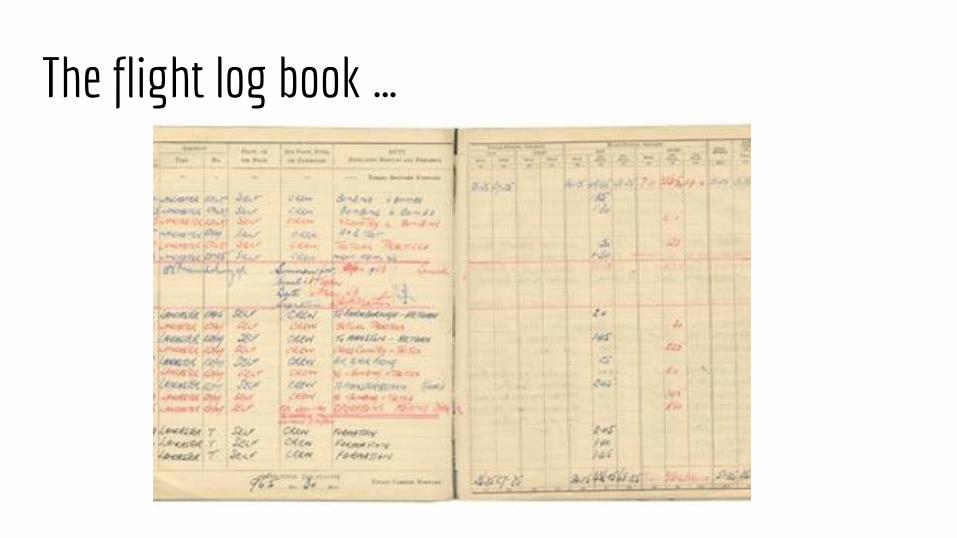
The flight log book …

Information to collect: Flight data sheetSession Number:
Date:
Instructor:
Location: Address/City/State , football field, south playground etc.)
Describe your site - Flat/slope? trees - shrubs
GPS location (optional): lat, long, elevation
Drone & transmitter information: Make / model / battery type & number
Weather conditions: Cloud Cover (%), Temperature, wind direction, speed, variability, sun direction, humidity (optional)
Potential dangers and plan for handling each.
Flight Number: Time of takeoff:
Names: Pilot / Spotter / Data recorder:
Goal for this flight:
Battery number /
Flight duration:
File names / Folder name of images/video taken from ground / in-flight.
Observations:How did flight end? (Crash/soft/etc)Flight path / altitude description:

Sample Activity Idea: [Drone-only experiment, testing physical properties]
What payload can my UAV carry?
Materials: Set of washers or bolts String Balance, or a food or postal scale
Small sensors that measure environmental conditions such as temperature, air pressure, and location are becoming widely available. Can your drone carry these into flight?
Design and conduct an experiment to find a practical limit on the payload mass your UAV can carry. Consider the Sample Data Table at right: expand as necessary to capture data from multiple trials. Use graphics, videos, or photographs to document your results.
Sample Data Table
UAV onlyUAV +
Payload #1UAV +
Payload #2
Mass
Ability to launch
(good, fair, poor, fail)
Ability to maneuver(good, fair, poor, fail)
Payload mass

Information to collect: Science data sheetInvestigation:
What payload can my drone carry?
Equipment list for this investigation: drone, battery, washers / small weights, string, scale
Info from flight data sheet +
Trial number: Payload _____
Payload Mass:
Ability to launch (quick, slow, struggle, fail):
Ability to maneuver (good, fair, poor, fail):
Initial measurements
Drone + battery Mass:
Ability to launch:
Maneuverability:
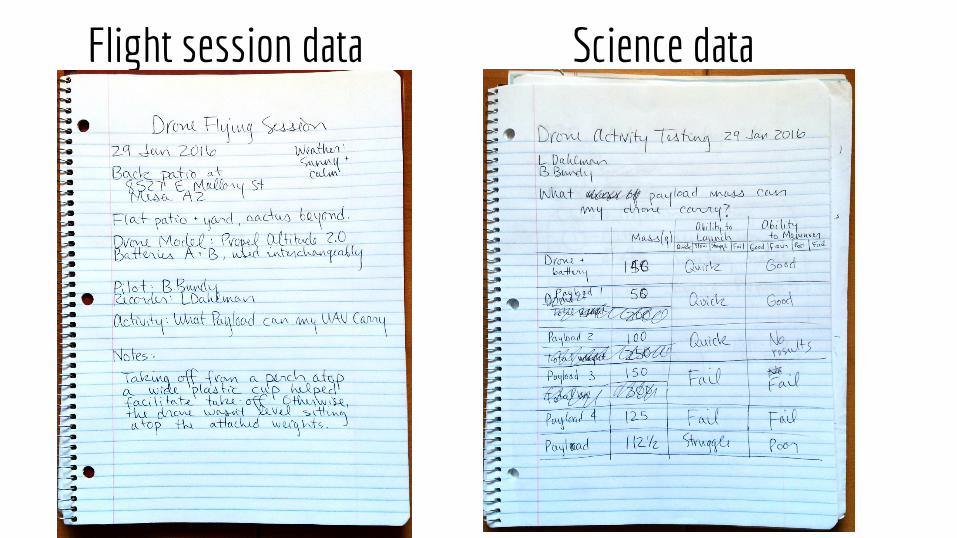
Flight session data Science data

The Science / Flight Team & RolesPilot Roles: Pre-flight
● Checks the drone ● Checks instruments/
sensors
In-flight● Flies the drone -
follows investigation instructions from Data Recorder
● Keeps drone in site & lands safely
Post-flight● Turns off drone, etc.
Data Recorder Roles: Pre-flight
● Calls out pre-flight checklist items
● Completes the Flight Datasheet
In-flight● Reads out investigation
instructions● Fills in data collected
during flightPost-flight
● Calls out post-flight checklist
Spotter/Safety Lead Roles: Pre-flight
● Describes weather data● Checks surroundings
for obstacles & hazards
In-flight● Keeps drone in site● Scans surroundings● (optional) Reads off
data to recorder
Post-flight● Retrieve the drone.

Pre-flight checklist: before every flight

Pre-flight checklist: before every flightData Recorder: Read this checklist aloud, asking for the confirm / data from Spotter & Pilot.
Spotter/Safety Lead: ❏ Weather conditions of flying area:
(Cloud Cover (%), Temperature, wind direction, speed, variability, humidity (optional))
❏ Hazards present? (yes/no/describe)❏ Takeoff/landing area established?
Science focused checklist: TBD by the investigation
Pilot:❏ Drone checks:
Spin your props - secured? Check for loose parts. Battery is charged & connected. (opt) Payload secured?
❏ Transmitter checks: Battery is charged, Joy-sticks work.
❏ Instrument checks: Camera: Connected to power? SD card inserted? Sufficient storage available?Other instruments?
❏ Other sensors & equipment: Power on? memory card inserted? Sensor working? Secured to drone? Meter-circle in place?

Before you fly
Safety - Step Back 5x5 for Safety❏ STOP
❏ Put your drone down.
❏ Take 5 steps back.❏ Look around for 5 seconds.
❏ Look behind you too!❏ IDENTIFY & ASSESS hazards,
MAKE CHANGES if needed , SAFELY – complete your flight
Instructor: Data scribe - see anything? Spotter- see anything? Pilot - See anything?
Stop to address anything you see.
Instructor: Team, start your flight!

What can you learn from Drone flying experiments? What patterns can you find in your data or metadata?
How long were you able to fly? How has this changed?
Have you crashed less often?
How have your landings changed?
What are you doing different now that has improved your flights?
What kinds of data were collected?
Sensor / Topical data:Environmental - Weather / ground coverMath - Scale w/ meter circle Physics - flight characteristicsEngineering - designing & modifying
Reflection - how could you have perform this experiment from the ground? How did a different perspectives add value?

QuestionThink about:
Which of the categories of activities we’ve suggested seem most useful for your teaching
environment?
Categories of investigationsI) Drone physical properties experiments & data from learning to fly
II) Photos & Videos
III) Fly with purchased sensors
IV) Build your own sensors to fly/ Modify your drone
V) Program the drone (beyond our scope)

Sample Activity Idea: [Drone-only experiment, testing physical properties]
What payload can my UAV carry?
Materials: Set of washers or bolts String Balance, or a food or postal scale
Small sensors that measure environmental conditions such as temperature, air pressure, and location are becoming widely available. Can your drone carry these into flight?
Design and conduct an experiment to find a practical limit on the payload mass your UAV can carry. Consider the Sample Data Table at right: expand as necessary to capture data from multiple trials. Use graphics, videos, or photographs to document your results.
Sample Data Table
UAV onlyUAV +
Payload #1UAV +
Payload #2
Mass
Ability to launch
(good, fair, poor, fail)
Ability to maneuver(good, fair, poor, fail)
Payload mass

Sample Activity Idea: (Taking photos / videos)
How can drone images enhance GLOBE’s land cover classification protocol ?
Materials: UAV with camera GLOBE’s Climate and Land Cover Project
Could using images from a drone help you classify more land, or do so with greater accuracy, than the current GLOBE protocol?
1. Select a study site and gather field measurements as directed by GLOBE’s Climate and Land Cover Project.
2. Modify the protocol for use with a drone, and then gather similar measurements.
3. Compare your efforts and results
Sample Comparison Chart
GLOBE protocol
Modified Protocol
Enacted procedures
Land area classified
Time and Resources required
Advantages
Disadvantages

Sample Activity Idea (Taking photos / videos)
How are UAV images the same as and different from Google Earth satellite images?Materials: Google Earth image of your location UAV with a camera
Take a close look at a satellite image of a place where you can fly your UAV. What can you see? What can’t you see?
Use your UAV to take images of the area you examined: compare and contrast what you see in the two images. Prepare a graphic showing the satellite view and a UAV view of the same place, and document the qualitative and quantitative differences between them. Use a chart, a Venn diagram, and/or a graph to explain differences and similarities in the two kinds of images.
Sample Comparison Chart
Google Earth Image
UAV Image
Extent of image (area covered)
Smallest visible feature
(spatial resolution)
Cost to capture image
Practical temporal resolution
Examples of effective uses for
each platform

Sample Activity Idea
Study an object from all sides: 3D images
Materials: UAV with camera
Building 3D images of an object from photos from a drone. How can this help you make better observations?
Identify an object to study (tree etc). Make a flight plan and gather photos. Display digital images from your drone, making 3D image from overlapping images
Resources: ● https://photosynth.net - make the 3d image● https://synthexport.codeplex.com/ - export tool
Data
Object 1 Object 2
Is everything visible?
Direction of image collection
(Panorama, Walk, Spin, Wall)
Planned collection path - sketch of photos
to take
Description of special photos of interest
Number of photos + filename sequence

Sample Activity Idea (Taking photos/ videos + analysis)
Quantifying the spatial density of saguaro cactus
Materials: UAV with camera 1-meter circle on ground (cloth or tarp) Image Analysis Software, for example: Digital Earth Watch (DEW) Identify multiple sites of similar extents. Make a flight plan and gather photos of the extent of each site. Display digital images from your drone, set a distance calibration, and measure distances in the images in real-world units.
Data
North-facing slope
South-facing slope
Flight

Sample Activity Idea: (Flying with purchased sensors)
Land cover and temperature
Materials: UAV with camera 1-meter circle on ground (cloth or fabric) Image Analysis Software, for example: Digital Earth Watch (DEW) Identify multiple sites of similar extents. Make a flight plan and gather photos of the extent of each site. Display digital images from your drone, set a distance calibration, and measure distances in the images in real-world units.
Data
North-facing slope
South-facing slope
Flight

QuestionWhich of the categories of activities we’ve
suggested seem most useful for your teaching environment?
(Please respond in the chat window)
Categories of investigationsI) Drone physical properties experiments & data from learning to fly
II) Photos & Videos
III) Fly with purchased sensors
IV) Build your own sensors to fly/ Modify your drone
V) Program the drone (beyond our scope)

We’ve paid attention to your feedback via the chat window. We also want to give you the opportunity to
provide anonymous feedback on this pair of Webinars:
Click the long link in the Chat window, or type in this URL:
http://goo.gl/forms/ctdLcWazEY
Webinar 1: UAVs for STEM
Webinar 2: Plan, Fly, Review

Webinar 1: UAVs 4 STEM: Using recreational drones for learning
Slides are available (no recording)
Webinar 2: Plan, Fly, Review: Documenting Drone DataSlides and recording will be available
Asd
Recordings and slides: https://goo.gl/sHQVc4
Are you interested in participating in
our workshopJuly 19
Durham, NC ?

Thank you for attending!

Sample Activity Idea
How are UAV images the same as and different from satellite images?Materials: Digital satellite image of your location UAV with a camera
Take a close look at a satellite image of a place where you can fly your UAV. What can you see? What can’t you see?
Use your UAV to take images of the area you examined: compare and contrast what you see in the two images. Prepare a graphic showing the satellite view and a UAV view of the same place, and document the qualitative and quantitative differences between them. Use a chart, a Venn diagram, and/or a graph to explain differences and similarities in the two kinds of images.
Sample Comparison Chart
Satellite Image UAV Image
Extent of image (area covered)
Smallest visible feature
(spatial resolution)
Cost to capture image
Practical temporal resolution
Examples of effective uses for
each platform

Investigations by complexity of resources neededCategories of investigations
I) Drone physical properties experiments & data from learning to fly
II) Photos & Videos
III) Fly with purchased sensors
IV) Build your own sensors to fly/ Modify your drone
V) Program the drone (beyond our scope)

Time to fly!Pilot:
1. Announce out loud – “CLEAR PROPS”.2. Make sure the throttle (left stick) is all the way down.3. Turn on the transmitter.4. Back away 3 or 4 steps (or to a safe distance).5. Bind & calibrate drone6. Take test photo and video7. Announce out loud – “TAKE OFF”.8. Launch drone9. Keep facing the quadcopter the entire time.
10. Maintain a safe altitude when flying over buildings / obstacles11. Keep a direct line of sight at all times when flying
Data scribe:
1. Call off take out list2. Start a stopwatch
(app)3. Take notes4. Keep an eye on the
drone tooSpotter:
5. Move around so you can always see the drone.
6. Continually scan the flight and ground areas for potential hazards.

Information to collect: example Science data sheetScience data for investigation: How are UAV images the same as and different from satellite images?
Equipment list for this investigation:
Info from flight data sheet + UAV/drone image 1:
File name:
Width of meter circle 1 (in pixels):
Height of meter circle 2 (in pixels):
Area covered by photo:
Smallest visible feature:
etc.
Google Earth / Satellite image:
Satellite type:
Date of image:
Location of image: (coordinates)
File name:
Spatial resolution:
Area covered by image:
Smallest visible feature:
etc.
![DVT - Multi FOV [12x9 - 5x5], [8x8 - 5x5] oder [5x5], OPG 2-in-1, … · DVT - Multi FOV [12x9 - 5x5], [8x8 - 5x5] oder [5x5], OPG 2-in-1, CEPH One-Shot oder Scan-Ceph optional, 3-in-1](https://static.fdocuments.net/doc/165x107/61024a32d7dc9526313ea8da/dvt-multi-fov-12x9-5x5-8x8-5x5-oder-5x5-opg-2-in-1-dvt-multi-fov.jpg)