Flight Modes in Migrating European Bee-Eaters: Heart Rate May
13
Flight Modes in Migrating European Bee-Eaters: Heart Rate May Indicate Low Metabolic Rate during Soaring and Gliding Nir Sapir 1 * ¤ , Martin Wikelski 2,5 , Marshall D. McCue 3 , Berry Pinshow 4 , Ran Nathan 1 1 Movement Ecology Laboratory, Department of Evolution, Systematics and Ecology, Alexander Silberman Institute of Life Sciences, The Hebrew University of Jerusalem, Jerusalem, Israel, 2 Max Planck Institute for Ornithology, Vogelwarte Radolfzell, Radolfzell, Germany, 3 Department of Biological Sciences, St. Mary’s University, San Antonio, Texas, United States of America, 4 Mitrani Department of Desert Ecology, Jacob Blaustein Institutes for Desert Research, Ben-Gurion University of the Negev, Midreshet Ben-Gurion, Israel, 5 Department of Biology, Konstanz University, Konstanz, Germany Abstract Background: Many avian species soar and glide over land. Evidence from large birds (m b .0.9 kg) suggests that soaring- gliding is considerably cheaper in terms of energy than flapping flight, and costs about two to three times the basal metabolic rate (BMR). Yet, soaring-gliding is considered unfavorable for small birds because migration speed in small birds during soaring-gliding is believed to be lower than that of flapping flight. Nevertheless, several small bird species routinely soar and glide. Methodology/Principal Findings: To estimate the energetic cost of soaring-gliding flight in small birds, we measured heart beat frequencies of free-ranging migrating European bee-eaters (Merops apiaster, m b ,55 g) using radio telemetry, and established the relationship between heart beat frequency and metabolic rate (by indirect calorimetry) in the laboratory. Heart beat frequency during sustained soaring-gliding was 2.2 to 2.5 times lower than during flapping flight, but similar to, and not significantly different from, that measured in resting birds. We estimated that soaring-gliding metabolic rate of European bee-eaters is about twice their basal metabolic rate (BMR), which is similar to the value estimated in the black- browed albatross Thalassarche (previously Diomedea) melanophrys, m b ,4 kg). We found that soaring-gliding migration speed is not significantly different from flapping migration speed. Conclusions/Significance: We found no evidence that soaring-gliding speed is slower than flapping flight in bee-eaters, contradicting earlier estimates that implied a migration speed penalty for using soaring-gliding rather than flapping flight. Moreover, we suggest that small birds soar and glide during migration, breeding, dispersal, and other stages in their annual cycle because it may entail a low energy cost of transport. We propose that the energy cost of soaring-gliding may be proportional to BMR regardless of bird size, as theoretically deduced by earlier studies. Citation: Sapir N, Wikelski M, McCue MD, Pinshow B, Nathan R (2010) Flight Modes in Migrating European Bee-Eaters: Heart Rate May Indicate Low Metabolic Rate during Soaring and Gliding. PLoS ONE 5(11): e13956. doi:10.1371/journal.pone.0013956 Editor: Lewis George Halsey, Roehampton University, United Kingdom Received April 13, 2010; Accepted October 19, 2010; Published November 11, 2010 Copyright: ß 2010 Sapir et al. This is an open-access article distributed under the terms of the Creative Commons Attribution License, which permits unrestricted use, distribution, and reproduction in any medium, provided the original author and source are credited. Funding: This study was supported by the U.S. - Israel Binational Science Foundation (grants 229/2002 and 124/2004), the Ring Foundation and the Robert Szold Fund. N.S. was supported by Rieger - JNF fellowships (in 2005–2007) and a Fulbright doctoral dissertation grant (in 2004). The funders had no role in study design, data collection and analysis, decision to publish, or preparation of the manuscript. Competing Interests: The authors have declared that no competing interests exist. * E-mail: [email protected] ¤ Current address: Department of Integrative Biology, University of California, Berkeley, California, United States of America Introduction Avian species of a wide size range, from the 25 g little swift (Apus affinis) to the 11 kg Andean condor (Vultur gryphus), soar over land on convective thermals, gaining altitude that allows horizontal progress by gliding, when seeking food, mates, and breeding sites and during long distance migratory journeys [1,2]. Based on scaling arguments of muscle power and wing dimensions, Pennycuick [3] suggested that, unlike flapping flight, soaring flight may increase with a scaling factor similar to that of basal metabolic rate (BMR). He also proposed that birds spend about 1.5 times their BMR during soaring and gliding because the energy cost of muscle tension to maintain wing posture during soaring or gliding is about half the BMR. Yet, measurements of rate of oxygen consumption ( _ V O 2 ) during flight in a wind-tunnel showed that for two 0.9 kg American herring gulls (Larus argentatus smithsonianus), metabolic rate (MR) during gliding averaged 1.9–2.4 times more than resting MR [4] and about three times their measured basal metabolic rate (BMR) [5,6]. In wandering albatross (Diomedea exulans), the energy cost of soaring flight, measured using doubly labeled water (DLW), was estimated to be 2.4 times BMR [7], while measurements of heart beat frequency ( f H ) [8] in black- browed albatrosses (Thalassarche (previously Diomedea) melanophrys) estimated it to be twice that at the BMR [9]. All these measurements were made in relatively large birds (m b .0.9 kg) that were not migrating. To the best of our knowledge, the energetic cost of soaring and gliding during migration in small birds has not been studied so far. PLoS ONE | www.plosone.org 1 November 2010 | Volume 5 | Issue 11 | e13956
Transcript of Flight Modes in Migrating European Bee-Eaters: Heart Rate May

Flight Modes in Migrating European Bee-Eaters: HeartRate May Indicate Low Metabolic Rate during Soaringand GlidingNir Sapir1*¤, Martin Wikelski2,5, Marshall D. McCue3, Berry Pinshow4, Ran Nathan1
1 Movement Ecology Laboratory, Department of Evolution, Systematics and Ecology, Alexander Silberman Institute of Life Sciences, The Hebrew University of Jerusalem,
Jerusalem, Israel, 2 Max Planck Institute for Ornithology, Vogelwarte Radolfzell, Radolfzell, Germany, 3 Department of Biological Sciences, St. Mary’s University, San
Antonio, Texas, United States of America, 4 Mitrani Department of Desert Ecology, Jacob Blaustein Institutes for Desert Research, Ben-Gurion University of the Negev,
Midreshet Ben-Gurion, Israel, 5 Department of Biology, Konstanz University, Konstanz, Germany
Abstract
Background: Many avian species soar and glide over land. Evidence from large birds (mb.0.9 kg) suggests that soaring-gliding is considerably cheaper in terms of energy than flapping flight, and costs about two to three times the basalmetabolic rate (BMR). Yet, soaring-gliding is considered unfavorable for small birds because migration speed in small birdsduring soaring-gliding is believed to be lower than that of flapping flight. Nevertheless, several small bird species routinelysoar and glide.
Methodology/Principal Findings: To estimate the energetic cost of soaring-gliding flight in small birds, we measured heartbeat frequencies of free-ranging migrating European bee-eaters (Merops apiaster, mb,55 g) using radio telemetry, andestablished the relationship between heart beat frequency and metabolic rate (by indirect calorimetry) in the laboratory.Heart beat frequency during sustained soaring-gliding was 2.2 to 2.5 times lower than during flapping flight, but similar to,and not significantly different from, that measured in resting birds. We estimated that soaring-gliding metabolic rate ofEuropean bee-eaters is about twice their basal metabolic rate (BMR), which is similar to the value estimated in the black-browed albatross Thalassarche (previously Diomedea) melanophrys, mb,4 kg). We found that soaring-gliding migrationspeed is not significantly different from flapping migration speed.
Conclusions/Significance: We found no evidence that soaring-gliding speed is slower than flapping flight in bee-eaters,contradicting earlier estimates that implied a migration speed penalty for using soaring-gliding rather than flapping flight.Moreover, we suggest that small birds soar and glide during migration, breeding, dispersal, and other stages in their annualcycle because it may entail a low energy cost of transport. We propose that the energy cost of soaring-gliding may beproportional to BMR regardless of bird size, as theoretically deduced by earlier studies.
Citation: Sapir N, Wikelski M, McCue MD, Pinshow B, Nathan R (2010) Flight Modes in Migrating European Bee-Eaters: Heart Rate May Indicate Low MetabolicRate during Soaring and Gliding. PLoS ONE 5(11): e13956. doi:10.1371/journal.pone.0013956
Editor: Lewis George Halsey, Roehampton University, United Kingdom
Received April 13, 2010; Accepted October 19, 2010; Published November 11, 2010
Copyright: � 2010 Sapir et al. This is an open-access article distributed under the terms of the Creative Commons Attribution License, which permitsunrestricted use, distribution, and reproduction in any medium, provided the original author and source are credited.
Funding: This study was supported by the U.S. - Israel Binational Science Foundation (grants 229/2002 and 124/2004), the Ring Foundation and the Robert SzoldFund. N.S. was supported by Rieger - JNF fellowships (in 2005–2007) and a Fulbright doctoral dissertation grant (in 2004). The funders had no role in study design,data collection and analysis, decision to publish, or preparation of the manuscript.
Competing Interests: The authors have declared that no competing interests exist.
* E-mail: [email protected]
¤ Current address: Department of Integrative Biology, University of California, Berkeley, California, United States of America
Introduction
Avian species of a wide size range, from the 25 g little swift (Apus
affinis) to the 11 kg Andean condor (Vultur gryphus), soar over land
on convective thermals, gaining altitude that allows horizontal
progress by gliding, when seeking food, mates, and breeding sites
and during long distance migratory journeys [1,2]. Based on
scaling arguments of muscle power and wing dimensions,
Pennycuick [3] suggested that, unlike flapping flight, soaring flight
may increase with a scaling factor similar to that of basal metabolic
rate (BMR). He also proposed that birds spend about 1.5 times
their BMR during soaring and gliding because the energy cost of
muscle tension to maintain wing posture during soaring or gliding
is about half the BMR. Yet, measurements of rate of oxygen
consumption ( _VVO2) during flight in a wind-tunnel showed that for
two 0.9 kg American herring gulls (Larus argentatus smithsonianus),
metabolic rate (MR) during gliding averaged 1.9–2.4 times more
than resting MR [4] and about three times their measured basal
metabolic rate (BMR) [5,6]. In wandering albatross (Diomedea
exulans), the energy cost of soaring flight, measured using doubly
labeled water (DLW), was estimated to be 2.4 times BMR [7],
while measurements of heart beat frequency ( fH) [8] in black-
browed albatrosses (Thalassarche (previously Diomedea) melanophrys)
estimated it to be twice that at the BMR [9]. All these
measurements were made in relatively large birds (mb.0.9 kg)
that were not migrating. To the best of our knowledge, the
energetic cost of soaring and gliding during migration in small
birds has not been studied so far.
PLoS ONE | www.plosone.org 1 November 2010 | Volume 5 | Issue 11 | e13956

Measurement of fH alone (e.g., [10,11,12]) cannot reveal the
metabolic demands of flight and other activities of free ranging
animals, since fH is only one component affecting the metabolic
rate of an animal [13]. Fick’s principle states that _VVO2 is equal to
the product of the fH, stroke volume (Vs, the amount of blood
pumped per heart beat), and arterio-venous difference in oxygen
content (CaO22C�vvO2) [14]:
_VVO2~fH|Vs(CaO2{C�vvO2) ð1Þ
Using fH to estimate variation in _VVO2 is contingent on the
assumption that the oxygen pulse (OP, i.e., the amount of oxygen
that is consumed by the animal during a single heart beat) defined
Figure 1. Sketch of European bee-eater flight modes. (A) Soaring-gliding flight employs updrafts created by the heating of the ground forgaining potential energy during soaring by circling over the rising air. During gliding the bird sinks in the air and progresses horizontally. (B) Flap-glide flight that is composed of sequences of short alternating flapping and gliding phases.doi:10.1371/journal.pone.0013956.g001
Figure 2. Received audio signals characterizing different flight modes of migratory European bee-eaters during flight. Each activity ischaracterized by a unique, identifiable signature of the audio power magnitude (decibels) in relation to the baseline power. (A) Flapping flight ischaracterized by two alternating phases; the first consists of a series of wing beats that are indicated by thick spikes, followed by a pause (greyshaded) of similar duration. (B) Soaring flight is characterized by sinusoidal signal strength due to null reception when the antenna of the tag is facing180u and 360u towards the receiving antenna while the birds rise in the air in circular path. Thick vertical lines separate between different circles.doi:10.1371/journal.pone.0013956.g002
Low Bird Soaring Energetics
PLoS ONE | www.plosone.org 2 November 2010 | Volume 5 | Issue 11 | e13956
as _VVO2|fH{1, is either constant, or changes in a systematic way
[8,13]. Measurement of fH can therefore serve as a useful estimate
for MR in birds only once the relationship between fH and energy
expenditure is established [13,15,16]. When this relationship is
known, the method may be at least as accurate as the DLW
technique [8,17], while avoiding some of its drawbacks, including
the need to recapture animals [13]. Moreover, unlike DLW
measurements, fH measurements may allow inferences on the
metabolic demands of activities that occur at a fine temporal scale,
for example, when a bird responds to changes in wind direction
during flight [18].
Although soaring-gliding is energetically cheaper than flapping,
for relatively small birds it may come at a potentially high cost in
terms of fitness, since the overall flight speed is slower [19] and
migration may thereby be prolonged [20]. Using Hedenstrom’s
[19] cost of transport model, for example, a 5 kg bird is
theoretically expected to migrate twice as fast when soaring and
gliding than when flapping. In contrast, Hedenstrom’s [19] model
predicts that soaring-gliding birds weighing 0.50 and 0.05 kg
migrate 1.5 and 3.5 times more slowly, respectively, than when
using flapping flight. Nevertheless, a number of small species, such
as swifts, swallows, and bee-eaters often soar and glide [e.g., 21],
including during migratory flight, suggesting that the assumptions
regarding their cost of transport need to be empirically
reevaluated.
To assess the variables of the cost of transport during soaring
and gliding in a small bird species, we established the relationship
between fH and _VVO2 under controlled laboratory conditions and
used radio telemetry to measure bird flight mode, flight speed and
fH in free-ranging European bee-eaters (Merops apiaster) during
migration, including during rest while staging, and during soaring-
gliding and flapping flight (Fig. 1). Theoretical calculations imply
that soaring-gliding MR scales with BMR [3] and based on
estimates from birds of mb.0.9 kg [3,4,7,9], we predicted that
soaring-gliding MR in bee-eaters is between 1.5 and 3 times their
BMR. The data we present bolster the little we know about
soaring-gliding MR in birds in general and are the first collected
from small migrating birds in the wild.
Methods
Field StudyBird trapping and transmitter attachment. Between
March and May, in 2005 and 2006, we trapped migrating
European bee-eaters at two sites, Eilat (29u349N 34u589E) and
Grofit (29u569N 34u049E), both located in the southern Arava
Figure 3. Heart beat frequency (fH ) of European bee-eaters in relation to time during activity at rest and during soaring-gliding. (A)fH in relation to time from last movement during stopover. (B) fH in relation to time from last wing beat during soaring and gliding.doi:10.1371/journal.pone.0013956.g003
Low Bird Soaring Energetics
PLoS ONE | www.plosone.org 3 November 2010 | Volume 5 | Issue 11 | e13956

Valley, Israel, on the major eastern Africa - Eurasia migration
flyway. The birds were captured with mist-nets near agricultural
fields, or in large Rybachy traps [22] at the International Birding
and Research Centre in Eilat. Trapped birds were ringed and
were individually marked with hair bleach (Blondor Light Powder,
Wella Corporation, Woodland Hills, California, USA) applied to
the tips of 2–3 of their flight feathers to enable identification in the
field [23]. Each bird was fitted with a 1 g transmitter (SP2000-HR,
Sparrow Systems, Fisher, Illinois, USA), following Cochran and
Wikelski [24]. Transmitters emitted in the 605 MHz band, and
the radio signal frequency was modulated by heart and flight
muscle electrical potentials [25,26], enabling the continuous
recording of fH and wing beat frequency. Due to the high
sensitivity of the receiver to changes in signal characteristics, we
were able to identify occasions when the birds moved their bodies
while perched, for example when preening or engaging in physical
interactions with conspecifics.
Bird activity and heart beat frequency acquisition and
analysis. We used two vehicle-mounted telemetry systems,
similar to those used in earlier studies [25–29], consisting of
AR8200 radio receivers (AOR Ltd., Tokyo, Japan) and custom-
made Yagi antennae. These were connected to laptop computers
running CoolEdit 2000H recording software (Syntrillium Software
Corp., Phoenix, Arizona, USA) through digital compressors
(aComp, Alto, Italy). During tracking, bird activity was
registered by the wing beat signal and the null-reception pattern
(see below), permitting us to distinguish between flapping and non-
flapping flight (figure 2A). Wing beat and the null reception
patterns during different activities were corroborated by occasional
visual observations of the individually identifiable tracked birds.
Bird movement was followed, and ground speed measured, with
the vehicle mounted telemetry system. Recordings from resting
birds were scanned and filtered, and we included for analysis only
measurements of fH in resting birds from which we detected no
motion for at least ten minutes (Fig. 3A). In many cases, periods of
prolonged rest might have included sleep, but since we have no
means to distinguish between resting per se and sleep, we treated
all the events during which birds were motionless as prolonged
rest.
Soaring was characterized by a unique, sinusoidal, decibel level
because of null reception when the position of the transmitter’s
antenna relative to the receiving antenna was at either 180u or
360u to it (figure 2B), a phenomenon observed in earlier telemetry
studies of soaring birds [29]. Soaring to gain altitude was typically
followed by gliding when the bird flew cross-country. Recordings
from soaring-gliding birds were scanned and filtered, and included
only measurements of fH beginning at least two minutes from the
bird’s last recorded wing beat (Fig. 3B). We used CoolEdit 2000Hsoftware to analyze audio files and applied fast Fourier transform
filters to increase the signal-to-noise ratio. We measured fH by
counting heart beat spikes on the computer screen, averaging five
successive inter-beat intervals (Fig. 4), and repeating this procedure
every 0.5 min for the whole audio file. When five consecutive
spikes could not be counted, for example during very short glides
between wing flaps, we counted fewer than five but no less than
three consecutive spikes. During flapping we could not distinguish
heart beats from wing beats, and therefore fH during flapping flight
was calculated from the first spikes that followed a series of wing
beats during glides. Due to the relatively high fH immediately after
flapping, sampling five heart beats directly after the last wing beat
Figure 4. An illustration of heart beat frequency ( fH) measurement of a European bee-eater using CoolEdit 2000H software. (A)Frequency analysis of the focal audio segment. (B) Application of fast Fourier transform filter according to the frequency analysis of the segment toincrease the signal-to-noise ratio. (C) Measuring the time interval of five consecutive heart beats on the computer screen from which fH in beatsmin21 was calculated.doi:10.1371/journal.pone.0013956.g004
Low Bird Soaring Energetics
PLoS ONE | www.plosone.org 4 November 2010 | Volume 5 | Issue 11 | e13956

in a wing beat series took an average of 0.6 s. We assumed that
sampling this way only slightly underestimates bird fH during
actual flapping flight because fH subsides only slightly during this
short interval.
Laboratory StudyBird trapping and experimental design. During May
2009 we trapped a total of twelve migrating European bee-eaters
at Grofit and transported them to the Jacob Blaustein Institutes for
Desert Research at Midreshet Ben-Gurion (30u529N, 34u479E).
The birds were housed in an aviary (46262.5 m) and were
provided with crickets, mealworms and water ad libitum. After a
habituation period of 24 hours, we equipped each with a radio
transmitter as described above, and examined the relationship
between their fH and MR using indirect calorimetry in metabolic
chambers. We monitored their fH while simultaneously measuring_VVO2 and carbon dioxide production ( _VVCO2). The mb of three
birds continuously decreased during the first 48 hours following
capture; they were released. Two additional birds were released
after their radio signals deteriorated and fH could not be measured.
The signals in three other individuals were viable for only one or
two sessions, and we did not include this data in the analysis.
Therefore, laboratory analysis included data from four individuals.
We usually measured one bird at a time in the gas exchange
system, but sometimes, we measured two birds simultaneously,
each in a separate chamber.
In order to elicit as wide a range of fHs as we could without
exercising the birds, the ambient temperature (Ta) of the metabolic
chambers was varied to include Tas of 10uC, 17.5uC, 25uC,
32.5uC, and 40uC. This range is similar to the natural range of air
temperatures (measured in Eilat during spring 2006 by the Israeli
Meteorological Service: 12 to 41uC, average 26.5uC), that these
birds experienced during their spring migration in the study area.
Measurements on each individual began at least 20 min after it
was placed in the metabolic chamber, after habituation to the
situation, as judged by the _VVO2 trace leveling off. In some of the
sessions, determined at random, we started the experiment when
the Ta in the chamber was 10uC and, after measuring _VVO2 at this
Ta for 10 min, we increased the temperature to 17.5uC, waited
20 min, assessed whether the _VVO2 trace had leveled off, measured_VVO2 again for 10 min, and then increased Ta in similar fashion
until measurements at all five Tas were made. In other sessions, we
started the experiment when the Ta in the chamber was 40uC and
used a decreasing Ta sequence. _VVO2 was measured during both
photophase and scotophase to encompass both resting and
sleeping states.
Figure 5. Distribution of heart beat frequency ( fH) of European bee-eaters during different activities and migration stages. (A)Soaring and flapping flights during stopover. (B) Rest during stopover. (C) Soaring and flapping during cross-country flight.doi:10.1371/journal.pone.0013956.g005
Low Bird Soaring Energetics
PLoS ONE | www.plosone.org 5 November 2010 | Volume 5 | Issue 11 | e13956
Quantifying the relationship between heart beat
frequency and metabolic rate. Air from outside the building
was pumped via a purge gas generator (PCDA-1-12-m-32-C, Pure
Gas, Broomfield, Colorado, USA) that removed CO2 and water
vapor to less than 1 ppm through metabolic chambers where birds
were placed. The volume of each metabolic chamber was 800 ml,
but was functionally reduced to about 750 ml by the bird’s
volume. The average flow rate was 600 ml min21, meaning that
the air in the chamber was turned over in about 75 seconds. Gases
were continuously measured using an infrared CO2 analyzer and
an O2 analyzer (models CD-3A and S-3A, respectively; AEI
Technologies, Naperville, IL, USA) coupled to a programmable
multiplexer (Sable Systems International, Las Vegas, NV, USA)._VVO2 and _VVCO2 were calculated as ml gas min21 using equations
2 and 3:
_VVO2~ _VVEFiO2{FeO2
1{FiO2
� �, ð2Þ
and
_VVCO2~ _VVE FiCO2{FeCO2ð Þ, ð3Þ
where _VVE is the mass flow of gas exiting the metabolic chamber in
ml min21, FiO2 and FiCO2 represent the fractional concentrations
of O2 and CO2 entering the metabolic chambers, and FeO2 and
FeCO2 represent the fractional concentrations of O2 and CO2
exiting the metabolic chambers [30]. The average (6 SD)
respiratory exchange ratio (RER~ _VVCO2= _VVO2) for bee-eaters
was 0.75 (60.20). We assumed that mean RER for fat is 0.71 and
for protein in birds is 0.74 [31], and converted _VVO2 (ml O2 min21)
to units of power (W), further assuming that the birds metabolized
a combination of 90% fat and 10% protein [32]. For each ml of
O2 consumed during protein catabolism, 18.70 J are released,
while for lipid, 19.8 J are released [31]. Therefore, we assumed
that the birds released 19.69 J for each ml of O2 consumed.
Hence, by converting _VVO2 (ml O2 min21) to power (watts = J s21),
we estimate that the uptake of 1 ml O2 s21 equals a power input of
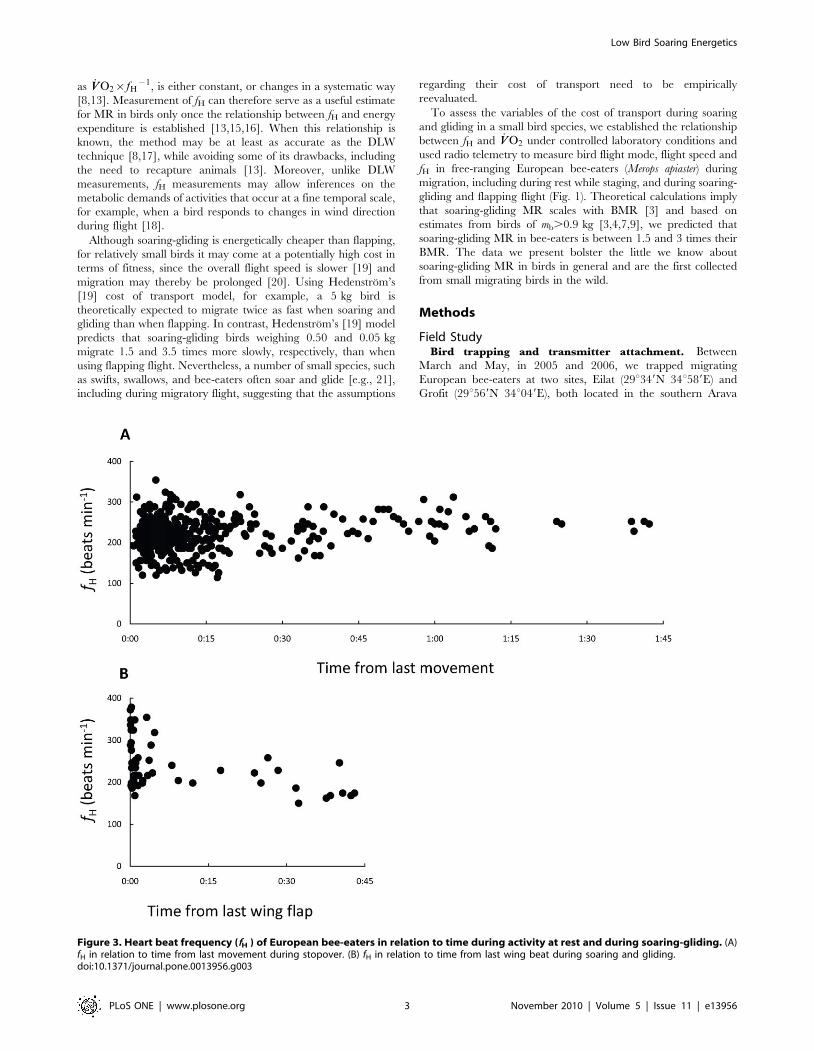
Figure 6. Heart beat frequency (fH) traces of two European bee-eaters engaged in different activities during stopover and cross-country flight. (A) fH of bird no. C48417 during stopover on May 5 2006 in relation to bird activity. A sample of this data can be heard in Audio S2.(B) fH of the same bird on the following day, 6 May 2006, during cross-country flight. A sample of this data can be heard in Audio S1. (C) fH of birdno. CC30955 on May 25 2006. The bird was followed during stopover in the early morning and then took off (dashed vertical line) for cross-countryflight in which it was followed for a distance of 90 km from the stopover site until its signal was lost. Time is GMT; add two hours for local time.doi:10.1371/journal.pone.0013956.g006
Low Bird Soaring Energetics
PLoS ONE | www.plosone.org 6 November 2010 | Volume 5 | Issue 11 | e13956
0.33 W. We used the minimum value of _VVO2 of each bird
measured during scotophase, considered the mean of these _VVO2
values as basal _VVO2, and used the RER as specified above to
estimate BMR. We examined the effects of Ta on _VVO2 and fH, but
since our measurements were made in a certain, limited, range of
Tas, no objective method (e.g., [33]) was applied to estimate the
thermal neutral zone of the birds.
Statistical AnalysisWe compared wing beat frequency during foraging flapping
flights and cross-country flapping flights by independent sample t-
test with unequal variances, following a Levene’s test for equality
of variance (p,0.001). We applied an independent sample t-test
with equal variances, following a Levene’s test for equality of
variance (p = 0.47) to compare bird ground speed during cross-
country soaring-gliding and flapping flight. We used the Wilcoxon
paired signed rank test using exact probability calculations [34] to
compare mean fH from the field between pairs of activities of each
individual. For example, we compared the average resting fH of
each individual measured during stopover with its own average fHmeasured during migratory cross-country soaring-gliding flight.
We used ANCOVA to test for the effect of the individual
(independent categorical random factor) and the period of the
experiment (photophase or scotophase, independent categorical
fixed factor) on the relationship between fH (independent factor)
and _VVO2 (dependent factor). Initially we considered all data from
the experiment; however because we had different numbers of
data points from each individual, we weighted the number of
observations so that each bird was equally represented [35,36].
Following this analysis, we did a major axis type-II regression to
establish the relationship between fH (independent factor) and_VVO2 (dependent factor) using a MatlabH code provided by Peltzer
[37]. Since resting and soaring fH during stopover, as well as
soaring-gliding fH during cross country flight, rarely exceeded 350
beats min21 (Fig. 5), we excluded from this analysis fH values
greater than 350 beats min21. We first ran the regression using all
data points from the experiment that met this criterion (i.e., ,350
beats min21) and then repeated the analysis using equal number of
data points from each individual, and we used a random number
generator (in MatlabH) to remove measurements from those birds
in which an excess were made. The latter analysis was done in
order to reduce potential bias due to the unequal contribution of
data from different individuals to the overall dataset because we
could not used weighted data in this particular statistical
procedure. We also applied major axis type-II regression to test
if OP (oxygen pulse; dependent factor) changes systematically with_VVO2 (independent factor), using linear and log models. To test the
effects of Ta on _VVO2 and fH we used one-way ANOVA followed
by Bonferroni post-hoc test, and ran separate analyses for
photophase and scotophase.
We calculated the standard error of the estimate (SEE) of _VVO2
for resting and soaring-gliding during stopover and for soaring-
gliding during cross-country migratory flight, based on the formula
of Green et al. [38]:
S:E:E:~
ffiffiffiffiffiffiffiffiffiffiffiffiffiffiffiffiffiffiffiffiffiffiffiffiffiffiffiffiffiffiffiffiffiffiffiffiffiffiffiffiffiffiffiffiffiffiffiffiffiffiffiffiffiffiffiffiffiffiffiffiffiffiffiffiffiffiffiffiffiffiffiffiffiffiffiffiffiffiffiffiffiffiffid2
1
n1z
1
n3
� �ze2
1
n2z
1
n4z
Xi{X� �2P
x2
" #vuut , ð4Þ
where d2 is the error associated with the variation between
individuals during the laboratory experiment, n1 is the number of
bee-eaters studied in the laboratory, n3 is the number of bee-eaters
whose fH was measured in the field, e2 is the error associated with
the scatter around the regression line, n2 is the number of data
points in the regression, n4 is the number of data points used for
calculating the average fH from the field, X is the average value of
fH used in the regression, Xi is the average value of fH from the
field from which s1 is to be estimated andP
x2 is the sum of all
the squared values of fH used in the regression. To estimate the
average and standard deviation of the power input associated with
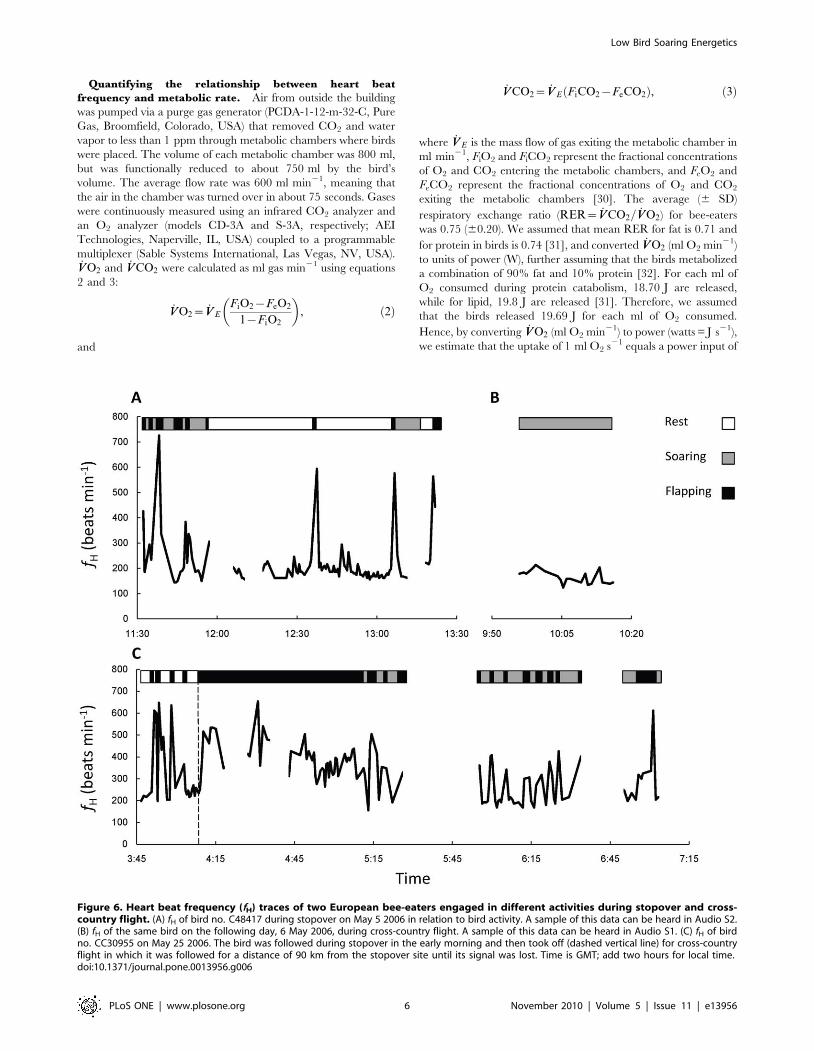
Figure 7. The distribution of wing beat frequency of European bee-eaters during stopover (foraging flights) and cross-countryflight (flap-glide flights).doi:10.1371/journal.pone.0013956.g007
Low Bird Soaring Energetics
PLoS ONE | www.plosone.org 7 November 2010 | Volume 5 | Issue 11 | e13956

Figure 8. (A) Heart beat frequency ( fH) of European bee-eaters measured in the field in relation to bird behavior, and (B)Laboratory f H{ _VVO2 relationship. In panel A the symbols represent mean 6 standard deviation fH of bee-eaters resting for prolonged durationand in different flight modes recorded during stopovers (filled circles) and migratory cross-country flights (open squares). Different letters above thebars indicate groups that differed statistically. N = number of birds whose fH was recorded during each activity. The photographs above the figuredepict each activity (photo credits: Daniele Occhiato). In panel B the trend line is illustrated following a major axis model II regression with N = 63; seeTable 2 for regression statistics. Dashed vertical line indicates the average soaring-gliding fH recorded in the field, and the dashed horizontal linedepicts the corresponding _VVO2 value.doi:10.1371/journal.pone.0013956.g008
Low Bird Soaring Energetics
PLoS ONE | www.plosone.org 8 November 2010 | Volume 5 | Issue 11 | e13956
estimated average _VVO2 from the field, we used RER as specified
above. All values are reported as means 61 standard deviation,
unless otherwise indicated.
Ethics StatementThe tips of several flight feathers of the tracked birds were
marked by making them sandy colored using human hair bleach
that was applied for 10 min [23]. After applying the lightener we
washed the remains from the feathers with water and left the
feathers to dry. The birds were anesthetized with a mixture of
Isoflurane and air during the attachment of the radio tags
following Cochran and Wikelski [24], and we minimized bird
handling time by releasing the birds as soon as possible after
completing the ringing and transmitter attachment procedures,
always within an hour of trapping. Tag mass was 2.05% of the mb
of the bird with the lowest mb (48.8 g), and 1.78% of the average
mb of all the birds (56.3 g). Birds were released in the field near
conspecifics, and we followed them after release by radio tracking
and with binoculars. We did not detect any abnormal behavior of
the birds during different activities such as foraging flights, rest, and
later on during migratory flights that we compared to untagged
conspecifics around them. For example, during migratory flights
tagged birds were found inside migrating flocks and did not show
signs of lingering; we could see no difference in their flight compared
to untagged birds. The same tags were applied to ,17 g spotted
antbirds (Hylophylax naevioides) whose mb is about one third that of the
bee-eaters, and no adverse effects of the tag were detected [39].
Raim [40] found that the same tags fell off the backs of 60 brown-
headed cowbirds (Molothrus ater) in 10–14 days, with an upper limit
of 24 days. Bird trapping permits were obtained from the Israel
Nature and Parks Authority (permits 2005/22055, 2006/25555)
and the experimental procedure was approved by the Animal Care
and Use Committee of the Hebrew University of Jerusalem (permits
NS–06–07–2 and NS–09–11652–4).
Results
During the spring seasons of 2005 and 2006, we followed 34
migrating bee-eaters in the southern Arava Valley, Israel. After the
birds stopped over in the area for one to nine days, we were able to
track 11 of them during cross-country migratory flights of up to
230 km. All the bee-eaters took off for migratory flight during the
day, and their fH was recorded using the two vehicle-mounted
telemetry systems until their signals were lost. Following field
observations, we distinguished between two modes of flight used by
the birds during cross-country flight: (1) flapping flight, character-
ized by a series of rapid wing beats lasting an average of
1.3961.84 s (N = 40 series from six individuals), separated by
1.2861.19 (N = 40 series from six individuals) second-long pauses
(Fig. 2A), and (2) sustained soaring-gliding flight (Fig. 2B and audio
S1), followed by gliding without flapping (9.5614.2 minutes from
last wing beat, range 2.0–43.0 minutes, N = 53 from six individuals).
Flapping flight in European bee-eaters thus consists of flap-glide
flights with a power fraction (the proportion of the cycle during
which the bird actively flaps) of 0.5 (see [41,42], and compare with
[43]). During foraging at a stopover, we again distinguished flapping
flight from soaring flight, when the birds circled and rose above the
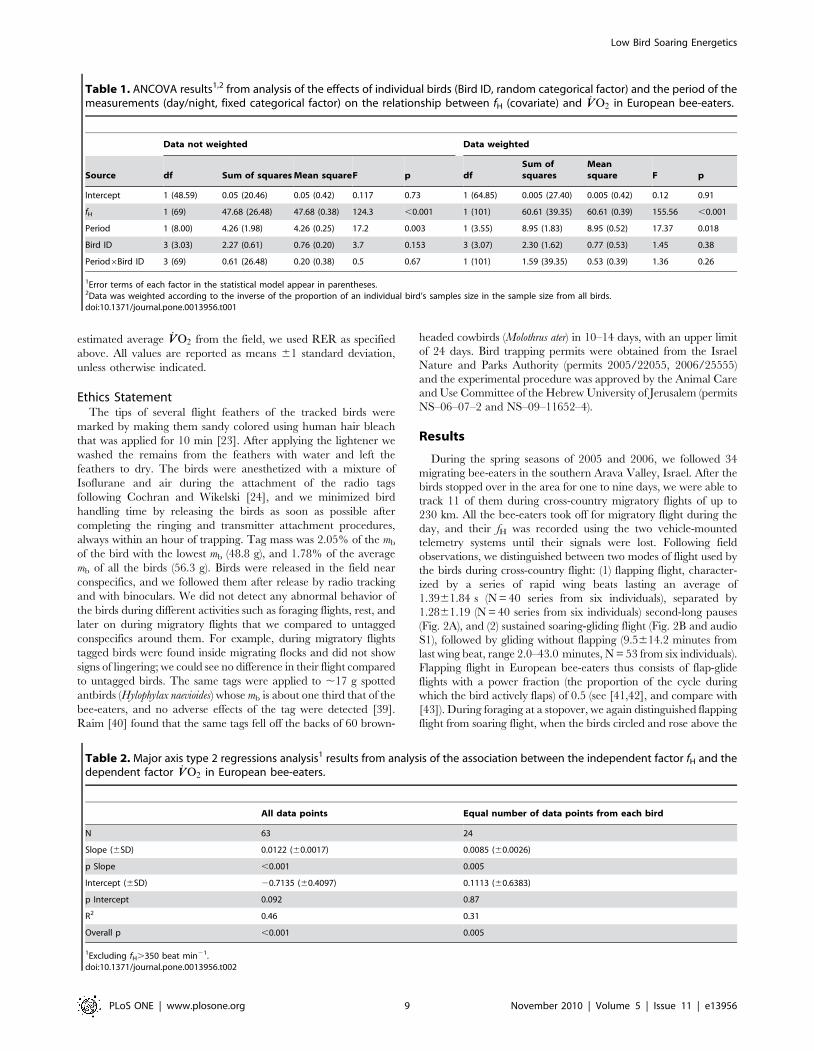
Table 1. ANCOVA results1,2 from analysis of the effects of individual birds (Bird ID, random categorical factor) and the period of themeasurements (day/night, fixed categorical factor) on the relationship between fH (covariate) and _VVO2 in European bee-eaters.
Data not weighted Data weighted
Source df Sum of squares Mean squareF p dfSum ofsquares
Meansquare F p
Intercept 1 (48.59) 0.05 (20.46) 0.05 (0.42) 0.117 0.73 1 (64.85) 0.005 (27.40) 0.005 (0.42) 0.12 0.91
fH 1 (69) 47.68 (26.48) 47.68 (0.38) 124.3 ,0.001 1 (101) 60.61 (39.35) 60.61 (0.39) 155.56 ,0.001
Period 1 (8.00) 4.26 (1.98) 4.26 (0.25) 17.2 0.003 1 (3.55) 8.95 (1.83) 8.95 (0.52) 17.37 0.018
Bird ID 3 (3.03) 2.27 (0.61) 0.76 (0.20) 3.7 0.153 3 (3.07) 2.30 (1.62) 0.77 (0.53) 1.45 0.38
Period6Bird ID 3 (69) 0.61 (26.48) 0.20 (0.38) 0.5 0.67 1 (101) 1.59 (39.35) 0.53 (0.39) 1.36 0.26
1Error terms of each factor in the statistical model appear in parentheses.2Data was weighted according to the inverse of the proportion of an individual bird’s samples size in the sample size from all birds.doi:10.1371/journal.pone.0013956.t001
Table 2. Major axis type 2 regressions analysis1 results from analysis of the association between the independent factor fH and thedependent factor _VVO2 in European bee-eaters.
All data points Equal number of data points from each bird
N 63 24
Slope (6SD) 0.0122 (60.0017) 0.0085 (60.0026)
p Slope ,0.001 0.005
Intercept (6SD) 20.7135 (60.4097) 0.1113 (60.6383)
p Intercept 0.092 0.87
R2 0.46 0.31
Overall p ,0.001 0.005
1Excluding fH.350 beat min21.doi:10.1371/journal.pone.0013956.t002
Low Bird Soaring Energetics
PLoS ONE | www.plosone.org 9 November 2010 | Volume 5 | Issue 11 | e13956
stopover sites without making any horizontal progress by gliding. In
addition, we defined prolonged motionless rest during stopovers
(33.5653.9 minutes from last body motion, range: 10.0–278.3 min-
utes, N = 385 from nine individuals; audio S2). In Figure 6 we
present raw traces of fH and corresponding activity from two birds
tracked during stopover and cross-country flight, and figure 5 shows
the distribution of fH during stopover for soaring flight, flapping
flight and rest, as well as during cross-country flight for soaring-
gliding and flapping flight.
Wing beat frequency during stopover feeding flights
(696.96180.6 min21, N = 112 from nine individuals) was signifi-
cantly lower (independent sample t-test, df = 54.5, t = 4.1, p,0.001)
than wing beat frequency during migratory cross-country flapping
flight (874.86247.6 min21, N = 40 from six individuals). The
distribution of wing beat frequency during stopover and cross-
country flight is presented in figure 7. Ground speed during flapping
flight, averaged for each individual, was 10.166.5 m s21 (N = 7
birds), and was 10.361.5 m s21 (N = 5) during soaring-gliding.
Generally, flapping flight took place into headwinds (2.86
4.9 m s21), while soaring-gliding took place under variable wind
conditions (0.3 m63.0 m s21; [44]). Mean bird air speed during
flapping flight was 12.965 m s21, not significantly different from
mean air speed during soaring-gliding (10.663.2 m s21; indepen-
dent sample t-test, df = 10, t = 0.92, p = 0.38).
Heart beat frequency of bee-eaters measured during cross-
country soaring-gliding flight or during stopover soaring flight was
statistically indistinguishable from fH measured during prolonged
(.10 minutes), motionless, rest (Wilcoxon paired signed rank test,
N = 6 birds, Z = 0.73, p = 0.46 and N = 6, Z = 0.11, p = 0.92, for
cross-country flights and stopovers, respectively). Average fHduring cross-country soaring-gliding flight was not different from
that measured during soaring-gliding flight while the birds were
stopping over (N = 4, Z = 0.4, p = 0.71). In addition, fH during
flapping foraging flight in stopover was statistically indistinguish-
able (N = 5, Z = 1.5, p = 0.14) from fH during cross country
flapping flight. Heart beat frequency during flapping flight was 2.2
to 2.5 times higher than that during soaring, gliding or resting.
These differences were statistically significant in all paired
comparisons; for example flapping vs. soaring-gliding flights
during stopover (N = 8, Z = 2.5, p = 0.012) and cross-country
flight (N = 6, Z = 2.2, p = 0.028). Figure 8A includes the average,
per bird, fH6SD.
We found that individual birds had no significant effect on the
relationship between fH and _VVO2 when tested using both un-
weighted and weighted data. The time in which the measurements
took place was a significant factor, with _VVO2 during scotophase
being significantly lower than _VVO2 during photophase. _VVO2
covaried significantly with fH (Table 1). The results of major axis
type-II regression applied to establish the relationship between fH(independent factor) and _VVO2 (dependent factor) were similar in
the two models that used either all data points or equal numbers of
data points from each bird (Table 2). Figure 8B shows the
relationship between fH and _VVO2 using all the data from the birds.
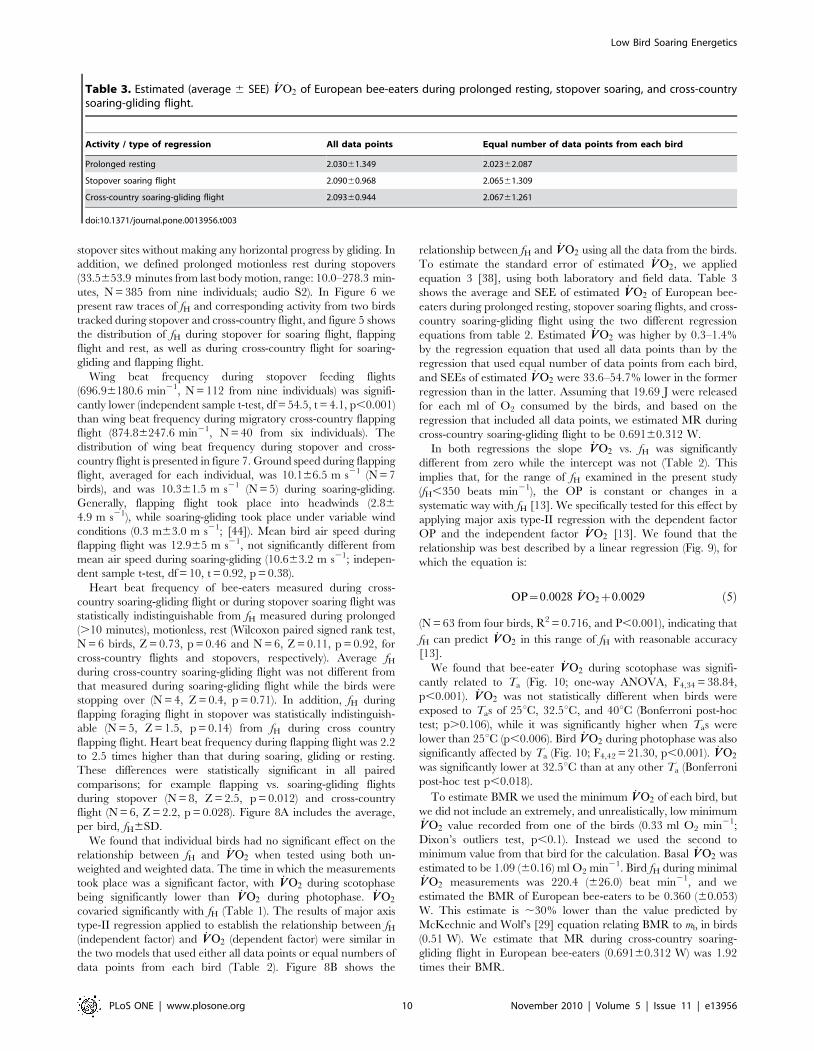
To estimate the standard error of estimated _VVO2, we applied
equation 3 [38], using both laboratory and field data. Table 3
shows the average and SEE of estimated _VVO2 of European bee-
eaters during prolonged resting, stopover soaring flights, and cross-
country soaring-gliding flight using the two different regression
equations from table 2. Estimated _VVO2 was higher by 0.3–1.4%
by the regression equation that used all data points than by the
regression that used equal number of data points from each bird,
and SEEs of estimated _VVO2 were 33.6–54.7% lower in the former
regression than in the latter. Assuming that 19.69 J were released
for each ml of O2 consumed by the birds, and based on the
regression that included all data points, we estimated MR during
cross-country soaring-gliding flight to be 0.69160.312 W.
In both regressions the slope _VVO2 vs. fH was significantly
different from zero while the intercept was not (Table 2). This
implies that, for the range of fH examined in the present study
(fH,350 beats min21), the OP is constant or changes in a
systematic way with fH [13]. We specifically tested for this effect by
applying major axis type-II regression with the dependent factor
OP and the independent factor _VVO2 [13]. We found that the
relationship was best described by a linear regression (Fig. 9), for
which the equation is:
OP~0:0028 _VVO2z0:0029 ð5Þ
(N = 63 from four birds, R2 = 0.716, and P,0.001), indicating that
fH can predict _VVO2 in this range of fH with reasonable accuracy
[13].
We found that bee-eater _VVO2 during scotophase was signifi-
cantly related to Ta (Fig. 10; one-way ANOVA, F4,34 = 38.84,
p,0.001). _VVO2 was not statistically different when birds were
exposed to Tas of 25uC, 32.5uC, and 40uC (Bonferroni post-hoc
test; p.0.106), while it was significantly higher when Tas were
lower than 25uC (p,0.006). Bird _VVO2 during photophase was also
significantly affected by Ta (Fig. 10; F4,42 = 21.30, p,0.001). _VVO2
was significantly lower at 32.5uC than at any other Ta (Bonferroni
post-hoc test p,0.018).
To estimate BMR we used the minimum _VVO2 of each bird, but
we did not include an extremely, and unrealistically, low minimum_VVO2 value recorded from one of the birds (0.33 ml O2 min21;
Dixon’s outliers test, p,0.1). Instead we used the second to
minimum value from that bird for the calculation. Basal _VVO2 was
estimated to be 1.09 (60.16) ml O2 min21. Bird fH during minimal_VVO2 measurements was 220.4 (626.0) beat min21, and we
estimated the BMR of European bee-eaters to be 0.360 (60.053)
W. This estimate is ,30% lower than the value predicted by
McKechnie and Wolf’s [29] equation relating BMR to mb in birds
(0.51 W). We estimate that MR during cross-country soaring-
gliding flight in European bee-eaters (0.69160.312 W) was 1.92
times their BMR.
Table 3. Estimated (average 6 SEE) _VVO2 of European bee-eaters during prolonged resting, stopover soaring, and cross-countrysoaring-gliding flight.
Activity / type of regression All data points Equal number of data points from each bird
Prolonged resting 2.03061.349 2.02362.087
Stopover soaring flight 2.09060.968 2.06561.309
Cross-country soaring-gliding flight 2.09360.944 2.06761.261
doi:10.1371/journal.pone.0013956.t003
Low Bird Soaring Energetics
PLoS ONE | www.plosone.org 10 November 2010 | Volume 5 | Issue 11 | e13956

Discussion
The fH in soaring-gliding European bee-eaters in relation to
resting fH is, to our knowledge, the lowest recorded thus far
among soaring-gliding birds and certainly the first in free-flying
small birds. Previous investigations of birds of 0.9 to 10 kg
[4,7,9,11,12] found that soaring or gliding fH was 1.3–2.0 times
resting fH. Our estimate for MR of migrating European bee-
eaters during cross-country soaring-gliding flight, stopover
soaring flight, and prolonged rest were about twice their BMR.
This estimate is similar to that reported by Bevan et al. [9] for
breeding black-browed albatrosses during dynamic soaring. With
the exception of the study of Bevan et al. [9], our estimated
soaring-gliding MR in relation to BMR, is 0.67 to 0.83 the value
found for other species. It is possible that different methodologies
are responsible for these differences. In the study of Baudinette
and Schmidt-Nielsen [4], it is possible that the conditions of the
wind tunnel, namely the small test section that was only slightly
Figure 10. Variation in _VVO2 and fH in relation to ambient temperature (Ta) and period of measurement. Different letters above _VVO2
data for photophase and below it for scotophase indicate significantly statistical difference (p,0.05) between groups.doi:10.1371/journal.pone.0013956.g010
Figure 9. The relationship between _VVO2 and oxygen pulse (OP) in European bee-eaters for fH values,350 beat min21.doi:10.1371/journal.pone.0013956.g009
Low Bird Soaring Energetics
PLoS ONE | www.plosone.org 11 November 2010 | Volume 5 | Issue 11 | e13956

wider than the birds’ wingspan, and the relatively turbulent flow
of air, resulted in elevated MR during gliding, and during the
measurements the birds often extend their feet to land (B.
Pinshow, personal observations). The estimation of soaring MR
reported by Adams et al. in wandering albatrosses [7] was based
on a combination of DLW measurements and bird time-activity
budgets. The latter were measured in different albatross
populations and may therefore not reflect the actual budgets of
the DLW studied birds (see details in [7]).
Measurement of fH can serve as a useful estimate for MR in
birds [9,15,16,17], but only once the relationship between fH and_VVO2 has been established [8,13,15,16]. Although OP changed
systematically with _VVO2 in resting bee-eaters in the laboratory
(Fig. 9), this relationship may not be general to all birds and during
different activities. Since instantaneous _VVO2 cannot be measured
in the field in free ranging birds, or other animals, to estimate field
MR from fH, one must assume that the fH - _VVO2 relationship
established in the laboratory holds true for birds in the wild. This
may well be the case in soaring-gliding flight when the birds do not
flap their wings, or in other organisms that use power to statically
support a weight against gravity. In the study of Bevan et al. [8,9],
the fH{ _VVO2 relationship was based on measurements from birds
that did not support weight in flight, but rather walked on a
treadmill and thus were exercising their leg muscles. Maas et al.
[46] reported that fH and _VVO2 were correlated, and that _VVO2 was
only slightly higher in humans supporting a static load, with
forearms horizontal while holding water-containing Jerrycans
weighing 4–10 kg for 10 minutes, than when at rest. When static
load support was combined with walking on a treadmill, the
fH{ _VVO2 relationship increased dramatically, probably because
OP changed between these two activities (see also [15]). The _VVO2
estimates obtained using measurements of treadmill walking or
exposure to variable Ta must therefore be re-evaluated in the
future using other methodologies that are not burdened by the
assumption regarding the fH{ _VVO2 laboratory relationship. This
may be achieved, for example, using modern, tiltable, wind
tunnels (e.g., [47]) where birds can glide continuously [48].
Our finding that bee-eaters may have low soaring-gliding MR,
and that soaring-gliding cross-country flight does not incur a
penalty of slower progress on the journey provides a plausible
explanation for why several species of small birds soar and glide
during migration. Consequently, we suggest that assumptions
regarding the cost of transport in birds using different flight modes
(e.g., [19]) should be re-evaluated. Low cost of transport may
imply low energetic demands of major activities in their life cycle,
associated not only with long-distance migration, but also with
foraging, for example, during which birds were frequently seen
gliding (usually just after prey capture, N. Sapir personal observations).
Sustained soaring-gliding flight can only be used under
particular meteorological conditions [3], and its use may be
limited by headwinds along migratory flyways [19]. Hedenstrom
[19] proposed that small, soaring-gliding, migratory species are
particularly sensitive to headwinds due to their low flight speed.
Since soaring-gliding was used under variable wind conditions,
including headwinds, this factor is probably of minor importance.
An additional factor, atmospheric convection, was found to limit
soaring-gliding in bee-eaters [44]. Therefore, unlike flapping flight,
soaring-gliding flight in bee-eaters, and probably in other avian
species, might be largely constrained in time and space by
occurrence of the necessary meteorological conditions.
We conclude that the combination of low MR and relatively
high speed of progression during soaring-gliding in migrating
European bee-eaters may explain the propensity of small bird
species to soar and glide because the cost of transport is lower than
that of flapping, although this mode of flight is limited to when
conditions are appropriate. Our findings and those of Bevan et al.
[9] also call for reconsideration of the energy cost of soaring-
gliding in birds that is commonly assumed to be 3–4 times BMR
(for example in [19]). Finally, our data support Pennycuick’s [3]
theoretical conclusion that soaring-gliding MR scales with mb with
a similar scaling factor to that of BMR.
Supporting Information
Audio S1 Soaring flight heart beat recording. The file contains
24s of heart beat recording of bird C48417 during sustained
soaring within a migratory cross-country flight over southern Israel
on 6 May 2006. Heart beat frequency varies within this section
between 161.0 to 196.7 beats per minute. Bird circling rate during
soaring is 9.6s per circle (completed 2.5 circles in 24s).
Found at: doi:10.1371/journal.pone.0013956.s001 (1.15 MB
WAV)
Audio S2 Prolonged rest heart beat recording. The file contains
24s of heart beat recording of bird C48417 during prolonged rest
while stopping-over in southern Israel on 5 May 2006. Heart beat
frequency varies within this section between 170.0 to 180.3 beats
per minute.
Found at: doi:10.1371/journal.pone.0013956.s002 (1.15 MB
WAV)
Acknowledgments
We are grateful to William W. Cochran for his help and inspiration during
the design, execution, and data analysis of the study, Melissa Bowlin for her
help with the heart beat frequency analysis and Uzi Motro for statistical
advice. We would like to thank Reuven Yosef, Noam Weiss and Tzadok
Tzemah for help with bird trapping, Miri Ben-Hamo for help during
laboratory experiments, Judy Shamoun-Baranes and Adena Brickman for
improving earlier versions of the text, Arnon Tsairi, Hemdat Banai, Ofir
Altstein, David Troupin and Yoav Bartan for technical assistance, and
tracking team members and members of the Movement Ecology
Laboratory for help in the field and in the laboratory. This is paper
number 707 of the Mitrani Department of Desert Ecology.
Author Contributions
Conceived and designed the experiments: NS MW MDM BP RN.
Performed the experiments: NS MDM. Analyzed the data: NS MDM.
Contributed reagents/materials/analysis tools: MW BP RN. Wrote the
paper: NS MW MDM BP RN.
References
1. del Hoyo J, Elliott A, Sargatal J (1994) The birds of the world, volume 2.
Barcelona, Spain: Lynx Edicions. 638 p.2. del Hoyo J, Elliott A, Sargatal J (1999) The birds of the world, volume 5.
Barcelona, Spain: Lynx Edicions. 759 p.
3. Pennycuick CJ (1972) Soaring behaviour and performance of some East Africanbirds observed from a motorglider. Ibis 114: 178–218.
4. Baudinette RV, Schmidt-Nielsen K (1974) Energy cost of gliding flight inherring gulls. Nature 248: 83–84.
5. Lustick S, Battersby B, Kelty M (1978) Behavioral thermo-regulation:
Orientation towards the sun in herring gulls. Science 200: 81–83.
6. Ellis HI (1984) Energetics of free-ranging seabirds. In: Whittow GC, Rahn H,
eds. Seabird energetics. New York, U S A: Plenum Press. pp 203–234.7. Adams NJ, Brown CR, Nagy KA (1986) Energy expenditure of free-ranging
wandering albatrosses Diomedea exulans. Physiol Zool 59: 583–591.
8. Bevan RM, Woakes AJ, Butler PJ, Boyd IL (1994) The use of heart-rate toestimate oxygen-consumption of free-ranging black-browed albatrosses Diomedea
melanophrys. J Exp Biol 193: 119–137.9. Bevan RM, Butler PJ, Woakes AJ, Prince PA (1995) The energy expenditure
of free-ranging black-browed albatrosses. Phil Trans R Soc B 350: 119–
131.
Low Bird Soaring Energetics
PLoS ONE | www.plosone.org 12 November 2010 | Volume 5 | Issue 11 | e13956

10. Gessaman JA, Folk GE, Brewer MC (1965) Telemetry of heart rate from 8 avian
species. Amer Zool 5: 696–697.11. Kanwisher JW, Williams TC, Teal JM, Lawson KO (1978) Radiotelemetry of
heart-rates from free-ranging gulls. Auk 95: 288–293.
12. Weimerskirch H, Martin J, Clerquin Y, Alexandre P, Jiraskova S (2001) Energysaving in flight formation - pelicans flying in a ‘V’ can glide for extended periods
using the other birds’ air streams. Nature 413: 697–698.13. Butler P, Green JA, Boyd IL, Speakman JR (2004) Measuring metabolic rate in
the field: The pros and cons of the doubly labelled water and heart rate methods.
Func Ecol 18: 168–183.14. Fick A (1870) Ueber die messung des blutquantums in der herzenventrikeln.
Sitzungsb. der. Phys. Med. Gesellsch. zu. Wurzburg 16 1870.15. Ward S, Bishop CM, Woakes AJ, Butler PJ (2002) Heart rate and the rate of
oxygen consumption of flying and walking barnacle geese (Branta leucopsis) andbar-headed geese (Anser indicus). J Exp Biol 205: 3347–3356.
16. Green JA, Frappell PB, Clark TD, Butler PJ (2008) Predicting rate of oxygen
consumption from heart rate while little penguins work, rest and play. CompBiochem Physiol A 150: 222–230.
17. Nolet BA, Butler PJ, Masman D, Woakes AJ (1992) Estimation of daily energy-expenditure from heart-rate and doubly labeled water in exercising geese.
Physiol Zool 65: 1188–1216.
18. Weimerskirch H, Guionnet T, Martin J, Shaffer SA, Costa DP (2000) Fast andfuel efficient? Optimal use of wind by flying albatrosses. Proc R Soc B 267:
1869–1874.19. Hedenstrom A (1993) Migration by soaring or flapping flight in birds: The
relative importance of energy cost and speed. Phil Trans R Soc B 342: 353–361.20. Alerstam T, Lindstrom A (1990) Optimal bird migration: The relative
importance of time, energy, and safety. In: Gwinner E, ed. Bird migration:
the physiology and ecophysiology. Berlin, Germany: Springer. pp 331–351.21. Fry CH (1984) The bee-eaters. Calton, England: T & A.D Poyser Ltd.
22. Erik WW (1967) A large trap for mass bird trapping. In: Potapov RL,Vykhovski BE, eds. Migratsii ptits Pribaltik (Cisbaltic bird migration). Leningrad:
‘‘Nauka’’ Publishing House.
23. White SB, Bookhout TA, Bollinger EK (1980) Use of human-hair bleach tomark blackbirds and starlings. J Field Ornithol 51: 6–9.
24. Cochran WW, Wikelski M (2005) Individual migratory tactics of New WorldCatharus thrushes: Current knowledge and future tracking options from space. In:
Marra P, Greenberg R, eds. Birds of two worlds. Washington DC, U S A:Smithsonian Press. pp 274–289.
25. Lord RD, Bellrose FC, Cochran WW (1962) Radio telemetry of the respiration
of a flying duck. Science 137: 39–40.26. Bowlin MS, Wikelski M (2008) Pointed wings, low wingloading and calm air
reduce migratory flight costs in songbirds. PLoS ONE 3: e2154.27. Cochran WW (1972) Long-distance tracking of birds. In: Galler SR, Schmidt-
Koenig K, Jacobs GJ, Belleville RE, eds. Animal orientation and navigation.
Washington DC, U S A: NASA. pp 39–59.28. Cochran WW, Mouristen H, Wikelski M (2004) Migrating songbirds recalibrate
their magnetic compass daily from twilight cues. Science 304: 405–408.
29. Cochran WW (1975) Following a migrating peregrine from Wisconsin to
Mexico. Hawk Chalk 14: 28–37.30. Withers PC (1977) Measurement of VO2, VCO2, and evaporative water loss with
a flow-through mask. J Appl Physiol 42: 120–123.
31. Walsberg GE, Wolf BO (1995) Variation in the respiratory quotient of birds andimplications for indirect calorimetry using measurements of carbon dioxide
production. J Exp Biol 198: 213–219.32. Jenni-Eiermann S, Jenni L, Kvist A, Lindstrom A, Piersma T, et al. (2002) Fuel
use and metabolic response to endurance exercise: a wind tunnel study of a long-
distance migrant shorebird. J Exp Biol 205: 2453–2460.33. Pinshow B, Fedak MA, Battles DR, Schmidt-Nielsen K (1976) Energy-
expenditure for thermoregulation and locomotion in emperor penguins.Am J Physiol 231: 903–912.
34. Siegel S, Castellan JNJ (1988) Nonparametric statistics for the behavioralsciences, 2nd edn. , Singapore: McGrew-Hill Book company.
35. Kish L (1992) Weighting for unequal Pi. J Official Stat 8: 183–200.
36. Korn EL, Graubard BI (1995) Examples of differing weighted and unweightedestimates from a sample survey. Am Stat 49: 291–295.
37. Peltzer ED (2009) lsqfitma code. URL: http://www.mbari.org/staff/etp3/regress/index.htm. Accessed on 10 July 2009.
38. Green JA, Butler PJ, Woakes AJ, Boyd IL, Holder RL (2001) Heart rate and rate
of oxygen consumption of exercising macaroni penguins. J Exp Biol 204:673–684.
39. Steiger SS, Kelley JP, Cochran WW, Wikelski M (2009) Low metabolism andinactive lifestyle of a tropical rain forest bird investigated via heart-rate
telemetry. Physiol Biochem Zool 82: 580–589.40. Raim A (1978) A radio transmitter attachment for small passerine birds. Bird
Banding 49: 326–332.
41. Rayner JMV, Viscardi PW, Ward S, Speakman JR (2001) Aerodynamics andenergetics of intermittent flight in birds. Am Zool 41: 188–204.
42. Pennycuick JC (2008) Modelling the flying bird. Amsterdam & London: ElsevierAcademic Press.
43. Ropert-Coudert Y, Wilson RP, Gremillet D, Kato A, Lewis S, Ryan PG (2006)
Electrocardiogram recordings in free-ranging gannets reveal minimum differ-ence in heart rate during flapping versus gliding flight. Mar Ecol Prog Ser 328:
275–284.44. Sapir N (2010) The effects of weather on bee-eater (Merops apiaster) migration.
Ph.D. thesis. Jerusalem, Israel: The Hebrew University of Jerusalem.45. McKechnie AE, Wolf BO (2004) The allometry of avian basal metabolic rate:
good predictions need good data. Physiol Biochem Zool 77: 502–521.
46. Maas S, Kok MLJ, Westra HG, Kemper HCG (1989) The validity of the use ofheart-rate in estimating oxygen-consumption in static and in combined static
dynamic exercise. Ergonomics 32: 141–148.47. Pennycuick CJ, Alerstam T, Hedenstrom A (1997) A new low-turbulence wind
tunnel for bird flight experiments at Lund University, Sweden. J Exp Biol 200:
1441–1449.48. Rosen M, Hedenstrom A (2001) Gliding flight in a jackdaw: a wind tunnel study.
J Exp Biol 204: 1153–1166.
Low Bird Soaring Energetics
PLoS ONE | www.plosone.org 13 November 2010 | Volume 5 | Issue 11 | e13956