Fixing failing schools: How states and localities ...
57
W&M ScholarWorks W&M ScholarWorks Undergraduate Honors Theses Theses, Dissertations, & Master Projects 5-2014 Fixing failing schools: How states and localities implement Fixing failing schools: How states and localities implement federal reforms federal reforms Keenan Kelley College of William and Mary Follow this and additional works at: https://scholarworks.wm.edu/honorstheses Part of the American Politics Commons, and the Education Policy Commons Recommended Citation Recommended Citation Kelley, Keenan, "Fixing failing schools: How states and localities implement federal reforms" (2014). Undergraduate Honors Theses. Paper 80. https://scholarworks.wm.edu/honorstheses/80 This Honors Thesis is brought to you for free and open access by the Theses, Dissertations, & Master Projects at W&M ScholarWorks. It has been accepted for inclusion in Undergraduate Honors Theses by an authorized administrator of W&M ScholarWorks. For more information, please contact [email protected].
Transcript of Fixing failing schools: How states and localities ...

W&M ScholarWorks W&M ScholarWorks
Undergraduate Honors Theses Theses, Dissertations, & Master Projects
5-2014
Fixing failing schools: How states and localities implement Fixing failing schools: How states and localities implement
federal reforms federal reforms
Keenan Kelley College of William and Mary
Follow this and additional works at: https://scholarworks.wm.edu/honorstheses
Part of the American Politics Commons, and the Education Policy Commons
Recommended Citation Recommended Citation Kelley, Keenan, "Fixing failing schools: How states and localities implement federal reforms" (2014). Undergraduate Honors Theses. Paper 80. https://scholarworks.wm.edu/honorstheses/80
This Honors Thesis is brought to you for free and open access by the Theses, Dissertations, & Master Projects at W&M ScholarWorks. It has been accepted for inclusion in Undergraduate Honors Theses by an authorized administrator of W&M ScholarWorks. For more information, please contact [email protected].

Acknowledgements
I have to first thank my advisor, Dr. Paul Manna, for his generous and dedicated guidance
throughout this year and a half process. I constantly strive to live up to his academic standards of
excellence, and any success in this project is due to his careful direction. I am also very thankful
for the comments and early guidance of my peers in Dr. Manna’s senior seminar. I would also
like to thank Dr. Jaime Settle and Dr. Peter McHenry for serving on my thesis committee and for
providing helpful and insightful suggestions. Special thanks to Dr. Susan Moffitt and Dr. Ken
Meier for their thoughtful comments at the Midwest Political Science Association conference.
Additionally, a sincere thanks to all of the generous donors from the William and Mary Honors
Fellowship. This project would not have been possible without their support.
Thank you to my many friends who provided tremendous feedback in all stages of this
project. For their brain power in service to this project, thank you to Lizzy Pelletier, Meg
Schwenzfeier, Molly Michie, Rob Marty, Ashley Napier, Taylor Feenstra, Rachel Lienesch,
Rachel Brooks, and Drew Engelhart. Also much thanks and love to my other wonderful friends
(in addition to the aforementioned people) who were always available for much needed pep-
talks. Thank you Chris Huebner, Laura Godwin, Lauren Weiss, Dan Casey, Erik Michel, Connor
Tribble, Medha Satyal, Annie Goho, Allie Baer, and countless others who in no small part made
this possible! Most importantly, thank you to Mom, Dad, Sally and Ruth for always being the
most supportive and loving family. This project would not be possible without any of the people
mentioned above.

2
Abstract
Under the Adequate Yearly Progress (AYP) provision of the No Child Left Behind Act of 2001
(NCLB), schools that consistently failed to reach state-designed levels of proficiency were
required to implement at least one reform from a slate of federally prescribed options. Although
much work in the education and political science community has investigated the federal and
state impact of NCLB, little work has been done on local governance. This paper will be the first
to look for a relationship between state-level factors and local NCLB implementation. It
addresses the following question: Are there state-level factors that influence the types of reforms
implemented in struggling schools? This study provides insight into how state dynamics
influence education reform. First, my evidence provides support to my hypothesis that interest
groups matter in the implementation of local reform. Second, I find little support for the impact
of bureaucratic capacity on local reform.

3
Introduction
“This is life and death.”1 Perhaps a bit dramatic, but like his peers over the past ten years,
Superintendent John Deasy has lived and died by the implications of the No Child Left Behind
Act (NCLB). When passed in 2001, NCLB transformed the governance structure of an already
complex federal education system (Manna 2011; Timar 1997). At the heart of the law was a
system of accountability standards for the nation’s schools, which would be designed,
implemented, and monitored by the states (Manna 2004; 2011). For those schools that
consistently failed to meet state standards, local leaders with help from the state would have to
choose from a set of federal reforms to “fix” them (Manna 2011; U.S. Department of Education
2006; hereafter USDOE).
Significant scholarly work has been done about NCLB’s impact as a federal initiative and
its impact on student achievement (Center on Education Policy 2007; 2009; Dee and Jacob 2011;
Hanushek and Raymond 2004; Manna 2011). This paper addresses a different question relating
to governance: Are there state-level factors that influence the types of reforms implemented in
struggling schools?
Understanding the mechanisms public officials utilize to make decisions is essential to a
transparent and democratic society. In a country that overwhelmingly supports a decentralized
mechanism of education governance (Jacobsen and Saultz 2012; Timar 1997), discerning state
and local dynamics is essential. Despite these normative goals, why is a study of NCLB’s local
implementation still relevant when 46 of 52 states (including the District of Columbia and Puerto
1 Quote from former Superintendent of Prince George’s County public schools, Maryland and current
Superintendent of Los Angeles public schools, John Deasy. Reported by the Associated Press.

4
Rico) have been granted a waiver by the U.S. Department of Education from Adequate Yearly
Progress (AYP) consequences?2
I pose two primary reasons. First, federal education policy remains volatile, and it is
unclear how and when policies will be determined. Over the course of the Obama
Administration, there have been three Race to the Top (RTTT) initiatives, NCLB waivers 3, and
talks of Elementary and Secondary Education Act (ESEA)4 reauthorization. Given this federal
volatility, states are not only facing complex federal expectations today, but also the prospect of
future complications.
Second, states across the country are passing and debating reforms similar to those
implemented under NCLB, including school takeover, teacher and principal removal, and charter
authorization. When considering reforms, state leaders should consider both the achievement-
related evidence and the political dynamics of their state. This study will attempt to partially
explain the second consideration by analyzing the impact of state-level interest groups and
bureaucratic capacity on reform efforts.
This thesis makes three primary contributions to the education policy literature. First, my
evidence supports the finding that interest groups matter in local reform implementation. It
appears that business associations prefer quick and clean measures of reform as compared to
more complex and technical reforms. Furthermore, teachers unions seem to protect their own
members and their interests, while also seeking to grow classroom capacity. Second, I find little
2 States that have not been granted a waiver can be found http://www2.ed.gov/policy/elsec/guid/esea-
flexibility/index.html 3 Most of the NCLB waivers issued by the U.S. Department of Education will expire at the end of this coming
school year in Spring 2014. As the political dynamics in Washington look too contentious to produce a new
reauthorization of NCLB, it is possible, however, unlikely that states could again be forced to comply with NCLB. It
is more likely that the Department of Education will pass down new waivers (Riddle and Kober 2012a; 2012b). 4 Elementary and Secondary Education Act (ESEA) was originally signed into law in 1965 under President Johnson.
No Child Left Behind was the 2001 reauthorization of ESEA (Manna 2011). The law has traditionally been
reauthorized every six years, but it has not been reauthorized since 2001.
5
support for the impact of bureaucratic capacity on local reform. This study finds capacity
impacted only one type of reform under AYP’s reform plan. Third, greater study is needed on the
impact of bureaucratic capacity. Although there are mostly null findings in this study, part of the
explanation for the result may have to do with the poor measures of capacity currently available
to researchers. Future work should be done to measure and capture better measures.
The remainder of this paper is divided into four sections. I begin with a brief explanation
of NCLB. Then, I outline the two primary theoretical lenses that may explain the variation in
reform implementation: interest groups and bureaucratic capacity. Next, I discuss my methods
and data, and then I explain my results. Finally, I discuss the broader implications of this paper.
NCLB Background
Despite the overwhelming bipartisan support for No Child Left Behind when it was
passed by Congress5, the law did not meet the same acclaim upon its implementation. Advocates
of NCLB trumpeted that the law would hold schools accountable yet give state and local leaders
the flexibility to act effectively (Manna 2011). Critics lamented clumsy federal implementation
and condemned the main accountability measure, Adequate Yearly Progress (AYP), as a poor
tool for analyzing student achievement in schools (Ravitch 2010).
As envisioned, NCLB would significantly increase the participation of the federal
government in education policy. For the first time, there would be consequences imposed by the
federal government on schools and districts that failed to show sufficient academic progress over
a given school year. Although accountability had long been brewing as an issue on the national
agenda, NCLB was the first federal initiative to create a mechanism, AYP, through which
5 The bill passed on May 23, 2001 in the House of Representatives with a majority of 384-45 (Republicans voted in
favor 185-34, and Democrats voted in favor 197-10). It then passed in the United States Senate by a margin of 91-8
(Republicans voted 43-6 in favor, and Democrats voted 47-2 in support). The bill was signed into law by President
George W. Bush on January 8, 2002. https://www.govtrack.us/congress/bills/107/hr1

6
localities would face federal consequences (Manna 2011). AYP is the expectation that schools
must achieve a level of proficiency on standardized tests in each successive year (USDOE 2006).
States had much control over how AYP was implemented. They were allowed to both
define the student-level standard of proficiency and the minimum percentage of students that
must achieve proficiency for a school or district to meet AYP, often referred to as “cut-scores.”
Schools would miss AYP if they failed to get the minimum number of proficient students or if
any individual student subgroup–for example African American, Hispanic, low income students–
did not reach achieve their cut-score. The AYP standards also included minimum performance in
test participation, attendance, and graduation requirements. Only in the 2013-2014 school year
could states not set their own cut-scores, because NCLB mandated by that time that all schools
and districts had to meet 100 percent proficiency (Manna 2011).
Although AYP was designed to give states increased flexibility, some viewed the design
as problematic. Critics argued that states, who also designed their own tests, could set the bar for
student-level proficiency and AYP so low that schools and districts could easily achieve them
without improving (Carey 2007; Fuller et al. 2007). Advocates said that test scores would still
improve, yet there is still a debate about NCLB’s outcomes. Some argue that NCLB has
improved student outcomes (Center on Education Politics 2007; 2009; Hanushek and Raymond
2004), while others argue that nothing has changed or outcomes have regressed (Lee 2006).
This study does not engage in the debate over outcomes, however. Instead, I focus on the
implementation of reforms for the worst performing schools. These schools were the ones who
consistently failed to make AYP. Schools that did not meet AYP were designated as “in need of
improvement.” And schools that failed for multiple years faced varying levels of consequences.
The responsibilities for each successive year can be seen in Table 1. The second year a school

7
missed AYP, they had to offer local school choice options for their students, and in year three
they were required to implement supplemental education services. In year four, schools had to
implement corrective action, in addition to the previous reforms. By year five, schools had to
design a plan for restructuring, and then implement it if necessary in year six (USDOE 2006, No
Child Left Behind Act (Public Law 107-110), Section 116).
Table 1. Consequences for schools missing AYP
Number of Years
Missing AYP
Consequence for School
1 School on watch
2 Implement local school choice
3 Implement local school choice and supplemental educational services
4 Implement corrective action, and implement local school choice and
supplemental educational services
5 Create a restructuring plan, implement corrective action, and
implement local school choice and supplemental educational services
6 Implement restructuring plan, implement corrective action, and
implement local school choice and supplemental educational services
Note: Adapted from Manna 2011 and the No Child Left Behind Act (Public Law 107-110), Section 116
SEAs, localities, and schools all were given responsibilities in the implementation of
school improvement, yet there exists variation in how these responsibilities were carried out.
When a school falls under corrective action or restructuring, localities were required to provide
the school with technical assistance6, which is “practical advice offered by an expert source that
addresses specific areas for improvement” (USDOE 2006, 15). Localities, as mentioned earlier,
were required to continue implementing previous steps of improvement and one of the seven
6 Localities did not have to administer technical assistance alone. Localities could use other resources, such as SEAs,
institutions of higher education, educational service agencies or private organizations (USDOE 2006).

8
corrective action reforms. State Education Agencies (SEAs) had two primary responsibilities
when a school was in improvement: to “allocate Title I, Part A funds” for improvement
activities, and “create and sustain a statewide system” of technical support (USDOE 2006, 17).
States varied significantly in the quality and type of technical support. Some relied on expert
support teams who held expertise in a variety of areas, school improvement specialists or
regional support centers, while others left technical support mostly up to localities or hosted
infrequent statewide conferences (Le Floch et al. 2007).
SEAs, localities and schools all played an important role in dictating which reforms were
selected in corrective action and restructuring. Schools in most cases made the ultimate decision
on which reform to implement, yet state and local factors certainly played a supportive role. I
will be looking see how these state-level factors affected the implementation of local reforms.
Theoretical Framework
My paper will test two theories in the literature on the policy-making process. Some
scholars posit that interest groups–teachers unions and business interests–can account for
changes in policies that reflect the desires of these powerful groups (Manna 2006; Moe 2011;
Ravitch 2010). Other experts assert that bureaucracies’ capacities–a measure of the abilities of
state actors–can explain variation in policy across states (Barrilleaux and Brace 2007; Barilleaux
and Miller 1988; Berkman and Plutzer 2010; Gottfired et al. 2011; Timar 1997). The following
section will discuss these perspectives, and how they may work in the context of school reforms.
Interest group policy-making model
The nation’s K-12 education system provides many entry points for citizens to give their
input and advice, which can give interest groups tremendous leverage to assert their policy

9
preferences (Manna 2006; Moe 2011). The first primary theory of study in this paper, the interest
group policy-making model, will test the assertion that powerful interest groups advance their
agenda in reform implementation. In this theory, I expect states with powerful education interest
groups are more likely to see reforms that align with their agenda than states with weak
education interest groups.
The two primary interest groups in education policy are teachers unions and business
associations (Moe 2011, Hartney and Flavin 2011, Moe 2006). Teachers unions traditionally
support proposals that protect teachers’ jobs, salaries, and benefits and promote a quality work
environment (Kahlenberg 2006; Moe 2011). Unlike many other traditional interest groups,
teachers unions are well positioned in the policy landscape to project substantial power. First,
combined political contributions of the National Education Association (NEA) and the American
Federation of Teachers (AFT) exceed any other single business or industry political group in the
United States (Moe 2011). Second, teachers unions are able to influence education policy
processes at the federal, state, and local levels (Moe 2006; 2011; West 2010). Third, unions have
won strong collective bargaining and protective contracts in most states, making them a forceful
agent (Kahlenberg 2006; Moe 2011; West 2010).
Teachers unions have had tremendous success over the past 50 years in achieving their
goals (Kahlenberg 2006). Defenders of teachers unions argue these victories have benefited
students, as well. When teachers can focus on their classroom instead of their pay, health
benefits, job security, and other job-related issues, students will benefit from better teaching
(Kahlenberg 2006). Advocates also point towards smaller class sizes (Mishel and Rothstein
2002), as further examples of union victories that helped students. They argue that unions free
teachers to maximize their effectiveness (Ravitch 2010; Weingarten 2010).

10
Conversely, a growing group of union critics see the interests of unions as an obstruction
to needed education reforms and subsequent improvements to student achievement (Brimelow
2003; Lieberman 1997; Moe 2011). Critics point to the roots of teachers unions, which they say
were designed and formed, like their private and public union counterparts, to protect the
workers they represent (Levi et al. 2009; Moe 2006). Their incentives are to address the goals of
the members. Union leaders are elected and paid by a group with homogenous interests (Levi et
al. 2009). Failure to represent teachers’ interests could, in some states, result in financial losses
for the union7 or replacement of the leadership (Moe 2006; 2011). These incentives encourage
unions to focus on the needs of their members, primarily job security, financial compensation,
and resource support (Moe 2006).
Business associations act as the main countervailing force to teachers unions in education
policy (Moe 2011; Ravitch 2010). Yet, why do business associations care about education?
Business leaders see investment in education as a smart, long-term decision that will develop a
more capable workforce and benefit the business community (Moe 2011). Often reform efforts
supported by business associations focuses on developing human capital, encouraging free
market solutions, and instituting accountability metrics and punishment mechanisms for teachers
and principals (Moe 2011; Ravitch 2010). Much of the business community’s interest in
education reform has been leveled in urban communities such as New York City and San Diego
(Hannaway and Stanislawski 2005; Klein 2010; Ravitch 2010).
Despite a common interest in education, business associations differ from teachers unions
in several ways. First, business groups often have more diverse policy agendas with interests
7 Unions lose money by losing members. In states that do not have compulsory membership dues, teachers could
choose to leave the union, resulting in a financial lose for the organization. There are 24 states that require teachers
to pay agency fees to the union, and only in these states would unions not be at risk of losing funding. Alternatively,
members can replace union leaders (Moe 2011).

11
ranging from tax policy to infrastructure to healthcare. This diverse agenda makes it difficult for
associations to match teachers unions in every federal, state, and local arena. They have neither
the resources nor the information, because of this diverse agenda and their lack of direct
connections to the classroom (Moe 2011). Instead of constantly battling, associations carefully
choose the issues they push.
This paper will test the relative strengths of teachers unions and business interests
through the lens of struggling school reforms. In the interest group policy-making model, in
states with a strong union presence, I expect fewer reforms will threaten teachers stability. In
states with a strong business influence, there will be a greater proportion of the typical business
association agenda implemented.
Bureaucratic capacity policy-making model
One of the primary tasks of state education agencies (SEAs) since the 1960s has been to
carry out federal programs and help localities implement them. Before growing demand from the
federal government, SEAs were small and rather unprofessional. However, in the 1970s SEAs
began to grow in size and funding (Timar 1997). With growth came more specialization and
professionalism. Lastly, SEAs began to develop and expand into more complex state-level
policy. This growth did not last forever, and since the 1980s, SEAs have been facing smaller
budgets and shrinking capacity. Despite these general national trends over the last 50 to 60 years,
there still exists wide variation in capabilities of SEAs across states (Barilleaux and Brace 2007;
Berkman and Plutzer 2010; Gottfried et al. 2011).
NCLB required states to take much greater responsibility for education quality than ever
before. States were mandated to set standards for student achievement, evaluate schools and
12
districts based on these measures, and report results back to the federal government (Manna
2011). Reports included a variety of performance measures from student subgroup test scores,
testing participation rates, school attendance rates, high school graduation rates, structure and
content of state assessments, and teacher quality (State Consolidated Reports 2006). There is a
range in the quality and thoroughness of these reports across states. Implementation of policies
under NCLB have been found to have mixed quality associated with the abilities of SEAs (Boyle
et al. 2009; Gottfried et al. 2011; Le Floch et al. 2007; Sunderman and Orfield 2007).
As scholars have struggled to identify consistent data sources on state funding and
manpower, they have shifted focus to other relationships that help explain bureaucratic capacity
and its relation to policy making and implementation. Scholars have found a relationship
between urbanization and professionalization of bureaucracies (Manna and Harwood 2011).
Urban states possess the resources to develop professionalized bureaucracies, the networks to
connect to other experts, and the ability to understand and implement reforms and strategies that
have been developed in and for urban schools. Conversely, rural states often struggle to scrap
together the same resources, networks, or easy adoption of reforms. Resources, networking, and
technical ability have led scholars to adopt urbanization as a useful proxy measure for
bureaucratic capacity (Berkman and Plutzer 2010; Manna and Harwood 2011).
Scholars of bureaucratic capacity would point out that the differences between state
agencies make up a large portion of the difference in the success or failure of local
implementation (Barrilleaux and Brace 2007; Barilleaux and Miller 1988; Berkman and Plutzer
2010; Gottfried et al. 2011). I will refer to this theory as the bureaucratic capacity policy-making
model. If this model holds true, we can expect to see states with greater capacity will initiate
more complex reforms.
13
Data and Methods
For this paper, I have collected data from all 50 states, the Districts of Columbia, and
Puerto Rico on the implementation of corrective action and restructuring reforms under NCLB.
The dependent variables originated from State Consolidated Reports8 from 2006 to 2011, while
the independent variables of interest came from a variety of sources. Teacher union and business
association political contributions were gathered using the Industry Tool at Follow the Money9,
and total assets of teacher union and management groups were found via Foundation Center’s
990 Finder search tool10
. Measures of bureaucratic capacity were also compiled from different
sources, including the U.S. Census Bureau for population density11
, and the National Center for
Education Statistics’s (NCES) table generator tool for state education funding12
. Also from the
NCES, I collected most of the data for the control variables, except for the partisanship controls
which were gathered from the National Governors Association13
and the Council of State
Government’s Knowledge Center14
.
In this analysis, I have two sets of dependent variables: corrective action reforms and
restructuring reforms. These data, as mentioned previously, have been gathered from State
8 Thanks to Professor Paul Manna, Department of Government at the College of William & Mary, for his access to
the State Consolidated Reports. These data have been gathered in conjunction with his work on the State Education
Governance Study funded by the Spencer Foundation. 9 Data can be found following this link: http://www.followthemoney.org/database/IndustryTotals.phtml. To search
for teachers union contributions follow “Labor” then “Public Sector Unions” and select “Teachers unions” for each
state. To search for business association contributions follow “General Business” and select “Business
Associations.” 10
Data can be found following this link: http://foundationcenter.org/findfunders/990finder/. Search organization
names in the correct search box, and then select the appropriate state. For a list of all organizations searched for this
project, consult Table 2 in the Appendix. 11
Data can be found following this link: http://www.census.gov/popest/data/index.html. Follow the link to find the
total population and density in each year 2006 to 2010. 12
Data can be found by following this link: http://nces.ed.gov/ccd/elsi/default.aspx?agree=0. Use the table generator
to find the variables of interest: percent of total funding from state sources, percent of students receiving free and
reduced lunch, percent of white students, total students. 13
Data can be found by following this link: http://www.nga.org/cms/FormerGovBios. Consult rosters of Governor’s
for each year from 2006 to 2011. 14
Data can be found by following this link: http://knowledgecenter.csg.org/kc/content/bos-2006-chapter-3-state-
legislative-branch. Consult “Book of State” report for each year 2006 to 2011.

14
Consolidated Reports, which are completed by SEAs and reported to the U.S. Department of
Education.
Dependent Variables–Corrective Action
As defined by the U.S. Department of Educations’s Student Achievement and School
Accountability Programs Office, a corrective action reform “is a significant intervention in a
school that is designed to remedy the school’s persistent inability to make adequate progress
toward all students becoming proficient in reading and mathematics” (USDOE 2006). Schools in
corrective action must continue to implement reforms required in earlier stages of school
improvement and implement at least one of the reforms in Table 3.
Table 3. Corrective Action Reforms and examples.
Corrective Action Reforms Examples of Reform
New curriculum Development of new math or reading curriculum or
pedagogical techniques
Replace staff Removal of inadequate staff, but must be in accordance
with all labor laws
Decrease managerial authority Flexible measure that can transfer powers to local control
board or central office.
Replace principal Removal of inadequate principal, but must be in
accordance with all labor laws
Extend school day or year No minimum amount of time to extend school day or
school year
Outside expert Appoint a professional expert who is to support and
recommend reforms, but in practice suggestions are
implemented
Change internal organization Changes in scheduling, administrative responsibilities, etc. Note: Examples are provided from a guide shared with Illinois localities from the Illinois Department of Education.
Also important to note that a school can implement more than one of these options at the same time (Illinois State
Board of Education).

15
State education agencies were required by the U.S. Department of Education to report
counts of corrective action reforms15
implemented. I collected these data from“Section 1.4
School and District Accountability” of the 2006 to 2011 State Consolidated Reports. Figure 1
shows the large variation in the average number of corrective action reforms implemented across
states. For instance, in California, schools across the state implemented an average of 576
corrective action reforms, while the smallest state, Wyoming, implemented 7. For this reason, I
transformed the counts of each corrective action into percent of total reforms16
.
Figure 1. Average corrective action reforms implemented in schools from 2006 to 2011, by
state
Note: Data collected from State Consolidated Reports for each state from 2006 to 2011. Results are the average
number of reforms in each state over this time period.
Even when accounting for the size of the state, there still exists variation in the
percentage of corrective action reforms implemented. Table 4 contains the basic descriptive
statistics of the corrective action reform variables. Even the reform with the smallest amount of
15
These counts of total corrective action reform are not necessarily equal to the number of schools in corrective
action. A school could choose to implement more than one corrective action reform at a time, and so I did not
calculate the measure out of total schools in corrective action, because it would over predict the implementation of
reforms. 16
See footnote 15. I also did not make this variable out of total schools in a state, because my universe of interest is
schools implementing reforms.

16
variance, Decrease managerial authority, has a standard deviation of a little over 9 percentage
points, while New curriculum has a standard deviation of 26.7 percentage points. The frequency
of reform implementation also varies. New curriculum is the most popular reform with a mean of
over 37 percent of total reforms, while Decrease managerial authority, Replace staff, and
Replace principal all have means below 6 percent.
New curriculum is the modal reform across states and years, yet it is not the most popular
reform in each state in each year. Figure 2 has two maps with the most popular corrective action
reform for each state. The first map is for the 2006-2007 school year, and the second one is for
the 2010-2011 school year. There are five different reforms that are the modal type in at least one
state in 2006-2007. 17 states that have two or more reforms that are equally popular. In the 2010-
2011 school year the map looks quite different. Decrease managerial authority is no longer a
modal reform in any state, and there are only 13 states with multiple equally popular reform. The
most striking change is the increase of New curriculum as the modal reform from 14 states in
2006-2007 to 23 states in 2010-2011.
Figure 2. Most popular corrective action reforms, by state in 2006-2007 school year and 2010-
2011 school year
Note: Data gathered from State Consolidated Reports in year 2006 and 2010. Maps were generated at
https://datawrapper.de/

17

18
Dependent Variables–Restructuring
The Department of Education guidelines for state and local agencies define the
restructuring process as follows:
“A school that misses its annual achievement targets for five or more years is identified for
restructuring...Generally speaking, under NCLB when a school is in restructuring status, the LEA must
take intensive and far-reaching interventions to revamp completely the operation and governance of that
school” (USDOE 2006, 26).
The restructuring process was intended to aggressively reform the worst schools. Similar to the
corrective action process, schools entering restructuring had to maintain any reforms from
previous levels of consequences. After the fifth year of missing AYP, a school would create a
restructuring plan, then implement it if they failed a sixth year. The restructuring plan must
include one of the five options in Table 5.
Table 5. Restructuring reforms and examples
Restructuring Examples of Reform
Replace staff Replace all or most staff associated with poor performance, can
include principal, must be in accordance with state laws
Public charter Close and reopen school as public charter
Private contract Contract with a successful private management company that
will operate the school
State takeover Turn over operations of school to the SEA, if permitted by state
laws
Other Decrease managerial control, increase control by LEA, reopen
school as themed school, create small independent learning
communities, dissolve the school, pair with achieving school,
expand or narrow grades served
Note: Examples gathered from School Improvement Report (2006).
Some of these restructuring options align with options under corrective action, yet there
are a few major differences. Most notably, the final option for schools under restructuring is a
loosely defined Other category. According to NCLB, the Other option permits an LEA to
implement

19
“any other major restructuring of the school’s governance arrangement that makes fundamental reforms,
such as significant changes in the school’s staffing and governance, to improve academic achievement in
the school and that has substantial promise of enabling the school to make adequate yearly
progress” (USDOE 2006, 30).
This reform was designed to give localities greater flexibility. The law, however, did not design a
clear mechanism for SEAs or the U.S. Department of Education to hold localities accountable to
the aforementioned standard.
As in the case of corrective action reforms, the largest states often implemented the most
reforms, so for my analyses I transformed the restructuring counts into a percentage of total
reforms in each state and year. Unlike corrective action there is a clear modal reform. Table 4
shows the mean of Other reforms at over 73 percent, and the next closest reform, Replace staff,
has a mean of 20.41 percent. Public charters, Private entities, and State takeovers are very
uncommon with each falling around or below 3 percent of reforms implemented.
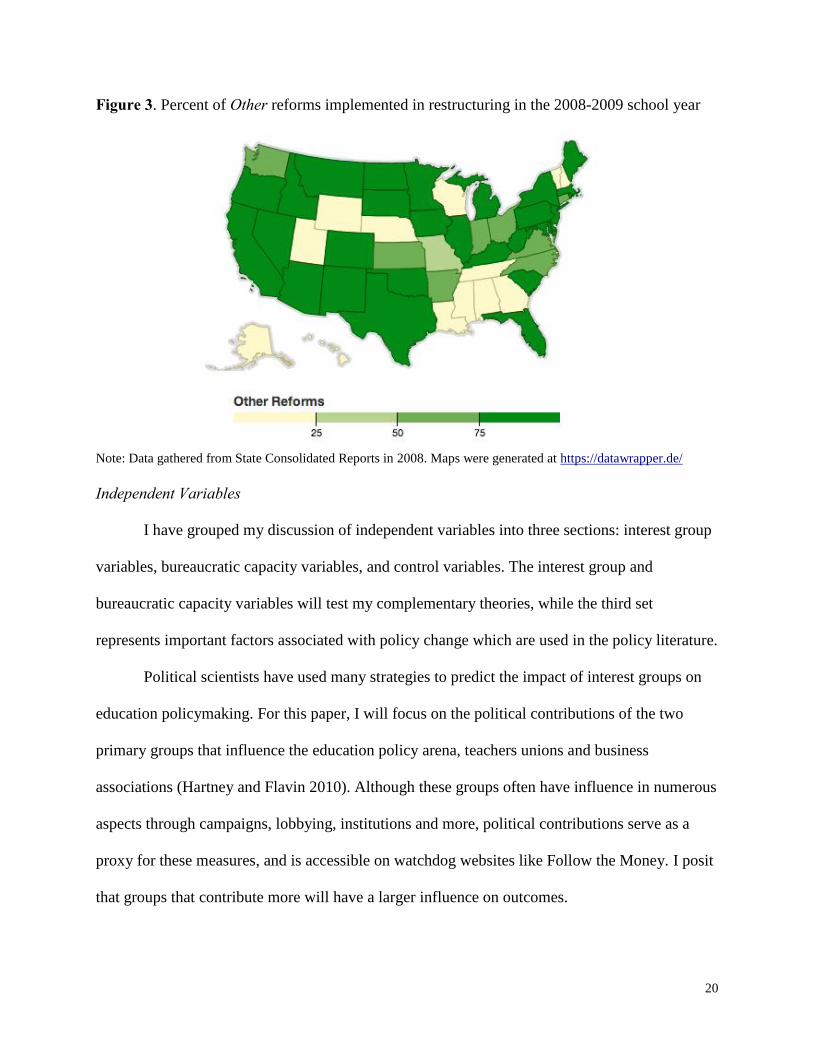
Despite the popularity of implementing Other restructuring reforms, there still exists a
great deal of variance across states in the proportion of each reform implemented. See in Figure
3, a map of the United States that represents the percent of Other reforms implemented in the
2008-2009 school year. Although a majority of states fall in the upper quartile, 28 states
implemented over 75 percent, there are still 13 states that implement less than 25 percent Other
reforms.
20
Figure 3. Percent of Other reforms implemented in restructuring in the 2008-2009 school year
Note: Data gathered from State Consolidated Reports in 2008. Maps were generated at https://datawrapper.de/
Independent Variables
I have grouped my discussion of independent variables into three sections: interest group
variables, bureaucratic capacity variables, and control variables. The interest group and
bureaucratic capacity variables will test my complementary theories, while the third set
represents important factors associated with policy change which are used in the policy literature.
Political scientists have used many strategies to predict the impact of interest groups on
education policymaking. For this paper, I will focus on the political contributions of the two
primary groups that influence the education policy arena, teachers unions and business
associations (Hartney and Flavin 2010). Although these groups often have influence in numerous
aspects through campaigns, lobbying, institutions and more, political contributions serve as a
proxy for these measures, and is accessible on watchdog websites like Follow the Money. I posit
that groups that contribute more will have a larger influence on outcomes.

21
I collected political contributions data from Follow the Money’s Industry tool. Political
contributions by groups has wide variation year to year due to the timing of state elections. For
instance, most states have state-level elections on even numbered years (2008, 2010, etc.), but
other states have elections on odd numbered years (2007, 2009, etc.). To account for this
variation across states, I created a cycle variable that added the political contributions from the
two years before the spring half of the school year. For instance, corrective action and
restructuring school year reforms implemented in School Year 2006-2007 are associated with
political contributions from January to December 2005 plus January to December 2006. Finally,
to account for variation in size of contributions based on population size, I standardized the
contribution measure by dividing it by the total number of students. My political contribution
variables were constructed as a state group’s two-year political contributions per student.
Substantial variation exists across states in the political contributions of teachers unions
and business associations, yet in most states teachers unions contribute more than business
associations. In Figure 4, blue states represent greater union contributions, and red states
represent greater association contributions. There are only 10 states where business associations
outpace unions, and they are predominately southern with the exception of Vermont and
Delaware. Business associations contribute up to 10 times as much as unions in these states. The
lightest blue states represent a comparable level of union strength to the associations pink. In this
slightly pro-union category, there are 23 states. Even more startling are the 11 states that are
extremely pro-union, which are shaded a dark blue. In these states, unions contribute at least 25
dollars for every association dollar.

22
Figure 4. Measure of the ratio of teacher union to business association political contributions
from 2006 to 2011.
Note: Data gathered from followthemoney.org by using it’s Industry tool. Maps were generated at
https://datawrapper.de/
In addition to examining the impact of business associations and teachers unions, I sought
a measure of school leaders’ influence on the policy process. I looked to find a measure of
leadership groups, which includes school principals, superintendents and school board members.
Finding political contributions for leadership groups proved quite challenging. After
unsuccessfully looking for leadership political contributions, I sought other measures of their
influence.
As another measure of group strength, I collected total asset data from IRS 990 forms on
state school leadership organizations. The only available years were 2009 through 2011. Only in
2009 were assets comparable to my other measures. I focused the data collection on state
affiliates to the four main national leadership groups: The National Association of Elementary
School Principals (NAEP), The National Association of Secondary School Principals (NASSP),

23
The School Superintendent Association (AASA) and The National School Boards Association
(NSBA)17
. There exists wide variation in size of these leadership organizations across states.
In addition to collecting total asset records for these state leadership groups, I also
gathered total assets of state teachers unions associated with the National Education Association
(NEA) and the American Federation of Teachers (AFT). As a more locally based organization,
the AFT did not have an affiliate in every state, however, future research should develop a more
inclusive measure of AFT affiliates that captures the organization’s influence.
To best reflect the combined interests of these groups and to account for possible gaps in
individual state affiliates, I generated two composite variables. The first variable combined the
assets of all the leadership groups, and the second variable combined the assets of the teachers
unions. Each variable was then transformed into a per student measure to control for state size.
My two measures of bureaucratic capacity, state population density and percentage of
state funding, are variables used in Manna and Harwood’s (2011) paper on state governance and
policy outcomes. State population density is used as a proxy of SEA strength. The theory is that
urban states tend to have greater capabilities at the state and local level. Urban states have both
the resources and professional networks to help buoy the state agency. In rural states that tend to
have weaker administrative capacities, it can be difficult to enact intense reforms that would
increase responsibility on strapped states and localities. I have collected population density data
from the U.S. Census Bureau’s total population estimates from 2006 to 2009 and the census
count in 2010. Total state land area was gathered from the National Atlas. As a highly skewed
variable, I decided to take the natural log of population density to bring in some of the outliers.
17
See Table 2 (A-F) in the Appendix for a complete list of the state affiliates searched for this project. As a note,
leadership groups are not a large part of this paper’s analysis of state-level factors and their impact on local reform
implementation. However, future research in the implementation of education reform would benefit from a more in-
depth study of the impact of leadership groups. For this reason, I have listed the groups searched in this study.

24
My second variable for bureaucratic capacity is the percent of total education funding
from state sources. State funding captures the financial and political strength of the state and its
agency relative to federal and local interests (Manna and Harwood 2011). States that invest a
larger portion of the fiscal pie will position a state to be more assertive on reform decisions.
These data were collected from the National Center for Education Statistics annual Digest of
Education Statistics in Table 181 for years 2006 to 2010.
As you can see in Figure 5, there is wide variation in education funding by source. Some
states rely heavily on state funding, while others are more locally based. Federal spending
remains fairly consistent at about 10 percent of total spending. My theory of bureaucratic
capacity would predict that for states where a greater amount of their funding comes from state
coffers, these states will implement more complex and technical reforms. On the other hand,
states with little state level funding will shirk their responsibility and select simpler reforms. I
will explain how these theories manifest themselves in the forthcoming hypothesis section.

25
Figure 5. Average division of total public education funding (federal, state, local) by state from
2006 to 2010.
Note: Data collected from the National Center for Education Statistics’s Digest of Education Statistics Table 181
from 2006 to 2010. States may not total to 100 percent due to omission of private funding sources.
Control Variables
I have three control variables designed to isolate the effects of the individual independent
variables. The first control is the percentage of students in a state that receive a free or reduced
priced lunch. This measure is a common control in education studies to account for
socioeconomic variation across states (Hartney and Flavin 2010; Moe 2011). The free and
reduced lunch rate also accounts for the challenges that resource poor schools and states have in
funding reforms. Poor states face different and additional challenges when educating their
children (Manna and Harwood 2011). For example, in communities where students are
malnourished due to financial hardship, there is clear evidence of poorer academic performance
(Meier and O’Toole 2006). The second control is the percentage of the state student population
that is white. The percentage of white students in a state helps account for the diversity of the
state and some of the demands on states and schools (Manna and Harword 2011). Diversity
often results in additional task demands for actors in a system. For instance, in schools with large

26
English Language Learner populations, teachers and administrators are faced with a scarce
resource problem where they have to adapt their teaching for a prominent subgroup while also
maintaining quality of learning for other students (Meier and O’Toole 2006). These controls are
not here to assert that poor and diverse states care less about education in their state, but rather
that they often face greater challenges in collecting enough resources and teaching students with
greater variation in needs and abilities. Both of these variables were collected from the National
Center of Education Statistics table generator tool.
The third and final control for my study is a measure of political dynamics. I have
collected data on the party affiliation of a state’s governor and legislature from 2006 to 2010.
Others have used this technique of unified versus divided partisan government to help control for
variation in policy (Alt and Lowry 1994; Manna and Harwood 2011). For this study, I looked at
just unified Republican government for two reasons. First, I had problems with regression results
when I added three partisan dummy variables. Second, Republicans at the state level have been
at the forefront of many recent reforms18
. The variable is a dummy variable with a state receiving
a value of 1 if there is a unified Republican government, meaning both the Governor and
legislatures are Republican led. A state receives a 0 if either the governor or the legislature is not
Republican controlled. These data were collected from the National Governor’s Association and
the Council of State Governments.
Methods
To analyze the data collected, I use large-N quantitative methods. For each dependent
variable, I run an ordinary least square regression with robust standard errors and clustered by
state. I further account for the multiple years in my data set by using dummy variables for years
18
Many Republican states have been implementing reforms. See http://www.economist.com/node/21548268.

27
2007, 2008 and 2009 with year 2006 omitted. I have removed year 2010 due to the missing
values for state education funding. These year variables control for unmeasured factors that may
be associated with changes across each year. Clustering by state allows multiple values for each
state, and it assumes that each state year is not independent, meaning a state does not restart its
policy process each year. My regression will attempt to explain the variation in implementation
of each reform with the state year as my level of analysis.
Corrective Action Hypotheses
Hypothesis 1: In states that have a strong business interest presence, schools in corrective
action will implement a greater proportion of Outside expert reforms.
Hypothesis 2: In states that have a strong teachers union presence, schools in corrective
action will implement a smaller proportion of Staff replacement reforms.
Given a strong presence from any of these interest groups, I expect them to push at the state and
local level for schools to implement reforms favorable to their members. Business groups will
seek solutions consistent with their goal of bringing free-market style reforms to education, while
teachers unions will seek to protect their members from layoffs.
Hypothesis 3: In states that have strong state education bureaucracies, schools in
corrective action will implement a greater proportion of New curriculum, Change
internal organization, and Extended school day or year reforms.
Strong SEAs will have the resources and manpower to direct at reforms, including developing
New curriculums, Change internal organization, or Extend the school day or school year. Less
capable SEAs may decide to shirk their responsibility or become less involved in the process

28
because they do not have the resources to adequately help, and they do not want to overextend
beyond their established policy turf (Wilson 1989).
Restructuring Hypotheses
Hypothesis 4: In states that have a strong business interest presence, schools in
restructuring will implement a greater proportion of Private contract and Public charter
reforms.
Hypothesis 5: In states that have a strong teachers union presence, schools in
restructuring will implement a smaller proportion of Staff replacement reforms.
Once again, interest groups seek to protect themselves and further their own policy interests.
Business associations will seek to push a private, free-market agenda, including implementing
reforms with expert Private contractors and Public charter schools. Teachers unions will protect
members from firings.
Hypothesis 6: In states that have strong education bureaucracies, schools in restructuring
will implement a greater proportion of State takeover reforms and a smaller proportion of
Other reforms.
SEAs that have access to more resources will be able to implement more complex reforms. State
takeovers are often difficult to perform and require significant manpower, resources, and
expertise. Additionally, states with greater resources should seek to implement more complex
options than Other reforms.
Results
The following section will review the findings from my 12 models of AYP reform
implementation. There are seven corrective action models and five restructuring models. I use

29
the variables described in the Data and Methods section to test the impact of education interest
groups and the capacity of state education agencies.
I will begin with a brief analysis of some basic bivariate relationships and summary
statistics. Then, I will look at the impact of business associations and teachers unions
individually. Finally, I will address the influence of bureaucratic capacity.
Summary and Basic Statistics
In this subsection of results, I will outline some of the basic relationships between the
independent, dependent and control variables. I will also discuss the relationship with two
independent variables, teachers union and school leadership assets.
In looking at correlations of business association and reforms implemented, there are no
strong findings. First, there is little evidence of a positive association between business
associations and Outside expert reforms, as I had hypothesized. The correlation coefficient is just
r = 0.037. I also predicted that greater business influence would lead to an increase in Private
contract and Public charter reforms. However, the correlation coefficients for each–Private
contract (r = -0.008) and Public charters (r = -0.036)–are so small that the relationship is almost
random.
Despite the somewhat surprising business association results, there are some more
promising correlations with teachers unions. As I predicted earlier, increased teachers union
political influence is associated with fewer Replace staff reforms. Yet, the two correlations are
not strong. For corrective action Replace staff, the coefficient is r = -0.081 and it is r = -0.102 for
restructuring.

30
Finally in looking at the bureaucratic capacity measures, I projected that increased SEA
strength would be related with greater implementation of New curriculum, Change internal
organization and Extended school days or years reforms. I found mixed results across measures.
For Change internal organization reforms, there was a positive association with state funding (r
= 0.106) and an insignificant relationship with density (r = 0.001). In the cases of New
curriculum and Extended school days or years, the signs of the two independent variables were
different and all relatively small.
The correlations with restructuring reforms and the bureaucratic capacity measures are
more in line with my hypotheses. I hypothesized that an increase in bureaucratic capacity would
be associated with an increase in State takeovers and a decrease in Other reforms, and both are
supported by initial correlation coefficients. There is a moderately strong correlation between
State takeovers and state education funding (r = 0.372), and the second correlation between State
takeovers and state education funding is weaker but in the same direction (r = 0.077). For Other
reforms the correlation with state education funding is negative (r = -0.202) and so is the
correlation with population density (r = -0.169). Although few definitive conclusions can be
drawn from any of these weak correlations, it appears that there are a few relationships that have
the direction I anticipated.
The following section discusses two independent variables, teacher union and school
leadership assets. The first observation to note is there is no substantive correlation between the
two groups assets (r = -0.011). This result is not too surprising given common dynamics between
teachers and leaders in local and state settings, where they are often on opposite sides of the
table. A second important observation is that teachers union assets are positively related to
teachers union contributions, but the relationship is not too strong (r = 0.184).

31
Following a similar logic to the interest group model for union contributions, I can expect
to see greater assets associated with fewer Replace staff reforms. There is a negative but weak
relationship that exists between teachers union assets and Replace staff reforms (r = -0.098).
Additionally, there is a negative relationship between leadership assets and Replace staff reforms
(r = -0.083). Leadership assets do have an expected negative relationship with Replace principal
reforms under corrective action (r = -0.144), and teachers unions have an equally strong negative
association with the Replace principal reforms (r = -0.140).
However, leadership assets has an almost random association with Replace staff reforms
under restructuring (r = 0.009), and this is even more surprising, because this version of Replace
staff often includes replacement of principals, two of the main groups in the combined leadership
asset measure. Teachers assets, unlike leadership, is negatively related with restructuring Replace
staff (r = -0.185).
From this inconclusive descriptive analysis, it appears that leadership association and
teachers union assets reflect the expected direction of reforms. However, in just looking at
correlation coefficient over a few years, it would be foolish to draw any substantive conclusions
about the impact of leadership groups or teachers unions on school reforms.
Business Associations
The first set of regression models will focus on my business association hypotheses and
the overall impact of business contributions on the implementation of AYP reforms. In the first
hypothesis, I predicted that an increase in business association contributions would result in an
increase in the proportion of Outside expert reforms implemented. According to Model 7 in

32
Table 6, there is no statistically significant relationship and evidence of a positive relationship
between business association contributions and Outside expert reforms.
Business associations do, however, have a statistically significant impact on three of the
models in Table 6. In Model 1, business contributions has a statistically significant relationship
with implementation of New curriculum reforms. A one dollar per student increase in business
contributions, is associated with a 0.602 percentage point decrease in New curriculum reforms,
holding all other factors equal. For a standard deviation increase in business contributions, there
is a 1.296 percentage point decrease in New curriculum reforms implemented, and this is only
4.9 percent of a standard deviation decrease in the reforms.
Business contributions has a positive relationship with Replace staff in Model 3 in Table
6. A one dollar per student increase in business contributions leads to a 0.210 percentage point
increase in Replace staff. This means for a one standard deviation increase in business
contributions, there is a 4.5 percent of a standard deviation increase in the number of Replace
staff corrective action reforms.
Finally, business contributions has a similar impact on the implementation of Change
internal organization corrective actions in Model 6. Holding all else equal, a one dollar per
student increase in the independent variable leads to a 0.327 percentage point decrease in
Change internal organization reforms. For a standard deviation increase in business
contributions, there is just a 5.1 percent of a standard deviation decrease in Change internal
organization reforms.

33

34
Business associations do not have a relationship with restructuring, as I posited. In
Hypothesis 4, I conjectured that an increase in business contributions would lead to a greater
proportion of Public charters and Private contract restructuring reforms. In looking at these two
models–Model 9 and Model 10 in Table 7–the signs of the two coefficients are both negative, yet
neither is statistically significant. From these results, it is unclear if there is an association
between business contributions and restructuring reforms, and I can reject my fourth hypothesis.
The statistically significant findings related to the influence of business association make
sense. If we look at the two negative relationships, New curriculum and Change internal
organization, it is important to recognize the technical complexity of these two reforms. In the
case of New curriculum, overhauling even one subject such as mathematics or reading for one
grade can be a rigorous reform. According to the standards of corrective action implementation
as outlined by the Department of Education (2006), any curriculum changes must be backed with
evidence of success. Business associations, however, do not possess the technical background to
help implement these reforms.
Similarly, Change internal organization reforms could be a complex undertaking.
Neither NCLB nor the Department of Education clearly defined requirements for Change
internal organization, except for any reform must be evidence-based and related to the initial
failure to reach AYP. Options range from changes in administrative tasks and responsibilities,
different scheduling, altering instructional teams or creating multiple grade classrooms.19
Once
again many of these pedagogical decisions are disconnected from the solutions and ideas of
many in the business community.
19
https://www.educateiowa.gov/sites/files/ed/documents/Guidance%20for%20Schools%20in%20Need%20of%20Assi
stance%20-%20Corrective%20Action%20-%202013%2012%2031.pdf

35

36
One of the most common reforms that business associations have advocated for is teacher
accountability (Moe 2011). The business community typically clashes with teachers unions on
this issue and others. Associations sees teachers as an important factor affecting students success.
If teachers cannot perform at a high level, then they should be fired as they would in the private
sector. Teachers unions view business association solutions as quick fixes that make teachers the
undeserving scapegoat (Moe 2011; Ravitch 2010). Given this traditional divide, it is unsurprising
that business associations are associated with a greater proportion of Replace staff. Business does
have a relationship–albeit substantively rather small–with reforms. Associations appear to prefer
quick personnel changes to complex systematic changes.
Teachers Unions
Teachers unions are often one of the most influential groups in the education policy
discussion. For the purposes of this study, I predicted in Hypothesis 2 that an increase in teachers
union political contributions would result in a smaller proportion of Replace staff corrective
action reforms. Based on Model 3 in Table 6, I find some evidence of a negative relationship.
For a one dollar per student increase in teacher union political contributions, there is a
0.178 percentage point decrease in Replace staff corrective actions, holding all other factors
constant. A standard deviation increase in union contributions results in a 0.454 percentage point
decrease in Replace staff or 4.7 percent of a standard deviation in the dependent variable.
Teacher union political contributions have even more substantive impact in two other
models. First, teacher union contributions have a positive relationship with New curriculum in
Model 1. For a dollar per student increase, holding all else equal, there is a 1.665 percentage
point increase in New curriculum reforms implemented. For a standard deviation increase in

37
contributions, there is a 4.25 percentage point increase in New curriculum reforms. Take a state
such as Massachusetts in the 2008-2009 school year, which had a total of 253 corrective action
reforms implemented that year. An additional 1.9 million dollars in political contributions by
teachers unions would be associated with 11 additional schools implementing new curriculums.20
Although this seems like a great deal of money, the 2009 total assets of the Massachusetts
Teachers Associations–30.9 million dollars–pales in comparison to this small contribution, and
add to that an additional 1.5 million dollars in assets from the smaller AFT Massachusetts
affiliate.
Second, teachers unions have a negative relationship with Change internal organization
in Model 6. A dollar per student increase in union political contribution is associated with a
0.738 percentage point decrease in the implementation of Change internal organization reforms,
holding all else equal. A standard deviation increase in union contributions would result in a 1.88
percentage point decrease in Change internal organization reforms, which is 5 percent of a
standard deviation change in reforms. In the Massachusetts case above, a similar contribution of
close to 2 million dollars is associated with 5 fewer schools that changed their internal
organization.
I predicted that teachers unions would also have an impact on the restructuring process.
In Hypothesis 4, I expected that in states with a stronger teachers union presence, schools in
restructuring would implement a smaller proportion of Replace staff reforms. The direction of
the coefficient is negative, but the relationship is not statistically significant, as seen in Model 8
in Table 7.
20
Calculated by one standard deviation in political contributions is $2.19 per student with approximately 958,910
students in Massachusetts schools in 2008-2009 results in $1,917,820 in political contributions. To calculate the
number of extra reforms implemented take 4.25 percent of 253 total reforms.

38
Teachers unions do appear to have an impact on Other restructuring reforms. In Model
12, there is a positive relationship. A one dollar per student increase in union contributions is
associated with a 1.129 percentage point increase in Other reforms implemented, holding all
other factors constant. With a standard deviation increase in contributions, there is a 2.88
percentage point increase in Other reforms. Once again, this impact appears small, but is
substantive.
These results appear to be substantively meaningful. My two primary hypotheses related
to teachers unions as interest groups reflected their well-founded desire, according to the
literature, to protect their own members’ jobs (Kahlenberg 2006; Moe 2011). The results of
corrective action reforms seems to prove that unions protect their members, yet there is no clear
answer in restructuring. In addition, unions have a meaningful impact on New curriculum and
Change internal organization corrective action implementation.
Teachers unions’ support for New curriculum reforms seems to make sense. There are
two possible perspectives that could explain why unions would support this reform, one
normatively positive and the other negative. First, unions could be supportive of reform because
they see it as a measure that could make their members more effective in the classroom. Whether
it is developing new evidence-based pedagogical methods, instituting new math or reading
curriculum, or even developing a primary curriculum, unions may see this reform as a necessary
tool for teachers’ success. Second, unions could like curriculum reform because it is a way to
avoid reform options they do not support. Unions could see New curriculum reform as a safe
alternative when compared to Replace staff, Extended school day or year, or Change internal
organization. All of these options could threaten the status quo work for teachers that unions

39
have looked to establish21
. From this study it is unclear, which of these explanations may best fit
the real world, but both are plausible and help to explain how union contributions are associated
with New curriculum reforms.
Unions’ support for Change internal organization corrective action reforms is more
challenging to explain. Traditionally in the education interest group literature, teachers unions
and business associations act as opposing forces with divergent interests. In this case, both
groups’ activities have negative associations with Change internal organization. Associations
most likely oppose this reform because it requires too much technical knowledge. The most
plausible explanation, for unions, is that these reforms could be considered too disruptive and
unproductive. As I discussed earlier, Change internal organization is a vague reform that could
be implemented in a variety of ways. This uncertainty may also explain part of the union’s
opposition. Altering classroom grade levels or instructional teams or daily scheduling would add
additional constraints to the work of teachers and require many to dramatically alter their daily
routine.
Bureaucratic Capacity
The second theoretical lens which I test in this analysis is a bureaucratic capacity
framework. At its most basic, my theory states that stronger state agencies would implement
reforms that they deemed to be more rigorous in both corrective action and restructuring. In
Hypothesis 3, I predicted that increased measures of bureaucratic capacity–increased education
funding from state sources and increased state population density–would result in a greater
proportion of New curriculum, Change internal organization, and Extended school day or year
21
All reforms must be in accordance with existing state and local labor laws and agreements.

40
corrective action reforms. In the following section, I will address the results of each reform
model individually.
First, there is mixed support for my estimation of New curriculum reforms. As seen in
Model 1, a one percentage point increase in state education funding as part of total funding,
results in a 0.293 percentage point statistically significant increase in New curriculum reforms
implemented, holding all other factors constant. In more practical terms, a one standard deviation
increase in state education funding would result in a 4.06 percentage point increase in New
curriculum reforms implemented. Take a relatively small reform state like Georgia, which
implemented 59 corrective action reforms in the 2006-2007 school year. A standard deviation
increase would be associated with a 2 school increase in New curriculum reforms. However, take
a large state like California in the 2006-2007 school year. In this year, California implemented
861 reforms. A standard deviation increase would result in about 34 schools with additional New
curriculum reforms. The positive result between state education funding and New curriculum
does not hold for state population density. There is a positive sign, but it is not statistically
significant. It appears that there is some but limited evidence of a relationship between
bureaucratic capacity and the implementation of New curriculum reforms.
Second, I find no support for my expectation that increased bureaucratic capacity would
lead to increased implementation of Change internal organization reforms. In Model 6, state
education funding has a small positive relationship with the dependent variable, but it is not
significant. State population density is also insignificant and negative. I can reject this part of
Hypothesis 3.
Third, there is no support for the third part of my corrective action hypothesis. In Model
2, I expected to see positive and statistically significant relationships with Extend school day or

41
year and both independent variables. Instead, state education funding has a statistically
insignificant positive relationship with extended school day or year, and state population density
has a negative and insignificant relationship. I can reject the third part of this hypothesis.
The findings for bureaucratic capacity and corrective action are mostly insignificant, as
they are for restructuring reforms. I predicted that an increase in state capacity would increase
the proportion of State takeover reforms and decrease the proportion of Other reforms
implemented in a state. In model 11 and 12, I find no evidence to support these predictions. In
Model 11, both state education funding and population density have positive signs in association
with State takeover, yet both are statistically insignificant. Again both signs are going the
expected negative direction for Other reforms, but the coefficients for state education funding
and population density are not significant. I can reject my sixth hypothesis.
Discussion
After analyzing my two sets of models on failing school reforms, I can now draw some
general conclusions about the relationship between interest groups, bureaucratic capacity, and
reform implementation. Hypothesis 1 asserted that increased business contribution are associated
with increased implementation of Outside expert reforms under corrective action. Similarly,
Hypothesis 4 asserted that increased business contributions would be associated with greater
implementation of Public charter and Private contract restructuring reforms. According to
Model 1 in Table 6 and Model 8 and 9 in Table 7, my hypotheses do not appear to be supported.
Hypothesis 2 predicted an increase in teacher union contributions would be associated
with fewer Replace staff corrective action reforms. This prediction is supported in Model 3 of
Table 1, however, the similar hypothesis for restructuring is not supported. As seen in Model 8,
there is a negative but statistically insignificant relationship.

42
In the corrective action bureaucratic capacity hypothesis, I predicted increased capacity
would lead to greater implementation of New curriculum, Extended school day or year, and
Change internal organization corrective action reforms. Evidence in Model 1 supports the
positive relationship with New curriculum, but no other model is statistically significant. For my
sixth hypothesis, I posited that additional bureaucratic capacity would be associated with a
greater proportion of State takeovers and fewer Other reforms. Neither of these predictions were
supported in Model 11 and 12.
Despite the mixed findings related to my original hypotheses, there are more expansive
conclusions that can be pulled from the results. First, business associations appear to prefer quick
and clean accountability measures rather than complex and technical ones. In the corrective
action models, business contributions were positively associated with Replace staff and
negatively associated with New curriculums and Change internal organizations. The main
difference between these two sets of reforms is that staff replacement can be fairly quickly
executed–fire any low performing teachers–while developing New curriculums and Change
internal organizations could take significantly more time to plan and implement.
Second, teachers unions protect their own, seek to build classroom capacity, and oppose
realignment of systems. Unsurprisingly, unions are negatively associated with Replace staff
replacement. One of their main duties is to provide job security for their members. Part of this
negative effect may have to do with institutional power. Under the guidelines for implementing
Replace staff, localities are required to comply with all established state and local labor laws,
which could make it quite difficult for localities to force out teachers who are protected by tenure
and collective bargaining in some states. Union contributions are also positively associated with
New curriculums. For teachers, New curriculums provide an opportunity to build classroom

43
capacity, sharpen their skills, and help improve their pedagogical techniques. Unions may also be
looking to avoid other more difficult choices. Unions have a negative relationship with Change
internal organization, which is designed to shake up the day to day activities of students,
teachers, and principals. Perhaps, unions see this reform as useless and unhelpful or maybe as an
extra burden and a pain to implement. Unions are also positively associated with Other reforms
in restructuring. Unions may also be looking to shirk systematic and difficult change in
restructuring, or maybe they are avoiding the four remaining options because they are not
favorable to union interests.
Third, bureaucratic capacity is associated with only one reform. State funding’s positive
relationship with New curriculum reforms may reflect a stronger agency’s ability to aptly help
localities in implementation. Good SEAs would have the necessary resources and technical
expertise to help with this reform. Besides New curriculum, it is hard to draw any substantive
conclusions on the impact of bureaucratic capacity. One possibility is that state agencies are not
influential in this process. Although SEAs are suppose to help localities with technical support
systems and distribution of funding, it is possible that they are not at all helpful and are not
filling the role intended as a facilitator of federal policy. However, I think the more likely
explanation is that my measures of bureaucratic capacity are not capturing the mechanism
through which agencies influence localities. Although state funding and population density are
measures used in the education policy literature, more ideal measures would relate directly to
financial and staffing capacities of the agency (Berkman and Plutzer 2011) or the commitment of
leaders and agents to executing policy (Jochim and Murphy 2013). It would also be useful to
gather measures of “statewide system of support that provides technical assistance to schools

44
identified for improvement” (USDOE 2006), since this is the specific task that agencies were
given related to AYP implementation.
Implications
Bureaucratic capacity and interest group theories of policy-making tell a compelling
story, yet for this study, there is still much variation to explain that is not captured by these two
theories. At the beginning of this paper I asked: Are there state-level factors that influence the
types of reforms implemented in struggling schools? My evidence suggests that there are.
Overall, interest groups have a substantive impact on the policy process, but bureaucratic
capacity does not.
In looking at the real world impact of business associations and teachers unions, I found
that increased participation by these groups could result in changes in implementation at many
schools. I also found that teachers unions, in particular, have the resources available to contribute
significantly more politically, and perhaps, have an even more substantive impact. Yet,
bureaucratic capacity seemed to have no or a very small effect. Perhaps, bureaucratic capacity
does not influence local implementation of reforms.
Although I can not be certain, I believe that the measures of bureaucratic capacity were a
significant portion of the problem. Both state education funding as a percent of total education
and state population density are proxy measures for bureaucratic capacity. Despite their use in
the education policy and implementation literature, these types of studies would benefit from
greater access to state information. In the case of this project and future research in the area of
local implementation, basic measures of state funding for state agencies and staff numbers would
be a helpful start. These measures do not capture the entire story either, however. Measures of
state expertise and communication with localities would also be important. It is understandable

45
that not much research has been done using these types of variables, because of poor
transparency and reporting by agencies. Regardless, there is much work that can be done to
improve this type of study in education policy.
In addition, a more comprehensive study of local dynamics’ impact on local
implementation would be valuable. Despite SEAs’ requirements under NCLB to help and hold
localities accountable for reform, much of the heavy lifting in planning, debating, and executing
reforms happens at the local level. In this study, I was unable to easily find access to quantitative
local data that would prove useful. A focused qualitative study would, perhaps, be able to answer
some of the questions I was unable to. It would not only be interesting to examine how interest
groups and, especially, SEAs influence local reform, but also this type of study would give
policymakers a more nuanced understanding of what each of these reforms look like in practice.
Filling this hole in the NCLB literature would certainly be a valuable addition.
Even this study was at the mercy of accurate and thorough reporting of corrective action
reforms by states. Due to the vague language and poor enforcement by the U.S. Department of
Education, there is some variation in how states have reported their data on corrective action and
restructuring. There are also cases of omitted states due to NCLB waivers or poor state reporting.
This study was unable to account well for this other than to drop states from the analysis, and
future research would do well to dive into these omitted states further.
Although the numbers of schools impacted by state forces may seem substantively small,
there is an argument to be made that great focus should be put on these schools. At the
foundation of our American education system is the core belief that all children should have an
opportunity at a great education that will give them options to pursue their own version of
success. For students in schools under corrective action and restructuring, there is little chance of

46
attaining this goal. These struggling schools have failed to meet basic–and in some cases very
low–standards of academic achievement. These schools do not provide students with the same
opportunities as many of their peers in better performing schools, and policymakers should, as
they attempted in NCLB, seek to fix this inequity for students left in failing schools.
Even with good intentions to fix America’s worst schools, policymakers must not only
implement policy they believe will help, but also recognize the impact of internal and external
influences on its implementation. Leaders at all levels should be aware of these other actors–
teachers unions, business associations and SEAs–and their perspectives on policies. In this study,
it appears that the two most prominent education interest groups may have influenced how and
what localities implemented. This is not to say that any of these groups are particularly harmful
to students, but it is possible that these groups may not always best represent the needs of
students in the most vulnerable schools in America. In the end, leaders should be aware of the
actors in their policy environment and that to obtain desired policy outcomes, they must find
ways to navigate these interests.

47
References
Alt, James E. and Robert C. Lowry. 1994. Divided government, fiscal institutions, and budget
deficits: Evidence from the states. American Political Science Review 88:
811-828.
Barilleaux, Charles and Mark Miller. 1988. The political economy of state Medicaid policy. The
American Political Science Review 82 (4) 1089-1107.
Barilleaux, Charles and Paul Brace. 2007. Notes from the laboratories of democracy: State
government enactments of market- and state-based health insurance reforms in the 1990s.
Journal of Health Politics, Policy and Law 32 (4) 656-682.
Berkman, Michael and Erik Plutzer. 2010. Evolution, creationism, and the battle to control
America’s classrooms. Cambridge: Cambridge University Press.
Boyle, Andrea, Kerstin C. Le Floch, Susan Bowles Therriault, and Brian Holzman. 2009. State
support for school improvement: School-level perceptions of quality. Washington, D.C.:
American Institutes for Research.
Brimelow, Peter. 2003. The worm in the apple: How the teachers unions are destroying
American education. New York: Harper Collins.
Carey, Kevin. 2007. The Pangloss index: How states game the No Child Left Behind Act.
Washington, D.C.: Education Sector.
Center on Education Policy. 2007. Answering the question that matters most: Has student
achievement increased since No Child Left Behind? Washington, D.C.: Center on
Education Policy.

48
Center on Education Policy. 2009. Are achievement gaps closing and is achievement rising for
all? Washington, D.C.: Center on Education Policy.
Consolidated State Performance Report. 2006-2011. Washington, D.C.: Department of
Education.
Dee, Thomas S. and Brian Jacob. 2011. The impact of No Child Left Behind on student
achievement. Journal of Policy Analysis and Management 30 (3) 418-446.
GovTrack. 2014. No Child Left Behind Act of 2001. April.
https://www.govtrack.us/congress/bills/107/hr1 (April 15, 2014).
Follow The Money. 2014. Industry Influence.
http://www.followthemoney.org/database/IndustryTotals.phtml.
Foundation Center. 2014. 990 Finder. http://foundationcenter.org/findfunders/990finder/.
Fuller, Bruce, Joseph Wright, Kathryn Gesicki, and Erin Kang. 2007. Gauging growth: How to
judge No Child Left Behind. Educational Researcher 36 (5): 268-278.
Gottfired, Michael A., Brian M. Stecher, Matthew Hoover, and Amanda Brown Cross. 2011.
Federal and state roles and capacity for improving schools. Rand Education. Report.
Hannaway, Jane and Maggie Stanislawski. 2005. Flip-flops in school reform. In Urban School
Reform: Lessons from San Diego, ed. F Hess. Cambridge, MA: Harvard Education Press.
Hanushek, Eric A. and Margaret E. Raymond. 2004. The effects of school accountability systems
on the level and distribution of student achievement. Journal of the European Economic
Association (2) 406-415.
Hartney, Michael and Patrick Flavin. 2011. From the schoolhouse to the statehouse: Teacher
union political activism and U.S. state education reform policy. State Politics & Policy
Quarterly 11 (3): 251-268.
49
Hirsch, Barry T., David A. Macpherson and John V. Winters. 2013. Teacher salaries, state
collective bargaining laws, and union coverage. Prepared for American Economic
Association Meeting.
Illinois State Board of Education. 2013. Guidance to Districts with Schools in Corrective Action.
http://www.isbe.state.il.us/sos/pdf/guidance_CA.pdf (accessed December 18, 2013).
Jacobsen, Rebecca and Andrew Saultz. 2012. The Polls–Trends: Who should control education?
Public Opinion Quarterly 76 (2): 379-390.
Jochim, Ashley and Patrick Murphy. 2013. The capacity challenge: What it takes for state
education agencies to support school improvement. Center on Reinventing Public
Education.
Kahlenberg, Richard D. 2006. The history of collective bargaining among teachers. In Collective
Bargaining in Education: Negotiating change in today’s schools, ed. J Hannaway and A
Rotherham. Cambridge, MA: Harvard Education Press.
Klein, Joel. 2009. Reactions from an urban school superintendent. In Creating a new
teaching profession, ed. D Goldhaber and J Hannaway. Washington, D.C.: The Urban
Institute Press.
Kronholz, June. 2010. What’s happening in the states. In Stretching the school dollar, ed. F Hess
and E. Osberg. Cambridge, MA: Harvard Education Press.
Las Vegas and Sante Fe. 2012.The Floridian school of thought. The Economist, Feb 25.
Lee, Jaekyung. 2006. Tracking achievement gaps and assessing the impact of NCLB on the gaps.
Cambridge, MA: The Civil Rights Project at Harvard University.

50
Le Floch, Kerstin C., Felipe Martinex, Jennifer O’Day, Brian Stecher, James Taylor, and Andrea
Cook. 2007. State and local implementation of the No Child Left Behind Act.
Washington, D.C.: U.S. Department of Education.
Levi, Margaret, David Olson, Jon Agnone, and Devin Kelly. 2009. Union democracy
reexamined. Politics & Society 37 (2): 203-228.
Lieberman, Myron. 1997. The teacher unions: How the NEA and the AFT sabotage reforms and
hold students, parents, teachers, and taxpayers hostage to bureaucracy. New York:
Harper Collins.
Manna, Paul. 2004. Management, control, and the challenge of leaving no child behind.
Presented at the Annual Meeting of the Midwest Political Science Association, Chicago,
April.
Manna, Paul. 2006. Teachers unions and no child left behind. In Collective bargaining in
education: Negotiating change in today’s schools, ed. J Hannaway and A Rotherham.
Cambridge, MA: Harvard Education Press.
Manna, Paul. 2011. Collision course: Federal education policy meets state and local realities.
Washington, DC: CQ Press.
Manna, Paul and Laura L. Ryan. 2011. Competitive grants and educational federalism: President
Obama’s Race to the Top program in theory and practice. Publius: The Journal of
Federalism 41(3): 522-546.
Manna, Paul and Tim Harwood. 2011. Governance and educational expectations in the U.S.
states. State Politics & Policy Quarterly 11(4): 483-509.
Meier, Kenneth J. and Lawrence J. O’Toole, Jr. (2006). Bureaucracy in a democratic state: A
governance perspective. Baltimore: The Johns Hopkins University Press.

51
Michel, Lawrence and Richard Rothstein, eds. 2002. The class size debate. Washington, D.C.:
Economic Policy Institute.
Moe, Terry. 2006. Union power and the education of children. In Collective bargaining in
education: Negotiating change in today’s schools, ed. J Hannaway and A Rotherham.
Cambridge, MA: Harvard Education Press.
Moe, Terry. 2011. Special interest: Teachers unions and America’s public schools. Washington,
DC: Brookings Institution.
National Center for Education Statistics. 2014. Table Generator.
http://nces.ed.gov/ccd/elsi/default.aspx?agree=0.
National Governor’s Association. 2014. Former Governors’ Biographies.
http://www.nga.org/cms/FormerGovBios.
Ravitch, Diane. 2010. The death and life of the great American school system. New York: Basic
Books
Riddle, Wayne and Nancy Kober. 2012a. Accountability issues to watch under NCLB waivers.
Washington, DC: Center on Education Policy.
Riddle, Wayne and Nancy Kober. 2012b. What impact will NCLB waivers have on the
consistency, complexity, and transparency of state accountability systems? Washington,
DC: Center on Education Policy.
Timar, Thomas. 1997. The institutional role of state education departments: A historical
perspective. American Journal of Education 105 (3) 231-260.
The Council of State Governments. 2014. State Legislative Branch.
http://knowledgecenter.csg.org/kc/content/bos-2006-chapter-3-state-legislative-branch.

52
Sunderman, Gail L and Gary Orfield. 2007. Do states have the capacity to meet the NCLB
mandate? Phi Delta Kappan 89 (2): 137-139.
U.S. Census Bureau. 2014. Population Estimates. http://www.census.gov/popest/data/index.html
U.S. Department of Education. 2006. LEA and school improvement: Non-regulatory guidance.
Washington D.C.: Department of Education.
U.S. Department of Education. 2014. Elementary & secondary education: ESEA flexibility.
April. http://www2.ed.gov/policy/elsec/guid/esea-flexibility/index.html (April 15, 2014).
Weingarten, Randi. 2009. Reactions from a teachers union leader. In Creating a new teaching
profession, ed. D Goldhaber and J Hannaway. Washington, D.C.: The Urban Institute
Press.
West, Martin R. 2010. Overcoming the political barriers to change. In Stretching the school
dollar, ed. F Hess and E. Osberg. Cambridge, MA: Harvard Education Press.
Wilson, James Q. 1989. Bureaucracy: What government agencies do and why they do it. New
York: Basic Books.
Zuckerbrod, Nancy. 2007. School chiefs try to avoid the fourth ‘R’–Many face U.S. restructuring
order. Associated Press, July 9.

53
Appendix
Table 2. List of state affiliates from national labor organizationsA. NEA state affiliates Alabama Education Association
Arizona Education Association
Arkansas Education Association
California Teachers Association
Colorado Education Association
Connecticut Education Association
Delaware State Education Association
Education Minnesota
Florida Education Association
Georgia Association of Educators
Hawaii State Teachers Association
Idaho Education Association
Illinois Education Association
Indiana State Teachers Association
Iowa State Education Association
Kansas National Education Association
Kentucky Education Association
Louisiana Association of Educators
Maine Education Association
Maryland State Education Association
Massachusetts Teachers Association
Mea-Mft
Michigan Education Association
Mississippi Association of Educators
Missouri National Education Association
National Education Association of New Mexico
National Education Association Rhode Island
NEA-Alaska
NEA-New Hampshire
Nebraska State Education Association
Nevada State Education Association
New Jersey Education Association
North Carolina Association of Educators
North Dakota Education Association
Ohio Education Association
Oklahoma Education Association
Oregon Education Association
Pennsylvania State Education Association
South Carolina Education Association
South Dakota Education Association
Tennessee Education Association
Texas State Teachers Association
Utah Education Association
Vermont-NEA
Virginia Education Association
Washington Education Association
West Virginia Education Association
Wisconsin Education Association Council
Wyoming Education Association
B. AFT state affiliates AFT Connecticut
AFT Kansas
AFT Massachusetts
AFT Michigan
AFT Mississippi
AFT Missouri AFL-CIO
AFT New Mexico
AFT Pennsylvania
AFT Washington
AFT-NH
AFT-Oklahoma
American Federation of Teachers Utah
American Federation of Teachers-Maryland
Arizona Federation of Teachers Unions
California Federation of Teachers
Colorado Classified School Employees Association
Georgia Federation of Teachers
Illinois Federation of Teachers
Indiana Federation of Teachers
Louisiana Federation of Teachers
Minnesota Federation of Teachers
New Jersey State Federation of Teachers
New York State United Teachers
Ohio Federation of Teachers
Oregon AFT
Rhode Island Federation of Teachers & Health
Professionals Texas AFT
The Federation
United Professionals of Vermont
Washington Teachers Union
West Virginia AFT
Wisconsin AFT
C. NAESP state affiliates Alabama Association of Elementary School
Administrators
Alaska Association of Elementary School Principals
Arizona School Administrators
Arkansas Association of Elementary School Principals
Association of California School Administrators
Association of Washington School Principals
Association of Wisconsin School Administrators, Inc.
Colorado Association of School Executives
Confederation of Oregon School Administrators

2
Connecticut Association of Schools
Delaware Association of School Principals
District of Columbia Association of Elementary School
Principals
Florida Association of Elementary and Middle School
Principals
Georgia Association of Elementary School Principals
Hawaii Elementary and Middle School Administrators
Association
Idaho Association of Elementary School Principals
Illinois Principals Association
Indiana Association of School Principals
Kansas Association of Elementary School Principals
Kentucky Association of Elementary School Principals
Louisiana Association of Principals
Maine Principals' Association
Maryland Association of Elementary School Principals
Massachusetts Elementary School Principals' Association
Michigan Elementary & Middle School Principals
Association
Minnesota Elementary School Principals' Association
Mississippi Association of School Administrators Inc. Missouri Association of Elementary School Principals
Montana Association of Elementary & Middle School
Principals
Nebraska Association of Elementary School Principals
Nevada Association of Elementary School Principals
New Hampshire Association of School Principals
New Jersey Principals and Supervisors Association
New Mexico Association of Elementary School Principals
North Carolina Principals & Assistant Principals
Association
North Dakota Association of Elementary School Principals
Ohio Association of Elementary School Administrators
Oklahoma Association of Elementary School Principals
Pennsylvania Association of Elementary & Secondary
School Principals
Rhode Island Association of School Principals
School Administrators Association of New York State
School Administrators of Iowa
South Carolina Association of School Administrators
South Dakota Association of Elementary School Principals
Tennessee Principals Association
Texas Elementary Principals and Supervisors Association
Utah Association of Elementary School Principals
Vermont Principals’ Association
Virginia Association of Elementary School Principals
West Virginia Association of Elementary & Middle
School Principals
Wyoming Association of Elementary & Middle School
Principals
D. NAASP state affiliates Affiliated Georgia School Leaders
Alaska Association of Secondary School Principals
Arkansas Association of Secondary School Principals
Council for Leaders in Alabama Schools
Delaware Association of School Administrators
Florida Association of School Administrators Foundation
Hawaii Association of Secondary School Administrators
Idaho Association of School Administrators
Kansas Association of Secondary School Principals
Kentucky Association of Secondary School Principals
Maryland Association of Secondary School Principals
Massachusetts Secondary School Administrators'
Association
Michigan Association of Secondary School Principals
Minnesota Association of Secondary School Principals
Mississippi Association of Secondary School Principals
Missouri Association of Secondary School Principals
Nebraska Council of School Administrators
New Mexico Association of Secondary School Principals
North Dakota Council of Educational Leaders
Ohio Association of Secondary School Administrators
Oklahoma Association of Secondary School Principals
School Administrators of Montana
Secondary School Principals Association of Nevada
South Carolina Association of Secondary School
Administrators
South Dakota Association of Secondary School Principals
Tennessee Association of Secondary School Principals
Texas Association of Secondary School Principals
Utah Association of Secondary School Principals
Virginia Association of Secondary School Principals
West Virginia Association of Secondary School Principals
Wyoming Association of Secondary School Principals
E. AASA state affiliates Alaska Association of School Administrators
Arkansas Association of Educational Administrators
Buckeye Association of School Administrators
Connecticut Association of Public School Superintendents
Florida Association of District School Superintendents
Georgia School Superintendent Association
Illinois Association of School Administrators
Indiana Association of Public School Superintendents
Foundation
Kentucky Association of School Administrators
Louisiana Association of School Executives
Maine School Superintendents Association
Massachusetts Association of School Superintendents
Michigan Association of School Administrators
Minnesota Association of School Administrators
Missouri Association of School Administrators
Montana Association of School Superintendents
Nevada Association of School Administrators
New Hampshire School Administrators Association

3
New Jersey Association of School Administrators
New Mexico Coalition of Educational Leaders
New York State Council of School Superintendents
North Carolina Association of School Administrators
North Dakota Association of School Administrators
Oklahoma Association of School Administrators
Pennsylvania Association of School Administrators
Public School Superintendents Association of Maryland
Rhode Island School Superintendents Association
School Administrators of South Dakota
School Superintendents of Alabama
Tennessee Organization of School Superintendents
Texas Association of School Administrators
United School Administrators of Kansas
Utah School Superintendents Association
Vermont Superintendents Association
Virginia Association of School Superintendents
Washington Association of School Administrators
West Virginia Association of School Administrators
Wisconsin Association of School District Administrators
Wyoming Association of School Administrators
F. NSBA state affiliates Arizona School Boards Association
Arkansas School Boards Association
Associated School Boards of South Dakota
Association of Alaska School Boards
California School Boards Association
Colorado Association of School Boards
Delaware School Boards Association
Florida School Boards Association
Georgia School Boards Association
Idaho School Boards Association
Illinois Association of School Boards
Indiana School Boards Indiana School Boards Association
Iowa Association of School Boards
Kansas Association of School Boards
Kentucky School Boards Association
Louisiana School Boards Association
Maine School Boards Association
Maryland Association of Boards of Education
Massachusetts Association of School Committees
Michigan Association of School Boards
Minnesota School Boards Association
Mississippi School Boards Association
Missouri School Boards' Association
Montana School Boards Association
Nebraska Association of School Boards
Nevada Association of School Boards
New Hampshire School Boards Association
New Jersey School Boards Association
New Mexico School Boards Association
New York State School Boards Association
North Carolina School Boards Association
North Dakota School Boards Association
Ohio School Boards Association
Oklahoma State School Boards Association
Oregon School Boards Association
Pennsylvania School Boards Association
Rhode Island Association of School Committees
South Carolina School Boards Association
Tennessee School Boards Association
Texas Association of School Boards
Utah School Boards Association
Vermont School Boards Association
Virginia School Boards Association
Washington State School Directors’ Association
West Virginia School Boards Association
Wisconsin Association of School Boards
Wyoming School Boards Association

Note: Data collected from individual national affiliate websites, listed below. Searched in Foundation Center IRS
990 form search by group name and state from 2009 to 2011. Not every state has an affiliate associated with each
organization. In the combined measures, omitted was treated as $0. Websites include:
http://www.nea.org/home/49809.htm, http://www.aft.org/local/localsites.cfm, http://www.naesp.org/naesps-state-
affiliates, https://www.nassp.org/Content.aspx?topic=52284, http://www.aasa.org/stateexecsroster.aspx?id=3706,
http://www.nsba.org/Services/StateAssociations/Regions.pdf


![Failing Schools[1]](https://static.fdocuments.net/doc/165x107/577d2db41a28ab4e1eae1fd8/failing-schools1.jpg)