Fixed Income & Economics Daily · Strictly Macro, March 28, 2018 3 discipline and (ii) system...
27
IMPORTANT DISCLOSURES/CERTIFICATIONS ARE IN THE “IMPORTANT DISCLOSURES” SECTION OF THIS REPORT. U.S. investors’ inquiries should be directed to Santander Investment at (212) 350-0707. * Employed by a non-US affiliate of Santander Investment Securities Inc. and is not registered/qualified as a research analyst under FINRA rules. LATIN AMERICA MACRO STRATEGY RESEARCH Strictly Macro Synchronized Growth & Politics March 28, 2018 Macro Overview: Synchronized growth at last The Latin America region appears well positioned, in our view, to weather external shocks coming from a faster increase in core interest rates, global trade disruption due to far-reaching U.S. protectionism, and a weaker China, with a corresponding toll on commodities. Our confidence is rooted, first, in steadier macro fundamentals, highlighted by solid economic growth. We expect the Brazilian economy—accounting for the lion’s share of total output in our seven-country universe, at 43%—to outperform by growing in excess of 3% this year, faster than both its potential rate (about 2%) and its average pace since 2000 (2.5%). Indeed, we expect all countries (except Colombia) to deliver GDP growth above or close to potential rates. Moreover, the upbeat outlook we see for the region coincides with two key influences, in our view: (i) a synchronized world expansion for the first time since the global financial crisis (featuring global trade increasing 4.5%, its fastest pace since 2010); and (ii) muted local inflation, both of which improve the prospects for a sustainable expansion. In our view, another supportive element for the region as a whole is improving funding dynamics, albeit from elevated levels. Thus, the systemic risk alarm, which sounds when countries run swelling deficit positions in both current account and public sector balances, looks likely to be muted, in our opinion. For all countries except Argentina, we expect lower CA deficits compared to their average balances since 2008. Mexico, although under FDI stress due to NAFTA uncertainty, has been surprisingly resilient. Regarding public gaps, we expect all governments (except Peru) to maintain their fiscal consolidation efforts. Local assets have performed relatively well despite pressures from the big selloff in U.S. rates, global equity stresses (volatility spike), and some tough trade actions (such as sovereign risk; see middle chart next page). Capital inflows are still linked to investors’ expectations of gradual hikes by G-3 central banks and steady USD, which has indeed been highly supportive for risky assets. Our G-10 strategy team confirmed their long-held view that the Fed will deliver three hikes this year, followed by a similar dose in 2019. They expect 10-year Treasury yields to close at 3.25%, while euro rates should replicate about half of the overall U.S. rate increase, with the correlation to gain steam by end-2018. But even if the Fed hikes rates to around 3% (neutral), this is lower than the 5.25% at the end of the 2005-06 hiking cycle. On the negative side, a full scale U.S.-China trade dispute would put significant stress on the region’s outlook, in our view, given LatAm’s significant dependence on demand from the U.S. (mainly for Mexico) and China (rest of countries). Overall, we believe these two global tail risks could run in parallel with the idiosyncratic risk catalysts for the year: presidential elections in Colombia, Mexico, and Brazil, along with stabilization of inflation in Argentina. Rodrigo Park* Economist, Argentina [email protected] (54)11 4341-1080 Mauricio Molan* Economist, Brazil [email protected] (55) 11 3012-5724 Juan Pablo Cabrera* Economist, Chile [email protected] (56) 2 2320-3778 Diana Ayala Economist, Colombia [email protected] 1 (212) 407-0979 Pedro Balcao* Economist, Mexico [email protected] (52) 55 5269-2264 Tatiana Pinheiro* Economist, Peru [email protected] (55) 11 3012-5179 Marcela Bensión* Economist, Uruguay [email protected] (59) 8 1747-6905 David Franco* Macro, Rates & FX Strategy [email protected] (44) 207 756-6633 TABLE OF CONTENTS Macro Overview……………………………………………………………………………………………………………………….…1 ARGENTINA: Policy Trade-Offs Becoming More Apparent…………………………………………………...…….…………….... 6 BRAZIL: In a Sweet Spot for Now ............................................................................................................................................ 9 CHILE: Positive Growth Sentiment Starts to Materialize …………………………………………………………......................... 12 COLOMBIA: Presidential Elections on the Near Horizon …………………………………………………………….................... 15 MEXICO: 2018 Elections Uncertainty and Financial Volatility? 18 PERU: A Better Future?…………………………………………………………………………………………............................. .. 21 URUGUAY: The Plus Side of a Cheap Dollar ….…………………………………………………………………………………… 24
Transcript of Fixed Income & Economics Daily · Strictly Macro, March 28, 2018 3 discipline and (ii) system...

IMPORTANT DISCLOSURES/CERTIFICATIONS ARE IN THE “IMPORTANT DISCLOSURES” SECTION OF THIS REPORT.
U.S. investors’ inquiries should be directed to Santander Investment at (212) 350-0707. * Employed by a non-US affiliate of Santander Investment Securities Inc. and is not registered/qualified as a research analyst under FINRA rules.
LATIN AMERICA
MACRO STRATEGY RESEARCH
Strictly Macro Synchronized Growth & Politics March 28, 2018
Macro Overview: Synchronized growth at last
The Latin America region appears well positioned, in our view, to weather external shocks coming from a faster increase in core interest rates, global trade disruption due to far-reaching U.S. protectionism, and a weaker China, with a corresponding toll on commodities. Our confidence is rooted, first, in steadier macro fundamentals, highlighted by solid economic growth. We expect the Brazilian economy—accounting for the lion’s share of total output in our seven-country universe, at 43%—to outperform by growing in excess of 3% this year, faster than both its potential rate (about 2%) and its average pace since 2000 (2.5%). Indeed, we expect all countries (except Colombia) to deliver GDP growth above or close to potential rates. Moreover, the upbeat outlook we see for the region coincides with two key influences, in our view: (i) a synchronized world expansion for the first time since the global financial crisis (featuring global trade increasing 4.5%, its fastest pace since 2010); and (ii) muted local inflation, both of which improve the prospects for a sustainable expansion. In our view, another supportive element for the region as a whole is improving funding dynamics, albeit from elevated levels. Thus, the systemic risk alarm, which sounds when countries run swelling deficit positions in both current account and public sector balances, looks likely to be muted, in our opinion. For all countries except Argentina, we expect lower CA deficits compared to their average balances since 2008. Mexico, although under FDI stress due to NAFTA uncertainty, has been surprisingly resilient. Regarding public gaps, we expect all governments (except Peru) to maintain their fiscal consolidation efforts.
Local assets have performed relatively well despite pressures from the big selloff in U.S. rates, global equity stresses (volatility spike), and some tough trade actions (such as sovereign risk; see middle chart next page). Capital inflows are still linked to investors’ expectations of gradual hikes by G-3 central banks and steady USD, which has indeed been highly supportive for risky assets. Our G-10 strategy team confirmed their long-held view that the Fed will deliver three hikes this year, followed by a similar dose in 2019. They expect 10-year Treasury yields to close at 3.25%, while euro rates should replicate about half of the overall U.S. rate increase, with the correlation to gain steam by end-2018. But even if the Fed hikes rates to around 3% (neutral), this is lower than the 5.25% at the end of the 2005-06 hiking cycle. On the negative side, a full scale U.S.-China trade dispute would put significant stress on the region’s outlook, in our view, given LatAm’s significant dependence on demand from the U.S. (mainly for Mexico) and China (rest of countries). Overall, we believe these two global tail risks could run in parallel with the idiosyncratic risk catalysts for the year: presidential elections in Colombia, Mexico, and Brazil, along with stabilization of inflation in Argentina.
Rodrigo Park* Economist, Argentina
[email protected] (54)11 4341-1080
Mauricio Molan* Economist, Brazil
[email protected] (55) 11 3012-5724
Juan Pablo Cabrera* Economist, Chile
[email protected] (56) 2 2320-3778
Diana Ayala Economist, Colombia
1 (212) 407-0979
Pedro Balcao* Economist, Mexico
[email protected] (52) 55 5269-2264
Tatiana Pinheiro* Economist, Peru
[email protected] (55) 11 3012-5179
Marcela Bensión* Economist, Uruguay
(59) 8 1747-6905
David Franco* Macro, Rates & FX Strategy
(44) 207 756-6633
TABLE OF CONTENTS Macro Overview……………………………………………………………………………………………………………………….…1 ARGENTINA: Policy Trade-Offs Becoming More Apparent…………………………………………………...…….…………….... 6 BRAZIL: In a Sweet Spot for Now ............................................................................................................................................ 9 CHILE: Positive Growth Sentiment Starts to Materialize …………………………………………………………......................... 12 COLOMBIA: Presidential Elections on the Near Horizon …………………………………………………………….................... 15 MEXICO: 2018 Elections Uncertainty and Financial Volatility? 18 PERU: A Better Future?…………………………………………………………………………………………............................. .. 21 URUGUAY: The Plus Side of a Cheap Dollar ….…………………………………………………………………………………… 24

Strictly Macro, March 28, 2018 2
Presidential elections and policy risks
A significant threat—or boost—to assets in Brazil, Mexico, and Colombia could stem from the election outcomes. Same-year elections may be the only concurrence, since all other key elements diverge substantially, so understanding the context in each country is important. In Brazil, the new government will face challenging budget constraints, and we believe broad constitutional fiscal reform is the best way to fully stabilize the public sector deficit at around 3% of GDP. We believe the public spending cap is at risk of being breached next year without fiscal adjustments (Congress is more likely to move the fiscal agenda soon after the elections), due to lower inflation and still fast-growing pension liabilities. In our view, comprehensive fiscal reform should include a new tax code, new ceilings on civil servants’ salaries, further privatizations, and oil exploration rights, in addition to the new social security (pensions) bill. A stronger ruling alliance (center-right or center-left) between the new president and Congress will be needed to pass broad fiscal reform, in our view. Currently, centrist parties controlling the largest cities have the greatest vote momentum and could determine the election’s outcome, in our opinion. Voters’ political identification (most respondents are pro-centrist) and voters’ demands (security, jobs, and fighting corruption) also favor a centrist formula, in our view. Our assessment is that the level of political risk premia embedded in Brazilian assets as of today is limited.
Sovereign risk: strengths counterbalance political and external shocks
Sources: Bloomberg and Santander.
There is plenty at stake in the Mexican elections, not only in terms of offices to be voted on (the largest in history) but also because of the potential election of a leftist president. Andres Manuel Lopez Obrador (better known as AMLO) has consolidated a +10-p.p. lead as of this writing, benefiting from an early start to the race (as a third-time presidential candidate with +95% recognition) and an effective pre-campaign. The official campaigns begin on March 30, allowing plenty of time for things to change before the elections on July 1. The following will be the critical factors, in our view: (i) strategic voting, with key factors being the role of the independent candidate (5% of votes), undecided voters (30%), and fragmentation (a two-way race or three-way race); (ii) the youth vote (+30% of registered voters); (iii) turnout (averaged 62% in the last three elections); (iv) information (social media); and (v) the potential for new corruption scandals. Fighting corruption is the top demand from voters by far, but other key issues include structural reforms (mainly energy and education) and the new Mexico City airport. Successful oil biddings since 2015 (+70% profitable average government take plus USD 200bn in committed FDI) are highly unlikely to be reversed, in our view, under the new government. We believe party alliances will also play a key role when defining the new Congress, which has worked as an effective power counterweight since 1997. We note that constitutional changes require a two thirds majority and the support of 51% of states. High polarization means a new president could be elected with only about one-third of votes. Meanwhile, in sharp contrast to Brazil, we believe local assets have already incorporated a decent level of political risk premium, and market pricing is also consistent with (i) limited room to deviate from persistent macro
Brazil: Gross debt on the rise
Source: BCB
Mexico: AMLO in the lead
Source: Poll of polls Oraculus.mx as of March 27, 2018.
Colombia: Ivan Duque with a substantial lead
Sources: Alianza de Medios/YanHass, Invamer, CNC, and
EcoAnalitica.
45.0
50.0
55.0
60.0
65.0
70.0
75.0
80.0
(% GDP)
40.1
27.7
22.5
5.4
0
5
10
15
20
25
30
35
40
45
AMLO Ricardo Anaya Jose AntonioMeade
MargaritaZavala
(%)
41
25
11
6
0
10
20
30
40
50
Ivan Duque Gustavo Petro Sergio Fajardo German Vargas
(%)
La Gran Encuesta / YanHaas InvamerCNC EcoAnaliticaAverage

Strictly Macro, March 28, 2018 3
discipline and (ii) system anchors in place: Banxico’s independence and tight stance, fiscal consolidation, oil hedges, and stabilization funds.
For Colombia, the political risks associated with the presidential elections have diminished somewhat, in our view, since the legislative elections on March 11. This is partly because we believe the composition of Congress, with right and center-right parties together still holding a majority, should ensure continuation of the country’s macroeconomic and fiscal policy framework, regardless of the outcome of the presidential election. Moreover, in the most recent polls the center-right coalition candidate, Ivan Duque, has strengthened his support and holds a comfortable lead (+16 ppts) vs. the runner-up, the leftist candidate Gustavo Petro. Nonetheless, whoever wins will face important issues, including the challenges of fiscal consolidation and debt stabilization, promotion of sustainable growth, and polarized views on the peace agreement.
Key facts about upcoming elections
Brazil
Colombia
Mexico
Key Dates
Campaign Period August 16 – October 6 January 27 – May 26 March 30 – June 27
Election Dates First round: October 7
Run-off: October 28
First Round: May 27
Run-off: June 17
July 1
(no second round)
New Government Takes Office
January 1, 2019 August 7, 2018 December 1, 2018
Other Key Dates Debates: Apr 22, May 20, Jun 12
Preliminary results (fast count): Jul 1st at 11pm (Mex city time)
Elections General Presidential General
Number of Offices President, state governors, 100% of the Lower House, 2/3 of Senate, state assemblies
President +1,800 offices will be elected, including: President, Congress, 9 state governors
Key Drivers Corruption, public security, employment
Corruption, peace agreement, security, Venezuela, employment
Corruption
Term President and governor: 4 years, one reelection allowed
Deputies: 4 years, indefinite reelections
Senators: 8 years, indefinite reelections
President: 4 years, no reelection
President: 6 years, no reelection
Deputies: 3 years , reelection
Senators 6 years, reelection
Leading Candidate Lula: 37% Ivan Duque: 41% AMLO 40%
Datafolha, January 30 Average of the YanHaas, CNC, EcoAnalitica, and Invamer March polls results (March 20 -26)
Poll of Polls, oraculus.mx , March 27
Source Santander.
David Franco* Macro, Rates & FX Strategy
(44) 207 756-6633
Diana Ayala Macro, Rates & FX Strategy [email protected]
1 (212) 407-0979

Strictly Macro, March 28, 2018 4
FORECAST SUMMARY TABLES
KEY MACRO INDICATORS
GDP growth 2016 2017 1Q18 2Q18 3Q18 4Q18 2018F 2019F Last Review ‘18 Nom GDP ’18
Argentina -1.8 2.9 3.5 2.8 2.7 3.1 3.0 3.5 Down 612
Brazil -3.6 1.0 2.6 2.9 3.4 3.8 3.2 3.2 Up 2,055
Chile 1.6 1.6 4.4 3.0 3.1 3.4 3.5 3.5 Up 303
Colombia 2.0 1.8 2.2 2.1 2.6 2.9 2.5 3.0 Unchanged 334
Mexico 2.9 2.0 1.3 2.8 2.7 2.9 2.4 2.5 Down 1,207
Peru 4.0 2.5 2.5 3.0 3.5 4.5 3.5 4.0 Down 219
Uruguay 1.5 3.1 2.0 4.0 4.5 3.1 3.4 2.7 Up 66
LatAm-7 -0.3 1.7 2.4 2.8 3.0 3.4 2.9 3.1 1,282
In %. Year-on-year basis. Nominal GDP in US$ billions. LatAm 7: Nominal GDP-PPP Weighted Sources: IMF, National central banks, finance ministries, and Santander.
GDP Priv Cons Pub Cons Investment Exports Imports
Components ‘16 ‘17 ‘18F ‘16 ‘17 ‘18F ‘16 ‘17 ‘18F ‘16 ‘17 ‘18F ‘16 ‘17 ‘18F
Argentina -1.0 3.6 3.1 0.3 2.0 1.5 -4.9 11.3 11.2 5.3 0.4 4.0 5.7 14.7 8.7
Brazil -4.3 1.0 4.7 -0.1 -0.6 0.2 -10.3 -1.8 7.0 1.9 5.2 3.3 -10.2 5.0 9.2
Chile 2.4 2.6 3.5 5.1 3.2 3.5 -0.8 -2.0 4.5 -0.1 0.0 4.9 -1.6 5.5 7.4
Colombia 1.5 1.7 2.1 2.4 4.0 2.8 -2.7 0.1 0.9 -1.2 -0.6 5.4 -7.3 0.2 1.3
Mexico 3.7 3.0 2.8 2.4 0.1 2.0 1.1 -1.5 0.2 3.5 3.8 6.8 2.9 6.4 6.5
Peru 3.3 2.5 3.0 -0.5 1.6 2.0 -3.9 -2.3 2.0 9.5 8.5 6.5 -2.2 4.0 4.0
Uruguay 0.7 3.9 2.7 1.6 0.2 1.6 0.7 -5.3 3.3 -1.4 7.5 5.0 -2.9 2.5 2.5
LatAm-7 -0.3 2.1 3.6 1.2 0.6 1.4 -4.8 -0.2 4.5 2.7 3.7 4.9 -3.4 6.0 7.2
Annual changes in %. na: Not available. LatAm 7: Nominal GDP-PPP Weighted Sources: IMF, National central banks, finance ministries, and Santander.
Inflation Headline CPI (YoY) Core measure
2016* 2017* Mar-18F Apr-18F May-18F 2018F* 2019F* 2017 2018F 2019F
Argentina 37.7 24.8 25.0 23.9 23.9 18.0 14.0 21.1 14.0 11.0
Brazil 6.3 2.9 2.8 3.0 3.0 3.5 4.0 3.9 3.1 4.0
Chile 2.7 2.2 1.9 1.8 1.9 2.6 2.9 1.9 2.2 2.7
Colombia 5.8 4.1 3.4 3.3 3.4 3.4 3.2 5.0 3.8 3.5
Mexico 3.3 6.8 5.1 4.9 4.8 4.2 3.6 4.9 4.0 3.5
Peru 3.2 1.4 1.0 1.2 1.1 2.5 2.5 1.5 2.5 2.5
Uruguay 8.1 6.6 6.9 7.0 7.1 7.0 6.8 8.2 6.7 6.6
LatAm-7 8.5 6.5 5.9 5.8 5.8 5.2 4.8 6.0 4.6 4.5
*Year-end levels, YoY. Core measure as per national definitions. LatAm7: Nominal GDP-PPP Weighted Sources: Sources: IMF, National central banks, finance ministries, and Santander.
Macro Miscellanea ARS BRL CLP COP MXN PEN UYU
Fiscal balance % of GDP 2016 -5.9 -9.0 -2.7 -4.0 -2.6 -2.3 -3.9
2017 -6.1 -7.8 -2.8 -3.6 -1.1 -3.0 -3.4
2018F -5.4 -5.7 -2.0 -3.1 -2.0 -3.6 -3.2
2019F -4.0 -5.2 -1.8 -2.2 -2.0 -3.0 -3.2
Public debt % of GDP 2016 26.7 46.2 9.3 44.0 48.7 23.8 30.9
(Net terms in ARS, BRL, CLP) 2017 26.6 51.6 14.4 45.0 46.2 24.8 27.3
2018F 28.0 57.9 15.7 45.0 46.1 27.0 23.5
2019F 29.5 62.8 16.8 44.0 46.0 28.0 20.7
Current account % of GDP 2016 -2.4 -1.3 -1.4 -4.3 -2.1 -2.7 -0.1
2017 -5.0 -0.5 -1.2 -3.3 -1.6 -1.3 2.5
2018F -5.3 -0.8 -1.3 -3.0 -1.6 -2.0 1.9
2019F -4.7 -1.0 -1.6 -3.0 -1.5 -2.5 1.2
Trade balance US$ bn 2016 1.9 47.7 5.3 -9.2 -13.1 1.9 1.1
2017 -8.5 67.0 6.9 -4.8 -10.9 5.6 2.7
2018F -12.7 55.5 5.6 -3.3 -11.9 2.0 2.6
2019F -8.4 54.5 3.4 -3.5 -12.5 2.0 2.2
Unemployment % of workforce 2016 7.5 12.0 6.5 8.2 3.9 6.7 7.8
2017 7.2 11.8 6.7 8.6 3.4 6.9 7.9
2018F 6.8 10.8 6.6 8.0 3.2 6.0 8.2
2019F 6.4 9.0 6.5 7.5 3.2 6.0 7.8
Source: Santander.

Strictly Macro, March 28, 2018 5
MONETARY POLICY MONITOR
Central bank reference interest rates. Levels in %, monthly changes in bps. Sources: Central banks and Santander.
Easing cycle in Brazil has been extended: In Brazil, the BCB surprised the market with a more dovish stand in its March communique. As a result, our economists now expect the BCB will deliver an additional 25-bp cut in May, before ending the easing cycle that began in 4Q16, and they anticipate that the board will remain on hold at 6.25% until 2H19.
Easing cycle expected to begin in Argentina: In Argentina, our economists expect the Central Bank to start a gradual easing cycle in 2Q18, as inflationary pressures moderate. While they expect inflation to fall, they see it ending above the new inflation target, thus leaving limited space for the MPC to ease.
One more hike in Mexico: Banxico delivered a 25-bp hike in February, as expected, yet left the door open for additional hikes as it considers that the risks to inflation remain to the upside, with FX depreciation among the most important. Our economics team expects volatility in the MXN closer to the elections and now sees Banxico hiking one more time in May.
Low interest rates in the Andeans: In Colombia, BanRep has signaled the end of the easing cycle, and we expect it to remain on hold at 4.50% for the rest of the year. We believe Peru ended its easing cycle in March, and we expect the BCRP to remain on hold until 4Q18. In Chile our economists expect the BCCh to remain on hold for most of the year, as the output gap gradually closes and inflation normalizes.
FOREIGN EXCHANGE RATES
BRL MXN CLP COP ARS PEN UYU
Mar-18* 3.31 18.5 608 2841 20.2 3.23 28.3
Jun-18 3.40 20.0 640 2950 20.6 3.32 29.2
Sep-18 3.50 18.4 645 2850 21.3 3.36 29.9
Dec-18 3.50 18.2 645 2900 22.0 3.40 30.5
Mar-19 3.52 18.3 650 2950 22.6 3.44 31.0
Jun-19 3.55 18.5 650 2900 23.2 3.49 31.4
Sep-19 3.57 18.6 650 2900 23.9 3.53 31.9
Dec-19 3.57 18.8 650 3000 24.5 3.57 32.4
End-of-period levels. * March 23 2018 Sources: Bloomberg and Santander.
Year-to-date, LatAm currencies—with the exception of the Argentinean peso—have appreciated, supported in part by higher commodities prices and a weak USD. Political noise, a stronger USD on the back of higher U.S. rates, and the risk of a trade war between the U.S. and China could put pressure on the currencies. Across the region we see moderate weakening by end-2018, with the exception of Mexico.
The BRL is a high-beta currency, and we believe that a lower yield premium and political uncertainty would continue to lead to slower inflows and thus a weaker BRL. In Mexico, the peso may experience some short- term pressure associated with the general elections. In Argentina, we expect peso depreciation to be contained as a result of the Central Bank’s intervention. We believe that in Colombia the electoral process could put some pressure on the COP in the coming months, although high oil prices should work in its favor. In Chile, the CLP looks expensive vs. local fundamentals (growth, exports, interest rates, public finance), so we expect a downward correction in the coming quarters.
Mar-18 Jun-18 Sep-18 Dec-18 Mar-19 Jun-19 Sep-19 Dec-19
ARGENTINA 27.25 27.25 25.00 23.00 21.00 20.00 18.50 17.00 15.00
0 -225 -200 -200 -100 -150 -150 -200
BRAZIL 6.50 6.50 6.25 6.25 6.25 6.25 6.25 7.50 8.50
0 -25 0 0 0 0 125 100
CHILE 2.50 2.50 2.50 2.50 2.75 3.00 3.25 3.75 3.75
0 0 0 25 25 25 50 0
COLOMBIA 4.50 4.50 4.50 4.50 4.50 4.75 5.25 5.25 5.25
0 0 0 0 25 25 0 0
MEXICO 7.50 7.50 7.75 7.75 7.50 7.00 6.75 6.50 6.50
0 25 0 -25 -50 -25 -25 0
PERU 2.75 2.75 2.75 2.75 3.00 3.25 3.50 3.75 3.75
0 0 0 25 25 25 25 0
Current

Strictly Macro, March 28, 2018 6
ARGENTINA
POLICY TRADE-OFFS BECOMING MORE APPARENT
Activity expansion expected to decelerate mildly in the coming months due to falling agricultural production and a slower pace of disinflation.
Higher than expected inflation due to impact of regulated price hikes leaves little room for further repo rate cuts at the coming meetings.
Heightened FX volatility is delaying the disinflationary process, in our view, prompting the Central Bank to sell USD.
Primary deficit targets look easier to meet, in our view; beginning-of-the-year data suggest strong effort to reduce economic subsidies.
Rodrigo Park*
(5411) 4341-1080
Martin Mansur *
(5411) 4341-1096
Cristian Cancela*
(5411) 4341-1383
Slower growth at the margin due to drought
For 2018 we expect GDP expansion approximately in-line with last year. In 2017 activity grew 2.8%, slightly below our forecast (3%). For this year we initially expected 3.5% GDP expansion, but mainly owing to the persistent drought that affected core agricultural areas, we have revised that down to 3.0%. We believe that in 2018 activity expansion will depend largely on grain production, whose estimates are being constantly revised downward.
The most recent estimates from the Rosario Stock Exchange have reduced forecasts for the soybean and corn grain harvest by 25 million tons to 102 MT, a decline of 16% y/y. According to our estimates, this will translate into a 0.4 p.p. reduction in GDP growth, which will be felt mostly starting in 2Q18. On the demand side, we think the recent increase in international benchmark interest rates (10-yr UST trading at 2.86% on average during the last 30 days until March 19, up from 2.20% in August) will likely result in a slightly slower pace of investment expansion, which we lowered to +11.2% from the previous +12.6% estimate for 2018. Finally, consumption may also be marginally dented by higher inflation than originally expected. Although we expect wage growth to surpass inflation, we project real salaries to expand 1.5%, 0.5 p.p. below our previous forecast. Changing the inflation target, rising inflation expectations
Inflation continues to be one of the government’s main concerns, as controlling it is proving harder than initially expected. After adjusting for the impact of policy changes introduced in 2017 and fine-tuning the relation among different macro variables, at year-end 2017 the government increased its inflation targets for 2018 (to 15% from 10%) and 2019 (to 10% from 5%). Although these targets are upward revisions, meeting them remains a challenge. The modification of the inflation targets, however, anticipated a looser monetary policy stance, resulting in continued FX weakness and heightened volatility. Consumer inflation continues to be affected by adjustments in regulated prices, as seen in December and February, when the CPI jumped 3.1% m/m and 2.4% m/m, respectively, due to 9.1% and 4.8% monthly increases in the regulated sub-index. We still expect regulated price hikes in April (gas, water, and transport) and June (transport). For March, we expect the CPI to increase 2% m/m due to seasonal increases in education items. As a result, the CPI would have accumulated 6.3% throughout 1Q18. However, once the impact of regulated prices is past, we expect inflation to gradually decrease, mostly in 2H18, converging to an 18% annual rate by year-end, although we acknowledge a risk of an upward revision. In addition, core measures are not showing a significant slowdown. Core inflation has averaged 1.7% m/m since October 2016 and rose to 2.1% m/m in February, affected by the fallout from transport and energy price hikes. In this context, inflation expectations have consistently risen, as analysts accounted for the impact of regulated price adjustments and the inflation target shift. In February’s Central Bank poll of economic forecasters, inflation expectations increased to 19.9% for end-2018 (up from 16.6% in November) and to 14% for December 2019 (vs. 11.25% in November). The change in inflation targets translated into a two-stage 150-bp cut in the seven-day repo rate, to 27.25% p.a. As a result of the decline in the policy rate, together with the increase in inflation expectations, the ex ante real rate fell to an annualized
Drought takes its toll
Sources: Notes: Agricultural production, in million tons.
Year 2018 is estimated. Sources: Ministry of Agriculture,
Rosario Stock Exchange, and Santander.
Widening gap
Notes: Inflation expectations for end of 2018 and end of
2019 and inflation targets. Sources: Central Bank and
Santander.
Recalibrating monetary policy
Notes: ex ante annualized real rate (deflated by headline
and core inflation expectations). Sources: Central Bank
and Santander.
0102030405060708090
100110120130
1980 1984 1988 1992 1996 2000 2004 2008 2012 2016
Agricultural production
0%
4%
8%
12%
16%
20%
24%
oct-16 abr-17 oct-17
20182019Target 2018Target 2019
0%
1%
2%
3%
4%
5%
6%
7%
8%
9%
10%
11%
12%
ago-16 feb-17 ago-17 feb-18
Real rate (headline)
Real rate (core)
Average (core)

Strictly Macro, March 28, 2018 7
8% currently, down from more than 11% in December. Despite the decline, the real rate stands approximately at the average seen since August 2016. Overall, we believe the task of reducing inflation is made more complex by the need to normalize relative prices. In addition, the Central Bank continues to be the main source of pesos for the Treasury. The massive government debt issuance in international markets is bought by the Central Bank, which translates into the monetary base expanding at a 27% annual rate. The purchase is conducted outside the FX market (but at market prices), which reduces USD supply, avoiding real appreciation but hindering the disinflation process. Currency purchases from the Treasury by the Central Bank are by far the biggest driver of monetary base growth (76% of money base expansion factors year to March 14). Thus, the CB has to issue Lebacs (whose stock grew 93% y/y this month) to sterilize the massive peso issuance due to foreign currency purchases. Central Bank intervention expected to tame FX volatility
After the FX volatility spurt that coincided with the change in the inflation targets on December 28, we expect more subdued peso movements, mostly due to the recent intervention of the Central Bank in the FX market. As of March 14, the CB had sold almost USD1 bn in the FX market in 2018 in order to tame volatility, which during the first two weeks of the month decreased to half the level seen in January. The most important catalyst for the Central Bank interventions is the apparent pass-through to prices, which is jeopardizing the objective of controlling inflation, in our view. In January and February, the WPI jumped 4.6% and 4.8% m/m, respectively, the fastest pace since February 2016. As a result of the recent peso depreciation (which accumulated 15% between December 11 and March 19), the real exchange rate weakened 10.9% in the period, reaching the weakest level since March 2016. A weaker REER and the subsequent impact on inflation suggest to us that the Central Bank will remain committed to avoiding further depreciation from current levels in the coming weeks. The USD export supply high season (beginning in early April) will likely aid Central Bank efforts in reducing volatility, in our view. On a more structural note, the rising current account deficit (which reached 5% of GDP last year, the deepest since 1998) remains a source of concern, as the country is one of the most sensitive in the region to changing market sentiment and sudden capital flow reversals. Last year export growth trailed imports significantly (0.9% vs 19.7%), resulting in a record high USD8.5 bn trade deficit. In 2018, although we expect exports to be hit by lower agricultural production (partially offset by higher grain and derivatives quotes), industrial external sales should benefit from rising demand due to a Brazilian GDP pickup. Overall, we expect merchandise exports to gain 4%, while imports should increase 8.7%, leading the current account deficit to widen slightly to 5.3% of GDP this year.
Fiscal targets—easier to meet
On the fiscal front, we think figures are looking favorable to reach the primary deficit target for this year (3.2% of GDP). In the first two months of 2018, revenue expanded 22.6% annually, while expenditures grew 18.9% y/y. While the revenue performance is closely related to economic activity growth, the main fiscal efforts were seen on the expenditures side. Economic subsidies outlays fell 18.5% y/y (while inflation was 25.2% in the period). This is the main pillar of the government’s plan to reduce the primary deficit. Additionally, capital expenditures fell 27.9% y/y, while wages of government workers grew 18.4%, decelerating from the 24.9% annual growth observed in December. One of the government’s stated objectives is that the salary negotiations in the public sector need to be linked to the 15% annual inflation target by year-end. On the negative side, social security (53% of primary expenditures) increased in real terms due to an extraordinary pension payments scheme. However, we anticipate a deceleration in this item’s growth given the modification in the pension and subsidies adjustment formula approved in December. Taking into account January and February data, the government is well positioned to reach the 0.6% of GDP primary deficit target for 1Q18, in our view. Finally, interest payments represented 2.3% of GDP as of February (12M accumulated basis). We do not expect interest payments to decelerate this year, given the new debt placements the federal government still needs to make in order to close the financial program. We estimate the government still needs the equivalent of USD13 bn to meet its financing needs.
Rising uncertainty on FX market
Notes: Monthly average of exchange rate variation
standard deviation. Sources: Bloomberg and Santander.
Weaker ARS
Notes: REER. Base Dec 2001 = 100. Sources: Central
Bank, INDEC, Bloomberg, and Santander.
Meeting fiscal targets
Notes: Quarterly primary surplus target and observed
primary surplus (as percentage of last 12-months GDP).
Sources: Ministry of Economy and Santander.
0.0%
0.2%
0.4%
0.6%
0.8%
1.0%
1.2%
ene-17 jul-17 ene-18
ARS/USD volatility
110
120
130
140
150
160
170
nov-15 may-16 nov-16 may-17 nov-17
REER
-5%
-4%
-3%
-2%
-1%
0%
1Q17 3Q17 1Q18 3Q18
Primary deficit Target (% GDP)Actual primary deficit
Strictly Macro, March 28, 2018 8
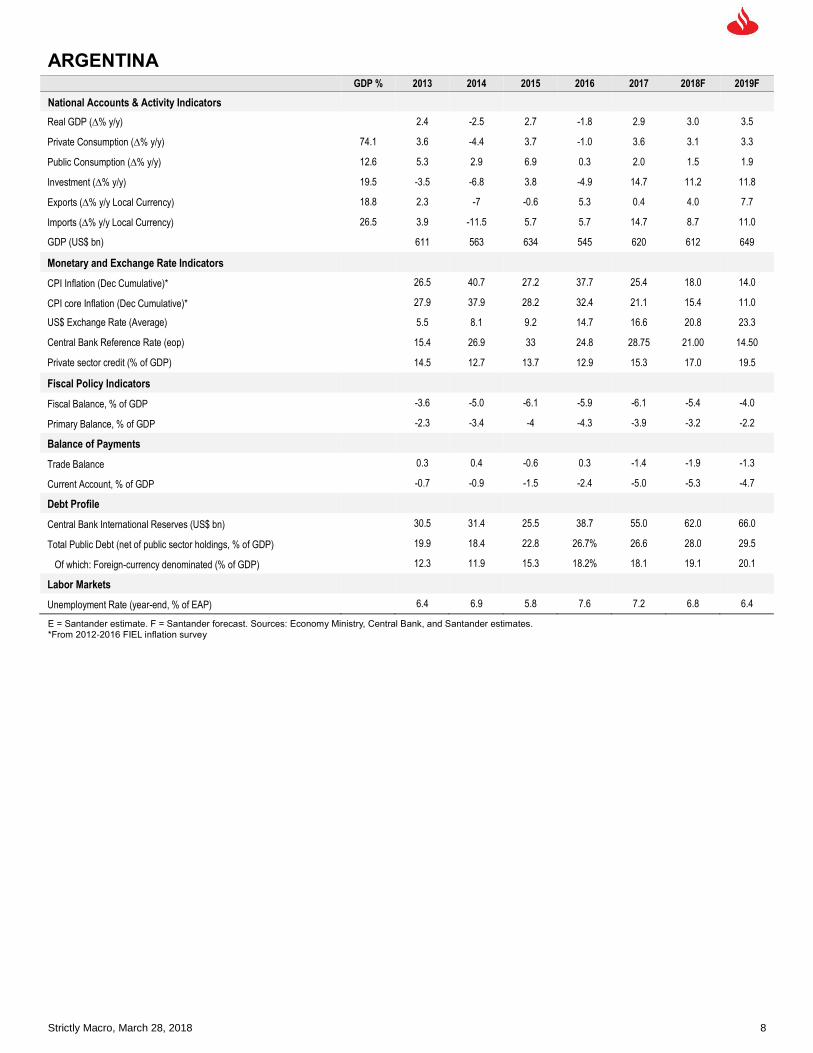
ARGENTINA GDP % 2013 2014 2015 2016 2017 2018F 2019F
National Accounts & Activity Indicators
Real GDP (% y/y) 2.4 -2.5 2.7 -1.8 2.9 3.0 3.5
Private Consumption (% y/y) 74.1 3.6 -4.4 3.7 -1.0 3.6 3.1 3.3
Public Consumption (% y/y) 12.6 5.3 2.9 6.9 0.3 2.0 1.5 1.9
Investment (% y/y) 19.5 -3.5 -6.8 3.8 -4.9 14.7 11.2 11.8
Exports (% y/y Local Currency) 18.8 2.3 -7 -0.6 5.3 0.4 4.0 7.7
Imports (% y/y Local Currency) 26.5 3.9 -11.5 5.7 5.7 14.7 8.7 11.0
GDP (US$ bn) 611 563 634 545 620 612 649
Monetary and Exchange Rate Indicators
CPI Inflation (Dec Cumulative)* 26.5 40.7 27.2 37.7 25.4 18.0 14.0
CPI core Inflation (Dec Cumulative)* 27.9 37.9 28.2 32.4 21.1 15.4 11.0
US$ Exchange Rate (Average) 5.5 8.1 9.2 14.7 16.6 20.8 23.3
Central Bank Reference Rate (eop) 15.4 26.9 33 24.8 28.75 21.00 14.50
Private sector credit (% of GDP) 14.5 12.7 13.7 12.9 15.3 17.0 19.5
Fiscal Policy Indicators
Fiscal Balance, % of GDP -3.6 -5.0 -6.1 -5.9 -6.1 -5.4 -4.0
Primary Balance, % of GDP -2.3 -3.4 -4 -4.3 -3.9 -3.2 -2.2
Balance of Payments
Trade Balance 0.3 0.4 -0.6 0.3 -1.4 -1.9 -1.3
Current Account, % of GDP -0.7 -0.9 -1.5 -2.4 -5.0 -5.3 -4.7
Debt Profile
Central Bank International Reserves (US$ bn) 30.5 31.4 25.5 38.7 55.0 62.0 66.0
Total Public Debt (net of public sector holdings, % of GDP) 19.9 18.4 22.8 26.7% 26.6 28.0 29.5
Of which: Foreign-currency denominated (% of GDP) 12.3 11.9 15.3 18.2% 18.1 19.1 20.1
Labor Markets
Unemployment Rate (year-end, % of EAP) 6.4 6.9 5.8 7.6 7.2 6.8 6.4
E = Santander estimate. F = Santander forecast. Sources: Economy Ministry, Central Bank, and Santander estimates. *From 2012-2016 FIEL inflation survey

Strictly Macro, March 28, 2018 9
BRAZIL
IN A SWEET SPOT, FOR NOW
Brazil seems to be in a sweet spot in the economic cycle, in our opinion, enjoying a period of low inflation and growth recovery. However, the still fragile fiscal situation will require continuous consolidation, which depends on political will, in our view.
We expect the monetary easing cycle to be completed by this quarter, with the Central Bank holding the policy rate at 6.25% until 2H19, in our view.
The opaque electoral scenario could lead to an underperforming currency and a steep yield curve, in our opinion.
Luciano Sobral*
(5511) 3553-3753
Tranquility for how long?
Only seven months from a defining presidential election, the Brazilian economy and markets have been enjoying a tranquil period, with growth returning to cruising speed (nothing spectacular, but a relief from the long recession that ended last year), well-behaved inflation, along with inflation expectations leading to the lowest policy rates in many decades, and relatively low volatility in the markets.
This favorable conjuncture is, in our view, the product of a positive cyclical recovery (more on this later), favorable external conditions, and improved economic management. Looking forward, markets’ bullishness rests on two more questionable assumptions, in our view: first, that the monetary policy normalization in the developed world will not drastically reverse investment flows to emerging markets; second, that a reformist candidate, who would keep working on the fiscal consolidation agenda required to put the debt trajectory back on a sustainable path, will be elected president in October. The rest of the year will be important in terms of providing more solid evidence for those assumptions (the elections will be especially important) and indicating whether the current positive scenario might be extended into 2019.
Inflation and growth still moderate; expect lower interest rates for longer
We recently revised downward our 2018 CPI inflation estimate (to 3.5% from 3.8%; for more details, see our report Even Better Than the Real Thing, February 15, 2018). The price readings released so far this year have confirmed these more benign expected dynamics: food inflation, which tends to be concentrated in the first and last quarters of the year, has been normalizing slowly from last year’s unusual deflation; and core measures continue to decelerate, influenced by economic slack and indexation to 2017’s low headline inflation. Although we expect 12-month CPI to accelerate from the current 2.9%, core inflation, according to our forecasts, will end this year at 3.2%, about 10 bps below the latest data available.
On the economic growth side, although we think the recovery has been looking more solid and widespread, with almost all high-frequency indicators and their composition pointing in the same direction (recently, two important laggards, net formal job creation and volume of services, started to tick upward at the margin), growth momentum in the current quarter has been frustrating more optimistic forecasters. We remain confident in our 3.2% GDP growth projection for this year, but we believe it is valid to reexamine its premises. On the demand side, we expect household consumption to grow 4.7% and investments to jump 7%. We find the evidence for a strong recovery in consumption is convincing, as job markets are finally recovering and consumers seem ready to re-leverage, emerging from the recession with lighter balance sheets and good credit scores (because of low delinquency rates—see charts at right). Investments, however, are more volatile and harder to model, especially given the importance of the election results to the business environment. Flat investments would yield headline growth closer to the IMF’s latest projection (1.9% for 2018), and we
12-Month CPI Inflation (%)
Sources: IBGE and Santander.
Households outstanding debt /12-month
income (%)
Sources: Brazil Central Bank and Santander.
2
4
6
8
10
12
Headline
Core
20
30
40
50
Debt/income (%)
Debt/income ex-mortgages (%)

Strictly Macro, March 28, 2018 10
still cannot dismiss this scenario, in our view.
The bright side of slow growth and persistently high levels of spare capacity in the economy is historically low policy rates. We believe the Brazil Central Bank will be able to keep its benchmark rate (Selic) at 6.25% until the second half of 2019, providing a boon to consumption, investment, and government accounts. According to our forecasts, the public sector’s nominal balance should tighten almost two full percentage points of GDP this year (from 7.8% to 5.7%), even with the primary deficit slightly widening (from 1.7% to 2.0% of GDP) in the same period. In our view, the consolidation of the growth recovery with stable inflation and relatively low interest rates is key to the sustainability of Brazilian debt, as evidenced by the table below. A successful fiscal effort to stabilize the debt/GDP ratio depends, in our opinion, on a combination of low rates and moderate growth similar to current conditions.
Primary surplus needed to stabilize the debt-to-GDP ratio (% of GDP)
Real interest rate (%)
GDP growth (%)
0 1 2 3 4 5
0 0.0 -0.8 -1.6 -2.4 -3.2 -3.9
1 0.8 0.0 -0.8 -1.6 -2.4 -3.2
2 1.6 0.8 0.0 -0.8 -1.6 -2.4
3 2.4 1.6 0.8 0.0 -0.8 -1.6
4 3.2 2.4 1.6 0.8 0.0 -0.8
5 3.9 3.2 2.4 1.6 0.8 0.0
6 4.7 3.9 3.2 2.4 1.6 0.8
7 5.5 4.7 3.9 3.2 2.4 1.6
8 6.3 5.5 4.7 3.9 3.2 2.4
Assuming debt/GDP at 78.8% at the end of 2018. Source: Santander estimates.
Two red flags: exchange rate and the yield curve
Market prices provide an important illustration of how investors perceive uncertainties related to the elections and the continuation of the current supportive economic environment. The BRL has been underperforming (relative to other emerging market currencies), and the once-strong correlation between the USD/BRL rate and country risk has broken down (see chart), while a steep yield curve has been preventing long-term borrowers from fully benefiting from the monetary easing.
The explanation for both phenomena is, in our view, in the combination of extraordinarily low overnight rates and concerns regarding the elections. In the case of the currency, cheap hedging costs (caused by a narrow interest rate differential and low volatility), and the probability of increasing political risk may be leading corporates to smooth out currency mismatches by buying (through derivatives) hard currency in the market. As for the yield curve, we believe a stimulative monetary policy should lead the bond market to price in normalization in the near future, but the term premium is probably amplified by that same perception of political risk.
The electoral calendar suggests that those uncertainties will not be dispelled anytime soon, as the definition of candidates and coalitions may not occur before August, and, until then, polls are unlikely to show a clear lead for anyone, in our view. In the meantime, we believe investors will continue to struggle to find a balance between an attractive point in the economic cycle and the difficulty in establishing a base case for economic policy’s general orientation in the next four years—which will eventually define whether some fat years can follow the lean years Brazil is trying to leave behind.
Delinquency rates (%)
Sources: Brazil Central Bank and Santander.
BRL/USD rate versus 5-year CDS
Sources: Bloomberg and Santander.
Calendar year forward rates (%)
Market data as of March 19. Sources: AE Broadcast and
Santander.
0
1
2
3
4
5
Companies Individuals
50
150
250
350
450
550
1.5
2.0
2.5
3.0
3.5
4.0
4.5BRL/USD
CDS
7.6
9.810.5 10.4
2019 2020 2021 2022

Strictly Macro, March 28, 2018 11
BRAZIL
GDP % 2013 2014 2015 2016 2017 2018F 2019F
National Accounts & Activity Indicators
Real GDP (% y/y)
3.0 0.5 -3.8 -3.6 1.0 3.2 3.2
Private Consumption (% y/y) 62.8 3.5 2.3 -3.2 -4.2 1.0 4.7 2.9
Public Consumption (% y/y) 20.8 1.5 0.8 -1.4 -0.6 -0.6 0.2 1.0
Investment (% y/y) 16.5 5.8 -4.2 -14.0 -10.2 -1.8 7.0 9.5
Exports (% y/y Local Currency) 11.3 2.4 -1.1 6.9 1.9 5.2 3.3 3.2
Imports (% y/y Local Currency) -11.4 7.2 -1.9 -14.0 -10.3 5.0 9.2 3.5
GDP (US$ bn)
2,471 2,455 1,801 1,796 2,055 2,055 2,106
Monetary and Exchange Rate Indicators
IPCA-IBGE Inflation (Dec Cumulative) (%)
5.91 6.41 10.67 6.29 2.90 3.50 4.00
IGP-M Inflation (Dec Cumulative) (%)
5.53 3.67 10.54 7.18 -0.50 4.00 4.50
US$ Exchange Rate (Average)
2.16 2.35 3.33 3.49 3.19 3.39 3.53
Central Bank Reference Rate (eop)
10.00 11.75 14.25 13.75 7.00 6.25 8.50
Stock of Credit To Nonfinancial Private Sector (% of GDP)
50.9 52.2 53.7 49.6 47.1 46.8 47.4
Fiscal Policy Indicators
Public Sector Fiscal Balance (harmonized) (% of GDP)
-3.0 -6.0 -10.2 -8.9 -7.8 -5.7 -5.2
Primary Balance (% of GDP)
1.71 -0.56 -1.85 -2.47 -1.7 -2.0 -1.8
Balance of Payments
Trade Balance, % of GDP
0.02 -0.27 0.98 2.66 3.30 2.70 2.60
Current Account, % of GDP
-3.03 -4.24 -3.27 -1.30 -0.50 -0.80 -1.00
Debt Profile
International Reserves (US$ bn)
358.8 363.6 356.5 365.0 381.1 380.0 380.6
Total Public Debt (net of public sector holdings, % of GDP)
30.5 32.6 35.6 45.9 51.6 57.9 62.8
Of which: Foreign-currency denominated (% of GDP)
-10.2 -10.3 -10.5 -10.5 -10.0 -9.8 -9.8
Labor Markets
Unemployment Rate (% eop) 6.2 6.5 9.0 12.0 11.8 10.8 9.0
E = Santander estimate. F = Santander forecast Sources: IBGE, MDIC, FIPE, FGV, Central Bank, SEADE, and Santander.

Strictly Macro, March 28, 2018 12
CHILE
POSITIVE GROWTH SENTIMENT STARTS TO MATERIALIZE
We now expect GDP growth to reach 3.5% in both 2018 and 2019, near potential, after four slow years averaging 1.8%.
Investment should be the key provider of faster growth, in our view, due to the recovery of the mining and construction sectors and increasing business confidence.
As we expect inflation to remain low, we believe the BCCh will support the recovery with gradual rate hikes. Fiscal policy, in turn, will not add extra fuel, in our view: as newly appointed authorities have pointed out, it’s time for austerity.
Juan Pablo Cabrera*
(562) 2320 3778
By mid-2016, the Chilean economy was suffering from three negative shocks at the same time: low copper prices, sluggish external demand (especially in neighboring countries), and faltering domestic confidence, mainly in the business sector. All this led to sub-par GDP growth of 1.5% in 2016 after an also meager 1.8% average in 2014-15, vs. a potential pace estimated at 3.0-3.5%. But less than two years later, these three drivers are all working in the opposite direction. Copper-related sector real income is growing by 20% y/y, LatAm countries are expanding at near 3% y/y entering 2018, and the local business confidence index now reaches 57, well into optimistic territory. Coincidentally or not, the key local and external drivers of growth in Chile are all improving at the same time, in our view justifying our upward GDP revision for 2018, to 3.5% from the previous 2.7%, the fastest annual pace since 2012.
On the domestic front, the victory of Sebastián Piñera in the December elections reduced political uncertainty, as pro-growth policies are likely to return to the top of the government agenda, in our view. On the external side, sustained increases in copper prices first normalized profits in the mining sector and are now refilling the investment pipeline, which dried up notably between 2014 and 2016. Finally, global economic growth is also giving Chile’s open economy a boost via exports, with neighboring LatAm peers now jumping on the wagon of expanding DM economies.
Key local and external drivers, improving at the same time
y/y changes, last 3M averages. Latam growth includes Argentina, Brazil, Colombia, Mexico and Peru, based on monthly activity indicators. Source: local statistics offices, Santander.
Regarding the growth picture for 2018, we expect the difference to come from investment rather than private consumption. Even during the past four years of subpar growth, the Chilean consumer has been the key pillar of the real economy. Owing to a resilient labor market and abundant local credit, retail sales averaged 3.0% growth between 2013 and 2017, faster than GDP, with durables experiencing a boom of 13% y/y growth in 2016-17. As we see no signs of repressed consumption, we expect this GDP component to play a secondary role in the ongoing acceleration of growth: we estimate a 3.5% expansion, somewhat better than the 2.6% recorded in 2017.
Growth expectations are focused on gross investment, which according to our estimates accumulates a large 15% gap vs. the level that would exist today if the pre-2013 trend had prevailed in subsequent years. Together with the turning point in the mining cycle, the construction sector has already resumed growth (+4.4% y/y in January) after a poor 2017 at -3%, and the rebound in business
Construction Activity Index
IMACON index. y/y growth, last 3M average. Sources:
BCCh and Santander.
Retail sales, y/y growth, last 3M
Sources: INE and Santander.

Strictly Macro, March 28, 2018 13
confidence suggests to us that capital spending will accelerate further in 2H18: we estimate a 4.5% increase in gross investment in 2018, vs -2% in 2017 (with 2.5% y/y for 1H18 and 6.5% y/y for 2H18).
IMACEC: The high-growth season has just begun
y/y changes in overall IMACEC index. In red, Santander estimates. Source: BCCh and Santander.
The non-mining export sector is also improving, mainly due to stronger demand from trading partners. In the January-February period, manufacturing exports (accounting for 35% of overall exports) jumped 16% y/y, while agricultural sales (10% share of exports) soared by 50% y/y. Pulp and paper, chemicals, salmon, and fruit were among the best-performing sectors. Combined with the expected increase in mining output, we expect real exports to grow 5% in 2018, vs. the null variation of 2017.
The monetary policy implications of this activity backdrop are not so obvious, as inflation has remained low in recent months, and we expect it to stay around 2% y/y until July-August. In this context, we think the BCCh will continue to face a sort of “dilemma,” whereby growth conditions indicate that rates should be adjusted upward, while low inflation readings suggest no rate movements by the BCCh, or even cuts, as were discussed in the last MPR meeting in February. Incorporating our growth and inflation projections into our BCCh reaction function model, we come to the conclusion that the next move should be hikes, with the MPR increasing rates at least 100 bps to 3.50% by mid-2019. In part, this reflects the fact that the BCCh board has historically managed rates following output gap conditions rather than short-term inflation, which in Chile is volatile, highly dependent on FX gyrations, and often weakly correlated with the slack in the real economy. As a result, if growth stays around 3.5% this year and in 2019, the relevant question is the size and timing of the tightening cycle, not the direction of rates, in our view. For inflation, our forecasts for 2018 and 2019 are 2.6% and 2.9%, respectively.
On the FX front, we believe the main CLP driver will continue to be global USD dynamics, as seen in the last few years. Local factors will matter but would not generate a trend on their own, in our view. The USDCLP rate has hovered around 600 since year-end 2017, somewhat stronger than traditional fair-value metrics, but justified, in our opinion, by the positive sentiment prevailing in local markets after the elections. Based on the working assumption of a gradually stronger USD globally, but neutral-to-positive copper prices, we project a USDCLP rate oscillating between 590-630 during the year.
Fiscal policy, in turn, will not contribute to faster growth, but rather the opposite, in our view. Newly appointed officials have stated that it is time for austerity after many years of rapid spending growth and widening budget deficits. In this context, we expect the Piñera administration to save a good part of the extra revenue generated by rising copper prices and reduce the 2018 deficit to 2% of GDP from 2017’s 2.8%.
Regarding politics, we believe the new Piñera government will likely try to push for tax reform in Congress (aimed at simplifying the income tax structure for corporates, but probably on a neutral basis for tax revenue) and a new pension law (maintaining the AFP system but trying to raise benefits via higher contributions by employers and the state). We believe that these reforms are important for medium-term fundamentals but not key for 2018 growth conditions, whose recovery is mostly cyclical.
BCCh policy rates
In %. *As per our BCCh reaction function model. Sources:
INE, BCCh, and Santander.
Fiscal balance as % of GDP
Last 12M. Mining sector revenue includes Codelco
surplus and royalties. Sources: Treasury and Santander.

Strictly Macro, March 28, 2018 14
CHILE
GDP % 2013 2014 2015 2016 2017 2018F 2019F
National Accounts & Activity Indicators
Real GDP (% y/y)
4.1 1.9 2.3 1.6 1.6 3.5 3.5
Private Consumption (% y/y) 12 4.2 4.4 1.9 2.4 2.6 3.5 3.6
Public Consumption (% y/y) 65 5.6 2.2 5.8 5.1 3.2 3.5 3.5
Investment (% y/y) 28.4 0.4 -6.1 -1.5 -0.8 -2.0 4.5 6.0
Exports (% y/y Local Currency) 39 4.3 0.7 -1.9 -0.1 0.0 4.9 3.5
Imports (% y/y Local Currency) 39 2.2 -7.0 -2.8 -1.6 5.5 7.4 7.1
GDP (US$ bn)
277 258 241 247 271 303 318
Monetary and Exchange Rate Indicators
CPI Inflation (Dec Cumulative)
2.9 4.6 4.4 2.7 2.3 2.6 2.9
CPI core Inflation IPCX1 (Dec Cumulative)
2.6 4.6 4.7 2.8 1.9 2.2 2.7
US$ Exchange Rate (Average)
525 606 654 677 650 615 625
Central Bank Reference Rate (eop)
4.5 3.00 3.50 3.50 2.50 2.75 3.5
Private sector credit (% of GDP)
83.2 85.0 88.0 88.2 90.0 91.0 92.0
Fiscal Policy Indicators
**Fiscal Balance, % of GDP
-0.6 -1.6 -2.1 -2.7 -2.8 -2.0 -1.8
**Primary Balance, % of GDP
-0.1 -1.0 -1.4 -2.0 -2.0 -1.1 -0.8
Balance of Payments
Trade Balance, % of GDP
0.6 2.5 1.5 2.1 2.5 1.8 1.1
Current Account, % of GDP
-3.7 -1.3 -2.0 -1.4 -1.2 -1.3 -1.6
Debt Profile
Central Bank International Reserves (US$ bn)
41.1 40.5 38.6 40.0 40.0 40.0 40.0
Total Public Debt (gross, % of GDP)
12.1 14.1 16.2 21.5 25.5 25.6 26.2
Of which: Foreign-currency denominated (% of GDP)
1.9 2.5 3.2 3.5 4.0 4.5 5.0
Labor Markets
Unemployment Rate (% eop) 6.0 6.4 6.2 6.5 6.7 6.6 6.5
E = Santander estimate. F = Santander forecast Sources: Central Bank, Servicio de Estudios, and Santander.

Strictly Macro, March 28, 2018 15
COLOMBIA
PRESIDENTIAL ELECTIONS ON THE NEAR HORIZON
The first round of the presidential elections will be held on May 27. Ivan Duque, the center-right candidate, is currently in the lead, according to the latest polls.
Growth in 4Q17 disappointed, yet leading indicators point to an ongoing recovery. We expect the economy to continue to pick up and forecast growth of 2.5% y/y in 2018.
BanRep remains highly data dependent and has left the door open for additional easing. We consider that the MPC will remain on hold for the rest of the year, although we do not rule out a final cut in April if inflationary dynamics in March are better than expected.
Diana Ayala
1 (212) 407-0979
Presidential elections are approaching
On March 11, Colombia held its legislative elections, kicking off the country’s electoral process for this year. The results of those elections were favorable for the right and center-right parties, which continue to hold a majority in the Congress following the vote. In the Senate, the right and center-right parties won 60% of the seats, with Centro Democratico, former President Uribe’s party, winning the most seats (19 seats). The outcome of the elections was perceived in general as positive, with both Fitch and Standard & Poor’s rating agencies stating their view that the composition of the Congress would ensure the continuation of the country’s macroeconomic and fiscal policy framework.
On the same day, the center-right and left coalitions held their primary elections to select their respective official presidential candidates. In the case of the center-right coalition, Ivan Duque (the Centro Democratico party’s candidate) won the candidacy comfortably, capturing 68% of the votes. Following the results, he named Marta Lucia Ramirez, the runner-up, as his running-mate for vice president. In the left primary, Gustavo Petro, former mayor of Bogota, won the nomination, as expected, with 85% of the votes.
Political analysts (e.g., Primera Pagina on March 12, 2018, among others) highlighted the large difference in number of votes cast between the two primaries, with the “Gran Consulta por Colombia” coalition (center-right, with ~6.0 mn votes) almost doubling the number of votes for the “Consulta Inclusion Social por la Paz” coalition (left) (~3.5 mn votes). In the view of these political analysts, the results suggest that Ivan Duque is highly likely to reach the second round. Gustavo Petro’s road to the presidency, on the other hand, may be more challenging than initially expected.
The polls after the March 11 elections (the latest published on March 26 by EcoAnalitica) show Ivan Duque gaining strength, with a clear lead over his opponents, at ~41% of the vote intentions. Gustavo Petro, who led in the polls before the March 11 elections, is in second place, with ~25% of vote intentions. In the run-off scenarios, the YanHaas poll (March 20) shows Ivan Duque as the leader in all scenarios. Despite Ivan Duque’s current lead, the results of the presidential election remain uncertain, as two months are remaining before the first round, scheduled to take place on May 27, and alliances can still be built before then. However, we agree with the rating agencies and consider that the composition of the Congress is likely to ensure the continuity of the current policy macro framework, regardless of the outcome of the presidential elections.
Green shoots of ongoing recovery
Growth disappointed in 4Q17, as GDP grew 1.6% y/y, decelerating from 2.3% y/y in 3Q17. Despite this slowdown, the economy grew 1.8% y/y, beating market expectations of 1.6%. The more moderate growth in 4Q17 was explained by lower consumption growth, which decelerated to 0.9% y/y from 2.5% y/y in 3Q17. However, exports’ performance also disappointed, as they contracted 3.8% y/y in 4Q17 after expanding a solid 5.0% in 3Q17. The net external contribution ended up being positive, as imports registered a larger decline of 4.1% y/y in the last quarter of 2017.
Leading indicators suggest that the economic recovery continues, albeit at a
Latest polls show Ivan Duque with a substantial lead
Sources: Alianza de Medios/YanHass, Invamer, CNC and
EcoAnalitica.
Economic activity picking up
Source: DANE.
41
25
11
6
0
10
20
30
40
50
Ivan Duque Gustavo Petro Sergio Fajardo German Vargas
(%)
La Gran Encuesta / YanHaas InvamerCNC EcoAnaliticaAverage
-1
0
1
2
3
4
5
6
7
8
Jan-14 Sep-14 May-15 Jan-16 Sep-16 May-17 Jan-18
(YoY %)
Activity Indicator (ISE)
3 per. Mov. Avg. (Activity Indicator (ISE))
Strictly Macro, March 28, 2018 16
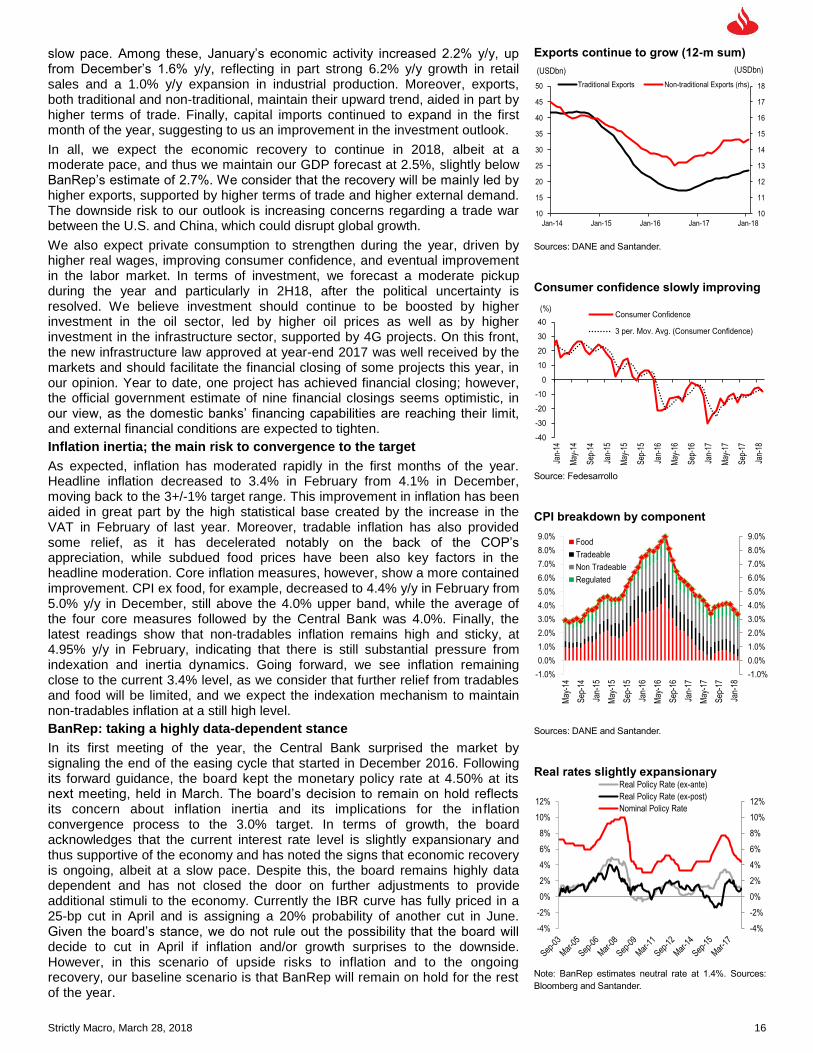
slow pace. Among these, January’s economic activity increased 2.2% y/y, up from December’s 1.6% y/y, reflecting in part strong 6.2% y/y growth in retail sales and a 1.0% y/y expansion in industrial production. Moreover, exports, both traditional and non-traditional, maintain their upward trend, aided in part by higher terms of trade. Finally, capital imports continued to expand in the first month of the year, suggesting to us an improvement in the investment outlook.
In all, we expect the economic recovery to continue in 2018, albeit at a moderate pace, and thus we maintain our GDP forecast at 2.5%, slightly below BanRep’s estimate of 2.7%. We consider that the recovery will be mainly led by higher exports, supported by higher terms of trade and higher external demand. The downside risk to our outlook is increasing concerns regarding a trade war between the U.S. and China, which could disrupt global growth.
We also expect private consumption to strengthen during the year, driven by higher real wages, improving consumer confidence, and eventual improvement in the labor market. In terms of investment, we forecast a moderate pickup during the year and particularly in 2H18, after the political uncertainty is resolved. We believe investment should continue to be boosted by higher investment in the oil sector, led by higher oil prices as well as by higher investment in the infrastructure sector, supported by 4G projects. On this front, the new infrastructure law approved at year-end 2017 was well received by the markets and should facilitate the financial closing of some projects this year, in our opinion. Year to date, one project has achieved financial closing; however, the official government estimate of nine financial closings seems optimistic, in our view, as the domestic banks’ financing capabilities are reaching their limit, and external financial conditions are expected to tighten.
Inflation inertia; the main risk to convergence to the target
As expected, inflation has moderated rapidly in the first months of the year. Headline inflation decreased to 3.4% in February from 4.1% in December, moving back to the 3+/-1% target range. This improvement in inflation has been aided in great part by the high statistical base created by the increase in the VAT in February of last year. Moreover, tradable inflation has also provided some relief, as it has decelerated notably on the back of the COP’s appreciation, while subdued food prices have been also key factors in the headline moderation. Core inflation measures, however, show a more contained improvement. CPI ex food, for example, decreased to 4.4% y/y in February from 5.0% y/y in December, still above the 4.0% upper band, while the average of the four core measures followed by the Central Bank was 4.0%. Finally, the latest readings show that non-tradables inflation remains high and sticky, at 4.95% y/y in February, indicating that there is still substantial pressure from indexation and inertia dynamics. Going forward, we see inflation remaining close to the current 3.4% level, as we consider that further relief from tradables and food will be limited, and we expect the indexation mechanism to maintain non-tradables inflation at a still high level.
BanRep: taking a highly data-dependent stance
In its first meeting of the year, the Central Bank surprised the market by signaling the end of the easing cycle that started in December 2016. Following its forward guidance, the board kept the monetary policy rate at 4.50% at its next meeting, held in March. The board’s decision to remain on hold reflects its concern about inflation inertia and its implications for the inflation convergence process to the 3.0% target. In terms of growth, the board acknowledges that the current interest rate level is slightly expansionary and thus supportive of the economy and has noted the signs that economic recovery is ongoing, albeit at a slow pace. Despite this, the board remains highly data dependent and has not closed the door on further adjustments to provide additional stimuli to the economy. Currently the IBR curve has fully priced in a 25-bp cut in April and is assigning a 20% probability of another cut in June. Given the board’s stance, we do not rule out the possibility that the board will decide to cut in April if inflation and/or growth surprises to the downside. However, in this scenario of upside risks to inflation and to the ongoing recovery, our baseline scenario is that BanRep will remain on hold for the rest of the year.
Exports continue to grow (12-m sum)
Sources: DANE and Santander.
Consumer confidence slowly improving
Source: Fedesarrollo
CPI breakdown by component
Sources: DANE and Santander.
Real rates slightly expansionary
Note: BanRep estimates neutral rate at 1.4%. Sources:
Bloomberg and Santander.
10
11
12
13
14
15
16
17
18
10
15
20
25
30
35
40
45
50
Jan-14 Jan-15 Jan-16 Jan-17 Jan-18
(USDbn)(USDbn)
Traditional Exports Non-traditional Exports (rhs)
-40
-30
-20
-10
0
10
20
30
40
Jan-
14
May
-14
Sep
-14
Jan-
15
May
-15
Sep
-15
Jan-
16
May
-16
Sep
-16
Jan-
17
May
-17
Sep
-17
Jan-
18
(%)Consumer Confidence
3 per. Mov. Avg. (Consumer Confidence)
-1.0%
0.0%
1.0%
2.0%
3.0%
4.0%
5.0%
6.0%
7.0%
8.0%
9.0%
-1.0%
0.0%
1.0%
2.0%
3.0%
4.0%
5.0%
6.0%
7.0%
8.0%
9.0%
May
-14
Sep
-14
Jan-
15
May
-15
Sep
-15
Jan-
16
May
-16
Sep
-16
Jan-
17
May
-17
Sep
-17
Jan-
18
Food
Tradeable
Non Tradeable
Regulated
-4%
-2%
0%
2%
4%
6%
8%
10%
12%
-4%
-2%
0%
2%
4%
6%
8%
10%
12%
Real Policy Rate (ex-ante)
Real Policy Rate (ex-post)
Nominal Policy Rate

Strictly Macro, March 28, 2018 17
COLOMBIA % GDP 2013 2014 2015 2016 2017 2018F 2019F
National Accounts & Activity Indicators
Real GDP (% y/y) 4.7 4.6 3.1 2.0 1.8 2.5 3.0
Private Consumption (% y/y) 61.1 3.4 4.3 3.2 1.5 1.7 2.1 3.3
Public Consumption (% y/y) 16.1 5.8 6.3 2.8 2.4 4.0 2.8 2.8
Investment (% y/y) 23.7 6.8 9.8 1.8 -2.7 0.1 0.9 2.0
Exports (% y/y) 18.9 5.2 -1.5 1.2 -1.2 -0.6 5.4 4.0
Imports (% y/y) 19.8 6 7.9 1.4 -7.3 0.2 1.3 3.5
GDP (US$ bn) 380 378 291 280 309 334 348
Monetary and Exchange Rate Indicators
CPI Inflation (Dec Cumulative) 1.9 3.7 6.8 5.75 4.09 3.43 3.19
Core inflation (Dec Cumulative) 2.8 3.3 5.2 5.14 5 3.8 3.5
US$ Exchange Rate (Average) 1869.3 2400 2740 3050 2952 2900 2950
Central bank reference Rate (eop) 3.25 4.5 5.75 7.5 4.75 4.50 5.25
Bank lending to the private sector (% chg YoY, Dec) 14 14 12 9 10 12 12
Fiscal Policy Indicators
Fiscal Balance, % of GDP -2.4 -2.4 -3.0 -4 -3.6 -3.1 -2.2
Primary Balance, % of GDP 0 -0.2 -0.5 -1.1 -0.7 0.1 0.6
Balance of Payments
Trade Balance (% of GDP) -0.7 -3 -4.7 -3.3 -1.5 -1.0 -1.0
Current Account (% of GDP) -3.3 -6.6 -6.4 -4.3 -3.3 -3.0 -3.0
Debt Profile
Central Bank International Reserves (US$ bn) 43.6 47.3 46.7 46.7 47.3 47.6 48.0
Total Public Debt (gross, % of GDP) 32 38 37 44 45 45 44
Of which: Foreign-currency denominated (% of GDP) 9 11 14 16 16 15 15
Labor Markets
Unemployment Rate Avg. (year-end % of EAP) 8.4 8.7 8.6 8.7 8.6 8.0 7.5
E = Santander estimate. F = Santander forecast. Sources: Finance Ministry, Budget Office, Central Bank, and Santander.

Strictly Macro, March 28, 2018 18
MEXICO
2018 ELECTIONS: UNCERTAINTY AND FINANCIAL VOLATILITY?
On March 30 the political campaigns for the election to be held on July 1 will get under way. The president of the republic will be elected, and the entire Upper House and Lower House will be renewed.
In the election for president, three political alliances will participate, as well as independent candidates for the first time.
Our MXN/USD exchange rate scenario considers the potential for volatility, which may also be observed in other financial variables that are associated with the electoral process.
Rafael Camarena* (5255) 5269-1927
Salvador Orozco* (5255) 5269-1933
Pedro Balcao* (5255) 5269-2264
2Q18: a bumpy ride expected
The second quarter of the year should be dominated by the final phase of the electoral process, which could cause temporary volatility in the domestic financial markets, mainly in the exchange rate. If this happens, we would expect Banco de Mexico to raise its target interest rate again. We estimate that the risks associated with NAFTA negotiations will decrease significantly in the second half of the year, when the electoral process will be concluded. In our view, the most favorable outcome would be if the election ratifies an economic policy committed to the stability of the economy and the promotion of structural reforms, particularly reform of the energy sector.
Official political campaigns: ready, set, go . . .
The political campaigns for the July general elections will start on March 30 and end on June 27. In the elections scheduled to take place on July 1, the entire Upper House and Lower House will be renewed, the president will be elected, as well as the governments of the states of Chiapas, Guanajuato, Jalisco, Morelos, Puebla, Tabasco, Veracruz, and Yucatan. In addition, the Mexico City head of government, local deputies, and mayors will be elected.
In Mexico there is no electoral “second round” but rather a direct vote. The winner is the one with the highest number of votes regardless of the percentage that separates him or her from second place.
In the election for president, three political alliances will participate and, for the first time, independent candidates as well. The coalition of the parties MORENA-Partido del Trabajo-Encuentro Social is represented by Andres Manuel López Obrador, also known as AMLO, who defines himself as a politician of “the left.” This will be his third campaign for the presidency after 2006 and 2012, when Felipe Calderón and the current president, Enrique Peña, respectively, were the winners.
Also participating is the alliance formed by Partido Acción Nacional (PAN), Partido de la Revolución Democrática (PRD), and Movimiento Ciudadano (MC), whose candidate is Ricardo Anaya, the previous leader of PAN. This group combines ideologies that on the political spectrum are defined as “center-right” (PAN) and “moderate left” (PRD and MC). At the beginning of the administration of President Peña Nieto, these parties supported the “Pact for Mexico,” which formed the basis for the approval of structural reforms in the energy, telecommunications and education sectors.
For his part, José Antonio Meade, former minister of finance, leads the coalition of the current ruling party, Partido Revolucionario Institucional (PRI), Partido Verde Ecologista, and Partido Nueva Alianza. Jose Antonio Meade is shaping up to be the candidate of continuity of the current government’s economic policy and of support of the structural reforms approved by the current government.
As for the independent candidates, their probability of success is perceived as low, according to the latest polls. Among these, Margarita Zavala (former
Bloomberg poll tracker for Mexican elections
Note: Percentages are for effective vote intentions as of
March 28, 2018. Sources: Bloomberg and Santander.
42
25
23
7
0
5
10
15
20
25
30
35
40
45
50
Nov ´2017 Dec ´2017 Jan ´2018 Feb '2018 Mar ´2018
(%)
AMLO R. Anaya JA Meade M. Zavala

Strictly Macro, March 28, 2018 19
member of PAN and wife of former president Felipe Calderón) stands out.
According to Bloomberg, the company that produces the Poll Tracker of electoral preferences, Andres Manuel López Obrador currently has 42% of the electoral preferences, Ricardo Anaya 25%, José Antonio Meade 23%, and Margarita Zavala 7%.
The Instituto Nacional Electoral (National Electoral Institute, or INE) has scheduled three debates among the candidates for the presidency, scheduled to take place on April 22, May 20, and June 22.
Banxico keeps the door open for another hike
Regarding inflation, we estimate that the annual inflation rate will be below 5.0% in the second quarter after closing at 6.8% in 2017, and we expect inflation to close the year at 4.2%. However, Banco de Mexico has warned that in the event of deviations in the downward expected trajectory of inflation due to possible shocks (e.g., exchange rate), the monetary policy will adjust to keep medium- and long-term inflation expectations anchored and to promote convergence toward the authority’s target inflation (3.0% +/- 1 p.p.).
Our MXN/USD exchange rate scenario considers the potential for volatility, which may also be observed in other financial variables that are associated with the electoral process. This has consistently been the case in the quarter prior to the elections (which take place on the first Sunday of July every six years), at least in the periods prior to the three previous elections. We expect that if this happens, the governing board of Banco de Mexico will raise its target interest rate at its May meeting (day 17) by 25 bp to 7.75% from the current 7.50%. Thus, for the meeting scheduled for April 12, the rate would remain at the current level of 7.50%.
MXN pressures lower than previously estimated
We have seen lower pressures on the MXN in the short term as a result of the following factors: (i) the U.S. dollar weakening against most currencies, particularly against the main currencies of developed economies; going forward, more stability is expected; and (ii) the perception of lower risks related to the negotiation of the North American Free Trade Agreement with the U.S. and Canada. Although progress has been slower than some observers expected, the overall market perception is of greater certainty that the U.S. will continue to negotiate. While controversial U.S. proposals regarding NAFTA remain on the table, U.S. economic and political groups have been actively participating in efforts to maintain the trade relationship with Canada and Mexico, seeking to improve the region’s competitiveness.
However, as we mentioned previously, we continue to warn of the risks of financial volatility associated with the internal electoral process, upward pressure on the interest rates of U.S. Treasury bonds, and possible episodes of volatility associated with the Fed's monetary policy.
Therefore, we consider that the level of greatest pressure for the MXN will be between May and June, toward MXN20.20/USD, vs. the MXN22.00/USD we forecast previously. For the second half of 2018 we have a positive outlook regarding the performance of the exchange rate, with a forecast of MXN18.20/USD at year-end 2018. Thus, we maintain our estimate based on the following forecasts: (i) NAFTA negotiations continuing throughout 2018, with positive news in the second half of the year; (ii) moderate but sustained growth in Mexico's economic activity (2.4% annual rate in 2018), supported by exports, growth in the service sector, favorable remittance flows (US$26-28 billion), and Foreign Direct Investment (US$28-30 billion); (iii) a cautious monetary policy that will direct its efforts to consolidating the inflation trend toward the target range; and (iv) continuation of policies focusing on macroeconomic stability and support for structural reforms.
Consumer price index (YoY%)
Sources: INEGI and Santander.
6.8
4.2
0.0
1.0
2.0
3.0
4.0
5.0
6.0
7.0
8.0
Jan-
16
Apr
-16
Jul-1
6
Oct
-16
Jan-
17
Apr
-17
Jul-1
7
Oct
-17
Jan-
18
Apr
-18
Jul-1
8
Oct
-18
(%)
CPI Core CPI
Forecast

Strictly Macro, March 28, 2018 20
MEXICO GDP % 2013 2014 2015 2016 2017 2018F 2019F
National Accounts & Activity Indicators
Real GDP (% y/y) 1.4 2.8 3.3 2.9 2.0 2.4 2.5
Private Consumption (% y/y) 73.9 1.8 2.1 3.4 3.7 3.0 2.8 2.7
Public Consumption (% y/y) 10.9 0.5 2.9 1.9 2.4 0.1 2.0 1.0
Investment (% y/y) 20.9 -3.4 3.1 5.0 1.1 -1.5 0.2 3.5
Exports (% y/y Local Currency) 17 1.4 7.0 8.4 3.5 3.8 6.8 7.5
Imports (% y/y Local Currency) 21.5 2.1 5.9 5.9 2.9 6.4 6.5 7.2
GDP (US$ bn) 1,275 1,313 1,169 1,076 1,154 1,207 1,319
Monetary and Exchange Rate Indicators
CPI Inflation (Dec Cumulative) 4.0 4.1 2.1 3.3 6.8 4.2 3.6
CPI core Inflation (Dec Cumulative) 2.8 3.2 2.4 3.4 4.9 4.0 3.5
US$ Exchange Rate (Average) 12.8 13.3 15.9 18.7 18.7 19.1 17.7
Central Bank Reference Rate (eop) 3.50 3.00 3.25 5.75 7.25 7.50 6.50
Bank Lending to Private Sector (% of GDP) 14.7 14.8 16.0 16.9 17.5 18.8 19.2
Fiscal Policy Indicators
Fiscal Balance, % of GDP -2.3 -3.2 -3.5 -2.6 -1.1 -2.0 -2.0
Primary Balance, % of GDP -0.4 -1.1 -1.1 -0.1 1.4 0.9 0.9
Balance of Payments
Trade Balance -0.1 -0.2 -1.3 -1.2 -0.9 -0.9 -0.9
Current Account, % of GDP -2.4 -1.8 -2.5 -2.1 -1.6 -1.6 -1.5
Debt Profile
Central Bank International Reserves (US$ bn) 176.5 193.2 176.7 176.5 172.8 175.0 178.0
Total Public Debt (gross, % of GDP) 40.4 43.2 47.3 48.7 46.2 46.1 46.0
Of which: Foreign-currency denominated (% of GDP) 10.2 11.9 14.6 18.3 15.3 14.9 14.5
Labor Markets
Unemployment Rate (year-end, % of EAP) 4.9 4.8 4.3 3.9 3.4 3.2 3.2
E = Santander estimate. F = Santander forecast Sources: Economy Ministry, Central Bank, and Santander estimates.

Strictly Macro, March 28, 2018 21
PERU
A BETTER FUTURE?
In our view, 2018 will see consistent economic growth, supported by private consumption stemming from the loosened monetary policy and by public investments from the reconstruction program, and with a background of inflation fluctuating within the target range of 1-3%.
In 2018 we expect neither a notable transformation nor a sovereign downgrade.
The resolution of the political impasse does not change the overall economic policy outlook, in our view, and in addition could relieve uncertainty about the political scenario in the short and medium terms.
We revised our 2018 GDP growth forecast to 3.5% from 4.0%, above 2017 GDP growth of 2.5% and in line with consensus.
In our opinion, there is asymmetric risk on the economic activity side, given that the end of the statistical effect is sufficient to pull inflation toward the center of the target range (1-3%) in 2H18.
We recognize that the BCRP may resume the easing cycle if economic growth disappoints. However, our baseline scenario is the BCRP holding the reference rate at 2.75% in 1H18 and hiking it to 3.00% p.a. in 4Q18.
Tatiana Pinheiro*
(5511) 3012-5179
Conclusion
We maintain our positive view that the strengthening of macro fundamentals will be sufficient to allow the Peruvian economy to weather the domestic political crisis. Among these stronger fundamentals, we see: low public debt ratio to GDP, low current account deficit, low external financing needs, inflation expectations well anchored to the inflation target, and favorable global growth conditions ahead. Therefore, in 2018 we expect neither a notable transformation nor a sovereign downgrade. In our view, 2018 will be a year of consistent economic growth, supported by private consumption stemming from the loosened monetary policy and by public investments from the reconstruction program, and with a background of inflation fluctuating within the target range of 1-3%.
The end of a political saga
The resignation of Peruvian President Pedro Pablo Kuczynski (Kuczynski, Peruanos por el Kambio, or PPK) should bring no change regarding economic policy, in our opinion, but could relieve uncertainty about the political scenario in the short and medium terms. According to the constitution, if the president steps down, the first and second vice president (in this order) should replace the president. The constitution rules that if both vice presidents also resign, the head of Congress should take office and call for early elections (for congressional seats as well as for the presidency).
As expected, Martin Vizcarra (first vice president) accepted the position and was sworn in as the new president two days after PPK’s resignation. In his first speech as president, Mr. Vizcarra stated that he will appoint a new cabinet in the near future. We consider that Vizacarra’s transition will be smooth, with a continuation of President Kuczynski’s economic policies—including fiscal spending and public investments plans. In our opinion, Vizcarra is likely to continue to hold office until the end of PPK’s mandate (2021), because the majority of legislators would rather avoid earlier elections, given the widespread anti-establishment sentiment among the population due to the recent corruption scandals. For instance, according to the most recent Ipsos poll (released in February) the rejection rate for Keiko Fujimori (Fuerza Popular) was 64%, for Luis Galarreta, head of Congress (Fuerza Popular), it was 52%, and for Kuczynski (Peruanos por el Kambio – PPK) it was 75%.
We expect the reform agenda to be frozen, mainly because the government
Business Confidence Index
Source: Encuesta de expectativas macroeconómicas
BCRP.
Inflation consensus expectation
Notes: Economic analysts. Source: BCRP.
40
45
50
55
60
65
70
Jan
-12
May-1
2
Sep-1
2
Jan
-13
May-1
3
Sep-1
3
Jan
-14
May-1
4
Sep-1
4
Jan
-15
May-1
5
Sep-1
5
Jan
-16
May-1
6
Sep-1
6
Jan
-17
May-1
7
Sep-1
7
Jan
-18
1.5
2.0
2.5
3.0
3.5
Jan
-15
Mar-
15
May-1
5
Jul-
15
Sep-1
5
Nov-
15
Jan
-16
Mar-
16
May-1
6
Jul-
16
Sep-1
6
Nov-
16
Jan
-17
Mar-
17
May-1
7
Jul-
17
Sep-1
7
Nov-
17
Jan
-18
2017
2018
2019

Strictly Macro, March 28, 2018 22
coalition will continue to have no more than 30% of the total seats, while Fuerza Popular (the main opposition party) will maintain the majority in Congress (with 59 seats of 130).
The fact that the political environment in 1Q18 was the same as at the end of December 2017—an ongoing push to impeach President Kuczynski and a deadlock between the executive and opposition-controlled Congress—undermined the economic growth outlook for 2018. The opposition had attempted to remove the former president since the end of 2017, based on Kuczynski`s business links with Odebrecht when he was finance minister and prime minister during the Alejandro Toledos administration (2001-2006). In our opinion, the political uncertainties of the past three months have constrained investments and consumption decisions. For instance, the business confidence index (expectation for three months ahead) dropped to 55 in February from 63 in December.
Outlook: Economic activity heating up
We are revising down our 2018 GDP growth forecast to 3.5% from 4.0%, above 2017 GDP growth of 2.5% and in line with the consensus. We still see the recent political turmoil as a drag on some important sources of economic growth, such as consumer and business confidence. Our forecast for real GDP growth in 2018 is based on household consumption and public investments in the reconstruction program, in the mining sector, and in infrastructure plans linked to the Pan American Games (which the government expects to be 1.3% of GDP).
For the mining sector, which is less susceptible to the political cycle, we expect investment of around USD 5bn in 2018; for the reconstruction program, the government plans to invest USD 7.5bn. The focus of this program will be the following sectors: agriculture, transportation, health, housing, sanitation, and streets & sidewalks. For household consumption, we think the additional cut in the BCRP reference rate to 2.75% p.a. in 1Q18 reinforces the monetary impulse already in place. The breakdown of our real GDP growth forecast sees domestic demand (consumption + investments) rising by 3.7% and net exports up 1.4%—i.e., domestic demand accelerating and net exports decelerating.
Inflation and monetary policy
We maintain our forecast for 2018 inflation at 2.5%; we foresee inflation gaining traction throughout 2Q18 as domestic demand heats up. In 1Q18, we expect inflation (CPI y/y) to decelerate to close to 1% (bottom of the range of the inflation target), basically due to statistical base effects (high inflation in 1H17 due to El Nino’s impact on foodstuff prices). February CPI was 1.18% y/y.
In 2017 the BCRP cut the reference rate by 100 bps to 3.25%. In 1Q18 the BCRP cut the reference rate by 50 bps to 2.75% p.a., mainly due to the collapse in inflation and the monetary authority’s assessment that economic growth is currently below its potential. We see asymmetric risk on the economic activity side, given that the end of the statistical effect is sufficient to pull inflation toward the center of the target range (1-3%). In other words, we believe the BCRP may resume the easing cycle if it keeps seeing economic growth below potential. However, our baseline scenario is that the easing cycle was ended with the last decision. We are also maintaining our call that the BCRP will have to hike the reference rate in 4Q18, but we revised our reference rate (eop) to 3.0% from 3.75%.
GDP breakdown – (contributions) & forecast
Sources: Instituto Nacional de Estadística e Informática and BCRP.
GDP growth consensus expectation
Notes: Economic analysts. Source: BCRP.
Inflation (CPI y/y)
Source: BCRP.
1.75.3
3.6 4.6 3.5 2.4 2.5 2.2 1.7
2.0 2.0
1.5
0.60.5
0.90.7
0.7 1.2
-0.10.2 0.2 0.1
-4.7
10.0
3.5 1.83.1
-0.8-0.7 -0.9
-0.5
0.5 1.1
2.6
-7.5
-1.2 -1.3 -1.5
0.2 0.3 3.1 3.1 0.8 0.9
-5
-2
1
4
7
10
-10
-5
0
5
10
15
20
2009
2010
2011
2012
2013
2014
2015
2016
2017
2018
(F)
2019
(F)
Net Export
Investment
Government consuption
Private consumption
GDP (rhs)
2.00
3.00
4.00
5.00
Feb-1
5
Apr-
15
Jun
-15
Aug-1
5
Oct-
15
Dec-1
5
Feb-1
6
Apr-
16
Jun
-16
Aug-1
6
Oct-
16
Dec-1
6
Feb-1
7
Apr-
17
Jun
-17
Aug-1
7
Oct-
17
Dec-1
7
Feb-1
8
2017
2018
2019
0.00
1.00
2.00
3.00
4.00
5.00
6.00
7.00
Jan
-09
Jul-
09
Jan
-10
Jul-
10
Jan
-11
Jul-
11
Jan
-12
Jul-
12
Jan
-13
Jul-
13
Jan
-14
Jul-
14
Jan
-15
Jul-
15
Jan
-16
Jul-
16
Jan
-17
Jul-
17
Jan
-18
Jul-
18
forecast

Strictly Macro, March 28, 2018 23
PERU
GDP % 2013 2014 2015 2016 2017 2018F 2019F
National Accounts & Activity Indicators
Real GDP (% y/y)
5.8 2.4 3.3 4.0 2.5 3.5 4.0
Private Consumption (% y/y) 61.4 5.7 3.9 4.0 3.3 2.5 3.0 3.0
Public Consumption (% y/y) 11.2 6.7 6.0 9.8 -0.5 1.6 2.0 1.0
Investment (% y/y) 28.2 11.5 -3.1 -2.9 -3.9 -2.3 2.0 4.5
Exports (% y/y Local Currency) 23.9 -1.3 -0.9 4.0 9.5 8.5 6.5 6.0
Imports (% y/y Local Currency) 24.6 4.2 -1.4 2.4 -2.2 4.0 4.0 3.0
GDP (US$ bn)
198 203 192 197 217 219 222
Monetary and Exchange Rate Indicators
CPI Inflation (Dec Cumulative)
2.9 3.2 4.4 3.2 1.4 2.5 2.5
WPI Inflation (Dec Cumulative)
1.6 1.5 2.6 1.9 -0.6 2.0 2.0
US$ Exchange Rate (Average)
2.7 2.8 3.2 3.4 3.24 3.40 3.57
Central Bank Reference Rate (eop)
4.00 3.50 3.75 4.25 3.3 3.0 3.75
Fiscal Policy Indicators
**Fiscal Balance, % of GDP
0.9 -0.3 -2.1 -2.3 -3.0 -3.6 -3.0
**Primary Balance, % of GDP
2.0 0.8 -1.0 -1.3 -1.9 -2.5 -1.9
Balance of Payments
Trade Balance, % of GDP
0.3 -0.7 -1.5 1.0 2.9 1.5 0.9
Current Account, % of GDP
-4.7 -4.4 -4.8 -2.7 -1.3 -2 -2.5
Debt Profile
Central Bank International Reserves (US$ bn)
65.7 62.3 61.5 61.7 63.6 64.6 65.1
Total Public Debt (gross, % of GDP)
20.0 20.1 23.3 23.8 24.8 27.0 28.0
Of which: Foreign-currency denominated (% of GDP)
9.0 8.7 11.1 10.3 8.7 8.7 8.7
Labor Markets
Unemployment Rate (year-end, % of EAP) 6.5 5.2 6.2 6.7 6.9 6.0 6.0
E = Santander estimate. F = Santander forecast Sources: Economy Ministry, Central Bank, and Santander estimates.

Strictly Macro, March 28, 2018 24
URUGUAY
THE PLUS SIDE OF A CHEAP DOLLAR
A cheap U.S. dollar is boosting household consumption and keeping inflation levels under control.
We lowered our year-end FX forecast to UYU 30.5/USD while keeping a downward bias.
Authorities presented the new guidelines for wage negotiations. We expect demand for labor to remain weak.
Marcela Bensión*
(598) 132 6905
A cheap dollar is keeping inflation low and activity on track
The peso closed near UYU/USD 28.4 as of March 16, strengthening 1.3% YTD in addition to 1.7% appreciation in 2017. Peso strength is boosting household consumption, which we estimate to have increased 4% y/y in real terms in the past year (figures to be released on March 22). Imported goods and services, such as new cars, home appliances, and travel agencies, were the top performers among retail sales—unsurprisingly, given that these sectors are closely linked to the U.S. dollar. In addition, outstanding consumer loans picked up to 2.3% y/y in real terms as of January 2018—up from a 4.1% y/y decline as of February 2017—while remaining a modest 25% of household income.
A cheap dollar is also contributing to keep inflation on the verge of the 7% y/y Central Bank target, particularly as prices for fresh fruits and vegetables reverse trend. After fruit and vegetable prices fell by 21% y/y by mid-2017, warm temperatures and heavy rainfall during the winter season led to poorer harvests recently, resulting in a 19% y/y increase in their prices as of February. This led to a surge in headline inflation readings to 7.1% y/y as of February 2018, from 6.7% y/y the previous month.
We recently lowered our year-end FX forecast based on stronger than expected capital inflows, currency portfolio shifts by residents, firmer commodity prices, and persistently high public sector expenses. As a result, we now expect the peso to close 2018 at UYU 30.54/USD, down from our previous forecast of UYU 31.56/USD, implying a 5.9% y/y increase vs. the previous 7%. In addition, we are maintaining a downside bias for the U.S. dollar under an alternative scenario in which the Brazilian real and global commodity prices could close firmer than currently assumed in our models (+6% y/y and 0% y/y, respectively). According to our models, if the BRL were to remain at 3.30/USD throughout the year, the peso would end the year at UYU 29.00/USD, 0.8% y/y higher than December 2017.
Upside risks for the U.S. dollar—domestic inflation and UYU rates—include lower than expected global risk appetite and potential contagion from Argentina if the ARS and the real exchange rate (RER) in the neighbor country continue to weaken at a faster pace than the UYU as has recently occurred. Although the BRL has appeared to be the main regional driver of the UYU since 2003, Argentina is a key provider of tourism inflows—68% of the total—so a strong deviation in the bilateral RER could have a negative impact on tourism inflows, potentially increasing UYU weakening risks as the summer season approaches toward year-end.
Under our baseline scenario, UYU peso yields—which picked up recently in line with inflation readings and stand at 9.0-9.5% along the curve—will likely continue to attract capital inflows despite standing at 2% in real terms, below the 3-4% level estimated as “neutral”. We believe this is a self-sustaining process, which would only be disrupted by unlikely developments such as a “black swan” event or political willingness to tackle a widely unpopular but increasingly needed governmental fiscal reform (a fiscal rule, among others).
The peso strengthened further in 2018
UYU/USD. Daily interbank quotes as of March 19, 2018.
Source: BCU.
Driving import-related retail sales
Retail sales. Selected sectors. % y/y change in real terms.
Source: Cámara Nacional de Comercio y Servicios.
Inflation picks up, driven by fresh foods
Key inflation drivers. % y/y change. Sources: INE and
Santander.
27,5
28,0
28,5
29,0
29,5
Jan-08 Jun-08 Nov-08 Apr-09 Sep-09 Feb-10 Jul-10
-5% 0% 5% 10% 15% 20% 25%
Supermarkets
Travel Agencies
Home App.
Hardware store
New cars
Women clothes
Toy stores
0%
2%
4%
6%
8%
10%
12%
-40%
-20%
0%
20%
40%
60%
Jan-13 Jul-13 Jan-14 Jul-14 Jan-15 Jul-15 Jan-16
Fresh fruits and vegetables
UYU/USD
CPI

Strictly Macro, March 28, 2018 25
The negative side of a cheap dollar: one of many stones in the shoe
Since January 2018, President Vazquez has been facing persistent demands from a growing group of producers that confront increasing production costs. Initially these demands came from the agriculture sector, but they are now widespread within other activity sectors. Among the complaints is a cheap U.S. dollar in a context in which the UYU stands as one of the strongest currencies in the region, together with the ARS. However, this concern is only one of many. In particular, the complaints point to a heavy tax burden and expensive administered fuel and energy prices—the highest in the region—following successive fiscal adjustments lately to finance persistently high and inefficient public sector spending. While the authorities have responded to such demands—introducing transitory measures that reduce taxes and administered prices for specific agriculture sectors—the response was described by producers as being too little, too late. In our view, unless structural fiscal spending is contained, the peso is likely to remain overvalued, increasing financial volatility risks in the face of potential headwinds.
Authorities presented wage guidelines: supportive for household consumption but discouraging for employment
On March 13, government authorities kicked off negotiations between firms and workers by presenting wage guidelines for the next three years. Since 2005, wages in Uruguay have been determined by wage councils composed of firms and worker unions grouped in roughly 200 activity groups. If no agreement is achieved within a reasonable time frame, the government ultimately renders a decision. In this seventh round, authorities kept the main guidelines put forward during the previous round (in 2015)—that is, suggesting nominal wage adjustments subject to: (i) sector performance (“troubled”, “balanced”, or “dynamic”); (ii) wage levels (the authorities have mandated higher increases for workers at lower wage levels and lower wage adjustments for workers with higher wage levels); and (iii) past inflation readings (under normal conditions, past inflation adjustments are suggested every 18 months or at term, while including special clauses that shield against higher inflation readings).
For the first term year, authorities propose nominal wage adjustments ranging from 6.5% y/y to 11.0% y/y. Under our baseline inflation forecast for 2018 (7% y/y), this would imply a modest 0.5% y/y real wage decline for workers earning more than roughly USD 8,000 annually in sectors with declining sales (“troubled”), and, on the opposite side, 3.7% y/y real wage increases for workers with lower income levels within dynamic sectors (>4% real y/y sales increases). All in all, we expect nominal wage increases to average 8.4% y/y—that is, 1.1% y/y on average in real terms. While such an increase is likely to continue favoring household consumption, it will do so at the cost of little or no job creation, in our view. In fact, since late 2014, employment has fallen by 2.1%—some 35,000 jobs—and the unemployment rate has risen from 6.5% to 8.5% as of January 2018 as firms cut labor costs. Less qualified workers receiving lower wages could be those most affected in terms of employment, in our opinion, considering the government’s requirement to grant them higher wage increases. In our view, this fragile situation within the labor market explains why consumer sentiment remained slightly negative as of January (47.8 vs. neutral 50, as per Sura/Universidad Católica).
From an inflation perspective, we believe 8-9% wage increases—not always matched by productivity gains—are likely to continue exerting pressure on non-tradable goods, imposing inflation risks under unexpected capital outflows and peso weakening.
In sum, we remain supportive for the macro picture in 2018, although we continue to acknowledge that declining investment and employment are fragile grounds for sustained GDP growth.
First year wage adjustment guidelines
Proposed official guidelines for first year wage contracts
(2018-2019). % real change. Sources: Ministry of Finance
and Santander.
Real wages likely to continue rising . . .
Real wage average y/y increases. Sources: INE and
Santander.
. . . although at the expense of low employment, in our view
Uruguay payrolls. Average annual change in number of
jobs. Sources: INE and Santander.
-1%
0%
1%
2%
3%
4%
5%
6%
Troub. Balanc. Dynam. Troub. Balanc. Dynam.
Regular wages
Lower wages
0%
1%
1%
2%
2%
3%
3%
4%
4%
5%
2010 2011 2012 2013 2014 2015 2016 2017 2018F
-40.000
-20.000
0
20.000
40.000
60.000
80.000
100.000
2007 2008 2009 2010 2011 2012 2013 2014 2015 2016 2017

Strictly Macro, March 28, 2018 26
URUGUAY
GDP % 2013 2014 2015 2016 2017 2018F 2019F
National Accounts & Activity Indicators
Real GDP (% y/y)
4.6 3.5 0.4 1.5 3.1 3.4 2.7
Private Consumption (% y/y) 66.0 5.5 3.0 -0.5 0.7 3.9 2.7 2.4
Public Consumption (% y/y) 13.8 4.9 2.5 2.2 1.6 0.2 1.6 1.8
Investment (% y/y) 22.9 4.8 0.0 -9.0 0.7 -5.3 3.3 14.2
Exports (% y/y Local Currency) 24.0 -0.1 3.5 -0.6 -1.4 7.5 5.0 4.0
Imports (% y/y Local Currency) 27.3 2.8 0.8 -7.3 -2.9 2.5 2.5 10.0
GDP (US$ bn)
57.6 57.3 53.4 52.5 60.3 65.5 67.3
Monetary and Exchange Rate Indicators
CPI Inflation (Dec Cumulative)
8.5 8.3 9.4 8.1 6.6 7.0 6.8
WPI Inflation (Dec Cumulative)
9.2 10.3 10.0 7.7 6.6 6.7 6.6
US$ Exchange Rate (Average)
20.5 23.2 27.3 30.1 28.7 29.4 31.5
Central Bank Reference Rate (eop)
n/a n/a n/a n/a n/a n/a n/a
Monetary Base (% y/y) 16.1 10.7 9.5 6.1 12.9 8.0 8.0
Fiscal Policy Indicators
**Fiscal Balance, % of GDP
-2.3 -3.5 -3.5 -3.9 -3.4 -3.2 -3.2
**Primary Balance, % of GDP
0.4 -0.6 0.0 -0.6 -0.2 0.1 0.1
Balance of Payments
Trade Balance, % of GDP
-2.3 -1.6 -0.5 2.1 4.5 4.0 3.3
Current Account, % of GDP
-5.0 -4.5 -2.3 -0.1 2.5 1.9 1.2
Debt Profile
Central Bank International Reserves (US$ bn)
16.3 17.6 15.8 13.7 16.0 17.9 21.2
Total Public Debt (gross, % of GDP)
55.3 58.8 61.6 63.5 60.0 59.1 61.2
Of which: Foreign-currency denominated (% of GDP)
37.7 44.3 56.3 53.1 48.9 47.0 47.2
Labor Markets
Unemployment Rate (year-end, % of EAP) 6.5 6.6 7.5 7.8 8.2 7.8 7.4
E = Santander estimate. F = Santander forecast Sources: Banco Central de Uruguay, Finance and Economy Ministry, National Statistics Agency (INE), and Santander.

Strictly Macro, March 28, 2018 27
CONTACTS / IMPORTANT DISCLOSURES
Macro Research Maciej Reluga* Head Macro, Rates & FX Strategy – CEE [email protected] 48-22-534-1888 Sergio Galván* Economist – Argentina [email protected] 54-11-4341-1728 Maurício Molan* Economist – Brazil [email protected] 5511-3012-5724 Juan Pablo Cabrera* Economist – Chile [email protected] 562-2320-3778 Diana Ayala Economist - Colombia [email protected] 212-350-0979 Tatiana Pinheiro* Economist – Peru [email protected] 5511-3012-5179 Piotr Bielski* Economist – Poland [email protected] 48-22-534-1888 Marcela Bensión* Economist – Uruguay [email protected] 5982-1747-5537
Fixed Income Research Diana Ayala Macro, Rates & FX Strategy – Latin America [email protected] 212-407-0979 Juan Arranz* Chief Rates & FX Strategist – Argentina [email protected] 5411-4341-1065 Juan Pablo Cabrera* Chief Rates & FX Strategist – Chile [email protected] 562-2320-3778 David Franco* Macro, Rates & FX Strategy – Latin America [email protected] 44-207-756-6633 Aaron Holsberg Head of Credit Research [email protected] 212-407-0978
Equity Research Christian Audi Head LatAm Equity Research [email protected] 212-350-3991 Andres Soto Head, Andean [email protected] 212-407-0976 Walter Chiarvesio* Head, Argentina [email protected] 5411-4341-1564 Valder Nogueira* Head, Brazil [email protected] 5511-3012-5747 Pedro Balcao Reis* Head, Mexico [email protected] 5255-5269-2264
Electronic Media Bloomberg SIEQ <GO> Reuters Pages SISEMA through SISEMZ
This report has been prepared by Santander Investment Securities Inc. ("SIS"; SIS is a subsidiary of Santander Holdings USA, Inc. which is wholly owned by Banco Santander, S.A. "Santander"), on behalf of itself and its affiliates (collectively, Grupo Santander) and is provided for information purposes only. This document must not be considered as an offer to sell or a solicitation of an offer to buy any relevant securities (i.e., securities mentioned herein or of the same issuer and/or options, warrants, or rights with respect to or interests in any such securities). Any decision by the recipient to buy or to sell should be based on publicly available information on the related security and, where appropriate, should take into account the content of the related prospectus filed with and available from the entity governing the related market and the company issuing the security. This report is issued in Spain by Santander Investment Bolsa, Sociedad de Valores, S.A. (“Santander Investment Bolsa”), and in the United Kingdom by Banco Santander, S.A., London Branch. Santander London is authorized by the Bank of Spain. This report is not being issued to private customers. SIS, Santander London and Santander Investment Bolsa are members of Grupo Santander.
ANALYST CERTIFICATION: The following analysts hereby certify that their views about the companies and their securities discussed in this report are accurately expressed, that their recommendations reflect solely and exclusively their personal opinions, and that such opinions were prepared in an independent and autonomous manner, including as regards the institution to which they are linked, and that they have not received and will not receive direct or indirect compensation in exchange for expressing specific recommendations or views in this report, since their compensation and the compensation system applying to Grupo Santander and any of its affiliates is not pegged to the pricing of any of the securities issued by the companies evaluated in the report, or to the income arising from the businesses and financial transactions carried out by Grupo Santander and any of its affiliates: Rodrigo Park*, Mauricio Molan*, Juan Pablo Cabrera*, Diana Ayala, Pedro Balcao*, Tatiana Pinheiro*, Marcela Bension*, David Franco*, Martin Mansur*, Cristian Cancela*, Luciano Sobral*, Rafael Camarena*, and Salvador Orozco*.
*Employed by a non-US affiliate of Santander Investment Securities Inc. and not registered/qualified as a research analyst under FINRA rules, and is not an associated person of the member firm, and, therefore, may not be subject to the FINRA Rule 2242 and Incorporated NYSE Rule 472 restrictions on communications with a subject company, public appearances, and trading securities held by a research analyst account.
The information contained herein has been compiled from sources believed to be reliable, but, although all reasonable care has been taken to ensure that the information contained herein is not untrue or misleading, we make no representation that it is accurate or complete and it should not be relied upon as such. All opinions and estimates included herein constitute our judgment as at the date of this report and are subject to change without notice.
Any U.S. recipient of this report (other than a registered broker-dealer or a bank acting in a broker-dealer capacity) that would like to effect any transaction in any security discussed herein should contact and place orders in the United States with SIS, which, without in any way limiting the foregoing, accepts responsibility (solely for purposes of and within the meaning of Rule 15a-6 under the U.S. Securities Exchange Act of 1934) for this report and its dissemination in the United States.
© 2018 by Santander Investment Securities Inc. All Rights Reserved.