Fishery View Improvement of Time Series Line Chart Visualization of Fishery Data CPSC 533C Final...
12
Fishery View Improvement of Time Series Line Chart Visualization of Fishery Data CPSC 533C Final Presentation Ying Zhang & Lan Wu December 19 th 2005
-
date post
21-Dec-2015 -
Category
Documents
-
view
217 -
download
0
Transcript of Fishery View Improvement of Time Series Line Chart Visualization of Fishery Data CPSC 533C Final...

Fishery ViewImprovement of Time Series Line Chart Visualization of
Fishery Data
CPSC 533CFinal Presentation
Ying Zhang & Lan Wu
December 19th 2005
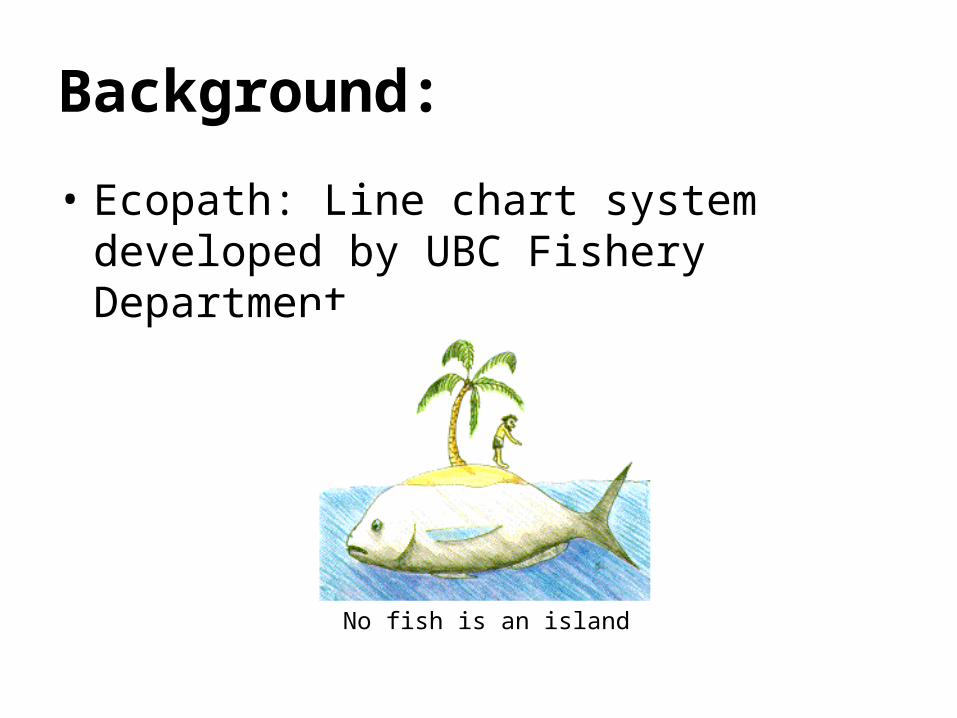
Background:
• Ecopath: Line chart system developed by UBC Fishery Department
No fish is an island
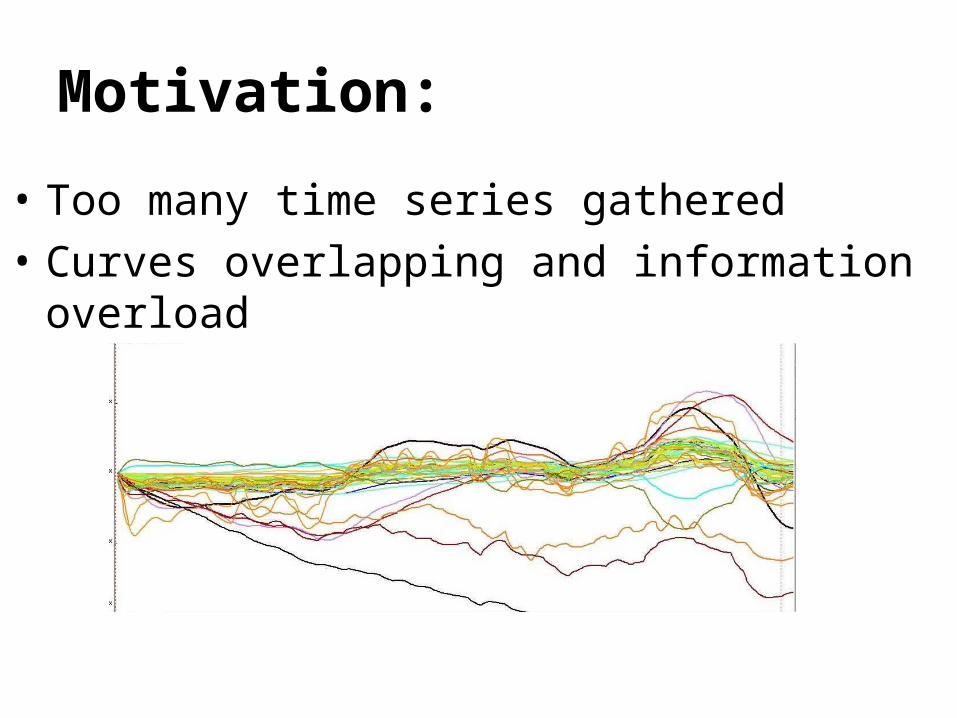
Motivation:
• Too many time series gathered• Curves overlapping and information
overload

Data:
• Focus: 45 fishes– The diet matrix (45 by 45 mat)– Their population at 648 discrete time points before and after fishing strategy applied (two 45 by 648 mat)

Task and Infovis Solution 1:• Task: Find the related fishes of a specific fish
• Solution: Brushing and highlighting

Task and Infovis Solution 2:• Task: Evaluate the effect of human’s fishing
• Solution: Difference graph

Task and Infovis Solution 3:• Task: Find the patterns fish populations match
• Solution: Clustering

High Level Implementation:
• Programming Platform: Visual Studio.Net
• Graphics Package: Zedgraph
• Clustering Algorithm– Distance Measure:
(Root Mean Square)
2 /rms i iD Y X M

Demo coming~

Unfinished/Future Work:
• Repeated Colors
• Overlapping reduced but still not eliminated
• Code Optimization
• More user interaction
Lessons learned:
• Understanding users’ preferences
• Developing based on an existing framework or using a visualization package

Thank you !
?