Fiscal Year 2016 Budget Book - University of Missouri System · 2019-08-24 · The University of...
35
FISCAL YEAR 2016 BUDGET
Transcript of Fiscal Year 2016 Budget Book - University of Missouri System · 2019-08-24 · The University of...

Fiscal Year 2016 Budget


TABLE OF CONTENTS
PAGE Budget Introduction and Overview...................................................................................... 1
Statistical Highlights............................................................................................................. 3
All Funds Budget Summary................................................................................................. 5
Current Funds Budget Summary ……................................................................................ 6
Operations Fund Budget Summary...................................................................................... 7
Auxiliary Enterprises Fund Budget Summary..................................................................... 8
Hospital Operations Fund Budget Summary....................................................................... 9
Current Funds Expenditures by Program ............................................................................ 10
Operations Fund Expenditures by Program ......................................................................... 11
Expenditures by Program - Columbia…............................................................................... 12
Expenditures by Program - Kansas City…............................................................................ 13
Expenditures by Program - Missouri S&T…........................................................................ 14
Expenditures by Program - St. Louis…................................................................................. 15
Budget Summary University of Missouri - Consolidated………............................................................... 16 University of Missouri - Columbia .............................................................................. 17 University of Missouri - Kansas City............................................................................ 18 Missouri University of Science and Technology.......................................................... 19 University of Missouri - St. Louis................................................................................. 20 University of Missouri - System Administration......................................................... 21 University of Missouri - University-wide Units........................................................... 22 University of Missouri - Hospital Units........................................................................ 23
Operations Fund Budget Summary by Administrative Unit University of Missouri - Columbia................................................................................ 24 University of Missouri - Kansas City............................................................................ 25 Missouri University of Science and Technology.......................................................... 26 University of Missouri - St. Louis………………......................................................... 27 University of Missouri - System Administration.......................................................... 28 University of Missouri - University-wide Units............................................................ 29
Other Curators’ Programs Budget Summary......................................................................... 30


University of Missouri System FY2016 Budget
Introduction and Overview
The University of Missouri System Operating Budget Book presents summary information on total sources and uses of the University’s funds by major fund groups. Additional information is provided on the current funds which include resources of the University that are expendable for any purpose directly related to the primary missions of the University, i.e., instruction, research, and public service, as well as related support services. Current funds can be divided into restricted and unrestricted funds. Restricted funds are those that are restricted in use by the donor or supporting agency.
Budget planning and development was guided by the campus strategic plans and the policy decisions and planning parameters of the President and the Board of Curators. Net tuition and fee revenues included in these budgets are based on tuition and required fee rates approved by the Board. The increase in net fee revenues included in the budget is driven by enrollment changes related to student mix, enrollment growth, and financial aid combined with approved rate increases in tuition, supplemental course fees, and other required fees.
Assumptions for planning included the following:
• State appropriations for the University of Missouri are subject to a 3.0% withholding bythe State of Missouri. The University’s budget was developed and entered into theUniversity’s financial system based on the assumption that state appropriation revenueswould equal 97.0% of state funds appropriated to the University. State appropriations forgeneral operations include $5.6 million in performance funding allocated to the campusesfor strategic priorities and $848,750 in legislative directives at the campuses
• Tuition and fee budgets are based on the tuition and fee rates as approved by the Board ofCurators in February 2015. Changes in enrollments, student mix, and institutional aid aredetermined by the individual campuses. In general enrollments are planned to increasemodestly from FY2015 and increased investments in institutional student aid are planned.
• The following salary and wages guidelines were used by the campuses for FY2016 budgetplanning:
Each campus will recommend for Board approval a salary and wage budget consistentwith campus needs. Budget increases should support faculty and staff salary merit, marketand equity adjustments consistent with the campus’s faculty and staff recruitment andretention strategy as well as their position relative to their peers.
Salary and wage budget increases varied by campus from a 0%-2% increase in the salaryand wage base.
1

• The flat benefit rate assessment remained unchanged at 27.72% of eligible salaries plusapplicable FICA charges.
• The budget reflects actions taken by the campuses to balance their budget and reallocateresources to fund their strategic priorities.
The budgets reported in this document are based on the original detail budgets for the University as entered into the Hyperion Budget system for the fiscal year.
2

Campuses: Columbia, Kansas City, Missouri S&T, and St. Louis
Enrollment, Fall 2015 Head Count FTE MU 35,424 30,665 UM-Kansas City 16,685 11,743 MO Science & Technology 8,886 7,489 UM-St. Louis 16,738 9,919
Total Enrollment 77,733 59,816 (76 percent undergraduate, 24 percent graduate and first professional students)
Enrollment has grown by 39% or over 21,000 students since FY2001.
UNIVERSITY OF MISSOURI SYSTEMStatistical Highlights
56,030
77,733
50,000
55,000
60,000
65,000
70,000
75,000
80,000
Head
coun
t Enr
ollm
ent
Enrollment Growth Fall 2000 - Fall 2015
39% Growth
46% 51%
21% 20%
11%
12%
22%
17%
0
10,000
20,000
30,000
40,000
50,000
60,000
70,000
80,000
Head Count FTE
Enrollment, Fall 2015
UM-St. Louis
MO Science & Technology
UM-Kansas City
MU
3

Since FY2001, state appropriations per FTE student have declined while net tuition and fees per FTE student have increased. However, the combined total has remained basically flat. Adjusted for inflation, the combined total funding per FTE student has actually fallen 17%, or $3,044 per FTE student, as compared to FY2001.
Degrees and Certificates Awarded, FY2015Undergraduate Certificate 55 Bachelor's 11,360 Graduate Certificate 780 Master's 4,204 Educational Specialist 122 Doctor's-research/scholarship 712 Doctor's-professional practice 876
Total Degrees and Certificates 18,109
Faculty and Staff Headcount, Fall 2014Total Faculty 5,937 (66 percent full-time, 34 percent part-time)
Total Staff 17,786 (78 percent full-time, 22 percent part-time)
Total faculty and staff 23,723
UNIVERSITY OF MISSOURI SYSTEMStatistical Highlights
$20,549
$0
$5,000
$10,000
$15,000
$20,000
$25,000
$0
$5,000
$10,000
$15,000
$20,000
$25,000
State Appropriations plus Net Tuition & Fees per FTE Student*
State Appropriations/FTE Net Tuition & Fees/FTE Total/FTE CPI Adjusted
Gap17%
* Includes State Appropriations and Net Tuition & Fees for Operations Fund
4

Fund Definition Amount
OperationsThe Operations fund is where the majority of the University's instructional and public service activities are budgeted and accounted for. It is funded primarily by tuition and fees and state appropriations for operations.
1,227,325,992
Other Unrestricted
Other Unrestricted funds are comprised of Service Operations, Continuing Education, and Self Insurance Funds. Service Operations provide services to departments or other organizational units within the University. Continuing Education extends the campus course offerings outside of the normal time, space, and campus location. Self Insurance Funds include medical benefits, dental benefits, educators' legal liability, medical malpractice, auto and general liability, long-term liability, and worker's compensation.
90,424,231
Auxiliary EnterprisesAuxiliary Enterprises are self-supporting activities that provide services primarily to students, faculty, staff, and patients.
615,931,773
Hospital OperationsThe Hospital Operations fund is primarily composed of the combined clinical operations of MU Hospitals & Clinics, Ellis Fischel Cancer Center, Columbia Regional Hospital, Misssouri Psychiatric Center, and the Missouri Rehabilitation Center.
795,636,695
Restricted State, Gifts, Endowments Distribution
These are funds restricted by third parties. They are comprised primarily of gifts, endowment distributions, and restricted state appropriations.
64,437,131
Grants and ContractsGrants and Contracts are comprised of restricted funds including federal grants, Pell grants, state grants, and other grants and contracts.
197,920,451
Total Current Funds 2,991,676,274
Loan, Endowment and Plant
Loan funds are used to record activity on funds available for loans to students. Endowment and similar funds include all gifts, bequests, and other funds directed to be used to support a University progam in perpertuity. Ninety percent of the endowment fund is restricted for use by donors and most of the remaining ten percent has been designated by the Board or administration for special use. The plant fund group is used to record acquisition and replacement of assets, to pay off debt, and to record the net investment in assets (equity) from both current expenditures and reserves for renewal and replacement.
148,001,039
Total University Funds 3,139,677,312
UNIVERSITY OF MISSOURI SYSTEMFiscal Year 2016 All Funds Revenues Budget Summary
Operations39.1%
Other Unrestricted2.9%
Auxiliary Enterprises19.6%
Hospital Operations25.3%
Restricted State, Gifts, Endowments Distribution
2.1%Grants and Contracts
6.3%
Loan, Endowment and Plant
4.7%
5

FY14 FY15 FY16Actual Actual Budget
Beginning Net Assets 1,146,209,404 788,023,692 756,571,269 - Revenues 2,917,336,809 2,998,975,441 2,991,676,274 -
Compensation 1,709,750,509 1,803,909,363 1,876,455,088 Other Expenses 841,185,057 859,010,996 820,295,868
Expenditures 2,550,935,566 2,662,920,359 2,696,750,955 - Transfers (222,212,672) (267,115,849) (213,751,755) -
Change in Net Assets 144,188,571 68,939,233 81,173,563
Effect of Change in Accounting Principle * (502,374,284)
Change in Net Assets, as Adjusted (358,185,713)
Ending Net Assets 788,023,692 856,962,925 837,744,833
* Accounting change to comply with GASB67 and 68 related to reporting of university pension plan
UNIVERSITY OF MISSOURI SYSTEMFiscal Year 2016 Current Funds Budget Summary
Sales & Services -Hospital & Clinics
26.2%
Sales & Services -Auxiliary & Educational
18.0%Other
Income9.5%
Grants and Contracts
10.7%
State Appropriations
14.6%
Net Tuition & Fees21.0%
FY16 Current Funds Revenues: $3.0 Billion
Compensation69.9%
Other Operating Expense28.8%
Capital Expenditures
1.3%
FY16 Current Funds Expenditures: $2.7 Billion
25% 26% 26%
17% 18% 18%
20% 20% 21%
14% 15% 15%
12% 11% 11%
12% 10% 9%
$0
$500
$1,000
$1,500
$2,000
$2,500
$3,000
FY14 Actual FY15 Actual FY16 Budget
Mill
ions
Total Budget by Revenue Source
Other Income
Grants and Contracts
State Appropriations
Net Tuition & Fees
Sales & Services - Auxiliary & Educational
Sales & Services - Hospital & Clinics
6

FY14 FY15 FY16Actual Actual Budget
Beginning Net Assets 471,562,924 451,261,363 471,487,143
Revenues 1,177,112,005 1,232,124,874 1,227,325,992
Compensation 910,052,746 919,072,314 951,602,197 Other Expenses 246,195,305 252,018,384 237,552,637
Expenditures 1,156,248,051 1,171,090,698 1,189,154,834
Transfers (41,165,514) (13,224,563) (433)
Change in Net Assets (20,301,561) 47,809,613 38,170,725
Ending Net Assets 451,261,363 499,070,977 509,657,868
Operations Fund Key Points
• Funded primarily (87.2%) by net tuition & fees and state appropriations• Compensation is 80% of expenses.• 58.2% of expenses on primary programs of Instruction, Research, and Public Service• Transfers are primarily to the plant fund.
UNIVERSITY OF MISSOURI SYSTEMFiscal Year 2016 Operations Fund Budget Summary
Net Tuition & Fees
51.9%
State Appropriations
35.3%
Other Income11.0%
Sales and Services
1.7%
FY16 Operations Fund Revenues: $1.23 Billion
Salaries & Wages61.1%
Benefits18.9%
Other Operating Expense
4.0%Fuel & Utilities
4.3%
Capital Expenditures
2.5%
Computing & Equipment
3.7%
Travel, Training & Business Meeting
2.6%
Professional & Consulting
2.9%
FY16 Operations Fund Expenditures:$1.19 Billion
7

FY14 FY15 FY16Actual Actual Budget
Beginning Net Assets 30,912,869 32,488,961 65,430,701
Revenues 536,514,774 605,253,209 615,931,773
Compensation 288,273,589 327,025,731 341,590,721 Other Expenses 187,535,841 197,828,851 197,254,517
Expenditures 475,809,430 524,854,582 538,845,238
Transfers* (59,129,252) (76,909,070) (64,042,541)
Change in Net Assets 1,576,092 3,489,557 13,043,993
Ending Net Assets 32,488,961 35,978,518 78,474,694
* Transfers are primarily to the plant fund for maintenance & repair, capital projects and debt service.
UNIVERSITY OF MISSOURI SYSTEMFiscal Year 2016 Auxiliary Enterprises Fund Budget Summary
Compensation63.4%
Other Operating Expense22.4%
Computing & Equipment
4.5%
Travel, Training & Business Meeting
3.4%Fuel & Utilities
3.0%Professional &
Consulting2.9%
Capital Expenditures
0.3%
FY16 Auxiliary Enterprises Fund Expenditures:$538.8 Million
University Physicians
29.4%
Residential Life19.8%
Intercollegiate Athletics Auxiliary
11.9%
Bookstore8.9%
UMKC Medical & Dental Services
6.4%
MOREnet4.6%Recreation Facilities
& University Centers
4.1%
MU Veterinary Medicine
Hospital & Lab2.6%
Research Reactor2.6%
Parking2.2%
Other Auxiliaries7.6%
FY16 Auxiliary Enterprises Fund Revenues by Key Auxiliaries: $615.9 Million
8

FY14 FY15 FY16Actual Actual Budget
Beginning Net Assets 309,466,286 351,823,546 355,189,137
Revenues 758,401,693 790,895,108 795,636,695
Compensation 317,329,829 323,659,245 339,636,916 Other Expenses 337,128,061 356,530,215 370,567,675
Expenditures 654,457,890 680,189,461 710,204,591
Transfers* (61,586,544) (94,709,379) (87,981,333)
Change in Net Assets 42,357,260 15,996,268 (2,549,229)
Ending Net Assets 351,823,546 367,819,814 352,639,908
* Transfers are primarily to the plant fund for maintenance & repair, capital equipment & projects and debt service.
UNIVERSITY OF MISSOURI SYSTEMFiscal Year 2016 Hospital Operations Fund Budget Summary
Sales and Services98.4%
Other Income1.6%
FY16 Hospital Operations Fund Revenues: $795.6 Million
Compensation47.8%
Other Operating Expense41.9%
Computing & Equipment
6.4%
Fuel & Utilities1.9%Professional &
Consulting1.7%
Travel, Training & Business Meeting
0.3%
FY16 Hospital Operations Fund Expenditures:$710.2 Million
9

FY14 FY15 FY16Actual Actual Budget
Instruction $623,167,840 $638,395,068 $650,487,861Research 190,148,986 189,094,055 166,820,254 Public Service 145,637,476 153,474,851 140,833,312 Academic Support 138,556,439 147,633,107 153,284,921 Student Services 83,650,566 91,624,970 100,782,607 Institutional Support 122,669,153 128,578,514 116,350,823 Operation and Maintenance of Plant 115,148,665 108,419,817 118,421,870
Total Educational & General 1,418,979,125 1,457,220,382 1,446,981,648
Hospitals 656,147,011 680,845,395 710,924,069 Auxiliaries 475,809,430 524,854,582 538,845,238
Total Expenditures 2,550,935,566 * $2,662,920,359 $2,696,750,955
* Excludes an adjustment of $502,374,284 due to change in accounting principle
† Primary programs include Instruction, Research and Public Service.
UNIVERSITY OF MISSOURI SYSTEMFiscal Year 2016 Current Funds Expenditures by Program
Instruction24.1%
Research6.2%
Public Service5.2%
Academic Support
5.7%Student Services
3.7%Institutional
Support4.3%
Operation and Maintenance of
Plant4.4%
Hospitals26.4%
Auxiliaries20.0%
FY16 Current Funds Expenditures: $2.7 Billion
Instruction45.0%
Research11.5%
Public Service9.7%
Academic Support10.6%
Student Services7.0%
Institutional Support
8.0%
Operation and Maintenance of Plant
8.2%
FY16 Current Funds Educational & General Expenditures: $1.4 Billion
68% 67% 66%
32% 33% 34%
$0
$200
$400
$600
$800
$1,000
$1,200
$1,400
$1,600
FY14 Actual FY15 Actual FY16 Budget
Mill
ions
Primary Programs vs. Other Educational & General Programs
Primary Programs† Other Educational & General Programs
10

FY14 FY15 FY16Actual Actual Budget
Instruction $570,915,472 $573,476,675 $580,108,404Research 63,361,661 65,867,016 57,158,783 Public Service 52,047,830 54,529,571 55,270,603 Academic Support 133,455,133 140,770,491 144,651,803 Student Services 77,226,424 82,977,002 85,300,076 Institutional Support 140,478,339 144,263,278 148,171,864 Operation and Maintenance of Plant 118,763,192 109,206,665 118,493,301
Total Expenditures $1,156,248,051 $1,171,090,698 $1,189,154,834
† Primary programs include Instruction, Research and Public Service.
UNIVERSITY OF MISSOURI SYSTEMFiscal Year 2016 Operations Fund Expenditures by Program
Instruction48.8%
Research4.8%
Public Service4.6%
Academic Support12.2%
Student Services
7.2%
Institutional Support12.5%
Operation and Maintenance
of Plant10.0%
FY16 Operations Fund Expenditures: $1.2 Billion
59% 59% 58%
41% 41% 42%
$0
$200
$400
$600
$800
$1,000
$1,200
$1,400
FY14 Actual FY15 Actual FY16 Budget
Mill
ions
Primary Programs vs. Other Educational & General Programs
Primary Programs† Other Educational & General Programs
11

Current Funds Operations FundFY16 Budget FY16 Budget
Instruction $332,531,495 $297,056,625Research 121,635,332 45,020,983 Public Service 100,869,730 46,737,396 Academic Support 85,842,467 79,936,643 Student Services 41,827,054 33,026,068 Institutional Support 27,426,788 49,725,396 Operation and Maintenance of Plant 61,594,069 62,156,900
Total Educational & General 771,726,935 613,660,011
Auxiliaries 427,109,817 -
Total Expenditures 1,198,836,752$ 613,660,011$
† Primary programs include Instruction, Research and Public Service.
UNIVERSITY OF MISSOURI SYSTEM - ColumbiaFiscal Year 2016 Expenditures by Program
Instruction48.4%
Research7.3%
Public Service7.6%
Academic Support13.0%
Student Services
5.4%Institutional
Support8.1%
Operation and Maintenance of Plant
10.1%
FY16 Operations Fund Expenditures: $614 Million
72%
63%
28%
37%
$0
$100
$200
$300
$400
$500
$600
$700
$800
$900
Current Funds Operations Fund
Mill
ions
Primary Programs vs. Other Educational & General Programs
Primary Programs† Other Educational & General Programs
Instruction27.7%
Research10.1%
Public Service
8.4%
Academic Support
7.2%
Student Services
3.5%
Institutional Support
2.3%Operation and Maintenance of
Plant5.1%
Auxiliaries35.6%
FY16 Current Funds Expenditures: $1,199 Million
12
Current Funds Operations FundFY16 Budget FY16 Budget
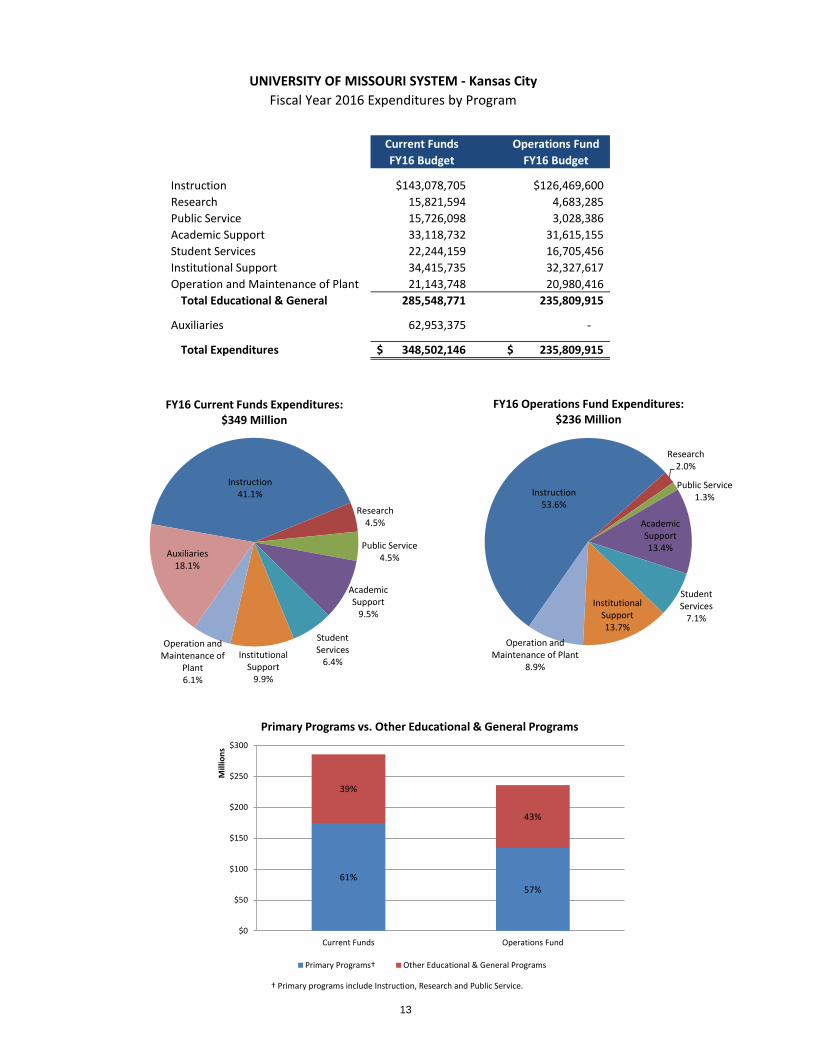
Instruction $143,078,705 $126,469,600Research 15,821,594 4,683,285 Public Service 15,726,098 3,028,386 Academic Support 33,118,732 31,615,155 Student Services 22,244,159 16,705,456 Institutional Support 34,415,735 32,327,617 Operation and Maintenance of Plant 21,143,748 20,980,416
Total Educational & General 285,548,771 235,809,915
Auxiliaries 62,953,375 -
Total Expenditures 348,502,146$ 235,809,915$
† Primary programs include Instruction, Research and Public Service.
UNIVERSITY OF MISSOURI SYSTEM - Kansas CityFiscal Year 2016 Expenditures by Program
Instruction53.6%
Research2.0%
Public Service1.3%
Academic Support13.4%
Student Services
7.1%Institutional
Support13.7%
Operation and Maintenance of Plant
8.9%
FY16 Operations Fund Expenditures: $236 Million
61%57%
39%
43%
$0
$50
$100
$150
$200
$250
$300
Current Funds Operations Fund
Mill
ions
Primary Programs vs. Other Educational & General Programs
Primary Programs† Other Educational & General Programs
Instruction41.1%
Research4.5%
Public Service4.5%
Academic Support
9.5%
Student Services
6.4%Institutional
Support9.9%
Operation and Maintenance of
Plant6.1%
Auxiliaries18.1%
FY16 Current Funds Expenditures: $349 Million
13

Current Funds Operations FundFY16 Budget FY16 Budget
Instruction $87,256,263 $76,472,393Research 20,933,805 4,275,704 Public Service 3,247,061 1,472,516 Academic Support 7,585,435 7,429,701 Student Services 17,247,538 16,304,447 Institutional Support 19,407,335 19,058,925 Operation and Maintenance of Plant 17,483,408 17,161,542
Total Educational & General 173,160,845 142,175,228
Auxiliaries 14,035,608 -
Total Expenditures 187,196,453$ 142,175,228$
† Primary programs include Instruction, Research and Public Service.
UNIVERSITY OF MISSOURI SYSTEM - Missouri S&TFiscal Year 2016 Expenditures by Program
Instruction53.8%
Research3.0%
Public Service
1.0%
Academic Support
5.2%
Student Services11.5%
Institutional Support13.4%
Operation and Maintenance
of Plant12.1%
FY16 Operations Fund Expenditures: $142 Million
64%58%
36%
42%
$0
$20
$40
$60
$80
$100
$120
$140
$160
$180
$200
Current Funds Operations Fund
Mill
ions
Primary Programs vs. Other Educational & General Programs
Primary Programs† Other Educational & General Programs
Instruction46.6%
Research11.2%
Public Service1.7%
Academic Support
4.1%Student Services
9.2%
Institutional Support10.4%
Operation and Maintenance of
Plant9.3%
Auxiliaries7.5%
FY16 Current Funds Expenditures: $187 Million
14
Current Funds Operations FundFY16 Budget FY16 Budget
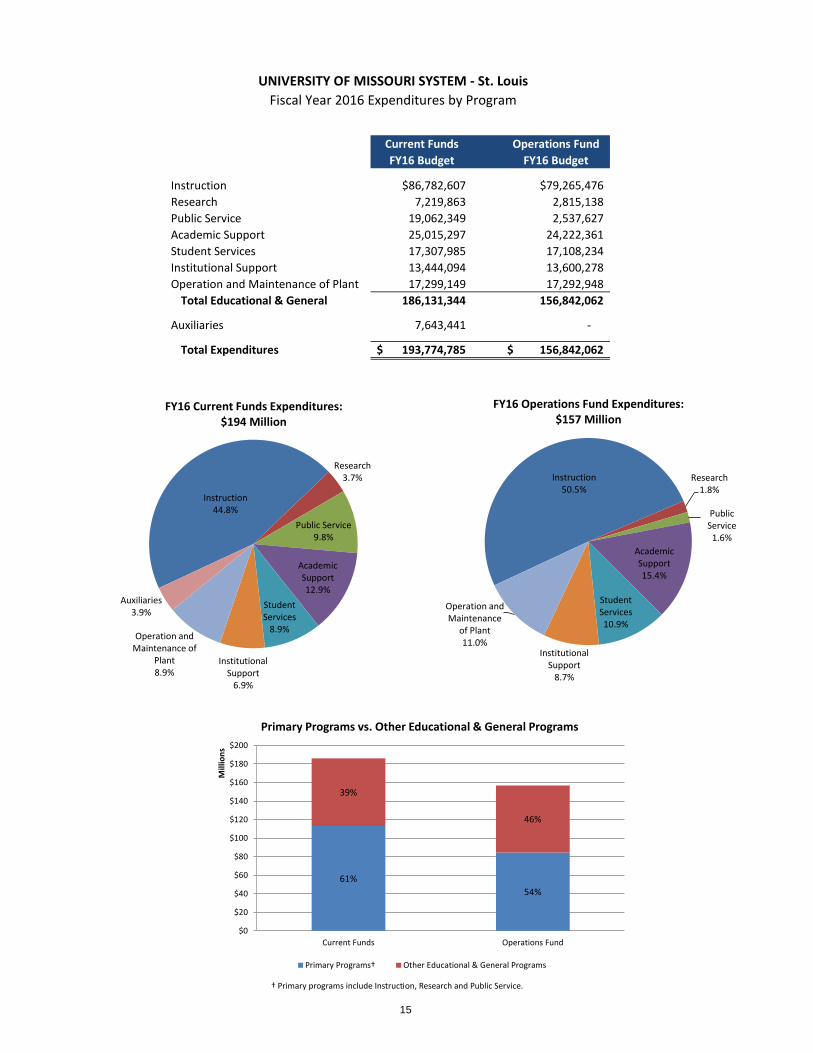
Instruction $86,782,607 $79,265,476Research 7,219,863 2,815,138 Public Service 19,062,349 2,537,627 Academic Support 25,015,297 24,222,361 Student Services 17,307,985 17,108,234 Institutional Support 13,444,094 13,600,278 Operation and Maintenance of Plant 17,299,149 17,292,948
Total Educational & General 186,131,344 156,842,062
Auxiliaries 7,643,441 -
Total Expenditures 193,774,785$ 156,842,062$
† Primary programs include Instruction, Research and Public Service.
UNIVERSITY OF MISSOURI SYSTEM - St. LouisFiscal Year 2016 Expenditures by Program
Instruction50.5%
Research1.8%
Public Service
1.6%Academic Support15.4%
Student Services10.9%
Institutional Support
8.7%
Operation and Maintenance
of Plant11.0%
FY16 Operations Fund Expenditures: $157 Million
61%54%
39%
46%
$0
$20
$40
$60
$80
$100
$120
$140
$160
$180
$200
Current Funds Operations Fund
Mill
ions
Primary Programs vs. Other Educational & General Programs
Primary Programs† Other Educational & General Programs
Instruction44.8%
Research3.7%
Public Service9.8%
Academic Support12.9%
Student Services
8.9%
Institutional Support
6.9%
Operation and Maintenance of
Plant8.9%
Auxiliaries3.9%
FY16 Current Funds Expenditures: $194 Million
15

Budget Summary by Fund by AccountFY16 - YearTotal Budget Original for All Programs, All Classes, All_Projects
* Primarily interest expense
All Organizations (Consolidated)
OperationsOther
UnrestrictedAuxiliary
EnterprisesHospital
Operations
Restricted State, Gifts, Endowment
DistributionGrants and Contracts
Total Current Funds
Loan, Endowment, and
Plant Funds Total All FundsRevenues
Tuition and Fees $829,571,347 $70,135,062 $0 $0 $2,218 $0 $899,708,627 $0 $899,708,627Less: Scholarship Allowances (192,047,459) (2,660,810) 0 0 (31,446,188) (72,698,000) (298,852,457) 0 (298,852,457)
Net Tuition and Fees 637,523,888 67,474,252 0 0 (31,443,970) (72,698,000) 600,856,170 0 600,856,170
State Appropriation 433,722,473 0 0 0 4,544,140 0 438,266,613 48,600,000 486,866,613Grants - Federal 0 0 0 0 0 143,600,000 143,600,000 235,000 143,835,000Grants - Federal Pell 0 0 0 0 0 59,600,000 59,600,000 0 59,600,000State Grants & Contracts 0 0 0 0 0 41,284,452 41,284,452 0 41,284,452Other Grants & Contracts 0 0 0 0 0 74,900,000 74,900,000 0 74,900,000Gift Revenues 1,085,770 0 14,935,000 0 36,809,266 0 52,830,036 48,429,214 101,259,250Recovery of F & A 48,866,000 0 0 0 0 (48,866,000) 0 0 0Endowment & Investment Income 26,844,497 13,752,643 222,850 8,911,440 49,105,979 0 98,837,409 38,438,708 137,276,117Sales & Services Income 21,137,564 3,058,344 600,773,923 786,725,255 180,576 0 1,411,875,662 0 1,411,875,662Other Income 58,145,801 6,138,991 0 0 5,241,140 100,000 69,625,932 12,298,117 81,924,049
Total Revenues 1,227,325,992 90,424,231 615,931,773 795,636,695 64,437,131 197,920,451 2,991,676,274 148,001,039 3,139,677,312
ExpendituresSalaries & Wages 726,429,956 51,753,202 271,682,505 252,817,498 27,414,132 102,961,190 1,433,058,482 0 1,433,058,482Benefit Expense 225,172,241 23,272,394 69,908,216 86,819,418 8,058,620 30,165,718 443,396,605 0 443,396,605
Compensation 951,602,197 75,025,595 341,590,721 339,636,916 35,472,751 133,126,907 1,876,455,088 0 1,876,455,088Other Operating Expense 207,779,106 (93,491,655) 195,003,062 370,467,679 30,365,774 62,316,288 772,440,254 29,980,256 802,420,510Capital Expenditures 29,693,793 202,342 1,877,063 0 2,006,956 1,114,999 34,895,154 (34,895,154) 0Non-Operating Expense* 79,738 12,408,685 374,392 99,996 (2,350) 0 12,960,461 75,512,123 88,472,584Depreciation Expense 0 0 0 0 0 0 0 183,377,809 183,377,809
Other Expense 237,552,637 (80,880,628) 197,254,517 370,567,675 32,370,379 63,431,288 820,295,868 253,975,034 1,074,270,902
Total Expenditures 1,189,154,834 (5,855,033) 538,845,238 710,204,591 67,843,131 196,558,195 2,696,750,955 253,975,034 2,950,725,990
Transfers - Increase/(Decrease)Intra Unrestricted CurrentFund 31,457,067 (31,809,925) 1,622,786 (1,446,855) 72,364 0 (104,563) 104,563 0Mandatory Transfers (20,697,885) (11,142,208) (55,513,672) (22,667,724) (1,218,858) 1,149,998 (110,090,349) 110,090,349 0Non-Mandatory Transfers (10,759,615) (21,318,363) (10,151,656) (63,866,754) 5,001,304 (2,461,760) (103,556,843) 105,174,006 1,617,163
Total Transfers (433) (64,270,495) (64,042,541) (87,981,333) 3,854,810 (1,311,762) (213,751,755) 215,368,918 1,617,163
Change in Net Assets 38,170,725 32,008,769 13,043,993 (2,549,229) 448,811 50,495 81,173,563 109,394,923 190,568,486
Ending Net Assets $509,657,868 ($261,466,740) $78,474,694 $352,639,908 $159,347,608 ($908,505) $837,744,833 $3,350,808,850 $4,188,553,683
16

Budget Summary by Fund by AccountFY16 - YearTotal Budget Original for All Programs, All Classes, All_Projects
* Primarily interest expense
COLUM - Columbia (Includes MU & Extention)
OperationsOther
UnrestrictedAuxiliary
EnterprisesHospital
Operations
Restricted State, Gifts, Endowment
DistributionGrants and Contracts
Total Current Funds
Loan, Endowment, and
Plant Funds Total All FundsRevenues
Tuition and Fees $424,461,919 $36,098,836 $0 $0 $0 $0 $460,560,755 $0 $460,560,755Less: Scholarship Allowances (105,608,619) (69,210) 0 0 (18,546,273) (31,000,000) (155,224,103) 0 (155,224,103)
Net Tuition and Fees 318,853,300 36,029,626 0 0 (18,546,273) (31,000,000) 305,336,652 0 305,336,652
State Appropriation 220,491,068 0 0 0 3,590,140 0 224,081,208 24,000,000 248,081,208Grants - Federal 0 0 0 0 0 102,400,000 102,400,000 80,000 102,480,000Grants - Federal Pell 0 0 0 0 0 23,200,000 23,200,000 0 23,200,000State Grants & Contracts 0 0 0 0 0 29,600,000 29,600,000 0 29,600,000Other Grants & Contracts 0 0 0 0 0 44,600,000 44,600,000 0 44,600,000Gift Revenues 0 0 14,270,000 0 11,129,281 0 25,399,281 33,689,600 59,088,881Recovery of F & A 35,266,000 0 0 0 0 (35,266,000) 0 0 0Endowment & Investment Income 5,481,315 0 119,274 0 34,297,177 0 39,897,766 19,209,566 59,107,332Sales & Services Income 13,253,140 2,872,544 465,993,643 0 17,130 0 482,136,457 0 482,136,457Other Income 40,857,587 4,617,424 0 0 327,867 0 45,802,878 805,315 46,608,193
Total Revenues 634,202,409 43,519,594 480,382,916 0 30,815,322 133,533,999 1,322,454,241 77,784,481 1,400,238,723
ExpendituresSalaries & Wages 379,388,560 37,047,599 226,587,081 0 13,221,808 68,162,227 724,407,274 0 724,407,274Benefit Expense 116,699,154 11,401,260 57,498,199 0 3,899,420 20,934,474 210,432,507 0 210,432,507
Compensation 496,087,714 48,448,858 284,085,280 0 17,121,228 89,096,700 934,839,781 0 934,839,781Other Operating Expense 106,104,416 (56,013,385) 141,966,782 0 13,714,448 44,940,537 250,712,798 20,072,371 270,785,168Capital Expenditures 11,406,391 110,842 683,363 0 604,895 114,999 12,920,491 (12,920,491) 0Non-Operating Expense* 61,488 (71,845) 374,391 0 (350) 0 363,684 29,275,549 29,639,232Depreciation Expense 0 0 0 0 0 0 0 76,215,616 76,215,616
Other Expense 117,572,295 (55,974,389) 143,024,536 0 14,318,993 45,055,537 263,996,972 112,643,045 376,640,017
Total Expenditures 613,660,010 (7,525,531) 427,109,817 0 31,440,220 134,152,237 1,198,836,753 112,643,045 1,311,479,798
Transfers - Increase/(Decrease)Intra Unrestricted CurrentFund 20,201,986 (15,534,592) (2,498,203) 0 120,000 0 2,289,191 4,001 2,293,192Mandatory Transfers (4,672,821) (11,142,208) (36,151,882) 0 68,812 679,998 (51,218,101) 51,293,101 75,000Non-Mandatory Transfers (4,968,343) (21,288,363) (8,154,264) 0 (33,028) (61,760) (34,505,757) 34,630,330 124,573
Total Transfers 10,560,822 (47,965,163) (46,804,348) 0 155,784 618,238 (83,434,668) 85,927,432 2,492,765
Change in Net Assets 31,103,221 3,079,962 6,468,752 0 (469,115) 0 40,182,820 51,068,869 91,251,690
Ending Net Assets $337,095,929 $27,894,544 $37,815,907 $0 $86,393,550 $0 $489,199,931 $1,882,667,986 $2,371,867,917
17

Budget Summary by Fund by AccountFY16 - YearTotal Budget Original for All Programs, All Classes, All_Projects
* Primarily interest expense
KCITY - Kansas City
OperationsOther
UnrestrictedAuxiliary
EnterprisesHospital
Operations
Restricted State, Gifts, Endowment
DistributionGrants and Contracts
Total Current Funds
Loan, Endowment, and
Plant Funds Total All FundsRevenues
Tuition and Fees $173,817,843 $13,872,391 $0 $0 $2,218 $0 $187,692,452 $0 $187,692,452Less: Scholarship Allowances (32,784,144) (97,600) 0 0 (6,571,825) (16,000,000) (55,453,569) 0 (55,453,569)
Net Tuition and Fees 141,033,699 13,774,791 0 0 (6,569,607) (16,000,000) 132,238,883 0 132,238,883
State Appropriation 79,132,709 0 0 0 0 0 79,132,709 13,400,000 92,532,709Grants - Federal 0 0 0 0 0 20,500,000 20,500,000 125,000 20,625,000Grants - Federal Pell 0 0 0 0 0 14,200,000 14,200,000 0 14,200,000State Grants & Contracts 0 0 0 0 0 6,000,000 6,000,000 0 6,000,000Other Grants & Contracts 0 0 0 0 0 7,000,000 7,000,000 0 7,000,000Gift Revenues 99,270 0 625,000 0 13,105,353 0 13,829,623 1,963,500 15,793,123Recovery of F & A 5,500,000 0 0 0 0 (5,500,000) 0 0 0Endowment & Investment Income 1,055,385 0 0 0 9,574,659 0 10,630,044 3,386,532 14,016,576Sales & Services Income 4,492,936 154,000 73,797,827 0 26,426 0 78,471,189 0 78,471,189Other Income 5,117,713 928,390 0 0 4,589,018 0 10,635,121 525,000 11,160,121
Total Revenues 236,431,712 14,857,181 74,422,827 0 20,725,850 26,200,000 372,637,570 19,400,032 392,037,602
ExpendituresSalaries & Wages 139,256,827 6,046,040 34,676,447 0 7,961,004 14,455,264 202,395,582 0 202,395,582Benefit Expense 43,062,162 1,869,402 9,074,169 0 2,412,865 4,115,254 60,533,851 0 60,533,851
Compensation 182,318,989 7,915,442 43,750,616 0 10,373,869 18,570,517 262,929,434 0 262,929,434Other Operating Expense 48,080,483 (2,778,748) 18,233,059 0 7,529,089 7,979,483 79,043,365 1,155,000 80,198,365Capital Expenditures 5,410,444 10,500 969,700 0 138,703 0 6,529,347 (6,529,347) 0Non-Operating Expense* 0 0 0 0 0 0 0 9,945,925 9,945,925Depreciation Expense 0 0 0 0 0 0 0 24,911,940 24,911,940
Other Expense 53,490,927 (2,768,248) 19,202,759 0 7,667,792 7,979,483 85,572,712 29,483,518 115,056,230
Total Expenditures 235,809,916 5,147,194 62,953,375 0 18,041,661 26,550,000 348,502,146 29,483,518 377,985,664
Transfers - Increase/(Decrease)Intra Unrestricted CurrentFund 5,492,160 (9,095,213) 4,341,174 0 0 0 738,121 0 738,121Mandatory Transfers (4,310,523) 0 (11,259,172) 0 (1,361,670) 350,000 (16,581,365) 16,629,865 48,500Non-Mandatory Transfers (30,475) 0 (329,392) 0 0 0 (359,867) 359,867 0
Total Transfers 1,151,162 (9,095,213) (7,247,390) 0 (1,361,670) 350,000 (16,203,111) 16,989,732 786,621
Change in Net Assets 1,772,958 614,774 4,222,063 0 1,322,518 0 7,932,313 6,906,246 14,838,559
Ending Net Assets $39,794,820 $6,161,190 $22,093,219 $0 $36,011,164 $0 $104,060,392 $332,921,022 $436,981,414
18

Budget Summary by Fund by AccountFY16 - YearTotal Budget Original for All Programs, All Classes, All_Projects
* Primarily interest expense
ROLLA - Missouri S & T
OperationsOther
UnrestrictedAuxiliary
EnterprisesHospital
Operations
Restricted State, Gifts, Endowment
DistributionGrants and Contracts
Total Current Funds
Loan, Endowment, and
Plant Funds Total All FundsRevenues
Tuition and Fees $112,162,601 $11,405,050 $0 $0 $0 $0 $123,567,651 $0 $123,567,651Less: Scholarship Allowances (29,632,988) (127,500) 0 0 (4,294,157) (9,098,000) (43,152,646) 0 (43,152,646)
Net Tuition and Fees 82,529,613 11,277,550 0 0 (4,294,157) (9,098,000) 80,415,006 0 80,415,006
State Appropriation 52,452,380 0 0 0 0 0 52,452,380 1,200,000 53,652,380Grants - Federal 0 0 0 0 0 15,600,000 15,600,000 0 15,600,000Grants - Federal Pell 0 0 0 0 0 6,600,000 6,600,000 0 6,600,000State Grants & Contracts 0 0 0 0 0 2,099,000 2,099,000 0 2,099,000Other Grants & Contracts 0 0 0 0 0 15,500,000 15,500,000 0 15,500,000Gift Revenues 492,500 0 0 0 3,464,631 0 3,957,131 6,735,000 10,692,131Recovery of F & A 6,000,000 0 0 0 0 (6,000,000) 0 0 0Endowment & Investment Income 1,067,795 0 65,000 0 6,418,488 0 7,551,283 3,517,456 11,068,739Sales & Services Income 840,989 23,642 22,265,861 0 0 0 23,130,492 0 23,130,492Other Income 2,717,970 162,700 0 0 94,000 100,000 3,074,670 1,109,000 4,183,670
Total Revenues 146,101,247 11,463,892 22,330,861 0 5,682,962 24,801,000 210,379,962 12,561,456 222,941,418
ExpendituresSalaries & Wages 82,092,303 4,378,669 3,436,012 0 1,670,947 11,691,449 103,269,380 0 103,269,380Benefit Expense 25,383,595 1,342,434 1,006,360 0 362,987 2,244,360 30,339,737 0 30,339,737
Compensation 107,475,898 5,721,103 4,442,372 0 2,033,934 13,935,810 133,609,117 0 133,609,117Other Operating Expense 26,958,615 (2,983,379) 9,369,236 0 2,591,862 7,614,000 43,550,334 4,378,240 47,928,574Capital Expenditures 7,742,464 81,000 224,000 0 993,288 1,000,000 10,040,752 (10,040,752) 0Non-Operating Expense* (1,750) 0 0 0 (2,000) 0 (3,750) 4,368,310 4,364,560Depreciation Expense 0 0 0 0 0 0 0 13,016,571 13,016,571
Other Expense 34,699,329 (2,902,379) 9,593,236 0 3,583,150 8,614,000 53,587,336 11,722,369 65,309,704
Total Expenditures 142,175,227 2,818,724 14,035,608 0 5,617,084 22,549,810 187,196,453 11,722,369 198,918,821
Transfers - Increase/(Decrease)Intra Unrestricted CurrentFund 8,763,802 (8,061,000) (50,400) 0 0 0 652,402 0 652,402Mandatory Transfers (3,741,408) 0 (6,432,168) 0 9,000 120,000 (10,044,576) 10,053,576 9,000Non-Mandatory Transfers 1,418,805 0 (1,300,000) 0 (18,805) (2,400,000) (2,300,000) 2,300,000 0
Total Transfers 6,441,199 (8,061,000) (7,782,568) 0 (9,805) (2,280,000) (11,692,174) 12,353,576 661,402
Change in Net Assets 10,367,219 584,168 512,685 0 56,074 (28,810) 11,491,335 13,192,663 24,683,998
Ending Net Assets $80,214,832 $4,126,879 $5,360,871 $0 $21,122,599 ($987,810) $109,837,371 $344,669,461 $454,506,832
19
Budget Summary by Fund by AccountFY16 - YearTotal Budget Original for All Programs, All Classes, All_Projects
* Primarily interest expense
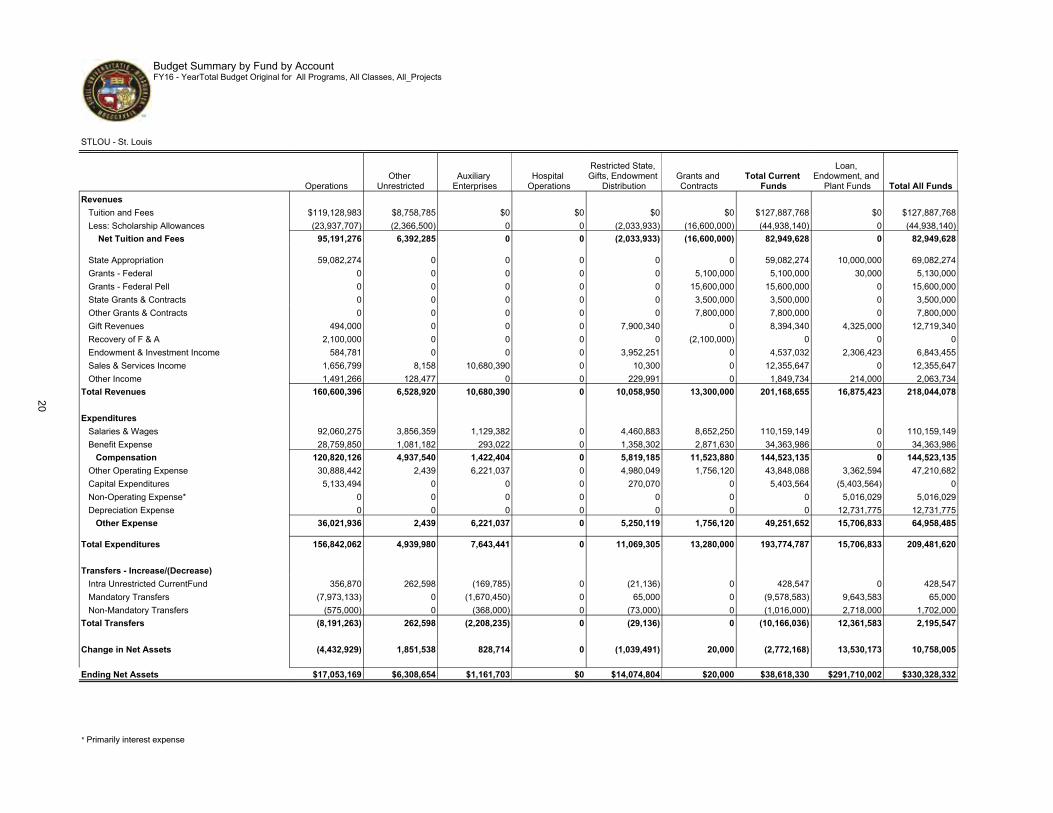
STLOU - St. Louis
OperationsOther
UnrestrictedAuxiliary
EnterprisesHospital
Operations
Restricted State, Gifts, Endowment
DistributionGrants and Contracts
Total Current Funds
Loan, Endowment, and
Plant Funds Total All FundsRevenues
Tuition and Fees $119,128,983 $8,758,785 $0 $0 $0 $0 $127,887,768 $0 $127,887,768Less: Scholarship Allowances (23,937,707) (2,366,500) 0 0 (2,033,933) (16,600,000) (44,938,140) 0 (44,938,140)
Net Tuition and Fees 95,191,276 6,392,285 0 0 (2,033,933) (16,600,000) 82,949,628 0 82,949,628
State Appropriation 59,082,274 0 0 0 0 0 59,082,274 10,000,000 69,082,274Grants - Federal 0 0 0 0 0 5,100,000 5,100,000 30,000 5,130,000Grants - Federal Pell 0 0 0 0 0 15,600,000 15,600,000 0 15,600,000State Grants & Contracts 0 0 0 0 0 3,500,000 3,500,000 0 3,500,000Other Grants & Contracts 0 0 0 0 0 7,800,000 7,800,000 0 7,800,000Gift Revenues 494,000 0 0 0 7,900,340 0 8,394,340 4,325,000 12,719,340Recovery of F & A 2,100,000 0 0 0 0 (2,100,000) 0 0 0Endowment & Investment Income 584,781 0 0 0 3,952,251 0 4,537,032 2,306,423 6,843,455Sales & Services Income 1,656,799 8,158 10,680,390 0 10,300 0 12,355,647 0 12,355,647Other Income 1,491,266 128,477 0 0 229,991 0 1,849,734 214,000 2,063,734
Total Revenues 160,600,396 6,528,920 10,680,390 0 10,058,950 13,300,000 201,168,655 16,875,423 218,044,078
ExpendituresSalaries & Wages 92,060,275 3,856,359 1,129,382 0 4,460,883 8,652,250 110,159,149 0 110,159,149Benefit Expense 28,759,850 1,081,182 293,022 0 1,358,302 2,871,630 34,363,986 0 34,363,986
Compensation 120,820,126 4,937,540 1,422,404 0 5,819,185 11,523,880 144,523,135 0 144,523,135Other Operating Expense 30,888,442 2,439 6,221,037 0 4,980,049 1,756,120 43,848,088 3,362,594 47,210,682Capital Expenditures 5,133,494 0 0 0 270,070 0 5,403,564 (5,403,564) 0Non-Operating Expense* 0 0 0 0 0 0 0 5,016,029 5,016,029Depreciation Expense 0 0 0 0 0 0 0 12,731,775 12,731,775
Other Expense 36,021,936 2,439 6,221,037 0 5,250,119 1,756,120 49,251,652 15,706,833 64,958,485
Total Expenditures 156,842,062 4,939,980 7,643,441 0 11,069,305 13,280,000 193,774,787 15,706,833 209,481,620
Transfers - Increase/(Decrease)Intra Unrestricted CurrentFund 356,870 262,598 (169,785) 0 (21,136) 0 428,547 0 428,547Mandatory Transfers (7,973,133) 0 (1,670,450) 0 65,000 0 (9,578,583) 9,643,583 65,000Non-Mandatory Transfers (575,000) 0 (368,000) 0 (73,000) 0 (1,016,000) 2,718,000 1,702,000
Total Transfers (8,191,263) 262,598 (2,208,235) 0 (29,136) 0 (10,166,036) 12,361,583 2,195,547
Change in Net Assets (4,432,929) 1,851,538 828,714 0 (1,039,491) 20,000 (2,772,168) 13,530,173 10,758,005
Ending Net Assets $17,053,169 $6,308,654 $1,161,703 $0 $14,074,804 $20,000 $38,618,330 $291,710,002 $330,328,332
20

Budget Summary by Fund by AccountFY16 - YearTotal Budget Original for All Programs, All Classes, All_Projects
* Primarily interest expense
UMSYS - System Administration
OperationsOther
UnrestrictedAuxiliary
EnterprisesHospital
Operations
Restricted State, Gifts, Endowment
DistributionGrants and Contracts
Total Current Funds
Loan, Endowment, and
Plant Funds Total All FundsRevenues
Tuition and Fees $0 $0 $0 $0 $0 $0 $0 $0 $0Less: Scholarship Allowances (44,000) 0 0 0 0 0 (44,000) 0 (44,000)
Net Tuition and Fees (44,000) 0 0 0 0 0 (44,000) 0 (44,000)
State Appropriation 14,751,175 0 0 0 954,000 0 15,705,175 0 15,705,175Grants - Federal 0 0 0 0 0 0 0 0 0Grants - Federal Pell 0 0 0 0 0 0 0 0 0State Grants & Contracts 0 0 0 0 0 0 0 0 0Other Grants & Contracts 0 0 0 0 0 0 0 0 0Gift Revenues 0 0 40,000 0 60,160 0 100,160 0 100,160Recovery of F & A 0 0 0 0 0 0 0 0 0Endowment & Investment Income 18,655,221 0 38,576 0 80,490 0 18,774,287 3,718,963 22,493,250Sales & Services Income 893,700 0 28,036,202 0 0 0 28,929,902 0 28,929,902Other Income 7,461,265 282,000 0 0 0 0 7,743,265 0 7,743,265
Total Revenues 41,717,361 282,000 28,114,778 0 1,094,650 0 71,208,789 3,718,963 74,927,752
ExpendituresSalaries & Wages 33,631,991 424,535 5,853,583 0 59,534 0 39,969,642 0 39,969,642Benefit Expense 11,267,479 150,158 2,036,466 0 10,662 0 13,464,765 0 13,464,765
Compensation 44,899,470 574,693 7,890,049 0 70,196 0 53,434,408 0 53,434,408Other Operating Expense (4,252,850) 395,636 19,212,948 0 885,238 0 16,240,971 423,000 16,663,971Capital Expenditures 1,000 0 0 0 0 0 1,000 (1,000) 0Non-Operating Expense* 20,000 0 1 0 0 0 20,001 0 20,001Depreciation Expense 0 0 0 0 0 0 0 4,731,908 4,731,908
Other Expense (4,231,850) 395,636 19,212,949 0 885,238 0 16,261,972 5,153,908 21,415,880
Total Expenditures 40,667,619 970,329 27,102,998 0 955,434 0 69,696,380 5,153,908 74,850,288
Transfers - Increase/(Decrease)Intra Unrestricted CurrentFund (3,357,751) 644,783 0 0 (26,500) 0 (2,739,468) 100,562 (2,638,906)Mandatory Transfers 0 0 0 0 0 0 0 0 0Non-Mandatory Transfers (860,592) (30,000) 0 0 (108,013) 0 (998,605) 914,091 (84,514)
Total Transfers (4,218,342) 614,783 0 0 (134,513) 0 (3,738,072) 1,014,653 (2,723,420)
Change in Net Assets (3,168,601) (73,546) 1,011,780 0 4,704 0 (2,225,664) (420,292) (2,645,956)
Ending Net Assets $31,539,262 ($268,546) $12,042,994 $0 $321,790 $0 $43,635,499 $99,765,904 $143,401,403
21

Budget Summary by Fund by AccountFY16 - YearTotal Budget Original for All Programs, All Classes, All_Projects
* Primarily interest expense
University Wide Units
OperationsOther
UnrestrictedAuxiliary
EnterprisesHospital
Operations
Restricted State, Gifts, Endowment
DistributionGrants and Contracts
Total Current Funds
Loan, Endowment, and
Plant Funds Total All FundsRevenues
Tuition and Fees $0 $0 $0 $0 $0 $0 $0 $0 $0Less: Scholarship Allowances (40,000) 0 0 0 0 0 (40,000) 0 (40,000)
Net Tuition and Fees (40,000) 0 0 0 0 0 (40,000) 0 (40,000)
State Appropriation 7,812,867 0 0 0 0 0 7,812,867 0 7,812,867Grants - Federal 0 0 0 0 0 0 0 0 0Grants - Federal Pell 0 0 0 0 0 0 0 0 0State Grants & Contracts 0 0 0 0 0 0 0 0 0Other Grants & Contracts 0 0 0 0 0 0 0 0 0Gift Revenues 0 0 0 0 0 0 0 0 0Recovery of F & A 0 0 0 0 0 0 0 0 0Endowment & Investment Income 0 13,752,643 0 0 (5,238,710) 0 8,513,933 6,232,828 14,746,761Sales & Services Income 0 0 0 0 0 0 0 0 0Other Income 500,000 20,000 0 0 0 0 520,000 9,644,802 10,164,802
Total Revenues 8,272,867 13,772,643 0 0 (5,238,710) 0 16,806,800 15,877,630 32,684,430
ExpendituresSalaries & Wages 0 0 0 0 0 0 0 0 0Benefit Expense 0 7,427,958 0 0 0 0 7,427,958 0 7,427,958
Compensation 0 7,427,958 0 0 0 0 7,427,958 0 7,427,958Other Operating Expense 0 (32,114,218) 0 0 0 0 (32,114,218) 486,164 (31,628,054)Capital Expenditures 0 0 0 0 0 0 0 0 0Non-Operating Expense* 0 12,480,530 0 0 0 0 12,480,530 13,605,111 26,085,641Depreciation Expense 0 0 0 0 0 0 0 0 0
Other Expense 0 (19,633,688) 0 0 0 0 (19,633,688) 14,091,274 (5,542,413)
Total Expenditures 0 (12,205,729) 0 0 0 0 (12,205,729) 14,091,274 1,885,545
Transfers - Increase/(Decrease)Intra Unrestricted CurrentFund 0 (26,500) 0 0 0 0 (26,500) 0 (26,500)Mandatory Transfers 0 0 0 0 0 0 0 (197,500) (197,500)Non-Mandatory Transfers (5,744,010) 0 0 0 5,238,710 0 (505,300) 505,300 0
Total Transfers (5,744,010) (26,500) 0 0 5,238,710 0 (531,800) 307,800 (224,000)
Change in Net Assets 2,528,857 25,951,873 0 0 0 0 28,480,730 2,094,156 30,574,886
Ending Net Assets $3,959,857 ($305,689,462) $0 $0 $0 $0 ($301,729,605) $136,817,415 ($164,912,191)
22

Budget Summary by Fund by AccountFY16 - YearTotal Budget Original for All Programs, All Classes, All_Projects
* Primarily interest expense
HOSPT - University Healthcare
OperationsOther
UnrestrictedAuxiliary
EnterprisesHospital
Operations
Restricted State, Gifts, Endowment
DistributionGrants and Contracts
Total Current Funds
Loan, Endowment, and
Plant Funds Total All FundsRevenues
Tuition and Fees $0 $0 $0 $0 $0 $0 $0 $0 $0Less: Scholarship Allowances 0 0 0 0 0 0 0 0 0
Net Tuition and Fees 0 0 0 0 0 0 0 0 0
State Appropriation 0 0 0 0 0 0 0 0 0Grants - Federal 0 0 0 0 0 0 0 0 0Grants - Federal Pell 0 0 0 0 0 0 0 0 0State Grants & Contracts 0 0 0 0 0 85,452 85,452 0 85,452Other Grants & Contracts 0 0 0 0 0 0 0 0 0Gift Revenues 0 0 0 0 1,149,501 0 1,149,501 1,716,114 2,865,615Recovery of F & A 0 0 0 0 0 0 0 0 0Endowment & Investment Income 0 0 0 8,911,440 21,623 0 8,933,063 66,940 9,000,003Sales & Services Income 0 0 0 786,725,255 126,720 0 786,851,975 0 786,851,975Other Income 0 0 0 0 264 0 264 0 264
Total Revenues 0 0 0 795,636,695 1,298,108 85,452 797,020,255 1,783,054 798,803,309
ExpendituresSalaries & Wages 0 0 0 252,817,498 39,956 0 252,857,454 0 252,857,454Benefit Expense 0 0 0 86,819,418 14,383 0 86,833,801 0 86,833,801
Compensation 0 0 0 339,636,916 54,339 0 339,691,255 0 339,691,255Other Operating Expense 0 0 0 370,467,679 665,088 26,148 371,158,915 102,888 371,261,803Capital Expenditures 0 0 0 0 0 0 0 0 0Non-Operating Expense* 0 0 0 99,996 0 0 99,996 13,301,200 13,401,196Depreciation Expense 0 0 0 0 0 0 0 51,770,000 51,770,000
Other Expense 0 0 0 370,567,675 665,088 26,148 371,258,911 65,174,088 436,432,999
Total Expenditures 0 0 0 710,204,591 719,427 26,148 710,950,166 65,174,088 776,124,254
Transfers - Increase/(Decrease)Intra Unrestricted CurrentFund 0 0 0 (1,446,855) 0 0 (1,446,855) 0 (1,446,855)Mandatory Transfers 0 0 0 (22,667,724) 0 0 (22,667,724) 22,667,724 0Non-Mandatory Transfers 0 0 0 (63,866,754) (4,560) 0 (63,871,314) 63,746,418 (124,896)
Total Transfers 0 0 0 (87,981,333) (4,560) 0 (87,985,893) 86,414,142 (1,571,751)
Change in Net Assets 0 0 0 (2,549,229) 574,121 59,304 (1,915,804) 23,023,108 21,107,304
Ending Net Assets $0 $0 $0 $352,639,908 $1,423,702 $59,304 $354,122,914 $262,257,061 $616,379,975
23

Budget Summary by Administrative Unit - University of Missouri - ColumbiaFY16 YearTotal, Budget Original, 0000 - Operations
Beginning Net Assets Revenues Transfers Expenditures
Change in Net Assets
Ending Net Assets
College/School/Division
Chancellor $3,591,739 $3,680,783 $363,874 $2,376,436 $1,668,221 $5,259,960
Executive Vice Chancellor & ProvostCA&S - Arts & Science (5,807,718) 89,424,472 6,195,301 97,669,924 (2,050,152) (7,857,870)CAFNR - Ag, Food & Nat Resources 39,799,606 53,757,780 2,399,304 49,380,973 6,776,112 46,575,717CBUSN - Business 7,746,873 23,751,781 22,292 25,030,181 (1,256,108) 6,490,765CEDUC - Education 12,687,881 16,319,845 2,934,536 21,298,616 (2,044,235) 10,643,645CENGR - Engineering 9,507,839 25,014,235 120,272 31,674,612 (6,540,105) 2,967,734CENMG - Enrollment Management 2,472,088 9,937,653 952,169 10,464,614 425,208 2,897,296CGRAD - Graduate School 1,210,887 1,296,474 321,547 1,515,384 102,637 1,313,524CHES - Human Environmental Sciences 6,434,640 11,236,466 1,183,326 12,348,050 71,742 6,506,382CHLPR - School of Health Professions 3,454,889 10,382,531 7,385,213 18,713,152 (945,407) 2,509,482CIATS - Information & Access Tech Svcs 7,388,938 30,849,876 (9,725,328) 21,818,628 (694,080) 6,694,857CJRNL - Journalism 892,524 14,248,548 1,465,240 15,669,873 43,915 936,439CLAW - Law 4,618,298 9,987,142 333,912 10,488,270 (167,216) 4,451,083CLIBR - Library (276,517) 17,952,771 890,576 18,262,292 581,055 304,538CMED - Medicine 60,295,878 43,161,918 5,431,149 47,241,524 1,351,543 61,647,421CNRSG - Nursing 14,464,521 5,798,472 1,847,478 5,611,282 2,034,668 16,499,189CPROV - Provost 16,132,603 28,867,000 (1,177,831) 24,837,117 2,852,052 18,984,655CTSPA - Truman School of Public Affrs 471,195 2,536,953 452,430 3,300,309 (310,926) 160,269CVTMD - Veterinary Medicine 12,568,679 21,105,255 931,007 24,798,663 (2,762,400) 9,806,279
Total Executive Vice Chancellor & Provost 194,063,102 415,629,172 21,962,593 440,123,463 (2,531,698) 191,531,404
Vice Chancellor - Dev and Alumni Relations 2,974,746 11,940,170 (197,300) 13,541,107 (1,798,237) 1,176,509
Vice Chancellor - Health Affairs 500,000 1,043,663 0 837,987 205,676 705,676
Vice Chancellor - Student Affairs 4,073,886 11,449,469 822,390 12,533,152 (261,293) 3,812,593
Research, Grad Studies & Econ Dev 29,698,358 40,654,610 (9,199,903) 31,011,976 442,731 30,141,089
Administrative ServicesCADMN - Campus Operations 0 6,348,014 605,000 6,888,658 64,356 64,356CCFAC - Campus Facilities 0 65,461,701 (5,102,882) 59,779,820 578,999 578,999COPAX - Operations Auxiliary & Svc Ops (55,000) 2,490,780 (9,575) 2,500,997 (19,792) (74,792)COPGA - Campus Operation General Admin 232,764 572,163 0 488,121 84,042 316,807
Total Administrative Services 177,764 74,872,658 (4,507,457) 69,657,597 707,605 885,369
FinanceCBSGA - Business Services - Gen Admin (2,944,000) 1,815,179 12,000 2,343,783 (516,604) (3,460,604)CVCFN - Vice Chancellor for Finance 862,107 2,667,269 (155,912) 3,071,460 (560,103) 302,004
Total Finance (2,081,893) 4,482,448 (143,912) 5,415,243 (1,076,707) (3,158,600)
Campus DepartmentCCPDP - Campus Departments 38,595,000 42,574,482 (1,865,855) 3,449,057 37,259,570 75,854,570CCPSC - Campus Scholarships Fellowship 0 (3,444,000) 3,707,932 0 263,932 263,932CRECV - Recovery 0 (12,683,000) 0 (12,683,000) 0 0
Total Campus Department 38,595,000 26,447,482 1,842,077 (9,233,943) 37,523,502 76,118,502
Intercollegiate Athletics 1,155,344 420,537 2,009,880 2,514,875 (84,458) 1,070,886
University Affairs 152,818 5,532,530 (1,889,210) 4,294,321 (651,001) (498,183)
ExtensionCEXTN - Extension 256,700 1,488,428 195,944 1,672,342 12,030 268,730EADM - Administration 230,000 3,676,236 15,000 3,215,377 475,859 705,859EANR - Agriculture & Natural Res 2,612,563 5,101,517 79,016 5,262,489 (81,956) 2,530,608EBI - Business & Industry 828,245 883,663 79,055 722,881 239,837 1,068,082ECD - Community Development 1,191,728 1,325,293 13,583 1,467,582 (128,706) 1,063,022ECMPS - Campus Wide Departments 1 0 0 1 (1) 0EHES - Human Environmental Sciences 439,067 2,719,122 76,292 2,978,448 (183,034) 256,033EPRGS - Program Support 26,004,230 3,921,962 (1,041,079) 6,145,907 (3,265,024) 22,739,206EREGP - Regional Programming 0 16,158,023 0 16,013,395 144,628 144,628EVETM - Vet Med 600,000 198,245 0 114,161 84,084 684,084EYTH - Youth 929,309 2,576,399 79,978 2,995,212 (338,835) 590,474
Total Extension 33,091,844 38,048,888 (502,211) 40,587,795 (3,041,118) 30,050,726
Total Columbia $305,992,708 $634,202,409 $10,560,822 $613,660,010 $31,103,221 $337,095,929
24

Budget Summary by Administrative Unit - University of Missouri - Kansas CityFY16 YearTotal, Budget Original, 0000 - Operations
Beginning Net Assets Revenues Transfers Expenditures
Change in Net Assets
Ending Net Assets
College/School/Division
Chancellor $184,430 $884,754 $0 $834,684 $50,070 $234,500
ProvostKA&S - College of Arts & Sciences (1,911,514) 25,013,776 8,516,437 33,822,272 (292,059) (2,203,573)KBIOS - School of Biological Sciences 0 5,371,515 67,207 5,419,093 19,629 19,629KBUSN - School of Management (12,885,967) 15,196,357 384,096 15,554,997 25,456 (12,860,510)KCULT - Office of Cultural Events 0 897,938 0 897,938 0 0KDENT - School of Dentistry 6,108,002 21,560,886 26,400 21,585,304 1,982 6,109,984KEDUC - School of Education 384,547 5,694,576 142,576 6,248,456 (411,304) (26,757)KGRAD - School of Graduate Studies 406,553 1,070,505 3,288 1,017,070 56,723 463,276KHMDV - Institute for Human Dev 150,000 704,910 7,045 713,214 (1,259) 148,741KHNRS - Honors College 13,057 0 1,241,686 1,235,719 5,967 19,024KINFO - Information Services 2,850,260 9,183,898 314,135 9,879,333 (381,299) 2,468,961KINOV - UMKC Innov Ctr 280,960 512,000 0 499,912 12,088 293,048KLAW - School of Law (321,500) 9,114,650 300,096 9,761,743 (346,997) (668,497)KLIBR - Libraries 543,875 7,205,152 87,600 7,283,925 8,827 552,702KMED - School of Medicine 16,488,287 22,714,900 65,843 22,761,155 19,588 16,507,875KMUSI - Conservatory of Music & Dance (3,207,501) 6,032,733 1,371,625 8,128,552 (724,195) (3,931,696)KNRSG - School of Nursing & Health St 254,368 10,465,126 9,720 9,408,232 1,066,614 1,320,982KONLN - Online Learning 286,600 167,000 995,170 1,084,883 77,287 363,887KPHAR - School of Pharmacy 937,235 12,649,167 (185,000) 13,720,165 (1,255,998) (318,763)KRSCH - Research 5,082,595 2,141,200 (426,500) 2,116,222 (401,522) 4,681,073KSCE - School of Computing & Engr (1,727,035) 9,362,876 388,000 9,060,870 690,006 (1,037,029)KUCOL - University College 274,711 (5,200) 295,000 284,086 5,714 280,425KVCAA - VC Academic Affairs 1,327,107 4,291,249 (949,366) 3,104,333 237,550 1,564,657
Total Provost 15,334,640 169,345,214 12,655,058 183,587,473 (1,587,202) 13,747,439
Vice Chancellor - Admininistration & Finance 1,702,268 31,609,981 (1,371,898) 29,625,223 612,860 2,315,128
Vice Chancellor - Advancement 933,123 3,827,875 0 3,830,430 (2,555) 930,568
Vice Chancellor - Student Affairs 1,858,252 10,538,396 480,138 11,209,725 (191,191) 1,667,061
Campus Scholarships & Waivers 3,813,782 (200,350) (350,000) 0 (550,350) 3,263,432
Campus Wide 14,298,353 15,441,819 (10,252,040) 1,575,309 3,614,470 17,912,823
Diversity (1,011,403) 591,844 0 586,838 5,006 (1,006,397)
Human Resources 739,153 1,647,820 (10,096) 1,596,816 40,908 780,061
Marketing and CommunicationsKMKTC - VC Marketing & Communications 18,000 417,362 0 413,641 3,721 21,721KPUBC - Public Communication 701,000 1,785,371 0 1,778,299 7,072 708,072KRADI - Radio Station 0 50,575 0 50,575 0 0
Total Marketing and Communications 719,000 2,253,308 0 2,242,515 10,793 729,793
UMKC Foundation (549,737) 491,051 0 720,902 ($229,851) ($779,588)
Total Kansas City $38,021,861 $236,431,712 $1,151,162 $235,809,916 $1,772,958 $39,794,820
25

Budget Summary by Administrative Unit - Missouri University of Science and TechnologyFY16 YearTotal, Budget Original, 0000 - Operations
Beginning Net Assets Revenues Transfers Expenditures
Change in Net Assets
Ending Net Assets
College/School/Division
Chancellor $2,179,550 $1,824,426 $0 $1,620,907 $203,519 $2,383,069
ProvostRCASB - College Arts,Sciences&Business 5,602,342 21,008,251 407,583 23,389,278 (1,973,443) 3,628,898RCEC - College Engineering&Computing 24,465,045 33,939,804 2,823,595 37,288,156 (524,757) 23,940,289RENRM - Enrollment Management 635,451 5,417,241 0 5,458,742 (41,501) 593,950RGRDS - Graduate Studies 303,743 513,604 531,500 1,128,018 (82,914) 220,829RIATS - Info Access & Tech Services 2,150,531 7,467,138 (799,436) 6,662,198 5,504 2,156,035RPROV - Provost 9,772,358 7,585,616 (434,724) 5,702,514 1,448,378 11,220,736RSPON - Sponsored Programs 2,595,595 5,616,218 416,159 4,532,356 1,500,021 4,095,615RUGST - Undergraduate Studies 1,877,024 1,861,680 130,940 1,996,084 (3,464) 1,873,560
Total Provost 47,402,089 83,409,553 3,075,616 86,157,346 327,823 47,729,912
Campus Departments 6,490,800 20,037,392 2,722,928 13,565,437 9,194,883 15,685,683
Office of Administrative Services 5,574,890 23,010,109 (4,772,090) 18,859,862 (621,843) 4,953,047
Office of Student Affairs 2,757,659 8,170,108 937,503 8,518,132 589,479 3,347,138
Office of University Advancement 881,845 4,799,917 18,805 5,129,751 (311,029) 570,817
Global & Strategic PartnershipsRG&SP - Global&Strategic Partnerships 752,562 2,344,191 0 2,703,094 (358,903) 393,659RGLBL - Global Learning 3,781,217 1,077,586 4,444,436 4,173,960 1,348,062 5,129,279
Total Global & Strategic Partnerships 4,533,779 3,421,777 4,444,436 6,877,054 989,159 5,522,939
Human Resources, Equity & Inclusion 27,000 1,427,965 14,000 1,446,736 (4,771) 22,229
Total Missouri University of Science and Techonology $69,847,613 $146,101,247 $6,441,199 $142,175,227 $10,367,219 $80,214,832
26

Budget Summary by Administrative Unit - University of Missouri - St. LouisFY16 YearTotal, Budget Original, 0000 - Operations
Beginning Net Assets Revenues Transfers Expenditures
Change in Net Assets
Ending Net Assets
College/School/Division
ChancellorSCHNL - Chancellor $0 $795,015 ($3,913) $749,502 $41,600 $41,600SCHSU - Chancellor-Special Units 450,000 435,054 0 473,928 (38,874) 411,126
Total Chancellor 450,000 1,230,069 (3,913) 1,223,430 2,726 452,726
ProvostSA&S - College of Arts & Sciences 8,000,330 28,237,589 1,242,339 31,144,123 (1,664,195) 6,336,135SACF - VC Academic Affairs 2,186,490 6,404,454 (1,833,513) 5,614,147 (1,043,206) 1,143,284SBUSN - College of Business Administra (1,065,321) 12,900,454 588,170 13,043,185 445,439 (619,882)SCIS - Office of Int Stud & Programs 692,382 1,732,777 318,796 1,848,793 202,780 895,162SEDUC - College of Education 3,168,567 8,654,865 898,452 10,366,204 (812,887) 2,355,680SENGR - UMSL/Washington Univ. Engineer 308,726 2,952,597 354 3,040,206 (87,255) 221,470SFA&C - College of Fine Arts & Commun (573,332) 6,695,972 1,174,655 7,804,290 66,337 (506,995)SGRAD - Graduate School 199,848 272,515 131,336 558,732 (154,881) 44,967SLIBR - Libraries 2,051,254 5,390,825 91,700 6,015,645 (533,120) 1,518,134SNRSG - College of Nursing 2,591,231 7,478,657 7,070 8,795,342 (1,309,615) 1,281,615SONLN - Online Education 257,000 952,417 0 558,710 393,707 650,707SOPTO - College of Optometry 2,141,468 6,450,232 (633,448) 5,865,192 (48,408) 2,093,060SPLHC - Honors College 78,790 1,051,685 (1,496) 959,045 91,144 169,934SPPRC - School of Public Policy 1,422,555 1,526,759 5,490 1,586,896 (54,647) 1,367,909SRES - VP Research 3,228,205 2,117,565 517,501 3,151,745 (516,679) 2,711,525SSTAF - Vice Provost Student Affairs (728,652) 12,330,125 1,263,920 16,966,311 (3,372,266) (4,100,918)SSSW - School of Social Work 96,500 1,385,099 267,148 1,607,999 44,248 140,748
Total Provost 24,056,041 106,534,587 4,038,474 118,926,567 (8,353,506) 15,702,535
Budget Development & Planning (14,640,255) 5,633,402 (4,928,369) (2,044,374) 2,749,407 (11,890,848)
Vice Chancellor - AdvancementSALUM - Alumni & Community Relations 76,468 806,000 60,523 866,582 (59) 76,409SKWMU - KWMU Radio 13,054 149,357 0 190,157 (40,800) (27,746)SMRKT - University Advt Marketing 55,785 2,722,379 (273) 2,733,541 (11,435) 44,350SUADM - Univ Advancement Adm (116,422) 545,638 (60,633) 471,969 13,036 (103,386)SUCAM - University Campaign 32,065 1,387,170 (106,000) 1,192,219 88,951 121,017SUDEV - University Advancement 148,257 651,838 (44) 553,122 98,672 246,929SUNIT - College and Units 148,068 674,857 (1,399) 768,448 (94,990) 53,078
Total Vice Chancellor - Advancement 357,275 6,937,239 (107,826) 6,776,038 53,375 410,650
Vice Chancellor - Managerial & TechnologicalSBUSI - Business Services 0 413,252 119 413,252 119 119SCFM - Campus Facilities Mgmt 6,263,000 26,426,961 (7,187,434) 16,743,570 2,495,957 8,758,957SFIN - Finance 341,476 1,167,601 (3,045) 1,085,916 78,640 420,116SHRES - Human Resources 0 909,730 25,931 933,101 2,560 2,560SITS - Information Technology Svcs 4,058,560 7,703,428 (18,000) 8,938,965 (1,253,537) 2,805,024SSFTY - Institutional Safety 0 2,663,191 3,295 2,868,169 (201,683) (201,683)SVCMT - VC for Managerial & Technologi 600,000 980,936 (10,495) 977,427 (6,986) 593,014
Total Vice Chancellor - Managerial & Technological 11,263,036 40,265,099 (7,189,629) 31,960,401 1,115,069 12,378,105
Total St. Louis $21,486,098 $160,600,396 ($8,191,263) $156,842,062 ($4,432,929) $17,053,169
27

Budget Summary by Administrative Unit - UM System AdministrationFY16 YearTotal, Budget Original, 0000 - Operations
Beginning Net Assets Revenues Transfers Expenditures
Change in Net Assets
Ending Net Assets
College/School/Division
Board of Curators $0 $466,041 $9,000 $475,041 $0 $0
President 223,779 1,742,330 15,000 1,789,986 (32,656) 191,123
General Counsel 309,807 4,188,076 77,000 4,281,240 (16,164) 293,643
Government Relations 674,051 3,055,966 0 3,026,400 29,566 703,617
Human ResourcesAHMRL - Human Resources 219,000 2,931,110 525,930 3,396,701 60,338 279,338ATORE - Total Rewards 0 9,019,000 (108,098) 8,865,341 45,561 45,561
Total Human Resources 219,000 11,950,110 417,831 12,262,042 105,899 324,899
Information SystemsAASB - Administrative Systems Budget 100,000 17,480,107 (1,197,607) 15,969,337 313,163 413,163AINFO - Information Systems 2,287,809 5,661,449 291,768 7,416,150 2,046,468 241,341
Total Information System 2,387,809 23,141,556 (1,489,375) 23,385,487 (1,733,305) 654,504
VP Academic AffairsAACAD - Academic Affairs 1,475,597 3,069,045 14,763 3,341,601 (257,793) 1,217,804AR&ED - Research & Economic Develop 12,643,568 8,348,216 (2,340,000) 6,786,258 (778,042) 11,865,526
Total Academic Affairs 14,119,165 11,417,261 (2,325,237) 10,127,859 (1,035,835) 13,083,330
VP FinanceAAUDT - Internal Auditing 184,842 1,502,600 0 1,901,793 (399,193) (214,351)ACTRL - Controller 326,933 2,889,104 0 2,818,714 70,390 397,323AFCPL - Facilities Planning 21,555 431,094 (11,000) 393,594 26,500 48,055AMNSV - Management Services 556,906 1,549,918 (100,562) 1,757,987 (308,631) 248,275APLBD - Budget & Planning 40,000 858,860 0 858,860 0 40,000APROC - Procurement - Sourcing & SCM 1,491,604 8,650,030 0 8,823,911 (173,881) 1,317,723ATRE - Treasurers Office 140,000 1,249,500 0 1,210,416 39,084 179,084AVPFN - VP Finance 569,152 786,504 0 544,151 242,353 811,505AINST - Institutional Research 0 457,428 0 451,010 6,418 6,418
Total VP Finance 3,330,991 18,375,038 (111,562) 18,760,436 (496,960) 2,834,031
Campus Wide Departments 13,443,261 (32,619,017) (811,000) (33,440,871) 10,854 13,454,115
Total UM System Administration $34,707,863 $41,717,361 ($4,218,342) $40,667,619 ($3,168,601) $31,539,262
28

Budget Summary by Administrative Unit - University-wide Resources & University BankFY16 YearTotal, Budget Original, 0000 - Operations
Beginning Net Assets Revenues Transfers Expenditures
Change in Net Assets
Ending Net Assets
College/School/Division
University-wide ResourcesUFIN - UWIDE Finance $1,431,000 $8,272,867 ($5,744,010) $0 $2,528,857 $3,959,857
Total University-wide Resources 1,431,000 8,272,867 (5,744,010) 0 2,528,857 3,959,857
University Bank
Total University-wide Resources & University Bank $1,431,000 $8,272,867 ($5,744,010) $0 $2,528,857 $3,959,857
29

Missouri Missouri Spinal CordKidney Telehealth Injury
Program Network ResearchFund 2010 Fund 2015 Fund 2050
REVENUES State Appropriations $1,697,500 $1,892,640 $954,000
TOTAL REVENUES 1,697,500 1,892,640 954,000EXPENDITURES Salaries & Wages 221,208 1,021,882 22,034 Benefit Expenses 69,566 315,918 7,793
Total Compensation 290,775 1,337,799 29,827 Other Expenses 1,406,725 554,841 924,173
TOTAL EXPENDITURES 1,697,500 1,892,640 954,000CHANGE IN NET ASSETS ($0) ($0) $0
State HistoricalSociety
Fund 6030REVENUES State Appropriations $2,144,530 Other Incomes 530,573
TOTAL REVENUES 2,675,103.00 EXPENDITURES Salaries & Wages 1,892,231 Benefit Expenses 619,603
Total Compensation 2,511,834 Computing Expenses 19,500 Other Departmental Expenses 152,645
TOTAL EXPENDITURES 2,683,979
CHANGE IN NET ASSETS (8,876) ENDING NET ASSETS $51,124
Below is the FY2016 budget for the State Historical Society of Missouri, which is recorded in the agency fund.
FY2016 State Historical Society Budget
Operating Budget Summaries for the Missouri Kidney Program, the Missouri Telehealth Network, and Spinal Cord Injury Research
The following table presents summary budget data for the Missouri Kidney Program, Missouri Telehealth Network, and Spinal Cord Injury Research. These programs are recorded as restricted current funds.
FY2016 Other Curators' Programs Budget Summaries
In addition to the general state appropriation for the operations of the University, the Curators receive line-itemed state appropriations for the Missouri Rehabilitation Center (part of MU Healthcare), Missouri Kidney Program, Missouri Telehealth Network, Spinal Cord Injury Research, and the State Hisorical Society of Missouri.
30

Office of Budget and Planning University of Missouri System
118 University Hall, Columbia MO 65211
(573) 882-3400
www.umsystem.edu
University of Missouri SystemCOLUMBIA | KANSAS CITY | ROLLA | ST.LOUIS