Fiscal decentralization is high on the agenda in policy ... · Economics (MecoP) University of...
28
econstor www.econstor.eu Der Open-Access-Publikationsserver der ZBW – Leibniz-Informationszentrum Wirtschaft The Open Access Publication Server of the ZBW – Leibniz Information Centre for Economics Standard-Nutzungsbedingungen: Die Dokumente auf EconStor dürfen zu eigenen wissenschaftlichen Zwecken und zum Privatgebrauch gespeichert und kopiert werden. Sie dürfen die Dokumente nicht für öffentliche oder kommerzielle Zwecke vervielfältigen, öffentlich ausstellen, öffentlich zugänglich machen, vertreiben oder anderweitig nutzen. Sofern die Verfasser die Dokumente unter Open-Content-Lizenzen (insbesondere CC-Lizenzen) zur Verfügung gestellt haben sollten, gelten abweichend von diesen Nutzungsbedingungen die in der dort genannten Lizenz gewährten Nutzungsrechte. Terms of use: Documents in EconStor may be saved and copied for your personal and scholarly purposes. You are not to copy documents for public or commercial purposes, to exhibit the documents publicly, to make them publicly available on the internet, or to distribute or otherwise use the documents in public. If the documents have been made available under an Open Content Licence (especially Creative Commons Licences), you may exercise further usage rights as specified in the indicated licence. zbw Leibniz-Informationszentrum Wirtschaft Leibniz Information Centre for Economics Jametti, Mario; Joanis, Marcelin Working Paper Electoral competition as a determinant of fiscal decentralization CESifo working paper: Public Finance, No. 3574 Provided in Cooperation with: Ifo Institute – Leibniz Institute for Economic Research at the University of Munich Suggested Citation: Jametti, Mario; Joanis, Marcelin (2011) : Electoral competition as a determinant of fiscal decentralization, CESifo working paper: Public Finance, No. 3574 This Version is available at: http://hdl.handle.net/10419/52485
Transcript of Fiscal decentralization is high on the agenda in policy ... · Economics (MecoP) University of...

econstor www.econstor.eu
Der Open-Access-Publikationsserver der ZBW – Leibniz-Informationszentrum WirtschaftThe Open Access Publication Server of the ZBW – Leibniz Information Centre for Economics
Standard-Nutzungsbedingungen:
Die Dokumente auf EconStor dürfen zu eigenen wissenschaftlichenZwecken und zum Privatgebrauch gespeichert und kopiert werden.
Sie dürfen die Dokumente nicht für öffentliche oder kommerzielleZwecke vervielfältigen, öffentlich ausstellen, öffentlich zugänglichmachen, vertreiben oder anderweitig nutzen.
Sofern die Verfasser die Dokumente unter Open-Content-Lizenzen(insbesondere CC-Lizenzen) zur Verfügung gestellt haben sollten,gelten abweichend von diesen Nutzungsbedingungen die in der dortgenannten Lizenz gewährten Nutzungsrechte.
Terms of use:
Documents in EconStor may be saved and copied for yourpersonal and scholarly purposes.
You are not to copy documents for public or commercialpurposes, to exhibit the documents publicly, to make thempublicly available on the internet, or to distribute or otherwiseuse the documents in public.
If the documents have been made available under an OpenContent Licence (especially Creative Commons Licences), youmay exercise further usage rights as specified in the indicatedlicence.
zbw Leibniz-Informationszentrum WirtschaftLeibniz Information Centre for Economics
Jametti, Mario; Joanis, Marcelin
Working Paper
Electoral competition as a determinant of fiscaldecentralization
CESifo working paper: Public Finance, No. 3574
Provided in Cooperation with:Ifo Institute – Leibniz Institute for Economic Research at the University ofMunich
Suggested Citation: Jametti, Mario; Joanis, Marcelin (2011) : Electoral competition as adeterminant of fiscal decentralization, CESifo working paper: Public Finance, No. 3574
This Version is available at:http://hdl.handle.net/10419/52485

Electoral Competition as a Determinant of Fiscal Decentralization
Mario Jametti Marcelin Joanis
CESIFO WORKING PAPER NO. 3574 CATEGORY 1: PUBLIC FINANCE
SEPTEMBER 2011
An electronic version of the paper may be downloaded • from the SSRN website: www.SSRN.com • from the RePEc website: www.RePEc.org
• from the CESifo website: Twww.CESifo-group.org/wp T
CESifo Working Paper No. 3574
Electoral Competition as a Determinant of Fiscal Decentralization
Abstract Fiscal decentralization is high on the agenda in policy fora. This paper empirically investigates the underlying causes of fiscal decentralization, based on the predictions of a simple political economy model. We argue that the likeliness that a central government engages in devolution of powers depends in important ways on the political forces that it faces, the theory’s main insight being that the central government’s electoral strength should, all else being equal, decrease that government’s share of spending. Consistent with the model’s predictions, empirical results from a panel of democracies support the relevance of political factors as determinants of fiscal decentralization. The relationship between central government electoral strength and both expenditure and revenue centralization emerges as negative and non-linear.
JEL-Code: H770, D720, H110.
Keywords: fiscal decentralization, fiscal federalism, vertical interactions, partial decentralization, elections.
Mario Jametti Institute for Microeconomics and Public
Economics (MecoP) University of Lugano
Switzerland – 6904 Lugano [email protected]
Marcelin Joanis Department of Economics University of Sherbrooke 2500 boul. de l’Université
Sherbrooke (Québec), Canada, J1K 2R1 [email protected]
August 26, 2011 < Tables and Figures at end > We wish to thank Toke Aidt, Massimo Bordignon, Bob Inman, Sonia Paty and Nicolas Sahuguet for insightful comments, and Youri Chassin for his help with data collection. This paper has been presented, under the title “Determinants of Fiscal Decentralization: Political Economy Aspects” at Cambridge University, CESifo-Munich, Augsburg University, University of Brescia, National Tax Association (Denver 2009), IIPF (Uppsala 2010), SIEP (Pavia 2010), SCSE (Québec 2010), “New issues on fiscal federalism and tax competition” workshop (Lyon 2010) and SSES (Fribourg 2010). Financial support from the Institut d’Economia de Barcelona (IEB) is greatfully acknowledged. The responsibility for any error remains ours.

1 Introduction
Sub-central governments enjoy larger degrees of competence in revenue and expenditure deci-
sions, a trend that has been documented empirically (Arzaghi and Henderson, 2005). What
are the determinants of this trend? And what are the channels through which decentralization
is achieved? These questions, while on top of the policy agenda, have been relatively little
explored.
In this paper we explore the political determinants of �scal decentralization. In particular,
we argue that the likeliness that a central government engages in transfer of powers depends
in important ways on the political forces that it faces, the theory�s main insight being that the
central government�s electoral strength should, all else being equal, decrease that government�s
share of spending. In the model, rents associated with holding o¢ ce and citizen welfare are
substitutes in the central politician�s objective function. Citizen welfare depends, in turn, on a
combination of public goods produced by both the central government and local governments.
In this framework, central politicians may tend to increase their spending on the central public
good for electoral purposes. Yet, accumulated political capital weakens this incentive for strong
central politicians, making them more likely to be responsive to citizen welfare. While this
reponsiveness does imply spending on the central government�s own public good, it also involves
the devolution of spending powers to local governments provided that central and local public
goods are complements. Thus our theoretical perspective links the electoral prospects of central
governments (government strenght) to their willingness to devolve spending responsibilities to
local governments (�scal decentralization).
While an important literature has documented an empirical relationship between electoral
competition and �scal policy �either from the macro perspective of �electoral budget cycles�1
1See Brender and Drazen�s (2005) important cross-country work.
2

or the micro perspective of �redistributive politics�2 �the conceptually close empirical literature
on the determinants of �scal decentralization has been slow to incorporate political variables in
the analysis. An early, cross-sectional attempt is Panizza (1999), who �nds that country size,
income, ethnic fractionalization and the degree of democracy all reduce the degree of �scal
centralization. Similar results are presented by Arzaghi and Henderson (2005), using panel
data. A more recent study, also in a panel context, on the determinants of decentralization in
Switzerland (Feld et al., 2008) shows that centralization is negatively related to the availability
of direct democratic decision-making (referenda), while Stegarescu (2009) documents the role
of political integration as a determinant of �scal decentralization in OECD countries. None
of these papers, however, test for the e¤ect of electoral competition on decentralization. Our
paper aims at �lling this gap, by including in �scal decentralization regressions a measure of
government strenght.3 Our analysis is based on a theoretical political economy framework,
thus introducing explicitly the e¤ects of political choices on the degree of decentralization.4
Using data from a panel of democracies, we explore the role of electoral conditions prevailing
at the central level on the degree of both expenditure and revenue centralization.5 Fixed e¤ects
regressions generally support our theory�s prediction together with highlighting a non-linear
relationship between centralization and government strength. Overall, we �nd that electorally
2For example, on the role played by electoral competition in the geographical allocation of public infrastruc-ture expenditures, see Knight (2004), Cadot et al. (2006) and Joanis (2011).
3We measure government strength as the share of seats held by government in parliament. Alternativemeasures (which we include as controls) are based on political fragmentation indices. Such measures have beenused by some authors to test for the �weak government hypothesis� in studies of a single government�s �scaldiscipline. The weak government hypothesis states that a government formed by a larger number of actors ismore prone to the adverse consequences of a common-pool resource problem (Elgie and McMenamin, 2008). Onthe empirical relationship between �scal discipline and political fragmentation, see Roubini and Sachs (1989),de Haan and Sturm (1997), de Haan et al. (1999) and Volkerink and de Haan (2001).
4Panizza (1999) also presents a theoretical model in which the degree of centralization is endogenouslydetermined. However, the empirical implementation of that model does not focus on electoral variables.
5The paper is also related to the large body of empirical research investigating decentralization as a deter-minant of various economic variables. For example, Oates (1985) relates the size of government to the degree ofdecentralization, a question that has been taken up by a number of studies (for a survey, see Feld et al., 2003).Thus, decentralization often features as an explanatory variable in empirical research on �scal federalism.
3

strong central governments tend to be associated with lower levels of centralization. More
generally, these results suggest that electoral variables rightly belong in the set of determinants
of �scal decentralization.
The paper proceeds as follows. Section 2 lays down the theoretical model and derives the
main empirically-testable prediction. Section 3 describes the data, with empirical results being
presented and discussed in Section 4. The last section concludes.
2 A Political Economy Model of Decentralization
This section lays down a simple political economy model of the behaviour of a central govern-
ment facing a choice between spending centrally and devolving some spending responsibilities
to a local level of government. The analysis is cast in the context of a pure moral hazard
political agency model, an approach initiated by Barro (1973) and Ferejohn (1986).
2.1 Model and Main Testable Prediction
In the �rst of two periods, the central government chooses a spending policy to maximize a
linear combination of expected discounted political rents over the two periods and of voter
welfare, subject to the constraint that it needs to seek reelection at the end of the that period.6
Its probability of reelection is increasing in spending at the central level.
More speci�cally, the central government makes decisions over spending on a central public
good (gc) and on the decentralization of some spending responsibilities (gl) to a local level of
government. The objective of the politician in power is:
6We follow Treisman (2007) and Brülhart and Jametti (2007) in assuming that politicians are neither extremerevenue maximizing Leviathans nor pure welfare maximizers.
4

maxgl;gc
� [s1 + ��s2] + (1� �)W (gl; gc) (1)
s.t. s1 = T � gl � gc (2)
s2 = T � gl; (3)
where st is the political rent extracted at t = 1; 2 andW is social welfare, which is increasing in
spending at both the central and regional levels, and � 2]0; 1[ is the weight of rent extraction.
The two constraints determine the amount of rents taken by the central politician in each
period, where T represents the (exogenous) �scal base. The period-1 devolution decision is
durable and reduces the amount of rents that he can take in both periods. Second-period
rents are discounted by a time preference factor (�) and by the politician�s perception of his
reelection probability (�). We assume that he is limited to only two terms in o¢ ce, as such he
becomes a lame duck if reelected.7 This is re�ected in the period-2 constraint.
We assume a simple form of probabilistic voting, with � = G( + gc). G is an increasing
and concave function of electoral capital + gc, where the parameter captures the electoral
strenght of the incumbent central politician.8 With these assumptions on the electoral process,
the federal government�s problem yields the following �rst order conditions:
gc = G�1�1
�
�1� ��W 0l � 1
��� � B � ; (4)
gl =1
�G0( + gc)
�1� ��W 0c � 1
�+ T; (5)
where W 0j is the partial derivative of social welfare with respect to spending by government j,
7This is an assumption for simplicity. Alternatively, one could assume that spending decisions at the centrallevel (gc) are over two periods. This complicates the analysis but does not change our general results.
8We follow Joanis (2011) in adopting this particular functional form.
5

and G0 is the �rst derivative of G. Together, these two equations imply:
gc = B � ; (6)
gl =1
�G0(B)
�1� ��W 0c � 1
�+ T � A; (7)
where A and B are functions of exogenous model parameters if W has constant partial deriv-
atives.
In this simple model, electoral strenght linearly reduces the central government�s own spend-
ing: safe reelection prospects reduce the politician�s need to court his electorate by spending
on the central public good. Solving, we obtain the following condition for the degree of cen-
tralization (CENTRAL):
CENTRAL � gc
gc + gl=
1AB� + 1
: (8)
Thus, the level of centralization depends negatively on electoral strength ( ), which is what
we will test for in the empirical application. Notably, the relationship is non-linear, something
we will also address.
2.2 Relation to the Theoretical Literature and Confounding Channels
This simple theoretical model contributes to a small but growing group of models of �partial�
decentralization. In most of the standard �scal federalism theoretical literature, the devolution
of public good provision and �nancing is assumed to be a binary decision, i.e. expenditures
are either provided by the central or the local governments. Based on the �Decentraliza-
tion Theorem� (Oates, 1972) allocation of public goods and services is guided by a trade-o¤
between internalizing inter-jurisdictional spillovers and scale economies and catering to local
6

preferences.9 Notably, even what is known as the Second Generation Theory of Fiscal Federal-
ism (Weingast, 2009), while moving away from assuming benevolent governments10 to include
political dimensions, still essentially remains within a binary choice framework. The recent
literature on partial decentralization is devoted to studying instances of multi-level governance
departing from the binary allocation of �scal responsibilities. A key message of this literature
is that institutional frameworks characterized by partial decentralization are especially prone
to political in�uences �see Devarajan et al. (2009) and Joanis (2009).11
An innovative feature of the theoretical perspective adopted here is its focus on the federal
government�s key role in in�uencing the equilibrium degree of (partial) decentralization. The
model o¤ers an interesting perspective on the following question: Why would an opportunistic
central politician ever let go of some spending responsibilities or revenues? The model predicts
that devolution will occur if the central government�s reelection prospects are high � i.e. if
government strenght, captured in the model by political capital , is high �and if local spending
is su¢ ciently welfare-improving from citizens�perspective.
Our theory thus predicts a monotone, non-linear negative relationship between government
strenght and centralization. This relationship depends on two important implicit assumptions.
The �rst one is related to the debate between the so-called �swing voter� and �machine
politics�views of electoral politics. Should a government invest more in public good provision
when its reelection prospects are uncertain? The implicit assumption in our model is yes: when
reelection uncertainty increases (i.e. decreases), the expected electoral return on spending
by the central government goes up (since G exhibits decreasing returns). This is consistent
9See Epple and Nechyba (2004) for a recent survey.10The standard in the First Generation Theory (Oates, 2003).11The political economy of partial decentralization has received relatively little attention in the literature.
Recent exceptions include Brueckner (2009), who studies partial �scal decentralization in a Tiebout-style frame-work, and Hat�eld and Padro i Miquel�s (2008), whose analysis is cast in a tax competition framework. Notethat neither of these papers provide an empirical application.
7

with the Downsian tradition, where an incumbent should be expected to spend most when
the election is most uncertain �see, for example, Lindbeck and Weibull (1987). However, a
competing view of government behaviour supports the opposite prediction. According to the
alternative machine politics view, public spending is a safer investment for strong electorally-
motivated governments than for weak ones. This view of government behaviour is consistent
with a theoretical perspective �rst developed by Cox and McCubbins (1986). A more complete
theoretical model would nest both views of government behaviour, which have both been shown
to be empirically relevant. In our framework, taking into account such machine politics motives
could reverse the sign of the correlation between centralization and government strenght. The
empirical relevance of these motives will thus tend to make it harder to detect the negative
correlation stemming from the mechanism captured by our simple theoretical model.
A second rather strong assumption is the passivity of local governments in the model.
While this assumption is in line with recent studies documenting the relatively low degree
of autonomy of local governments (e.g. Blöchliger and King, 2006), a more complete model
would also take into account the electoral objectives of local politicians. In a closely related
model, Joanis (2009) characterizes the vertical interactions between two levels of government
that are involved in the provision of a public good, in an environment where imperfect voter
information creates a shared accountability problem. An important feature of the model is
that the degree of decentralization is endogenous and depends, among other, on the relative
political conditions prevailing at each level of government, i.e. the extent to which each level
of government can a¤ect its electoral fortunes by contributing to the public good. Speci�cally,
the model predicts that the degree of centralization is positively associated with the ratio of
the electoral uncertainty prevailing at the local level on the electoral uncertainty at the central
level. Thus, the sign of the correlation between central government strength and centralization
8

predicted above could be reversed by vertical interactions between the center and the local
governments. Again, the empirical relevance of this mechanism will make it harder to estimate
the predicted negative correlation between government strenght and centralization.
This discussion of potentially confounding channels reinforces the appeal of an empirical
test of our theory.
3 Empirical Framework and Data
We estimate the following general model:
CENTRALjt = f� jtjPjt;Xjt
�; (9)
where corresponds to a variable measuring central government strength, P are other political
variables, and X are non-political control variables.
We assembled a new database combining information from four sources: the IMF�s Govern-
ment Financial Statistics (GFS); the World Bank�s Dataset of Political Indicators (DPI) and
World Development Indicators (WDI); and the Polity 2 dataset from the University of Mary-
land. We avail of an unbalanced panel of a total of 107 countries (j) with yearly observations
(t) for the period 1990 to 2006.12
From GFS we included data on expenditures and revenues of di¤erent levels of government
(central, state and local). We have used this information to construct our measures of cen-
tralization. DPI contains information on the political system of each country as well as a vast
array of electoral variables, such as party composition and strength of national governments
12A total of 104 countries present at least one year of central government expenditure. The countries of formerYugoslavia are considered individually in our dataset. Note that our dataset includes all the countries of Panizza(1999) except: Central African Republic, Guatemala, Honduras, Iraq, Jordan, Kenya, Malawi, New Zealand,Senegal, Sri Lanka, Yemen and Zaire. However, data is missing in many instances leaving us with at most 64countries in the sample.
9

and oppositions. We used this information for our measure of political strength and for polit-
ical controls. The WDI dataset contains variables concerning overall economic indicators and
constitutes our basis for additional control variables. Finally, we use Polity 2 (polity index > 0)
to restrict our sample to democracies as we are in a political economy context.
Our dependent variables correspond to centralization ratios:
CENTRAL =gc
gc + gs + gl; (10)
where g is government expenditure or revenues; c is central government; s is state or sub-federal
government; and l is local government. Thus, we contrast central government decisions with
decisions taken at any sub-central unit. Data is taken from the GFS-Series 1 �Revenue Cash�
and 2 �Cash expenditure�for central, state and local governments.13 We exclude observations
with either expenditure or revenue centralization ratios equal to one, since we are unable to
distinguish between absence of sub-central spending and missing data.14
We measure government strength ( ) as the share of seats held by the government in the
legislature.15 This variable represents the absolute political strength of the government and is
close to our theoretical model.
Our political control variables (Pjt) are government and opposition Hirschmann-Her�ndahl
Indices (HHI), i.e. the sum of squared seat shares of government or opposition parties, re-
spectively.16 The HHIs measure the breadth of the political spectrum that is part of both
13We computed overall public expenditure as indicated in (10). GFS contains the government unit �GeneralGovernment�, which, in principle should correspond to the denominator of (10). However, information on thisvariable is lacking in many instances, and hence we did not use it. Additionally, we have run our regressionsusing the Series 7 �Outlays�. Results do not vary signi�cantly and are available upon request.14 Inspection of the data showed that the expenditure centralization ratio in Romania for 1990 was less than
1%. We dropped this observation as well.15All political variables are taken directly from DPI without transformation. Share of seats by government
corresponds to the variable MAJ .16We prefer the HHI, the standard measure of market concentration in IO, to the simple number of parties
in government. Alternatively, fractionalization, de�ned as 1 - HHI, is also used in the literature (see e.g. Elgie
10

government and opposition. Further we include dummies for left wing government, election
year, coalition government if the government HHI < 1, and minority government for govern-
ments with less than 50% of seats in parliament ( < 0:5). Left wing controls for potentially
di¤erent preferences for decentralization across political views; spending might also be di¤erent
in electoral years. Finally, coalition and minority government are used as alternatives to the
HHIs in some speci�cations.
Note that DPI presents electoral results. Thus the government composition variables are
constant for a particular country over the election cycle (e.g. 4 years). We take this into
account for inference by clustering standard errors over the electoral cycle.
The economic controls (Xjt) correspond to GDP per capita, population and population
density, all taken from WDI. Table 1 presents summary statistics.
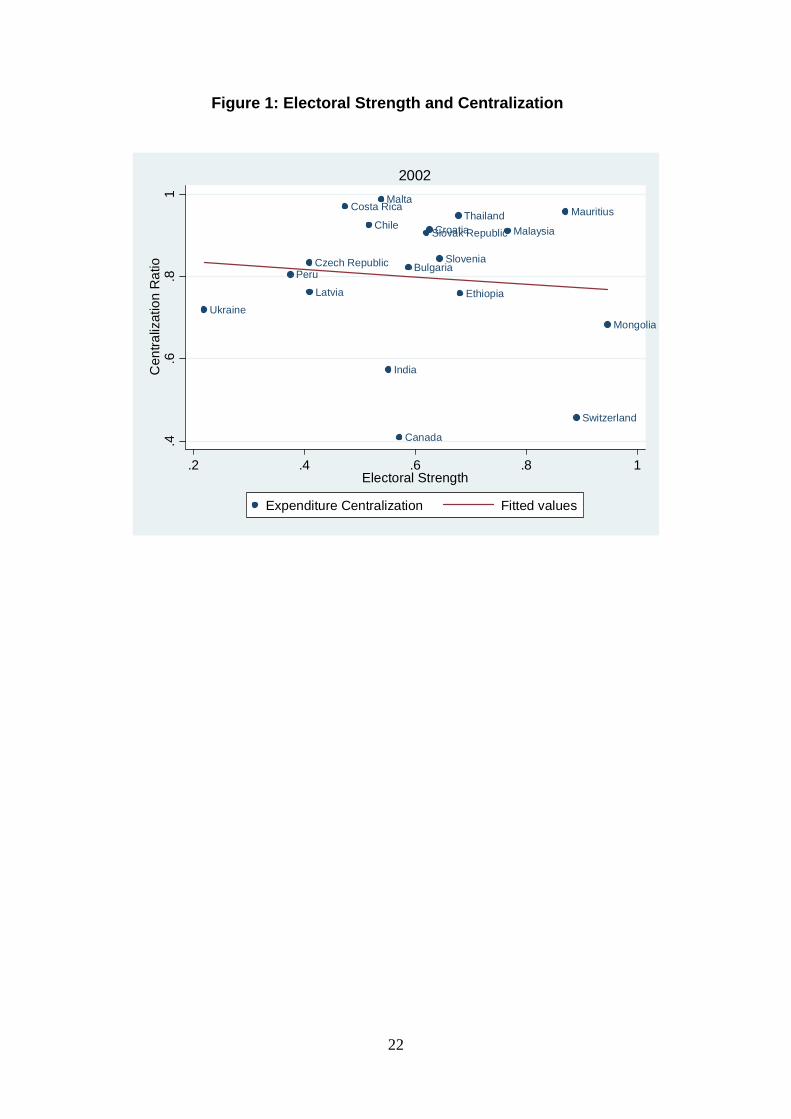
Figure 1 provides an illustration of our theoretical prediction. For 2002, we plotted the
degree of expenditure centralization on government strength ( ) �nding a slightly negative
correlation. Clearly, the countries in our sample di¤er in many other relevant aspects than
political strength. In order to move beyond unconditional correlations we estimate the following
version of equation (9):17
CENTRALjt = �+ �1 jt + �2Pjt + �3Xjt +COUNTRYj +YEARt + "jt; (11)
where COUNTRYj is a vector of country �xed e¤ects, and YEARt is a vector of year e¤ects.
We estimate the model for both expenditure and revenue centralization as the dependent
and McMenamin, 2008).17Using Stata 11, we cannot estimate panel �xed e¤ects models with our level of clustering. Thus we included
both a vector of country and time dummies. However, the reported R2 correspond to the within R-squares from(country) �xed e¤ect regressions.
11

variable. To allow for the non-linear e¤ect indicated by the theoretical model, we estimate all
speci�cations including the square and cube of .18
We use �xed e¤ects estimation to control for any country speci�c constant e¤ects. This is
di¤erent from Panizza (1999) and Arzaghi and Henderson (2005), although they also use GFS
data. The �rst only considers a cross-section while the latter use random e¤ects model. Their
focus is mainly on aspects that are country-speci�c and �xed over time, while our focus is on
time varying government strength. Many of the variables used in these earlier papers enter our
�xed e¤ects, and thus cannot be accounted for directly.
4 Estimation and Results
4.1 Expenditure Regressions
Table 2 presents our expenditure centralization speci�cations. The number of observations
varies across models between 457 and 530, including 60 to 64 countries. At the bottom of
the table, we present the likelihood and R2 as goodness-of-�t measures as well as the joint
signi�cance (and p-value) of all the political variables.
In the most basic speci�cation, column (1), where we only include government seat share
( ) and the �xed e¤ects, we �nd a negative e¤ect of government strength on centralization,
as predicted by theory. The e¤ect is not statistically signi�cant, however. In column (2) we
include economic controls (Xjt). We use logs of income per capita, population and population
density. Further, we lag income one period anticipating the time elapsing between economic
and political decision making. Including economic controls improves the �t of the model
signi�cantly, as illustrated by the increase in the R2 from 0:003 to 0:33. The coe¢ cient on
18We choose a cubic speci�cation for two reasons. First, political incentives might be di¤erent for very weekor very strong governments. A quadratic speci�cation does not allow for this. Further, in our dataset both theAIC and BIC information criteria indicate that the cubic speci�cation is a better �t to the data.
12

seat share remains negative and is slightly larger in absolute value, while still insigni�cant.
Economic controls are in line with expectations. Higher income increases centralization as
does a higher population density. Larger countries, in terms of population, decrease the level
of centralization, ceteris paribus.
Columns (3) and (4) present our full models including all political variables. The coe¢ cient
value for government strength in column (3) does not vary much and is close to �0:04. Now it
is statistically signi�cant at the 10%-level, while from the other political controls only left wing
is signi�cant. Interestingly, governments more on the left side of the political spectrum, while
typically expected to increase their own spending, are associated to lower levels of centraliza-
tion. The two concentration measures (government and opposition HHI ) are not signi�cant.
Political variables are (marginally) jointly signi�cant at the 10%-level. Column (4) presents
a robustness check on the political variables. We drop the HHIs and include dummies for
coalition and minority government. The coe¢ cient value of our main variable does not change
much, but we loose statistical signi�cance. Note that additionally to a left wing government,
a coalition also reduces the degree of centralization.
We next present the results of our non-linear speci�cation in columns (5) to (8). Controls
are identical as in the linear speci�cation and their coe¢ cients do not change much. We loose
statistical singi�cance for left wing in column (7), but coalition in column (8) is signi�cant at
the 5%-level.
There is a dramatic change, however, in the precision of the e¤ect of government strength.
Across all speci�cations, all terms of are highly statistically signi�cant. The overall e¤ect
remains negative. The upper panel of Figure 2 plots the cumulative e¤ect of the polynomial
coe¢ cients over the range of observed values for political strength. First, the (upper) con�dence
interval illustrates that the e¤ect is signi�cantly negative over the range observed. Second, the
13

empirical e¤ect is fairly constant over medium values of . It appears thus that, via the �exible
cubic speci�cation, our main e¤ect varies for extreme values of strength. This makes sense in as
much as our model might not adequately capture the incentives of governments facing extreme
values of . For instance, values close to zero for might correspond to situations where the
(only slightly) strongest party has very limited decisional power within a government coalition,
while values close to one may allow governments to essentially abstract from courting the
electorate.
4.2 Revenue Regressions
Table 3 presents the same speci�cations as Table 2 with revenue centralization as the dependent
variable. The number of observations varies between 458 and 529, corresponding to 59 to 64
countries.
The e¤ect of government strength on centralization is negative througout all speci�ca-
tions. Mirroring expenditure results, it is not statistically signi�cant in the linear speci�cations
(columns (1) to (4)). Again, if we allow for the more �exible cubic speci�cation, the precision
of the coe¢ cients increases manyfold and the overall e¤ect is (signi�cantly) negative. The
cumulative e¤ect is illustrated in the lower panel of Figure 2.
The economic controls contribute largely to the �t of the model. Their e¤ects (and coe¢ -
cient magnitudes) are highly similar to the expenditures regressions.
From the other political controls we observe that the opposition HHI is signi�cant and
negative both in the linear and cubic speci�cation. Hence, a more dispersed political opposition
reduces the degree of centralization. Further, in the non-linear speci�cation a coalition reduces
centralization.
14

4.3 Discussion of Results
We consistently �nd, across all speci�cations, that more government strength leads to a lower
degree of centralization. Controlling for other political aspects renders the e¤ect signi�cant (in
the expenditure regressions), while allowing for a non-linear e¤ect renders it highly signi�cant.
We would argue that this is an important and relevant result. Our country panel allows
to estimate the average e¤ect of , controlling for a wide range of other determinants of
centralization, in particular everything that is country-speci�c via �xed e¤ects. Hence, our
results con�rm our theoretical prior that stronger politicians have a weaker incentive to spend
by themselves on public good provision, since they do not have to invest as heavily in their
reelection, thus applying downward pressure on the centralization ratio.
The magnitude of the e¤ect, however, does not appear to be very large when one considers
the linear speci�cation. Based on Table 2 column (3) an increase in government strength
from the �rst decile (= 0:56) to the ninth decile (= 0:94) implies a decrease in the level
of decentralization of 1:5 percentage points, representing about 2% evaluated at the mean
(= 0:77). The e¤ect is stronger in the cubic speci�cation. This is illustrated in Figure 2,
indicating an overall e¤ect of government strength of roughly �0:2 evaluated at the mean.
Here an increase in from the �rst to the ninth decile implies a reduction in centralization of
5:6 percentage points, equal to 7:5% evaluated at the mean.
While the sign and magnitude of our coe¢ cients are stable across speci�cations, we do
not obtain statistical signi�cance particularly in the linear speci�cation. On the one hand,
this con�rms our theoretical prior, pointing toward a non-linear relationship. Intuitively, gov-
ernments that are at either side of the range of might be exposed to other incentives than
governments with medium strength. On the other hand, our approach to inference, clustering
15

at the electoral cycle, is quite conservative.
While our results are robust to a number of di¤erent speci�cations, they must be interpreted
with caution given some caveats. First, the GFS are often criticized for their frequent missing
data points and for hard-to-interpret variations in revenue and expenditure items for some
countries. However, to date, they remain the only comprehensive data source if one wants
to look at determinants of decentralization in a cross-country context including less devel-
opped countries.19 Second, unobserved preferences of the electorate jointly determine political
strength and the level of decentralization, thus creating an endogeneity problem. We would
argue that these preferences can be considered fairly stable over the period covered by our data
and that the problem is thus attenuated by the inclusion of country �xed e¤ects. Finally, and in
our opinion most importantly, our theoretical model assumes passive sub-federal governments.
This is in great part driven by the availability of data, as we do not have political indicators
at the sub-federal level. Yet, as discussed above, sub-federal governments interact with central
government decisions in ways that may well reverse the channel highlighted by our theory.
5 Conclusion
Does electoral competition a¤ect the degree of (de-)centralization in a federation? We address
this question empirically based on a simple political economy model. Our theoretical prediction
is that the degree of centralization is inversely related to the electoral strength of the central
government. The intuition behind this is that a strong government has a lesser incentive to
court its electorate by contributing to the public good. This in turn reduces the degree of
centralization.19Given the absence of better data, GFS data are widely used (and published). Examples are: the directly
related Panizza (1999) and Arzaghi and Henderson (2005); and the more recent Enikolopov and Zhuravskaya(2007) and Teobaldelli (2011).
16

We test this prediction using a panel of countries with yearly observations between 1990
and 2006. In our estimates we consistently �nd that electoral strength, measured as the share
of seats held by government in parliament, reduces the level of centralization. Thus our results
con�rm our theoretical prior. We identify a highly signi�cant non-linear (cubic) relationship
between government strength and centralization.
While the cross-country analysis presented in this paper remains exploratory given the
caveats discussed in the previous section, we are con�dent that our analysis is a useful step-
ping stone to advance our understanding of key political economy aspects of decentralization.
We extend the analysis precursored by Panizza (1999) and Arzaghi and Henderson (2005) by
introducing in a structured way electoral politics as a determinant of decentralization. Some of
the issues mentioned above could potentially be adressed, in further research, by considering
within-country data. As such, this paper is part of a broader, ongoing research agenda. Nev-
ertheless, the analysis is already suggestive of implications for policy design, highlighting the
need for decentralization reforms to take into account the reality of the political process. With
decentralization of expenditure responsibilities being an increasingly pervasive institution in
both developed and developing countries, this paper indicates a need to shift the policy focus
from whether decentralization is desirable to how decentralization is actually implemented.
17
References
[1] Arzaghi, M. and J. V. Henderson (2005). �Why Countries are Fiscally Decentralizing?�
Journal of Public Economics, 89, 1157-1189.
[2] Barro, R. (1973). �The Control of Politicians: An Economic Model,�Public Choice, 14,
19-42.
[3] Blöchliger, H. and D. King (2006). �Less Than You thought: the Fiscal Autonomy of
Sub-Central Governments,�OECD Economics Studies, 43, 155-188.
[4] Brender, A. and A. Drazen (2005). �Political budget cycle in new versus established democ-
racies,�Journal of Monetary Economics, 52, 1271-1295.
[5] Brueckner, J. K. (2009). �Partial �scal decentralization,� Regional Science and Urban
Economics, 39(1), 23-32, January.
[6] Brülhart, M. and M. Jametti (2007). �Does tax competition tame the Leviathan?,�CEPR
Discussion Paper 6606.
[7] Cadot, O., L.-H. Röller and A. Stephan (2006). �Contribution to productivity or pork
barrel? The two faces of infrastructure investment,�Journal of Public Economics, 90, pp.
1133-1153.
[8] Cox, G. W. and M. D. McCubbins (1986). �Electoral politics as a distributive game,�
Journal of Politics, 48, no. 2, 370-389.
[9] de Haan, J. and J.-E. Sturm (1997). �Political and economic determinants of OECD budget
de�cits and government expenditures: A reinvestigation,�European Journal of Political
Economy, 13, 739�750.
18

[10] de Haan, J., J.-E. Sturm, and G. Beekhuis (1999). �The weak government thesis: Some
new evidence,�Public Choice, 101, 163�176.
[11] Devarajan, S., S. Khemani and S. Shah (2009). �The Politics of Partial Decentralization,�
in Ehtisham Ahmad and Giorgio Brosio (Eds.), Does Decentralization Enhance Service
Delivery And Poverty Reduction?, Edward Elgar.
[12] Elgie, R. and I. McMenamin (2008). �Political fragmentation, �scal de�cits and political
institutionalisation,�Public Choice, 136, 255-267.
[13] Enikolopov, R. and E. Zhuravskaya (2007). �Decentralization and political institutions,�
Journal of Public Economics, 91, 2261-2290.
[14] Epple, D. and Th. Nechyba (2004). �Fiscal Decentralization,�in J. V. Henderson and J.-F.
Thisse (Eds.), Handbook of Regional and Urban Economics Vol 4 - Cities and Geography,
Elsevier - North Holland.
[15] Feld, L. P., G. Kirchgässner and C. A. Schaltegger (2010). �Decentralized Taxation and
the Size of Government: Evidence from Swiss State and Local Governments,�Southern
Economic Journal, 77(1), 27-48.
[16] Feld, L. P., C. A. Schaltegger and J. Schnellenbach (2008). �On Government Centralization
and Fiscal Referendums,�European Economic Review, 52, 611-645.
[17] Ferejohn, J. (1986). �Incumbent Performance and Electoral Control,�Public Choice, 50,
5-25.
[18] Hat�eld, J. W. and G. Padro i Miquel (2008). �A Political Economy Theory of Partial
Decentralization,�NBER Working Papers 14628.
19
[19] Knight, B. (2004). �Parochial interests and the centralized provision of local public goods:
Evidence from congressional voting on transportation projects,� Journal of Public Eco-
nomics, 88, 845-866.
[20] Joanis, M. (2009). �Intertwined Federalism: Accountability Problems under Partial De-
centralization,�CIRANO working paper 2009-s39.
[21] Joanis, M. (2011). �The Road to Power: Partisan Loyalty and the Centralized Provision
of Local Infrastructure,�Public Choice, 146, 117-143.
[22] Lindbeck, A. and J. W. Weibull (1987). �Balanced-budget redistribution as the outcome
of political competition,�Public Choice, 52(3), 273-297.
[23] Oates, W. E. (1972). Fiscal Federalism, New York: Harcourt Brace.
[24] Oates, W. E. (1985). �Searching for Leviathan: An Empirical Study,�American Economic
Review, 75, 748-757.
[25] Oates, W. E. (2003). �Toward a Second-Generation Theory of Fiscal Federalism,� Inter-
national Tax and Public Finance, 12, 349-373.
[26] Panizza, U. (1999). �On the Determinants of Fiscal Centralization: Theory and Evidence,�
Journal of Public Economics, 74, 97-139.
[27] Roubini, N. and J. Sachs (1989). �Government spending and budget de�cits in the indus-
trial countries,�Economic Policy, 8, 99�132.
[28] Stegarescu, D. (2009). �The e¤ects of economic and political integration on �scal de-
centralization: Evidence from OECD countries,�Canadian Journal of Economics, 42(2),
694-718.
20
[29] Teobaldelli, D. (2011). �Federalism and the shadow economy,�Public Choice, 146, 269-289.
[30] Treisman, D. (2007). The Architecture of Government: Rethinking Political Decentraliza-
tion, Cambridge: Cambridge University Press.
[31] Volkerink, B. and J. de Haan (2001). �Fragmented government e¤ects on �scal policy:
New evidence,�Public Choice, 109, 221�242.
[32] Weingast, B. R. (2009). �Second Generation Fiscal Federalism: The Implications of Fiscal
Incentives,�Journal of Urban Economics, 65, 279-293.
21
22
Figure 1: Electoral Strength and Centralization
Switzerland
Canada
Malta
Chile
Costa Rica
Peru
India
Malaysia
Thailand
Ethiopia
Mauritius
Bulgaria
Ukraine
Czech Republic
Slovak Republic
Latvia
Mongolia
Croatia
Slovenia
.4.6
.81
Cen
tra
lizat
ion
Ra
tio
.2 .4 .6 .8 1Electoral Strength
Expenditure Centralization Fitted values
2002

23
Figure 2: Cumulative Effect of Political Strength on Centralization
- Non-linear Specification
-.5
-.4
-.3
-.2
-.1
0
.2 .4 .6 .8 1Central Government Seat Share
Prediction 95% lower bound CI95% upper bound CI
Expenditure Centralization
-.4
-.3
-.2
-.1
0
.2 .4 .6 .8 1Central Government Seat Share
Prediction 95% lower bound CI95% upper bound CI
Revenue Centralization

24
Variable Observations Mean Std. Dev. Min Max
Expenditure Centralization 532 0.77 0.14 0.40 0.99
Revenue Centralization 531 0.74 0.15 0.39 0.99
Government seat share (γ) 535 0.57 0.14 0.17 0.97
Government Herfindahl index 537 0.67 0.28 0.11 1.00
Opposition Herfindahl index 534 0.46 0.22 0.07 1.00
Left Wing 537 0.37 0.48 0 1
Election Year 537 0.26 0.44 0 1
Coalition Government 537 0.64 0.48 0 1
Minority Government 537 0.27 0.44 0 1
GDP per capita (constant 2000 US$) 537 10566 10636 129 38407
Population (in millions) 537 53.40 162.00 0.25 1080.00
Population Density 537 117.82 148.78 1.39 1254.06
Sources: GFS, DPI, WDI
Table 1
Summary Statistics

25
(1) (2) (3) (4) (5) (6) (7) (8)
Government seat share (γ) ‐0.040 ‐0.045 ‐0.039* ‐0.042 ‐1.397*** ‐1.163** ‐1.272** ‐1.128**
(0.032) (0.029) (0.022) (0.030) (0.486) (0.470) (0.507) (0.477)
γ2
2.626*** 2.224** 2.398*** 2.247**
(0.894) (0.854) (0.914) (0.867)
γ3
‐1.560*** ‐1.345*** ‐1.426*** ‐1.372***
(0.526) (0.499) (0.529) (0.504)
Government Herfindahl index 0.005 0.011
(0.014) (0.011)
Opposition Herfindahl index ‐0.021 ‐0.023
(0.018) (0.016)
Left Wing ‐0.010* ‐0.011** ‐0.007 ‐0.008*
(0.005) (0.005) (0.005) (0.005)
Election Year ‐0.002 ‐0.001 ‐0.001 ‐0.001
(0.003) (0.003) (0.002) (0.002)
Coalition Government ‐0.015* ‐0.013**
(0.008) (0.006)
Minority Government ‐0.006 0.008
(0.008) (0.006)
Lag of Log(GDP per capita) 0.098*** 0.087*** 0.079** 0.082*** 0.076** 0.075**
(0.033) (0.033) (0.032) (0.028) (0.030) (0.030)
Log(Population) ‐2.150*** ‐2.025*** ‐2.582*** ‐1.720*** ‐1.696*** ‐2.093***
(0.459) (0.602) (0.561) (0.450) (0.536) (0.490)
Log(Population Density) 2.017*** 1.867*** 2.411*** 1.593*** 1.553*** 1.948***
(0.490) (0.620) (0.576) (0.482) (0.565) (0.514)
Log likelihood 1199.69 1080.28 1081.74 1090.13 1225.10 1102.85 1103.75 1111.00
R‐squared 0.003 0.33 0.32 0.33 0.002 0.33 0.32 0.33
Number of Observations 530 459 457 459 530 459 457 459
Number of Countries 64 60 60 60 64 60 60 60
Joint Significance of Political Variables 1.55 2.37 1.87* 1.22 3.04** 2.58* 2.33** 2.28**
P‐value 0.21 0.13 0.10 0.30 0.03 0.06 0.03 0.03
* p<0.1, ** p<0.05, *** p<0.01
Notes: A constant, time effects and country fixed effects included in all regressions.
Standard errors clustered across the electoral cycle.
R‐squared presented from fixed effect panel regression.
Table 2
Expenditure Regressions
Dependent Variable = Ratio of Expenditure
Centralization
Linear Political Strength Non‐Linear Political Strength

26
(1) (2) (3) (4) (5) (6) (7) (8)
Government seat share (γ) ‐0.017 ‐0.021 ‐0.022 ‐0.035 ‐1.070** ‐0.936** ‐1.094** ‐1.001**
(0.032) (0.028) (0.024) (0.031) (0.483) (0.424) (0.480) (0.446)
γ2
2.127** 1.847** 2.109** 1.953**
(0.910) (0.787) (0.885) (0.811)
γ3
‐1.303** ‐1.128** ‐1.265** ‐1.175**
(0.542) (0.466) (0.520) (0.472)
Government Herfindahl index ‐0.001 0.003
(0.015) (0.013)
Opposition Herfindahl index ‐0.039** ‐0.041**
(0.019) (0.018)
Left Wing ‐0.004 ‐0.003 ‐0.001 ‐0.001
(0.005) (0.005) (0.005) (0.005)
Election Year 0.000 0.000 0.000 0.001
(0.003) (0.003) (0.002) (0.002)
Coalition Government ‐0.013 ‐0.012*
(0.008) (0.007)
Minority Government ‐0.011 ‐0.001
(0.009) (0.009)
Lag of Log(GDP per capita) 0.088** 0.087** 0.073** 0.076** 0.077** 0.071**
(0.038) (0.036) (0.035) (0.033) (0.032) (0.033)
Log(Population) ‐2.573*** ‐2.278*** ‐3.012*** ‐2.204*** ‐1.970*** ‐2.600***
(0.602) (0.716) (0.715) (0.549) (0.617) (0.624)
Log(Population Density) 2.298*** 1.988*** 2.713*** 1.937*** 1.695*** 2.324***
(0.639) (0.742) (0.735) (0.584) (0.649) (0.648)
Log likelihood 1142.27 1050.05 1050.71 1056.33 1160.27 1065.00 1066.96 1068.33
R‐squared 0.00 0.35 0.35 0.35 0.002 0.35 0.35 0.35
Number of Observations 529 458 456 458 529 458 456 458
Number of Countries 64 59 59 59 64 59 59 59
Joint Significance of Political Variables 0.28 0.57 1.36 0.60 1.98 2.01 2.19** 1.35
P‐value 0.59 0.45 0.24 0.70 0.12 0.11 0.04 0.23
* p<0.1, ** p<0.05, *** p<0.01
Notes: A constant, time effects and country fixed effects included in all regressions.
Standard errors clustered across the electoral cycle.
R‐squared presented from fixed effect panel regression.
Table 3
Revenue Regressions
Dependent Variable = Ratio of Expenditure
Centralization
Linear Political Strength Non‐Linear Political Strength