FISCAL CONSOLIDATION AND MACRO ECONOMY: INDIA’S …
32
FISCAL CONSOLIDATION AND MACRO ECONOMY: INDIA’S EXPERIENCE WITH RULE-BASED FISCAL POLICY AND POST-CRISIS CHALLENGES Brajamohan Misra * 1 Introduction Fiscal policy in India has evolved over time. Broadly, during the first 30 years of independence, between 1950 and 1980, the fiscal deficits of both the central and the state governments were not excessive. This was a period of revenue surplus in general. A major black spot in India’s fiscal development was 1980s, when Indian public finances were in a state of disarray resulting in persistently large fiscal deficits. There was a structural change in government budgets during the 1980s with emergence of revenue deficit in Centre’s budget in 1979-80. Revenue deficit and fiscal deficit continued to enlarge during 1980s raising concerns over rising public debt and interest payments and the consequent constraints on the availability of resources for meeting developmental needs. The large fiscal imbalances of the 1980s spilled over to the external sector resulting in the macroeconomic crisis of India in 1991. In the aftermath of the macro-economic crisis of 1991, a comprehensive reform programme was launched in India, of which fiscal consolidation constituted a major plank. The fiscal performance during the reform period, however, was characterized by a clear divide in the mid-1990s in the attainment of fiscal targets. There was evidence of the successful fiscal correction during 1991-92 to 1996-97 (except for 1993-94) in terms of a significant reduction in the fiscal deficit indicators. Since then, there was a significant reversal of the trend mostly up to 2002-03. In an effort to renew the process of fiscal consolidation and provide for long-term macroeconomic stability, the Central government enacted the Fiscal Responsibility and Budget Management (FRBM) Legislation in August 2003. At the State level, several State governments enacted a similar legislation on fiscal responsibility. Recognizing that any deviation from the self imposed targets prescribed in the fiscal legislations would exacerbate the fiscal stress, both Central and State governments responsibly adhered to the legislations up to 2007-08. With global financial crisis of 2008 affecting India’s macro-economy, the adherence to rule based policy was paused during the subsequent two years as the governments provided fiscal stimulus to compensate for the fall in private demand. Roll back of expansionary fiscal stance, however, commenced in 2010-11. Against this backdrop, this paper aims at examining the linkage between fiscal consolidation and macro-economic developments in India with specific emphasis on the rule based fiscal regime. A discussion on thematic theoretical and empirical literature on is provided in Section 2 after the introduction. Section 3 presents stylized facts about the fiscal policy regime in India. Section 4 sets out some analytics and empirical findings based a small structural model on fiscal consolidation and macro-economy in Indian context. The future challenges with regard to fiscal consolidation are deliberated upon in Section 5 followed by colluding observations. 2 Fiscal consolidation and macroeconomic performance: survey of literature There is a strong body of theoretical literature regarding impact of fiscal consolidation on ————— * The author is presently Adviser in the Department of Economic and Policy Research of the Reserve Bank of India, Mumbai. The views expressed in this paper are those of the author and do not reflect those of the organisation he is working for.
Transcript of FISCAL CONSOLIDATION AND MACRO ECONOMY: INDIA’S …
FISCAL CONSOLIDATION AND MACRO ECONOMY: INDIA’S EXPERIENCE WITH RULE-BASED FISCAL POLICY AND POST-CRISIS CHALLENGES
Brajamohan Misra*
1 Introduction
Fiscal policy in India has evolved over time. Broadly, during the first 30 years of independence, between 1950 and 1980, the fiscal deficits of both the central and the state governments were not excessive. This was a period of revenue surplus in general. A major black spot in India’s fiscal development was 1980s, when Indian public finances were in a state of disarray resulting in persistently large fiscal deficits. There was a structural change in government budgets during the 1980s with emergence of revenue deficit in Centre’s budget in 1979-80. Revenue deficit and fiscal deficit continued to enlarge during 1980s raising concerns over rising public debt and interest payments and the consequent constraints on the availability of resources for meeting developmental needs. The large fiscal imbalances of the 1980s spilled over to the external sector resulting in the macroeconomic crisis of India in 1991.
In the aftermath of the macro-economic crisis of 1991, a comprehensive reform programme was launched in India, of which fiscal consolidation constituted a major plank. The fiscal performance during the reform period, however, was characterized by a clear divide in the mid-1990s in the attainment of fiscal targets. There was evidence of the successful fiscal correction during 1991-92 to 1996-97 (except for 1993-94) in terms of a significant reduction in the fiscal deficit indicators. Since then, there was a significant reversal of the trend mostly up to 2002-03. In an effort to renew the process of fiscal consolidation and provide for long-term macroeconomic stability, the Central government enacted the Fiscal Responsibility and Budget Management (FRBM) Legislation in August 2003. At the State level, several State governments enacted a similar legislation on fiscal responsibility.
Recognizing that any deviation from the self imposed targets prescribed in the fiscal legislations would exacerbate the fiscal stress, both Central and State governments responsibly adhered to the legislations up to 2007-08. With global financial crisis of 2008 affecting India’s macro-economy, the adherence to rule based policy was paused during the subsequent two years as the governments provided fiscal stimulus to compensate for the fall in private demand. Roll back of expansionary fiscal stance, however, commenced in 2010-11.
Against this backdrop, this paper aims at examining the linkage between fiscal consolidation and macro-economic developments in India with specific emphasis on the rule based fiscal regime. A discussion on thematic theoretical and empirical literature on is provided in Section 2 after the introduction. Section 3 presents stylized facts about the fiscal policy regime in India. Section 4 sets out some analytics and empirical findings based a small structural model on fiscal consolidation and macro-economy in Indian context. The future challenges with regard to fiscal consolidation are deliberated upon in Section 5 followed by colluding observations.
2 Fiscal consolidation and macroeconomic performance: survey of literature
There is a strong body of theoretical literature regarding impact of fiscal consolidation on
————— * The author is presently Adviser in the Department of Economic and Policy Research of the Reserve Bank of India, Mumbai.
The views expressed in this paper are those of the author and do not reflect those of the organisation he is working for.
76 Brajamohan Misra
macroeconomic performance. In the empirical literature, a host of issues relating to fiscal consolidation have been debated and discussed. The issue became a lively subject of discussion following the recent global financial crisis, which necessitated coordinated monetary-fiscal policy actions by the national authorities with a view to pulling their economies out of recession. The theoretical perspectives and major relevant empirical works in this regard are reviewed in this Section.
2.1 Theoretical perspectives
There is no agreement among economists either on analytical grounds or on the basis of empirical results whether financing government expenditure by incurring a fiscal deficit is good, bad or neutral in terms of its real effects, particularly on investment and growth. There are three main theoretical perspectives with regard to fiscal policy and its impact on macroeconomic conditions namely Neo-classical, Keynesian and Ricardian Equivalence. Depending upon circumstances and the relevant theoretical perspectives, fiscal deficit may be bad, indifferent or good. In the Neo-classical perspective, fiscal deficit will have a detrimental effect on investment and growth owing to lower savings (revenue deficit) and pressure on interest rate resulting in crowding out of private investment. The Neo-classical economists assume that markets clear so that full employment of resources is attained. In contrast the Keynesian view argues, when there are unemployed resources, autonomous increase in government expenditure, whether through investment or consumption, financed through borrowings would cause output to expand through a multiplier process. In terms of Ricardian Equivalence, fiscal deficits are treated as neutral in terms of their impact on growth as deficit in any current period equals the present value of future taxation that is required to pay off the incremental debt resulting from the deficit. While the Neo-classical and Ricardian schools focus on the long run, the Keynesian view emphasises the short run effects.
For the “rational expectations” school or for the “real business school”, the implementation of an expansionary fiscal policy, aiming at strengthening growth rates and reducing unemployment, would not achieve objectives. On the contrary, budget deficits, either by money printing or by public borrowing, will increase public debt and interest rates, crowd out private investments, fuel inflation and damage medium-term growth. These cause, in turn, an upward adjustment of nominal wages to the new increased levels of prices, squeezing profits and postponing further corporate investments. Feldstein (1987), an eminent scholar of economic orthodoxy, also insists on arguing against expansionary fiscal policies, especially those resorting to deficit spending. Barro (1974) too, rejecting the idea that monetary and fiscal policies can be complementary policy tools, considers discretionary fiscal policies as particularly ineffective, since economic agents facing or expecting fiscal laxity save their money for future increased tax payments instead of increasing private spending and stimulating demand. Indeed, the idea is that in a situation of easier fiscal policy, monetary policy will have to be tightened later and higher taxes should be imposed for the accumulated government debt to be repaid (“Ricardian equivalence”). In this case, the fiscal multiplier is zero as consumption finally does not change. As far as Barro’s assumption is concerned, it should be emphasized that it has never been confirmed by empirical evidence in the real economy, as household savings have sharply fallen over the past two and half decades in most OECD countries, despite fiscal laxity. As empirical support in favour of the Ricardian view is rather weak (Elmendorf and Mankiw, 1998), the two major competing theories are the Neo-classical and Keynesian approaches.
There is another view which emphasised supply-side effects of fiscal policy under the name of New-classical models. The distinctive feature of full-fledged new classical models is that prices clear markets, so that fluctuations in output are the result of supply-side shocks and not of changes in aggregate demand. One implication of New-classical models, first highlighted by Lucas (1975)

Fiscal Consolidation and Macro Economy: India’s Experience with Rule-based Fiscal Policy and Post-crisis Challenges 77
and Sargent and Wallace (1981), is that fully anticipated policies affecting aggregate demand (but not aggregate supply) have no effect on growth either in the short term or the longer term. Only unanticipated policies – which reflect either surprises by the government or imperfect information – have an effect, which emerges entirely through the supply side. This does not mean that these models are silent on fiscal policy. However, they focus on the design of optimal fiscal policy, as distinct from the impact of fiscal policy on economic activity (see Lucas and Stokey, 1983; and Chari and Kehoe, 1998).
2.2 Empirical literature
There is a divide in empirical literature on whether fiscal consolidation is positively associated with positive macroeconomic performance or otherwise.
2.3 Fiscal deficits and growth
The link between fiscal deficits and economic growth is one of the most widely debated relationships in the macroeconomic literature.
2.3.1 Negative association of fiscal deficit and growth
Fiscal deficits received much of the blame for the assorted economic ills that beset developing countries in the 1980s, over-indebtedness and the debt crisis, high inflation and poor investment performance and growth (Easterly and Schmidt-Hebbel, 1993). The authors argue that fiscal deficits financed by money creation leads to inflation while debt financing leads to higher real interest rates or increased repression of financial markets, with fiscal gains coming at increasingly unfavourable terms. Fiscal deficit tends to reduce national savings and private sector credit significantly affecting private investment. According to the authors the virtuous circle of growth and good fiscal management is one of the strongest arguments for a policy of low and stable fiscal deficit.
Large fiscal consolidation has been associated with a positive macroeconomic development (Daniel et al., 2006). High quality fiscal adjustment can help mobilize domestic savings, increase the efficiency of resource allocation and boost confidence and expectations. The possibility of expansionary fiscal contraction is confirmed by Gupta et al. (2002) for a panel of low-income countries. In a study of transitional countries, Segura-Ubiergo et al. (2006) find that fiscal adjustment has been associated with higher growth primarily through two channels: (i) reduced government borrowing requirements, which curtailed the need to monetize budget deficits; and (ii) a credibility effect that signalled a political commitment to long-term fiscal sustainability and macro-economic stability. Further, Baldacci et al. (2003) state that the most important transmission mechanism through which fiscal adjustment stimulates growth in low-income countries is factor productivity.
Rangarajan and Subbarao (2007) stated, in a paper, that the fiscal deficits are per se not bad. In fact, they may be necessary, even desirable in some situations. The issue, therefore, is not whether or not there should be a fiscal deficit, but its appropriate level. The answer depends on a number of variables, particularly the level of savings and the ratio of revenues to GDP. It is also a function of the existing stock of debt and debt servicing burden, the rate of interest, the external payments situation, the degree of capital controls and importantly the use to which the borrowed resources are put. The advisable fiscal deficit level, therefore, is very contextual and varies from country to country. The authors mentioned the following reasons as to why continued high fiscal deficits are a concern. First, they disempowered the government’s fiscal stance by pre-empting a
78 Brajamohan Misra
larger share of public resources for debt servicing thereby leaving that much less for desirable expenditures such as physical infrastructure (e.g., roads, power) and social infrastructure (e.g., education, health). This leads to a declining ratio of capital expenditure in total expenditure. Second, “if we incur fiscal deficits together with revenue deficits, it means we are using up borrowed resources for current consumption which may raise growth in the short term, but of the spurious variety. For sustainable growth, we need to balance our books on the revenue account and use borrowed funds only for investment”. Third, to the extent the government pre-empts the available investible resources, it crowds out the private sector. A balance needs to be struck in apportioning the investible resources between the government and the private sector. The crowding out argument has even greater force in an economy with capital controls. Fourth, continued fiscal deficits impact on interest and inflation rates depending on how the deficits are financed. If the government borrows in the domestic market, it puts pressure on the interest rate. If the government finances the deficit by creating high power money, it fuels inflation. In India, since deficits are financed by open market borrowing, albeit through a preferential Statutory Liquidity Ratio (SLR) window, the risk is largely of government borrowings leading to higher interest rates. Finally, fiscal deficits are also bad for another little realised, but powerful reason. Fiscal deficits, especially in the face of revenue deficits, exacerbate inter-temporal equity concerns as they give the pleasure of spending to the current generation while passing on the pain of debt servicing to the later generation.
There is overwhelming empirical evidence that low fiscal deficits and growth are self-reinforcing; good fiscal management preserves access to foreign lending and avoids the crowding out of private investment, while growth stabilizes the budget and improves the fiscal position. But there are many dimensions to this issue, including whether government borrowing is financing government consumption or investment in infrastructure, whether the deficit is sustainable and how it is financed.
2.3.2 The contrary view
There are also arguments advocating higher deficit for promoting growth. Evdoridis (2000) on the positive impact of public deficits on economic growth indicates precisely the mechanism of dynamic equilibrium and the potentially positive impact of budget deficits in economic growth. The most interesting aspect of Evdoridis’s work is the demonstration that this positive outcome for growth rates is valid not only in recession periods. He argues that for a sustainable high growth rate, an imbalanced budget in favour of expenditures is a necessary prerequisite for growth, along with some combination of monetary easing.
2.3.3 Situation-specific view
According to Perotti (1999) the initial conditions of some key variables can explain why fiscal expansions have a positive effect in “good times” but a negative one in “bad times”, where fiscal consolidation are required. Hemming et al. (2002) summarised the empirical findings with regard to effectiveness of fiscal policy and size of fiscal multiplier as below:
Fiscal Multiplier will tend to be positive and possibly quite large when:
• there is excess capacity, the economy is either closed or it is open and the exchange rate is fixed and households have limited time horizons or are liquidity constrained;
• increased government spending does not substitute for private spending, it enhances the productivity of labor and capital and lower taxes increase labor supply and/or investment;
• government debt is low and the government does not face financing constraints;
Fiscal Consolidation and Macro Economy: India’s Experience with Rule-based Fiscal Policy and Post-crisis Challenges 79
• there is an accompanying monetary expansion with limited inflationary consequences.
Fiscal multipliers are likely to be smaller, and could turn negative, when:
• there is crowding out either directly as government provision substitutes for private provision and through imports, or as interest rates rise and a flexible exchange rate appreciates in response to a fiscal expansion;
• households are Ricardian, in which case a permanent fiscal expansion can reduce consumption;
• there is a debt sustainability problem and risk premium on interest rates are large, in which case a credible fiscal contraction can result in a large fall in interest rates;
• expansionary fiscal policy increases uncertainty which leads to more cautious savings and investment decisions by households and firms.
Researchers have pointed out that the role of fiscal policy appears most clearly when, for one reason rather the other, monetary policy cannot be used (Allsopp, 2005). There is a potential role of the fiscal instruments to be used so as to ensure medium-term price stability and subject to that, to deliver as much stabilization as possible. There are two cases which are of great policy significance. The first is where the nominal interest rate approaches its lower bound of zero – the “liquidity trap case”. The second is the case of monetary unions such as EMU, where interest rates cannot be used to offset country-specific shocks (often called asymmetric shocks, to distinguish them from common shocks).
2.3.4 Short-term and long-term effects
There is another line of research which divides the effects of expansionary fiscal policy in the short run and long run (Andrés and Doménech, 2004). According to some research studies, there is a significant and positive short run effects on output of fiscal expansions. These results are in clear contrast with the other stream of literature in which contractionary policies have expansionary effects on output. As regards long run effect of fiscal expansion, the empirical evidence for the United States and EMU indicates that the deterioration of public savings, which is the main cause of larger government deficits, was not compensated by private savings, resulting in lower national saving and investment rate. If private saving compensates for only a fraction of public deficits, then fiscal expansions financed with public debt should increase real interest rates. If deficit spending implies higher interest rates and lower private investment, most growth theories (for example, Mankiw, Romer and Weil, 1992) predicts a lower per capita income or long run growth. Therefore, fiscal deficits have an indirect effect upon growth through capital accumulation. However, a negative direct effect has been directly confirmed empirically by some authors, even after controlling by the investment rates (Fischer and William, 1990; Andrés et al., 1996).
2.3.5 Quality of public expenditure
Following the above research findings, there is a debate about quality of public expenditure. The reform of public expenditure is typically undertaken to reduce government spending. But even when public spending need not shrink, expenditure reform can still improve the productivity of existing spending, free resources to help meet new needs, and improve governance and transparency (Gupta et al., 2005). Reducing expenditure while improving their composition need not undermine growth of social indicators. While the capital expenditure is perceived to be growth inducing, public expenditure also plays a great role, necessarily when targeted at the poor. Thus, public spending should be judged on its impact on growth and investment, as well as on poverty and equity (Daniel et al., 2006).

80 Brajamohan Misra
2.4 Fiscal rules and fiscal consolidation
The experiences on fiscal consolidation process in the 1990s have another noteworthy feature, which was the introduction of a sound fiscal framework supported by institutional reforms (OECD, 2007). Recognising the difficulties associated with discretionary fiscal policies, several advanced countries enacted fiscal responsibility legislations (FRLs) during the 1990s as permanent institutional devices aiming to promote fiscal discipline in a credible, predictable and transparent manner. New Zealand was at the forefront of these reforms, adopting FRL in 1994 followed by Australia, United Kingdom and the European Union. In emerging market economies, adoption of fiscal responsibility has been more recent and limited mainly to Latin America (Argentina, Brazil, Chile and Peru) and Asia (India, Indonesia, Pakistan and Sri Lanka).
In practice, fiscal rules have been adopted for a wide variety of reasons such as: (a) to ensure macroeconomic stability, as in post-war Japan; (b) to enhance the credibility of the Government’s fiscal policy and aid in deficit elimination, as in some Canadian provinces; (c) to ensure long-term sustainability of fiscal policy, especially in light of population ageing, as in New Zealand; or (d) to minimize negative externalities within a federation or international arrangement, as in the European Economic and Monetary Union (Kennedy and Robbins, 2001). In the emerging countries, the immediate motivation has been to reverse the building of public debt, to restore fiscal sustainability and more generally, to enhance the credibility of macroeconomic management (Kopits, 2004).
Present fiscal policy rules are fairly diverse in both design and implementation. While Anglo-Saxon countries (Australia, New Zealand, United Kingdom) emphasise procedural rules aiming to enhance transparency, accountability and fiscal management, continental Europe (EMU Stability and Growth Pact) and emerging market economies (Argentina, Brazil, Columbia, India, Pakistan, Peru and Sri Lanka) rely far more on a set of numerical reference values (targets, limits) on performance indicators. There are four main types of numerical fiscal rules: deficit rules (e.g., balanced budget); debt rules (e.g., debt ceilings); borrowings rules (e.g., prohibition of central bank financing) and expenditure rules (e.g., ceilings on some types of public expenditure or public expenditure growth).
It has been documented that countries with fiscal rules achieved better results. Fiscal rules with embedded expenditure targets tended to be associated with larger and longer fiscal adjustments and higher success rates. Furthermore, adoption of a spending rule on top of a budget balance rule helped in the achievement and maintenance of a primary balance that was sufficient to stabilize the debt-to-GDP ratio (OECD, 2007). Since, in most countries FRLs have not been around for more than few years, evidence on their effectiveness is still preliminary. Still, there seems to be broad agreement that the quality of fiscal institutions does matter for fiscal performance. In this sense, FRL holds the potential of improving fiscal management, if supported by strong political management to fiscal prudence and sufficiently developed fiscal institutional framework. A well designed FRL may help contain fiscal deficits and expenditure biases, address issues of time inconsistency, help reduce borrowing costs and output variability and enhance transparency and accountability (Corbacho and Schwartz, 2007).
2.5 The return of activist fiscal policy
Countries all over the world provided fiscal stimulus following the global financial crisis of 2008. The U.S. federal government enacted several rounds of activist fiscal policy. These began early in the recession with temporary tax cuts enacted in February 2008, followed by a tax credit for first-time homebuyers enacted in July 2008. They reached a crescendo in February 2009 with the American Recovery and Reinvestment Tax Act (ARRA): a combination of tax cuts, transfers to individuals and states and government purchases estimated to increase budget deficits by a

Fiscal Consolidation and Macro Economy: India’s Experience with Rule-based Fiscal Policy and Post-crisis Challenges 81
cumulative amount equal to 5.5 per cent of one year’s GDP. The fiscal stimulus continued thereafter with more targeted measures. Accompanying these fiscal efforts were the Troubled Asset Relief Program, enacted in fall 2008 to address the financial crisis and a continuing array of interventions by the Federal Reserve Board that aimed to stabilize credit markets and stimulate the economy. Around the world, other countries caught in the grip of recession also pursued a variety of active fiscal strategies, ranging from temporary consumption tax rebates (for example, in the United Kingdom) to large public works projects (notably in China). The prevalence of fiscal policy interventions in this period reflects both the severity of the recession and a revealed optimism with regard to the potential effectiveness of activist fiscal policy (Auerbach et al., 2010). Thus, extending fiscal stimulus to contain the impact of the crisis as well as promote growth may be seen as return of the Keynesian doctrine.
According to the IMF Staff Position Note of June 9, 2009, the global financial crisis is having major implications for the public finances of most countries. Fiscal revenues are declining through the operation of automatic stabilizers and because of lower asset and commodity prices. Direct fiscal support is being provided to the financial sector and many countries are undertaking discretionary fiscal stimulus. This is cushioning the global economy from the effects of the crisis. But it implies a fiscal deterioration that is particularly strong for advanced countries, where the increase in both government debt and contingent liabilities is unprecedented in scale and pervasiveness since the end of the Second World War. According to the Note, the fiscal balances of G-20 advanced countries are projected to weaken by 8 percentage points of GDP on average and government debt is projected to rise by 20 percentage points of GDP in 2008-09, with most of the deterioration occurring in 2009. The fiscal balances of G-20 emerging market economies will deteriorate by 5 percentage points of GDP. For advanced economies, the increase in debt mostly reflects support to the financial sector, fiscal stimulus, and revenue losses caused by the crisis. For emerging economies, a relatively large component of the fiscal weakening reflects declining commodity and asset prices. It may mentioned that following large fiscal supports extended by many European countries like Greece, Portugal, Spain and Ireland, their fiscal conditions deteriorated very fast and they were beset with sovereign debt problems, which necessitated support of European Union and IMF.
The IMF Staff Note states that while fiscal balances are expected to improve over the medium term, they will remain weaker than before the crisis. Public debt-to-GDP ratios will continue to increase over the medium term: in 2014 the G-20 advanced country average is projected to exceed the end-2007 average by 36 percentage points of GDP. On current policies, debt ratios will continue to grow over the longer term, reflecting demographic forces. Moreover, for both advanced and emerging economies, the crisis has increased short- and medium-term fiscal risks, with key downside risks arising from the need for possible further support to the financial sector, the intensity and the persistence of the output downturn, and the return from the management and sale of assets acquired during the financial support operations. The somber fiscal outlook raises issues of fiscal solvency and could eventually trigger adverse market reactions. This must be avoided: market confidence in governments’ solvency is a key source of stability and a precondition for economic recovery. Therefore, there is an urgent need for governments to clarify their exit strategy to ensure that solvency is not at risk. In formulating such a strategy, four components are particularly important: (1) fiscal stimulus packages, where these are appropriate should not have permanent effects on deficits; (2) medium-term frameworks, buttressed by clearly identified policies and supportive institutional arrangements, should provide a commitment to fiscal correction, once economic conditions improve; (3) structural reforms should be implemented to enhance growth; and (4) countries facing demographic pressures should firmly commit to clear strategies for health and pension reforms.
82 Brajamohan Misra
3 Fiscal regimes in india: some stylized facts
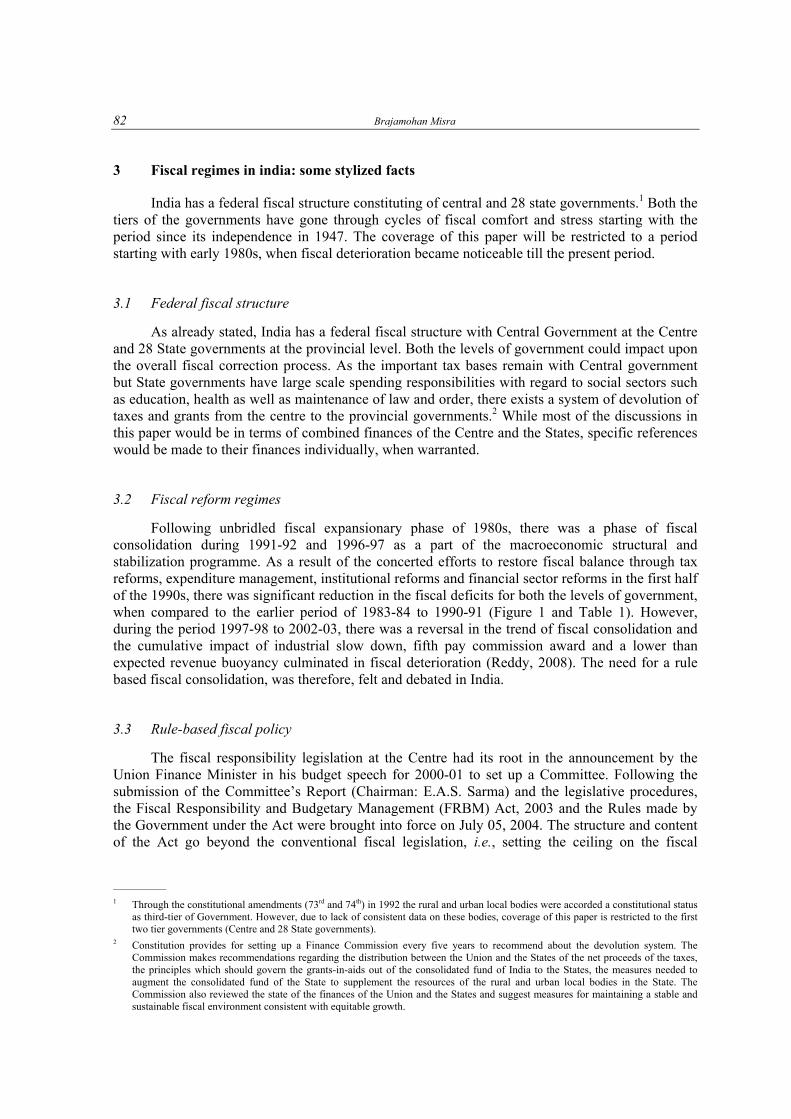
India has a federal fiscal structure constituting of central and 28 state governments.1 Both the tiers of the governments have gone through cycles of fiscal comfort and stress starting with the period since its independence in 1947. The coverage of this paper will be restricted to a period starting with early 1980s, when fiscal deterioration became noticeable till the present period.
3.1 Federal fiscal structure
As already stated, India has a federal fiscal structure with Central Government at the Centre and 28 State governments at the provincial level. Both the levels of government could impact upon the overall fiscal correction process. As the important tax bases remain with Central government but State governments have large scale spending responsibilities with regard to social sectors such as education, health as well as maintenance of law and order, there exists a system of devolution of taxes and grants from the centre to the provincial governments.2 While most of the discussions in this paper would be in terms of combined finances of the Centre and the States, specific references would be made to their finances individually, when warranted.
3.2 Fiscal reform regimes
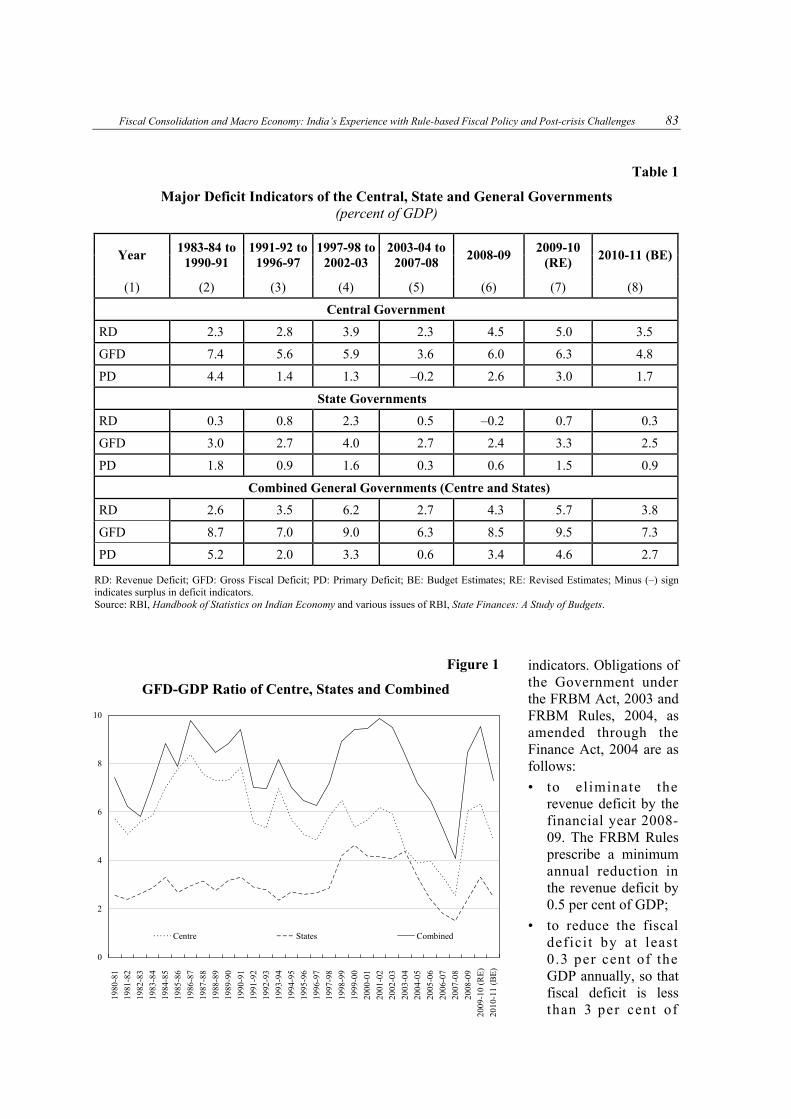
Following unbridled fiscal expansionary phase of 1980s, there was a phase of fiscal consolidation during 1991-92 and 1996-97 as a part of the macroeconomic structural and stabilization programme. As a result of the concerted efforts to restore fiscal balance through tax reforms, expenditure management, institutional reforms and financial sector reforms in the first half of the 1990s, there was significant reduction in the fiscal deficits for both the levels of government, when compared to the earlier period of 1983-84 to 1990-91 (Figure 1 and Table 1). However, during the period 1997-98 to 2002-03, there was a reversal in the trend of fiscal consolidation and the cumulative impact of industrial slow down, fifth pay commission award and a lower than expected revenue buoyancy culminated in fiscal deterioration (Reddy, 2008). The need for a rule based fiscal consolidation, was therefore, felt and debated in India.
3.3 Rule-based fiscal policy
The fiscal responsibility legislation at the Centre had its root in the announcement by the Union Finance Minister in his budget speech for 2000-01 to set up a Committee. Following the submission of the Committee’s Report (Chairman: E.A.S. Sarma) and the legislative procedures, the Fiscal Responsibility and Budgetary Management (FRBM) Act, 2003 and the Rules made by the Government under the Act were brought into force on July 05, 2004. The structure and content of the Act go beyond the conventional fiscal legislation, i.e., setting the ceiling on the fiscal
————— 1 Through the constitutional amendments (73rd and 74th) in 1992 the rural and urban local bodies were accorded a constitutional status
as third-tier of Government. However, due to lack of consistent data on these bodies, coverage of this paper is restricted to the first two tier governments (Centre and 28 State governments).
2 Constitution provides for setting up a Finance Commission every five years to recommend about the devolution system. The Commission makes recommendations regarding the distribution between the Union and the States of the net proceeds of the taxes, the principles which should govern the grants-in-aids out of the consolidated fund of India to the States, the measures needed to augment the consolidated fund of the State to supplement the resources of the rural and urban local bodies in the State. The Commission also reviewed the state of the finances of the Union and the States and suggest measures for maintaining a stable and sustainable fiscal environment consistent with equitable growth.
Fiscal Consolidation and Macro Economy: India’s Experience with Rule-based Fiscal Policy and Post-crisis Challenges 83
Table 1
Major Deficit Indicators of the Central, State and General Governments (percent of GDP)
Year 1983-84 to
1990-91 1991-92 to
1996-97 1997-98 to
2002-03 2003-04 to
2007-08 2008-09
2009-10 (RE)
2010-11 (BE)
(1) (2) (3) (4) (5) (6) (7) (8)
Central Government
RD 2.3 2.8 3.9 2.3 4.5 5.0 3.5
GFD 7.4 5.6 5.9 3.6 6.0 6.3 4.8
PD 4.4 1.4 1.3 –0.2 2.6 3.0 1.7
State Governments
RD 0.3 0.8 2.3 0.5 –0.2 0.7 0.3
GFD 3.0 2.7 4.0 2.7 2.4 3.3 2.5
PD 1.8 0.9 1.6 0.3 0.6 1.5 0.9
Combined General Governments (Centre and States)
RD 2.6 3.5 6.2 2.7 4.3 5.7 3.8
GFD 8.7 7.0 9.0 6.3 8.5 9.5 7.3
PD 5.2 2.0 3.3 0.6 3.4 4.6 2.7
RD: Revenue Deficit; GFD: Gross Fiscal Deficit; PD: Primary Deficit; BE: Budget Estimates; RE: Revised Estimates; Minus (–) sign indicates surplus in deficit indicators. Source: RBI, Handbook of Statistics on Indian Economy and various issues of RBI, State Finances: A Study of Budgets.
indicators. Obligations of the Government under the FRBM Act, 2003 and FRBM Rules, 2004, as amended through the Finance Act, 2004 are as follows:
• to eliminate the revenue deficit by the financial year 2008-09. The FRBM Rules prescribe a minimum annual reduction in the revenue deficit by 0.5 per cent of GDP;
• to reduce the fiscal defici t by at least 0.3 per cent of the GDP annually, so that fiscal deficit is less than 3 per cent of
Figure 1
GFD-GDP Ratio of Centre, States and Combined
0
2
4
6
8
10
1980
-81
1981
-82
1982
-83
1983
-84
1984
-85
1985
-86
1986
-87
1987
-88
1988
-89
1989
-90
1990
-91
1991
-92
1992
-93
1993
-94
1994
-95
1995
-96
1996
-97
1997
-98
1998
-99
1999
-00
2000
-01
2001
-02
2002
-03
2003
-04
2004
-05
2005
-06
2006
-07
2007
-08
2008
-09
2009
-10
(RE
)
2010
-11
(BE
)
Centre States Combined

84 Brajamohan Misra
GDP by the end of 2008-09;
• to limit Government guarantees to at most 0.5 per cent of the GDP in any financial year;
• to limit additional liabilities (including external debt at current exchange rate) to 9 per cent of GDP in 2004-05, 8 per cent of GDP in 2005-06, 7 per cent of GDP in 2006-07, 6 per cent of GDP in 2007-08;
• not to borrow directly from the Reserve Bank of India w.e.f. April 01, 2006.
• to present three statements before the Parliament along with the annual budget: Macroeconomic Framework Statement, Fiscal Policy Strategy Statement and Medium-term Fiscal Policy Statement incorporating three year rolling targets for prescribed fiscal indicators and underlying assumptions;
• to move towards greater fiscal transparency and start disclosing specified information such as arrears of unrealized revenue, guarantees and assets latest by 2006-07;
• furthermore, the FRBM Act requires that the Finance Minister conduct quarterly review of receipts and expenditure and place the outcome of these reviews before the Parliament. He is obliged to take remedial measures to check deterioration in fiscal position, which may not only include measures to increase revenues but also to curtail expenditures. The Finance Minister is also obliged to make a statement in the Parliament explaining the reasons for any deviations from the obligations cast on the Government under the FRBM Act and remedial measures that are proposed to be taken to rectify the situation.
Thus, the FRBM Act not only mandates minimum quantifiable targets for reducing the growth of debt, deficit and guarantees in a time bound manner but also embeds a series of improvements in the area of fiscal transparency and medium-term fiscal planning to improve budget management and catalyse the process of true democratic control of fiscal policy through informed public opinion on the risks inherent in unabated growth in debt and deficit.
The State Governments also adopted a rule-based framework for fiscal correction and consolidation through progressive enactment of Fiscal Responsibility Legislation (FRL). Karnataka was the first to enact the FRL in September 2002 followed by Kerala and Tamil Nadu in 2003 and Punjab in 2004. Subsequently, twenty-two more States enacted the FRLs. All State Governments barring Sikkim and West Bengal have enacted FRLs so far.3 These two States enacted FRLs subsequently following the recommendations of the 13th Finance Commission. The enactment of FRLs has provided impetus to the process of attaining fiscal sustainability as reduction in key deficit indicators, viz., revenue deficit (RD) and gross fiscal deficit (GFD), is critical for reducing the mounting level of debts of the States. Although there are variations across States in the choice of target and the time frame for achieving the target, most of the FRLs have stipulated elimination of RD by March 31, 2009 and reduction in GFD as percent of gross State domestic product (GSDP) to 3 per cent by March 31, 2010, in line with the targets prescribed by the TFC. In addition, several States have imposed limits on guarantees and targeted to reduce their liabilities.
3.4 Fiscal consolidation during the rule-based period (2004-05 to 2007-8)
The experience with FRBM Act, 2003 at Centre and the corresponding Acts at State level show that statutory fiscal consolidation targets have a positive effect on macroeconomic management of the economy. Table 2 provides how both the Central and State governments (consolidated) improved their fiscal position in terms of the major deficit indicators during the post-rule based period. Incidentally, the fiscal correction process was faster by the States as ————— 3 A reference may be made to Misra and Khundrakpam (2009) for a detailed discussion on fiscal consolidation of Central and State
governments.
Fiscal Consolidation and Macro Economy: India’s Experience with Rule-based Fiscal Policy and Post-crisis Challenges 85
Table 2
Major Deficit Indicators of the Central, State and General Governments (percent of GDP)
Year 2003-04 2004-05 2005-06 2006-07 2007-08 2008-09 2009-10 RE 2010-11 BE
(1) (2) (3) (4) (5) (6) (7) (8) (9)
Central Government
RD 3.6 2.4 2.5 1.9 1.1 4.5 5.0 3.5
GFD 4.5 3.9 4.0 3.3 2.5 6.0 6.3 4.8
PD –0.03 –0.04 0.4 –0.2 –0.9 2.6 3.0 1.7
State Governments
RD 2.3 1.2 0.2 –0.6 –0.9 –0.2 0.7 0.3
GFD 4.4 3.3 2.4 1.8 1.5 2.4 3.3 2.5
PD 1.5 0.7 0.2 –0.4 –0.5 0.6 1.5 0.9
Combined General Governments (Centre and States)
RD 5.9 3.6 2.7 1.3 0.2 4.3 5.7 3.8
GFD 8.4 7.2 6.5 5.4 4.1 8.5 9.5 7.3
PD 2.0 1.3 1.0 0.0 –1.1 3.4 4.6 2.7
RE: Revised Estimates, BE: Budget Estimates, RD: Revenue Deficit, GFD: Gross Fiscal Deficit, PD: Primary Deficit; Negative (–) sign indicates surplus in deficit indicators. Source: RBI, Handbook of Statistics on Indian Economy and various issues of RBI, State Finances: A Study of Budgets.
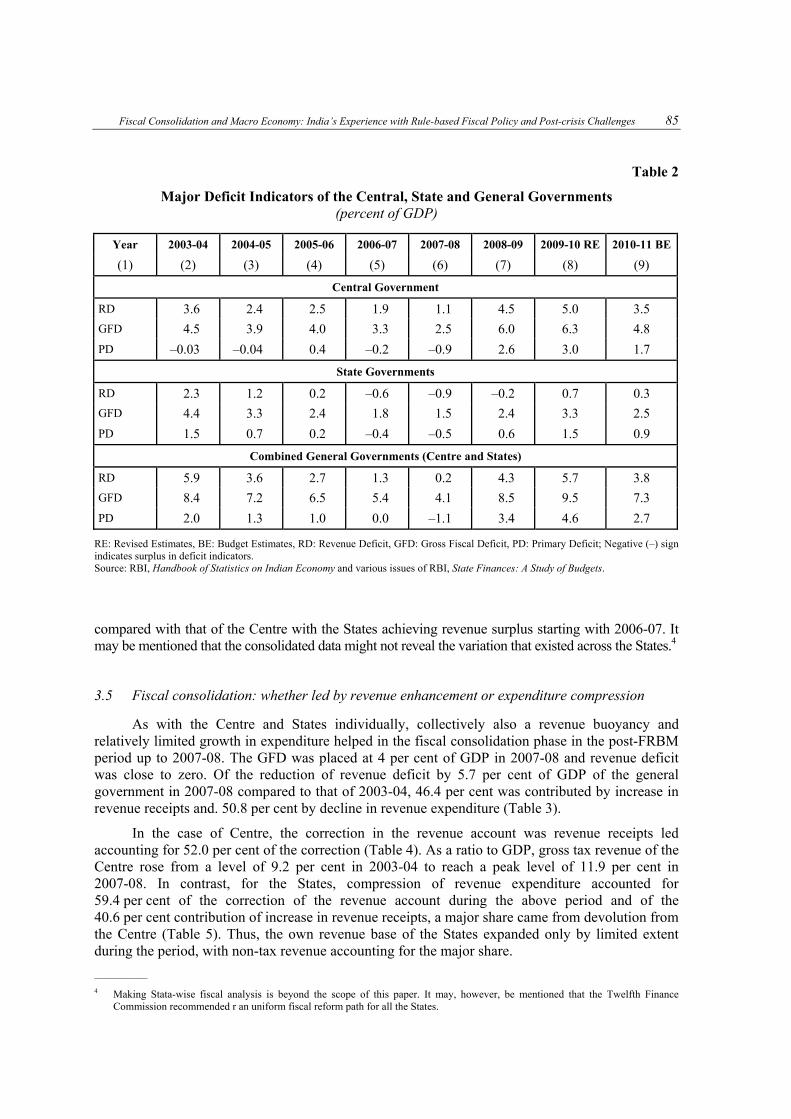
compared with that of the Centre with the States achieving revenue surplus starting with 2006-07. It may be mentioned that the consolidated data might not reveal the variation that existed across the States.4
3.5 Fiscal consolidation: whether led by revenue enhancement or expenditure compression
As with the Centre and States individually, collectively also a revenue buoyancy and relatively limited growth in expenditure helped in the fiscal consolidation phase in the post-FRBM period up to 2007-08. The GFD was placed at 4 per cent of GDP in 2007-08 and revenue deficit was close to zero. Of the reduction of revenue deficit by 5.7 per cent of GDP of the general government in 2007-08 compared to that of 2003-04, 46.4 per cent was contributed by increase in revenue receipts and. 50.8 per cent by decline in revenue expenditure (Table 3).
In the case of Centre, the correction in the revenue account was revenue receipts led accounting for 52.0 per cent of the correction (Table 4). As a ratio to GDP, gross tax revenue of the Centre rose from a level of 9.2 per cent in 2003-04 to reach a peak level of 11.9 per cent in 2007-08. In contrast, for the States, compression of revenue expenditure accounted for 59.4 per cent of the correction of the revenue account during the above period and of the 40.6 per cent contribution of increase in revenue receipts, a major share came from devolution from the Centre (Table 5). Thus, the own revenue base of the States expanded only by limited extent during the period, with non-tax revenue accounting for the major share.
————— 4 Making Stata-wise fiscal analysis is beyond the scope of this paper. It may, however, be mentioned that the Twelfth Finance
Commission recommended r an uniform fiscal reform path for all the States.

86 Brajamohan Misra
Table 3
Correction in Revenue Account of Central and State Governments (percent of GDP)
2003-04 2007-08 Correction 4=(3–2) Contribution
(1) (2) (3) (4) (5)
Revenue Receipt 18.6 21.3 2.7 –47.4
Revenue Expenditure 24.4 21.5 –2.9 50.9
Revenue Deficit 5.9 0.2 –5.7
Table 4
Correction in Revenue Account of Central Governments (percent of GDP)
2003-04 2007-08 Correction 4=(3-2) Contribution
(1) (2) (3) (4) (5)
Revenue Receipt 9.6 10.9 1.3 –52.0
Revenue Expenditure 13.1 11.9 –1.2 48.0
Revenue Deficit 3.6 1.1 –2.5
Table 5
Correction in Revenue Account of the State Governments (percent of GDP)
2003-04 2007-08 Correction 4=(3–2) Contribution
(1) (2) (3) (4) (5)
RD 2.30 –0.86 –3.16
Revenue Receipts 11.22 12.51 1.28 40.61
Own Revenues 6.94 7.29 0.35 11.08
OTR 5.59 5.75 0.15 4.89
ONTR 1.35 1.55 0.20 6.19
Current Transfers 4.28 5.21 0.93 29.53
SCT 2.44 3.04 0.60 19.00
GRANTS 1.85 2.18 0.33 10.52
RE 13.53 11.65 –1.88 59.39
RD: Revenue Deficit; OTR: Own Tax revenue; ONTR: Own Non-tax Revenue; SCT: Share in Central Taxes; RE: Revenue Expenditure. Source: RBI, State Finance Studies, various issues.

Fiscal Consolidation and Macro Economy: India’s Experience with Rule-based Fiscal Policy and Post-crisis Challenges 87
3.6 Global financial crisis and fiscal stimulus
Given the exceptional circumstances of 2008-09 and 2009-10, fiscal consolidation effort was setback on account of economic slowdown following the global crisis. In line with international trend, the government responded with a number of fiscal stimulus measures encompassing both tax cuts and higher expenditure during 2008-09 and 2009-10 to counter the economic slowdown. Therefore, revenue deficit and gross fiscal deficit of the Central government widened substantially
a n d e x c e e d e d t h e pre-FRBM level. In this context, it is important to recognise that unlike in most Advanced G-20 countries where the direct fiscal support to f inancial inst i tut ions averaged 5.7 per cent of GDP (IMF, 2009, “Staff Position Note”, Septem-ber), the Government did not extend any such support in India. The broad nature of the stimulus measures is set out in Table 6.
Owing to the fiscal stimulus package which envisaged significant
reduction in tax rates and rise in expenditure as a part of discretional fiscal policy by the Centre, the fiscal deficit indicators reversed during 2008-09 and 2009-10. Incidentally, the payments on account of Sixth Pay Commission of the Centre coincided with the timing of the stimulus package and acted as stimulus for the economy in view of falling private consumption and investment demand. Gross tax revenue of the Centre as a ratio to GDP declined noticeably to 10.9 per cent in 2008-09 and further to 9.6 per cent in 2009-10 on account of sharp fall in collection of indirect tax collections (customs and excise), particularly excise duties. As a result of the shortfall in revenues and substantial increase in public expenditure, the revenue deficit and fiscal deficit targets mandated under the FRBM Act and Rules were not met in 2008-09 and 2009-10.
The fiscal consolidation process of the States was also disrupted and many of them deviated from the targets stipulated under their FRLs. The State Governments provided fiscal stimulus during 2008-09 and 2009-10 through different measures although there is lack of consistent collated data on fiscal stimulus extended by the States. Roughly, the deviation of fiscal deficit of 2009-10 from 2007-08 would provide some idea about impact of the global fiscal crisis on fiscal position of the Centre and the States as indicated in Table 7. While the deviation of fiscal deficit of the general government for 2009-10 from the level achieved in 2007-08 looks high at 5.4 per cent, it is at least 3.5 per cent higher compared to the FRBM target (3 per cent) of the Centre and targets of FRLs of the States (3 per cent of GSDP for each State).
This section analyses the analytics of fiscal consolidation in Indian context. First, the major empirical analyses have been briefly touched upon. Subsequently, the empirical findings based on the small structural macro model are discussed. The basic characterisation relates to whether fiscal deficit has any impact on macroeconomic performance in terms of growth and inflation.
Table 6
Fiscal Stimulus Measures (percent of GDP)
2008-09 2009-10
Tax reductions 0.2 0.4
Expenditure measures 2.2 1.4
of which: Sixth Pay Commission 0.5 0.3
Total 2.4 1.8

88 Brajamohan Misra
4 Fiscal consolidation and macroeconomic performance: Some analytics and empirical findings in the context of India
4.1 Review of literature in Indian context
Mohan (2008) observed that a high level of fiscal deficit impacts the practice of monetary policy and tends to have a negative impact on real GDP growth through “crowding out” effects and/or rise in interest rates in the economy. The high level of fiscal deficit between1997-98 and 2002-03 was associated with relatively low GDP growth. The reduction in fiscal deficit since 2003-04 has been associated with a phase of high GDP growth. Thus, fiscal correction and consolidation, which is a major ingredient of macroeconomic stability, provide a conducive environment for propelling growth of the economy. Figure 2 presents the movements of GDP growth and combined GFD-GDP ratio showing almost an inverse relationship between the two.
Kochhar (2004) indicated that the main channels through which the f iscal imbalances impact the growth per-formance of the economy are through the deteriora-tion in the quality of public expenditure, limi-tations on the room for macroeconomic policy manoeuvre and on the scope for the structural reforms and liberaliza-tion. Together this pre-vents the economy from attaining a sustained high growth path. She indi-cated a key manifestation of negative consequences of the large fiscal imbal-ances relates to deteriora-tion in the composition of public spending. In particular, public capital expenditure fails sharply and a growing proportion of revenue was used each year to service public debt. She stated that there was secular decline in the ratio of capital to current spending during the period 1990-91 and 2001-02. Rangarajan and S u b b a r a o ( 2 0 0 7 ) indicated that there was a declining ratio of capital
Table 7
Fiscal Deficit – Impact of Crisis (percent of GDP)
Difference of Fiscal Deficit 2007-08 2009-10
(1 over 2)
(1) (2) (3) (4)
Centre 2.5 6.3 3.8
States 1.5 3.3 1.8
Combined General Government 4.1 9.5 5.4
Figure 2
Growth Rate of GDP and Combined GFD-GDP Ratio
0
2
4
6
8
10
12
1980
-81
1981
-82
1982
-83
1983
-84
1984
-85
1985
-86
1986
-87
1987
-88
1988
-89
1989
-90
1990
-91
1991
-92
1992
-93
1993
-94
1994
-95
1995
-96
1996
-97
1997
-98
1998
-99
1999
-00
2000
-01
2001
-02
2002
-03
2003
-04
2004
-05
2005
-06
2006
-07
2007
-08
2008
-09
2009
-10
(RE
)
2010
-11
(BE
)
GDP Growth rate Combined GFD-GDP Ratio
Fiscal Consolidation and Macro Economy: India’s Experience with Rule-based Fiscal Policy and Post-crisis Challenges 89
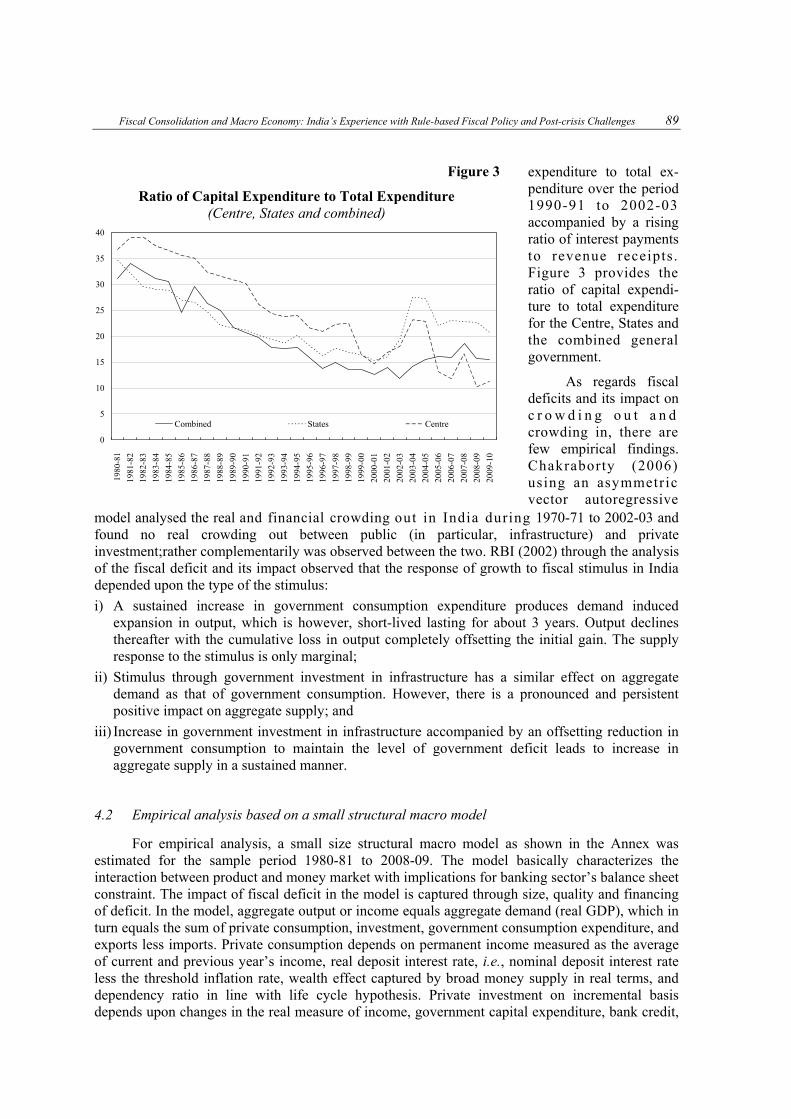
expenditure to total ex-penditure over the period 1990-91 to 2002-03 accompanied by a rising ratio of interest payments to revenue receipts. Figure 3 provides the ratio of capital expendi-ture to total expenditure for the Centre, States and the combined general government.
As regards fiscal deficits and its impact on c r o w d i n g o u t a n d crowding in, there are few empirical findings. Chakraborty (2006) using an asymmetric vector autoregressive
model analysed the real and financial crowding out in India during 1970-71 to 2002-03 and found no real crowding out between public (in particular, infrastructure) and private investment;rather complementarily was observed between the two. RBI (2002) through the analysis of the fiscal deficit and its impact observed that the response of growth to fiscal stimulus in India depended upon the type of the stimulus:
i) A sustained increase in government consumption expenditure produces demand induced expansion in output, which is however, short-lived lasting for about 3 years. Output declines thereafter with the cumulative loss in output completely offsetting the initial gain. The supply response to the stimulus is only marginal;
ii) Stimulus through government investment in infrastructure has a similar effect on aggregate demand as that of government consumption. However, there is a pronounced and persistent positive impact on aggregate supply; and
iii) Increase in government investment in infrastructure accompanied by an offsetting reduction in government consumption to maintain the level of government deficit leads to increase in aggregate supply in a sustained manner.
4.2 Empirical analysis based on a small structural macro model
For empirical analysis, a small size structural macro model as shown in the Annex was estimated for the sample period 1980-81 to 2008-09. The model basically characterizes the interaction between product and money market with implications for banking sector’s balance sheet constraint. The impact of fiscal deficit in the model is captured through size, quality and financing of deficit. In the model, aggregate output or income equals aggregate demand (real GDP), which in turn equals the sum of private consumption, investment, government consumption expenditure, and exports less imports. Private consumption depends on permanent income measured as the average of current and previous year’s income, real deposit interest rate, i.e., nominal deposit interest rate less the threshold inflation rate, wealth effect captured by broad money supply in real terms, and dependency ratio in line with life cycle hypothesis. Private investment on incremental basis depends upon changes in the real measure of income, government capital expenditure, bank credit,
Figure 3
Ratio of Capital Expenditure to Total Expenditure (Centre, States and combined)
0
5
10
15
20
25
30
35
40
1980
-81
1981
-82
1982
-83
1983
-84
1984
-85
1985
-86
1986
-87
1987
-88
1988
-89
1989
-90
1990
-91
1991
-92
1992
-93
1993
-94
1994
-95
1995
-96
1996
-97
1997
-98
1998
-99
1999
-00
2000
-01
2001
-02
2002
-03
2003
-04
2004
-05
2005
-06
2006
-07
2007
-08
2008
-09
2009
-10
Combined States Centre
1980
-81
90 Brajamohan Misra
and interest rate on loans and the change in trade openness. Export demand is characterized with quantum index of exports explained by two variables, the scale variable for external demand measured world exports in real terms and the trade competitiveness captured through real effective exchange rate. Import demand in volume terms depends upon real domestic income. For the government sector, fiscal deficit is exogenous while income and revenue are treated endogenous, depending upon nominal GDP. The budget constraint is thus characterized as government’s total expenditure equals to revenue receipts and fiscal deficit. Government’s capital expenditure is defined as total expenditure less revenue expenditure. The financing of fiscal deficit is linked to monetary sector. In the monetary sector, banks mobilise deposits which is determined by real income and real interest rate. Given the deposit resources, the level of funds available for lending and investment purposes is derived as deposits less cash reserve requirement by the central bank. From available funds, banks invest government securities as much required by the government through bond financing mode. Thus, supply of credit to private sector is constrained by the level of funds and financing of deficit. The nominal money demand is measured by deposits and currency with the public, the latter accounting for transaction demand for money endogenously determined by nominal GDP. Given the nominal level of broad money, the measure of aggregate price level and its inflation rate are captured through an inverted real money demand equation, which in turn depends upon real income, and money market interest rate. The money market interest rate is determined by liquidity pressure, the proportion of deficit to be financed by banks from the availability of funds. The yield on government bonds, which are liquid and risk free, is determined by money market condition. Loan interest rate is determined by money market interest rate to account for liquidity effect and the spread between the yield on government bonds and deposit interest rate.
In terms of empirical analysis, the model has 12 endogenous equations and various identities including the government budget and banking sector balance sheet. Most of the estimated equations showed reasonably high explanatory performance in terms of coefficient of determination or the adjusted R2.
The estimated structural equations showed that permanent income has significant positive effect whereas dependency ratio has significant negative effect on private consumption. Wealth has positive effect but with a higher 10 per cent level of significance. Real deposit interest rate has significant positive effect, suggesting inverse consumption smoothing.
In the case of investment or capital formation variable, output, credit and trade openness have significant positive effect. Government’s capital expenditure has positive effect with a higher 10 per cent level of significance. Real interest rate has negative but insignificant effect.
In the export demand equation, world income has significant positive effect. The real exchange rate measure of competitiveness has negative effect with a higher level of significance; implying that appreciation of exchange rate or deterioration in competitiveness could affect exports negatively. It is evident from export demand, the short-run elasticity of exports with respect to world demand is 0.58 but long-run elasticity is unity, suggesting that the shift in export share could occur due to competitiveness.
Imports show a significant positive relationship with domestic real GDP with short run and long-run elasticity at 0.96 and 1.75, respectively. On account of government’s revenue, total revenue is significantly determined by real output and aggregate price level and the output effect is much stronger than the price effect.
As regards the monetary sector, the growth rate of currency demand by the public could almost move in tandem with nominal GDP Growth in the long-run. In the case of real broad money aggregate, the long-run elasticity with respect to real income is 1.5, in line with the Indian evidence. Interest rate has significant inverse relationship with money demand. As regards the
Fiscal Consolidation and Macro Economy: India’s Experience with Rule-based Fiscal Policy and Post-crisis Challenges 91
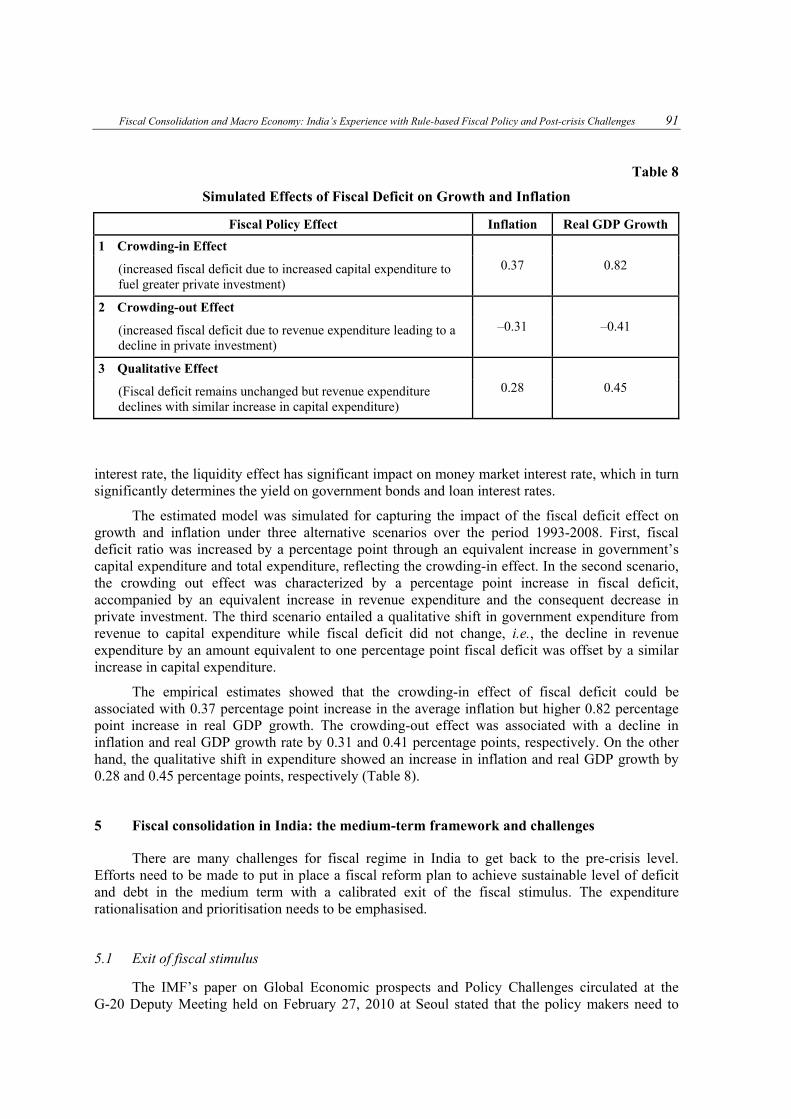
Table 8
Simulated Effects of Fiscal Deficit on Growth and Inflation
Fiscal Policy Effect Inflation Real GDP Growth
1 Crowding-in Effect
(increased fiscal deficit due to increased capital expenditure to fuel greater private investment)
0.37 0.82
2 Crowding-out Effect
(increased fiscal deficit due to revenue expenditure leading to a decline in private investment)
–0.31 –0.41
3 Qualitative Effect
(Fiscal deficit remains unchanged but revenue expenditure declines with similar increase in capital expenditure)
0.28 0.45
interest rate, the liquidity effect has significant impact on money market interest rate, which in turn significantly determines the yield on government bonds and loan interest rates.
The estimated model was simulated for capturing the impact of the fiscal deficit effect on growth and inflation under three alternative scenarios over the period 1993-2008. First, fiscal deficit ratio was increased by a percentage point through an equivalent increase in government’s capital expenditure and total expenditure, reflecting the crowding-in effect. In the second scenario, the crowding out effect was characterized by a percentage point increase in fiscal deficit, accompanied by an equivalent increase in revenue expenditure and the consequent decrease in private investment. The third scenario entailed a qualitative shift in government expenditure from revenue to capital expenditure while fiscal deficit did not change, i.e., the decline in revenue expenditure by an amount equivalent to one percentage point fiscal deficit was offset by a similar increase in capital expenditure.
The empirical estimates showed that the crowding-in effect of fiscal deficit could be associated with 0.37 percentage point increase in the average inflation but higher 0.82 percentage point increase in real GDP growth. The crowding-out effect was associated with a decline in inflation and real GDP growth rate by 0.31 and 0.41 percentage points, respectively. On the other hand, the qualitative shift in expenditure showed an increase in inflation and real GDP growth by 0.28 and 0.45 percentage points, respectively (Table 8).
5 Fiscal consolidation in India: the medium-term framework and challenges
There are many challenges for fiscal regime in India to get back to the pre-crisis level. Efforts need to be made to put in place a fiscal reform plan to achieve sustainable level of deficit and debt in the medium term with a calibrated exit of the fiscal stimulus. The expenditure rationalisation and prioritisation needs to be emphasised.
5.1 Exit of fiscal stimulus
The IMF’s paper on Global Economic prospects and Policy Challenges circulated at the G-20 Deputy Meeting held on February 27, 2010 at Seoul stated that the policy makers need to
92 Brajamohan Misra
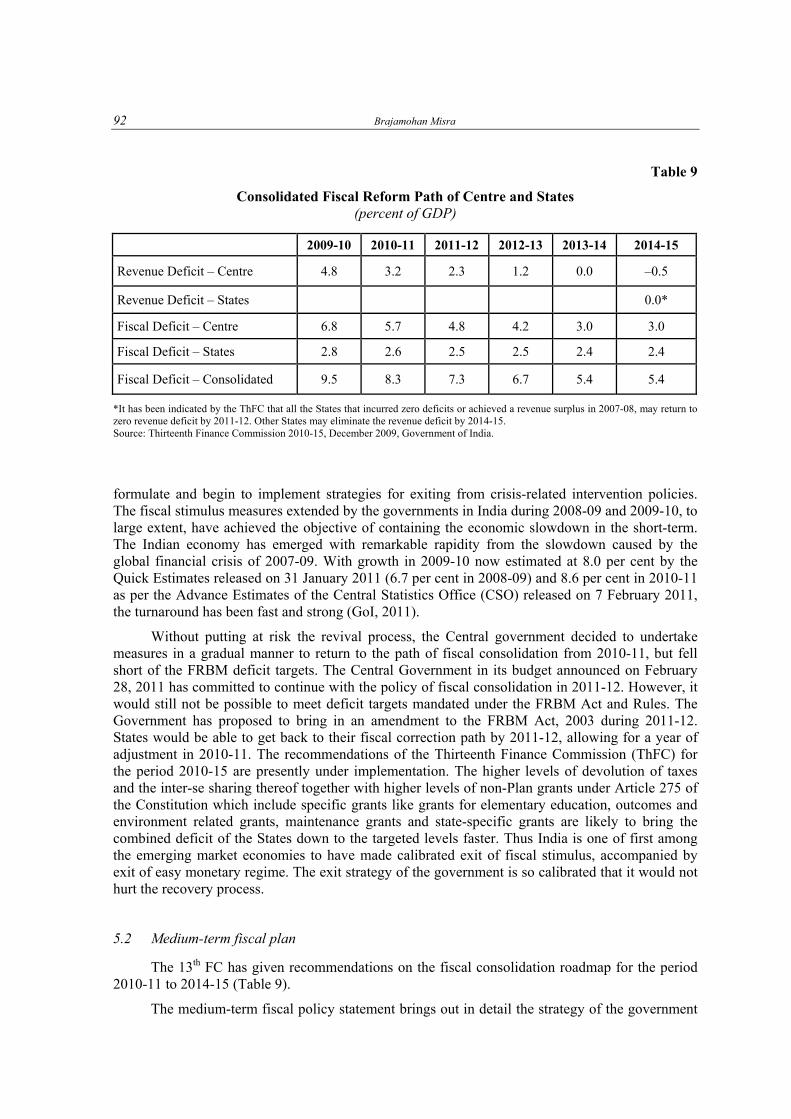
Table 9
Consolidated Fiscal Reform Path of Centre and States (percent of GDP)
2009-10 2010-11 2011-12 2012-13 2013-14 2014-15
Revenue Deficit – Centre 4.8 3.2 2.3 1.2 0.0 –0.5
Revenue Deficit – States 0.0*
Fiscal Deficit – Centre 6.8 5.7 4.8 4.2 3.0 3.0
Fiscal Deficit – States 2.8 2.6 2.5 2.5 2.4 2.4
Fiscal Deficit – Consolidated 9.5 8.3 7.3 6.7 5.4 5.4
*It has been indicated by the ThFC that all the States that incurred zero deficits or achieved a revenue surplus in 2007-08, may return to zero revenue deficit by 2011-12. Other States may eliminate the revenue deficit by 2014-15. Source: Thirteenth Finance Commission 2010-15, December 2009, Government of India.
formulate and begin to implement strategies for exiting from crisis-related intervention policies. The fiscal stimulus measures extended by the governments in India during 2008-09 and 2009-10, to large extent, have achieved the objective of containing the economic slowdown in the short-term. The Indian economy has emerged with remarkable rapidity from the slowdown caused by the global financial crisis of 2007-09. With growth in 2009-10 now estimated at 8.0 per cent by the Quick Estimates released on 31 January 2011 (6.7 per cent in 2008-09) and 8.6 per cent in 2010-11 as per the Advance Estimates of the Central Statistics Office (CSO) released on 7 February 2011, the turnaround has been fast and strong (GoI, 2011).
Without putting at risk the revival process, the Central government decided to undertake measures in a gradual manner to return to the path of fiscal consolidation from 2010-11, but fell short of the FRBM deficit targets. The Central Government in its budget announced on February 28, 2011 has committed to continue with the policy of fiscal consolidation in 2011-12. However, it would still not be possible to meet deficit targets mandated under the FRBM Act and Rules. The Government has proposed to bring in an amendment to the FRBM Act, 2003 during 2011-12. States would be able to get back to their fiscal correction path by 2011-12, allowing for a year of adjustment in 2010-11. The recommendations of the Thirteenth Finance Commission (ThFC) for the period 2010-15 are presently under implementation. The higher levels of devolution of taxes and the inter-se sharing thereof together with higher levels of non-Plan grants under Article 275 of the Constitution which include specific grants like grants for elementary education, outcomes and environment related grants, maintenance grants and state-specific grants are likely to bring the combined deficit of the States down to the targeted levels faster. Thus India is one of first among the emerging market economies to have made calibrated exit of fiscal stimulus, accompanied by exit of easy monetary regime. The exit strategy of the government is so calibrated that it would not hurt the recovery process.
5.2 Medium-term fiscal plan
The 13th FC has given recommendations on the fiscal consolidation roadmap for the period 2010-11 to 2014-15 (Table 9).
The medium-term fiscal policy statement brings out in detail the strategy of the government

Fiscal Consolidation and Macro Economy: India’s Experience with Rule-based Fiscal Policy and Post-crisis Challenges 93
to reduce the fiscal deficit closer to the mandated level under the FRBM Act and Rules by 2013-14. The process of fiscal consolidation by the Centre, which resumed in 2010-11 will be continued during 2011-12 after the deviations experienced during 2008-09 and 2009-10. However, the revenue deficit as percentage of GDP is estimated to decline from 5.3 per cent in 2009-10 (inclusive of Securities issued in lieu of subsidies) to 3.4 per cent in RE 2010-11. This correction is largely attributed to higher non tax receipts from 3G and BWA spectrum auction. In absence of this source of revenue in the coming financial year, revenue deficit is estimated to be static at 3.4 per cent of GDP in BE 2011-12. It is further projected to decline to 2.1 per cent of GDP by 2013-14. The revenue deficit and fiscal deficit in RE 2010-2011 are higher than the targets set under the FRBM Act and Rules. The deviation from the mandate under FRBM Act and Rules may be seen in the context of developments during 2008-09 and 2009-10. With the decision of the government to revert back to the path of fiscal consolidation starting from 2010-11, it is estimated to bring down the fiscal deficit from 7.8 per cent (inclusive of oil and fertiliser bonds) in 2008-09 to 4.6 per cent in BE 2011-12. This is better than the target of 4.8 per cent recommended by the ThFC. It is further projected to be brought down to 4.1 per cent of GDP in 2012-13 and 3.5 per cent in 2013-14.
There are, however, difficulties in achieving revenue surplus. This was explained in detail in the Fiscal Policy Strategy Statement of 2010-11. Revenue expenditure of the Central Government also includes releases made to States and other implementing agencies for implementation of Government schemes and programmes. The outcomes of many of these schemes are not in the nature of the outcomes related to revenue expenditure. In most of the cases these schemes are primarily in nature of creating durable assets but these assets are not owned by the Central Government. Therefore, in technical classification of revenue and capital account, the Central Government is not able to show expenditure on these schemes as capital expenditure. Examples of such schemes are Rajiv Gandhi Grameen Vidyutikaran Yojana, Jawaharlal Nehru National Urban Renewal Mission, Pradhan Mantri Gram Sadak Yojana, Accelerated Irrigation Benefit Programme, etc. Over the years, the number of such schemes funded by the Central Government and implemented by States/autonomous bodies has increased significantly. This has resulted in significant increase in funds transfer from Centre to States/autonomous bodies have increased significantly. This has resulted in significant increase in funds transfer from Centre to State/autonomous bodies resulting in higher revenue expenditure. However, these revenue expenditures cannot be treated as unproductive in nature. On the contrary, they contribute to growth in economy. The total expenditure on such items are significant at about 1.6 per cent of GDP. This reflects that half of the government revenue deficit is attributed towards these grants and, therefore, effective revenue deficit of the government is estimated at 1.8 per cent of GDP in 2011-12. It would be the endeavour of the government to eliminate this component of revenue deficit in a time bound manner. With the projected level of expenditure for 2012-13 and 2013-14, along with the assumption that the above mentioned grant will increase in medium term at not less than 10 per cent, the effective revenue deficit is estimated to come down to 0.5 per cent of GDP in 2013-14. Policy initiatives and administrative efficiency can make the target of eliminating effective revenue deficit by 2013-14 achievable.
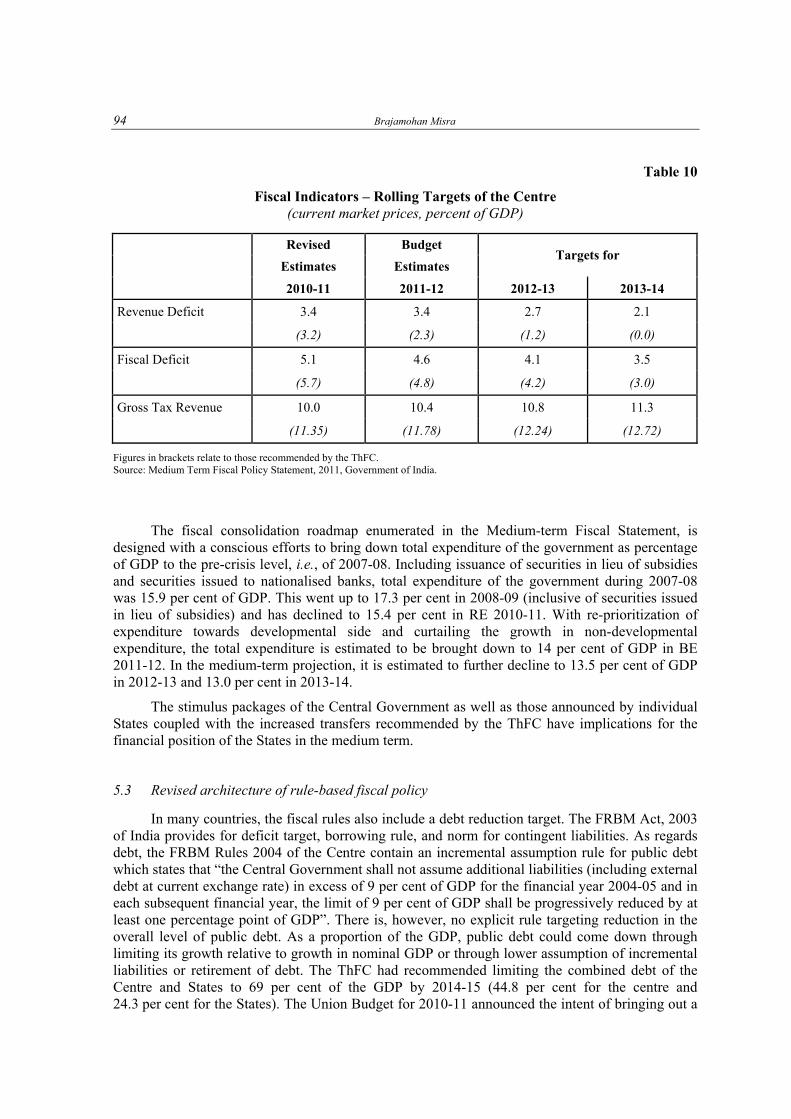
The fiscal consolidation in the medium term will be attained by the Centre both through rise in revenue and decline in expenditure. Gross tax revenue is estimated to increase from 10.0 per cent of GDP in RE 2010-11 to 10.4 per cent in BE 2011-12 (reflecting growth of 18.5 per cent over RE 2010-11), which is however still lower than 11.9 per cent of GDP achieved during 2007-08. With economy reverting back to the path of trend growth rate, it would be possible to get back to the achieved peak level of tax to GDP ratio. In the medium-term targets, gross tax collection as percentage of GDP is projected at 10.8 per cent in 2012-13 and 11.3 per cent in 2013-14. Introduction of Goods and Services Tax (GST) and Direct Tax Code would have significant bearing on tax mobilisation efforts of the government (Table 10).
94 Brajamohan Misra
Table 10
Fiscal Indicators – Rolling Targets of the Centre (current market prices, percent of GDP)
Revised Budget
Estimates Estimates Targets for
2010-11 2011-12 2012-13 2013-14
Revenue Deficit 3.4 3.4 2.7 2.1
(3.2) (2.3) (1.2) (0.0)
Fiscal Deficit 5.1 4.6 4.1 3.5
(5.7) (4.8) (4.2) (3.0)
Gross Tax Revenue 10.0 10.4 10.8 11.3
(11.35) (11.78) (12.24) (12.72)
Figures in brackets relate to those recommended by the ThFC. Source: Medium Term Fiscal Policy Statement, 2011, Government of India.
The fiscal consolidation roadmap enumerated in the Medium-term Fiscal Statement, is
designed with a conscious efforts to bring down total expenditure of the government as percentage of GDP to the pre-crisis level, i.e., of 2007-08. Including issuance of securities in lieu of subsidies and securities issued to nationalised banks, total expenditure of the government during 2007-08 was 15.9 per cent of GDP. This went up to 17.3 per cent in 2008-09 (inclusive of securities issued in lieu of subsidies) and has declined to 15.4 per cent in RE 2010-11. With re-prioritization of expenditure towards developmental side and curtailing the growth in non-developmental expenditure, the total expenditure is estimated to be brought down to 14 per cent of GDP in BE 2011-12. In the medium-term projection, it is estimated to further decline to 13.5 per cent of GDP in 2012-13 and 13.0 per cent in 2013-14.
The stimulus packages of the Central Government as well as those announced by individual States coupled with the increased transfers recommended by the ThFC have implications for the financial position of the States in the medium term.
5.3 Revised architecture of rule-based fiscal policy
In many countries, the fiscal rules also include a debt reduction target. The FRBM Act, 2003 of India provides for deficit target, borrowing rule, and norm for contingent liabilities. As regards debt, the FRBM Rules 2004 of the Centre contain an incremental assumption rule for public debt which states that “the Central Government shall not assume additional liabilities (including external debt at current exchange rate) in excess of 9 per cent of GDP for the financial year 2004-05 and in each subsequent financial year, the limit of 9 per cent of GDP shall be progressively reduced by at least one percentage point of GDP”. There is, however, no explicit rule targeting reduction in the overall level of public debt. As a proportion of the GDP, public debt could come down through limiting its growth relative to growth in nominal GDP or through lower assumption of incremental liabilities or retirement of debt. The ThFC had recommended limiting the combined debt of the Centre and States to 69 per cent of the GDP by 2014-15 (44.8 per cent for the centre and 24.3 per cent for the States). The Union Budget for 2010-11 announced the intent of bringing out a
Fiscal Consolidation and Macro Economy: India’s Experience with Rule-based Fiscal Policy and Post-crisis Challenges 95
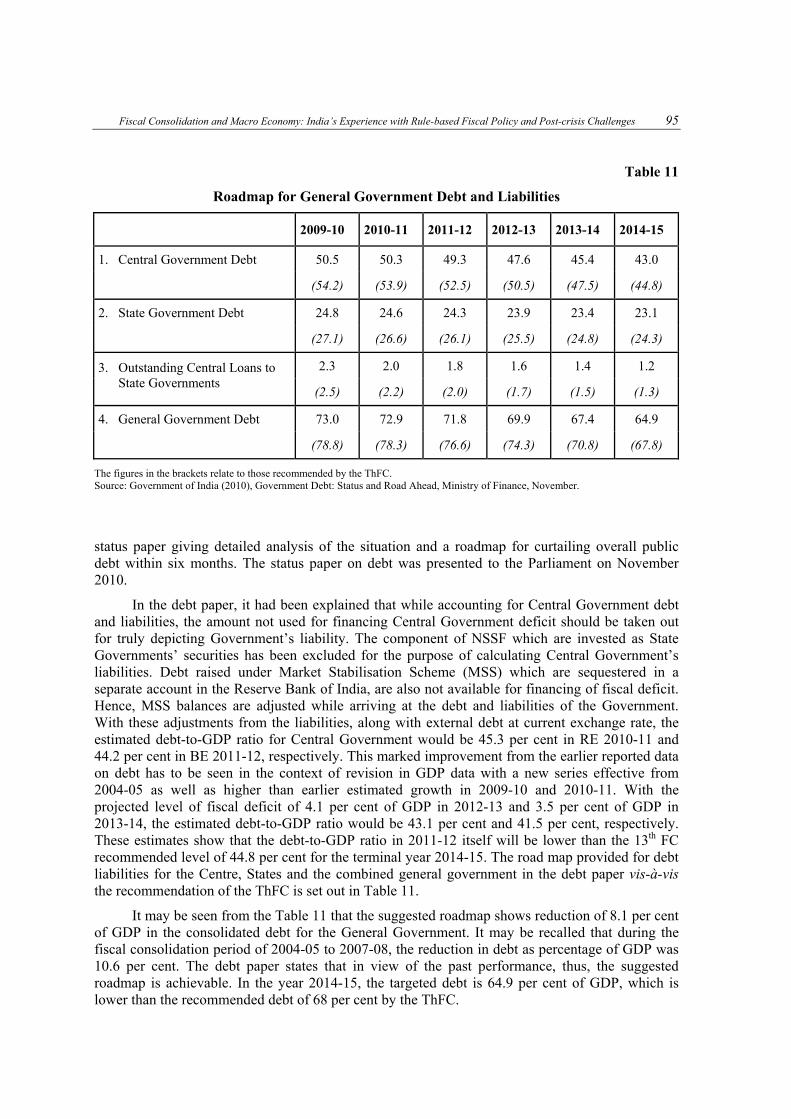
Table 11
Roadmap for General Government Debt and Liabilities
2009-10 2010-11 2011-12 2012-13 2013-14 2014-15
1. Central Government Debt 50.5 50.3 49.3 47.6 45.4 43.0
(54.2) (53.9) (52.5) (50.5) (47.5) (44.8)
2. State Government Debt 24.8 24.6 24.3 23.9 23.4 23.1
(27.1) (26.6) (26.1) (25.5) (24.8) (24.3)
2.3 2.0 1.8 1.6 1.4 1.2 3. Outstanding Central Loans to State Governments
(2.5) (2.2) (2.0) (1.7) (1.5) (1.3)
4. General Government Debt 73.0 72.9 71.8 69.9 67.4 64.9
(78.8) (78.3) (76.6) (74.3) (70.8) (67.8)
The figures in the brackets relate to those recommended by the ThFC. Source: Government of India (2010), Government Debt: Status and Road Ahead, Ministry of Finance, November.
status paper giving detailed analysis of the situation and a roadmap for curtailing overall public debt within six months. The status paper on debt was presented to the Parliament on November 2010.
In the debt paper, it had been explained that while accounting for Central Government debt and liabilities, the amount not used for financing Central Government deficit should be taken out for truly depicting Government’s liability. The component of NSSF which are invested as State Governments’ securities has been excluded for the purpose of calculating Central Government’s liabilities. Debt raised under Market Stabilisation Scheme (MSS) which are sequestered in a separate account in the Reserve Bank of India, are also not available for financing of fiscal deficit. Hence, MSS balances are adjusted while arriving at the debt and liabilities of the Government. With these adjustments from the liabilities, along with external debt at current exchange rate, the estimated debt-to-GDP ratio for Central Government would be 45.3 per cent in RE 2010-11 and 44.2 per cent in BE 2011-12, respectively. This marked improvement from the earlier reported data on debt has to be seen in the context of revision in GDP data with a new series effective from 2004-05 as well as higher than earlier estimated growth in 2009-10 and 2010-11. With the projected level of fiscal deficit of 4.1 per cent of GDP in 2012-13 and 3.5 per cent of GDP in 2013-14, the estimated debt-to-GDP ratio would be 43.1 per cent and 41.5 per cent, respectively. These estimates show that the debt-to-GDP ratio in 2011-12 itself will be lower than the 13th FC recommended level of 44.8 per cent for the terminal year 2014-15. The road map provided for debt liabilities for the Centre, States and the combined general government in the debt paper vis-à-vis the recommendation of the ThFC is set out in Table 11.
It may be seen from the Table 11 that the suggested roadmap shows reduction of 8.1 per cent of GDP in the consolidated debt for the General Government. It may be recalled that during the fiscal consolidation period of 2004-05 to 2007-08, the reduction in debt as percentage of GDP was 10.6 per cent. The debt paper states that in view of the past performance, thus, the suggested roadmap is achievable. In the year 2014-15, the targeted debt is 64.9 per cent of GDP, which is lower than the recommended debt of 68 per cent by the ThFC.
96 Brajamohan Misra
5.4 Expenditure reforms
With regard to expenditure, a number measures have been initiated by the Centre during the recent years. The focus on outcomes has got institutionalized with the practice of select departments being mandated to come up with their “Result Framework (RF) Document”. This puts emphasis on tracking on measurable outcomes in the form of Key Performance Indicators (KPIs). Result Frameworks are so drawn up that quarterly monitoring becomes possible. During the year, the RF as well as the achievements against the KPIs are being reviewed by a Committee on Government Performance and the report of such review are being submitted to the Prime Minister through the concerned Minister for further action as deemed necessary. At the end of the year, all Ministries/Departments covered under the RF system review and prepare a report listing the achievements against the agreed goals in form of KPIs and these results are to be placed before the Cabinet for information by 1st June of each year.
Initiatives have also been taken to evenly pace the plan expenditure during the year and also to avoid rush of expenditure at the year end. The practice of restricting the expenditure in the month of March to 15 per cent of budget allocation within the fourth quarter ceiling of 33 per cent is being enforced. The quarterly exchequer control based cash and expenditure management system which inter alia involves preparing a Monthly Expenditure Plan (MEP) continues to be followed in select Demands for Grants. The emphasis is on right pacing plan expenditure by ensuring adequate resources for execution of budgeted schemes.
Central Plan Scheme Monitoring System (CPSMS) is an initiative towards establishing a suitable on-line management information and decision support system. This MIS tracks devolution of funds as well as their utilization through all tiers of implementing agencies and in some cases up to the end beneficiaries. The real time availability of information on status of fund utilization and balances in respective bank accounts will enable better cash management system with timely release of adequate funds and avoidance of parking of funds without actual requirement. While ensuring reduced cost of carrying borrowed fund, it will also bring in accountability as people can access information about a particular scheme in their respective areas.
Non-plan expenditure at 126 per cent of total revenue receipts during 2009-10 has resulted in use of borrowed resources for consumptive expenditure. This brings us back to the issue of structural problems in the composition of expenditure which, if not addressed, will further squeeze out the fiscal space for undertaking developmental works. The government has addressed these issues in right earnest while formulating the strategy for 2011-12. With focus on curtailing growth in non-plan expenditure, the above mentioned percentage is estimated to decline to 103 per cent in BE 2011-12. With further reallocation of resources towards priority sectors, it is projected to decline to 90 per cent of total revenue receipts in 2013-14.
During the period 2004-05 to 2007-08, fiscal consolidation aided with lower interest rate regime had helped the government in bringing down interest payment as percentage of net tax revenue of Central Government to 38.9 per cent in 2007-08 from the high of 56.5 per cent in 2004-05. However, higher fiscal deficit during the crisis period, resulted in higher interest outgo which coupled with moderation in net tax revenue, has increased the interest payment as proportion of net tax revenue to Centre to 47.2 per cent in 2009-10. With resumption of fiscal consolidation path by the Central government, this percentage is estimated to improve to 40.3 per cent in BE 2011-12. This indicates that any slippage on fiscal front even for one or two financial years may lead to serious crowding out of resources for developmental expenditure in future as interest payment will elbow out other expenditures from government’s net tax revenue. In the medium-term outlook, this ratio is projected to further improve to 38.4 per cent and 36.1 per cent in 2012-13 and 2013-14, respectively. Interest payment as percentage of GDP is estimated to decline from 3.3 per cent in 2009-10 to 3.0 per cent in BE 2011-12 and 2.9 per cent by 2013-14. The projection
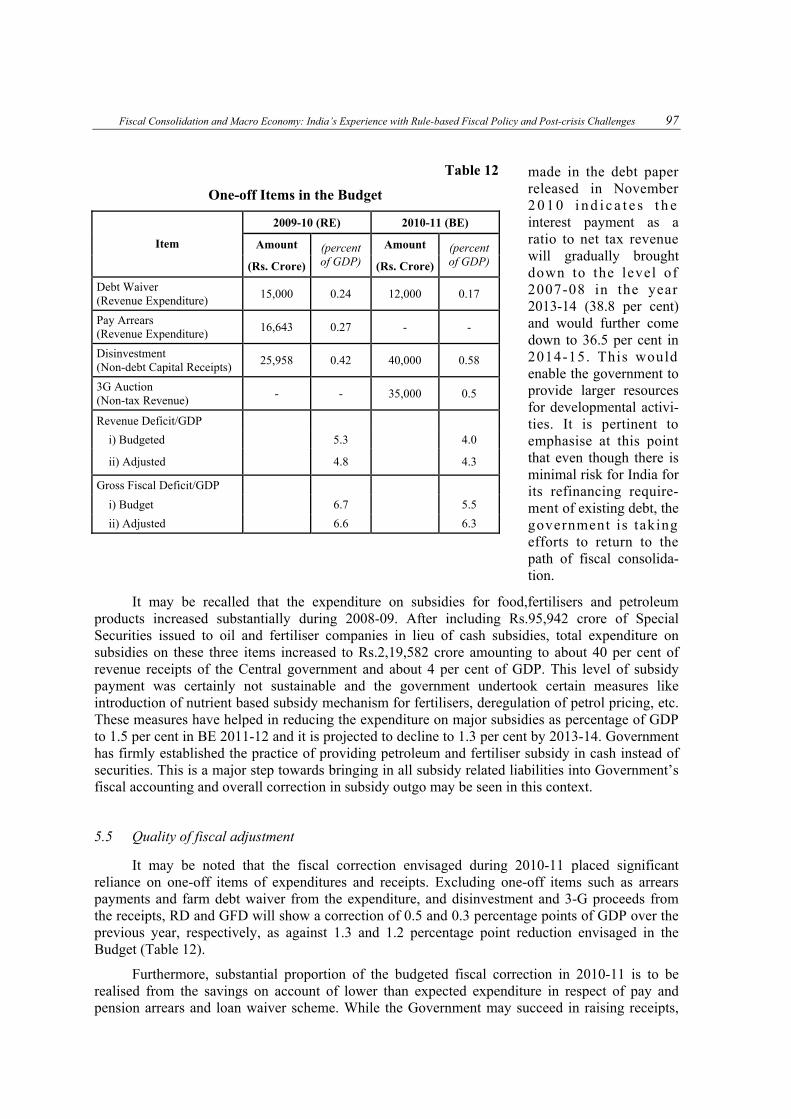
Fiscal Consolidation and Macro Economy: India’s Experience with Rule-based Fiscal Policy and Post-crisis Challenges 97
made in the debt paper released in November 2 0 1 0 i n d i c a t e s t h e interest payment as a ratio to net tax revenue will gradually brought down to the level of 2007-08 in the year 2013-14 (38.8 per cent) and would further come down to 36.5 per cent in 2014-15. This would enable the government to provide larger resources for developmental activi-ties. It is pertinent to emphasise at this point that even though there is minimal risk for India for its refinancing require-ment of existing debt, the government is taking efforts to return to the path of fiscal consolida-tion.
It may be recalled that the expenditure on subsidies for food,fertilisers and petroleum products increased substantially during 2008-09. After including Rs.95,942 crore of Special Securities issued to oil and fertiliser companies in lieu of cash subsidies, total expenditure on subsidies on these three items increased to Rs.2,19,582 crore amounting to about 40 per cent of revenue receipts of the Central government and about 4 per cent of GDP. This level of subsidy payment was certainly not sustainable and the government undertook certain measures like introduction of nutrient based subsidy mechanism for fertilisers, deregulation of petrol pricing, etc. These measures have helped in reducing the expenditure on major subsidies as percentage of GDP to 1.5 per cent in BE 2011-12 and it is projected to decline to 1.3 per cent by 2013-14. Government has firmly established the practice of providing petroleum and fertiliser subsidy in cash instead of securities. This is a major step towards bringing in all subsidy related liabilities into Government’s fiscal accounting and overall correction in subsidy outgo may be seen in this context.
5.5 Quality of fiscal adjustment
It may be noted that the fiscal correction envisaged during 2010-11 placed significant reliance on one-off items of expenditures and receipts. Excluding one-off items such as arrears payments and farm debt waiver from the expenditure, and disinvestment and 3-G proceeds from the receipts, RD and GFD will show a correction of 0.5 and 0.3 percentage points of GDP over the previous year, respectively, as against 1.3 and 1.2 percentage point reduction envisaged in the Budget (Table 12).
Furthermore, substantial proportion of the budgeted fiscal correction in 2010-11 is to be realised from the savings on account of lower than expected expenditure in respect of pay and pension arrears and loan waiver scheme. While the Government may succeed in raising receipts,
Table 12
One-off Items in the Budget
2009-10 (RE) 2010-11 (BE)
Amount Amount Item
(Rs. Crore)
(percent of GDP) (Rs. Crore)
(percent of GDP)
Debt Waiver (Revenue Expenditure)
15,000 0.24 12,000 0.17
Pay Arrears (Revenue Expenditure)
16,643 0.27 - -
Disinvestment (Non-debt Capital Receipts)
25,958 0.42 40,000 0.58
3G Auction (Non-tax Revenue)
- - 35,000 0.5
Revenue Deficit/GDP
i) Budgeted 5.3 4.0
ii) Adjusted 4.8 4.3
Gross Fiscal Deficit/GDP
i) Budget 6.7 5.5
ii) Adjusted 6.6 6.3

98 Brajamohan Misra
both from high tax buoyancy and once-off sources, the real measure of fiscal consolidation lies in improving the quality of expenditure. If the Government is able to commit more resources to capital expenditure, it will help deal with some of the bottlenecks that contribute to supply-side inflationary pressures. Durable fiscal consolidation would require measures to augment revenue collection on a sustainable basis and rationalisation of recurring expenditure, with a focus on curtailing non-plan revenue expenditure and enhancing the proportion of capital expenditure.
5.6 Concluding observations
India’s fiscal scenario has undergone several phases of ups and downs as discussed in the paper. With significant deterioration in early 2000s, the Central government and the State governments decided to abide by rule-based framework under statutory legislations from 2004-05 (some States even started earlier). The results of this decision was rewarding in terms of low fiscal deficit and high growth for the economy. This process continued smoothly until 2007-08. The fiscal consolidation process, however, paused following the knock-on effect of the recent global financial crisis. Fiscal stimulus measures provided by the government in terms of tax cuts and additional spending resulted in rise in fiscal deficits as a result the Centre and the States could not adhered to the deficit targets under FRBM/FRLs. The Central government has already resumed the process of fiscal consolidation since 2010-11 and has committed to carry forward the process further. The States have been given a year of adjustment during 2010-11 and will commence the fiscal consolidation process starting with 2011-12. The Thirteenth Finance Commission has laid out a medium-term fiscal restructuring plan, both for the Centre and the States. Apart from the deficit targets, the Commission has recommended a target in terms of Debt-GDP/ GSDP for the Centre and the States to be achieved in a calibrated manner by 2014-15. While the Debt Paper of the Government of India has indicated that it would be feasible to reach the targets of debt Debt-GDP/GSDP, the Central government may find it difficult to generate revenue surplus by 2014-15 as stipulated by the Commission. In this connection, the emphasis in the current phase of consolidation should be on the quality of adjustment, while also building adequate fiscal space to deal with future adverse shocks to growth and inflation.
The empirical analysis based on the small structural macro model was in terms of three scenarios. First, if fiscal deficit to be raised, it will have a positive impact on growth accompanied by some inflation when the entire amount of deficit is devoted to capital expenditure. Second, when the fiscal deficit is used for revenue expenditure accompanied by decline in private investment, may lead to lower growth and moderation of inflation. Third, with the level of fiscal deficit remaining unchanged, a qualitative shift in expenditure from revenue to capital expenditure would result in higher growth and a bit of inflation. The findings, especially, the inflation effect of deficit could be moderated with improvement in supply side through a production function in the model, which was experimented by some modelling exercises in the RBI (RCF, 2001-02). Nevertheless, the findings indicate that the government may keep the fiscal deficit under control and raise the proportion of capital expenditure in total expenditure to contribute to growth.
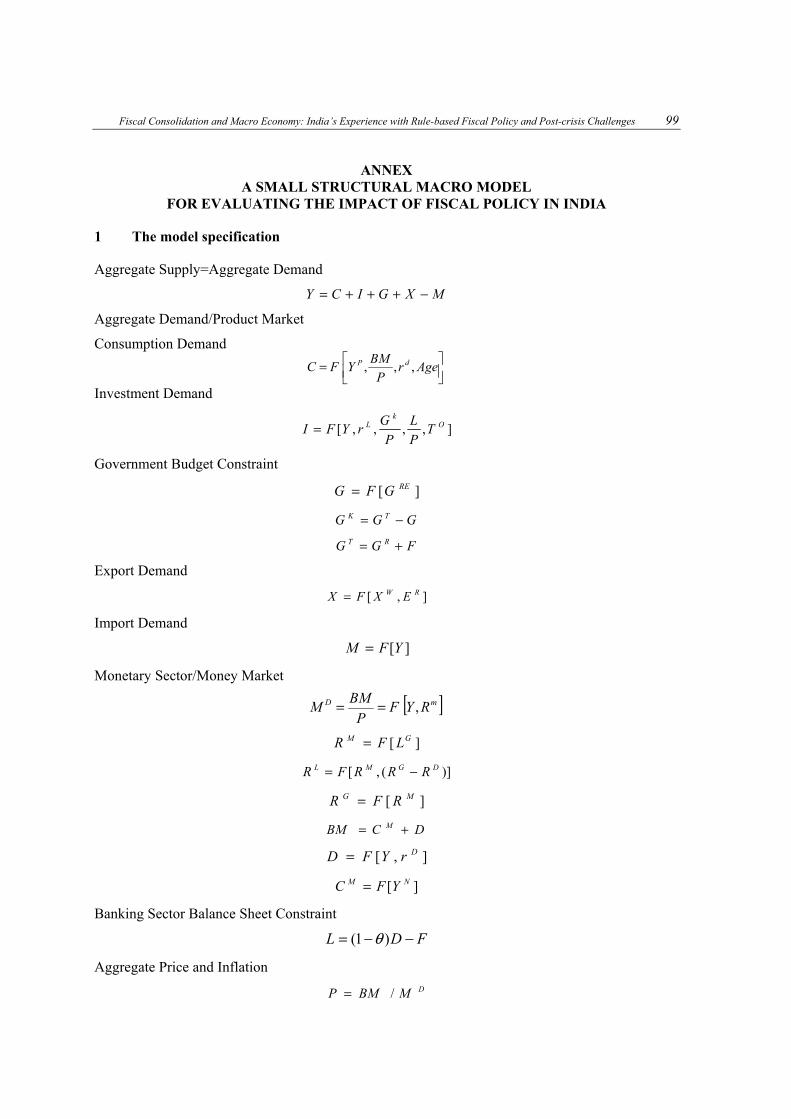
Fiscal Consolidation and Macro Economy: India’s Experience with Rule-based Fiscal Policy and Post-crisis Challenges 99
ANNEX A SMALL STRUCTURAL MACRO MODEL
FOR EVALUATING THE IMPACT OF FISCAL POLICY IN INDIA
1 The model specification
Aggregate Supply=Aggregate Demand
MXGICY −+++=
Aggregate Demand/Product Market
Consumption Demand
Investment Demand
],,,,[ O
kL T
P
L
P
GrYFI =
Government Budget Constraint
][ REGFG =
GGG TK −=
FGG RT +=
Export Demand
],[ RW EXFX =
Import Demand
][YFM =
Monetary Sector/Money Market
][ GM LFR =
)](,[ DGML RRRFR −=
][ MG RFR =
DCBM M +=
],[ DrYFD =
][ NM YFC =
Banking Sector Balance Sheet Constraint
FDL −−= )1( θ
Aggregate Price and Inflation
DMBMP /=
= Ager
P
BMYFC dP ,,,
[ ]mD RYFP
BMM ,==

100 Brajamohan Misra
1−−= ppπ
PYY N *=
Real Interest
π−= Rr
The variables are defined as follows:
Y: Real GDP; YN: nominal GDP; C: Consumption; I: investment; G: government consumption expenditure; X: exports; M: imports; GK: Government capital expenditure; GT: government total expenditure; BM: Broad money; P: Price index; CM: currency demand; D: aggregate deposits; L: Loans to private sector; F: financing of government deficit; RM: money market interest rate; RL: nominal loan interest rate, and rL: real loan interest rate; RG and rG: nominal and real yield on Government bonds; RD and rD: nominal and real deposit interest rates; LG: Liquidity pressure due to deficit financing: F/(1–θ)D; DFL: GDP Deflator.
2 Estimated equations
1 Consumption
LnC =11.85 + 0.46*LnYp + 0.10*LnBM/P + 0.37*rd – 1.29*Age
(7.02) (4.89) (1.91) (2.34) (5.85)
Adj. R2: 0.999; DW = 2.18; First order residual correlation LM Test: F(1,24) = 0.86(0.37)
2 Investment
D(I) = –5346.10 + 0.30*D(Y) – 362.84*rL + 61.14*d(GK/P) + 14.72*d(L/P) + 5679.87*TO –
(–0.96) (5.32) (–0.44) (1.74) (2.25) (6.62)
– 83295.73D2008 – 38826.81*D2000
(–10.48) (–8.35)
Adj. R2: 0.939; DW = 2.67; F(1,24) = 3.25(0.10)
3 Government revenue expenditure
G = 4557.37 + 0.29*GR + 0.59*G-1 + 24117.59*D1998-9
(2.22) (11.40) (12.10) (4.67)
Adj. R2: 0.999; DW: 1.81; F(1,24) = 0.01(0.93)
4 Export demand
LnX = 0.36 + 0.58*LnXw – 0.18*LnER + 0.59*LnX–1
(0.55) (2.40) (–1.83) (3.63)
Adj. R2: 0.994; Dw: 1.83; F(1,20) = 0.27(0.61)
( ) 11 −+= DFLDFL π

Fiscal Consolidation and Macro Economy: India’s Experience with Rule-based Fiscal Policy and Post-crisis Challenges 101
5 Import demand
LnM = –11.27 + 0.96*LnY + 0.41*LnM-1 – 0.18D9
(–4.56) (4.55) (3.02) (–5.35)
Adj. R2: 0.992; Dw: 2.05; F(1,24)=0.09(0.76)
6 Real money demand
LnBM/P = –2.51 + 0.30*LnY – 0.34*RM + 0.81*LnBM/P–1
(–1.68) (1.77) (–2.37) (7.44)
Adj. R2: 0.999, DW: 1.56; F(1,24)=0.21(0.65)
7 Government revenue
LnGR = –2.93 + 0.40*LnY + 0.19*LnP + 0.72*LnGR–1
–(3.84) (4.29) (2.06) (9.68)
Adj. R2=0.999, DW=2.07; F(1,24) =0.0.06(0.82)
8 Banks time deposits
D(TD) = –31023.7 + 0.50 *D(Y) +3923.24 *rd + 0.82*D(TD)
(–2.08) (3.10) (1.31) (8.43)
Adj. R2=0.948 DW=2.17, F(1,24)=3.36(0.10)
9 Bank credit
D(L) = 235531.0 + 1.18*D(Y) – 9573.49*rL – 321095.1*LG – 149058.3Do
(3.22) (7.14) (–3.29) (–3.68) (–11.95)
Adj. R2 0.934; DW:1.54; F(1,24)=1.50(0.20)
10 Banks’ loan interest rate
RL= 1.50 + 0.12*RM – 0.11*(RG-RD) + 0.83RL–1 – 1.47D2008
(1.62) (13.01) (–1.82) (12.99) (–11.16)
Adj. R2 = 0.940 DW = 1.64, F (1,24): 0.96(0.34)
11 Money market interest rate
RM = 3.82 + 0.42RM–1 + 0.19*LGap + 7.11D1990-91 + 9.12D1995
(3.70) (4.11) (2.18) (4.94) (4.92)
Adj. R2 = 0.800; DW = 2.16; F(1,24) = 1.41(0.25)

102 Brajamohan Misra
12 Government bond yield
RG = 1.25 + 0.78*RG–1 + 0.12*Rm – 1.90*D2002-03
(2.34) (13.63) (3.45) (–4.06)
Adj. R2 = 0.94; DW = 1.68; F(1,24) = 0.59(0.45)
Fiscal Consolidation and Macro Economy: India’s Experience with Rule-based Fiscal Policy and Post-crisis Challenges 103
REFERENCES
Allsopp, C. (2005), “The Macroeconomic Role of Fiscal Policy”, Oxford Review of Economic Policy, Vol. 21, No. 4.
Andrés, J. and R. Doménech (2004), “Fiscal Rules and Macroeconomic Stability”, Dirección General de Presupuestos, Working Paper, No. D-2009-01.
Auerbach, A.J., W.G. Gale and B.H. Harris (2010), “Activist Fiscal Policy”, Journal of Economic Perspectives, Vol. 24, No. 4, pp. 141-64, Fall.
Baldacci, E., B. Clements and S. Gupta (2003), “Using Fiscal Policy to Spur Growth”, Finance & Development, December, International Monetary Fund, Washington (D.C.).
Barro, R. (1974), “Are Government Bonds Net Wealth?”, Journal of Political Economy, No. 82667, November-December.
Carbacho, A. and G. Scwartz (2007), “Fiscal Responsibility Laws”, in M.S. Kumar and T. Ter-Minassian (eds.), Promoting Fiscal Discipline, International Monetary Fund, Washington (D.C.).
Chari, V.V. and P.J. Kehoe (1998), “Optimal Fiscal and Monetary Policy”, Federal Reserve Bank of Minneapolis, Research Department, Staff Report, No. 251.
Chakraborty, L.S. (2006), “Fiscal Deficit, Capital Formation and Crowding out Evidence from India”, Working Paper, No. 73, NIPFP, December.
Corbacho, A. and G. Schwartz (2007), “Fiscal Responsibility Laws”, in M.S. Kumar and T. Ter-Minassian (eds.), Promoting Fiscal Discipline, International Monetary Fund, Washington (D.C.).
Daniel, J., J. Davis, M. Fouad and C. Van Rijckeghem (2006), “Fiscal Adjustment for Stability and Growth”, Pamphlet Series, No. 55, International Monetary Fund, Washington (D.C.).
Easterly, W. and K. Schmidth-Hebbel (1993), “Fiscal Deficits and Macroeconomic Performance in Developing Countries”, The World Bank Research Observer, Vol. 8, No. 2, July.
Elmendorf, D. and N.G. Mankiw (1998), “Fiscal Policy and Economic Growth”, NBER, Working Paper, No. 4223.
Evdoridis, G. (2000), “Public Sector Deficits as the Foundation of Economic Growth”, Journal of Post Keynesian Economics, Vol. 22, No. 4, Summer.
Feldstein, M. (1987) “Budget Deficits, Tax Rules and Real Interest Rates”, NBER, Working Paper, No. 1970, Cambridge (MA).
Fischer, S. and E. William (1990), “The Economics of the Government Budget Constraint”, World Bank Research Observer, Vol. 5, No. 2.
Government of India (2010), “Government Debt: Status and Road Ahead”, Ministry of Finance, November.
————— (2011), “Medium Term Fiscal Policy Statement and Fiscal Policy Strategy Statement”, presented to the Parliament along with the Union Budget 2011-12 on February 28, 2011.
Gupta, S., B. Clements, E. Baldacci and C. Mulas-Granados (2002), “Expenditure Composition, Fiscal Adjustment and Growth in Low-Income Countries”, International Monetary Fund, Working Paper, No. 02/77, IMF, Washington (D.C.).

104 Brajamohan Misra
Hemming, R., M. Kell and S. Mahfouz (2002), “The Effectiveness of Fiscal Policy in Stimulating Economic Activity: A Review of Literature” (2002), International Monetary Fund, Working Paper, No. WP/02/208, IMF, Washington (D.C.).
International Monetary Fund (2009), “Fiscal Implications of the Global Economic and Financial Crisis”, International Monetary Fund, Staff Position Note, No. SPN 109/13, July, IMF, Washington (D.C.).
————— (2010), “Global Economic Prospect and Policy Challenges”, prepared for the meeting of the G-20 Deputation, February 27, 2010, in Seoul, Korea.
Joseph, M., K. Singh, R.K. Dash, J. Bhattacharya and R. Tewari (2011), “Indian Economy: Selected Methodological Advances”, Working Paper, No. 253, Indian Council of Research on International Economics, February.
Kennedy, S. and J. Robbins (2001), “The Role of Fiscal Rules in Determining Fiscal Performance”, Government of Canada, Department of Finance, Working Paper, No. 16.
Kochhar, K. (2004), “Macroeconomic Implications of Fiscal Imbalances”.
Kopits, G. (2004), “Fiscal Rules: Useful Policy Framework or Unnecessary Ornament?”, in Banca d’Italia (ed.), Fiscal Rules.
Lucas, R.E. (1975), “An Equilibrium Model of the Business Cycle”, Journal of Political Economy, Vol. 21.
Lucas, R.E. and N.L. Stokey (1983), “Optimal Fiscal and Monetary Policy in an Economy Without Capital”, Journal of Monetary Economics, Vol. 12, No. 1.
Mankiw, G.N., D. Romer and D.N. Weil (1992), “A Contribution to the Empirics of Economic Growth”, The Quarterly Journal of Economics, Vol. 107, No. 2.
Misra, B.M. and J.K. Khundrakpam (2009), “Fiscal Consolidation by Central and State Governments: The Medium Term Outlook”, RBI Staff Studies, April.
Mohan, R. (2008), “The Role of Fiscal and Monetary Policies in Sustaining Growth with Stability in India”, paper presented at the 6th Asian Economic Policy Review Conference, Tokyo, April 19.
Organisation for Economic Co-operation and Development (2007), OECD Economic Outlook, No. 81, June.
Rangarajan, C. & D.K. Srivastava (2005), “Fiscal Deficits and Government Debt in India: Implication for Growth and Stabilization”, Madras School of Economics, Working Paper, No. 35, July.
Rangarajan, C. and D. Subbarao (2007), “The Importance of Being Earnest about Fiscal Responsibility”, Madras School of Economics, Monograph, No. 3.
Reddy, Y.V. (2008), “Fiscal Policy and Economic Reform”, NIPFP, Working Paper, No. 3, July.
Reserve Bank of India (RBI) (2002), Report on Currency and Finance 2000-01.
Sargeant, T. and N. Walkie (1975), “Rational Expectations, the Optimal Monetary Instrument and the Optimum Money Supply Rule”, Journal of Political Economics, Vol. 83.
Sargent, T.J. and N. Wallace (1981), “Some Unpleasant Monetarist Arithmetic”, Federal Reserve Bank of Minneapolis, Quarterly Review, No. 531, Fall.

Fiscal Consolidation and Macro Economy: India’s Experience with Rule-based Fiscal Policy and Post-crisis Challenges 105
Segura-Ubiergo, A., A. Simone and S. Gupta (2006), “New Evidence on Fiscal Adjustment and Growth in Transition Economics”, IMF, Working Paper, No.WP/06/244.
The World Bank (2010), “India Economic Update, Economic Policy and Poverty Trans South Asia Region”, June.