FISCAL CONSOLIDATION ACROSS GOVERNMENT LEVELS
27
1 FISCAL CONSOLIDATION ACROSS GOVERNMENT LEVELS By Hansjörg Blöchliger
Transcript of FISCAL CONSOLIDATION ACROSS GOVERNMENT LEVELS

1
FISCAL CONSOLIDATION ACROSS GOVERNMENT LEVELS
By Hansjörg Blöchliger

2
TABLE OF CONTENTS
FISCAL CONSOLIDATION ACROSS GOVERNMENT LEVELS ............................................................ 3 1. Introduction .............................................................................................................................................. 3 2. Developments up to 2011 ........................................................................................................................ 4
2.1. Sub-central deficits and debt before and during the crisis................................................................. 4 2.2. Sub-central spending and tax revenues ............................................................................................. 5
3. Sub-central consolidation needs............................................................................................................... 6 3.1. The risks posed by high SCG debt .................................................................................................... 6 3.2. Long-term consolidation needs ......................................................................................................... 8
4. Intergovernmental fiscal relations during past consolidation episodes .................................................. 11 4.1. The contribution of SCGs to general government consolidation success ....................................... 11 4.2. The role of intergovernmental transfers for the success of general government consolidation ................................................................................................................................... 13 4.3. Large consolidations: the contribution of central and sub-central government .............................. 14
5. Policies supporting fiscal consolidation across government levels ....................................................... 15 5.1. Spending instruments ...................................................................................................................... 16 5.2. Revenue instruments ....................................................................................................................... 18 5.3. Reforms to intergovernmental grants .............................................................................................. 21
6. Sub-central government fiscal rules and the wider framework ............................................................. 23 6.1 Rationale for sub-central fiscal rules ................................................................................................ 23 6.2. The strength of rules and their impact on outcomes ........................................................................ 23 6.3. What rules for sub-central government? ......................................................................................... 24
BIBLIOGRAPHY ......................................................................................................................................... 26
Tables
Table 1.Sub-central governments and success in stabilising debt ................................................................ 13 Table 2.Transfers and consolidation success ................................................................................................ 14
Figures
Figure 1.Sub-central governments are consolidating ..................................................................................... 4 Figure 2.Sub-central debt is stabilising .......................................................................................................... 5 Figure 3.Gross financial liabilities ................................................................................................................. 6 Figure 4.Spending came down since consolidation started, while tax revenues remained largely stable ...... 6 Figure 5.Sub-central deficits and debt .......................................................................................................... 10 Figure 6.A few sub-central budgets are far from being sustainable ............................................................. 11 Figure 7.Central and sub-central government balances do not always evolve in parallel ............................ 15 Figure 8.Market mechanisms in public service provision ............................................................................ 17 Figure 9.Taxes on immovable property are typically a sub-central tax........................................................ 19 Figure 10.User charges in OECD countries ................................................................................................. 20 Figure 11.In some countries, grants are pro-cyclical .................................................................................... 22 Figure 12.The relationship between fiscal rules and fiscal outcomes is weak ............................................. 24

3
FISCAL CONSOLIDATION ACROSS GOVERNMENT LEVELS
Key messages
• Sub-central governments (SCGs) are consolidating: After experiencing a deficit and debt hike during the crisis, SCGs have been in consolidation mode since 2010. Sub-central debt is stabilizing, except in a few countries. So far, sub-central consolidation has been mainly achieved through spending cuts, while revenues remained largely stable. Sub-central tax revenues rose a bit, while intergovernmental transfers went slightly down.
• Some SCGs need to consolidate further: In order to reach debt levels of 2007 or 2010 by the year 2026, SCGs in a few countries require additional consolidation efforts, as shown by fiscal gap calculations. Sub-central consolidation needs would rise further if intergovernmental grants were cut. A 20% grants reduction would oblige SCGs in most countries to tighten their belts further in order to reach the debt targets.
• During past consolidation episodes, SCGs helped stabilise general government debt: In general, consolidation at the state and – albeit less – at the local level increased the probability of debt stabilisation at the general government level. Reductions in intergovernmental grants improved the success rate. During extended consolidation periods, central and sub-central deficits moved in parallel, although some SCGs experienced a “second trough” three or four years after consolidation had started.
• Various instruments may help consolidate budgets and also raise economic activity in the medium to long run. On the spending side, SCGs could more strongly rely on market mechanisms in public service provision and better target public investment. On the revenue side, SCGs could strengthen taxation of immovable property – a typical sub-central tax – and increase user fees. Central government could reform the transfer system, including a shift from transfer revenue to SCG own tax revenue.
• Fiscal rules: Fiscal rules can help achieve consolidation objectives. SCGs should set their own medium-to-long term debt targets and develop operational “debt brakes”. In return, budget balance rules could be abolished. Trading of debt across jurisdictions should be possible. Debt limits (rather than targets) should be avoided. Independent bodies (e.g. fiscal councils) can help monitor SCG fiscal policy.
1. Introduction
1. The economic and financial crisis has turned into a fiscal crisis affecting both central and sub-central governments (SCGs) in many OECD countries. While government revenues declined, spending rose as a consequence of both the working of the automatic stabilisers and stimulus programmes. As a result and although most SCGs are less severely affected than central governments, SCG deficits and debt rose in most countries, often going beyond what is permitted by self- or central-government-imposed fiscal rules. The ratings of some SCGs were downgraded, and a few are struggling to avoid default. In the meantime, consolidating the public finances has become a priority for many governments, and the sub-central level will have to share in this effort. With the end of stimulus programmes that often granted support to the sub-central level, pressure on sub-central budgets will increase even further. Although sub-central fiscal positions improved considerably since 2009, deficit and debt reduction will occupy a central place on many SCG agendas in the coming years.
4
2. This paper provides data on and analysis of i) current SCG fiscal positions; ii) SCG consolidation needs; iii) past consolidation episodes; iv) policy instruments for sub-central consolidation; and v) the role of sub-central fiscal rules. It is organised in five parts: the first part reviews developments during the crisis and fiscal positions of SCGs up to 2011. The second part shows SCG consolidation needs to achieve alternative debt levels by the year 2026, as measured by so-called “fiscal gaps”. The third part sheds light on the past, presenting the factors that tend to support the success of consolidations, as well as presenting a set of case studies on large and successful consolidations. The fourth part deals with policy instruments that could help consolidate sub-central budgets. The fifth part highlights the role that fiscal rules and the wider fiscal framework can play in the consolidation process.
2. Developments up to 2011
2.1. Sub-central deficits and debt before and during the crisis
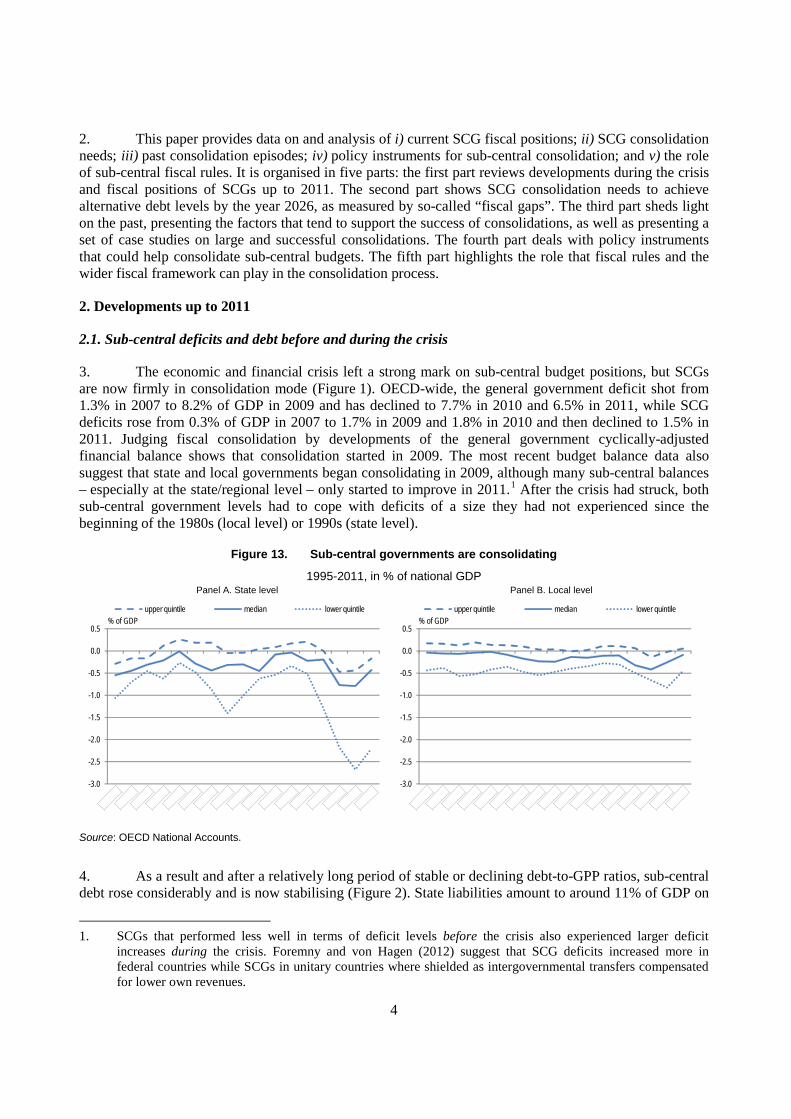
3. The economic and financial crisis left a strong mark on sub-central budget positions, but SCGs are now firmly in consolidation mode (Figure 1). OECD-wide, the general government deficit shot from 1.3% in 2007 to 8.2% of GDP in 2009 and has declined to 7.7% in 2010 and 6.5% in 2011, while SCG deficits rose from 0.3% of GDP in 2007 to 1.7% in 2009 and 1.8% in 2010 and then declined to 1.5% in 2011. Judging fiscal consolidation by developments of the general government cyclically-adjusted financial balance shows that consolidation started in 2009. The most recent budget balance data also suggest that state and local governments began consolidating in 2009, although many sub-central balances – especially at the state/regional level – only started to improve in 2011.1
Figure 13. Sub-central governments are consolidating
After the crisis had struck, both sub-central government levels had to cope with deficits of a size they had not experienced since the beginning of the 1980s (local level) or 1990s (state level).
1995-2011, in % of national GDP
Source: OECD National Accounts.
4. As a result and after a relatively long period of stable or declining debt-to-GPP ratios, sub-central debt rose considerably and is now stabilising (Figure 2). State liabilities amount to around 11% of GDP on
1. SCGs that performed less well in terms of deficit levels before the crisis also experienced larger deficit
increases during the crisis. Foremny and von Hagen (2012) suggest that SCG deficits increased more in federal countries while SCGs in unitary countries where shielded as intergovernmental transfers compensated for lower own revenues.
Panel A. State level Panel B. Local level
-3.0
-2.5
-2.0
-1.5
-1.0
-0.5
0.0
0.5
upper quintile median lower quintile
-3.0
-2.5
-2.0
-1.5
-1.0
-0.5
0.0
0.5
upper quintile median lower quintile% of GDP % of GDP

5
average, with states in some countries – notably in Canada, Germany and Spain – having considerably higher debt ratios. At the local level, liabilities amount to around 5% of GDP, with some local governments – notably in Japan – showing debt ratios of 35% of GDP. While this might be considered very modest compared with general debt, which OECD-wide stands above 100%, liabilities must be seen in relation to a government’s size. Comparing government liabilities to tax revenue of that government level suggests that SCGs are as much affected by the crisis as central government. The states in several federal/regional countries (e.g. Austria and Canada) and local governments in a few unitary countries (e.g. the Netherlands and the Czech Republic) have a higher debt-to-tax-revenue-ratio than their central government counterparts (Figure 3), the latter two because of their very low share in total tax revenue.2
Figure 14. Sub-central debt is stabilising
In per cent of national GDP, 1995-2011
Note: Local level without Australia, Chile, Mexico, New Zealand and the United States. Source: OECD National Accounts.
2.2. Sub-central spending and tax revenues
5. After being inconspicuously flat in the decade before the crisis, sub-central spending as a share of GDP rose considerably after 2007, reflecting both outright GDP declines in many countries and the effect of stimulus programmes (Figure 4), before falling again after 2009. Sub-central tax revenues slowly increased during the last decade, then shrank slightly in the aftermath of the crisis and have remained almost stable since then, suggesting that SCG taxes – often property taxes – react less to the cycle than central government taxes. Intergovernmental transfers – a significant revenue source for SCGs in many countries – remained largely stable during the crisis and declined very slightly since the beginning of sub-central consolidation (not shown). Overall, sub-central fiscal consolidation seems to be mainly achieved through spending cuts so far, while own revenues and intergovernmental transfers largely remained unchanged. The overall picture hides stark differences across countries and even between SCGs of the same country.
2. SCG revenues are essentially comprised of taxes, user fees and intergovernmental grants. Comparing liabilities
to the sum of the three SCG revenue sources would considerably reduce indicator values and hence provide a more favourable picture of the SCG debt situation. However, both user fees and, to some extent, intergovernmental grants are subject to the provision of certain public services, i.e. they cannot or only in part be used to reduce deficits. In this sense, the debt-to-tax ratio probably provides a better picture of how much leeway SCGs have to consolidate. Interest payments of SCGs also play a role when considering the sub-central potential to consolidate.
Panel A. State level Panel B. Local level
0
5
10
15
20
25
30
Upper quintile value Median Lower quintile value
0
5
10
15
20
25
30
upper quintile median lower quintile% of GDP % of GDP

6
Figure 15. Gross financial liabilities
Ratio of debt to own tax revenue, by level of government, 2011
Note: The vertical axis shows the ratio of debt to own tax revenue, or the years needed to pay back debt by its own means. Countries are shown in decreasing order of central government liabilities. Source: OECD National Accounts.
Figure 16. Spending came down since consolidation started, while tax revenues remained largely stable
Panel A: Spending in % of GDP Panel B: Tax revenue in % of GDP
Source: OECD National Accounts and Fiscal Decentralisation database.
3. Sub-central consolidation needs
3.1. The risks posed by high SCG debt
6. In the long term, governments at all levels have to respect the budget constraint: the present value of future government spending must equal the present value of future government revenues. This so-called transversality condition prohibits government from always borrowing to pay its debt. However, theory does not provide an answer of what determines the optimum or maximum government debt ratio; it just
0
1
2
3
4
5
6
7
8
9
10central level state level local level
0
5
10
15
20
Upper quintile value Median Lower quintile value
0
2
4
6
8
10
12
Upper quintile value Median Lower quintile value

7
argues that debt developments must be sustainable. Debt at any government level perceived as unsustainable could lead to a rise in interest rates, which worsens budget balances, could have a negative impact on financial markets and finally lead to default. The threshold where that starts happening is open to debate.3
7. Sub-central debt levels are, with the exception of a few countries, relatively low in terms of GDP, and they have increased comparatively little during the economic crisis. Overall, the fiscal crisis that is underway and that is likely to preoccupy countries for many years is a crisis of central government rather than of sub-central governments. However, debt creates externalities across governments, i.e. sustainability is determined by the joint actions of all governments, and financial difficulties in one government can contaminate other governments. The dynamics of this common pool problem are even more pertinent if discontinuities or threshold effects are present, i.e. if interest rates are suddenly rising or growth rates start falling once a certain general government debt level is exceeded. Three types of debt externalities might call for prudent sub-central debt levels:
There are various channels by which government debt can negatively affect economic activity and welfare in the long run, which argue in favour of containing debt increases or to reduce debt to a prudent level.
• Descending externalities: Debt dynamics at the central level may affect SCGs by increasing interest rates and debt servicing cost and by deteriorating budget balances for all governments. For highly indebted SCGs the cost of refinancing debt could increase considerably. High central government debt may also crowd out SCG debt and investment.
• Ascending externalities: SCG debt dynamics can get central government into troubles. In many countries central government guarantees extend to sub-central government debt, sometimes taking on the form of implicit or explicit bailout guarantees.4
• Horizontal externalities: Fiscal problems in a few SCGs can spread across the entire sub-central sphere. The bankruptcy of even a small SCG can disrupt sub-central financial markets and raise uncertainty about the sustainability of debt in other SCGs, and it may result in a general rise of risk premia on sub-central debt.
As a result, SCGs expecting a bailout may aim at unsustainable debt levels.
5
8. Sub-central governments often own public enterprises whose debt is not accounted for in the National Accounts, creating contingent liabilities. In most countries SCGs are owners or co-owners of infrastructure companies that provide water, energy or transport services. In several countries states or regions are holders of public banks which also provide credit to public enterprises and municipalities, thus concentrating rather than spreading risks. Some SCG public entities may be too-big-to-fail. Also, in several countries contingent liabilities due to underfunded public pension schemes pose a threat to the
3. Recent research on such threshold effects presents various results, from below 30 to above 80% debt-to-GDP
ratio (Egert, 2012).
4. For example, Danish municipalities receive financial help from central government if they get into financial difficulties, and they are put under administrative control (Mau-Pedersen, 2011). In Germany, the constitutional court ruled that the federal government had to help out two Länder (states) which were in financial distress.
5. Switzerland provides an interesting example for horizontal contagion. The default around the year 2000 of a small municipality – less than 0.05% of national GDP – caused the municipal bond market almost to collapse. Uncertainty about the fiscal situation of unaffected municipalities cut the municipalities from external funding and brought the body that managed municipal bonds into serious difficulties. It took municipal bond markets more than one and a half years to return to normal. Also, fears of municipal defaults in the summer of 2011 led to rising interest rates for municipal bonds in the United States.

8
sustainability of sub-central government debt. Apart from keeping explicit debt at prudent levels, SCGs exposed to contingent liabilities need to improve transparency, especially on their effective debt levels.6
9. The arguments above call for a prudent SCG debt policy and, depending on a country’s intergovernmental fiscal framework, for the setting of medium-term debt targets and debt reduction plans, preferably self-imposed. Given the institutional differences across countries, targets may vary strongly, depending on factors such as the strength and credibility of no-bailout clauses, the size and structure of public spending, tax autonomy, or the functioning of sub-central financial markets. Targets may also vary across jurisdictions within a country. These issues are further discussed in section 6.
3.2. Long-term consolidation needs
10. This section presents consolidation needs that would allow SCGs to attain a certain debt target in the future. It starts with presenting the current fiscal positions in terms of primary balances and debt levels. It then defines so-called “fiscal gaps”, i.e. the immediate and permanent improvement in the current primary balance needed to bring debt to a certain level. The calculation of fiscal gaps uses a basic formula linking debt levels, primary balances, the national growth rate and interest rates. Projections for these variables are mostly taken from the OECD Economic Outlook and adapted to the specificities of sub-national governments. While the methods can give a rough idea about the long-term consolidation needs of sub-central governments, it should be noted that the simulations are highly stylised and simplified. In particular, they do not take into account any repercussions of fiscal consolidation on interest rates or growth. The main assumptions underlying the simulations are outlined in Box 1.
3.2.1. Current fiscal positions
11. The starting point for the calculation of sub-central consolidation needs is the sub-central fiscal position in 2011 (Figure 5 and Box 1). Around half of the countries show primary deficits in 2011, which are considerable at the state level in Australia, Canada and Spain. In several countries, a 2010 deficit has turned into a surplus in 2011. As for debt, SCGs in most countries show relatively modest levels, although states in Canada, Germany and the United States and local governments in Japan have to shoulder a somewhat higher debt. Again, both primary balances and liabilities of SCGs are in much better shape than those of their central government counterparts, and they have deteriorated much less in the wake of the financial and economic crisis.
3.2.2. Fiscal gaps
12. The fiscal gap is defined as the immediate and permanent change in the primary balance that is required to ensure that debt meets a target at a certain point in time (Auerbach, 1994). As such, the fiscal gap provides an estimate of potential consolidation needs. Consolidation needs are defined against the 2011 primary balance. Two simulations are run, a first one reducing debt to the debt-GDP-ratio in 2011 (current debt level) and a second one reducing debt to the GDP ratio of 2007, i.e. before the crisis started. These debt targets are illustrative and not normative, as different countries may see different debt levels as appropriate. The simulation is run for two scenarios: a) with the transfer-to-GDP ratio in each country remaining constant; b) with transfers in each country being permanently cut by 20%. The consolidation needs shown in Figure 6 should be seen as an indication of the required scale of fiscal consolidation rather than saying anything about how it will be implemented.
6. Defaults of state-owned banks have led to protracted financial difficulties for individual SCGs in Germany,
Switzerland and the United States. In several countries, the defined-contribution pension schemes of sub-central governments are insufficient to pay future entitlements.

9
Box 1. Assumptions underlying the long-term consolidation simulations
The fiscal projections are anchored in the government’s inter-temporal budget constraint which posits that the level of outstanding debt equals the present value of past primary surpluses and deficits. Formally, the debt-to-GDP ratio at any point in time is defined as:
Where bo denotes the debt level in the terminal (or projected) year, pbj denotes annual primary balances, g denotes the GDP growth rate and r denotes the long-term interest rate. Solving for pbj allows determining the primary balance needed to achieve a certain debt target in the terminal (or projected) year.
The above equation also allows deriving so-called “fiscal gaps”, which show the additional immediate and permanent improvement in the current primary balance needed to achieve a certain debt target. Using the notation from above, the change in the primary balance as a share of GDP (Δpb) required to attain a certain debt target is equal to:
T denotes the terminal year, t is the initial year and pbs is the primary balance as a share of GDP in year s. A positive (negative) value for Δpb implies that a permanent increase in the primary surplus (or a permanent reduction in the primary deficit) is needed to ensure that the desired debt-to-GDP ratio (bt) is attained in the terminal year.
In order to provide SCG long-term fiscal projections based on the above identities, a number of assumptions on GDP growth and interest rates have to be made together with sub-central fiscal policy variables such as primary balances and debt. The assumptions and variables used for the simulations are as follows:
• Nominal GDP projections build on the assumptions underlying the OECD Economic Outlook’s short-term economic projections (until 2014) and the long-term baseline projections (from 2015 on). Together they provide growth rates until the year 2026. Growth rates for individual SCGs may differ from national averages, but this is not taken into account.
• Interest rates on government borrowing are again projected by the baseline projections of the OECD Economic Outlook, with projections extending until 2026. However, borrowing costs differ across government levels, with SCG interest rates usually higher than central government interest rates. For a few countries (CAN, CZE, DEU, NOR, ITA, SPA, SWI, USA) interest rates for selected SCGs are available for the 2007 to 2010 period, which allows constructing sub-central effective interest rate spreads. Since spreads have not been trending over that period (although disparities between highly- and lowly-rated SCGs have), the spreads are assumed to remain constant until 2026. For the other countries, a spread of 15% above the central government long-term interest rate is assumed, which is a bit above the average of the eight countries with available sub-central spreads.
• Sub-central primary balances are not projected by the OECD Economic Outlook, nor are they available through the National Accounts database. Sub-central primary balances are therefore calculated by estimating interest payments by level of government and adding the sub-central share to the sub-central budget balance (which is available in National Accounts). In the baseline, primary spending, revenues and primary balances in per cent of GDP are assumed to remain constant until 2026. Underlying (e.g. cyclically-adjusted and adjusted for one-offs) primary balances are not available.
• Sub-central debt levels are available for most countries until 2011 from the National Accounts. For countries where debt data are available until 2010, the 2011 growth-adjusted budget balance has been added to 2010 debt levels. The sub-central tax and primary spending share are assumed to remain constant.
• Fiscal gap calculations are run for two scenarios: one assuming that the share of transfers in GDP remains constant, and one assuming that transfers decline immediately and permanently by 20% of their 2011 levels.
The model is kept deliberately simple. No impact of the fiscal policy path on growth or interest rates is assumed. Also interest rates do not depend on the debt level.

10
Figure 17. Sub-central deficits and debt 2011
Note: Actual primary balances are constructed values, for details see Box 1.
Source: OECD Economic Outlook and National Accounts.
13. Sub-central fiscal consolidation needs are in general relatively low apart from a few countries (Figure 6, panel A). In terms of GDP the state level in Australia, Canada and Spain has the largest consolidation needs, while the fiscal gap is negative for the local level in Greece and Hungary. The fiscal gaps do not change markedly relative to whether the 2007 or 2011 debt-to-GDP ratios are set as the target. The picture changes if a decline in transfer spending by 20% is assumed (Figure 6, panel B). Such a decline will require all countries to step up their consolidation efforts, which also reveals how fragile many SCGs are fiscally and to what extent they depend on external rather than own funding.
Panel A. Actual primary balance
Panel B. Gross financial liabilities
Local
-5.0
-4.0
-3.0
-2.0
-1.0
0.0
1.0% of GDP
0
5
10
15
20
25
30
35
40
45% of GDP
State Local
State Local

11
Figure 18. A few sub-central budgets are far from being sustainable
Note: Fiscal gaps are defined as the additional and permanent improvement – above outcomes in 2011 – in primary balances required to hit the debt–to-GDP ratios of 2007 or 2011 in 2026. A fiscal gap of zero means that no additional effort compared to 2011 is needed. For panel B, a transfer reduction of 20% of their 2011 levels is simulated.
Source: OECD Economic Outlook and National Accounts.
4. Intergovernmental fiscal relations during past consolidation episodes
4.1. The contribution of SCGs to general government consolidation success
14. Intergovernmental fiscal relations may affect the success of consolidation of all government layers. SCGs can support a central government by consolidating their own budgets, but they may also
Panel A. Fiscal gaps expressed in % of GDP
Panel B. Fiscal gaps expressed in % of GDP if transfers are reduced by 20 %
-2
-1
0
1
2
3
4
5
6
72007 debt 2011 debt
0
1
2
3
4
5
6
7
82007 debt 2011 debt

12
undermine central government endeavours, thereby weakening overall consolidation efforts. Conversely, central government may tidy up its finances by shifting responsibilities to lower government levels, by cutting grants or by increasing its own tax share. More generally, success at one government level to consolidate and failure to do so at the other may prevent success at the general government level. Regressions were run in order to determine the factors that help succeed consolidation across government levels in the past. “Success” is defined as general government debt stabilisation after one, two or three years. The empirical analysis covers a sample of 31 OECD countries over the period 1980-2009. The results pertaining to intergovernmental fiscal frameworks are presented below. The other factors determining successful debt stabilisation are summarised in Box 2.
Box 2. The determinants of the success of consolidation: an analysis for general government
An econometric analysis of past consolidation episodes (Molnar, 2012) provided insights into what policy measures are most conducive to successful consolidations. The analysis identified a number of conditions for the start, length, intensity, and success of consolidation. The econometric analysis uses probit, duration, truncated regression and the bivariate Heckman selection method to investigate consolidations, highlighting the different ingredients that affect how and when consolidation is undertaken and whether it is successful in terms of stabilising debt after one, two or three years.
Successful consolidation episodes are typically supported by somewhat stronger growth than consolidation periods in general. Likewise, falling interest rates help debt stabilisation through reducing debt servicing costs and cushioning the contractionary impact of consolidation. Depreciation of the nominal effective exchange rate seems to be conducive to reducing debt, which may work through competitiveness gains boosting exports, and also appears to lengthen consolidation episodes. These results hold out limited promise of successful consolidation at the current conjuncture, as growth is fairly modest and interest rates are already relatively low.
Source: Molnar (2012).
15. The regression results suggest that sub-central governments support general government consolidation success (Table 1).7
7. However, SCGs do not appear to affect the length, size and intensity of consolidation episodes. An initially
high SCG debt tends to foster the start of a consolidation (not shown).
Fiscal consolidation by state-level governments is associated with general government debt stabilisation after two or three years following the start of the consolidation. Results are a bit less clear for the local level. Here consolidations appear to reduce the probability of general government debt stabilisation, but results are only statistically significant for the first two years, and are to some extent driven by individual countries (Canada and Korea). The negative contribution of local governments to general government consolidation may occur either as a reaction to attempts by central governments to shift the consolidation burden to lower levels of government or because SCGs are unable to reduce politically sensitive spending, such as on health and education.

13
Table 3. Sub-central governments and success in stabilising debt
Left-hand side variable: binary variable indicating the success of a consolidation
Debt stabilises
at t+1
Debt stabilises
at t+2
Debt stabilises
at t+3
Debt stabilises
at t+1
Debt stabilises
at t+2
Debt stabilises
at t+3 Explanatory variables Growth rate 8.80*** 3.80 2.30 7.77*** 5.13*** 4.65*** Long-term interest rates (change) -0.14*** -0.20*** -0.13*** -0.06*** -0.09*** -0.11*** Exchange rate (change) 0.04 0.06 0.07 0.15*** 0.1** 0.02 Inflation (change) -0.11 -0.08** -0.02 -0.06*** -0.07*** -0.07*** Strong left-leaning government -0.01 -0.04** -0.03* -0.02** -0.03*** -0.03*** Strong right-leaning government -0.01 -0.01 -0.01 -0.01 -0.01 -0.01* State-level government budget balance
(change) 0.34 0.71*** 0.73***
Local government budget balance (change) -0.41** -0.32* -0.19
Observations 145 164 183 472 473 474 LR-test of independent equations 7.35*** 7.39*** 12.75*** 4.35** 1.8 1.43
Notes: The budget balance measures are cyclically-adjusted using the Hodrick-Prescott filter. In order to ensure comparability, consolidation was defined as an improvement in the cyclically-adjusted central government and social security fund budget balance (using only cyclically-adjusted central government balances does not alter the results).
Significance levels: * significant at 10%; ** significant at 5%; *** significant at 1%. The regressions use the bivariate Heckman selection model. Reported coefficients are the marginal effects (i.e. the change in
probability of the left-hand side variable if the explanatory variable increases by one unit). The coefficients of the selection equation variables are not shown in the table but tests confirmed the selection bias in most cases.
4.2. The role of intergovernmental transfers for the success of general government consolidation
16. In order to reduce spending and to consolidate its own budget, central government may want to reduce intergovernmental grants. Such a decrease could have different effects on the probability of successful general government consolidation:
a) Positive effect: A reduction in transfers increases the probability of a successful general government consolidation, because SCGs are forced to put in an additional effort, i.e. raise efficiency of service delivery, reduce costs or raise more own revenues.
b) Negative effect: A reduction in transfers reduces the probability of successful general government consolidation, because most SCGs have mandated spending that is difficult to reduce, leading to ballooning SCG deficits.
c) No effect: A reduction in transfers has no impact on the success of general government consolidation since it simply shifts the consolidation burden downwards, without net effect.
17. Regression results suggest that a transfer reduction has a positive effect, i.e. increases the probability of success of general government consolidation (Table 2). The impact becomes significant only after three years of the start of a consolidation, however, suggesting that transfer reductions take some time to change SCG behaviour. One possible explanation for transfer reductions improving success rates of consolidation is the so-called “flypaper effect”, i.e. the observation that SCGs' propensity to spend is higher if expenditures are financed through grants rather than through own revenues. Under the flypaper

14
assumption, lower transfers would improve budget balance at the central level more than they would deteriorate them at the sub-central level, hence the net effect would be positive (Hines and Thaler, 1995).8
Table 4. Transfers and consolidation success
Left-hand side variable: binary variable indicating the success of a consolidation
Debt stabilises
at t+1
Debt stabilises
at t+2
Debt stabilises
at t+3
Debt stabilises
at t+1
Debt stabilises
at t+2
Debt stabilises
at t+3 Initiator of consolidation: central+social security combined balance Explanatory variables Growth rate 8.78*** 5.29*** 4.78** 8.90*** 3.91 2.28*** Long-term interest rates (change) -0.07*** -0.08*** -0.11*** -0.13*** -0.22*** -0.14*** Exchange rate (change) 0.1242** 0.04 -0.04 0.02 0.05 0.03 Inflation (change) -0.07*** -0.08*** -0.07*** -0.09** -0.08** -0.01*** Sub-central budget balance (change) 0.13 0.24 0.22 0.35 0.68*** .68*** Strong left-leaning government -0.02** -0.03*** -0.02** -0.02 -0.04** -0.04** Strong right-leaning government -0.01 -0.01 -0.04 -0.02* -0.01 -0.01** Central transfer spending (change, in
% of GDP) -0.09 -0.12 -0.11*
State transfer spending (change, in % of GDP) -0.12 -0.80 -1.2***
Observations 390 365 396 138 157 176 LR-test of independent equations 4.56** 0.30 5.44** 5.89** 7.86*** 11.19***
Note: See Table 1.
4.3. Large consolidations: the contribution of central and sub-central government
18. Some OECD countries have implemented large and sustained fiscal consolidation packages in the past, with episodes extending over several years, during which budgets improved considerably and debt tended to stabilise or decline. This section provides an analysis of 13 of the largest consolidation episodes between 1980 and 1998 and how they affected the central and sub-central budget balances. The methodology is explained in Box 3.
19. The results suggest that central and sub-central government consolidation efforts largely evolved in parallel (Figure 7). While central government balances tended to improve steadily starting from the trough, SCGs (state plus local governments) started to consolidate earlier, but suffered from a second trough three to four years after central government consolidation had started, clearly visible in some countries (namely Sweden, Finland, Italy, and to some extent Canada). This trough may point to a reduction in intergovernmental transfers or looser fiscal policy at the SCG level. While both deficits and the size of consolidation in terms of GDP were much smaller for SCGs than for the central government, they must be seen relative to the size of spending. In relation to spending, the SCGs’ consolidation effort is only a little smaller than that of central government.9
8. In an earlier study but a different empirical setting, de Mello (2007) found that higher transfers had a negative
impact on SCG budget discipline. An increase in transfers was associated with higher rather than lower SCG deficits, which is in line with the results above.
In general, deficits are lower and cyclical variation is
9. The ratio of SCG to general government spending for the countries and periods under scrutiny is around 36%. As a ratio of total spending, deficits were reduced by a bit more at the central than at the sub-central level. To make the same relative consolidation effort in terms of spending, central government would have to improve its balance by around 4.5% of GDP, while SCGs would have to improve it by around 2.5%.

15
smaller for SCGs than for central government.10
Box 3. Analysis of large consolidation episodes
Given the relatively small number of SCG observations, the results should be taken with care.
The 13 country cases representing large consolidations were selected on the basis of measuring the trough-to-peak of the underlying general government primary balance. The cases thus selected are: Australia (1984-88 and 1994-98), Canada (1993-97), Denmark (1983-86), Finland (1993-2000), the United Kingdom (1993-98), Greece (1990-94), Ireland (1982-88), Italy (1990-95), Japan (1979-87), Sweden (1981-87 and 1994-97), and the United States (1993-98).
Figures 7 and 8 provide an aggregate picture of the 13 consolidation episodes. They show the evolution of the median value, the 80% value and the 20% value of the variables under scrutiny before and during the consolidation period. T0 denotes the year when consolidation started (the trough, i.e. when balances started to improve), and T0-x and T0+x denote the years before or after the trough. Since the figures show percentiles and not a given group of countries (i.e. a country may change the percentile from one year to the next), care should be taken so as not to interpret changes as developments in a single country or country sub-group. The figures cover a time span of five years before and after the trough, which for most countries allows discerning broadly three distinct periods: a) a pre-crisis period; b) a crisis period when fiscal variables tend to deteriorate; and c) a consolidation period when most fiscal variables are improving.
The methodology also allowed assessing how economic variables (GDP, unemployment, interest rates etc.) evolved during large consolidation episodes. Results of this analysis are shown in Blöchliger et al. (2012).
Figure 19. Central and sub-central government balances do not always evolve in parallel
Note: Evolution before and during the consolidation period. Data concern 13 episodes. For details see Box 3. Source: OECD National Accounts.
5. Policies supporting fiscal consolidation across government levels
20. Policy reforms to the intergovernmental fiscal framework can support sub-central fiscal consolidation. Many instruments are available that rein in public spending or provide additional revenue, while they have little effect on economic activity in the short run and are likely to raise economic activity in the medium to long run, depending on multipliers. Effective instruments may hence have an effect both
10. This is in line with the analysis of the cyclical behaviour of SCG/CG balances over the past 25 years
(Blöchliger et al., 2010).
Panel A. Central government net lending Panel B. Sub-central government net lending
-12
-10
-8
-6
-4
-2
0
2
-5 -4 -3 -2 -1 0 1 2 3 4 5
Years
Upper quintile value Median Lower quintile value
-12
-10
-8
-6
-4
-2
0
2
-5 -4 -3 -2 -1 0 1 2 3 4 5
Years
Upper quintile value Median Lower quintile value
% of GDP % of GDP

16
on the nominator (deficit and debt levels) and on the denominator (GDP), jointly determining the sustainability of sub-central budgets. However, the space for SCGs to implement spending and revenue reforms is often limited. On the revenue side, many SCGs have little control over their tax revenues and no autonomy over tax bases or rates, while spending is mandated and regulated by central government or politically sensitive. While spending items such as education and health care are politically sensitive, work by the OECD has shown that considerable efficiency gains could be reaped in these areas in many countries, without compromising outcomes. Often the largest lever for sub-central fiscal consolidation is intergovernmental grants, and those are the central rather than the sub-central government’s policy instrument. The following discussion concentrates on instruments which are either related to intergovernmental fiscal frameworks or over which SCGs have at least some prerogatives in most countries. The full set of policies underscoring fiscal consolidation is provided in Hagemann (2012).
5.1. Spending instruments
5.1.1. Promoting market mechanisms in sub-central public service provision
21. Rules and procedures can mimic markets in the provision of public services. Market mechanisms can improve efficiency in the public sector in various ways: they better cater to consumers’ tastes and preferences, they enhance awareness of the resource costs of providing services and they improve productivity by raising the quality and lowering the cost of services. The latter is particularly relevant in times of fiscal consolidation. Market mechanisms are usually divided into three groups: i) privatisation and contracting (tendering, outsourcing, public-private partnerships etc.); ii) user choice and competition among service providers; and iii) price signals such as user fees or mechanisms where state funding reflects actual service use or performance. Applied individually or in combination, they can help SCGs both reduce pressure from spending on public services and foster productivity.
22. In a previous activity, the reliance on market mechanisms for altogether eight public services, which together make up the overwhelming part of sub-central spending in most OECD countries, was analysed. A composite indicator of the prevalence and strength of market mechanisms was developed. The results reveal that reliance on market mechanisms varies considerably across countries and across services (Figure 8). The indicator allows setting current arrangements against OECD recommendations in the form of a “policy reform gap”. Calculations of this gap suggest that a wider use of market mechanisms – in particular user choice or performance-related funding – should be used more in “social” services such as education, health, or childcare (Blöchliger, 2008). In order to avoid undesirable distributional effects, both social and geographic in nature, flanking policies might be needed, although many market mechanism reforms – such as the introduction of funding-follows-the-use systems or “vouchers” – have in general little or no redistributional consequences.

17
Figure 20. Market mechanisms in public service provision
Note: Panel A: Values scaled between 0 and 10, with a higher value representing greater use of market arrangements in public service provision. Panel B: The policy reform gap is the difference between actual implementation of market mechanisms and normative benchmarks derived from OECD recommendations, for each service. Values scaled between 0 and 10, with a longer horizontal bar representing a higher reform need. For details see Blöchliger (2008).
5.1.2. Public investment
23. Sub-central governments account for around 65% of general government public investment, with the share of capital spending in total spending being somewhat higher in more decentralised countries. Public infrastructure investment as a share of GDP has been declining over the past decades and especially during consolidation periods, amounting in 2009 to around 2% of GDP on average. With the end of the fiscal stimulus programmes that launched many sub-central investment projects, capital spending is likely to drop sharply. While such tightening of investment budgets can contribute to sub-central fiscal consolidation, a sound policy framework can help ensure effectiveness and a positive growth impact of the remaining sub-central investment. SCGs could follow three broad lines to increase investment efficiency.
• Improving transparency: Frameworks for assessing and selecting investment projects can help improve their effectiveness. For example, cost-benefit analysis (CBA) can help establish a ranking of projects according to their net social benefits. The usefulness of CBAs can be further strengthened if selected projects are subject to a “second opinion” and to ex-post evaluations. A stronger reliance on evaluation frameworks would increase the transparency of how projects affect the wider economy and increase pressure to invest only if returns are positive.
• More reliance on the private sector: Public investment may benefit from stronger involvement of the private sector, for example by relying on public-private partnerships (PPPs) (Sutherland and Araujo, 2010).11
• Improving coordination across governments: SCG investment projects may generate spillovers across jurisdictions, and failure to address them may result in sub-central over- or under-investment. Central government often uses matching grants or other forms of co-funding to
PPPs hold promise of a better and more innovative use of inputs than traditional procurement. They tend not only to increase efficiency but allow sub-central governments with limited access to borrowing to defer spending. However, PPPs must be well designed, especially with respect to the risk sharing between the public and private sector. Moreover, PPPs may be used to bypass sub-central fiscal rules, with the risk of creating contingent liabilities.
11. Most Public-Private Partnerships (PPPs) are contracted at the sub-central level. In Germany, around 80% of
PPP-investment is undertaken at the Länder and municipal level, making up 2 to 3% of sub-central investment, while in France, more than 50% of PPPs are arranged at the sub-central level. With the “Private Finance Initiative” the United Kingdom has the most advanced PPPs representing 10 to 15% of total public investment, mostly administered by local governments.
A. Market mechanisms : prevalence across countries B. Public reform gap across sub-central public services
0
1
2
3
4
5
6
7
8
MEX
TUR ITA
SUI
AUT
POR
FRA
NOR
JAP
ESP
FIN
SWE
IRL
BEL (
wal.)
BEL (
fla.)
NLD
DEN
AUS
0 1 2 3 4 5 6 7 8
waste
public transport
hospitals
secondary education
childcare
primary education
nursing homes
tertiary education

18
internalise cross-border externalities of investment projects. However, such arrangements are often more widely used than justifiable by plausible externality estimates (Blöchliger and Petzold, 2009). A better assessment of externalities and stricter rules for central government co-funding SCG projects can help contribute to consolidation at both the central and sub-central level. Improved co-ordination through intergovernmental bodies or across ministries can also help ensure that projects are assessed and implemented efficiently (Kim and Vammalle, 2012).
5.2. Revenue instruments
5.2.1. Taxes on immovable property
24. Taxes on immovable property are a typical sub-central tax: more than 95% of property tax revenue accrues to sub-central treasuries, although their significance in terms of GDP varies considerably across countries (Figure 9). Property taxes, paid by individuals and businesses, hold promise of yielding additional revenue at lower deadweight costs than many other taxes. Given the “immobility” of real estate, property taxes tend to result in smaller excess burdens than more mobile and responsive tax bases in the short to medium term, and they tend to be the least detrimental to growth (Johansson et al., 2008), although higher property taxes may also affect saving and investment (Mankiw, Weinzierl and Yagan, 2009). In addition, property tax design can be used as an instrument to affect land development and land use patterns. For instance, linking assessment to market values may increase incentives for developing land. In sum, increasing the share of property tax revenue could not only fill municipal tills, but also be a boon to economic development.
25. However, over the past decades political economy pressures have eroded the property tax base through a variety of exemptions, abatements and other privileges for the residential and the business property tax.12 In many countries properties have not been re-evaluated for years or even decades, generating hefty distortions and “unfairness” in assessed cadastral and register values across households and jurisdictions. Updating property values would require a substantial administrative investment, although it would be mainly a one-off cost. Real estate owners may resist any tax hike as they will be capitalised in lower property values. Property taxes offer a relatively strong link between taxes paid and benefits received, but this feature tends to make the tax regressive, generating resistance on equity grounds.13 Resistance is particularly strong from liquidity-constrained households, especially elderly households with little income, but large estates. The final reason for the property tax being unloved is that it is highly salient (or visible), as property taxes are usually paid once a year and in retrospect, and it is difficult to avoid (Cabral and Hoxby, 2012). Therefore, property tax reforms occur only rarely.14
12. Augustine et al. (2010) and Kenyon (2012) review property taxation trends and policies in the United States.
Similar trends can be observed in most OECD countries.
13. This view is not uncontested and depends on the incidence of the property tax. Property taxes can be designed in a progressive way. Some countries also provide income related benefits to the poorest households.
14. The 2011 property tax reform in Italy, involving the shift of hitherto national property taxes to municipalities and the introduction in 2014 of a local property tax provides one of the few examples of a successful reform (OECD, 2011).

19
Figure 21. Taxes on immovable property are typically a sub-central tax
2009
Source: OECD Revenue Statistics.
26. A strengthened property tax base and higher tax revenues might require addressing the wider intergovernmental fiscal framework and equity issues. Higher property taxes increase the share of SCGs in the total tax take, probably requiring a shift of responsibilities to lower government levels or a cut in intergovernmental grants once consolidation has borne fruit. An alternative to these changes would be a central government or a dual central/sub-central property tax. As for addressing equity concerns, means-testing the tax and granting a lower tax to low-income households provides one option. If property tax hikes are shifted into rents, support for low-income renters may also become necessary.
Panel A. Expressed in % of total immovable property revenue and by level of government
Panel B. Expressed in % of GDP
0
0.5
1
1.5
2
2.5
3
3.5
4%
0
10
20
30
40
50
60
70
80
90
100
State Local Central%

20
5.2.2. User fees
27. User charges (or user fees) are individual payments for services provided. User charges make up a considerable part of public sector revenues in some countries, with the OECD average hovering around 2.5% of GDP (Figure 10). User charges are a typical sub-central revenue source, with 50% to 75% of fee revenue accruing to the sub-central level. User charges are predominantly levied for infrastructure services such as transport, water and waste collection, while they are less common for social services such as childcare or education. User fees are a tool for managing both demand for and supply of infrastructure services and can underpin fiscal consolidation in various ways. They help manage and contain demand. They may also relieve budgets by providing the funds necessary to maintain and expand infrastructure networks. User charges may be particularly appropriate for environmentally sensitive goods and services. Proper pricing of services potentially affecting the environment such as waste collection, water and waste treatment, or transportation can help reduce environmental impacts.
Figure 22. User charges in OECD countries 2009
Source: OECD National Accounts. User charges are defined as “sales of goods and services” in the government accounts.
Panel A. Expressed in per cent of GDP
Panel B. Expressed in per cent of government spending
0
1
2
3
4
5
6Central State Local
0
2
4
6
8
10
12
14Central State Local

21
28. Equity considerations, market structure and the wider administrative environment may limit stronger reliance on user charges. Higher user charges could disproportionately affect low-income households. User charges often concern essential government services, so that an efficiency/equity trade-off could arise. Since many services are provided by a single monopolistic provider, regulation may need to ensure that fees are not excessive. Structural reforms, which raise competition between several service providers, could strengthen the case for a wider application of user charges. More generally, user charges are best applied in a framework where providers are competing with each other, where SCG budgets report service revenues and costs in a transparent way and where citizens have some control over the level and structure of charges (Groot and Budding, 2004). In the following, two policy areas are reviewed, where a wider application of user fees could help fiscal consolidation.
- Charging for urban transport infrastructure: There is a solid case for proper pricing of both rail and road transport networks, especially in urban areas. The lack of adequate price signals leads to excessive demand on the existing transport networks, while the lack of funding restricts investment in capacity expansion, resulting in congestion. Pricing as a means to manage and fund urban road networks is rare. As for rail, in most countries, user charges typically cover 50% or less of urban public transport cost, generating funding shortages for new rail infrastructure (Blöchliger, 2008). In the European Union, the cost of congestion is estimated at around 2% of GDP (Koopmans et al., 2004). A wider use of transport user charges could address both the need for fiscal consolidation and the long-term policy to balance demand for and supply of transport infrastructure.
- Water pricing: Water provision is in most countries a local responsibility. The sustainable use of water has become a central economic and environmental issue, and adequate pricing one of the core instruments of water policy (OECD, 2010b). While in most OECD countries tariffs account for the lion’s share of recurrent expenditure on water provision, full-cost recovery – including infrastructure and environmental cost – is rare. Differences in water price levels are considerable, with prices lower and the gap to full-cost recovery usually larger in countries where water is scarce. Pricing water at an adequate level has to take into account several and sometimes conflicting objectives such as environmental sustainability, economic efficiency, financial sustainability and social concerns. Price signals should be strengthened for households and industry. Agriculture, which is by far the largest water consumer and also a strong contributor to water pollution, should be particularly submitted to the principle of sustainable cost recovery.
5.3. Reforms to intergovernmental grants
29. OECD-wide, intergovernmental grants account for around 4% of GDP, 8% of general government spending and around 50% of total sub-central revenue, with large variations between countries. Over the last two decades grant systems have grown in size and complexity, owing to more decentralisation on the spending side not matched by decentralisation on the revenue side. Many transfer systems also tend to be pro-cyclical, thereby destabilising sub-central budgets (Figure 11). Structural reforms to the intergovernmental grant system could contribute to general government fiscal consolidation and yield considerable efficiency gains, without compromising the objective of inter-jurisdictional equalisation, while also improving stabilisation properties.

22
Figure 23. In some countries, grants are pro-cyclical
Reaction of transfers to the size of the output gap, 1950-2009
Note: The columns show the per cent change in transfer growth if the output gap increases by 1%. A negative value means an anti-cyclical transfer system; a positive value means it is pro-cyclical. The regression is run on a pooled dataset using no lags and excluding annual changes in transfer volume above +/-30%. Values for countries marked ** or * are significant at the 5 and 10% level. Full results including control variables are presented in Annex 1. Source: National Accounts and Fiscal Decentralisation database.
30. Reforms to the framework of intergovernmental transfers should rest on three pillars:
• Increasing the sub-central tax share: In several countries transfers make up the large bulk of SCG revenue, thereby weakening the sub-central budget constraint, while increasing general government spending. A higher tax share and correspondingly lower transfer share could help reduce total spending and increase sub-central fiscal responsibility and accountability. As a general rule, sub-central spending should be entirely covered by own tax revenue, with the transfers assuming the role of equalisation between wealthy and poor jurisdictions and co-funding projects with inter-jurisdictional scope.15
• Reducing the pro-cyclicality of grants: Transfer pro-cyclicality may be the result of several factors. Transfer spending is often a share of central government tax revenue which itself tends to fluctuate with the cycle. Moreover, many grants are matching sub-central spending and hence tend to exacerbate fluctuations of sub-central spending. Finally, the particular properties of equalisation can make such a system pro-cyclical. As a general rule, in order to avoid destabilising SCG revenue volatility and to reduce spending, transfers should be linked to SCG needs rather than to SCG spending. The size of the transfer system should be decoupled from central government tax revenue. Finally, using multi-year averages of variables when determining an SCG’s yearly grant entitlement may reduce excessive volatility.
Since the non-equalising grants make up around 45% of all grants on average and more in countries with large grant systems, increasing the SCG tax share and tax autonomy can be undertaken without running into equity trade-offs.
• Simplification of the grant system. Grant systems in many countries are overly complex, consisting of dozens or even hundreds of individual grants, often based on different allocation criteria. Moreover, almost half of all grants are earmarked, i.e. tied to a specific purpose. A simplification of the grant system may help improve SCG service levels. Better strategic and
15. This policy has so far only been enacted in a single country, namely in Italy’s Law 42 on fiscal federalism
from 2009.
-4
-3
-2
-1
0
1
2
3
4

23
budget oversight at the central level and more flexibility at the sub-central level can be achieved by reducing the number of grants and by bundling them, by reducing the number of criteria applied in the allocation of grants, by moving from input to output or performance criteria when allocating grants, and by moving from earmarked towards non-earmarked grants (while SCG service delivery may still be regulated through legislation outside the grant system).
6. Sub-central government fiscal rules and the wider framework
6.1 Rationale for sub-central fiscal rules
31. Fiscal rules constraining sub-central budget autonomy can underpin sub-central consolidation efforts. The main rationale for sub-central fiscal rules is a perceived reluctance of SCGs to commit to fiscal sustainability and to contain the externalities for general government finances resulting from irresponsible SCG behaviour. Sub-central fiscal rules address the various forms of soft budget constraints and complement intergovernmental fiscal frameworks that often lack market discipline.16
6.2. The strength of rules and their impact on outcomes
Governments have put various rules in place, often combining several of them. The most common is the SCG budget balance rule (often requiring a balanced budget each year), followed by borrowing rules, rules constraining tax autonomy, and spending rules. Fiscal rules may pursue several objectives – of which fiscal consolidation and fiscal sustainability is only one –, and trade-offs between rules’ objectives may exist.
32. In order to assess SCG fiscal rules and to compare their strength over time, a set of indicators was developed in 2005, which were up-dated for 2011. In general, the fiscal rules framework has changed little between 2005 and 2011, although sub-indicators reveal a trend towards stricter rule application. Fiscal rules appear to be more efficient at the state than at the local level to cope with the four objectives: sustainability, constraining spending, efficiency and coping with shocks. Budget efficiency and – to a lesser extent – long term sustainability have been strengthened since 2005, while spending containment has become less important. The fact that rules have become more conducive to certain objectives while others are weakened reflects the inherent trade-offs between the objectives. In sum, despite some adjustments, it appears that the main features of SCG fiscal rules have been well in place before the crisis started, except for a few countries. The correlation between the strength of the rules and fiscal outcomes (debt and spending growth) is relatively weak and sometimes suggests an inverse relationship, i.e. that bad fiscal outcomes led governments to tighten the rules (figure 12).
16. Features of intergovernmental fiscal frameworks relying on autonomy and market discipline include, among
others: Large SCG tax and spending autonomy; transparent accounting; established and confirmed no-bailout rule; competitive and liquid financial markets; credit rating; and the existence of a default/insolvency mechanism.

24
Figure 24. The relationship between fiscal rules and fiscal outcomes is weak
Source: Fiscal Network questionnaire responses and OECD National Accounts.
6.3. What rules for sub-central government?
33. Fiscal sustainability is – and will for some time be – an overriding concern. Fiscal frameworks are accommodating such concerns and are increasingly focusing on prudent debt levels. The shift towards more sustainable intergovernmental fiscal frameworks could imply the following cornerstones:
- Sub-central governments define long-term debt targets, functioning as an anchor for sub-central fiscal policy. Self-imposed long-term debt targets best reflect a government’s commitment to fiscal consolidation and sustainable public finances.
- Derived from long-term debt targets, SCGs establish medium-term debt (reduction) plans or “debt brake” rules.17
- Sub-central budgetary procedures should underpin debt targeting. SCGs should convert to multi-annual budgeting. A uniform or harmonised accounting framework helps compare fiscal outcomes across jurisdictions and prevent creative accounting.
SCGs themselves are responsible for defining debt targets and observing them. SCGs should “own” their fiscal policy.
- Independent bodies (e.g. fiscal councils) should oversee and monitor fiscal performance and sub-central commitments. They can inform the public when sub-central fiscal policy is off track and offer recommendations for corrective measures.
- SCGs should be allowed to trade their debt.18
34. Focusing on medium-term debt targets and debt reduction could allow forgoing budget balance requirements, including the “golden rule” that exempts investment from the balanced budget rule. While budget balance rules provide a similar commitment to sustainability as do debt rules, their often strict
Trading would require the establishment of markets where SCGs can either buy or sell debt entitlements.
17. The German Länder are submitted to a “debt brake rule”, requiring them to have structurally balanced budgets
and thereby reducing debt-to-GDP in the long run.
18. Austria’s domestic stability pact allows deficit and debt trading between jurisdictions and levels of government. The option has been used several times.
Panel A. 2005 spending rule versus spending growth 2005-2010 Panel B. 2005-2011 change in borrowing rule versus debt growth
y = 1.08x + 1.41R² = 0.12
-6
-4
-2
0
2
4
6
8
-2 -1.5 -1 -0.5 0 0.5 1 1.5
Chan
ge in
deb
t/GDP
Change in fiscal rule indicator
y = -0.34x + 2.62R² = 0.19
-0.5
0.0
0.5
1.0
1.5
2.0
2.5
3.0
3.5
4.0
0 1 2 3 4 5 6 7
Evol
utio
n spe
ndin
g /GD
P
Fiscal rule indicator 2005

25
application in the form of an annually balanced budget lends itself to pro-cyclical fiscal policy, and structural rules correcting for the cycle can become technically unfeasible.19
19. Structural and underlying SCG balances are available for the state level and for a few countries only. Hallett
and Jensen (2012) argue on political economy grounds that having a debt rather than a deficit rule is simpler and provides policy-makers with more incentives to remain “within target” while keeping flexibility in the short term. Foremny and von Hagen (2012) argue in favour of a spending rule to ensure fiscal discipline, but SCG spending rules can also be difficult to manage over the cycle.
Moreover, debt limits (rather than targets) should be abandoned. Evidence suggests that SCGs perceive a limit like an objective to reach rather than to avoid, and they tend to rush towards it. Limits might actually have deteriorated fiscal discipline as SCGs might have sailed as close to the cliff as the rules allowed.

26
BIBLIOGRAPHY
Ahrend, R., P. Catte and R. Price (2006), “Interactions between Monetary and Fiscal Policy: How Monetary Conditions Affect Fiscal Consolidation”, OECD Economics Department Working Papers, No. 521, OECD Publishing.
Araújo, S. and D. Sutherland (2010), “Public-Private Partnerships and Investment in Infrastructure”, OECD Economics Department Working Papers, No. 803, OECD Publishing.
Auerbach, A. (1994), “The U.S. Fiscal Problem: Where We Are, How We Got Here, and Where We’re Going”, in S. Fischer and J. Rotemberg (eds.), NBER Macroeconomics Annual, National Bureau of Economic Research.
Augustine, N., M. Bell, D. Brunori and J. Youngman (eds.) (2009), “Erosion of the Property Tax Base”, Lincoln Institute of Land Policy, Cambridge, Mass.
Bernanke, B. (2011), “Challenges for State and Local Governments”, speech at the 2011 Annual Awards Dinner of the Citizens Budget Commission, New York, New York, 2 March 2011.
Blöchliger, H. (2008), “Market Mechanisms in Public Service Provision”, OECD Economics Department Working Papers, No. 626, OECD Publishing.
Blöchliger, H. and O. Petzold (2009), “Taxes or Grants: What Revenue Sources for Sub-central Governments?”, OECD Economics Department Working Papers, No. 704, OECD Publishing.
Blöchliger, H., C. Charbit, J.M. Pinero Campos and C. Vammalle (2010), “Sub-central Governments and the Economic Crisis: Impact and Policy Responses”, OECD Economics Department Working Papers, No. 752, OECD Publishing.
Blöchliger, H., D. Song and D. Sutherland (2012), “Fiscal Consolidation: Part 4. Case Studies of Large Fiscal Consolidation Episodes”, OECD Economics Department Working Papers, No. 935, OECD Publishing.
Cabral, M. and C. Hoxby (2012), “The Hated Property Tax: Salience, Tax Rates, and Tax Revolts”, NBER Working Paper, No. w18514.
Égert, B., T. Kozluk and D. Sutherland (2009), “Infrastructure and Growth: Empirical Evidence”, OECD Economics Department Working Papers, No. 685, OECD Publishing.
Foremny, D. and J. von Hagen (2012), “Fiscal Federalism in Times of Crisis”, CEPR Discussion Paper, No. 9154, Centre for Economic Policy Research.
Groot, T. and T. Budding (2004), “The Influence of New Public Management Practices on Product Costing and Service Pricing Decisions in Dutch Municipalities”, Financial Accountability and Management, Vol. 20(4).

27
Guichard, S., M. Kennedy, E. Wurzel and C. André (2007), “What Promotes Fiscal Consolidation: OECD Country Experiences”, OECD Economics Department Working Papers, No. 553, OECD Publishing.
Hagemann, R. (2012), “Fiscal Consolidation: Part 6. What Are the Best Policy Instruments for Fiscal Consolidation?”, OECD Economics Department Working Papers, No. 937, OECD Publishing.
Hines, J. and R. Thaler (1995), “The Flypaper Effect”, Journal of Economic Perspectives, No. 9.
Johansson, A., C. Heady, J. Arnold, B. Brys and L. Vartia (2008), “Taxation and Economic Growth”, OECD Economics Department Working Papers, No. 620, OECD Publishing.
Koen, V. and P. van den Noord (2005), “Fiscal Gimmickry in Europe: One-off Measures and Creative Accounting”, OECD Economic Department Working Papers, No. 417, OECD Publishing.
Mau, N.-J. (2011), “Prevention of Local Government Unsustainable Behaviour: Some Danish Experience”, paper presented to the 2011 Copenhagen Workshop on “Normative Frameworks of Decentralisation and Intergovernmental Fiscal Relations”.
Mello, L. de (2007), “Local Government Finances: The Link between Intergovernmental Transfers and Net Worth”, OECD Economics Department Working Papers, No. 581, OECD Publishing.
Molnar, M. (2012), “Fiscal Consolidation: Part 5. What Factors Determine the Success of Consolidation Efforts?”, OECD Economics Department Working Papers, No. 936, OECD Publishing.
OECD (2010a), Implementing Congestion Charges, ITF Round Tables, OECD Publishing.
OECD (2010b), Pricing Water Resources and Water and Sanitation Services, OECD Publishing.
OECD (2011), OECD Economic Surveys: Italy, OECD Publishing.
Persson, J. and D. Song (2010), “The Land Transport Sector: Policy and Performance”, OECD Economics Department Working Papers, No. 817, OECD Publishing.
Sutherland, D. et al. (2009), “Infrastructure Investment: Links to Growth and the Role of Public Policies”, OECD Economics Department Working Papers, No. 686, OECD Publishing.
Vammalle, C., D. Allain-Dupré and N. Gaillard (2011), “A Sub-central Government Perspective on Fiscal Policy in a Tight Fiscal Environment”, in J. Kim and C. Vammalle (eds.), Institutional and Financial Relations across Levels of Government, OECD/KIPF Publication.