First-principles calculation of the elastic moduli of...
13
American Mineralogist, Volume 96, pages 125–137, 2011 0003-004X/11/0001–125$05.00/DOI: 10.2138/am.2011.3558 125 First-principles calculation of the elastic moduli of sheet silicates and their application to shale anisotropy B. MILITZER , 1,2, * H.-R. WENK, 1 S. STACKHOUSE, 1 AND L. STIXRUDE 3 1 Department of Earth and Planetary Science, University of California, Berkeley, California 94720, U.S.A. 2 Department of Astronomy, University of California, Berkeley, California 94720, U.S.A. 3 Department of Earth Sciences, University College London, Gower Street, London WC1E 6BT, U.K. ABSTRACT The full elastic tensors of the sheet silicates muscovite, illite-smectite, kaolinite, dickite, and nacrite have been derived with first-principles calculations based on density functional theory. For muscovite, there is excellent agreement between calculated properties and experimental results. The influence of cation disorder was investigated and found to be minimal. On the other hand, stacking disorder is found to be of some relevance for kaolin minerals. The corresponding single-crystal seismic wave velocities were also derived for each phase. These revealed that kaolin minerals exhibit a distinct type of seismic anisotropy, which we relate to hydrogen bonding. The elastic properties of a shale aggregate was predicted by averaging the calculated properties of the contributing mineral phases over their orientation distributions. Calculated elastic properties display higher stiffness and lower p-wave anisotropy. The difference is likely due to the presence of oriented flattened pores in natural samples that are not taken into account in the averaging. Keywords: Elasticity, clay, ab initio calculations, sheet silicates, seismic anisotropy INTRODUCTION Sheet silicates are among the minerals with highest elastic anisotropy. Aggregates containing oriented sheet silicates, such as schists and shales, also display very high anisotropies and this has important implications for interpreting seismic travel times through such rocks. Shales are the most abundant rocks in sedimentary basins and relevant for petroleum deposits (e.g., Jo- hansen et al. 2004) as well as for carbon sequestration (Chadwick et al. 2004). Their physical properties are of great importance in exploration geophysics (e.g., Mavko et al. 1998; Wang et al. 2001). Elastic properties of shales have been measured with ultrasound techniques (e.g., Hornby 1998; Hornby et al. 1994; Johnston and Christensen 1995), because of their importance for seismic prospecting of hydrocarbon deposits (e.g., Banik 1984). In metals and igneous and metamorphic rocks, anisotropic ag- gregate properties can be satisfactorily predicted by averaging the single-crystal elastic properties over the orientation distribution (Bunge 1985; Barruol and Kern 1996; Mainprice and Humbert 1994). In the case of shale, anisotropy can be calculated with this method, but absolute values of predicted elastic stiffness coefficients are over a factor of two higher than the measured results (Valcke et al. 2006; Voltolini et al. 2009; Wenk et al. 2008). Currently only empirical models are available to describe the elasticity of shales that do not rely on measured microstructural properties (e.g., Bayuk et al. 2007; Ougier-Simoni et al. 2008; Ponte Castaneda and Willis 1995; Sayers 1994). There are vari- ous reasons why the simple averaging schemes are limited in the case of shales. One reason is that porosity and grain contacts are inadequately accounted for. Another reason is the uncertainty in the single-crystal elastic properties of sheet silicates (Chen and Evans 2006). Despite their importance, the single-crystal elastic moduli of clay minerals have not been measured experimentally, because of technical difficulties associated with the small grain size. There is also considerable uncertainty in atomic force microscopy (Prasad et al. 2002). For illite, elastic constants of the analog mineral, muscovite, have traditionally been used (Vaughan and Guggenheim 1986; Zhang et al. 2009) but considerable uncer- tainty arises from using such analogies. For kaolinite, values from first-principles calculations exist for the ideal structure (Sato et al. 2005; Mercier and Le Page 2008). However, the structure of kaolin minerals in natural samples is expected to differ considerably from the ideal kaolinite. Moreover, other equally important sheet silicates have not yet been examined by experiment or theory, including illite-smectite. In view of this, in the present work, we have calculated the single-crystal elastic properties of illite-smectite and the kaolin minerals kao- linite, dickite, and nacrite, which have structures more similar to those found in nature. In addition, to establish and test our method, we have computed the elastic properties of muscovite, for which analogous experimental data exists. The computed elastic properties are then used to predict the elastic properties of the classic Kimmeridge Clay shale (age 151–156 Ma) from Hornby (1998) for which experimental elastic properties are available, as well as orientation distributions of component phases (Wenk et al. 2010). * E-mail: [email protected]
Transcript of First-principles calculation of the elastic moduli of...

American Mineralogist, Volume 96, pages 125–137, 2011
0003-004X/11/0001–125$05.00/DOI: 10.2138/am.2011.3558 125
First-principles calculation of the elastic moduli of sheet silicates and their application to shale anisotropy
B. Militzer,1,2,* H.-r. Wenk,1 S. StackHouSe,1 and l. Stixrude3
1Department of Earth and Planetary Science, University of California, Berkeley, California 94720, U.S.A.2Department of Astronomy, University of California, Berkeley, California 94720, U.S.A.
3Department of Earth Sciences, University College London, Gower Street, London WC1E 6BT, U.K.
aBStract
The full elastic tensors of the sheet silicates muscovite, illite-smectite, kaolinite, dickite, and nacrite have been derived with first-principles calculations based on density functional theory. For muscovite, there is excellent agreement between calculated properties and experimental results. The influence of cation disorder was investigated and found to be minimal. On the other hand, stacking disorder is found to be of some relevance for kaolin minerals. The corresponding single-crystal seismic wave velocities were also derived for each phase. These revealed that kaolin minerals exhibit a distinct type of seismic anisotropy, which we relate to hydrogen bonding. The elastic properties of a shale aggregate was predicted by averaging the calculated properties of the contributing mineral phases over their orientation distributions. Calculated elastic properties display higher stiffness and lower p-wave anisotropy. The difference is likely due to the presence of oriented flattened pores in natural samples that are not taken into account in the averaging.
Keywords: Elasticity, clay, ab initio calculations, sheet silicates, seismic anisotropy
introduction
Sheet silicates are among the minerals with highest elastic anisotropy. Aggregates containing oriented sheet silicates, such as schists and shales, also display very high anisotropies and this has important implications for interpreting seismic travel times through such rocks. Shales are the most abundant rocks in sedimentary basins and relevant for petroleum deposits (e.g., Jo-hansen et al. 2004) as well as for carbon sequestration (Chadwick et al. 2004). Their physical properties are of great importance in exploration geophysics (e.g., Mavko et al. 1998; Wang et al. 2001). Elastic properties of shales have been measured with ultrasound techniques (e.g., Hornby 1998; Hornby et al. 1994; Johnston and Christensen 1995), because of their importance for seismic prospecting of hydrocarbon deposits (e.g., Banik 1984). In metals and igneous and metamorphic rocks, anisotropic ag-gregate properties can be satisfactorily predicted by averaging the single-crystal elastic properties over the orientation distribution (Bunge 1985; Barruol and Kern 1996; Mainprice and Humbert 1994). In the case of shale, anisotropy can be calculated with this method, but absolute values of predicted elastic stiffness coefficients are over a factor of two higher than the measured results (Valcke et al. 2006; Voltolini et al. 2009; Wenk et al. 2008). Currently only empirical models are available to describe the elasticity of shales that do not rely on measured microstructural properties (e.g., Bayuk et al. 2007; Ougier-Simoni et al. 2008; Ponte Castaneda and Willis 1995; Sayers 1994). There are vari-ous reasons why the simple averaging schemes are limited in
the case of shales. One reason is that porosity and grain contacts are inadequately accounted for. Another reason is the uncertainty in the single-crystal elastic properties of sheet silicates (Chen and Evans 2006).
Despite their importance, the single-crystal elastic moduli of clay minerals have not been measured experimentally, because of technical difficulties associated with the small grain size. There is also considerable uncertainty in atomic force microscopy (Prasad et al. 2002). For illite, elastic constants of the analog mineral, muscovite, have traditionally been used (Vaughan and Guggenheim 1986; Zhang et al. 2009) but considerable uncer-tainty arises from using such analogies. For kaolinite, values from first-principles calculations exist for the ideal structure (Sato et al. 2005; Mercier and Le Page 2008). However, the structure of kaolin minerals in natural samples is expected to differ considerably from the ideal kaolinite. Moreover, other equally important sheet silicates have not yet been examined by experiment or theory, including illite-smectite. In view of this, in the present work, we have calculated the single-crystal elastic properties of illite-smectite and the kaolin minerals kao-linite, dickite, and nacrite, which have structures more similar to those found in nature. In addition, to establish and test our method, we have computed the elastic properties of muscovite, for which analogous experimental data exists. The computed elastic properties are then used to predict the elastic properties of the classic Kimmeridge Clay shale (age 151–156 Ma) from Hornby (1998) for which experimental elastic properties are available, as well as orientation distributions of component phases (Wenk et al. 2010).* E-mail: [email protected]

MILITZEr ET AL.: AB InITIO CALCULATIOn OF ELASTIC MODULI OF SHEET SILICATES126
coMputational MetHodSWe used the Vienna ab initio simulation package (VASP) (Kresse and Hafner
1993; Kresse and Furthmüller 1996) to perform density functional calculations using either the local density approximation (LDA) or the Perdew-Burke-Ernzerhof (Perdew et al. 1996) generalized gradient approximation (GGA) in combination with the projector augmented-wave method (Blöchl 1994). The wave functions of the valence electrons were expanded in a plane-wave basis with an energy cut-off of 586 eV or higher and the Brillouin zone was sampled using 4 × 2 × 2 and 6 × 4 × 4 k-points grids (Monkhorst and Pack 1976) depending on the size of the unit cell. All structures were relaxed until all forces were <10–3 eV/A.
To calculate the elastic constants we used the finite strain method (Karki et al. 1997, 1997b, 2001). The lattice vectors of the strained unit cell, (a→′, b→′, c→′) ≡ A
↔′,
were obtained from the unstrained cell, (a→, b→, c→) ≡ A↔
, using A↔′ = (1
↔ + ε↔) A↔
, where 1↔
is the unit matrix and ε↔ is the strain tensor. The diagonal and off-diagonal strain tensors were of the form (ravindran et al. 1998)
ε
δ1
0 00 0 00 0 0
=
; ε δ
δ4
0 0 00 0 20 2 0
=
/
/
,
where the indices are given in Voigt notation. The remaining strain tensors are obtained by index permutations. For each strain, we performed two calculations using δ = ± 0.005 and determined the corresponding stresses. The elastic constants were then determined from simple stress-strain relations. Consistent results were also obtained for other values of δ. Mainprice et al. (2008) performed similar calculations for talc.
The error associated with our computed elastic constants, due to controlled approximations, is estimated to be <±2 GPa, with the major part of this associated with the careful, but slightly imperfect, structural relaxation and use of a finite strain. In addition to this, we must also take into account the uncontrolled ap-proximation of adopting a specific exchange-correlation functional. While LDA and GGA have been shown to predict many properties of a variety of materials with remarkable accuracy, neither approach is perfect. LDA tends to overbind the sheets in sheet silicates, and zero-pressure densities predicted with LDA (ρP=
LD0A)
are too high (by 3% for muscovite). In contrast, GGA tends to underbind the sheets, and zero-pressure densities predicted with GGA (ρP
GG=0
A) are too low (by 5% for muscovite). Since the computed elastic constants are affected by changes in density, we can improve the accuracy of the predicted constants by adopting the experimental density (ρP
EX=0
P) and relaxing the structure at fixed volume. In this approach it is important to account for uncertainties in the volume, structure, and composition of the experimental sample and differences between it and the model system. By adopting the experimental value of the volume, we remove one of the main sources of error in elastic constants computed with DFT.
A similar strategy was adopted by White et al. (2009) who studied the geometry of ideal kaolinite, comparing predictions for several different functionals, but with the lattice parameters fixed at the experimental values. Following the suggestion of one of the referees, we investigated the difference between the elastic constants calculated with LDA, keeping all lattice parameters fixed at their experimental value, and using the cell parameters obtained by optimizing the cell at the experi-mental density. The resulting elastic constants were found to be very similar, which is not surprising, because the lattice parameters obtained from optimization at the experimental volume agreed well with the experimental values.
Imposing the experimental density affects the interlayer separations, but leads to little change in the geometry of the sheet itself. In clays, bonding between layers is rather weak, which is the reason why it is difficult to describe it with density functional methods. Consequently, at the zero pressure densities, we find significant differences in the LDA and GGA predictions of elastic behavior in the direction perpendicular to the sheets, while that within the sheet is less affected. Karki et al. (2001) have shown that LDA leads to good agreement with experiment for a wide variety of mantle phases. In view of this, while we will compare LDA and GGA results in the paper, our preferred elastic constants come from LDA at ρP
EX=0
P.It should also be noted that we compute isothermal elastic constants at 0 K,
whereas experimental studies determine adiabatic elastic constants at room tem-perature. However we expect the difference between the two to be small and direct comparison between theoretical and experimental values to be reasonable.
Optimized structures, for the different phases, are available as CIF files at the Inorganic Structural Database. To facilitate comparison with previous results, elastic constants are reported for two crystallographic settings: (1) The conventional setting (e.g., Standards on Piezoelectric Crystals 1949; nye 1959; Matthies and
Wenk 2009) with an orthogonal coordinate system defined by Z→
||c→, Y→
||c→×a→, and X→
= Y
→×Z→
and (2) a setting where the Z→
is perpendicular to the tetrahedral planes (001) in both monoclinic and triclinic crystal structures: X
→||a→, Z
→||a→×b→, and Y
→ = Z
→×X
→. The
latter choice preserves the direction of C33 when comparing different stackings in kaolinite polytypes that have different c→ axes.
Model SySteMS
MuscoviteMuscovite KAl2[AlSi3O10](OH)2 is a 2:1 sheet silicate, with
each layer comprising an octahedral sheet fused between two tetrahedral sheets (Fig. 1). Due to isomorphic substitution, it exhibits structural disorder in the tetrahedral sheets (Collins and Catlow 1992), with 25% of sites occupied by Al3+ cations and 75% by Si4+ cations. This leads to the layers having a net nega-tive charge, which is balanced by K+ anions residing between the layers.
Since it is possible that cation disorder will affect the elastic properties of the phase, we performed first-principles calculations to determine the most favorable arrangements.
Isomorphic substitution of Si4+ by Al3+, in the tetrahedral sheets, creates a local negative charge in the region of the Al3+ cation. It is therefore reasonable to assume that Al3+ cations within the same tetrahedral layer, will tend to repel one another. Our calculations support this. For an 84 atom unit cell, placing two Al3+ cations in the same tetrahedral sheet increases the energy by 1–2 eV, while placing all four Al3+ cations in the same sheet increases it by 7 eV. Calculations for heterogeneous distributions in larger super cells showed a similar trend. This provides a strong argument for having similar Al3+ cation concentrations in each layer, to reduce unfavorable interactions between them.
If one considers the conventional unit cell, assuming an equal Al3+ concentration in each layer, there is only one Al3+ cation to distribute among four sites. Every site is energetically equivalent and leads to the formation of a Si4+-Al3+ chain parallel to the b lattice vector (Fig. 2a). However, a more favorable cation dis-tribution is obtained if one considers a simulation cell compris-ing two unit cells (Fig. 2b). This allows Al3+ ions to be placed across the silicate rings and thus decrease Al3+-Al3+ interactions. Monte Carlo simulations using larger super cells, with up to 36 substitution sites, found the same arrangement of cations to be most favorable. In these calculations the optimization criteria was to maximize the distance between the Al3+ sites or alternatively minimize the Ewald energy.
However, doubling the size of the simulation cell would make first-principles calculations of the elastic constants of muscovite prohibitively expensive. We consequently used the configuration shown in Figure 2a for all calculations of elastic properties. Even for this configuration, there is still considerable structural freedom, because one can choose a different site for the Al3+ cation in each layer. However the energy differences arising from such permutations is relatively small (~0.07 eV per unit cell) compared to that possible with different concentrations in the layers (1–2 eV), because of the increased separation and screening of intermediate layers.
Out of the 44 ways to distribute four Al3+ ions equally among the four layers, we selected eleven configurations that either had a very low Ewald energy or the Al3+ ion separations were especially large. For those eleven geometries, we relaxed the

MILITZEr ET AL.: AB InITIO CALCULATIOn OF ELASTIC MODULI OF SHEET SILICATES 127
atomic positions and unit cell with GGA at ρPGG
=0A. Six of the
eleven relaxed structures were low in energy, within 0.07 eV per unit cell, which is a range that one would expect for a disordered mineral. For all six structures, we obtained very similar elastic constants, reported in Table 1. This leads us to conclude that cation disorder has very little impact on the elastic properties of muscovite. The largest deviations are seen in model 4 (Fig. 2), which has lower elastic constants mainly because the relaxation at zero-pressure led to a slightly lower density.
Illite-smectiteVarious structural models have been proposed for illite-
smectite minerals (Moore and reynolds 1989; Sakharov et al. 1999; Plançon et al. 1985; Drits et al. 1994; Watanabe 1988). They contain mixed layers of illite and swelling layers of smectite that cause systematic peak shifts in X-ray powder patterns. The interstratification of illite and smectite changes from random alternation to full segregation. Contrary to muscovite, illite-smectites exhibit a wide range of compositions with significant na, Ca, and Mg interlayers. Their exploration goes beyond the scope of this work; instead we adopted an idealized structural model put forth by Stixrude and Peacor (2002).
Figure 1. Muscovite. Comparison of Al3+ disorder models 1 and 4 reported in Table 1. The light and dark tetrahedra represent the Al3+
and Si4+ cation locations, respectively. The structure has been extended beyond the unit cell (marked by thin lines) for clarity but the Al3+:Si4+
ratio is the same in both structures. The spheres denote K+ ions and the octahedra mark the remaining Al3+ cations.
Figure 2. Sheets of tetrahedral cations in muscovite. The dark and light spheres indicate the Al3+ and Si4+ ions, respectively. The left panel shows the lowest energy confi guration for a 1:3 Al:Si ratio within the conventional unit cell (rectangular box). On the right, the lowest energy confi guration among all unit cells.
Table 1. Elastic constants of muscovite calculated at zero pressure with GGA, in the conventional setting, Z
→||c
→
Model 1 2 3 4 5 6E-E1 (eV) 0 0.007 0.016 0.042 0.054 0.072ρ (g/cm3) 2.682 2.683 2.688 2.675 2.690 2.689C11 172.7 172.8 173.1 167.9 169.7 170.6C22 166.7 166.9 167.7 158.6 167.0 165.6C33 54.8 54.8 55.1 53.0 55.0 54.7C44 14.2 14.3 14.7 9.4 14.9 15.2C55 17.2 17.3 17.4 15.5 16.8 16.5C66 67.6 67.6 67.8 66.5 67.5 67.5C12 48.8 48.8 49.2 43.8 48.0 48.6C13 20.1 20.2 20.4 17.7 20.6 20.5C15 –17.7 –17.7 –17.6 –18.4 –17.3 –16.7C23 17.4 17.5 17.9 14.2 18.0 18.5C25 –1.7 –1.7 –1.7 –4.2 –1.8 –1.5C35 –3.3 –3.2 –3.2 –4.9 –3.0 –2.5C46 –4.4 –4.4 –4.5 –5.0 –4.1 –4.0Notes: Each column corresponds to a model with a different tetrahedral Al3+/Si4+ cation arrangement. The energy differences with respect to model 1 are also given on line 2 in eV per 84 atom unit cell. One can see that cation disorder has little effect on the elastic properties of the phase.

MILITZEr ET AL.: AB InITIO CALCULATIOn OF ELASTIC MODULI OF SHEET SILICATES128
Illite-smectites are similar in structure to muscovite, in that they are composed of aluminosilicate layers, formed from an octahedral sheet fused between two tetrahedral sheets (2:1 sheet silicate; Fig. 3), however, the arrangement of cations in the tetra-hedral layers is quite distinct. Just as one would assume from their name, illite-smectites are interstratified minerals that comprise alternate layers of illite and smectite. In the present work, we investigate one of the simplest illite-smectites known as rectorite, where the illite layer has a structure similar to muscovite and the smectite layer has the pyrophyllite structure. Two types of interstratification have been considered by Stixrude and Peacor (2002): layer centered (model A) and interlayer centered (model B). In model A, alternate layers of illite and smectite, identical to those found in the mineral end-members, are stacked in sequence. However in model B, each layer is identical and comprises one aluminum-poor and one aluminum-rich tetrahedral sheet; the up-down alternation of these layers leads to two different interlayer environments: one enclosed by low-charge tetrahedral sheets and the other by high-charge tetrahedral sheets, where potassium anions reside. Theoretical calculations have shown that interlayer centered interstratification is more favorable than layer centered models (Stixrude and Peacor 2002). For our calculations of elastic properties we adopted the interlayer centered structure model B of Stixrude and Peacor (2002), with a chemical composition of K0.5Al2[Al0.5Si3.5]O10(OH)2, which corresponds to a 1:1 ratio of illite and smectite, with each layer possessing one aluminum-free tetrahedral sheet and one where 25% of sites are filled by Al3+
cations. This model differs from the natural smectite mineral rectorite (e.g., Zhang et al. 2009) in that all interlayer cations are assumed to be potassium, as oppose to a mixture of sodium, calcium, and potassium and no interlayer water is included.
Kaolin mineralsKaolinite is a 1:1 sheet silicate, i.e., tetrahedral layers are only
on one side of the octahedral sheet. Its ideal structural form is triclinic with two Al2Si2O5(OH)4 formula units per unit cell and a simple 1M stacking sequence (Bish 1993; neder et al. 1999) that is shown in Figures 3 and 4. However, natural kaolinites, in sedimentary rocks exhibit considerable stacking polytypism and disorder (Bailey 1963, 1988; Kogure et al. 2002, 2005). Stack-ing polytypism of hydrous sheet silicates has been analyzed in detail by Bailey et al. (1988) who identified 12 standard types. Stacking polytypism in kaolin minerals has also been investigated by Zvyagin and Drits (1996). Artioli et al. (1995) went beyond the 12 standard types by developing a random stacking model, which significantly improved agreement with powder diffraction patterns of natural kaolinites. Dera et al. (2003) studied pressure-induced changes in the stacking behavior. A comprehensive recent review of the stacking polytypism in kaolin minerals is given by Mercier and Le Page (2008), who also provide an extensive set of structural data derived from GGA calculations. Sato et al. (2004) and Balan et al. (2005) have also investigated structural details with ab initio calculations.
In this paper, we begin our calculations of elastic constants with the ideal kaolinite structure and compare with the work by Sato et al. (2005). To estimate the effects of stacking polytyp-ism we then compare these with values for three polytypes of kaolinite that have two layers in their unit cell: dickite, nacrite, and an alternate kaolinite structure.
Dickite exhibits a 2M stacking sequence, where the vacancy in octahedral site alternates between two sites leading to a monoclinic two-layer supercell (Bailey et al. 1988). Such an arrangement leads to increased interlayer binding. According to our DFT calculations, it lowers the energy by 0.01 eV per formula unit relative to the ideal kaolinite structure. For our sec-ond example of a two-layer mineral, we chose to look at nacrite because it occurs in nature and its structure has been determined
◄Figure 3. (left) Illite-smectite model with a chemical composition of K0.5Al2[Al0.5Si3.5]O10(OH)2, which corresponds to a 1:1 illite-smectite ratio. Each layer is identical and comprises one aluminum-free tetrahedral sheet and one where 25% of sites are fi lled by Al3+ cations. The up-down alternation of these layers leads to two different interlayer environments, one enclosed by low-charge tetrahedral sheets and the other by high-charge tetrahedral sheets, where potassium anions reside. (right) Ideal kaolinite structure where the unit cell has been doubled in c→ direction. notation is the same as Figure 1.

MILITZEr ET AL.: AB InITIO CALCULATIOn OF ELASTIC MODULI OF SHEET SILICATES 129
experimentally (Zheng and Bailey 1994; Zhukhlistov 2008). As our final example of two-layer stacking, we generated a new structure (labeled 2M* throughout this paper) by doubling the unit cell of ideal kaolinite, rotating the new layer by 120° and shifting it by a/3. We selected this particular structure, among other possible shifts and rotations, because it shows favorable interlayer hydrogen bonding, which is confirmed by the com-puted energy that is again lowered by 0.01 eV per formula unit, relative to ideal kaolinite.
nacrite stands out because it has the largest offset between adjacent layers (Fig. 4), which weakens the hydrogen bonding. The accurate characterization of hydrogen bonds is difficult experimentally because hydrogen is a weak X-ray scatterer but also challenging for density functional theory because of its weak binding forces. Zheng and Bailey (1994) pointed out that one of the three OH groups may not participate in the interlay-ing bonding and that is what we found when we relaxed the structures with LDA and GGA regardless which experimental geometry we started from. During the relaxation, the outer OH
group tilts into the plane of the layer, preventing it from forming a bond with upper layer. Balan et al. (2005) identified this tilt and explained it as a result of the shorted Si-O bond in nacrite that was observed theoretically and experimentally. This tilt was not reported by Sato et al. (2005) but it was investigated by Benco et al. (2001) who performed finite temperature DFT molecular dynamics simulations of kaolinite to compare calculated and measured OH stretching frequencies.
The stacking sequence in all four structures is illustrated in Figure 4 where, for clarity, we only show the positions of the tetragonal Si4+ and octahedral Al3+ cations along with the unit cell. Studying larger structures would lead to prohibitively expensive first-principles calculations.
reSultS
Structural parametersFor muscovite, we obtained fairly good agreement with
the lattice parameters determined in X-ray diffraction experi-
a
b
cd
Figure 4. Stacking polytypism in ideal kaolinite (a), dickite (b), nacrite (c), and an additional structure (2M*, d). Only the Si4+ ions (dark) and the Al3+ (light) are shown for simplicity. The view direction is perpendicular to the sheets and a shading has been added to the lower Si4+ layer. The thin lines denote the unit cell.

MILITZEr ET AL.: AB InITIO CALCULATIOn OF ELASTIC MODULI OF SHEET SILICATES130
ments (Table 2). Vaughan and Guggenheim (1986) reported: a = 5.1579(9), b = 8.9505(8), c = 20.071(5) Å, and β = 95.75(2)° while with GGA at ρP
G=G0A we find a = 5.238+0
–0.0.0
0703, b = 9.131(0)
–0.014, c = 20.723+0
–0.0.0
3045, and β = 95.56+0
–0.1.6
55, where we give the results for
our lowest energy structure and report the deviations from them, by the remaining five structures from Table 1 as uncertainty. The Si-Al disorder has little impact on the structural parameters, as expected. The disagreement with experiment is largest for the lattice parameter c because of the relatively weak binding in this direction. LDA shows better agreement with experiment than GGA. It should be noted that the sample used by Vaughan and Guggenheim (1986) exhibited a slightly different composition, K0.9Al2.8Si3.1O12H2.1 compared to the ideal composition that we adopted. Computations at ρP
EX=0
P are consequently performed at the experimental unit-cell volume rather than the mass density but we still refer to as ρP
EX=0
P for consistency. The agreement of the lattice parameter then becomes very good, confirming that the effect on ionic substitution in the Vaughan-Guggenheim sample is small.
For illite-smectite, we cannot directly adopt an experimental density because no explicit experimental data exist for our ideal-ized rectorite model. We thus estimate the density to be 2.825 g/cm3 by averaging of the experimental values for the unit-cell volume of muscovite and pyrophyllite (Table 3).
For ideal kaolinite, the calculated lattice parameters in Table 4 are in reasonable agreement with the measurements of neder et al. (1999) although the zero-pressure density is underestimated by 4% with GGA and overestimated by 4% with LDA.
Our structural parameters for dickite also slightly deviate from the theoretical work of Sato et al. (2004). As seen for ideal kaolinite in Table 4, we again predict a smaller sheet separation, but larger lattice parameters within the sheets. Our value for the angle β of 96.62° is in much better agreement with measured values of 96.48° by Bish and Johnston (1993) and 96.77° by Dera et al. (2003) than 104.57° reported by Sato et al. (2004).
In the case of nacrite, the lattice parameters computed with GGA at ρP
GG=0
A are in reasonable agreement with measurements by Zhukhlistov et al. (2008): a = 8.910, b = 5.144, c = 14.593 Å, and β = 100.50° and again the density is underestimated by 4%. It should be noted that, relative to kaolinite, the a and b axis are swapped. The computed energy is 0.01 eV per formula unit lower than that for ideal kaolinite.
Elastic propertiesTable 2 compares our elastic constants calculated for musco-
vite with LDA and GGA with the experimental results of Vaughan and Guggenheim (1986). Elastic constants determined with LDA at ρP
LD=0
A are stiffer than those calculated at the measured density, ρP
EX=0
P, predominantly because LDA overestimates the density. However, elastic constants from LDA calculations at ρP
EX=0
P are in very good agreement with experiment. The interlayer spac-ing, and consequently stiffness, in the direction perpendicular to the layers, C33, is most sensitive to changes in density. GGA yields good agreement with experimental elastic constants, when calculated at ρP
GG=0
A, but overestimates values at ρPEX
=0P.
The computed elastic constants for our illite-smectite model are shown in Table 3. Similar predictions are obtained for C11 and C22 with LDA at ρP
LD=0
A and GGA at ρPGG
=0A, but the values for
C33 differ substantially (i.e., LDA: 67.9 and GGA: 19.6 GPa). This reflects the fact that LDA overestimates the density and the interlayer binding while GGA underestimates both. The elastic constants from LDA and GGA computations for the estimated density of 2.825 g/cm3 are also compared in Table 3. We consider that LDA calculations, e.g., C33 = 27.2 GPa, to be our most ac-curate prediction for elastic properties of illite-smectite because, for muscovite, GGA overestimated C33 when the experimental density was used. In general, it will remain challenging for exist-ing density functional techniques to predict C33 accurately for weakly bonded sheet silicates in cases where the composition and structure of the interlayers is variable and poorly defined.
Tables 4 and 5 summarize the computed elastic constant for the kaolin group minerals. Similar to muscovite, we also determined values at ρP
EX=0
P in addition to calculating LDA and GGA results at ρP
LD=0
A and ρPGG
=0A. Comparison of our calculated
elastic constants with those of Sato et al. (2005) reveals sizable discrepancies that are much larger than one would expect from
Table 2. Elastic constants of muscovite model 1 in the conventional set-ting Z
→||c
→ calculated with GGA and LDA at different densities LDA LDA LDA LDA GGA GGA Experiment PLDA = 0 (a,b,c,β)EXP V = VEXP V = VEXP PGGA = 0 V (Å3) 904.5 917.2 921.9 921.9 921.9 984.3 921.9(3)a (Å) 5.140 5.150 5.1579 5.154 5.187 5.244 5.1579(9)b (Å) 8.925 8.945 8.9505 8.952 9.012 9.101 8.9505(8)c (Å) 19.806 19.998 20.071 20.073 19.818 20.713 20.071(5)β (°) 95.48 95.44 95.75 95.43 95.61 95.39 95.75(2)C11 187.5 182.7 180.3 180.9 194.3 170.1 181.0 ± 1.2C22 178.1 172.3 169.9 170.0 188.0 162.1 178.4 ± 1.3C33 71.5 62.7 60.1 60.3 91.1 55.6 58.6 ± 0.6C44 22.1 19.9 19.1 18.4 25.2 14.4 16.5 ± 0.6C55 28.1 25.0 22.4 23.8 30.5 17.8 19.5 ± 0.5C66 71.7 71.1 70.6 70.5 71.3 67.6 72.0 ± 0.7C12 59.8 55.1 53.3 53.4 68.1 47.4 48.8 ± 2.5C13 34.8 29.1 27.1 27.2 43.2 20.6 25.6 ± 1.5C15 –15.4 –14.7 –14.3 –14.7 –14.3 –14.1 –14.2 ± 0.8C23 31.0 25.6 23.6 23.5 39.5 18.2 21.2 ± 1.8C25 1.8 1.5 2.3 1.4 1.7 –0.8 1.1 ± 3.7C35 –0.7 –1.0 0.6 –1.0 1.1 0.0 1.0 ± 0.6C46 –0.7 –1.9 –1.8 –1.8 –0.6 –3.3 –5.2 ± 0.9Note: Those calculated with LDA at the experimental unit-cell volume in column 4 (bold) are in best agreement with the experimental values of Vaughan and Guggenheim (1986) in the last column.
Table 3. Elastic constants of illite-smectite in the conventional set-ting Z
→||c
→
LDA PLDA = 0 LDA GGA GGA PGGA = 0ρ (g/cm3) 2.923 2.8247 2.8247 2.600a (Å) 5.130 5.156 5.197 5.259b (Å) 8.861 8.905 8.964 9.066c (Å) 19.738 20.205 19.943 21.116α (°) 89.99 89.71 89.92 90.02β (°) 106.08 105.94 106.25 105.74γ (°) 89.95 89.94 89.96 89.95C11 165.5 153.9 169.1 150.0C22 197.8 188.5 202.8 191.2C33 67.9 27.2 82.3 19.6C44 18.6 10.4 10.5 6.9C55 35.9 24.8 37.0 19.1C66 56.3 55.4 56.4 54.3C12 31.3 25.1 37.4 32.0C13 25.8 13.2 33.4 16.9C15 –23.5 –30.3 –24.4 –36.0C23 18.8 5.2 24.9 8.3C25 –6.9 –8.2 –6.9 –9.6C35 –3.2 –5.4 –0.2 –1.9C46 –15.6 –15.9 –16.7 –15.0Note: Our most reliable results are in bold.
MILITZEr ET AL.: AB InITIO CALCULATIOn OF ELASTIC MODULI OF SHEET SILICATES 131
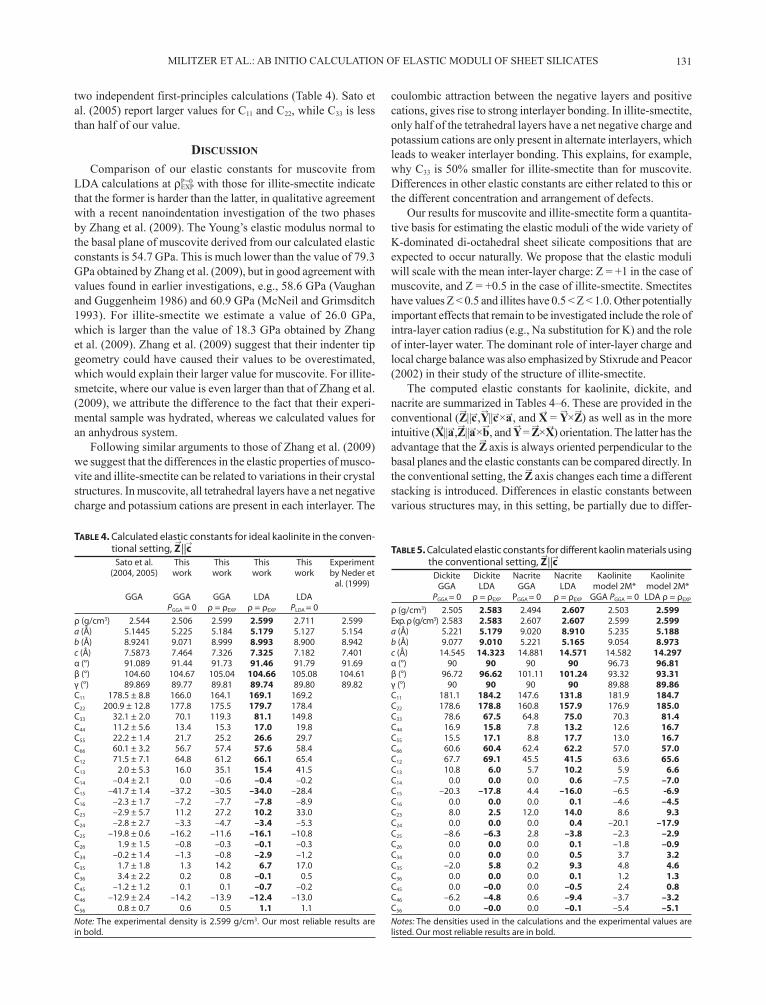
two independent first-principles calculations (Table 4). Sato et al. (2005) report larger values for C11 and C22, while C33 is less than half of our value.
diScuSSion
Comparison of our elastic constants for muscovite from LDA calculations at ρP
EX=0
P with those for illite-smectite indicate that the former is harder than the latter, in qualitative agreement with a recent nanoindentation investigation of the two phases by Zhang et al. (2009). The Young’s elastic modulus normal to the basal plane of muscovite derived from our calculated elastic constants is 54.7 GPa. This is much lower than the value of 79.3 GPa obtained by Zhang et al. (2009), but in good agreement with values found in earlier investigations, e.g., 58.6 GPa (Vaughan and Guggenheim 1986) and 60.9 GPa (Mcneil and Grimsditch 1993). For illite-smectite we estimate a value of 26.0 GPa, which is larger than the value of 18.3 GPa obtained by Zhang et al. (2009). Zhang et al. (2009) suggest that their indenter tip geometry could have caused their values to be overestimated, which would explain their larger value for muscovite. For illite-smetcite, where our value is even larger than that of Zhang et al. (2009), we attribute the difference to the fact that their experi-mental sample was hydrated, whereas we calculated values for an anhydrous system.
Following similar arguments to those of Zhang et al. (2009) we suggest that the differences in the elastic properties of musco-vite and illite-smectite can be related to variations in their crystal structures. In muscovite, all tetrahedral layers have a net negative charge and potassium cations are present in each interlayer. The
coulombic attraction between the negative layers and positive cations, gives rise to strong interlayer bonding. In illite-smectite, only half of the tetrahedral layers have a net negative charge and potassium cations are only present in alternate interlayers, which leads to weaker interlayer bonding. This explains, for example, why C33 is 50% smaller for illite-smectite than for muscovite. Differences in other elastic constants are either related to this or the different concentration and arrangement of defects.
Our results for muscovite and illite-smectite form a quantita-tive basis for estimating the elastic moduli of the wide variety of K-dominated di-octahedral sheet silicate compositions that are expected to occur naturally. We propose that the elastic moduli will scale with the mean inter-layer charge: Z = +1 in the case of muscovite, and Z = +0.5 in the case of illite-smectite. Smectites have values Z < 0.5 and illites have 0.5 < Z < 1.0. Other potentially important effects that remain to be investigated include the role of intra-layer cation radius (e.g., na substitution for K) and the role of inter-layer water. The dominant role of inter-layer charge and local charge balance was also emphasized by Stixrude and Peacor (2002) in their study of the structure of illite-smectite.
The computed elastic constants for kaolinite, dickite, and nacrite are summarized in Tables 4–6. These are provided in the conventional (Z
→||c→,Y
→||c→×a→, and X→ = Y
→×Z→
) as well as in the more intuitive (X→||a→,Z
→||a→×b
→, and Y
→ = Z
→×X→) orientation. The latter has the
advantage that the Z→
axis is always oriented perpendicular to the basal planes and the elastic constants can be compared directly. In the conventional setting, the Z
→ axis changes each time a different
stacking is introduced. Differences in elastic constants between various structures may, in this setting, be partially due to differ-
Table 4. Calculated elastic constants for ideal kaolinite in the conven-tional setting, Z
→||c
→
Sato et al. This This This This Experiment (2004, 2005) work work work work by Neder et al. (1999) GGA GGA GGA LDA LDA PGGA = 0 ρ = ρEXP ρ = ρEXP PLDA = 0 ρ (g/cm3) 2.544 2.506 2.599 2.599 2.711 2.599a (Å) 5.1445 5.225 5.184 5.179 5.127 5.154b (Å) 8.9241 9.071 8.999 8.993 8.900 8.942c (Å) 7.5873 7.464 7.326 7.325 7.182 7.401α (°) 91.089 91.44 91.73 91.46 91.79 91.69β (°) 104.60 104.67 105.04 104.66 105.08 104.61γ (°) 89.869 89.77 89.81 89.74 89.80 89.82C11 178.5 ± 8.8 166.0 164.1 169.1 169.2 C22 200.9 ± 12.8 177.8 175.5 179.7 178.4 C33 32.1 ± 2.0 70.1 119.3 81.1 149.8 C44 11.2 ± 5.6 13.4 15.3 17.0 19.8 C55 22.2 ± 1.4 21.7 25.2 26.6 29.7 C66 60.1 ± 3.2 56.7 57.4 57.6 58.4 C12 71.5 ± 7.1 64.8 61.2 66.1 65.4 C13 2.0 ± 5.3 16.0 35.1 15.4 41.5 C14 –0.4 ± 2.1 0.0 –0.6 –0.4 –0.2 C15 –41.7 ± 1.4 –37.2 –30.5 –34.0 –28.4 C16 –2.3 ± 1.7 –7.2 –7.7 –7.8 –8.9 C23 –2.9 ± 5.7 11.2 27.2 10.2 33.0 C24 –2.8 ± 2.7 –3.3 –4.7 –3.4 –5.3 C25 –19.8 ± 0.6 –16.2 –11.6 –16.1 –10.8 C26 1.9 ± 1.5 –0.8 –0.3 –0.1 –0.3 C34 –0.2 ± 1.4 –1.3 –0.8 –2.9 –1.2 C35 1.7 ± 1.8 1.3 14.2 6.7 17.0 C36 3.4 ± 2.2 0.2 0.8 –0.1 0.5 C45 –1.2 ± 1.2 0.1 0.1 –0.7 –0.2 C46 –12.9 ± 2.4 –14.2 –13.9 –12.4 –13.0 C56 0.8 ± 0.7 0.6 0.5 1.1 1.1 Note: The experimental density is 2.599 g/cm3. Our most reliable results are in bold.
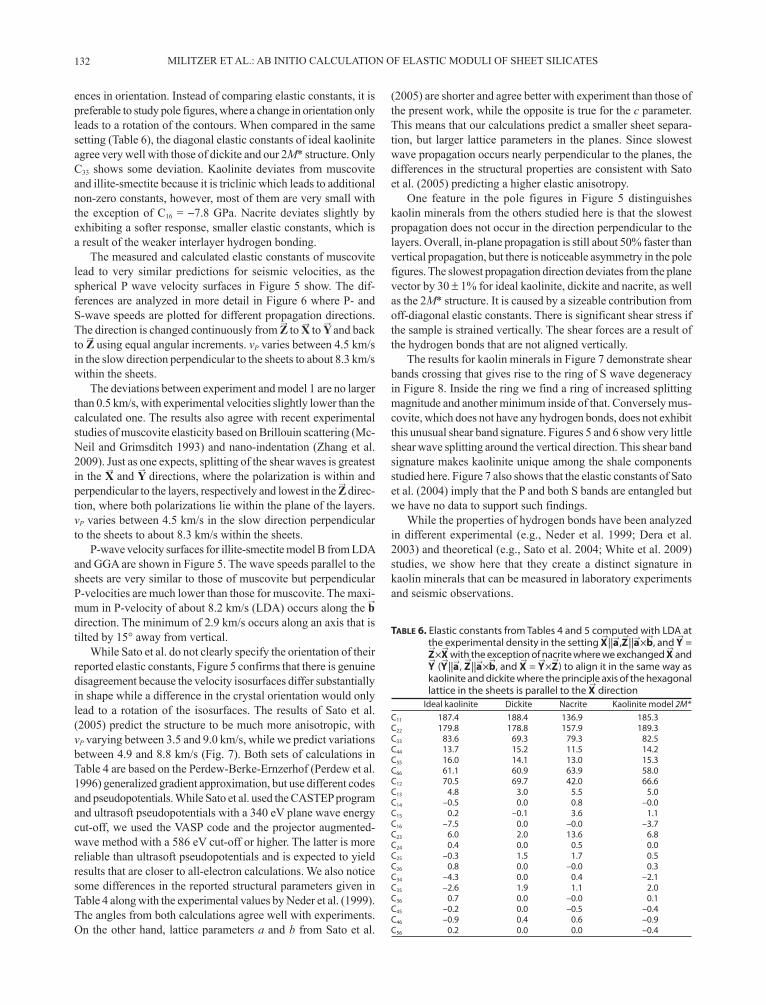
Table 5. Calculated elastic constants for different kaolin materials using the conventional setting, Z
→||c→
Dickite Dickite Nacrite Nacrite Kaolinite Kaolinite GGA LDA GGA LDA model 2M* model 2M* PGGA = 0 ρ = ρEXP PGGA = 0 ρ = ρEXP GGA PGGA = 0 LDA ρ = ρEXP
ρ (g/cm3) 2.505 2.583 2.494 2.607 2.503 2.599Exp. ρ (g/cm3) 2.583 2.583 2.607 2.607 2.599 2.599a (Å) 5.221 5.179 9.020 8.910 5.235 5.188b (Å) 9.077 9.010 5.221 5.165 9.054 8.973c (Å) 14.545 14.323 14.881 14.571 14.582 14.297α (°) 90 90 90 90 96.73 96.81β (°) 96.72 96.62 101.11 101.24 93.32 93.31γ (°) 90 90 90 90 89.88 89.86C11 181.1 184.2 147.6 131.8 181.9 184.7C22 178.6 178.8 160.8 157.9 176.9 185.0C33 78.6 67.5 64.8 75.0 70.3 81.4C44 16.9 15.8 7.8 13.2 12.6 16.7C55 15.5 17.1 8.8 17.7 13.0 16.7C66 60.6 60.4 62.4 62.2 57.0 57.0C12 67.7 69.1 45.5 41.5 63.6 65.6C13 10.8 6.0 5.7 10.2 5.9 6.6C14 0.0 0.0 0.0 0.6 –7.5 –7.0C15 –20.3 –17.8 4.4 –16.0 –6.5 -6.9C16 0.0 0.0 0.0 0.1 –4.6 –4.5C23 8.0 2.5 12.0 14.0 8.6 9.3C24 0.0 0.0 0.0 0.4 –20.1 –17.9C25 –8.6 –6.3 2.8 –3.8 –2.3 –2.9C26 0.0 0.0 0.0 0.1 –1.8 –0.9C34 0.0 0.0 0.0 0.5 3.7 3.2C35 –2.0 5.8 0.2 9.3 4.8 4.6C36 0.0 0.0 0.0 0.1 1.2 1.3C45 0.0 –0.0 0.0 –0.5 2.4 0.8C46 –6.2 –4.8 0.6 –9.4 –3.7 –3.2C56 0.0 –0.0 0.0 –0.1 –5.4 –5.1Notes: The densities used in the calculations and the experimental values are listed. Our most reliable results are in bold.
MILITZEr ET AL.: AB InITIO CALCULATIOn OF ELASTIC MODULI OF SHEET SILICATES132
ences in orientation. Instead of comparing elastic constants, it is preferable to study pole figures, where a change in orientation only leads to a rotation of the contours. When compared in the same setting (Table 6), the diagonal elastic constants of ideal kaolinite agree very well with those of dickite and our 2M* structure. Only C33 shows some deviation. Kaolinite deviates from muscovite and illite-smectite because it is triclinic which leads to additional non-zero constants, however, most of them are very small with the exception of C16 = −7.8 GPa. nacrite deviates slightly by exhibiting a softer response, smaller elastic constants, which is a result of the weaker interlayer hydrogen bonding.
The measured and calculated elastic constants of muscovite lead to very similar predictions for seismic velocities, as the spherical P wave velocity surfaces in Figure 5 show. The dif-ferences are analyzed in more detail in Figure 6 where P- and S-wave speeds are plotted for different propagation directions. The direction is changed continuously from Z
→
to X→ to Y→
and back to Z
→ using equal angular increments. vP varies between 4.5 km/s
in the slow direction perpendicular to the sheets to about 8.3 km/s within the sheets.
The deviations between experiment and model 1 are no larger than 0.5 km/s, with experimental velocities slightly lower than the calculated one. The results also agree with recent experimental studies of muscovite elasticity based on Brillouin scattering (Mc-neil and Grimsditch 1993) and nano-indentation (Zhang et al. 2009). Just as one expects, splitting of the shear waves is greatest in the X→ and Y
→ directions, where the polarization is within and
perpendicular to the layers, respectively and lowest in the Z→
direc-tion, where both polarizations lie within the plane of the layers. vP varies between 4.5 km/s in the slow direction perpendicular to the sheets to about 8.3 km/s within the sheets.
P-wave velocity surfaces for illite-smectite model B from LDA and GGA are shown in Figure 5. The wave speeds parallel to the sheets are very similar to those of muscovite but perpendicular P-velocities are much lower than those for muscovite. The maxi-mum in P-velocity of about 8.2 km/s (LDA) occurs along the b
→
direction. The minimum of 2.9 km/s occurs along an axis that is tilted by 15° away from vertical.
While Sato et al. do not clearly specify the orientation of their reported elastic constants, Figure 5 confirms that there is genuine disagreement because the velocity isosurfaces differ substantially in shape while a difference in the crystal orientation would only lead to a rotation of the isosurfaces. The results of Sato et al. (2005) predict the structure to be much more anisotropic, with vP varying between 3.5 and 9.0 km/s, while we predict variations between 4.9 and 8.8 km/s (Fig. 7). Both sets of calculations in Table 4 are based on the Perdew-Berke-Ernzerhof (Perdew et al. 1996) generalized gradient approximation, but use different codes and pseudopotentials. While Sato et al. used the CASTEP program and ultrasoft pseudopotentials with a 340 eV plane wave energy cut-off, we used the VASP code and the projector augmented-wave method with a 586 eV cut-off or higher. The latter is more reliable than ultrasoft pseudopotentials and is expected to yield results that are closer to all-electron calculations. We also notice some differences in the reported structural parameters given in Table 4 along with the experimental values by neder et al. (1999). The angles from both calculations agree well with experiments. On the other hand, lattice parameters a and b from Sato et al.
(2005) are shorter and agree better with experiment than those of the present work, while the opposite is true for the c parameter. This means that our calculations predict a smaller sheet separa-tion, but larger lattice parameters in the planes. Since slowest wave propagation occurs nearly perpendicular to the planes, the differences in the structural properties are consistent with Sato et al. (2005) predicting a higher elastic anisotropy.
One feature in the pole figures in Figure 5 distinguishes kaolin minerals from the others studied here is that the slowest propagation does not occur in the direction perpendicular to the layers. Overall, in-plane propagation is still about 50% faster than vertical propagation, but there is noticeable asymmetry in the pole figures. The slowest propagation direction deviates from the plane vector by 30 ± 1% for ideal kaolinite, dickite and nacrite, as well as the 2M* structure. It is caused by a sizeable contribution from off-diagonal elastic constants. There is significant shear stress if the sample is strained vertically. The shear forces are a result of the hydrogen bonds that are not aligned vertically.
The results for kaolin minerals in Figure 7 demonstrate shear bands crossing that gives rise to the ring of S wave degeneracy in Figure 8. Inside the ring we find a ring of increased splitting magnitude and another minimum inside of that. Conversely mus-covite, which does not have any hydrogen bonds, does not exhibit this unusual shear band signature. Figures 5 and 6 show very little shear wave splitting around the vertical direction. This shear band signature makes kaolinite unique among the shale components studied here. Figure 7 also shows that the elastic constants of Sato et al. (2004) imply that the P and both S bands are entangled but we have no data to support such findings.
While the properties of hydrogen bonds have been analyzed in different experimental (e.g., neder et al. 1999; Dera et al. 2003) and theoretical (e.g., Sato et al. 2004; White et al. 2009) studies, we show here that they create a distinct signature in kaolin minerals that can be measured in laboratory experiments and seismic observations.
Table 6. Elastic constants from Tables 4 and 5 computed with LDA at the experimental density in the setting X
→||a→,Z
→||a→×b
→, and Y
→ =
Z→
×X→
with the exception of nacrite where we exchanged X→
and Y→
(Y→
||a→, Z→
||a→×b→
, and X→
= Y→
×Z→
) to align it in the same way as kaolinite and dickite where the principle axis of the hexagonal lattice in the sheets is parallel to the X
→ direction
Ideal kaolinite Dickite Nacrite Kaolinite model 2M*C11 187.4 188.4 136.9 185.3C22 179.8 178.8 157.9 189.3C33 83.6 69.3 79.3 82.5C44 13.7 15.2 11.5 14.2C55 16.0 14.1 13.0 15.3C66 61.1 60.9 63.9 58.0C12 70.5 69.7 42.0 66.6C13 4.8 3.0 5.5 5.0C14 –0.5 0.0 0.8 –0.0C15 0.2 –0.1 3.6 1.1C16 –7.5 0.0 –0.0 –3.7C23 6.0 2.0 13.6 6.8C24 0.4 0.0 0.5 0.0C25 –0.3 1.5 1.7 0.5C26 0.8 0.0 –0.0 0.3C34 –4.3 0.0 0.4 –2.1C35 –2.6 1.9 1.1 2.0C36 0.7 0.0 –0.0 0.1C45 –0.2 0.0 –0.5 –0.4C46 –0.9 0.4 0.6 –0.9C56 0.2 0.0 0.0 –0.4

MILITZEr ET AL.: AB InITIO CALCULATIOn OF ELASTIC MODULI OF SHEET SILICATES 133
Application to shale anisotropyAn important application of improved single-crystal elastic
properties of clay minerals is to polycrystal averages for shales. Shales are complex rocks, rich in sheet silicates. To estimate the contribution of the matrix to elastic properties, and particularly elastic anisotropy, we need to know volume fractions of constitu-ent minerals, their orientation distributions and single-crystal elastic properties. It has previously been observed that measured
acoustic wave velocities are much lower than those computed from matrix averaging. Is this difference due to reduced elastic properties of sheet silicates, such as illite-smectite, or is it caused by the pore structure that is not taken into account for the averag-ing? This was the motivation behind this study.
To demonstrate the application of the computed single-crystal properties to natural shales, we have chosen a well-characterized shale, composed mainly of detrital and authigenic illite, kaolinite, and quartz, with minor plagioclase, pyrite, and chlorite. The shale is of Kimmeridgian age (156–151 Ma) and from a drill core in the north Sea. Elastic properties were determined as a function of pressure with ultrasonic methods (Hornby 1998). The same sample was recently reinvestigated with synchrotron X-ray dif-fraction to quantify orientation distributions of component phases (Wenk et al. 2010). The Kimmeridge Clay shale shows strong preferred orientation of kaolinite, illite, and illite-smectite, and a nearly random orientation distribution for quartz. The pole figures in Figure 9 display nearly axial symmetry of orientation distributions. Therefore, strict axial symmetry was imposed in the following property calculations (transverse isotropy), reducing the number of independent components of the aggregate elastic tensor to five: C11 = C22, C33, C12 = C11 − 2C66, C13 = C23, C14 = C55 and all others are zero.
To estimate the elastic properties of the shale, first the elastic properties of contributing mineral phases were calculated by averaging their single-crystal values over the mineral orientation distributions, using a geometric mean (Matthies and Humbert 1993) in the software Beartex (Wenk et al. 1998). For single-crystal properties we used the LDA values at ρP
L=0DA for illite and
illite-smectite, and for kaolinite the LDA values for kaolinite. For quartz we used the experimental data of Heyliger et al. (2002). It should be mentioned that in these texture-related calculations
76.565.554.5
87.5
km/s
Figure 5. P wave velocity surfaces derived from elastic constants in Tables 2–5: Muscovite computed using model 1 and experimental results from Vaughan and Guggenheim (1986), illite-smectite comparison of LDA and GGA for ρ = 2.825 g/cm3, ideal kaolinite from Sato et al. and this work, and finally our results for dickite, nacrite and our 2M* stacking model, all calculated at ρP
EX=0
P using LDA. Equal area projections along the Z→
= [001] direction in the conventional setting, Z
→||c→, is used throughout.
Z X Y ZPropagation direction
2
3
4
5
6
7
8
Elas
tic w
ave
spee
d (k
m/s
)
ExperimentModel 1vp
vs1
vs2
Figure 6. Elastic wave velocities for muscovite disorder model 1 (Fig. 2) from Table 2 column 4 and experimental results from Vaughan and Guggenheim (1986) as function of propagation direction using the conventional setting, Z
→||c→.

MILITZEr ET AL.: AB InITIO CALCULATIOn OF ELASTIC MODULI OF SHEET SILICATES134
a consistent approach must be used for phases with monoclinic crystal symmetry. Beartex uses the first setting ([001] twofold axis) and corresponding transformations of lattice parameters, pole figure indices, and elastic constants are required (Matthies and Wenk 2009). In this paper we represent data in second setting ([010] twofold axis), even though all calculations were done in the first setting. For the bulk aggregate elastic constants of the contributing phases were averaged, taking into account corresponding volume fractions.
Table 7 lists aggregate elastic constants of the contributing phases, as well as the bulk average and experimental data from
Hornby (1998) measured at the maximum confining pressure of 80 MPa. In the bulk average, the porosity, estimated at 2.5%, was not taken into account. From aggregate elastic properties, P- and S-wave velocities were calculated and Figure 10 shows P-veloci-ties and shearwave splitting as function of the angle to the bed-ding plane. Illite and illite-smectite are strongly anisotropic (32 and 30%, respectively), combining strong preferred orientation and strong single-crystal anisotropy. The anisotropy of kaolinite is smaller because of reduced single-crystal anisotropy (16%) and the contribution of quartz to anisotropy is negligible.
note that using the new single-crystal elastic constants, the calculated values for the shale aggregate are still considerably higher than experimental results in Table 7 but the differences are less than in previous comparisons (Voltolini et al. 2009; Wenk et al. 2008). Particularly, using the illite-smectite results instead of muscovite reduces the value of C33 from 85.0 to 70.5 GPa, which is still much higher than the measured value of 36 GPa.
The discrepancy between measured and computed aggregate elastic moduli is likely due to the pore/fracture structure of the rock. There is an extensive literature that discusses the influence of pores (e.g., Bayuk et al. 2007; Berryman et al. 2002; Mukerji et al. 1995), fracture distribution (Sayers 1998) and saturation (Pham et al. 2002) on the elastic properties of shales. The ap-proach of the models is generally empirical since very little is known about the details of the pore structure and distribution and does not consider anisotropy. This may change in the future as micro- and nano-tomography techniques are becoming available to map the 3D pore structure (e.g., Bleuet et al. 2008; Herman 2009; Kanitpanyacharoen et al. 2011). recently Matthies (2010) proposed a self-consistent model based on the theory of Eshelby (1957) to include penny- or rod-shaped pores in a heterogeneous anisotropic medium and this could prove valuable for further
Z X Y Z0
1
2
3
4
5
6
7
8
9
This workSato et al.
Z X Y Z
Propagation direction
0
1
2
3
4
5
6
7
8
9
Elas
tic w
ave
spee
d (k
m/s
)
Nacrite
Ideal koalinite
Figure 7. Elastic wave speeds compared for ideal kaolinite and nacrite. The upper branch shows vP and the lower two show vS.
Z=[001]
Figure 8. Comparison of shear wave splitting in muscovite and ideal kaolinite. The latter exhibits a ring of nearly perfect degeneracy in shear wave velocity. The dashes indicate the direction of polarization of the fast shear wave.

MILITZEr ET AL.: AB InITIO CALCULATIOn OF ELASTIC MODULI OF SHEET SILICATES 135
quantifying elastic properties of shales. The important role of porosity in the elasticity of the experimental sample is further emphasized by its variation with confining pressure, which re-duces the anisotropy substantially due to closing of pores and/or cracks (Hornby 1998).
Even without a quantitative model the comparison of measured and calculated elastic properties reveals important information about the pore structure in Kimmeridge Clay shale. Since the relative difference between computed and measured aggregate moduli is much greater for C33 than for C11, pores must have very anisotropic shapes and alignment. The pattern suggests pores that are flattened and aligned in the bedding plane. The difference between computed and measured Cij could be used in principle to invert for the properties of a simple pore geometry model, such as one based on penny-shaped cracks, although this is beyond the scope of the present study. In the future we plan to investigate this shale by micro-tomography and use this informa-tion to average over both pores and matrix minerals. Combined with our new values of single-crystal elastic moduli we hope to obtain more reliable estimates of shale elasticity.
In summary, we have calculated the single-crystal elastic properties of the layered silicates muscovite, illite-smectite, kaolinite, dickite, and nacrite, from density functional theory. Our results suggest that, for dioctahedral sheet silicates, cation disorder has little effect on the elastic properties of individual aluminosilicate layers. For muscovite calculated elastic proper-ties are in excellent agreement with experiments. The elastic properties of naturally occurring clays depend on the degree and type of isomorphic substitution and interlayer cations, since it controls the strength of interlayer bonding. Those with higher mean inter-layer charge (e.g., illites) are expected to be stiffer then those with lower inter-layer charge (e.g., illite-smectites). In a similar manner, in the case of kaolin minerals, stacking arrangements that result in strong interlayer hydrogen bonding
(dickite) are expected to be stiffer than those where it is weak (nacrite). The calculated elastic properties of sheet silicate minerals provide a quantitative basis on which to discuss the elasticity of shales, which should be of great benefit for seismic prospecting of hydrocarbon deposits.
acknoWledgMentSB.M. and S.S. acknowledge support from nSF (CMG 0530282) and U.C.
Berkeley’s lab fee grant program. Teragrid and nCCS computers were used. H.r.W. acknowledges support from DOE-BES (DE-FG02-05Er15637), nSF (EAr-0337006), and the Esper Larsen Fund. We acknowledge access to the facilities of beamline 11-ID-C at APS AnL for texture measurements and Y. ren for assistance with the experiments. Brian Hornby (BP) kindly provided us with a sample of Kimmeridge Clay shale. We appreciate constructive reviews by nico de Koker and Manuel Sintubin that helped us improve the manuscript.
Table 7. Elastic constants for Hornby Kimmeridge shale (in GPa)Phase vol% C11 C33 C44 C12 C13 P velocity anisotropy (%)Illite-mica 26.7 118.2 81.2 30.6 36.8 33.3 18.7Illite-smectite 45.5 83.6 49 22.6 20.6 19.3 26.7Kaolinite 5.1 121.7 87.3 29.1 43.6 34.5 16.6Quartz 22.7 97.3 97.1 43.9 8.1 7.8 0Average 97.9 70.5 29.9 23.3 21.2 16.5Experiment 56.2 36.4 10.3 18.4 20.5 21.6
Figure 9. (001) pole figures for detrital illite, illite-smectite, kaolinite, and quartz in equal-area projections on the bedding plane. Contours are in multiples of a random distribution.
Figure 10. P-velocities (a) and shear wave splitting (b) vs. angle to bedding plane normal. The computed results for the components were averaged to compare with the experimental values for the aggregate (Hornby 1998).
Quartzlllitel/SKaoliniteAverageExp.
P ve
loci
ties
(km
/s)
Angle from bedding normal (deg.)0 10 20 30 40 50 60 70 80 90
7
6
5
4
3
a
Quartzlllitel/SKaoliniteAverageExp.
Angle from bedding normal (deg.)
0 10 20 30 40 50 60 70 80 90
700
600
500
400
300
200
100
0
ds
velo
citi
es (m
/s)
b

MILITZEr ET AL.: AB InITIO CALCULATIOn OF ELASTIC MODULI OF SHEET SILICATES136
reFerenceS cited Artioli, G., Bellotto, M., Gualtieri, A., and Pavese, A. (1995) nature of structural
disorder in natural kaolinites: A new model based on computer simulation of powder diffraction data and electrostatic energy calculation. Clays and Clay Minerals, 43, 438–445.
Bailey, S.W. (1963) Polymorphism of kaolin minerals. American Mineralogist, 48, 1196–1209.
——— (1988) Polytypism of 1:1 layer silicates. In S.W. Bailey, Ed., Hydrous Phyllosilicates (exclusive of mica), vol. 19, p. 9–27. reviews in Mineralogy, Mineralogical Society of America, Chantilly, Virginia.
Balan, E., Lazzeri, M., Saitta, A.M., Allard, T., Fuchs, Y., and Mauri, F. (2005) First-principles study of OH-stretching modes in kaolinite, dickite, and nacrite. American Mineralogist, 90, 50–60.
Banik, n.C. (1984) Velocity anisotropy of shales and depth estimation in the north Sea basin. Geophysics, 49, 1411–1419.
Barruol, G. and Kern, H. (1996) Seismic anisotropy and shear-wave splitting in lower-crustal and upper-mantle rocks from the Ivrea Zone—experimental and calculated data. Physics of the Earth and Planetary Interiors, 95, 175–194.
Bayuk, I.O., Ammerman, M., and Chesnokov, E.M. (2007) Elastic moduli of anisotropic clay. Geophysics, 72, D107–D117.
Benco, L., Tunega, D., Hafner, J., and Lischka, H. (2001) Orientation of OH groups in kaolinite and dickite: Ab initio molecular dynamics study. American Mineralogist, 86, 1057–1065.
Berryman, J.G., Pride, S.r., and Wang, H.F. (2002) A differential scheme for elastic properties of rocks with dry or saturated cracks. Geophysical Journal International, 151, 597–611.
Bish, D.L. (1993) rietveld refinement of the kaolinite structure at 1.5 K. Clays and Clay Minerals, 41, 738–744.
Bish, D.L. and Johnston, C.T. (1993) rietveld refinement and Fourier-transform infrared spectroscopic study of the dickite structures at low temperature. Clay and Clay Minerals, 41, 297–304.
Bleuet, P., Welcomme, E., Dooryhee, E., Susini, J., Hodeau, J.-L., and Walter, P. (2008) Probing the structure of heterogeneous diluted materials by diffraction tomography. nature Materials, 7, 468–472.
Blöchl, P.E. (1994) Projector augmented-wave method. Physical review B, 50, 17953–17979.
Bunge, H.-J. (1985) Physical properties of polycrystals. In H.r. Wenk, Ed., Pre-ferred Orientation in Deformed Metals and rocks: An introduction to modern texture analysis, p. 507–525. Academic Press, Orlando.
Chadwick, r.A., Zweigel, P., Gregersenc, U., Kirby, G.A., Holloway, S., and Johan-nessen, P.n. (2004) Geological reservoir characterization of a CO2 storage site: The Utsira Sand, Sleipner, northern north Sea. Energy, 29, 1371–1381.
Chen, B. and Evans, J.r.G. (2006) Elastic moduli of clay platelets. Scripta Ma-terialia, 54, 1581–1585.
Collins, D.r. and Catlow, C.r.A. (1992) Computer simulation study of structures and cohesive properties of mica. American Mineralogist, 77, 1172–1181.
Dera, P., Prewitt, C.T., Japel, S., Bish, D.L., and Johnston, C.T. (2003) Pressure-controlled polytypism in hydrous layered materials. American Mineralogist, 88, 1428–1435.
Drits, V.A., Varaxina, T.V., Sakharov, B.A., and Plançon, A. (1994) A simple tech-nique for identification of one-dimensional powder X-ray diffraction patterns for mixed-layer illite-smectites and other interstratified minerals. Clays and Clay Minerals, 42, 382–390.
Eshelby, J.D. (1957) The determination of the elastic field of an ellipsoidal inclu-sion and related problems. Proceedings of the royal Society, London, Series A241, 376–396.
Herman, G.T. (2009) Fundamentals of computerized tomography: Image recon-struction from projection, 2nd ed. Springer, Berlin.
Heyliger, P., Ledbetter, H., and Kim, S. (2002) Elastic constants of natural quartz. Journal of Acoustical Society of America, 114, 644–650.
Hornby, B.E. (1998) Experimental laboratory determination of the dynamic elastic properties of wet, drained shales. Journal of the Geophysical research, 103 (B12), 29945–29964.
Hornby, B.E., Schwartz, L.M., and Hudson, J.A. (1994) Anisotropic effective-medi-um modeling of the elastic properties of shales. Geophysics, 59, 1570–1583.
Johansen, T.A., ruud, B.O., and Jakobsen, M. (2004) Effect of grain scale align-ment on seismic anisotropy and reflectivity of shales. Geophysical Prospect-ing, 52, 133–149.
Johnston, J.E. and Christensen, n.I. (1995) Seismic anisotropy of shales. Journal of Geophysical research, 100, 5991–6003.
Kanitpanyacharoen, W., Wenk, H.-r., Kets, F., and Lehr, B.C. (2011) Texture and anisotropy analysis of Qusaiba shales. Geophysical Prospecting, in press.
Karki, B.B. Stixrude, L., and Wentzcovitch, r.M. (2001) Elastic properties of major materials of Earth’s mantle from first principles, reviews of Geophys-ics, 39, 507–534.
Karki, r.B., Stixrude, J.L., Clark, S.J., Arren, M.C.W., Ackland, I.G.J., and Crain, J. (1997a) Structure and elasticity of MgO at high pressure. American Mineralogist, 82, 51–60.
——— (1997b) Elastic properties of orthorhombic MgSiO3 perovskite at lower mantle pressures. American Mineralogist, 82, 635–638.
Kresse, G. and Furthmüller, J. (1996) Efficient iterative schemes for ab initio total-energy calculations using a plane-wave basis set. Physical reviews B, 54, 11169.
Kresse, G. and Hafner, J. (1993) Ab initio molecular dynamics for liquid metals. Physical reviews B, 47, rC558–561.
Kogure, T. (2002) Identification of polytypic groups in hydrous phyllosilicates using electron back-scattering patterns (EBSPs). American Mineralogist, 87, 1678–1685.
Kogure, T., Inoue, A., and Beaufort, D. (2005) Polytype and morphology analyses of kaolin minerals by electron back-scattered diffraction. Clays and Clay Minerals, 53, 201–210.
Mainprice, D. and Humbert, M. (1994) Methods of calculating petrophysical properties from lattice preferred orientation data. Surveys in Geophysics, 15, 575–592.
Mainprice, D., Le Page, Y., rodgers, J., and Jouanna, P. (2008) Ab initio elastic properties of talc from 0 to 12 GPa: Interpretation of seismic velocities at mantle pressures and prediction of auxetic behavior at low pressure. Earth and Planetary Science Letters, 274, 327–338.
Matthies, S. (2010) On the combination of self-consistent and geometric mean elements for the calculation of the elastic properties of textured multi-phase samples. Solid State Phenomena, 160, 87–93.
Matthies, S. and Humbert, M. (1993) The realization of the concept of a geometric mean for calculating physical constants of polycrystalline materials. Physica Status Solidi, B177, K47–K50.
Matthies, S. and Wenk, H.-r. (2009) Transformations for monoclinic crystal sym-metry in texture analysis. Journal of Applied Crystallography, 42, 564–571.
Mavko, G., Mukerji, T., and Dvorkin, J. (1998) The rock Physics Handbook. Cambridge University Press, new York.
Mcneil, L.E. and Grimsditch, M. (1993) Elastic moduli of muscovite mica. Journal of Physics, Condensed Matter, 5, 1681–1690.
Mercier, P.H.J. and Le Page, Y. (2008) Kaolin polytypes revisited ab inition. Acta Crystallographica, B64, 131–143.
Monkhorst, H.J. and Pack, J.D. (1976) Special points for Brillouin-zone integra-tions. Physical review B, 13, 5188–5192.
Moore, D.M. and reynolds, r.C. (1989) X-ray diffraction and the identification and analysis of clay minerals. Oxford University Press, new York, 332 p.
Mukerji, T., Berryman, J., Mavko, G., and Berge, P. (1995) Differential effective medium modeling of rock elastic moduli with critical porosity constraints. Geophysical research Letters, 22, 555–558.
neder, r.B., Burghammer, M., Grasl, T.Z., Schulz, H., Bram, A., and Fiedler, S. (1999) refinement of the kaolinite structure from single-crystal synchrotron data. Clays and Clay Minerals, 47, 487–494.
nye, J.F. (1959) Physical Properties of Crystals. Clarendon Press, Oxford. Ougier-Simoni, A., Sarout, J., and Gueguen, Y. (2008) A simplified model of
effective elasticity for anisotropic shales: From laboratory to field data. Geophysics, 74, D57–63.
Perdew, J.P., Burke, K., and Ernzerhof, M. (1996) Generalized gradient approxima-tion made simple. Physical reviews Letters, 77, 3865.
Pham, N.H., Carcione, J.M., Helle, H.B., and Ursin, B. (2002) Wave velocities and attenuation of shaley sandstones as a function of pore pressure and partial saturation. Geophysical Prospecting, 50, 615–627.
Plançon, A., Tsipurski, S.I., and Drits, V.A. (1985) Calculation of intensity dis-tribution in the case of oblique texture electron diffusion. Journal of Applied Crystallography, 18, 191–196.
Ponte Castaneda, P. and Willis, J.r. (1995) The effect of spatial distribution on the effective behaviour of composite materials and cracked media. Journal of the Mechanics and Physics of Solids, 43, 1919–1951.
Prasad, M., Kopycinska, M., rabe, U., and Arnold, W. (2002) Measurement of Young’s modulus of clay minerals using atomic force acoustic microscopy. Geophysical research Letters, 29, 1–4.
ravindran, P., Fast, L., Korzhavyi, M., and Johansson, B. (1998) Density functional theory for calculation of elastic properties of orthorhombic crystals: Applica-tions to TiSi2. Journal of Applied Physics, 84, 4891–4904.
Sakharov, B.A., Lindgreen, H., Salyn, A., and Drits, V.A. (1999) Determination of illite-smectite structures using multispecimen X-ray diffraction profile fitting. Clays and Clay Minerals, 47, 555–566.
Sato, H., Ono, K., Johnston, C.T., and Yamagishi, A. (2004) First-principles study of 1:1 dioctahedral phyllosilicates. American Mineralogist, 89, 1581–1585.
——— (2005) First-principles studies on elastic constants of a 1:1 layered kaolinite mineral. American Mineralogist, 90, 1824–1826.
Sayers, C.M. (1994) The elastic anisotropy of shales. Journal of Geophysical research, 99, 767–774.
——— (1998) Misalignment of the orientation of fractures and the principal axes for P and S waves in rocks containing multiple non-orthogonal fracture sets. Geophysical Journal International, 133, 459–466.
Standards on Piezoelectric Crystals (1949) Proceedings of The Institute of radio Engineers, 49, 1378–1395.

MILITZEr ET AL.: AB InITIO CALCULATIOn OF ELASTIC MODULI OF SHEET SILICATES 137
Stixrude, L. and Peacor, D.r. (2002) First-principles study of illite-smectite and implications for clay mineral systems. nature, 420, 165–168.
Valcke, S.L.A., Casey, M., Lloyd, G.E., Kendall, J.-M., and Fisher, Q.J. (2006) Lattice preferred orientation and seismic anisotropy in sedimentary rocks. Geophysical Journal International, 166, 652–666.
Vaughan, M.T. and Guggenheim, S. (1986) Elasticity of muscovite and its relation-ship to crystal structure. Journal of Geophysical research, 91, 4657–4664.
Voltolini, M., Wenk, H.-r., Mondol, n.H., Bjørlykke, K., and Jahren, J. (2009) Anisotropy of experimentally compressed kaolinite-illite-quartz mixtures. Geophysics, 74, D13–D23.
Wang, Z., Wang, H., and Cates, M.E. (2001) Effective elastic properties of solid clays. Geophysics, 66 428–440.
Watanabe, T. (1988) Structural model of illite/smectite interstratified minerals and the diagram for their interstratification. Clay Science, 7, 97–114.
Wenk, H.-r., Matthies, S., Donovan, J., and Chateigner, D. (1998) BEArTEX, a Windows-based program system for quantitative texture analysis. Journal of Applied Crystallography, 31, 262–269.
Wenk, H.-r., Voltolini, M., Kern, H., Popp, T., and Mazurek, M. (2008) Anisotropy in shale from Mont Terri. The Leading Edge, 27, 742–748.
Wenk, H.-r., Kanitpanyacharoen, W., and Voltolini, M. (2010) Preferred orienta-tions of phyllosilicates: Comparison of fault gouge, shale and schist. Journal
of Structural Geology, 32, 478–489.White, C.E., Provis, J.L., riley, D.P., Kearley, G.J., and van Deventer, J.S.J. (2009)
What is the structure of kaolinite? reconciling theory and experiment. Journal of Physical Chemistry, B, 113, 6756.
Zhang, G., Wei, Z., and Ferrell, r.E. (2009) Elastic modulus and hardness of muscovite and rectorite determined by nanoindentation. Applied Clay Sci-ence, 43, 271–282.
Zheng, H. and Bailey, S.W. (1994) refinement of the nacrite structure. Clays and Clay Minerals, 42, 46–52.
Zhukhlistov, A.P. (2008) Crystal structure of nacrite from the electron diffraction data. Crystallography reports, 53, 76–82.
Zvyagin, B.B. and Drits, V.A. (1996) Interrelated features of structure and stacking of kaolin mineral types. Clays and Clay Minerals, 44, 297–303.
Manuscript received March 16, 2010Manuscript accepted august 3, 2010Manuscript handled by Florian heidelbach