Finite element modelling of composite structures under...
14
Finite element modelling of composite structures under crushing load Louis N.S. Chiu a,b , Brian G. Falzon c,⇑ , Romain Boman d , Bernard Chen a , Wenyi Yan a a Monash University, Department of Mechanical and Aerospace Engineering, Clayton Campus, Victoria 3800, Australia b Cooperative Research Centre for Advanced Composite Structures, 1/320 Lorimer Street, Port Melbourne, Victoria 3207, Australia c Queen’s University Belfast, School of Mechanical and Aerospace Engineering, Belfast, BT9 5AH, UK d University of Liège, Aerospace and Mechanical Engineering Department, 1 chemin des, Chevreuils, 4000 Liège, Belgium article info Article history: Available online 9 May 2015 Keywords: Damage mechanics Finite element analysis Non-linear behaviour Crushing response Energy absorption Structure failure abstract This paper details the theory and implementation of a composite damage model, addressing damage within a ply (intralaminar) and delamination (interlaminar), for the simulation of crushing of laminated composite structures. It includes a more accurate determination of the characteristic length to achieve mesh objectivity in capturing intralaminar damage consisting of matrix cracking and fibre failure, a load-history dependent material response, an isotropic hardening nonlinear matrix response, as well as a more physically-based interactive matrix-dominated damage mechanism. The developed damage model requires a set of material parameters obtained from a combination of standard and non-standard material characterisation tests. The fidelity of the model mitigates the need to manipulate, or ‘‘calibrate’’, the input data to achieve good agreement with experimental results. The intralaminar damage model was implemented as a VUMAT subroutine, and used in conjunction with an existing interlaminar damage model, in Abaqus/Explicit. This approach was validated through the simulation of the crushing of a cross-ply composite tube with a tulip-shaped trigger, loaded in uniaxial compression. Despite the complexity of the chosen geometry, excellent correlation was achieved with experimental results. Ó 2015 Elsevier Ltd. All rights reserved. 1. Introduction Over recent years, there has been a concerted effort by civil airframe manufacturers to develop lighter aerostructures with reduced operating costs. This has driven the increased use of carbon fibre reinforced polymer (CFRP) materials in the primary structure of the latest generation of passenger aircraft. As a result, there has been a considerable focus [1–4] on investigating the energy absorbing characteristics of CFRP to determine the crashworthiness of composite aerostructures. Composite materials offer superior potential as energy absorbers due to their high specific strength and the multitude of possible different energy-dissipating damage modes of matrix cracking, fibre failure and delamination [5]. However, the effective design of these energy absorbers is a complex undertaking due to the difficulty in predicting the multiple concurrent failure modes and their interactions. This lack of robustness and predictive capability of current numerical modelling tools, has meant that the crashworthiness assessment of composite subcomponents currently relies heavily on physical testing which is both time consuming and expensive. Energy absorbing structures with varying geometries have been extensively investigated in the literature. Typically, self-supporting geometries have been adopted for practical applications [6], including tube and tube-like structures [7–9], channel sections [10,11], as well as corrugated webs [12,13]. In particular, circular tubes have been studied extensively [14,15] to determine the effects of composition [16], layup [17], and trigger mecha- nism[18,19]. Analysis of loading on a typical section of material in a crushing structure is highly complex and three-dimensional. Much of the existing computational damage models available in commercial finite element packages, which track the initiation and evolution of damage through a structure, have been developed using plane stress shell elements. These elements assume that through thickness stresses are negligible, which does not hold true for structures being crushed. One example is material model type 54 (Mat54), a shell-based formulation implemented in LS-DYNA [20] utilising an approach developed by Chang and Chang [21]. Mat54 was used by Ghasemnejad et al. [22] and Feraboli et al. [23] to capture closed and open-sectioned specimen crushing, respectively. To achieve good correlation with experimental data, the input parameters were determined by trial and error [23]. Similarly, the ply type 7 model, based on Ladeveze and Le Dantec’s [24] work, implemented for PAM-CRASH was used by Joosten et al. [4] and Johnson and David [1] to simulate the http://dx.doi.org/10.1016/j.compstruct.2015.05.008 0263-8223/Ó 2015 Elsevier Ltd. All rights reserved. ⇑ Corresponding author. Tel.: +44 (0)28 9097 5640. E-mail address: [email protected] (B.G. Falzon). Composite Structures 131 (2015) 215–228 Contents lists available at ScienceDirect Composite Structures journal homepage: www.elsevier.com/locate/compstruct
-
Upload
dinhnguyet -
Category
Documents
-
view
214 -
download
0
Transcript of Finite element modelling of composite structures under...
Composite Structures 131 (2015) 215–228
Contents lists available at ScienceDirect
Composite Structures
journal homepage: www.elsevier .com/locate /compstruct
Finite element modelling of composite structures under crushing load
http://dx.doi.org/10.1016/j.compstruct.2015.05.0080263-8223/� 2015 Elsevier Ltd. All rights reserved.
⇑ Corresponding author. Tel.: +44 (0)28 9097 5640.E-mail address: [email protected] (B.G. Falzon).
Louis N.S. Chiu a,b, Brian G. Falzon c,⇑, Romain Boman d, Bernard Chen a, Wenyi Yan a
a Monash University, Department of Mechanical and Aerospace Engineering, Clayton Campus, Victoria 3800, Australiab Cooperative Research Centre for Advanced Composite Structures, 1/320 Lorimer Street, Port Melbourne, Victoria 3207, Australiac Queen’s University Belfast, School of Mechanical and Aerospace Engineering, Belfast, BT9 5AH, UKd University of Liège, Aerospace and Mechanical Engineering Department, 1 chemin des, Chevreuils, 4000 Liège, Belgium
a r t i c l e i n f o a b s t r a c t
Article history:Available online 9 May 2015
Keywords:Damage mechanicsFinite element analysisNon-linear behaviourCrushing responseEnergy absorptionStructure failure
This paper details the theory and implementation of a composite damage model, addressing damagewithin a ply (intralaminar) and delamination (interlaminar), for the simulation of crushing of laminatedcomposite structures. It includes a more accurate determination of the characteristic length to achievemesh objectivity in capturing intralaminar damage consisting of matrix cracking and fibre failure, aload-history dependent material response, an isotropic hardening nonlinear matrix response, as well asa more physically-based interactive matrix-dominated damage mechanism. The developed damage modelrequires a set of material parameters obtained from a combination of standard and non-standard materialcharacterisation tests. The fidelity of the model mitigates the need to manipulate, or ‘‘calibrate’’, the inputdata to achieve good agreement with experimental results. The intralaminar damage model wasimplemented as a VUMAT subroutine, and used in conjunction with an existing interlaminar damagemodel, in Abaqus/Explicit. This approach was validated through the simulation of the crushing of across-ply composite tube with a tulip-shaped trigger, loaded in uniaxial compression. Despite thecomplexity of the chosen geometry, excellent correlation was achieved with experimental results.
� 2015 Elsevier Ltd. All rights reserved.
1. Introduction
Over recent years, there has been a concerted effort by civilairframe manufacturers to develop lighter aerostructures withreduced operating costs. This has driven the increased use ofcarbon fibre reinforced polymer (CFRP) materials in the primarystructure of the latest generation of passenger aircraft. As a result,there has been a considerable focus [1–4] on investigating theenergy absorbing characteristics of CFRP to determine thecrashworthiness of composite aerostructures.
Composite materials offer superior potential as energyabsorbers due to their high specific strength and the multitude ofpossible different energy-dissipating damage modes of matrixcracking, fibre failure and delamination [5]. However, the effectivedesign of these energy absorbers is a complex undertaking due tothe difficulty in predicting the multiple concurrent failure modesand their interactions. This lack of robustness and predictivecapability of current numerical modelling tools, has meant thatthe crashworthiness assessment of composite subcomponentscurrently relies heavily on physical testing which is both timeconsuming and expensive.
Energy absorbing structures with varying geometries have beenextensively investigated in the literature. Typically, self-supportinggeometries have been adopted for practical applications [6],including tube and tube-like structures [7–9], channel sections[10,11], as well as corrugated webs [12,13]. In particular, circulartubes have been studied extensively [14,15] to determine theeffects of composition [16], layup [17], and trigger mecha-nism[18,19]. Analysis of loading on a typical section of materialin a crushing structure is highly complex and three-dimensional.Much of the existing computational damage models available incommercial finite element packages, which track the initiationand evolution of damage through a structure, have been developedusing plane stress shell elements. These elements assume thatthrough thickness stresses are negligible, which does not hold truefor structures being crushed. One example is material model type54 (Mat54), a shell-based formulation implemented in LS-DYNA[20] utilising an approach developed by Chang and Chang [21].Mat54 was used by Ghasemnejad et al. [22] and Feraboli et al.[23] to capture closed and open-sectioned specimen crushing,respectively. To achieve good correlation with experimental data,the input parameters were determined by trial and error [23].Similarly, the ply type 7 model, based on Ladeveze and LeDantec’s [24] work, implemented for PAM-CRASH was used byJoosten et al. [4] and Johnson and David [1] to simulate the

216 L.N.S. Chiu et al. / Composite Structures 131 (2015) 215–228
response of hat-shaped and C-shaped channel sections undercrushing loads. Similar to Mat54, some input parameters requiredsubstantial calibration against experimental test data in order forthis material model to produce the desired response, renderingthese models incapable of being a reliable predictive tool. Closeexamination of these results suggests that for damage-inducingloads, a 2D shell formulation is insufficient.
The complexity of composite crushing invariably results inhighly localised and rapid load redistribution and consequentlythe damage process needs to take into account the loading historyon the material. Much of the existing techniques do not properlyaccount for the effect of loading/unloading and load reversal,particularly for the inelastic shear behaviour of the matrixmaterial. Donadon et al. [25] and later Faggiani and Falzon [26]produced damage models which considered unloading andreloading behaviour. These two models were able to yield goodpredictions of the impact response for a simple composite plateand a stiffened composite panel, respectively, where the damagewas matrix-dominated. However, the differences in the anticipatedloading conditions between an impact and a crush event haveidentified limitations in these models. Puck and Schürmann [27]showed that the assessment of matrix damage requires considera-tion of local interactions which was incorporated into the work ofShi et al. [28] as well as many others. Raimondo et al. [29] used anenergy-based, interactive approach that took into account thecontribution of each loading direction to the overall energy balancewithin each element. However, the damage model did not accountfor loading and reloading which may have contributed to the overprediction of the force response during the impactor reboundphase after impact, while still in contact with the composite plate.Another issue with the model was the use of a crack saturationdensity parameter, which was obtained by trial and error, andhence is effectively a calibration parameter.
An accurate estimate of a characteristic length measure,associated with each finite element, is required to achieve meshindependence for a continuum damage mechanics (CDM) basedsmeared crack finite element (FE) damage model. Bazant and Oh[30] pioneered the concept of a crack band to prevent damagelocalisation, leading to zero energy dissipation, and preserve meshobjectivity in the FEA of softening material. Subsequent work byBazant and Cedolin [31] details localisation issues for differentclasses of constitutive laws, including CDM. Jirasek and Bazant[32] demonstrated the use for a characteristic length to scale thesoftening behaviour. The effectiveness of this approach has beenanalytically shown by Oliver [33]. Much of the existing compositedamage models use a coarse estimate of this quantity. The Abaqusin-built composite damage model, based on the work by
Table 1Summary of comparison between existing models and the present model.
Model Element formulation Robust characteristic len
Commercially available modelsPAM-CRASH ply type 7 [24] 2D NLS-DYNA Mat 54 [20] 2D NAbaqus hashin damage [39] 2D N
Recently published modelsDonadon et al. [25] 3D NFaggiani and Falzon [26] 3D NShi et al. [28] 3D NRaimondo et al. [29] 3D N
Present model 3D Y
⁄ Capable of accurately assessing characteristic length for a fracture plane in an arbitrary
Matzenmiller et al. [34], approximates the characteristic lengthas the cube root of the elemental volume, which is increasinglyinaccurate as the aspect ratio increases. Donadon et al.’s [25]model resolved this issue by calculating the characteristic lengthdirectly from the shape functions of the element, but withrestricted fracture plane orientations. Matrix failure in a non-zerodegree ply would generate a fracture plane that cannot berepresented using this method. A more general algorithm isrequired to determine the characteristic length for the full spec-trum of possible orientations of the fracture plane. (See Table 1).
This paper presents a finite-element based damage model,formulated for 3D solid elements and tailored for virtual crushtesting, which is able to capture the full suite of damage mecha-nisms and their interaction, within a continuous fibre laminatedcomposite structure. The proposed model presents numerousadvances over current approaches. Load history effects were incor-porated into the interaction of damage. In particular, the materialnonlinearity was accounted for during unloading and load rever-sals. A unified matrix damage mechanism was developed toaccount for the energy contributions under multi-axial loading. Arobust characteristic length algorithm for an arbitrarily orientedfracture plane was developed and incorporated. This damagemodel was combined with an established interlaminar damagemodel as well as friction models to form a complete package forthe simulation of damage in composite structures. The theoryand implementation of the intralaminar damage model is pre-sented in Section 2. The numerical results are compared withexperimental test data in Section 4, demonstrating the predictivecapability of the developed model.
2. Intralaminar damage model – theory and implementation
2.1. Theoretical foundations – quantifying damage effects in thematerial
The intralaminar damage model is based on continuum damagemechanics (CDM) for 3D stress states. CDM was first proposed byKachanov and was subsequently applied to micro-cracking in com-posite materials by Talreja [35], who proposed an energy-basedconstitutive relationship that includes the effect of damage forcomposite laminate plies through a homogenised damage fieldvector. Anisotropy in the laminate lead to the assignment of sepa-rate damage parameters for damage modes associated with eachdirection [36]. Developments by Chaboche [37] and Lemaitre[38], lead to a method to determine the behaviour of a materialunder damage-inducing loads. CDM assumes that before macro-scopic fracture occurs, microscopic cracks and voids form within
gth⁄ Nonlinear shear Load reversal Damageinteraction
Fibre Matrix
N N N NN N N NN N Y Y
Y Unloading/ reloading only Y YY Unloading/ reloading only N YY N Y YY N Y Y
Y Y Y Y
orientation with respect to both the material and the elemental coordinate system.

L.N.S. Chiu et al. / Composite Structures 131 (2015) 215–228 217
the material being loaded [38], causing a reduction in the effectiveload bearing area which, for the 1-D case, can be quantified by adamage parameter:
d ¼ A� eAA
ð1Þ
where A is the pristine load bearing area and eA is the reduced loadbearing area in the presence of microscopic damage. The damageparameter from different damage modes combine to form thedamage matrix ½D� which relates the stress vector in the damagedmaterial, r, to the effective stress vector, ~r, which would have beenexperienced by the material, had damage not occurred.
r ¼ ½D�~r ð2Þ
Operating on the assumption of strain equivalence, the
degraded stiffness matrix, ½eC�, of the damaged material may beexpressed as a function of the pristine material stiffness [C],
½eC� ¼ ½D�½C� ð3Þ
which leads to a softening of the material once damage has initi-ated. As more energy is dissipated via damage formation in thematerial, the load-bearing capacity of the material reduces. Thetransmitted stress reduces to zero when the volumetric strainenergy dissipated, g, reaches a critical value, signifying the completefailure of the material. This point is defined by the failure strain,efailure:Z efailure
0rde ¼ g ð4Þ
Damage must be irreversible to ensure that its formation is thermo-dynamically consistent. Hence any damage parameter must bemonotonically increasing. Damage mechanisms present within aunidirectional continuous fibre ply are captured by three damageparameters; two to account for the tension and compression infibre-dominated damage and one for matrix-dominated damage.This is discussed in more detail in Section 2.2.3. To capture thewhole structural response to damage inducing loads on laminatedcomposite structures, an existing cohesive damage model is utilisedin conjunction with the developed intralaminar model.
Fig. 1. Flowchart showing the processes w
2.2. Detailed theory and implementation of the damage model
The intralaminar damage model captures damage in a continu-ous fibre unidirectional composite ply which is either fibre- ormatrix-dominated (Fig. 1). Fibre-dominated damage is primarilyassociated with loading along the fibre direction. The anticipateddamage will occur in the form of net fibre breakage in tensionand predominantly fibre kink- band formation when loaded incompression. Matrix-dominated damage is primarily associatedwith transverse and shear loading which leads to plasticity and for-mation of cracks in the matrix material. The use of this 3D FEmethod necessitates the determination of a characteristic lengthto correctly scale the critical energy density.
2.2.1. Characteristic length calculation2.2.1.1. The role of the characteristic length in achieving meshobjectivity. When the strain energy density within an elementexceeds g, it no longer transmits loading and is deemed to havefailed. g is intrinsically linked to the critical energy release rate,G, the energy required to create a unit area of fracture surface,which can be measured experimentally. G and g are related by acharacteristic length where different fracture modes have differentenergy release rates and corresponding characteristic lengths, lmode.Through the characteristic length, g is scaled so that different meshdensities return the same total energy absorption at fracture.
Oliver [33] showed that by estimating the crack size within theelement, a proper characteristic length ðlmodeÞ can be deduced toscale the experimentally determined critical energy release rate
Gdirmode
� �to the critical volumetric strain energy gdir
mode
� �for a given
mode and direction:
gdirmode ¼
Gdirmode
lmodeð5Þ
Oliver’s analysis was performed on a 2D grid. An effective cracklength was calculated according to how the crack partitions the ele-ment. From this, the characteristic length was calculated as theratio between the area of the element and the effective crack length.This method was shown to be consistent with theoretical predic-tions for simple test cases. Generalising this concept to 3D yields:
ithin the intralaminar damage model.

Fig. 3. Fibre-dominated fracture with associated fracture plane.
218 L.N.S. Chiu et al. / Composite Structures 131 (2015) 215–228
lmode ¼VA
ð6Þ
The elemental volume ðVÞ can be obtained from the FE simulation.In calculating the crack area for an arbitrarily oriented crack surfaceðAÞ, the orientation of the material coordinate system, with respectto the element, and the rotation of the fracture plane must be takeninto consideration.
2.2.1.2. Implementation of the characteristic length calculation. Thefracture surface is defined by a unit normal vector ðnÞ in an arbi-trary hexahedral element (Fig. 2). This normal vector containsinformation about the material coordinate system as well as thefracture plane rotation.
The algorithm determines the points ðpkÞ where the fractureplane intersects with the elemental boundary formed by connect-ing adjacent nodes. The triangular areas ðAlÞ enclosed by adjacentintersection points ðpkÞ and the centre are then determined.Summing these, the total fracture plane area is approximated.This calculation is completed for each element in the model.
This procedure requires material coordinate system informa-tion as well as initial nodal coordinates of the elements, whichare not provided by the VUMAT input/output interface. This isresolved by reading the input file itself in the pre-processing stageto extract this information. All elements in the model are assignedinternal element numbers during the simulation process. An inter-nal Abaqus utility routine (vgetinternal) was used to match the ele-ment data obtained from the input file to the correct element.
One of the major advantages of this method is that it is able tooperate for models where the global, elemental and the materialcoordinate systems do not align, allowing greater freedom inhow the structure is meshed. Additional flexibility comes fromallowing each element to have an independent material coordinatesystem so that curved structures can be handled more accurately.It also enables the use of elements with a range of aspect ratioswithout significantly effecting accuracy.
Eight-node linear reduced integration solid elements, with oneintegration point at the centroid, are used in Abaqus/Explicit andconsequently the fracture plane is assumed to pass through thecentroid of each failed element. With further mesh refinement,an arbitrary macro-scale crack can be represented by a connectedseries of failed elements. It is also assumed that the element doesnot become concave. This is appropriate because built into the FEpackage [39] is a mechanism to prevent elements from becominginverted.
2.2.2. Modelling fibre-dominated damageFibre-dominated damage represents the damage, which affects
the longitudinal behaviour of a unidirectional prepreg (Fig. 3).In tension, this manifests as the breakage and pull out of fibres
from the surrounding matrix. On the other hand, compressivedamage causes the fibres to buckle and break during the formationof kink bands. The tensile and compressive characteristics areconsiderably different. Hence a separate damage parameter is
Fibres parallel to this plane
Fig. 2. Definition of unit normal vector ðnÞ and points of edge intersection ðpkÞ foran arbitrary fracture plane (shaded) within a hexahedral element.
defined for each mode. To determine the softening of thelongitudinal modulus due to damage, the effects of tensile andcompressive damage are combined.
2.2.2.1. Damage initiation. The point of damage initiation for thefibre-dominated mode is found by comparing the strain to thedamage initiation strain (eOT
11 and eOC11 for tension and compression,
respectively). An initiation function (FT11 and FC
11 for tension andcompression, respectively) is defined for both tensile and compres-sive loading as follows:
FT=Cfib ¼
e11
eOT=OC11
!2
ð7Þ
where the initiation strains are determined from the longitudinalelastic modulus (E11) and strengths in tension and compression(XT and XC respectively).
eOT=OC11 ¼ XT=C
E11ð8Þ
When the initiation function for any damage mode reaches unity,the initiation criterion is met and the damage begins to propagate.
2.2.2.2. Damage evolution. A bilinear response is assumed for bothtensile (Fig. 4) and compressive loading in the fibre direction.The bilinear model is appropriate for fibre dominated tension asit has brittle behaviour but it is an approximation for fibredominated compression. Other criteria, such as the fibremisalignment shear stress kinking model [40], give a moreaccurate damage initiation strength in compression. However,the initiation strength is not as important as the total energy con-sumption of the damage process, which is the basis for the pro-posed model. Hence the bilinear model is a compromise betweensimplicity and accuracy when used to represent fibre compression.
A positive linear stiffness describes the stress–strain behaviourprior to damage initiation. After initiation, the tangent modulusbecomes negative due to the degradation of the elastic modulus
Fig. 4. Bilinear stress–strain law (shaded area is the critical volumetric strainenergy release rate gT
fib) and associated damage parameter growth (bold dashedline).
L.N.S. Chiu et al. / Composite Structures 131 (2015) 215–228 219
by the damage parameter ðdfibÞ according to Eq. (3). The tensile
fibre-dominated damage parameter dT11
� �is found by comparing
the current strain ðe11Þ with the failure strain eFT11
� �:
dT11 e11ð Þ ¼ eFT
11
eFT11 � eOT
11
1� eOT11
e11
� �ð9Þ
The tensile failure strain eFT11
� �is determined by combining Eqs. (4)
and (5), and is a function of the fibre-dominated tensile critical
energy release rate GTfib
� �and the corresponding characteristic
length ðlfibÞ.
eFT11 ¼
2GTfib
XT lfib
¼2gT
fib
XT ð10Þ
The fibre tensile critical energy release rate GTfib
� �is found
experimentally, representing the energy consumed in creating anarea of crack under uniaxial tensile loading in the longitudinaldirection. Scaling GT
fib with the characteristic length yields the
corresponding critical volumetric energy density, gTfib.
The same approach is applied for compressive loading, whichleads to:
dC11 e11ð Þ ¼ eFC
11
eFC11 � eOC
11
1� eOC11
e11
� �ð11Þ
eFC11 ¼
2GCfib
XClfib
¼2gC
fib
XC ð12Þ
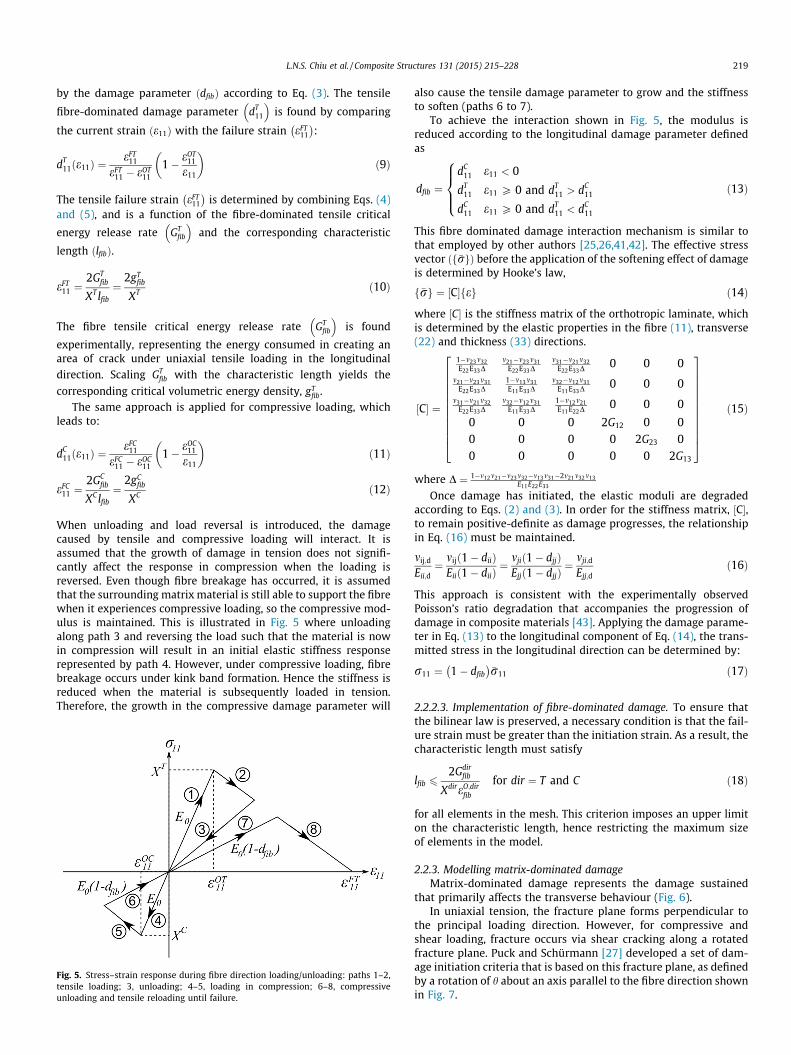
When unloading and load reversal is introduced, the damagecaused by tensile and compressive loading will interact. It isassumed that the growth of damage in tension does not signifi-cantly affect the response in compression when the loading isreversed. Even though fibre breakage has occurred, it is assumedthat the surrounding matrix material is still able to support the fibrewhen it experiences compressive loading, so the compressive mod-ulus is maintained. This is illustrated in Fig. 5 where unloadingalong path 3 and reversing the load such that the material is nowin compression will result in an initial elastic stiffness responserepresented by path 4. However, under compressive loading, fibrebreakage occurs under kink band formation. Hence the stiffness isreduced when the material is subsequently loaded in tension.Therefore, the growth in the compressive damage parameter will
Fig. 5. Stress–strain response during fibre direction loading/unloading: paths 1–2,tensile loading; 3, unloading; 4–5, loading in compression; 6–8, compressiveunloading and tensile reloading until failure.
also cause the tensile damage parameter to grow and the stiffnessto soften (paths 6 to 7).
To achieve the interaction shown in Fig. 5, the modulus isreduced according to the longitudinal damage parameter definedas
dfib ¼dC
11 e11 < 0
dT11 e11 P 0 and dT
11 > dC11
dC11 e11 P 0 and dT
11 < dC11
8>><>>: ð13Þ
This fibre dominated damage interaction mechanism is similar tothat employed by other authors [25,26,41,42]. The effective stressvector ðf�rgÞ before the application of the softening effect of damageis determined by Hooke’s law,
f�rg ¼ ½C�feg ð14Þ
where ½C� is the stiffness matrix of the orthotropic laminate, whichis determined by the elastic properties in the fibre (11), transverse(22) and thickness (33) directions.
½C� ¼
1�m23m32E22E33D
m21�m23m31E22E33D
m31�m21m32E22E33D 0 0 0
m21�m23m31E22E33D
1�m13m31E11E33D
m32�m12m31E11E33D 0 0 0
m31�m21m32E22E33D
m32�m12m31E11E33D
1�m12m21E11E22D 0 0 0
0 0 0 2G12 0 00 0 0 0 2G23 00 0 0 0 0 2G13
266666666664
377777777775ð15Þ
where D ¼ 1�m12m21�m23m32�m13m31�2m21m32m13E11E22E33
Once damage has initiated, the elastic moduli are degradedaccording to Eqs. (2) and (3). In order for the stiffness matrix, C½ �,to remain positive-definite as damage progresses, the relationshipin Eq. (16) must be maintained.
mij;d
Eii;d¼ mijð1� diiÞ
Eiið1� diiÞ¼ mjið1� djjÞ
Ejjð1� djjÞ¼ mji;d
Ejj;dð16Þ
This approach is consistent with the experimentally observedPoisson’s ratio degradation that accompanies the progression ofdamage in composite materials [43]. Applying the damage parame-ter in Eq. (13) to the longitudinal component of Eq. (14), the trans-mitted stress in the longitudinal direction can be determined by:
r11 ¼ 1� dfib
� ��r11 ð17Þ
2.2.2.3. Implementation of fibre-dominated damage. To ensure thatthe bilinear law is preserved, a necessary condition is that the fail-ure strain must be greater than the initiation strain. As a result, thecharacteristic length must satisfy
lfib 62Gdir
fib
XdireO;dirfib
for dir ¼ T and C ð18Þ
for all elements in the mesh. This criterion imposes an upper limiton the characteristic length, hence restricting the maximum sizeof elements in the model.
2.2.3. Modelling matrix-dominated damageMatrix-dominated damage represents the damage sustained
that primarily affects the transverse behaviour (Fig. 6).In uniaxial tension, the fracture plane forms perpendicular to
the principal loading direction. However, for compressive andshear loading, fracture occurs via shear cracking along a rotatedfracture plane. Puck and Schürmann [27] developed a set of dam-age initiation criteria that is based on this fracture plane, as definedby a rotation of h about an axis parallel to the fibre direction shownin Fig. 7.
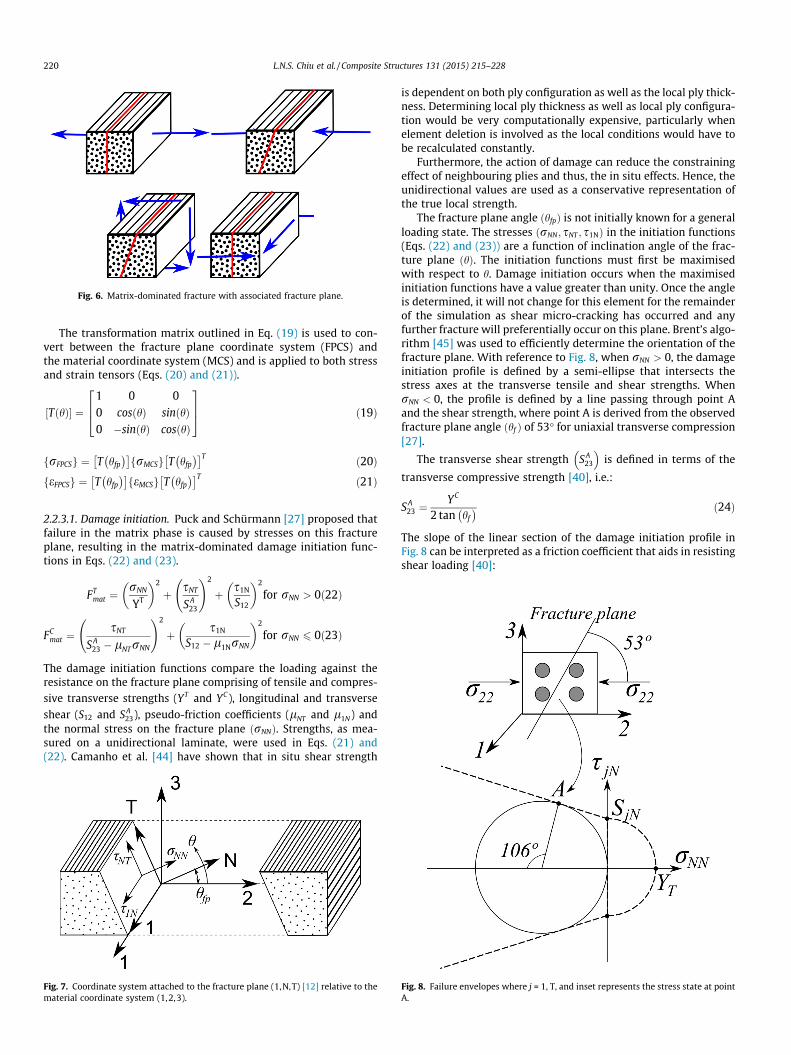
Fig. 6. Matrix-dominated fracture with associated fracture plane.
220 L.N.S. Chiu et al. / Composite Structures 131 (2015) 215–228
The transformation matrix outlined in Eq. (19) is used to con-vert between the fracture plane coordinate system (FPCS) andthe material coordinate system (MCS) and is applied to both stressand strain tensors (Eqs. (20) and (21)).
T hð Þ½ � ¼1 0 00 cosðhÞ sinðhÞ0 �sinðhÞ cosðhÞ
264375 ð19Þ
rFPCSf g ¼ T hfp
� �� rMCSf g T hfp
� �� T ð20Þ
eFPCSf g ¼ T hfp
� �� eMCSf g T hfp
� �� T ð21Þ
2.2.3.1. Damage initiation. Puck and Schürmann [27] proposed thatfailure in the matrix phase is caused by stresses on this fractureplane, resulting in the matrix-dominated damage initiation func-tions in Eqs. (22) and (23).
FTmat ¼
rNN
YT
� �2
þ sNT
S A23
!2
þ s1N
S12
� �2
for rNN > 0ð22Þ
FCmat ¼
sNT
S A23 � lNTrNN
!2
þ s1N
S12 � l1NrNN
� �2
for rNN 6 0ð23Þ
The damage initiation functions compare the loading against theresistance on the fracture plane comprising of tensile and compres-sive transverse strengths (YT and YC), longitudinal and transverse
shear (S12 and S A23), pseudo-friction coefficients (lNT and l1N) and
the normal stress on the fracture plane ðrNNÞ. Strengths, as mea-sured on a unidirectional laminate, were used in Eqs. (21) and(22). Camanho et al. [44] have shown that in situ shear strength
Fig. 7. Coordinate system attached to the fracture plane (1,N,T) [12] relative to thematerial coordinate system (1,2,3).
is dependent on both ply configuration as well as the local ply thick-ness. Determining local ply thickness as well as local ply configura-tion would be very computationally expensive, particularly whenelement deletion is involved as the local conditions would have tobe recalculated constantly.
Furthermore, the action of damage can reduce the constrainingeffect of neighbouring plies and thus, the in situ effects. Hence, theunidirectional values are used as a conservative representation ofthe true local strength.
The fracture plane angle ðhfpÞ is not initially known for a generalloading state. The stresses ðrNN; sNT ; s1NÞ in the initiation functions(Eqs. (22) and (23)) are a function of inclination angle of the frac-ture plane ðhÞ. The initiation functions must first be maximisedwith respect to h. Damage initiation occurs when the maximisedinitiation functions have a value greater than unity. Once the angleis determined, it will not change for this element for the remainderof the simulation as shear micro-cracking has occurred and anyfurther fracture will preferentially occur on this plane. Brent’s algo-rithm [45] was used to efficiently determine the orientation of thefracture plane. With reference to Fig. 8, when rNN > 0, the damageinitiation profile is defined by a semi-ellipse that intersects thestress axes at the transverse tensile and shear strengths. WhenrNN < 0, the profile is defined by a line passing through point Aand the shear strength, where point A is derived from the observedfracture plane angle ðhf Þ of 53� for uniaxial transverse compression[27].
The transverse shear strength S A23
� �is defined in terms of the
transverse compressive strength [40], i.e.:
S A23 ¼
YC
2 tan hf
� � ð24Þ
The slope of the linear section of the damage initiation profile inFig. 8 can be interpreted as a friction coefficient that aids in resistingshear loading [40]:
Fig. 8. Failure envelopes where j = 1, T, and inset represents the stress state at pointA.

Fig. 10. Calculating shear stress from shear strain using the elastic predictormethod progressing from old stress state s0 to s in the present increment.
Fig. 11. Shear stress–strain response with damage showing load reversal (1) andreloading (2) with kinematic hardening in the undamaged regime and reloading (3)in the damaged regime.
L.N.S. Chiu et al. / Composite Structures 131 (2015) 215–228 221
lNT ¼ �1
tan 2hf
� � ð25Þ
The same analysis is repeated for the thickness direction responsevia:
l1N ¼S12
S A23
lNT ð26Þ
Combining both the transverse and thickness direction profilesusing a quadratic relationship gives an overall damage initiationsurface for matrix damage shown in Fig. 9.
The shear model splits the overall strain into its elastic andinelastic components (Eq. (27)). A cubic function (Eq. (28)) wasused to describe the nonlinear behaviour of composites undershear loading when damage has not yet initiated ðdmat ¼ 0Þ.
cij ¼ cij;el þ cij;in i – j ð27Þ
s cij
� �¼ c1c3
ij � sgn cij
� �c2c2
ij þ c3cij ð28Þ
With the inclusion of inelastic strain in the shear response, an iso-tropic hardening relationship was adopted to deal with unloadingand load reversal. Fig. 10 shows an initial stress state ðct; stÞ, whichis reached after partial unloading along the secant shear modulus(GijÞ. The stress state after subsequent reloading to ctþDt dependson whether plastic yielding occurs. Initially, the stress is assumedto increase elastically to stþDt
E . However, as stþDtE > sðctÞ, yielding
has occurred, which results in the increased inelastic strain ofctþDt
in and stress reduced to stþDt .Alternatively, if stþDt
E < sðctÞ, yielding has not occurred so theinelastic strain remains constant and stþDt
E is retained as the finalstress state. Once damage has initiated, unloading and reloadingoccurs along the damaged secant modulus from the fixed inelasticstrain value as shown in path 3 in Fig. 11.
This shear model is based on the curve-fit of experimentallyobserved nonlinearity in the shear response. The unloading andloading reversal behaviour approximates the observed response.
2.2.3.2. Damage evolution. According to Puck and Schurmann’streatment of transverse damage, the normal and shear stresseson the fracture plane contribute to matrix cracking in aunidirectional ply [27]. As a consequence, the matrix damageparameter, dmat , which controls the stiffness reduction due tomatrix-dominated damage, is a function of both normal and shearstresses on the fracture plane. A resultant shear strain ðcrÞ isdefined on the fracture plane [26] as the vector sum of the two pla-nar shear components shown in Fig. 7:
cr ¼ffiffiffiffiffiffiffiffiffiffiffiffiffiffiffiffiffiffiffiffic2
NT þ c21N
qð29Þ
Fig. 9. Damage initiation surface in the stress space defined on the friction plane.
The resultant failure strain, cmaxr , is subsequently determined using
the mixed mode critical energy release rate, Gmat , and the totalstrain energy before damage initiation, K,
cmaxr ¼ 2
rOr
Gmat
lmat�K
� �þ cO
r ð30Þ
where rOr and cO
r are the resultant damage initiation stress andstrain respectively. The volumetric strain energies associated witheach stress component on the fracture plane, are combined usinga quadratic relationship,
K ¼ KNNhrNNirr
� �2
þK1Ns1N
rr
� �2
þKNTsNT
rr
� �2
ð31Þ
where the resultant shear stress ðrrÞ is defined as the magnitude ofthe stresses on the fracture plane:
rr ¼ffiffiffiffiffiffiffiffiffiffiffiffiffiffiffiffiffiffiffiffiffiffiffiffiffiffiffiffiffiffiffiffiffiffiffiffiffiffiffiffiffihrNNi2 þ r2
1N þ r2NT
qð32Þ

222 L.N.S. Chiu et al. / Composite Structures 131 (2015) 215–228
The volumetric strain energy associated with each stress compo-nent, Kij, is given by the integral in Eq. (33).
Kij ¼Z
dmat¼0rijdeij; where ij ¼ NN;1N;NT ð33Þ
The total strain energy release rate, Gmat , is:
Gmat ¼ GCmathrNNirr
� �2
þ G12mat
rLN
rr
� �2
þ G23mat
rNT
rr
� �2
ð34Þ
and the matrix-dominated damage parameter, dmat is therefore:
dmat ¼cmax
r
cmazr � cO
r1� cO
r
cr
� �ð35Þ
The shear stresses on the fracture plane are subsequently modifiedby the matrix-dominated damage parameter ðdmatÞ.
rLN ¼ ð1� dmatÞ�rLN ð36ÞrNT ¼ ð1� dmatÞ�rNT ð37ÞrNN ¼ �rNN � dmath�rNNi ð38Þ
These stresses are transformed back to the material coordinatesystem to form the complete stress tensor of the damaged element.The shear (Eqs. (36) and (37)) and normal (Eq. (38)) degradation onthe fracture plane results from the combined action of transverseand shear stress states.
2.2.3.3. Implementation of matrix-dominated damage. An optimisa-tion method based on Brent’s algorithm [45] was used for max-imising the damage initiation function to obtain the fractureplane angle. This method, which combines the robustness of agolden section search with the speed of quadratic interpolation,is superior to a series of function evaluations on possible fracture
Fig. 12. Bounding box over the set of stress states possible due to rotation of the fract
plane angles [45] in balancing a fast run time with good accuracy.To reduce unnecessary evaluations of the damage initiation func-tion, a bounding box was introduced to quickly check whether aparticular loading state was well below that needed to achievedamage initiation. This bounding box was created to encompassthe set of all possible stress states in the 1NT coordinate systemdue to rotation of the fracture plane. Fig. 12 shows the blue curve,representing the possible stresses at different fracture plane anglescontained within a box in the 1N-NN, NT-NN and 1N-NT-NN stressspaces respectively. The red curve/surface represents damageinitiation curve/surface in the respective stress spaces, which thebounding box is compared against.
If the bounding box is entirely within the damage initiationsurface, then this stress state cannot initiate damage. Hence theroutine, which maximises damage initiation functions to identifythe inclination of the fracture plane, is not executed.
2.3. Implementing the damage model within Abaqus
The intralaminar damage model was implemented usingthe user-defined material subroutine (VUMAT) withinthe Abaqus/Explicit package [39]. The Abaqus core provides theVUMAT with the current increment strain values as well as all statevariable values from the previous increment. VUMAT then calcu-lates and returns the stress state of the current increment toAbaqus at each integration point.
The proposed model assumed a homogenised composite plywhere microcracking is assumed to be smeared over the volumeof the element. The lack of discontinuities within the elementallows the application of conventional FE analysis rather thannecessitating more exotic methods such as the extended finite ele-ment method [46]. Any damage that occurs is assumed to be
ure plane as shown in the (a) 1N-NN (b) NT-NN and (c) 1N-NT-NN stress spaces.

0.00
0.20
0.40
0.60
0.80
1.00
1.20
1.40
5 X Baseline Baseline 0.2 X Baseline
Nor
mal
ised
pea
k fo
rce
Transverse TensionTransverse CompressionShear
0.00
0.20
0.40
0.60
0.80
1.00
1.20
5 X Baseline Baseline 0.2 X Baseline
Nor
mal
ised
ene
rgy
abso
rp�
on
Transverse TensionTransverse CompressionShear
Fig. 13. Sensitivity of model to transverse properties.
L.N.S. Chiu et al. / Composite Structures 131 (2015) 215–228 223
irreversible according to thermodynamic principles. Hence thedamage parameters are constrained to be monotonically increas-ing. As this model was developed to model composite crushing,fatigue has not be considered. Strain rate dependence has beenneglected as the fibre-dominated properties, which is the principalmode of energy dissipation due to its substantially higher criticalstrain energy release rate, was shown to be rate independent [47].
Element deletion was employed to remove elements based on:(i) the damage parameter; or (ii) the determinant of the deforma-tion gradient, detðFÞ.
delete element when eitherd11 > 0:990:8 > detðFÞ or detðFÞ > 1:6
�ð39Þ
These parameters indicate: (i) the lack of resistance to loading lead-ing to excessive distortions and (ii) the occurrence of large volumechanges respectively. Elements displaying these characteristicswere deleted, as their response was no longer valid and could causethe simulation to abort.
For composite structures undergoing crush damage, delamina-tion, friction and contact are also important considerations andestablished algorithms built into Abaqus were used to capturethese effects [39]. A bilinear traction-separation law was used tocapture the interlaminar behaviour and applied to cohesive sur-faces. The maximum traction was determined by the delaminationstrength, after which softening occurs. Delamination occurs whenthe strain energy in the surface exceeds the critical fracture energy.Mode mixing was achieved through a power law [48]. A generalcontact algorithm built into Abaqus was utilised to generate therequired tangential and normal forces between contact surfaces[39]. Normal contact forces imposed hard contact conditionsbetween the platen and the plies as well as between adjacent pliesfor when the plies come into contact after the cohesive surfaceswere ‘‘eroded’’ to prevent penetration. Tangential contact forcesconsist of friction forces experienced when the ply-platen orply-ply interface slide over each other, which was determinedusing the Coulomb friction model [39].
3. Material property measurement
The present model requires the input of a number of materialproperties which impact the accuracy of the prediction. Some ofthe commonly-used properties have associated standards for theirmeasurement, e.g. ASTM D3039M [49] for tensile strength, modu-lus and Poisson’s ratio, ASTM D3410M [50] for compressivestrength and modulus, and ASTM D3518M [51] for the shear profileand strength measurement of a composite ply. However, methodsdescribing the measurement of intralaminar critical energy releaserates are not as well established. Pinho et al. [52] demonstrated theuse of compact specimens, described in ASTM E399 [53] and E1820[54], for the determination of both tensile and compressivefibre-dominated critical energy release rates. It was shown thatthe method described in ASTM E399, originally intended for deter-mining the fracture toughness of metallic materials, was not suit-able due to the anisotropy of composite laminates. An alternativeFE based method was proposed and validated. This approach is alsosimilar to the single edge notch test method described in ASTME1922 [55], which applies only for tensile properties. ASTM E399can also be applied to the matrix-dominated energy release ratesin tension and compression by rotating the orientation of the lam-inate. There are currently no direct methods to measure theintralaminar shear energy release rates. However, the mode IIinterlaminar energy release rate is an appropriate approximationdue to the similarities in the failure mode. In contrast, methodsto obtain mode I, mode II and mixed-mode interlaminar criticalenergy release rates for unidirectional composite laminate are
specified in ASTM standards D5528 [56], D7905 [57] and D6617[58] respectively.
3.1. Material property sensitivity
Due to the epistemic uncertainty in some of the input materialproperties, the sensitivity of the value of transverse strengths wasinvestigated using a model of a simple chamfered flat plateundergoing crushing against a rigid surface. The transversematerial properties were chosen because of their probable in situdependence [44].
Fig. 13 shows the variation in peak force and specific energyabsorption, SEA, with variations to the baseline transverse proper-ties. As expected, decreasing the transverse tensile, compressiveand shear strengths to 20% of the baseline values resulted in areduced peak force. On the other hand, a fivefold increase in thetransverse tensile and shear strengths led to failure via bucklingaway from the crush front, resulting in a decreased overall peakforce. The increase in transverse compressive strength caused anexpected increase in peak force. Overall, the simulationdemonstrated that the SEA was not very sensitive to the variationin these transverse properties, which is the result of the low energyassociated with matrix damage. The primary energy dissipation isexpected to be through fibre-dominated damage mechanisms.
4. Model validation
4.1. Mesh sensitivity
The developed constitutive model softens the material locallyas damage progresses. This leads to mesh-dependent localisationof damage, which is resolved through the use of a characteristiclength. A mesh sensitivity study, on a cube loaded in longitudinaltension was performed with 13;23;33;43 and 53 elements respec-tively. The response in Fig. 14 confirms the mesh independenceof the proposed model.
The small deviation near complete failure is attributed to thebreakdown of the infinitesimal strain assumption used in themodel due to the large strains experienced by elements nearingcomplete failure.

0
2000
4000
6000
8000
0 0.05 0.1 0.15
Forc
e (N
)
Displacement (mm)
1 element2 element3 element4 element5 element
Fig. 14. Force-displacement curve for cube model with different mesh densities.
53 mm
80 mm
Fig. 16. Test specimen geometry.
224 L.N.S. Chiu et al. / Composite Structures 131 (2015) 215–228
4.2. Uniaxial transverse compression coupon simulation
The matrix-dominated damage mode for a unidirectional lami-nate, loaded in transverse compression, was validated againstexperimental data. A numerical model of the compression couponwas investigated to demonstrate that the intralaminar damagemodel was able to capture the observed fracture plane observedexperimentally [59] and described in the literature [27].
4.2.1. Model setupA virtual coupon model, similar to that described in ASTM D3410
[50], was created with dimensions 20 � 10 � 4 mm. This virtualcoupon was meshed with uniform cubic C3D8R linear reducedintegration solid elements with a side length of 0.2 mm. Thevirtual coupon was assigned with properties of T700/M21 obtainedfrom the literature[60–64] and in-house testing. Somematrix properties were unavailable and were substituted withthose available for a similar epoxy resin [26]. The elastic moduliwere E11 ¼ 142; E22 ¼ E33 ¼ 8:4 GPa;G12 ¼ G13 ¼ 4:8 GPa andG23 ¼ 2:9 GPa with a Poisson ratio of 0.32 [61]. The longitudinalstrengths were 2282 MPa and 1465 MPa [61], while transversestrengths were 65 MPa [61] and 290 MPa [26], for tension and com-pression, respectively. The transverse shear strength was 105 MPa[61]. In house testing yielded GT
fib ¼ 108 and GCfib ¼ 58:4 kJ=m2 for
the fibre. GTmat ¼ 0:331 and Gij
mat ¼ 0:443 kJ=m2 [63] were used for
the matrix. GCmat was estimated to be 1:1kJ=m2 [26]. Cubic shear
coefficients cij1 ¼ 34:24 GPa;cij
2 ¼ 15:06 GPa and cij3 ¼ 2:198 GPa
were determined from the shear response curve [62]. The densitywas set to 1.59 g/cc [26]. The specimen was loaded in uniaxialtransverse (the y direction in Fig. 15) compression.
4.2.2. ResultsFig. 15 (left) shows a fractured uniaxial compression coupon of
a similar material (IM7/8552). The fracture morphology of thenumerical model shown in Fig. 15 (right) bears close resemblanceto experimental observation. Formation of multiple fracture
Fig. 15. Compressive failure along the fracture plane [59] (left) is well captu
surfaces observed experimentally was also captured by the virtualcoupon. The inclination of the macroscopic fracture plane was con-sistent with an expected value of approximately 53� [27].
4.3. Composite crush specimen simulation
The crushing of a tulip triggered cylindrical energy absorberspecimen was simulated to validate the proposed model for usein evaluating energy absorber response.
4.3.1. Experimental setupA series of quasi-static crush tests were completed on a set of
composite energy absorber specimens. A tulip triggered cylinder(Fig. 16) geometry was chosen following recommendations fromthe literature [6]. The cylindrical tubes were manufactured fromT700/M21 unidirectional prepreg with a [0/90/0/90]s layup toobtain a nominal wall thickness of 1.2 mm. The manual layup pro-cess includes a debulking process to minimise imperfectionswithin the plies. The specimens were cured in an autoclave asper manufacturer’s instructions. The tulip trigger pattern was cutinto the top of the tubes after curing. Care was taken to ensure thatthe top and bottom of the tube were machined parallel for evenload distribution. This set of specimens was crushed betweentwo steel platens at quasi-static speeds of 0.5 mm/min in a screwdriven testing machine.
4.3.2. Virtual specimen setupA virtual tulip triggered test specimen was created for
Abaqus/Explicit. The model was meshed with an approximate
red by the virtual coupon (right) with fibres parallel to the x direction.

Fig. 17. Comparison of experimental and simulated deformation of the specimen: (i) splitting of plies, (ii) petalling of trigger section and (iii) substantial matrix damage insplayed plies (red region). (For interpretation of the references to colour in this figure legend, the reader is referred to the web version of this article.)
L.N.S. Chiu et al. / Composite Structures 131 (2015) 215–228 225
element dimension of 1 mm in the longitudinal and transversedirections to balance accuracy with runtime. Each ply hadthree elements in the thickness direction to adequately capturepost-delamination ply bending. The plies were modelled usingthe same element and properties as the uniaxial compressionvirtual coupon. The eight ply layers were modelled individually.The platens were modelled as rigid flat surfaces. Interlaminar
behaviour between adjacent plies were captured via cohesivesurfaces [39]. The interface strength was set to 60 MPa forboth modes I and II whereas the energy release rates were 0:331and 0:443 kJ=m2 for modes I and II respectively [63]. Hard contactconditions [39] were defined between the platen and the plies aswell as between adjacent plies for when the plies come intocontact after the cohesive surfaces were ‘‘eroded’’.

Fig. 18. Overlay of simulated crush response (dark) over experimental data (light).
0100200300400500600
0 10 20 30 40
Ener
gy a
bsor
bed
(kJ)
Dispalcement (mm)
0
5
10
15
20
Peak force Average force
Forc
e (k
N)
SimulatedExperimental
Fig. 19. Energy absorption (left) and force comparison (right) between numerical (dark) and experimental results (light).
226 L.N.S. Chiu et al. / Composite Structures 131 (2015) 215–228
Friction played a significant role in the response of the struc-ture. Numerical analysis shows that the friction coefficientbetween the composite plies and the platen is not constant.During the consumption of the trigger region (<10 mm displace-ment), substantial friction was present. An experimentally mea-sured value of 0.24 was adopted for this region. However, duringsteady-state crushing of the bulk cylinder, a significantly lowerfriction coefficient yielded a good match to experimental observa-tions. A friction coefficient of 0.10 was used during steady statecrushing. This reduced friction coefficient may be attributed tothe lubricating effects of trapped graphite debris/dust on thecomposite-ply interface. This is supported by the observed lubric-ity of small graphite particles [65] which are similar in compositionto the fine carbon fibre dust observed during testing.
The model utilised quarter symmetry to reduce thecomputational resources required. To suppress spurious responses,an enhanced stiffness based hourglass control and distortioncontrol was employed [39]. Variable mass scaling on aper-element basis, similar to that implemented by other authors([2,66]), was employed to further speed up the simulation time.A sensitivity study was used to ensure the effect of mass scalingon the final response was small. The simulation was run usingAbaqus/Explicit 6.11. Low-pass filters were necessary to removethe numerical oscillations, which are an artefact of explicitdynamic modelling.
4.3.3. ResultsThe force and displacement histories of the experimental tests
were recorded via the attached load cell and the frame respec-tively. The dominant damage modes were also noted. The experi-mental results showed good consistency in terms of force–displacement as well as the observed damage.
Fig. 17 shows the evolution of damage in the specimens undermonotonically increasing crushing loads and Fig. 18 shows thesimulated force–displacement response, which is consistent withthe range of observed experimental results. The displacement atwhich the peak force occurred was predicted with good accuracy.The higher predicted peak force is likely to be a numerical artefactrelating to the changing contact conditions upon element deletion.The progressive nature of the crushing was well captured, with aclear force plateau during the steady state crushing.
Two primary performance metrics, the energy absorption andaverage force, were well predicted by the model (Fig. 19).
5. Conclusion
An intralaminar damage model was developed and combinedwith established interlaminar and contact models to form acomplete modelling package able to predict the crush responseof composite structures. The present model is fullythree-dimensional, combining an improved characteristic lengthdetermination, nonlinear shear, a robust unloading/reloadingmechanism and a unified matrix damage mechanism, which pro-vides greater fidelity and predictability than previously reported.The model successfully reproduced the experimental response ofa set of tulip triggered tubular composite energy absorber speci-mens. This was achieved without the need to alter or calibrateexperimentally determined input parameters like many currentlyavailable damage models, which gives the present model a predic-tive capability. The use of this numerical model can contribute tothe reduction in the amount of physical testing necessary in thedesign of energy absorbing composite structures, which has poten-tial for significant improvements to the time and cost of the designprocess.

L.N.S. Chiu et al. / Composite Structures 131 (2015) 215–228 227
Acknowledgement
This work was undertaken within the Systems forCrashworthiness project, part of a CRC-ACS research program,established and supported under the Australian Government’sCooperative Research Centres Program. Prof Brian G. Falzonacknowledges the financial support of Bombardier and the RoyalAcademy of Engineering.
References
[1] Johnson AF, David M. Failure mechanisms and energy absorption in compositeelements under axial crush. Key Eng Mater 2012;488-489:638–41.
[2] Sokolinsky VS, Indermuehle KC, Hurtado JA. Numerical simulation of thecrushing process of a corrugated composite plate. Compos Part A: Appl SciManuf 2011;42(9):1119–26.
[3] Palanivelu S et al. Crushing and energy absorption performance of differentgeometrical shapes of small-scale glass/polyester composite tubes underquasi-static loading conditions. Compos Struct 2011;93(2):992–1007.
[4] Joosten MW et al. Experimental and numerical investigation of the crushingresponse of an open section composite energy absorbing element. ComposStruct 2011;93(2):682–9.
[5] Talreja R. Damage mechanics of composite materials. Composite MaterialsSeries. Amsterdam [The Netherlands]; New York: Elsevier; 1994.
[6] Garner DM, Adams DO. Test methods for composites crashworthiness: areview. J Adv Mater 2008;40(4):5–26.
[7] Lau STW, Said MR, Yaakob MY. On the effect of geometrical designs and failuremodes in composite axial crushing: a literature review. Compos Struct 2012;94(3):803–12.
[8] Kellas S, Jackson KE. Deployable system for crash—load attenuation. J AmHelicopter Soc 2010;55(4):042001–14.
[9] Bisagni C et al. Progressive crushing of fiber-reinforced composite structuralcomponents of a formula one racing car. Compos Struct 2005;68(4):491–503.
[10] Feraboli P et al. Crush energy absorption of composite channel sectionspecimens. Compos Part A: Appl Sci Manuf 2009;40(8):1248–56.
[11] Jackson A et al. Investigation into laminate design of open carbon–fibre/epoxysections by quasi-static and dynamic crushing. Compos Struct 2011;93(10):2646–54.
[12] Feraboli P. Development of a corrugated test specimen for composite materialsenergy absorption. J Compos Mater 2008;42(3):229–56.
[13] McCarthy MA, Wiggenraad JFM. Numerical investigation of a crash test of acomposite helicopter subfloor structure. Compos Struct 2001;51(4):345–59.
[14] Thornton PH. Energy absorption in composite structures. J Compos Mater1979;13(3):247–62.
[15] Farley GL. Energy absorption of composite materials. J Compos Mater1983;17(3):267–79.
[16] Bisagni C. Experimental investigation of the collapse modes and energyabsorption characteristics of composite tubes. Int J Crashworthiness 2009;14(4):365–78.
[17] Jacob GC et al. Energy absorption in polymer composites for automotivecrashworthiness. J Compos Mater 2002;36(7):813–50.
[18] Huang J, Wang X. On a new crush trigger for energy absorption of compositetubes. Int J Crashworthiness 2010;15(6):625–34.
[19] Kakogiannis D et al. Response of pultruded composite tubes subjected todynamic and impulsive axial loading. Compos Part B: Eng 2013;55(0):537–47.
[20] J.O. Hallquist, LS-DYNA theory manual 2006, Livermore: Livermore SoftwareTechnology Corporation.
[21] Chang F-K, Chang K-Y. A progressive damage model for laminated compositescontaining stress concentrations. J Compos Mater 1987;21(9):834–55.
[22] Ghasemnejad H et al. Experimental studies on fracture characterisation andenergy absorption of GFRP composite box structures. Compos Struct2009;88(2):253–61.
[23] Feraboli P et al. LS-DYNA MAT54 modeling of the axial crushing of a compositetape sinusoidal specimen. Compos Part A: Appl Sci Manuf 2011;42(11):1809–25.
[24] Ladeveze P, LeDantec E. Damage modelling of the elementary ply forlaminated composites. Compos Sci Technol 1992;43(3):257–67.
[25] Donadon MV et al. A progressive failure model for composite laminatessubjected to low velocity impact damage. Comput Struct 2008;86(11-12):1232–52.
[26] Faggiani A, Falzon BG. Predicting low-velocity impact damage on a stiffenedcomposite panel. Compos Part A: Appl Sci Manuf 2010;41(6):737–49.
[27] Puck A, Schürmann H. Failure analysis of FRP laminates by means ofphysically based phenomenological models. Compos Sci Technol 1998;58(7):1045–67.
[28] Shi Y, Swait T, Soutis C. Modelling damage evolution in composite laminatessubjected to low velocity impact. Compos Struct 2012;94(9):2902–13.
[29] Raimondo L et al. A progressive failure model for mesh-size-independent FEanalysis of composite laminates subject to low-velocity impact damage.Compos Sci Technol 2012;72(5):624–32.
[30] Bazant Z, Oh B. Crack band theory for fracture of concrete. Mater Struct 1983;16(3):155–77.
[31] Bazant ZP, Cedolin L. Stability of Structures: Elastic, Inelastic, Fracture andDamage Theories. World Scientific; 2010.
[32] Jirasek M, Bazant ZP. Inelastic Analysis of Structures. John Wiley & Sons; 2002.[33] Oliver J. A consistent characteristic length for smeared cracking models. Int J
Numer Methods Eng 1989;28(2):461–74.[34] Matzenmiller A, Lubliner J, Taylor RL. A constitutive model for anisotropic
damage in fiber-composites. Mech Mater 1995;20(2):125–52.[35] Talreja R. A continuum mechanics characterization of damage in composite
materials. Proc R Soc London A Math Phys Sci 1985;399(1817):195–216.[36] Talreja R. Stiffness properties of composite laminates with matrix cracking and
interior delamination. Eng Fract Mech 1986;25(5–6):751–62.[37] Chaboche JL. Continuum damage mechanics: present state and future trends.
Nucl Eng Des 1987;105(1):19–33.[38] Lemaiître J, Chaboche J-L. In: Mechanics of Solid Materials. Cambridge
University Press; 1990. p. 556.[39] SIMULIA, Abaqus Documentation version 6.112011: SIMULIA (Dassault
Systems).[40] Pinho ST, Iannucci L, Robinson P. Physically-based failure models and criteria
for laminated fibre-reinforced composites with emphasis on fibre kinking: PartI: development. Compos Part A: Appl Sci Manuf 2006;37(1):63–73.
[41] Falzon BG, Apruzzese P. Numerical analysis of intralaminar failuremechanisms in composite structures. Part II: applications. Compos Struct2011;93(2):1047–53.
[42] Falzon BG, Apruzzese P. Numerical analysis of intralaminar failuremechanisms in composite structures. Part I: FE implementation. ComposStruct 2011;93(2):1039–46.
[43] Van Paepegem W et al. Monitoring quasi-static and cyclic fatigue damage infibre-reinforced plastics by Poisson’s ratio evolution. Int J Fatigue 2010;32(1):184–96.
[44] Camanho PP et al. Prediction of in situ strengths and matrix cracking incomposites under transverse tension and in-plane shear. Compos Part A: ApplSci Manuf 2006;37(2):165–76.
[45] Press WH et al. Numerical Recipes in Fortran. 2nd ed. Cambridge: CambridgeUniversity Press; 1992.
[46] Liu PF, Zheng JY. Recent developments on damage modeling and finite elementanalysis for composite laminates: a review. Mater Des 2010;31(8):3825–34.
[47] Koerber H, Camanho PP. High strain rate characterisation of unidirectionalcarbon-epoxy IM7-8552 in longitudinal compression. Compos Part A: Appl SciManuf 2011;42(5):462–70.
[48] Camanho PP, Davila CG. Mixed-mode decohesion finite elements for thesimulation of delamination in composite materials. Langley Research Center:NASA; 2002.
[49] ASTM, D3039/D3039M – 08 in Standard test method for tensile properties ofpolymer matrix composite materials. ASTM International: WestConshohocken, PA; 2007
[50] ASTM, D3410/D3410M – 03 in Standard test method for compressiveproperties of polymer matrix composite materials with unsupported gagesection by shear loading. ASTM International, West Conshohocken, PA; 2003.
[51] ASTM, D3518/D3518M – 94 in Standard test method for in-plane shearresponse of polymer matrix composite materials by tensile test of a �45�laminate. ASTM International: West Conshohocken, PA; 2001
[52] Pinho ST, Robinson P, Iannucci L. Fracture toughness of the tensile andcompressive fibre failure modes in laminated composites. Compos Sci Technol2006;66(13):2069–79.
[53] ASTM, E399 – 09 in Standard test method for linear-elastic plane-strainfracture toughness kic of metallic materials; 2009.
[54] ASTM, E1820 – 01 in Standard test method for measurement of fracturetoughness; 2001.
[55] ASTM, D1922 – 03a in Standard test method for propagation tear resistance ofplastic film and thin sheeting by pendulum method. ASTM International: WestConshohocken, PA; 2003.
[56] ASTM, D5528 – 01, in Standard test method for mode I interlaminar fracturetoughness of unidirectional fiber-reinforced polymer matrix composites.ASTM International: West Conshohocken, PA; 2007
[57] ASTM, D7905/D7905M – 14, in Standard test method for determination of themode II interlaminar fracture toughness of unidirectional fiber-reinforcedpolymer matrix composites. ASTM International: West Conshohocken, PA;2014.
[58] ASTM, D6617/D6617M – 06, in Standard test method for mixed mode I-modeII interlaminar fracture toughness of unidirectional fiber reinforced polymermatrix composites. ASTM International: West Conshohocken, PA; 2006.
[59] Koerber H, Xavier J, Camanho PP. High strain rate characterisation ofunidirectional carbon-epoxy IM7-8552 in transverse compression and in-plane shear using digital image correlation. Mech Mater 2010;42(11):1004–19.
[60] Caminero MA et al. Damage monitoring and analysis of composite laminateswith an open hole and adhesively bonded repairs using digital imagecorrelation. Compos Part B: Eng 2013;53(0):76–91.
[61] Torres Arellano M et al. Mechanical characterization of an alternativetechnique to embed sensors in composite structures: the monitoring patch.Appl Compos Mater 2012;19(3-4):379–91.
[62] Preetamkumar M et al. Validation of intralaminar behaviour of the laminatedcomposites by damage mesomodel, In: 50th AIAA/ASME/ASCE/AHS/ASCstructures, structural dynamics, and materials conference, 2009, AmericanInstitute of Aeronautics and Astronautics.

228 L.N.S. Chiu et al. / Composite Structures 131 (2015) 215–228
[63] Falzon BG et al. An investigation of mode I and mode II fracture toughnessenhancement using aligned carbon nanotubes forests at the crack interface.Compos Struct 2013;106(0):65–73.
[64] Ilyas M et al. Dynamic delamination of aeronautic structural composites byusing cohesive finite elements, In: 17th International conference on compositematerials (ICCM-17), Edinburgh, Scotland; 2009.
[65] Liu Z et al. Observation of microscale superlubricity in graphite. Phys Rev Lett2012;108(20).
[66] Gutkin R, Pinho ST. Combining damage and friction to model compressivedamage growth in fibre-reinforced composites. J Compos Mater 2014.