Fine-grain Indoor Localization Infrastructure for Real …868448/FULLTEXT01.pdfDEGREE PROJECT, IN...
51
DEGREE PROJECT, IN MSC ENERGY INNOVATION (EIT KIC ENERGY FOR , SECOND LEVEL SMART CITIES) STOCKHOLM, SWEDEN 2015 Fine-grain Indoor Localization Infrastructure for Real-time Inspection of Large Buildings ASAD KHALID RAJA KTH ROYAL INSTITUTE OF TECHNOLOGY ELECTRICAL ENGINEERING
Transcript of Fine-grain Indoor Localization Infrastructure for Real …868448/FULLTEXT01.pdfDEGREE PROJECT, IN...

DEGREE PROJECT, IN MSC ENERGY INNOVATION (EIT KIC ENERGY FOR , SECOND LEVELSMART CITIES)
STOCKHOLM, SWEDEN 2015
Fine-grain Indoor LocalizationInfrastructure for Real-time Inspectionof Large Buildings
ASAD KHALID RAJA
KTH ROYAL INSTITUTE OF TECHNOLOGY
ELECTRICAL ENGINEERING

TRITA EE 2015:88
www.kth.se

Abstract
This master thesis project is about the systems integration of an indoor localizationsystem using Ultra Wideband Impulse Radio and a drone platform which uses theParrot AR.DRONE 2.0 along with the Robot Operating System (ROS). The goal wasto use off-the-shelf components to integrate an indoor localization system which can beused for energy modelling, indoor environmental panoramas and visual inspection oflarge buildings. The system architecture is explored, implemented and then subjectedto extensive testing. Experimental results of the openRTLS UWB system illustrateaccurate readings down to 2cm for Tag positions. The Parrot AR.DRONE 2.0 waschosen due to its low cost and agility; the open source drivers of ROS ensured modularsystem software, which has room for upgrades. The drone system can be used withoptional additional sensors, either attached internally or externally, to scan indoorareas and form environmental panoramas which can quantify ambient environmentalparameters such as temperature, humidity or pressure in harsh or hard to reach areas.The live video feed from the camera facilitates navigation in NLOS conditions. Thereal time flight path of the Parrot AR.DRONE 2.0 combined with the real time positiondata of the openRTLS UWB-IR system offers a unique insight into fine-grain data oflarge buildings.
i

ii

Acknowledgements
This work would not have been completed were it not for the patient guidance of mysupervisor, Dr. Zhibo Pang (ABB CRC). I am indebted to him for his knowledge,support and motivation.
I had a fantastic time at ABB Corporate Research. My colleagues made it all the moreworthwhile. Lasting friendships and a great many positive memories are what I takefrom this thesis work.
iii

iv
Contents
1 Introduction 11.1 Related Work . . . . . . . . . . . . . . . . . . . . . . . . . . . . . . . . 2
2 Problem Formulation 32.1 Outline of Thesis . . . . . . . . . . . . . . . . . . . . . . . . . . . . . . 3
3 Localization 53.1 Overview . . . . . . . . . . . . . . . . . . . . . . . . . . . . . . . . . . . 53.2 Fingerprinting Techniques . . . . . . . . . . . . . . . . . . . . . . . . . 7
3.2.1 Received Signal Strength Indicator -WLAN . . . . . . . . . . . 73.2.2 Bluetooth . . . . . . . . . . . . . . . . . . . . . . . . . . . . . . 8
3.3 Processing-based Techniques . . . . . . . . . . . . . . . . . . . . . . . . 83.3.1 Time-based Techniques . . . . . . . . . . . . . . . . . . . . . . . 83.3.2 GPS . . . . . . . . . . . . . . . . . . . . . . . . . . . . . . . . . 93.3.3 Visible Light Communication . . . . . . . . . . . . . . . . . . . 93.3.4 Sound . . . . . . . . . . . . . . . . . . . . . . . . . . . . . . . . 103.3.5 UWB . . . . . . . . . . . . . . . . . . . . . . . . . . . . . . . . 10
4 UWB Kit and Parrot 114.1 openRTLS UWB kit . . . . . . . . . . . . . . . . . . . . . . . . . . . . 11
4.1.1 Anchor . . . . . . . . . . . . . . . . . . . . . . . . . . . . . . . . 114.1.2 Mobile Tag . . . . . . . . . . . . . . . . . . . . . . . . . . . . . 13
4.2 Parrot AR.Drone 2.0 . . . . . . . . . . . . . . . . . . . . . . . . . . . . 14
5 Architecture and Implementation 155.1 Use Case Scenario . . . . . . . . . . . . . . . . . . . . . . . . . . . . . . 155.2 Architecture . . . . . . . . . . . . . . . . . . . . . . . . . . . . . . . . . 16
5.2.1 Parrot AR.DRONE 2.0 . . . . . . . . . . . . . . . . . . . . . . . 185.2.2 Ethernet Network . . . . . . . . . . . . . . . . . . . . . . . . . . 185.2.3 Data Analytics . . . . . . . . . . . . . . . . . . . . . . . . . . . 185.2.4 Location based Service Engine . . . . . . . . . . . . . . . . . . . 195.2.5 Service Graphical User Interface . . . . . . . . . . . . . . . . . . 19
5.3 Implementation . . . . . . . . . . . . . . . . . . . . . . . . . . . . . . . 20
v

vi CONTENTS
5.3.1 Software . . . . . . . . . . . . . . . . . . . . . . . . . . . . . . . 21
6 Experimental Results and GUI 256.1 Testing . . . . . . . . . . . . . . . . . . . . . . . . . . . . . . . . . . . . 25
6.1.1 Tag Distance Testing . . . . . . . . . . . . . . . . . . . . . . . . 256.1.2 Anchor Position Testing . . . . . . . . . . . . . . . . . . . . . . 276.1.3 Tag Relative Position Error . . . . . . . . . . . . . . . . . . . . 30
6.2 Graphical User Interface . . . . . . . . . . . . . . . . . . . . . . . . . . 32
7 Discussion and Conclusion 357.0.1 Challenges . . . . . . . . . . . . . . . . . . . . . . . . . . . . . . 36
7.1 Future Work . . . . . . . . . . . . . . . . . . . . . . . . . . . . . . . . . 36

List of Figures
3.1 Overview of Localization Techniques . . . . . . . . . . . . . . . . . . . 73.2 UWB Frequency Comparison - Image courtesy of RWTH Aachen . . . 10
4.1 RTLS Starter Kit - Picture taken from openRTLS website . . . . . . . 124.2 openRTLS Anchor - Picture taken from openRTLS website . . . . . . . 124.3 Tag - Picture taken from openRTLS website . . . . . . . . . . . . . . . 134.4 Parrot AR.Drone 2.0 . . . . . . . . . . . . . . . . . . . . . . . . . . . . 14
5.1 Systems Level Overview . . . . . . . . . . . . . . . . . . . . . . . . . . 165.2 System Architecture . . . . . . . . . . . . . . . . . . . . . . . . . . . . 175.3 Melexis MLX90614 Infrared Temperature Sensor . . . . . . . . . . . . 195.4 Implementation of the openRTLS System . . . . . . . . . . . . . . . . . 205.5 openRTLS Anchor Positions . . . . . . . . . . . . . . . . . . . . . . . . 205.6 Missing data from the Master . . . . . . . . . . . . . . . . . . . . . . . 22
6.1 Leica Disto D2 . . . . . . . . . . . . . . . . . . . . . . . . . . . . . . . 266.2 Distance Error Setup . . . . . . . . . . . . . . . . . . . . . . . . . . . . 266.3 Distance Error Comparison . . . . . . . . . . . . . . . . . . . . . . . . 276.4 Position Error Setup . . . . . . . . . . . . . . . . . . . . . . . . . . . . 286.5 Position Accuracy Test - Best case scenario . . . . . . . . . . . . . . . . 296.6 Position Accuracy Test - Worst case scenario . . . . . . . . . . . . . . . 296.7 Position Accuracy Test - Standard Deviation . . . . . . . . . . . . . . . 306.8 Relative Tag Error Setup . . . . . . . . . . . . . . . . . . . . . . . . . . 316.9 Relative Tag Error . . . . . . . . . . . . . . . . . . . . . . . . . . . . . 316.10 Graphical User Interface . . . . . . . . . . . . . . . . . . . . . . . . . . 326.11 3D Plot in the Graphical User Interface . . . . . . . . . . . . . . . . . . 33
7.1 Additional Sensors on System on Chip of the Parrot AR.DRONE 2.0 . 377.2 Fotokite - Image courtesy of Stuff.tv . . . . . . . . . . . . . . . . . . . 387.3 Fotokite tether - image courtesy of CNET . . . . . . . . . . . . . . . . 387.4 Flyability - image courtesy of Cool Things . . . . . . . . . . . . . . . . 38
vii

viii LIST OF FIGURES
Chapter 1
Introduction
Distributed renewable energy resources, the increased roll out of Smart Meters andsmart white appliances coupled with Demand Side Management imply a city is a dy-namic entity. It responds to its inhabitant’s ever changing needs under the umbrellaof sustainability and does this by amassing large amounts of data. Before venturinginto the realm of Smart Cities, it is crucial to ponder over what smart actually means.The use of word Smart is self-congratulatory [1]. Every city wants itself to be labelledsmart and thus any entity which has been connected to the internet is termed as Smart,although there are different meanings and implications. Levels of internet penetration,speed and other criteria such as e-governance and GIS etc are some of the parametersused. The common underlying theme is the availability of services, or better connec-tion of citizens with services. So, if a Smart City provides access to services, it standsto reason a Smart Building, in a Smart City, will extend this definition to its endusers.
The emphasis thus far has been on Big Data, not on sustainability. It is not thatwe have a dearth of data around us but the recurring issue is its accuracy. It is notfine grain and for sustainability to truly matter, there is a dire need for accurate sus-tainability data. A Smart City enables location aware citizens while a Smart Buildingcontinues accurate localization and brings it indoors. Buildings consume almost 40% ofour total energy needs, and thus, this has a huge potential for reducing our energy con-sumption, improving energy efficiency and meeting the EU 202020 targets. Location, inparticular, has been at the center of connecting Smart Citizens with the world aroundthem. GPS (Global Positioning System) takes care of advanced location based services.However, there is a dearth of localization options for indoor use. For a Smart Buildingto be termed as such, it should connect its inhabitants, with each other through PathNavigation, Position of Interest (PoI) and real time tracking, indoors.
The aim of this thesis was to not only explore one method of Indoor Localizationwhich is fine-grain (i.e., sub meter level) in indoor environments, but also to set up atechnology demonstrator using commercial-off-the-shelf sensors and a drone.
1

1.1. RELATED WORK 2
1.1 Related Work
Indoor Localization has been around for some time, and one can even go as far asconsidering it a hot topic for research. A lot of different approaches exist for localiza-tion. Our focal point was to use commercial-off-the-shelf sensors and an off the shelfrobot/drone to showcase the potential of accurate indoor localization.
The exponential growth of smartphones has put lots of computing power in our pockets,and that can be leveraged by accurate indoor positioning systems. Mobile Device basedcontrol can be used by using the cell phone’s GPS and based on the user’s direction oftravel between home and work, automation solutions can reduce energy consumption[2]. This, however, can only be used outside the building and as such, is of little useif the user is moving about indoors. Furthermore, cellular phones are not modular,and this is little, if any, possibility of retrofitting a sensor or any other localization aidwithout hampering the user experience.
A departure from cellular phones brings one into the realm of Radio Frequency (RF)based localization. Ultra Wideband Impulse Radio (UWB IR) has been gaining a lotof traction and is used for a localization system for indoor navigation [3]. The systemuses four ceiling mounted readers which enable it to track the mobile tag on top of arobot. However, the readers are connected via coaxial cable to the central processingcomputer. This, while simplifying the architecture by removing the processing andcircuitry to the host PC, introduces other complexities in system portability and im-plementation. The Readers are relegated to roles of passive devices, dependent on thehost machine. In [4], the architecture is similar to that of [3] with ceiling mountedReaders, but it implements autonomous navigation by sending the position estimationback to the robot using a ZigBee transceiver. In [5] a UWB indoor navigation systemwas presented for a unicycle robot, and its accuracy and precision was compared withother means including sonar and odometry. Collision avoidance and environmentalimaging are presented in [6]. Using the migration algorithm, UWB proved adequate forself localization and autonomous movement. In [7], trajectory following is presented foran omni-wheeled robot in a factory environment. This was a good test of UWB per-formance in a representative noisy area. All the papers thus reviewed used one variantor another of wheeled robots, and none used drones as a potential application of UWBIR localization.
The Parrot AR.Drone was used in [8], along with UbiSense UWB Localization and fixed’landmarks’ such as QR codes to aid indoor localization. The resulting sensor fusionof IMU, UWB, and Extended Kalmann Filtering of sensors showed a need for moresensors such as lasers to improve indoor localization.
Chapter 2
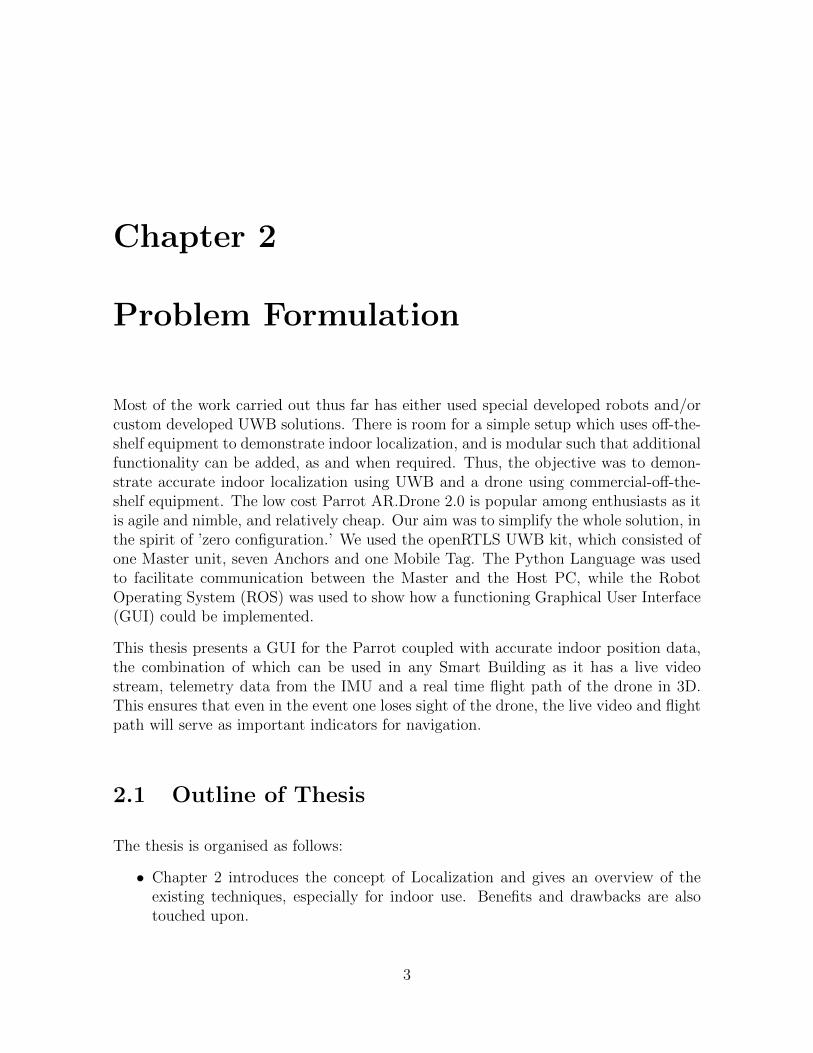
Problem Formulation
Most of the work carried out thus far has either used special developed robots and/orcustom developed UWB solutions. There is room for a simple setup which uses off-the-shelf equipment to demonstrate indoor localization, and is modular such that additionalfunctionality can be added, as and when required. Thus, the objective was to demon-strate accurate indoor localization using UWB and a drone using commercial-off-the-shelf equipment. The low cost Parrot AR.Drone 2.0 is popular among enthusiasts as itis agile and nimble, and relatively cheap. Our aim was to simplify the whole solution, inthe spirit of ’zero configuration.’ We used the openRTLS UWB kit, which consisted ofone Master unit, seven Anchors and one Mobile Tag. The Python Language was usedto facilitate communication between the Master and the Host PC, while the RobotOperating System (ROS) was used to show how a functioning Graphical User Interface(GUI) could be implemented.
This thesis presents a GUI for the Parrot coupled with accurate indoor position data,the combination of which can be used in any Smart Building as it has a live videostream, telemetry data from the IMU and a real time flight path of the drone in 3D.This ensures that even in the event one loses sight of the drone, the live video and flightpath will serve as important indicators for navigation.
2.1 Outline of Thesis
The thesis is organised as follows:
• Chapter 2 introduces the concept of Localization and gives an overview of theexisting techniques, especially for indoor use. Benefits and drawbacks are alsotouched upon.
3

2.1. OUTLINE OF THESIS 4
• Chapter 3 introduces the UWB kit and the Parrot AR.Drone 2.0. The systemslevel overview of the kit is presented.
• Chapter 4 demonstrates one use case scenario and explores the architecture andthe implementation of the whole system, paying particular attention to the vari-ous subsystems. It also explores software development of the system.
• Chapter 5 deals with the experimental testing and results of the UWB Sensors inLOS conditions in a representative indoor environment and presents the Graphi-cal User Interface and its software algorithm.
• Chapter 6 discusses a few points about the project and concludes the thesis, withrecommendations for future work

Chapter 3
Localization
Localization has enabled countless services for people, as far as the outdoors is con-cerned. Maps have been replaced with GPS, and road transport in foreign countrieshas never been easier. The ubiquitous SatNav provides turn by turn directions, 3D and2D visualization as well as other Points of Interest. There has been an increasing effortfor such related services to be enabled for indoor use. However, this is an ongoing issueand while Global Navigation Satellite Systems (GNSS) perform admirably outdoors,this is not the case indoors. Even in dense urban environments, where buildings shieldthe opens sky, GNSS sporadically loses connection.
3.1 Overview
Localization refers to the accurate location of an object, person or other entities usingsensory data [9]. This sensory data can be magnetic waves, acoustic waves and evenlight. The idea is to either use dedicated infrastructure, or some additional means toprecisely locate a position. Localization can be either processing based or fingerprint-ing based [16]. Processing based techniques use methods such as lateration, angulation,dead reckoning etc. Different parameters such as Received Signal Strength (RSS), angleof arrival, time of arrival and time difference of arrival.
Fingerprinting techniques rely on the non-deterministic nature of indoor environmentssuch as dead spots, multipath losses and noise [17]. A measurement scheme whichrecords the ’fingerprints’ of all such radio frequencies and stores it for later use is thecrux of this technique. Such a radio map becomes a signature of a particular loca-tion . Characteristics used for fingerprinting include RSS, access point identificationand response rate (RR). Indoor Localization presents a unique set of problems, as well
5

3.1. OVERVIEW 6
as some features which facilitate it over outdoor localization. Some of the challengesinclude:
• Signal attenuation from obstacles
• Multipath reflection from obsacles
• Dynamic RF fingerprints in industrial environments with consant movement ofelectrical apparatus (high probability of Electomagnetic Interference )
• Presence of corridors, rooms and pathways which imply Non Line of Sight condi-tions
With the caveats out of the way, indoor environments do facilitate localization due totheir inherent nature:
• No weather effects / uniform temperature and pressure in most indoor environ-ments
• Existence of infrastructure (internet access, electricity etc.)
• Small areas to localize (in relative terms especially when compared with outdoorlocalization)
The following table gives an overview of some of Localization techniques in use today,most of which has been described at length in [19]:
Technology Accuracy Coverage (m) Measuring Principle
Cameras 0.1mm – 0.1m 1-10 Angle measurements from imagesInfrared cm – m 1-5 Thermal imaging, active beaconsSound cm 2-10 Time of arrivalWLAN / WiFi m 20-50 RF FingerprintingRFID 0.1m – 1m 1-50 Proximity DetectionUltra Wideband cm — m 1-50 Time of arrivalGNSS 10m Global Parallel correlationOther RF m 10-1000 Fingerprinting
7 3.2. FINGERPRINTING TECHNIQUES
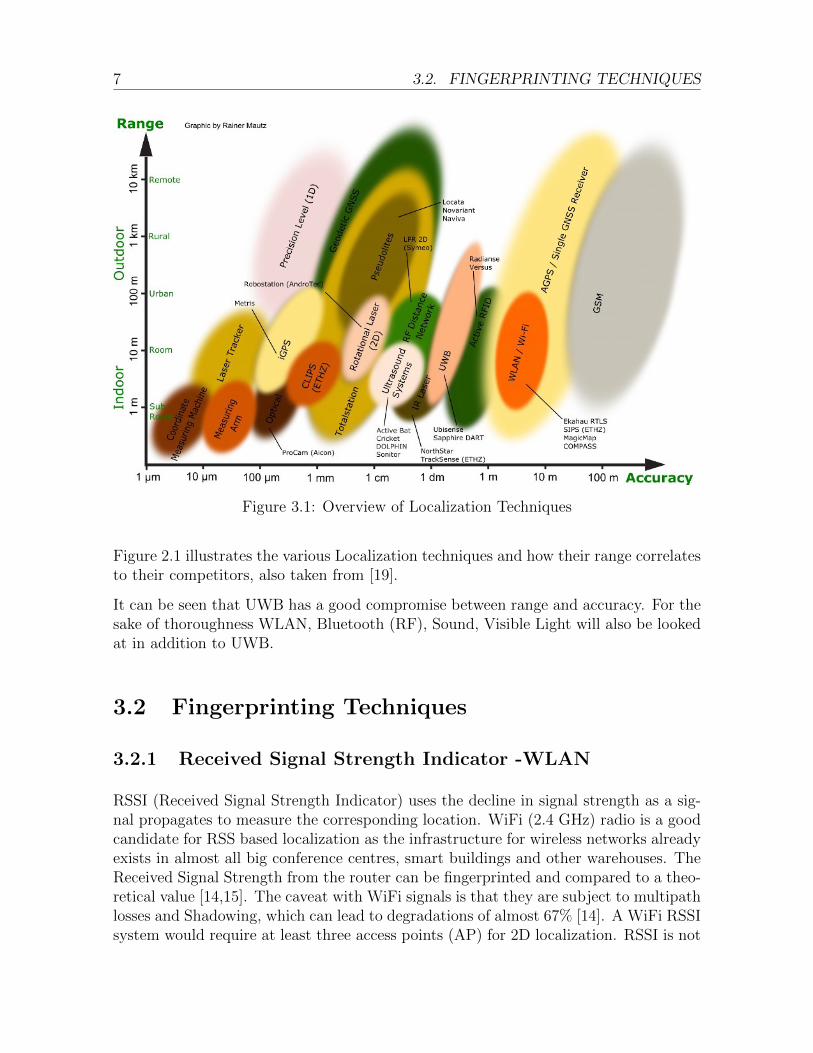
Figure 3.1: Overview of Localization Techniques
Figure 2.1 illustrates the various Localization techniques and how their range correlatesto their competitors, also taken from [19].
It can be seen that UWB has a good compromise between range and accuracy. For thesake of thoroughness WLAN, Bluetooth (RF), Sound, Visible Light will also be lookedat in addition to UWB.
3.2 Fingerprinting Techniques
3.2.1 Received Signal Strength Indicator -WLAN
RSSI (Received Signal Strength Indicator) uses the decline in signal strength as a sig-nal propagates to measure the corresponding location. WiFi (2.4 GHz) radio is a goodcandidate for RSS based localization as the infrastructure for wireless networks alreadyexists in almost all big conference centres, smart buildings and other warehouses. TheReceived Signal Strength from the router can be fingerprinted and compared to a theo-retical value [14,15]. The caveat with WiFi signals is that they are subject to multipathlosses and Shadowing, which can lead to degradations of almost 67% [14]. A WiFi RSSIsystem would require at least three access points (AP) for 2D localization. RSSI is not

3.3. PROCESSING-BASED TECHNIQUES 8
just valid for WiFi, though. Sound can also be used for localization, requiring receivers(microphones) and transmitter.
3.2.2 Bluetooth
Most smartphones have Bluetooth connectivity, which used to be the major methodof transfer of information from one smartphone to another, almost a decade ago. Thearrival of high density flash storage cards and WiFI changed this, though Bluetoothhas taken a backseat for information transfer and has been relegated to being used inwireless headsets. In localization, it requires constant communication and authentica-tion with the base station, which is considered unsafe [16]. One approach uses RR, orthe frequency of received measurements over time [18]. With the device set in discover-able mode only, Inquiry Response Rate (IRR) was accurate to upto 75% of times withpartial sensor coverage [16].
3.3 Processing-based Techniques
3.3.1 Time-based Techniques
Time based techniques use the propagation delay of a signal between a transmitter anda receiver. The transmitter and receiver comprise of a Mobile Tag (MT) and a fixedAnchor, which is usually the reference unit. Time of Arrival (ToA), Two Way Ranging(TW) and Time Difference of Arrival (TDoA) are further explored as under.
Time of Arrival
As the name implies, the time difference between transmission and arrival of a signalis used to calculate the distance between the Mobile Tag and Anchor. This requiresa synchronization of clocks of both units to ensure there are no errors in the timesmeasured.
Time Difference of Arrival
In TDoA, the Mobile Tag’s signal is broadcast to the different Reference Anchors, andthis time difference of arrival(delay) can then be used to estimate the position [19]. Ifthe Anchor i receives a signal at a time ti and the signal was transmitted at a time t0then, the distance is:
di = (ti − t0)c

9 3.3. PROCESSING-BASED TECHNIQUES
With the presence of another Anchor j, one just needs to subtract it from i to calculatethe distance between them:
di − dj = (ti − t0)c− (tj − t0)c
One can notice that clock synchronization between the Anchors is the only requirement,as the signal from the Mobile Tag, t0 gets cancelled [20].
Angle of Arrival
Angle of Arrival is similar to TDoA, except that it uses directional antennae whichleads to the angular direction of the Mobile Tag, with respect to the Anchors. Thebenefit of this arrangement is that only two Anchors are required for localization, asopposed to three for trilateration.
3.3.2 GPS
There are a number of different positioning systems currently in use. For outdoornavigation, Global Positioning System (GPS) and its most common implementation,satnav or Global Navigation System Satellite (GNSS) is almost entirely ubiquitous.Trilateration, the distance to a point from three known locations, is used for locating;if a fourth satellite is available, it can be used to double check the measurements [10].Given position, and requires 3 points. GPS satellites use pesudoranging and require4 points [11]. GPS cannot be used indoors due to signal blockage by building, andother multipath effects. Thus, a number of different methodologies exist for indoorlocalization, although they are not without their caveats.
3.3.3 Visible Light Communication
Visible Light Communication (VLC), seemingly a new method of information transfer,actually pre-dates the modern radio. Alexander Graham Bell used modulated light totransmit speech (photophone). Visible Light Communication requires Light EmittingDiode (LED) bulbs which can switch at extremely high frequencies that cannot bedetected by the naked eye. This switching frequency can be used to send information toa receiver. Fluorescent and Incandescent bulbs cannot be switched at such high rates,thus necessitating LED lamps. VLC incorporates illumination and communication,both processes occurring simultaneously. Light pollution, such as shadowing and alsodust in harsh environments means it requires high maintenance.

3.3. PROCESSING-BASED TECHNIQUES 10
Figure 3.2: UWB Frequency Comparison - Imagecourtesy of RWTH Aachen
3.3.4 Sound
Ultrasonic signals can be used to perform localization indoors, when they are impingedon a surface or receiver and their time of flight is calculated [13]. The Time of Flightincludes time when signals are sent and received, the location of the microphones (whichdetect sound) and the location of the transmitter. Thus, such a system depends on theavailability of the architecture, as the microphones and transmitter will be furtherconnected to a host machine which calculates the distance. Even though 3D accuraciesof upto 15cm have been achieved, the system is vulnerable to noise from the ambientenvironment. Degradation of the Signal to Noise Ratio (SNR) can take place with themost menial of actions, and this limits the scope of ultrasound localization to veryspecific, noise free environments.
3.3.5 UWB
Ultra Wideband uses very small pulses in the time domain, which translate to a largebandwidth in the frequency domain. The bandwidth has to be at least 20% of the centerfrequency, as dictated by FCC regulations. The narrow pulses imply a fine temporalresolution [9]. Furthermore, the power levels have to be below -41dBm, which is veryclose to the noise floor and thus there is no interference with other frequency bandswhich it overlaps. Consequently, UWB does not have any licensing requirements.

Chapter 4
UWB Kit and Parrot
4.1 openRTLS UWB kit
The UWB kit we used was from openRTLS. We bought the starter kit which includesseven Anchors, one Master unit and one mobile Tag. The Anchors and Master wereequipped with directional antennae. The picture below, from the manufacturer’s web-site, shows the kit. The Lithium Polymer batteries were not included.
4.1.1 Anchor
The Anchor Unit or Anchor is a fixed unit normally attached to the walls or theperipheral structure in which localization is required.
It requires a 9V DC Power Source, and can communicate on the 2.4 GHz ISM bandas well as UWB. The specifications are as follows, copied from the openRTLS web-site:
• UWB antenna
• Ethernet with PoE
• 9 — 30VDC power supply (2pin plug 3.5mm)
• ISM 2.4GHz radio
• Pressure sensor (height/altitude reference for tags)
• 3 red/green LED indicators
• 806036mm (wall and 35mm din-rail mountable)
11

4.1. OPENRTLS UWB KIT 12
Figure 4.1: RTLS Starter Kit - Picture taken fromopenRTLS website
Figure 4.2: openRTLS Anchor - Picture taken fromopenRTLS website

13 4.1. OPENRTLS UWB KIT
Figure 4.3: Tag - Picture taken from openRTLS web-site
• AT91SAM4E8C (Atmel) - ARM Cortex-M4 microcontroller, 120MHz, 512 KBFlash, 128 KB SRAM
• RF233 (Atmel) - 2.4GHz Radio Transceiver IEEE 802.15.4
• RFX2411 (RFaxis) - 2.4GHz RF Front End with PA, LNA and diversity switchSensors
• LPS25H (ST) - Digital Pressure Sensor
4.1.2 Mobile Tag
The Mobile Tag is a small unit, close in proportion to a credit card which can be movedfreely within a given area; or attached to any subject which needs monitoring.
The Tag specifications, again from the manufacturer’s website, are:
• UWB transceiver with onboard antenna
• Pressure sensor (height/altitude)
• RGB and red/green LED indicators
• 755017mm (enclosure)
• AT91SAM3S2B (Atmel) - ARM Cortex-M3 microcontroller, 64MHz, 128 KBFlash, 32 KB SRAM
• DW1000 (Decawave) - UWB Radio Transceiver, IEEE 802.15.4-2011 compliant
• AM0805 (Ambiq) - Ultra low power RTC
• LPS25H (ST) - Digital Pressure Sensor (option)
• LSM9DS0 (ST) - Digital Accelerometer, Gyro and Magnetic sensor

4.2. PARROT AR.DRONE 2.0 14
Figure 4.4: Parrot AR.Drone 2.0
• HTS221 (ST) - Humidity sensor Power sources
• micro-USB power source
• Lithium Polymer battery
4.2 Parrot AR.Drone 2.0
The low cost drone Parrot AR.Drone 2.0 was used as the carrier of the Mobile Tag. Itis small, agile and very user friendly. Most importantly, it has a foam hull (roll cage)which facilitates indoor flight by covering the exposed rotors. It features a 1GHz ARMCortex A8 processor which runs Linux 2.6.32, along with peripheral connectivity in theform of Wi-Fi b/g/n and Bluetooth. The front facing camera streams live video to thesmartphone controller. Its characteristics are:
• Resolution: 720p
• 92 degrees wide angle lens
• Recording Frequency: 30 frames per second
• Real time preview and storage of video and photos on the remote device. Ad-ditionally, there is a 60 Frames per second vertical camera of QVGA resolutionwhich measures ground speed.
The IMU comprises of:
• 3 axis gyroscope
• 3 axis accelerometer
• 3 axis magnetometer

Chapter 5
Architecture and Implementation
5.1 Use Case Scenario
Indoor Climate and Energy Modelling is a relatively new area, certainly when comparedwith existing CAD solutions which have been around for decades. With increasing im-portance attached to sustainability and energy efficiency, it can be safely said thatindoor energy modelling will only be used more often. Simplistically, it uses partial dif-ferential equations of convective heat transfer and air flow equations to generate modelson a building’s energy footprint. It is an important indicator of a building’s performanceand can be used to compare energy consumption with the usually forgotten ’embodiedenergy’ metric, or energy which was used in the construction of the building. Usually,only energy consumed is paid heed over a building’s lifetime. Embodied energy, canbe substantial in modern buildings which use lots of glass, double skin facades, andeven roof mounted solar PV panels. Solar PV Panels and Double Skin Facades reduceelectric energy and ventilation expenses respectively, but they have to be ethically man-ufactured and transported for the net energy footprint to be viable.
Drones are agile and fast. They can manoeuvre quickly, accurately and reach placeshumans cannot. Thus, a drone with environmental sensors (temperature, humidity, airquality, UV index etc.) can quickly and accurately model the real world data. WithUWB, the location corresponding to this data, accurate to within five centimeters, canalso be measured, and thus an accurate panoramic view of real environmental dataemerges. This ’indoor environmental panorama’ can be used on big glass facades, sky-lights and on other surfaces which are usually hard to reach. The Big Data, gatheredas such, will come in useful for not only testing the validity of the Simulation Softwareused, but can also offer unique insights for retrofits which cannot be gathered fromtraditional means. Furthermore, armed with the correct sensor, a drone can check forair leaks in ventilation shafts. UWB can be used to navigate the drone, which opens
15

5.2. ARCHITECTURE 16
Figure 5.1: Systems Level Overview
up another avenue for precise localization in harsh and non-line of sight environments.
An office environment with smoke can be easily navigated with the localization fromUWB. However, one would also require a live video feed of the environment for manualnavigation. Even for autonomous flight, live video is a necessary tool for monitoringand diagnostics.
5.2 Architecture
Figure 4.1 shows a representative architecture for an indoor localization system. TheMaster is connected with the PC which serves as the Control Unit for a drone or anyother robot. The 3D space represents a room or any indoor office environment. TheAnchors can be attached to the walls or hidden in specific compartments, as long asthey are made of wood. The Robot Control System on the PC should have live videostreaming as well, which aids in navigation. Furthermore, the localization data fromthe tag should also be used in a Graphical user Interface (GUI) which should display a3D flight path of the drone. This will add more depth to the navigation interface thanvideo streaming alone. Thus, the drone control PC can be replaced by a tablet runningLinux as well.
An Architecture diagram of using any UWB system control a robot (in this case, adrone) is shown in Figure 4.2. The Host PC is connected to the Master Anchor,

17 5.2. ARCHITECTURE
Figure 5.2: System Architecture

5.2. ARCHITECTURE 18
which has a real time Linux engine running onboard that takes care of the UWBEngine (Trilateration, Multilateration etc). This was the case with Open RTLS. Otherimplementations can include Master Units which do not run the UWB engine, in whichcase the multilateration will have to be accomplished by the Host PC. The Anchors arespread about the area in which we want accurate position information of the robot.
5.2.1 Parrot AR.DRONE 2.0
The PARROT Drone is small, but it can easily carry the Tag with no loss of performancewhatsoever. It communicates via WiFi to the Host PC, which can either be a tablet ifone favours touch screen interaction, a standalone tower PC with a monitor, or even alaptop. The important thing is that it is equipped with WiFi to communicate with thePARROT.
5.2.2 Ethernet Network
The Local Ethernet network serves a number of important tasks. The position data ofthe Tag can be stored continuously in a Database. This can take the form of eitheran SQL Database or a text file which contains the relevant data, stored locally on theHost Machine. The position data has to be logged to track the flight path and forother uses. The values can be logged synchronously or asynchronously. As each valueis time stamped, asynchronous gives greater control, and later values can be retrievedand/or be used for later use in autonomous control. Furthermore, storing the valuesfirst serves as a buffer, and this could be useful especially when real time applicationsare concerned. If parts of data from a string are missing, then the buffer serves as afail-safe for missing/garbled data, as only data which is of the correct format will bestored.
5.2.3 Data Analytics
Data Analytics deals with the analysis of the position data. Now, this could be a partof the location data or any additional sensor data. Analysis is a suitable word as therefresh rate of sensors varies from roughly 10Hz to 19Hz, which means over the course ofa single drone flight lasting approximately 10 minutes, one will have in between 6000 to12000 values of position data, temperature, pressure, distance, coordinates etc. Thus,there has to be a method for sifting and sorting through the data. Most of the sortingwill have already been accomplished in the Database block. The Analytics is moredependent on driving meaningful conclusions from the data. Changes in temperature,especially when accompanied by no change in pressure which means an identical height,can imply a different zone or room in a building.

19 5.2. ARCHITECTURE
5.2.4 Location based Service Engine
Location Based Service or LBS Engine takes the concrete data from Analytics, andturns it into an service. There can be numerous options for this. For instance, if onewere to use the MLX90614 infrared thermometer, then the hundreds of values of varyingtemperatures can form an ’environmental panorama’ which will easily illustrate the hotand cold surfaces in any given area, not dissimilar to a thermal camera. This has thepotential for a unique insight into the energy footprint of a given building.
5.2.5 Service Graphical User Interface
Service Graphical user Interface or SGUI will be the window into the data that hasbeen acquired, stored and analyzed. It is an open book at this point, as the exact enduse will be determined by the requirements.
Earlier, it was mentioned that a drone could be used for an environmental panorama.This can be accomplished by any infrared temperature sensor, such as the MelexisMLX90614. It is a digital infrared temperature sensor, and though it records onemeasurement and transmits it via I2C, when it is coupled with a drone’s agility it canbe used to quickly capture the temperature profile of any given area.
Figure 5.3: Melexis MLX90614 Infrared TemperatureSensor

5.3. IMPLEMENTATION 20
Figure 5.4: Implementation of the openRTLS System
Figure 5.5: openRTLS Anchor Positions
5.3 Implementation
The key feature in the implementation diagram is the presence of two PCs, one for thelocalization and one for controlling the robot. The robot control PC was necessitateddue to the different requirements of robots. In the case of the PARROT drone, itcommunicates with the PC via WiFi, and the user is recommended not to connectthe PC to the internet via Ethernet connection, or to have any other connections(e.g., Bluetooth) active. The Master, which is connected to the Host PC, initiates thesynchronisation process. This involves assigning the Anchors coordinates of the localarea, with the Master always at the Origin, as shown in Figure 4.5.
This is followed by the Anchors and Tags broadcasting their position, and finally, using

21 5.3. IMPLEMENTATION
Trilateration the Master computes the distance of the Tag from each Anchor and itself,and also the coordinates of the Tag. The Tag, owing to its small size, can be attachedto the Parrot drone easily, and this will enable the flightpath and the accurate indoorlocalization. The Parrot has its own PC which gives it control commands. Instead of aPC, one can also use a Laptop or a Tablet, as long as the Linux Operating System isused.
5.3.1 Software
The openRTLS Development Kit has its own proprietary software which serves as ademonstration of the units and for essential updates to the firmware of the Anchors andthe Master. The Python Language was used in Linux to communicate with the MasterAnchor, which was connected to the Host PC using an Ethernet RJ45 cable.
The data from the Master consisted of a string of alphanumeric values and punctuationsto make it readable. An instance of three readings consisted of the following:
LS : Received : {” id ” :”0 xDECA303030601EA0” ,” timestamp”:15295466 ,” msgid ” :69791 ,” coo rd ina t e s ” :{” x ” : 0 . 6 6 4 , ” y” : 0 . 2 2 6 , ” z ” : 0 . 0 0 0 , ” heading ” : 0 . 0 0 0 , ” pqf ” :100} , ” d i s t a n c e s ” : [ { ”anchor ” :”0 xDECA3930304142D9” ,” d i s t ” : 0 . 8 5 4 , ” dqf ” :100} ,{”anchor ” :”0 xDECA333031201D26” ,” d i s t ” : 1 . 2 3 2 , ” dqf ” :100} ,{”anchor ” :”0 xDECA343032401E27” ,” d i s t ” : 0 . 1 7 0 , ” dqf ” : 100} ]}
LS : Received : {” id ” :”0 xDECA303030601EA0” ,” timestamp”:15295515 ,” msgid ” :69792 ,” coo rd ina t e s ” :{” x ” : 0 . 6 6 4 , ” y” : 0 . 2 2 6 , ” z ” : 0 . 0 0 0 , ” heading ” : 0 . 0 0 0 , ” pqf ” :100} , ” d i s t a n c e s ” : [ { ”anchor ” :”0 xDECA3930304142D9” ,” d i s t ” : 0 . 8 4 9 , ” dqf ” :100} ,{”anchor ” :”0 xDECA333031201D26” ,” d i s t ” : 1 . 2 4 6 , ” dqf ” :100} ,{”anchor ” :”0 xDECA343032401E27” ,” d i s t ” : 0 . 1 7 0 , ” dqf ” : 100} ]}
LS : Received : {” id ” :”0 xDECA303030601EA0” ,” timestamp”:15295565 ,” msgid ” :69793 ,” coo rd ina t e s ” :{” x ” : 0 . 6 6 4 , ” y” : 0 . 2 2 6 , ” z ” : 0 . 0 0 0 , ” heading ” : 0 . 0 0 0 , ” pqf ” :100} , ” d i s t a n c e s ” : [ { ”anchor ” :”0 xDECA3930304142D9” ,” d i s t ” : 0 . 8 3 0 , ” dqf ” :100} ,{”anchor ” :”0 xDECA333031201D26” ,” d i s t ” : 1 . 2 2 2 , ” dqf ” :100} ,{”anchor ” :”0 xDECA343032401E27” ,” d i s t ” : 0 . 1 7 0 , ” dqf ” : 100} ]}
The string has pertinent information about all the Anchors, Tag and the distanceinformation as well as signal integrity parameters. They are:
1. The unique ID of each and every unit, starting with the Master

5.3. IMPLEMENTATION 22
Figure 5.6: Missing data from the Master
2. The time-stamp of the message
3. The message identity, which increases by one with each subsequent message
4. The coordinates of the Tag
5. The Power Quality Factor (pqf); a measure of the signal integrity from the Tag
6. The heading of the Tag (from the built-in magnetometer)
7. The distance of the Tag from each of the Anchors, in meters
8. The Distance Quality Factor (dqf), a measure of the signal integrity from eachAnchor
The information, though succinct, needs to be parsed from the string before any mean-ingful experiments can be performed. In a normal case, parsing with Python is notreally a big issue; however there were complications which prevented normal parsing.For instance, during successive testing regimes, it was discovered that some of the mes-sages from the Master appeared to be missing. In other words, the message id wasregistering new messages, but the coordinates of the Tag were not being sent; Figure4.6 illustrates this phenomenon.
As can be seen from the excerpt, the messages with the id 1,2,4 and 5 end early anddo not transmit all the information. This poses a rather interesting problem, which leddown different avenues in pursuit of the solution.
I started by considering it as a whole string, but I was stumped at the beginningas the presence of numerous punctuation marks, brackets and the like meant parsinguntil carriage return or one particular spot was not feasible. Next, I tried the ’regularexpression’ parsing process, or considering the entire string as representative data,with each character, number, alphabet and punctuation mark having its own uniqueindex. One can specify that the data between characters 20 and 36 is important andthus, needs to be parsed. Seemingly, this can do the job but as mentioned earlier,the data coming out from the Master tend to miss a few readings, which would meaninstead of the coordinates, for instance, one would either get empty data or othercharacters or alphabets; which is not adequate. Regular Expressions led me to FiniteAutomata (State Machine) which is a methodology for comparing particular characters

23 5.3. IMPLEMENTATION
in a recursive string. This, while a good read, was not entirely what I was looking interms of parsing.
Eventually, I discovered that converting the data into JSON or JavaScript Object Nota-tion would be the easiest way, as it enables a structured approach with all the characterslucidly displayed. Furthermore, I decided to convert the JSON string into a PythonDictionary. A Dictionary is like an array, and ensures the objects stored to have keysand values. An expression like ’Fruit:Apple’ will have Fruit as the key and Apple asthe value. Thus, to parse the location coordinates, the values were nested inside twokeys, ’X = float (myData[’coordinates’][’x’])’. This solution may have appeared obvi-ous, but the complications arose in the language itself. Although the command ’JSONloads’ converts an expression into a Python Dictionary, it is not immediately evident.If one were to ask the type of the expression, after conversion into the dictionary, theresult still appeared as a string; this was the major obstacle in the process. Once I hadresolved this through trial and error, it became obvious.
The code was developed in Python, a high level language which uses lucid syntax. Thisis where its power lies. A part of the code was already provided by the manufacturerfor the communication protocol, which was expanded to include the parsing, the SQLdatabase and some error correction. The algorithm of the code on the following pagehas been written in the format of Python syntax.

5.3. IMPLEMENTATION 24
Algorithm 1: Python Communication Algorithm
Input : Communication and Data hand-shakingOutput: Parsed x,y,z coordinates stored locally and in an SQL Database
1 begin2 Set up SQL Database3 initialization4 open SQL Database and connect with username and password5 start cursor object to start writing6 prepare SensorData variable for insertion as query7 close DataBase8 Communication Procedure9 open LAN Client with static IP address
10 wait for response11 if no carriage return received then12 print ”Empty Message”13 else14 print ”Complete Message Received”
15 open communication port16 instantiate Xdt, Ydt and Zdt for assignment to an empty list (array)17 while port is open do18 read incoming data19 if length of data received is not zero then20 receive data and decode to utf-821 convert data to JSON dictionary22 store the values of x,y,z coordinates(keys) into Xdt, Ydt and Zdt
explicitly declared as floats; store values in a local text file23 store values in the SQL SensorData variable
24 else25 print ”Empty Data”
26 print ”No data received

Chapter 6
Experimental Results and GUI
6.1 Testing
Now that we have looked at our Architecture and how we can implement it, we need toestablish that the UWB kit is accurate, precise and provides enough of a refresh rateto continuously sample data at a fast enough throughput. The bundled proprietarysoftware did not provide any way to save the data, thus the Algorithm presented in theprevious Chapter was used to write a Python Program which could save the locationcoordinates locally in a text file, as well as upload them to an SQL Database runningon an Apache Server.
The testing was carried out in representative indoor office environments. This meantobstacles such as tables, chairs, cupboards were not removed at all, as they constitutea representative environment. The Tag was placed at the same height as the Anchorsand the Master. This was essential for 2D localization, which was the first test carriedout.
6.1.1 Tag Distance Testing
As the name implies, this was done to ensure the distance of the Tag to the Anchors,as reported by the Master, was identical to the one manually measured with a rangefinder. The Leica Disto D2 was used, as it is extremely compact and offers the bestin-class accuracy.
The Master and Anchors were placed in a short ’corrdior’ surrounded by office equip-ment. The Master is shown in red, the Tag in white and the Anchors in yellow. Theheights of them all were established as equal with the Disto D2. The Tag was keptstationary, and the conditions were representative of Line of Sight (LOS).
25

6.1. TESTING 26
Figure 6.1: Leica Disto D2
Figure 6.2: Distance Error Setup

27 6.1. TESTING
Figure 6.3: Distance Error Comparison
The Testing methodology involved taking a distance reading from the Tag with eachAnchor with the Disto D2 and subsequently comparing it with the values obtainedfrom the openRTLS system. The number of readings was large, around 500 to reduceexperimental error and increase precision.
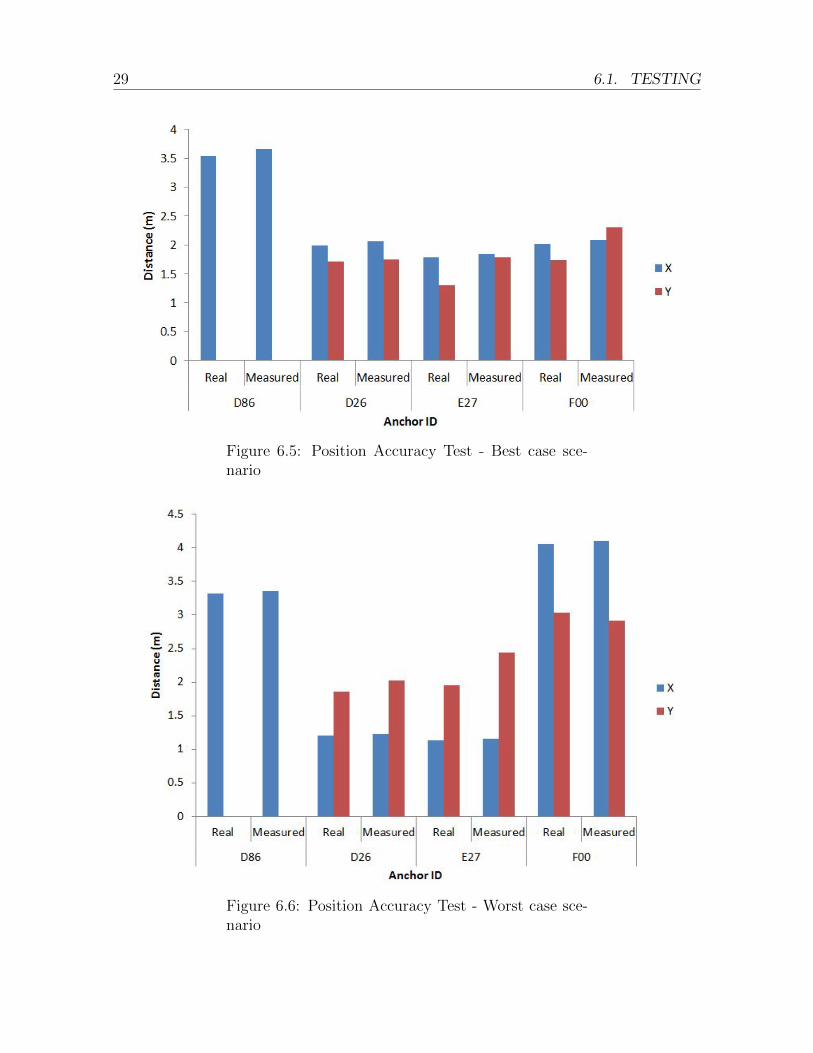
As can be seen in Figure 5.3, the readings fluctuated to around 7 centimeters from theLOS value in this particular instance. In others, the divergence was observed to bearound 25 centimeters. The Average Standard Deviation was found to be 0.014 metersfor one testing regime, and four testing regimes were carried out. The refresh rate ofthe readings, or the number of readings per second, varied directly with the number ofAnchors used. Thus with one Master, and three Anchors the refresh rate was close to19Hz, whereas with seven Anchors and one Master, the refresh rate was 10Hz.
6.1.2 Anchor Position Testing
The Master automatically assigns the Anchors coordinates, with itself being at theorigin. This system, while useful, has its own accuracy and precision. The Anchorspopulate the grid, as shown in Figure 4.5, seemingly at random. For a given area,

6.1. TESTING 28
Figure 6.4: Position Error Setup
after the Master has been switched on, one needs to switch on the Anchors one by onein an anti-clockwise manner for them to appear on the grid as they are positioned inreality.
Testing was carried out to compare the coordinates as assigned by the Master and theones from manual measurements. To ensure reproducibility, a ’round-robin’ methodol-ogy was applied; in which after a round of measurements, the Master would take theposition of the next Anchor and so on, until the Master came to its original starting po-sition. As was the case with Distance testing, the Anchors and the Master were placedat the same height, and to ensure precision, paper stencils of the Anchor’s position werecut so that minor inaccuracies in each rotation could be avoided. The setup is shownin Figure 5.4 below, with the Master in red, Anchors in white and the Tag (not usedin this regime) in yellow. The best and worst case results from four testing regimes areshown, as well as the standard deviation in the results. The major obstacle in testingwas the presence of desks, chairs and shelves which meant the axes, as dictated by theMaster, could not be followed by walking along them and determining the real coordi-nates. Thus, the real measurements have some room for error as well. Furthermore, theAnchor D86 was on the x-axis as such it does not have any y-axis measurement.
29 6.1. TESTING
Figure 6.5: Position Accuracy Test - Best case sce-nario
Figure 6.6: Position Accuracy Test - Worst case sce-nario

6.1. TESTING 30
Figure 6.7: Position Accuracy Test - Standard Devi-ation
6.1.3 Tag Relative Position Error
The Relative Position Error of the Tag can be computed by taking the mean of over 2000real positions, as measured by the Master. The real position is obtained by moving theTag to and fro over a short distance (typically 5 cm). This will reduce any experimentalerror. The mean is then compared with the value of the static Tag, placed on a tripodin the area of prior testing, which would be the estimated tag position. The error canbe calculated as shown, for 2D localization. The error in 3D localization can be easilyobtained by adding the z parameter. The mean µ was found to be 0.02 meters whilethe standard deviation σ was 5.38x10⁻⁴ meters.
e =√
(x− x)2 + (y − y)2

31 6.1. TESTING
Figure 6.8: Relative Tag Error Setup
Figure 6.9: Relative Tag Error

6.2. GRAPHICAL USER INTERFACE 32
Figure 6.10: Graphical User Interface
6.2 Graphical User Interface
Once the experimental results have been established, the requirement for indoor navi-gation dictate a functional and perhaps, even aesthetic GUI for precise control of thedrone. We used the Robot Operating System (ROS) as it provides a modular packagewhich, although has a steep learning curve, it ultimately is a very useful package foradvanced development.
Three components of the GUI were identified as crucial. The data from the accelerom-eter/IMU was essential, as well as live video from the drone and additionally, a 3D mapof the drones path in a 3D space (which can replicate an office environment). Therewere a few options for the 3D part of the interface. ROS provides a package, rviz,dedicated for this purpose. However, that is normally suited for articulating robotswith moving joints. For our needs, a dot in a 3D space would suffice. The x,y,z positionvalues from the Master were stored in a text file, in real time. Python and a librarywith integrated OpenGL was subsequently used to read the values from the text fileand plot them in real time. Storing in a text file served as a buffer, which prevented the3D plot from overloading with too many values. This especially became a problem witha few anchors, since the refresh rate of almost 19 values per second was superfluous.The GUI is presented in Figure 5.10. The IMU of a flight path of the drone is shownon the left hand side, with the live video on the top right and the real time path taken

33 6.2. GRAPHICAL USER INTERFACE
Figure 6.11: 3D Plot in the Graphical User Interface
on the bottom right. The interface was designed such that it illustrates the relevantdata in a clear manner which is not distracting. Furthermore, live video and the 3Dplot ensure the painless navigation of the drone even in unknown environments. The3D plot was designed such it supports ’pinch-to-zoom’, panning and swiping gestures.It can be rotated, tilted and shifted to suit one’s perspective. The plot auto-scales ifthe Parrot reaches the boundaries, but it can also be set to fixed dimensions if they areknown beforehand. A close-up of the 3D plot is shown in Figure 5.11 while the PythonAlgorithm which plots the real time data is shown on the following page.

6.2. GRAPHICAL USER INTERFACE 34
Algorithm 2: GUI Algorithm
Input : x,y,z Position CoordinatesOutput: Real time 3D graph of the coordinates - autoscaling enabled
1 begin2 Initiate Plot Area3 open figure4 add axes5 Animation Function6 open text file for reading only7 split the incoming x,y,z data on each newline8 store x into a dictionary9 store y into a dictionary
10 store z into a dictionary11 for every value in the dictionary do12 if length of each line is greater than 1 then13 split the x,y,z data on the comma14 append the x value to the x dictionary as a float15 append the y value to the x dictionary as a float16 append the z value to the x dictionary as a float
17 clear the figure for a new drawing with new coordinates18 plot a scatter diagram, in red color using a ’o’ marker for each coordinate19 set the axes limit based on the size of the room20 animate the plot with new values with a delay of 100 milliseconds (arbitrary
value)

Chapter 7
Discussion and Conclusion
The functioning GUI and the accurate localization illustrate that a Technology Demon-strator using the Parrot AR.DRONE 2.0 is a feasible solution. The idea to couple thedrone with UWB position data has its roots in the latter’s accuracy and precision. Awireless sensor network has specific requirements [21] which, in our case, had to bemet before the system could function. A drone, which is agile and fast can be usedto fly around indoors. When carrying a UWB Mobile Tag, the drone’s flight path canbe tracked as it flies around. The flight of the drone indoors can be done manually,using the provided Autonomy Drivers from the Open Source Package, AR Drone Au-tonomy. This is essentially an example of a real time embedded system which has itsown limitations and requirements [22].
The position accuracy of the openRTLS UWB sensors was quite adequate, to almostwithin 5 centimeters. The refresh rate, on the other hand, was not so reliable. Withall the Anchors deployed in the area, the measurement refresh rate dropped from 19Hzto almost 9Hz. Ordinarily, this is not bad at all, but in environments with lots ofobstacles and other reflective surfaces, it is inevitable the accuracy of the location datawill suffer. Thus, if one is using the UWB Position data in conjunction with ambientenvironmental sensors such as temperature, pressure and humidity etc., then care mustbe taken to ensure the data gathered has enough position points to accurately constructan environmental imprint.
Going to the Parrot, currently the system is configured to work with two PCs; one tocontrol the drone and another one which is connected to the Master. The reason this isso is due to the fact that the drone communicates with the PC on its own private WiFinetwork. This private connection dictates that no other connection port be opened onthe host PC. Thus, whilst controlling the drone, the PC should always be disconnectedfrom the internet. This Distributed approach has the advantage in that it separates theData Analytics from the piloting of the drone. A separate person/team can monitorthe sensory data while the drone is in flight. In our testing, we demonstrated both usecases; with two PCs and also one PC.
35

7.1. FUTURE WORK 36
7.0.1 Challenges
Some of the challenges faced dealt with the systems integration of the whole project.The Parrot AR.DRONE 2.0 and the openRTLS UWB are two separate systems withtheir own idiosyncrasies, a such it was complicated to understand the limitations ofboth systems while ensuring both ran simultaneously.
Another challenge dealt with the use case scenario of the system. At the start of thisthesis work, this was not clearly defined; the novelty of the project itself appeared tobe the goal. However, through research and greater understanding of the system theuse case scenario of energy modelling and visual inspection was developed.
Finally, the openRTLS system is still under development, as such it has some bugs inthe software which need to be ironed out. Initially, this meant I spent a lot of timetrying to understand the issues and my efforts were more focussed on their mitigationrather than high level development of the solution.
In conclusion, this has been a great project in terms of leaning new programming lan-guages, product development using commercial-off-the-shelf sensors and data analysisof real time embedded systems. The overall idea of the project was quite innovative,and proved to be a great learning experience.
7.1 Future Work
Now that the system has moved from an idea into a working prototype, the next stepsare to debug the system further and also to include fully autonomous flight. The nextstep is sensor fusion of the position data with the IMU data of the drone, optimising itwith an extended Kalmann Filter and then demonstrating autonomous flight.
One other area is the addition of sensors to the Parrot for the environmental panorama.These can be added to the GPIO (General Purpose Input/Output) pins of the Systemon Chip, as shown in Figure 5.12.
Another possible area for future work is safety for indoor flight. The exposed rotors ofdrones are not entirely safe for hazard free indoor use. Granted, one can use speciallydesigned hulls, such as the one with the Parrot AR.DRONE 2.0 for indoor flight, butit too is not entirely hazard free as it leaves the top and bottom parts exposed. Twostartups, both of them based in Switzerland, have tried to address the safety issue;albeit in different ways.
Fotokite is a tethered drone for aerial videography, which means it is attached by apiece of string, and ones pressure and direction tell the drone where to go. The biggestadvantage of having a tether is the complete absence of accidental collisions, as well asno regulatory hurdles to jump through.

37 7.1. FUTURE WORK
Figure 7.1: Additional Sensors on System on Chip ofthe Parrot AR.DRONE 2.0

7.1. FUTURE WORK 38
Figure 7.2: Fotokite - Image courtesy of Stuff.tv
Figure 7.3: Fotokite tether - image courtesy of CNET
Flyability, another Swiss startup, has invented a unique roll-cage which is completelycollision proof and safe. This means it can be sent through ventilation ducts, pipes andeven on reconnaissance through very harsh environments with no risk to the drone.
Figure 7.4: Flyability - image courtesy of Cool Things

Bibliography
[1] Robert G. Hollands (2008): Will the real smart city please stand up?, City, 12:3,303-320
[2] Jianli Pan, Raj Jain, Pratim Biswas, Weining Wang, Sateesh Addepalli, ”A Frame-work for Smart Location-Based Automated Energy Controls in a Green BuildingTestbed”, IEEE EnergyTech 2012, Cleveland, OH.
[3] Krishnan, S.; Sharma, P.; Zhang Guoping; Ong Hwee Woon, ”A UWB based Local-ization System for Indoor Robot Navigation,” in Ultra-Wideband, 2007. ICUWB2007. IEEE International Conference on , vol., no., pp.77-82, 24-26 Sept. 2007 doi:10.1109/ICUWB.2007.4380919
[4] Sharma, P., Krishnan, S., Zhang, G.: ”A multi-cell UWB-IR localization systemfor robot navigation”. Proc. IEEE Radio and Wireless Symp.,Orlando, FL, 2008,pp. 851854
[5] Segura, M; Mut, V; Sisterna, C.,”Ultra wideband indoor navigation system” IETRadar Sonar Navig., 2012, Vol. 6, Iss. 5, pp. 402 411 The Institution of Engineeringand Technology 2012 doi: 10.1049/iet-rsn.2011.0352.
[6] Salman, R.; Willms, I.; Sakamoto, T.; Sato, T.; Yarovoy, A., ”Environmentalimaging with a mobile UWB security robot for indoor localisation and positioningapplications,” in Radar Conference (EuRAD), 2013 European , vol., no., pp.331-334, 9-11 Oct. 2013
[7] Radovnikovich, M.; Fleck, P.; Hallenbeck, K., ”Ultra wide-band trajectory followingfor an omnidirectional factory automation vehicle,” in Technologies for PracticalRobot Applications (TePRA), 2014 IEEE International Conference on , vol., no.,pp.1-6, 14-15 April 2014 doi: 10.1109/TePRA.2014.6869139
[8] Alessandro Benini, Adriano Mancini, and Sauro Longhi. 2013. AnIMU/UWB/Vision-based Extended Kalman Filter for Mini-UAV Localiza-tion in Indoor Environment using 802.15.4a Wireless Sensor Network. J. Intell.Robotics Syst. 70, 1-4 (April 2013), 461-476. DOI=10.1007/s10846-012-9742-1http://dx.doi.org/10.1007/s10846-012-9742-1
39

BIBLIOGRAPHY 40
[9] Kevin Curran, Eoghan Furey, Tom Lunney, Jose Santos, Derek Woods and AidenMc Caughey (2011) An Evaluation of Indoor Location Determination Technologies,Journal of Location Based Services, Vol. 5, No. 2, pp:, June 2011, ISSN: 1748-9725,Taylor & Francis
[10] Mio (c2011). What is trilateration?. Available: http://www.mio.com/technology-trilateration.htm. Last accessed 22nd June 2015.
[11] Blewitt, G (c1997).Basics of the GPS Technique: Observation Equations. Bstad:National Land Survey. p2-3.
[12] Scott, J., Dragovic, B.,Audio Location: Accurate Low Cost Location SensingThird International Conference, PERVASIVE 2005, Munich, Germany, May 8-13,2005. Proceedings Pages pp 1-18 Copyright 2005 DOI 10.1007/11428572 1 PrintISBN978-3-540-26008-0 Online ISBN 978-3-540-32034-0
[13] P. Bahl and V. N. Padmanabhan, ”RADAR: an in-building RF-based user locationand tracking system,” in Proceedings of 19th Annual Joint Conference of the IEEEComputer and Communications Societies (INFOCOM 00), vol. 2, pp. 775784, TelAviv.Israel, March 2000.
[14] Y. Chen and H. Kobayashi, ”Signal strength based indoor geolocation,” in Proceed-ings of the IEEE International Conference on Communications (ICC 02), vol. 1,pp. 436439, New York, NY, USA, AprilMay 2002
[15] Mortaza S. Bargh and Robert de Groote. 2008. ”Indoor localization based on re-sponse rate of bluetooth inquiries,” In Proceedings of the first ACM internationalworkshop on Mobile entity localization and tracking in GPS-less environments(MELT ’08). ACM, New York, NY, USA, 49-54. DOI=10.1145/1410012.1410024http://doi.acm.org/10.1145/1410012.1410024
[16] Mikkel Baun Kjrgaard. 2007. ”A taxonomy for radio location fingerprinting,” InProceedings of the 3rd international conference on Location-and context-awareness(LoCA’07), Jeffrey Hightower, Bernt Schiele, and Thomas Strang (Eds.). Springer-Verlag, Berlin, Heidelberg, 139-156.
[17] Anil Madhavapeddy and Alastair Tse. 2005, A study of bluetooth propagation usingaccurate indoor location mapping,” In Proceedings of the 7th international confer-ence on Ubiquitous Computing (UbiComp’05), Michael Beigl, Stephen Intille, JunRekimoto, and Hideyuki Tokuda (Eds.). Springer-Verlag, Berlin, Heidelberg, 105-122. DOI=10.1007/11551201 7 http://dx.doi.org/10.1007/11551201 7
[18] Mautz, Rainer, Indoor Positioning Technologies, ETH Zurich, Department of Civil,Environmental and Geomatic Engineering, Institute of Geodesy and Photogram-metry (2012). http://dx.doi.org/10.3929/ethz-a-007313554
[19] Gustafsson, F.; Gunnarsson, F., Positioning using time-difference of arrivalmeasurements, in Acoustics, Speech, and Signal Processing, 2003. Proceedings.

41 BIBLIOGRAPHY
(ICASSP ’03). 2003 IEEE International Conference on , vol.6, no., pp.VI-553-6vol.6, 6-10 April 2003 doi: 10.1109/ICASSP.2003.1201741
[20] Zafer Sahinoglu, Sinan Gezici, and Ismail Guvenc. Ultra-wideband PositioningSystems. Cambridge, 2008.
[21] De Angelis, A., Fischione, C. Mobile Node Localization via Pareto Optimization:Algorithm and Fundamental Performance Limitations, IEEE Journal on SelectedAreas on Communications, Vol. 33, No. 7, pp. 12881303, July 2015.
[22] Fischione, C., Park, P., Di Marco, P., Johansson, K. H. Design Principles ofWireless Sensor Networks Protocols for Control Applications, S. Mazumder Ed.,Springer, Chapter 11, pp. 271299, April 2011.