FINDINGS OF THE - canr.msu.edu National... · The 2015 survey findings indicate that as new food...
67
FINDINGS OF THE 2015 NATIONAL FOOD HUB SURVEY APRIL 2016
-
Upload
dangnguyet -
Category
Documents
-
view
213 -
download
0
Transcript of FINDINGS OF THE - canr.msu.edu National... · The 2015 survey findings indicate that as new food...

FINDINGS OF THE 2015 NATIONAL FOOD HUB SURVEY
APRIL 2016

FINDINGS OF THE 2015 NATIONAL FOOD HUB SURVEY
CONTENTS
Executive Summary................................................................4
Introduction .............................................................................6
Findings: Operational Characteristics.....................................8
Findings: Food Safety.............................................................30
Findings: Finances .................................................................34
Findings: Values and Mission .................................................46
Findings: Networks, Challenges, Opportunities,and Barriers to Growth ...........................................................53
Discussion ..............................................................................62
References .............................................................................64
Appendix.................................................................................65
Michigan State University Center for Regional Food Systems & The Wallace Center at Winrock International2

AUTHORSJill Hardy—graduate student, Center for Regional Food Systems, Michigan State University / [email protected]
Dr. Michael Hamm—C. S. Mott Professor of Sustainable Agriculture; Senior Fellow, Center for Regional Food Systems, Michigan State University / [email protected]
Rich Pirog—Director, Center for Regional Food Systems, Michigan State University / [email protected]
Dr. John Fisk—Director, Wallace Center at Winrock International / [email protected]
Jeff Farbman—Program Associate, Wallace Center at Winrock International / [email protected]
Micaela Fischer—Policy Officer for Food and Agriculture, Thornburg Foundation, Santa Fe, New Mexico / [email protected]
ACKNOWLEDGEMENTSFor their invaluable guidance on the formation of the survey and this report, the authors would like to thank Jim Barham, Agricultural Economist, USDA Rural Development, and Gary Matteson, Vice President for Young, Beginning, Small Farmer Programs and Outreach, Farm Credit Council.
FUNDINGFunding from the C. S. Mott Endowed Chair in Sustainable Agriculture at Michigan State University and the W. K. Kellogg Foundation was used to conduct the 2015 National Food Hub Survey and produce this report. Participation by the Wallace Center has been graciously supported by the Kresge Foundation and the Surdna Foundation.
PHOTO CREDITSPage 4 – Mariana Fernandez, The Common Market, Philadelphia, PA
Page 6 – The Common Market, Philadelphia, PA
Page 8 – Kendall Frost, Intervale Food Hub, Burlington, VT
Page 30 – The Common Market, Philadelphia, PA
Page 34 – Eastern Market Corporation, Detroit, MI
Page 46 – Eastern Market Corporation, Detroit, MI
Page 53 – The Common Market, Philadelphia, PA
Page 62 – Eastern Market Corporation, Detroit, MI
SUGGESTED CITATIONHardy, J., Hamm, M., Pirog, R., Fisk, J., Farbman, J., & Fischer, M. (2016). Findings of the 2015 National Food Hub Survey. East Lansing, MI: Michigan State University Center for Regional Food Systems & The Wallace Center at Winrock International. Retrieved from http://foodsystems.msu.edu/resources/2015-food-hub-survey
Michigan State University Center for Regional Food Systems & The Wallace Center at Winrock International 3

The 2015 survey findings indicate that as new food hubs continue to open for business, more established food hubs continue to operate and thrive. One-third of hubs completing the survey began operations in the last two years. Three-fourths of surveyed hubs across the nation are breaking even or better. By comparison, a little over two-thirds (68%) of food hubs were breaking even or better in 2013. We think this change represents an important threshold
that demonstrates the food hub model can be financially successful across a variety of legal structures and geographic or customer markets.1 Our findings suggest that financial success coexists with mission-related success.
1 This report refers to businesses, institutions, and individuals buying product from food hubs as customers or markets interchangeably, depending on context.
EXECUTIVE SUMMARY
Food hubs—businesses that actively manage the aggregation and distribution of source-identified food products—are receiving continued, growing attention from diverse stakeholders who see food hubs as vectors for economic growth and social and environmental change. As consumer desire for local and regional foods continues to grow and evolve, food hubs are increasing in number and adapting to shifting demand from intermediated local and regional food markets. The 2015 National Food Hub Survey and its predecessor, the 2013 National Food Hub Survey, represent a broad effort to aggregate national-level data on the characteristics and impact of food hubs. Together, these surveys represent the beginning of a longitudinal database from a large, broad national sample of food hubs.
Michigan State University Center for Regional Food Systems & The Wallace Center at Winrock International4

KEY FINDINGS FROM THE REPORT • Food hub suppliers and customers are
almost entirely regional. More than 9 out of 10 food hub farm or ranch suppliers are located within 400 miles of the hub, and 3 out of 4 food hub customers are located within 400 miles of the hub.
• Food hubs are good for small and medium agricultural operations. More than 9 out of 10 food hubs source exclusively or mostly from farms and ranches with gross sales less than $500,000. Food hubs have, on average, nearly 80 farmer and food business suppliers.
• Food hubs strive to increase community food access and improve health outcomes. More than 87% of food hubs work to increase access to healthy or fresh food as part of their daily operations and programs. More than 95% of food hubs work to improve human health in their communities or region as part of daily operations and programs.
Almost all food hubs expect that business will continue to grow, but not without challenges.
• Food hubs are addressing challenges that include compliance with the Food Safety and Modernization Act (FSMA). Forty-six percent of hubs already require producers to show proof of food safety regulation compliance. The percentage of hubs requiring Good Agricultural Practices (GAP) certification increased 8% since 2013, and fully two-thirds of hubs either prefer or require GAP certification.
• Food hubs turn to communities of practice and networks for information. Almost half of hubs rely on informal networks and/or formal networks and communities of practice to learn and share business ideas. Formal communities of practice are the most highly ranked information source.
• Food hubs are concerned about maintaining product supply and keeping up with business growth. Securing more supply is a concern for more than half of surveyed hubs; however, less than half of those concerned think they can address this problem within the next year. Managing growth can perhaps be seen as a desirable problem to have. Yet without adequate capital and delivery, staff, and warehouse capacity, each of which was mentioned as a barrier by at least 40% of hubs, growth can quickly become a liability.
In a growing and expanding market, our findings suggest that continued success will require encouraging and growing small and mid-sized producer and processor engagement with food hubs, looking beyond current customer categories, and using capital wisely to grow infrastructure. Organizations supporting food hubs can facilitate networking and manifest food safety and management training opportunities. Food hubs need support organizations to help them explore how to manage growth in ways that allow them to continue to pursue both financial and non-financial goals.
Michigan State University Center for Regional Food Systems & The Wallace Center at Winrock International 5

INTRODUCTION
The results presented in this report expand on the 2013 National Food Hub Survey (Fischer et al., 2013) and present new information on food hubs. Together with the 2013 National Food Hub Survey, the 2015 National Food Hub Survey collected biennial information about food hub finances, structure, operations, markets, customers, suppliers, and challenges. In 2015, the survey included several new topics, such as food safety and business networks. We hope this report provides valuable information for existing and potential food hub operators, organizations that help support hubs, policy makers, advocates, and researchers.
BACKGROUNDAt its core, food hubs are “businesses or organizations that actively manage the aggregation, distribution and marketing of source-identified food products, primarily from local and regional producers, to strengthen their ability to satisfy wholesale, retail and institutional demand” (Barham, 2012). More recently, Fischer et al. (2105a)
suggested that food hubs be defined as “financially viable businesses that demonstrate a significant commitment to place through aggregation and marketing of regional food.” As the food hub concept matures and evolves, so too do stakeholders’ expectations of food hubs.
Michigan State University Center for Regional Food Systems & The Wallace Center at Winrock International6

Food hubs are viewed in many ways:
• As vital connectors between the shrinking number of small and mid-sized farms and large, previously inaccessible markets
• As sources of community economic development and placemaking
• As part of a solution to the complex problem of food and nutritional insecurity
• As a key to scaling up local food
Amid these expectations, the market for local and regional food is growing rapidly (Low et al., 2015; Burt et al., 2015). Food hub operators are left with questions about what defines success for a food hub; how to balance economic, social, and environmental goals; and how to respond to the dual tasks of seizing opportunities and addressing challenges in the growing market for food hub products.
The 2013 National Food Hub Survey (Fischer et al., 2013) and subsequent reports, presentations, and articles based on its results2 provided an initial detailed picture of the food hub landscape and set the stage for the 2015 National Food Hub Survey.
The intent of the 2015 National Food Hub Survey was twofold:
• Provide sound data to food hub operators and other stakeholders to inform decisions and further research.
• Build on the 2013 snapshot and create the first detailed longitudinal dataset on the operational and fiscal health of food hubs.
The Web-administered survey was conducted in March, April, and May of 2015. An invitation with a link to the survey was sent to a sample of 547 key U.S. food hub personnel. The 2013 National Food Hub Survey responses, the USDA Food Hub Directory, the National Good Food Network (NGFN) food hub database, and Internet searches conducted by investigators were used to create the invitation list. While a food hub may have had several key
personnel listed in the sample, only one completed survey was included for each food hub. In an attempt to reach all food hubs, nonresearch partners at other universities and institutes with ties to food hubs distributed a generic survey link to groups with whom they worked.
The response rate was 33% and represented 143 hubs. Eight additional organizations that were verified food hubs and were not identified in the initial sample responded via the generic survey link. In total, 151 completed and partial surveys were used in analysis. The 2013 National Food Hub Survey data, which included 107 hub responses, were used in some comparative analysis. See the Appendix (page 65) for details of survey development, sampling, data collection, analysis, and response rate.
Throughout, this report refers to 2013 and 2015 results. For clarification, 2013 results refer to the 2013 National Food Hub Survey, which asked respondents to report on fiscal year 2012, and 2015 results refer to the 2015 National Food Hub Survey, which asked respondents to report on fiscal year 2014.
2 Access to these reports, presentations, and articles is available at the Michigan State University Center for Regional Food Systems website: http://foodsystems.msu.edu/activity/info/national_food_hub_survey
Michigan State University Center for Regional Food Systems & The Wallace Center at Winrock International 7

FINDINGS: OPERATIONAL CHARACTERISTICS
This section includes information on the general structural and physical characteristics of food hubs and a description of hubs’ staff, suppliers, and products.
YEARS IN OPERATIONThe number of years that food hubs reported being in operation ranged from a dozen hubs reporting less than one year to several hubs reporting more than 50 years. The average length in operation was eight years and the median four years. The 2013 National Food Hub Survey reported that nearly one-third (32%) of hubs began operation in the previous two years (see Figure 1). Those hubs presumably either celebrated their third or fourth anniversary in business or are no longer in business as of
the 2015 survey. This means that the 47 hubs indicating they were in operation for two years or less in the 2015 survey are almost certainly new hubs that opened since the 2013 reporting year. Further, several responding hubs indicated that they planned to open their hub’s doors beginning in the 2015 growing season. Hubs indicating that they had not yet begun operations are not included in this analysis, but they do provide additional evidence that the number of food hubs is growing.
Michigan State University Center for Regional Food Systems & The Wallace Center at Winrock International8

FIGURE 1: FOOD HUBS BY YEARS IN OPERATION
2013
0-2 years 32%
3-5 years30%
6-10 years 13%
16-20 years4%
2015
Over 20 years11%11-15
years 10%
0-2 years 31%
3-5 years32%
6-10 years 19%
16-20 years5% Over 20
years 8%
11-15 years
5%
As in 2013, revenue for 2015 was significantly correlated to the age of the hub.3,4 This colinearity5 — the number of years in business and hub revenue increasing proportionally together—is important both observationally and statistically. Observationally, even with new hubs entering the market, older hubs appear to be not just maintaining but increasing their revenue. Details supporting this observation are discussed in the Findings: Finances section. Statistically, throughout this report, there are several mentions that particular variables are correlated to
both the age and revenue of the hub. Because hub age and revenue are colinear, it is uncertain which of these factors (or combination of both factors) is driving the relationship with any third variable.
3 rs = .54, p < .01. 4 Further explanation is provided in the Tutorial for Interpreting Statistical Test Results section of the Appendix. 5 Two variables are considered colinear if (a) each variable can be
graphed as approximately a straight line and (b) a change in one variable corresponds to a similar change in relative magnitude and direction of the other variable.
FIGURE 1: FOOD HUBS BY YEARS IN OPERATION
Note: n=106 Note: n=149
Michigan State University Center for Regional Food Systems & The Wallace Center at Winrock International 9

TABLE 1: PERCENTAGE OF TOTAL SURVEY RESPONSES FROM CENSUS REGIONS
GEOGRAPHIC LOCATION The hubs’ geographic distribution in 2015 was similar to 2013 (see Figure 2). There was no statistical correlation between the number of hubs responding to the survey from a census region and the population of the region. This suggests that there are likely many historical, social, and demographic factors beyond population size that affect where food hubs are located.
Table 1 shows the percentage of responses coming from each of the nine census regions in both 2013 and 2015. The hubs that responded to the survey in either year may not be geographically distributed in proportion to the locations of all known hubs. Because the number of hubs responding in any region is relatively small, it is not appropriate to interpret changes from 2013 to 2015 as accurate confirmation of a growing or shrinking number of hubs in a region.
FIGURE 2: LOCATION OF 2015 NATIONAL FOOD HUB SURVEY RESPONDENTSFIGURE 2: LOCATION OF 2015 NATIONAL FOOD HUB SURVEY RESPONDENTS
21
12
4
18 27
8 26
1520
Census Geographic Divisions
East North Central
East South Central
Middle Atlantic
Mountain
New England
South Atlantic
West North Central
West South Central
* East North Central: IL, IN, MI, OH, WI. East South Central: AL, KY, MS, TN. Middle Atlantic: NJ, NY, PA. Mountain: AZ, CO, ID, MT, NV, NM, UT, WY. New England: CT, ME, MA, NH, RI, VT. Pacific: AK, CA, HI, OR, WA. South Atlantic: DE, FL, GA, MD, NC, SC, VA, DC. West North Central: IA, KS, MN, MO, NE, ND. West South Central: AR, LA, OK, TX.
Census Region*Percentage of Total Responses, 2013 (n = 107)
Percentage of Total Responses, 2015 (n = 151)
New England 16% 13%
Middle Atlantic 16% 5%
South Atlantic 21% 17%
East North Central 11% 18%
East South Central 3% 5%
West North Central 8% 12%
West South Central 5% 3%
Mountain 8% 8%
Pacific 12% 14%
Michigan State University Center for Regional Food Systems & The Wallace Center at Winrock International10

LEGAL AND BUSINESS MODELSThe same 11 legal operating structures for food hubs were identified in both years of the survey. As in the 2013 report, these categories were collapsed into five: nonprofit, for-profit, cooperative, publicly owned, or other (see breakdown in Figure 3). Nonprofit food hubs made up 36% of the survey responses. For-profit entities, including S, C, and B Corps, LLCs, L3Cs, and unspecified for-profit structures, combined to account for 38% of respondents. LLCs (21%) were the most frequently cited for-profit legal structure. Consumer, producer, and hybrid cooperatives accounted for 19% of responses. The remaining 7% of hubs were publicly owned or had another or no formal legal structure..
The numbers of publicly owned hubs or hubs with other legal structures were small. It was not possible in this report to analyze them by legal structure.
A food hub’s legal structure helps define its scope of operations. However, the markets a food hub serves likely influence operations far more than the hub’s legal structure. Market groupings often used include farm to business or institution, farm to consumer, and hybrid (Barham, 2012). These three categories were the options given when the survey was administered in spring 2015. In summer 2015, the USDA proposed three revised categories that better describe food hub markets: wholesale, direct to consumer, and hybrid (Matson, 2015). These new categories reflect a renaming rather than a reclassification. To be consistent with the survey’s wording, this report will use the older categories, recognizing that farm to business or institution most resembles wholesale and farm to consumer resembles direct to consumer. Figure 4 shows the percentage of hubs selling to wholesale market buyers, such as grocery stores, restaurants, health care and educational food service providers, and other distributors (farm to business or institution); community supported agriculture (CSA), buying clubs, mobile units, retail online and brick-and-mortar stores or home delivery (farm to consumer); and a combination of wholesale and consumer (hybrid).
FIGURE 3: FOOD HUBS BY LEGAL STRUCTUREFIGURE 3: FOOD HUBS BY LEGAL STRUCTURE
Non-profit 36%
Cooperative19%
For profit 38%
Other4%
Publicly owned3%
Note: N=151
Over half (52%) of hubs serve both wholesale (farm to business or institution) and direct to consumer (farm to consumer) markets.
This report will refer to the legal organization of the food hub as its legal structure and the market a food hub serves as its business model. Because these classifications represent such fundamental differences between hubs, they, together with the number of years a food hub has been in business, will be used throughout the report to group and compare findings.
FIGURE 4: FOOD HUBS BY BUSINESS MODELFIGURE 4: FOOD HUBS BY BUSINESS MODEL
Farm to business orinstitution
28%
Farm to consumer
20%
Hybrid 52%
Note: N=151
Note: n=151
Note: n=151
Michigan State University Center for Regional Food Systems & The Wallace Center at Winrock International 11
EMPLOYEES AND VOLUNTEERS In 2013 and 2015, food hubs reported using both paid and unpaid labor. Hubs were also asked about their senior managers.
Paid EmployeesThe total number of paid employees working at the food hubs surveyed increased 85% between 2013 and 2015 (see Table 2). While this increase was partly because more hubs responded to the survey, it is also true that the average number of employees per hub increased slightly. The median number of hub employees did not change between 2013 and 2015 overall or for hubs in business for more than two years. However, on average, hubs completing both years of the survey showed a 29% increase in the median number of employees. Of the hubs who provided employee figures for both years, five lost employees, four had no change, and 31 added 1–73 employees. Hubs that have been in business longer,7 have warehouses,8 and, as in 2013, have larger total revenues 9 are likely to have more paid employees. Based on these findings, it is almost certain that food hubs are creating new jobs.
In 2015, 128 hubs reported that, in total, they employed 902 full-time, year-round, non-management employees; 570 full-time, part-time, and seasonal managers; 348 part-time, year-round employees; and 265 seasonal paid employees.
Eighty-eight percent of hubs with paid employees reported having women in paid positions and, on average, 56% of their paid employees were female. Forty-six percent of hubs with paid employees reported having people of color in paid positions and, on average, 38% of their paid employees were people of color.
Unpaid StaffAs in 2013, volunteers, including cooperative members and interns, continued to be important sources of labor for food hubs in 2015. Forty-two percent (n = 106) of hubs indicated that increasing staff was a barrier to growth, and 15% acknowledged that finding reliable seasonal and/or part-time staff was one of the hub’s top five challenges. Since a little more than one-third (39%) of these hubs expected to have the resources or capital to increase staff levels within the next 12 months, volunteers may be an important part of meeting staffing needs.Almost two-thirds (61%, n = 140) of hubs indicated they utilize unpaid or volunteer staff. About one-quarter use unpaid interns (27%), co-op members (22%), or volunteers who help regularly (29%).
7 rs = .35, p < .01. 8 t (124) = 1.86, p < .05. 9 rs = .75, p < .01.
All Hubs Hubs in Business More than Two Years
Hubs Completing Surveys in Both Years
n=40
2013(n = 77)
2015(n = 130)
2013(n = 53)
2015(n = 86)
2013 2015
Total number of employees 1184 2187 1058 1675 564 843
Mean 15 17 20 19 14 21
Median 6 6 9 9 7 9
Minimum/Maximum 0165
0280
0165
1189
1155
1189
TABLE 2: NUMBER OF HUB EMPLOYEES IN 2013 AND 2015 BY VARIOUS FACTORS
Michigan State University Center for Regional Food Systems & The Wallace Center at Winrock International12

Thirty-nine percent use volunteers who help occasionally. Figure 5 shows the mean and median ratio of volunteers to paid employees for different hubs based on legal and business model. If the ratio is greater than 1, the hub has more volunteers than paid employees. The large difference between mean and median figures indicates that there are a few hubs with many volunteers. Hubs with the most
13
12
4
12
11
8
3
2
1
3
2
1
Volunteer to staff ratio (mean) Volunteer to staff ratio (median)
Cooperative (n=18) For-profit (n=13)
Hybrid (n=41)
Nonprofit (n=39)
Farm to consumer (n=13) Farm to business/institution (n=18)
FIGURE 5: RATIO OF VOLUNTEER STAFF TO PAID STAFF BY LEGAL STRUCTURE AND BUSINESS MODEL
volunteers (greater than 100) tended to be either nonprofit or consumer-based cooperatives. Overall, hubs for which a ratio could be calculated (n = 72) had a mean of 10 and a median of 2 volunteers for every paid employee. Sixty-five percent had at least a 1:1 ratio of volunteers to employees. A little more than 1 in 10 hubs (11%) acknowledged that they may be overdependent on volunteers.
FIGURE 5: RATIO OF VOLUNTEER STAFF TO PAID STAFF BY LEGAL STRUCTURE AND BUSINESS MODEL
Senior ManagersManagers play critical roles in shaping business success. The 2015 survey took a closer look at food hub manager experience and education. Forty-two hubs, representing 28% of responding hubs, began operation in the last two years. Presumably, these new hubs needed to find qualified management. In addition, 7% of hubs that answered both years of the survey indicated having a different manager in
2015 than in 2013. It stands to reason that there is a demand for experienced and educated senior food hub managers. Figure 6 shows years of experience for seven key senior food hub manager expertise areas for 2013 and 2015. On average, food hub managers had less experience in all areas in 2015.
Michigan State University Center for Regional Food Systems & The Wallace Center at Winrock International 13

FIGURE 6: FOOD HUB MANAGERS’ EXPERIENCE BY AREA
Note: n is shown in parentheses for each area of experience.* “No experience” was not asked as a separate category in 2013, but this information is captured in the “less than 1 year” category
FIGURE 6. FOOD HUB MANAGERS' EXPERIENCE BY AREA
0% 10% 60%50%30%20% 40% 100%90%80%70%
13% 10% 16% 45%
8% 7%
16%
17% 24% 33%11%
12% 5% 13% 16%21% 33%
13% 17% 16% 41%13%
26% 5% 16% 13%11% 29%
23% 11% 16%17% 33%
6% 20% 20%15% 33%
7%
10% 18%15%
10% 20% 18%20% 25%
8% 25% 15%28% 24%
6%
43% 13% 8%13% 8% 15%
40% 14%22% 5% 19%
22% 22% 11%6% 15% 24%
19% 19% 22%22% 18%
2015 (136)
No experience* Less Than 1 Year
2013 (91)
2013 (91)
2013 (91)
2013 (91)
2013 (91)
2013 (91)
2013 (91)
2015 (134)
2015 (135)
2015 (138)
2015 (138)
2015 (135)
2015 (133)
1-2 Year 3-5 Years 6-10 Years Over 10 Years
Strategic Planning
Management
Production
Food Marketing and Sales
Warehousing/ Distribution of Food
Food Processing
Food Retail
26% 31%
Michigan State University Center for Regional Food Systems & The Wallace Center at Winrock International14

Managers’ lack of experience appears to be, in part, because of the abundance of new hubs. Depending on the area of experience, 21–41% fewer hubs in operation two years or less said their senior manager had at least three years of experience in that area than did hubs in operation more than two years. The exception was production experience: 5% more hubs in operation two years or less said their senior manager had at least three years of production experience than did hubs in operation more than two years. However, when asked if their senior manager had formal training or education in an experience category, hubs in operation for two years or less and hubs in operation for more than two years answered similarly, on average. A small number of hubs reported that their managers had formal training in an experience area but little on-the-job experience in that area (see Table 3). Table 4 illustrates a general but weak trend for hubs in business for a greater number of years to have older senior managers.10
Food hubs have a high percent of post-secondary educated managers. Seventy-one percent of food hub managers (n = 107) completed a four-year, graduate, or professional degree. Another 4% (n = 6) completed a two-year or vocational degree. Newer hubs tended to have managers with more formal education (see Figure 7). Close to half (46%) of hubs in operation for two years or less are managed by an individual with a graduate or professional degree.
10 rs = .27, p < .01.
TABLE 3: PERCENTAGE OF FOOD HUB MANAGERS WITH FORMAL TRAINING BUT NO EXPERIENCE
Area of Experience Formal Training orEducation with One
Year or Less of Experience
Food processing (n = 20) 20%
Food marketing and sales (n = 34) 12%
Strategic planning (n = 44) 9%
Management (n = 45) 9%
Food retail (n = 15) 7%
Production (n = 33) 6%
TABLE 4: AVERAGE AGE OF FOOD HUB’S SENIOR MANAGER BY YEAR AND BY AGE OF HUB
Area of Hub in Years Average Manager Age
2013 2015
0–2 years 44 45
3–5 years 44 48
6–10 years 41 47
11–15 years 51 51
16–20 years 51 52
21 years and over 56 60
Michigan State University Center for Regional Food Systems & The Wallace Center at Winrock International 15

Food hub managers come from a wide educational background (see Table 5). Over a quarter of hubs’ managers (29%) had higher education or degrees in general business, marketing, finance, or accounting.
To summarize, in 2015, food hub managers as a group were less experienced than in 2013, although some had formal training that they had not yet put to use. Hubs in business for two years or less tended to have younger, more highly educated managers with less food hub–related experience. Combined, the senior manager findings point to a possible interpretation that newly established hubs are recruiting younger, well-educated senior managers who may lack practical experience. A challenge is to provide appropriate support, guidance, and training to help these new managers be successful.11
11 One such unique training opportunity is the University of Vermont’s professional certificate in Food Hub Management: http://learn.uvm.edu/program/food-hub-management/.
13%
No college degree
0-2 year (n=45) 6-10 years (n=27)3-5 years (n=45) more than 10 years (n=26)
FIGURE 7: EDUCATION LEVEL OF FOOD HUB MANAGERS BY AGE OF HUB
20%
11%
40%40%39%
4%
11%
2%0%
19%
37%38%
46%
58%
19%
2-year college degree 4-year college degree graduate or professional degree
FIGURE 7: FORMAL EDUCATION LEVEL OF FOOD HUB MANAGERS BY AGE OF HUB
TABLE 5: AREAS OF STUDY BY FOOD HUB MANAGERS WITH HIGHER EDUCATION OR DEGREE
Business, marketing, finance, accounting 29%
Other liberal arts 14%
Other natural science, engineering 13%
Environment, urban planning, recreation, tourism 11%
Medicine, veterinary medicine, law 8%
Horticulture, agriculture, landscape architecture, soil science, sustainable agriculture
8%
Fine arts 5%
Nutrition, culinary arts, food science 4%
Education 3%
Note: n=126
Michigan State University Center for Regional Food Systems & The Wallace Center at Winrock International16

In 2015, on average, about one-third (31%) of hubs’ producers and suppliers were owned or operated by women and one-fifth by people of color (see Table 7). In 2013, on average, hubs indicated that 16% of their producers and suppliers were owned by women and that 29% of their producers and suppliers were owned by people of color.
12 The language of “procured or purchased” in the survey was intended to allow both hubs that paid for product and hubs that brokered product to better understand and answer questions.
PRODUCERS AND SUPPLIERSFor the purposes of this survey, producers and suppliers were defined as farms or ranches, food processors, or nonfood-related businesses not owned by the hub; other distributors; or the food hub’s own farms, ranches, or enterprises. The survey provided hubs an opportunity to report the breadth of their suppliers and producers. While what follows is necessarily an estimate by the food hubs about their producers’ and suppliers’ activities, it nonetheless begins to tell hubs’ supply-side story. Hubs were asked to indicate the number of producers and suppliers from which they procured or purchased product.12 Recognizing that two or more hubs may conceivably be working with the same supplier and thus a specific supplier may be counted more than once, 79 of the hubs surveyed enumerated a total of 6,255 producers and suppliers. In 2015, hubs procured or purchased from an average of 83 and a median of 37 producers and suppliers. There was little change from 2013, when the average was 80 and the median was 36. Hubs procured or purchased from as few as three to as many as 1,500 producers and suppliers. Twenty-eight hubs provided a number of producers and suppliers as well as producer information for both 2013 and 2015; those hubs had a 60% increase in the mean and a 53% increase in the median number of producers and suppliers (see Table 6).
TABLE 6: NUMBER OF PRODUCERS AND SUPPLIERS FOR HUBS COMPLETING BOTH YEARS’ SURVEY
2013 2015
Mean 72 115
Median 38 58
Minimum/Maximum 6–500 3–1500
TABLE 7: PERCENTAGE OF PRODUCERS AND SUPPLIERS OWNED OR OPERATED BY WOMEN OR PEOPLE OF COLOR
Women(n = 88)
People of Color (n = 72)
Mean 31% 20%
Median 30% 8%
Minimum/Maximum 2–100% 0–100%
Note: n=28
Michigan State University Center for Regional Food Systems & The Wallace Center at Winrock International 17

FIGURE 9: PERCENTAGE OF TOTAL BEGINNER PRODUCERS AND SUPPLIERS BY AGE OF HUB
52%60%
52%
30%
0-2 years (21)
Note: n is shown in parentheses for each age category.
3-5 years (21)
6-10 years (15)
11 or more years (14)
FIGURE 9: PERCENTAGE OF TOTAL BEGINNER PRODUCERS AND SUPPLIERS BY AGE OF HUB
Note: n is shown in parentheses for each age category.
FIGURE 8: PERCENTAGE OF HUBS PURCHASING OR PROCURING PRODUCT
Farms or ranches not owned or managed by the hub
FIGURE 8: PERCENTAGE OF HUBS PURCHASING OR PROCURING PRODUCT BY ENTERPRISE TYPE
32%
15%
25%
60%
91%
Food processors not owned by the hub
A different food distributor
The food hub’s own farms, ranches, enterprises
Nonfood-related businesses
Note: n=111Note: n=111
Figure 8 shows the percentage of hubs procuring or purchasing product from various sources. One-quarter of hubs are maintaining their own farms, ranches, or enterprises and distributing the products produced. Almost one-third of hubs (32%) are procuring product from other distributors and 15% from nonfood-related suppliers.
Beginning Producers and SuppliersThe USDA defines a beginning farmer or rancher as one who has been farming less than 10 years (USDA, 2010). The 2015 survey extended this definition to include any non-hub-owned food processors and nonfood-related businesses and other distributors from which a hub purchased or procured product. In 2015, on average, half of a hub’s producers and suppliers began business in the last 10 years (n = 71), an increase of 24% from 2013. Hubs that answered about beginning producers and suppliers in both years showed a 4% increase, from 47% to 51%. Hubs in business for less time13 and those with less revenue14 were more likely to report that a higher percentage of their total producers and suppliers were beginners (see Figure 9).
13 rs = –.45, p < .01. 14 rs = –.32, p < .01.
Michigan State University Center for Regional Food Systems & The Wallace Center at Winrock International18

Producer Certifications and PracticesHubs were asked to indicate if they required, preferred, or had no preference for producers and suppliers to use particular practices or have certain certifications.15 Responses are shown in Figure 10. For better comparison from 2013 to 2015, the percentage calculation for 2015 excludes hubs responding “not applicable” for a certification or practice, and the percentages include only hubs stating that they either preferred or required producers and suppliers to use specific practices or have certain certifications. First, it is important to note that for all categories, at least 53% of applicable hubs either preferred or required a certification or practice. However, in 2015, hubs were less likely than in 2013 to require any particular practice or certification except for Good Agricultural Practices (GAP) certification (14% in 2015 vs. 8% in 2013). Taking both requirements and preferences together, hubs were also less likely than in 2013 to either require or prefer any practice or certification except Certified Humane (80%), GAP certification (74%), and Marine Stewardship Council certification (53%).
Hubs in business less than two years more often required non-certified organic (24%, n = 100), grass-fed (17%, n = 83), free-range/pasture-raised (28%, n = 87), and antibiotic-free (33%, n = 83) practices than hubs in business more than two years (non-certified organic: 6%, grass-fed: 7%, free-range/pasture-raised: 15%, antibiotic-free: 21%). Hubs in business for two or more years were more likely to require integrated pest management (IPM; 9%, n = 96) and third-party certifications such as GAP (18%, n = 101), Certified Naturally Grown (7%, n = 93), and Good Handling Practices (GHP; 8%, n = 92) than hubs in business less than two years (IPM: 0%, GAP: 6%, Certified Naturally Grown: 3%, GHP: 3%).16
Farm to business or institution hubs were more likely to require any category of practices or certifications than hybrid or farm to consumer hubs. Farm to business or institution hubs (27%, n = 30) were three times more likely than hybrid hubs (9%, n = 56) and 4.5 times more likely than farm to consumer hubs (6%, n = 16) to require GAP certification.17
15 Some hubs specialize in livestock and/or seafood or, conversely, carry only plant-based products. Recognizing that some certifications and practices may not apply to the producers and suppliers of some hubs, the 2015 survey allowed hubs to answer “not applicable” to any certification or practice.
16 To ensure a robust analysis by age of hub, practices required by 5% or less of hubs were not included.
17 To ensure a robust analysis by market type, practices required by 5% or less of hubs were not included.
Michigan State University Center for Regional Food Systems & The Wallace Center at Winrock International 19

FIGURE 10: FOOD HUB REQUIRED AND PREFERRED PRODUCER/SUPPLIER CERTIFICATIONS AND PRACTICES BY YEAR
43%
25%
49%
63%
35%
19%
60%
68%
8%
14%
67%
68%
8%
5%
51%
54%
9%
7%
58%
67%
11%
2%
60%
57%
12%
3%
63%
77%
13%
1%
54%
74%
17%
13%
73%
65%
22%
10%
65%
72%
24%
13%
65%
68%
2%
6%
75%
64%
8%
2%
63%
67%
6% 41%
53%
FIGURE 10. FOOD HUB REQUIRED AND PREFERRED PRODUCER/SUPPLIER CERTIFICATIONS AND PRACTICES BY YEAR
Note: n is shown in parentheses for each certification or practice.
Require Prefer
Antibiotic-free 2015 (87)
2013 (53)
Free-range/ Pasture-raised 2015 (88)
2013 (57)
Chemical-free 2015 (97)
2013 (46)
Grass-fed 2015 (84)
2013 (51)
Non-certified but practicing organic 2015 (101)
2013 (59)
Animal Welfare Approved 2015 (73)
2013 (39)
Certified Humane 2015 (74)
2013 (41)
USDA certified organic 2015 (103)
2013 (65)
Good Handling Practices certified 2015 (93)
2013 (43)
Certified Naturally Grown 2015 (94)
2013 (51)
Good Agricultural Practices certified 2015 (102)
2013 (52)
Fair trade 2015 (61)
2013 (41)
Marine Stewardship Council certified 2015 (32)
2013 (32)
Integrated pest management 2015 (97)
2013 (51)
Note: n is shown in parentheses for each certification or practice.
43%
25%
49%
63%
35%
19%
60%
68%
8%
14%
67%
68%
8%
5%
51%
54%
9%
7%
58%
67%
11%
2%
60%
57%
12%
3%
63%
77%
13%
1%
54%
74%
17%
13%
73%
65%
22%
10%
65%
72%
24%
13%
65%
68%
2%
6%
75%
64%
8%
2%
63%
67%
6% 41%
53%
FIGURE 10. FOOD HUB REQUIRED AND PREFERRED PRODUCER/SUPPLIER CERTIFICATIONS AND PRACTICES BY YEAR
Note: n is shown in parentheses for each certification or practice.
Require Prefer
Michigan State University Center for Regional Food Systems & The Wallace Center at Winrock International20

FIGURE 13: CHANGE IN TOTAL YEARLY AMOUNT PURCHASED FROM SMALL AND MID-SIZED FARMS SINCE 2013
FIGURE 11: NUMBER OF SMALL OR MID-SIZED FARMS AND RANCHES AS PRODUCERS AND SUPPLIERS
Note: n=99
Small and Mid-Sized Farms and RanchesHubs were asked how many of their total producers and suppliers are farms and ranches, and they enumerated 4,083, accounting for 65% of their total suppliers. As with the total number of producers and suppliers, two or more hubs may be working with the same farms and ranches, although this is unlikely. Hubs were also asked how many of their total producers and suppliers were small or mid-sized farms and ranches (defined as having gross sales less than $500,000). Ninety-two percent of food hubs reported that most or all of their farm and ranch suppliers were small or mid-sized (see Figure 11).
Over their hub’s lifetime, 72% of hubs said the total yearly amount spent on product from small and mid-sized farms and ranches had increased (see Figure 12), and 70% said the total yearly amount had increased in the last two years (see Figure 13).
FIGURE 11: NUMBER OF FARMS AND RANCHES THAT ARE SMALL OR MID-SIZED
All37%
Most 55%
Few1%
None1%
Some6%
Note: N=99
FIGURE 12: SINCE HUB BEGAN: CHANGE IN TOTAL YEARLY AMOUNT PURCHASED FROM SMALL AND MID-SIZED FARMS
Increaseda lot41%
Increaseda little 31%
Decreased a lot1%
Decreaseda little
6%
Stayedthe same
21%
Note: N=100
FIGURE 13: SINCE 2013: CHANGE IN TOTAL YEARLY AMOUNT PURCHASED FROM SMALL AND MID-SIZED FARMS
Increaseda lot27%
Increaseda little 43%
Decreased a lot0%
Decreaseda little
5%
Stayedthe same
25%
Note: N=9
FIGURE 12: CHANGE IN TOTAL YEARLY AMOUNT PURCHASED FROM SMALL AND MID-SIZED FARMS SINCE HUB BEGAN
Note: n=100 Note: n=97
Michigan State University Center for Regional Food Systems & The Wallace Center at Winrock International 21

FIGURE 14: NUMBER OF PRODUCT CATEGORIES CARRIED BY HUBS
TYPES OF PRODUCTS SOLDFood hubs were asked about 11 different categories of products (see Figure 14 for the average number of categories and Figure 15 for categories). Hubs with more categories of product were somewhat more likely to purchase or procure product from more producers and suppliers.18 Farm to consumer hubs (n = 17) averaged eight product categories, hybrid hubs (n = 59) averaged five, and farm to business or institution hubs (n = 24) averaged four product categories.
Almost all hubs (92%) carried fresh produce and herbs (see Figure 15). Eggs and meat/poultry were each carried by 65% of hubs. Approximately half of hubs carried milk and other dairy products (51%); grains, beans, and flours (51%); processed produce (46%); or other processed or value-added products (53%). Figure 15 also shows that there was little change between 2013 and 2015 in the percentage of hubs carrying particular product categories.
18 rs = .37, p < .01.
FIGURE 14: NUMBER OF PRODUCT CATEGORIES CARRIED BY HUBS
119%
4 to 5 23%
6 or more 46%
2 to 3 12%
Note: N=110Note: n=110
Michigan State University Center for Regional Food Systems & The Wallace Center at Winrock International22

There was little change between 2013 and 2015 in the average percentage of food hub gross sales in each product category. In 2015 (n = 110), fresh produce and herbs accounted for 63% of total gross sales on average. Meat and poultry accounted for 26% on average. Milk and dairy products accounted
for 10% of average gross sales; processed produce 9% and other processed products 10%; eggs 6%; grains, beans, and flours 6%; bread and other baked goods 4%; fish and seafood 4%; coffee and tea 2%; and nonfood items 2%.
92%93%
65%65%
65%60%
53%52%
51%50%
51%37%
46%38%
35%41%
24%29%
28%21%
12%13%
FIGURE 15: PERCENTAGE OF FOOD HUBS CARRYING PRODUCTS BY CATEGORY
2015 (n = 110) 2013 (n = 81)
Fresh produce and herbs
Meat and poultry
Eggs
Other processed or value-added products
Milk and other dairy products
Grains, beans, flours
Processed produce
Baked goods/bread
Nonfood items
Coffee/Tea
Fish and seafood
FIGURE 15: NUMBER OF PRODUCT CATEGORIES CARRIED BY HUBS
Michigan State University Center for Regional Food Systems & The Wallace Center at Winrock International 23

$0.00
$0.10
$1.00
$0.90
$0.80
$0.70
$0.60
$0.50
$0.40
$0.30
$0.20
$0.58
$0.18
$0.05
$0.05
$0.04
$0.04
$0.03$0.03
Gross Sales
Fresh produce/herbs
Meat, poultry, and fish
Milk and dairy
Other processed
Eggs
Processed produce
Grains, beans, and floursOther
One useful way to think about category sales is as a portion of one dollar in sales across all food hubs. Figure 16 shows that the two largest sales-generating categories across all hubs are fresh produce or herbs, accounting for 58 cents of every
dollar in food hub sales, with meat, poultry, and fish accounting for 18 cents of every sales dollar. All other categories combined accounted for 24 cents of every dollar in sales.
FIGURE 16: TOTAL FOOD HUB SALES AS A FRACTION OF $1
Michigan State University Center for Regional Food Systems & The Wallace Center at Winrock International24

INFRASTRUCTURE Despite the apparent growth of the food hub sector in total number of hubs, food hubs reported little change in infrastructure utilization between 2013 and 2015 (see Figure 17).
However, for the 28 hubs that answered in both 2013 and 2015, the percentage of hubs with their own office space and space to rent to other businesses increased (see Figure 18).
86%78%
FIGURE 18: SAME-HUB INFRASTRUCTURE TYPES IN BOTH SURVEYS
2015
82%81%
75%78%
71%67%
14%15%
11%7%
32%22%
Note: N = 28
2013
FIGURE 18: SAME-HUB INFRASTRUCTURE TYPES ACROSS SURVEYS
Note: n=28
Office space for the hub
Trucks
Warehouse
Online ordering system
Processing facilities
Retail space for the hub
Rental space for other businesses
79%78%
FIGURE 17: FOOD HUB INFRASTRUCTURE TYPES
69%70%
66%70%
59%59%
26%23%
22%22%
18%17%
2015 (n= 124) 2013 (n= 75)
FIGURE 17: FOOD HUB INFRASTRUCTURE TYPES
Office space for the hub
Trucks
Warehouse
Online ordering system
Processing facilities
Retail space for the hub
Rental space for other businesses
Michigan State University Center for Regional Food Systems & The Wallace Center at Winrock International 25

Among business types in 2015, hybrid hubs (n = 78) most often had delivery vehicles (75%), processing facilities (34%), retail space for the hub (32%), and licensed shared-use kitchens (21%). Farm to business or institution hubs (n = 41) most often had warehouses (74%) and office space for the hub (81%). Farm to consumer hubs (n = 26) most often had online ordering systems (73%).
Warehouse and delivery fleet size, online ordering systems, and usage of licensed shared-use kitchen space varied among hubs. Of the 91 hubs reporting on warehouse size, 25% had warehouse space under 1,200 square feet, and another 25% had warehouse space over 6,000 square feet. Farm to business or institution hubs were more likely than other customer market types to have a warehouse. However, all three market types had the same median warehouse size of 3,000 square feet. Three-quarters (75%, n = 99) of hubs with trucks, vans, or other delivery vehicles had four vehicles or fewer. Seventy percent of all hubs (n = 143) offered transportation services for producers, irrespective of owning delivery vehicles. Nine out of 10 hubs (n = 30) indicating that they had sales income from online sales had an online ordering system. Regardless of having an online ordering system, if a hub was selling via the Web, online sales accounted for 65% (n = 27) of sales on average. Licensed shared-use kitchens were available at 15% of hubs (n = 135). In most cases, hubs allowed a variety of groups or organizations, including those that were not currently suppliers, to access the kitchen facility (see Table 8).
Overall, hub infrastructure makeup was fairly unchanged since 2013 and differed mostly by the type of market a food hub served. For 30–45% of hubs, a lack of certain infrastructure elements such as vehicles, warehouse space, and processing facilities was cited as a barrier to growth (see Findings: Networks, Challenges, Opportunities, and Barriers to Growth, page 53).
Percent of Hubs Allowing Use
Food hub’s current suppliers and producers
90%
Potential, incubator, or startup food businesses that are not currently the food hub's producers or suppliers
90%
Community organizations or public rentals for parties, events, fundraisers, etc.
70%
Mature food businesses that are not currently the hub’s suppliers or producers
75%
TABLE 8: LICENSED SHARED-USE KITCHEN USAGE
Note: n=21
Michigan State University Center for Regional Food Systems & The Wallace Center at Winrock International26

CUSTOMERS Food hubs were asked to indicate if they worked with a particular customer category and, if so, the percentage of gross sales for that customer category. Percentage of gross sales by customer is discussed in the Findings: Finances section (page 34). The category including restaurants, caterers, bakeries, and corporate caterers is the only customer group serviced by more than half of hubs in both 2013 (58%) and 2015 (61%; see Figure 19). Fewer hubs sold product through their own retail storefront in 2015 (10%) than in 2013 (20%). In 2015, the percentage of hubs selling though online stores (+12%) and CSA (+6%) increased over 2013 levels.
On average, hubs served four types of customers. Hubs in operation less than two years served four customer types on average, while hubs in operation more than two years served an average of five customer types. This is reflected in Figure 20, where a greater percentage of hubs operating more than two years are serving more categories of customers than those in operation two years or less. As in 2013, the total revenue of the hub is somewhat positively correlated to the number of customer types a hub serves,19 as is the number of years a hub has been in operation.20 Farm to business or institution and hybrid hubs sold to an average of five customer types, while farm to consumer hubs sold to two customer types.
Restaurants/caterers/bakeries/corporate caterers (62%), K–12 food service (38%), and small local or regional grocery stores (35%) are served by the highest percentages of food hubs in operation two years or less, and these categories may represent good prospects for beginning hubs looking to diversify their customer base. Online stores (29%) and CSA (26%) may also be good prospects, but hubs tend to work more exclusively with these two categories of customers (see Figure 20).
19 All hubs: rs =.28, p<.01; hubs with > 1 customer type: rs =.35, p< .01. 20 All hubs: rs = 20, p< .05; hubs with > 1 customer type: rs =.24, p< .01.
Michigan State University Center for Regional Food Systems & The Wallace Center at Winrock International 27

FIGURE 19: AVERAGE PERCENTAGE OF HUBS SELLING TO CUSTOMER TYPES BY YEAR
Mobile retail units
Pre-K food service
Hub’s own retail storefront
Food processors
Buying clubs
Farmers markets
Hospitals
Large supermarkets or supercenters
Food cooperatives
Distributors
Online stores
Colleges/Universities
K-12 food service
Small local or regional supermarket chains*
CSA
Corner stores, bodegas, or independent grocery stores*
Restaurants/Caterers/ Bakeries/ Corporate caterers
Senior care †
*These categories were given as separate options in 2013. The percentage shown represents the combined category for 2013.†This category was not given as an option in 2013.
FIGURE 19: AVERAGE PERCENTAGE OF HUBS SELLING TO CUSTOMER TYPES BY YEAR
7%6%
10%20%
13%15%
18%24%
5%6%
20%18%
20%22%
21%27%
26%24%
27%24%
28%16%
29%27%
31%35%
33%39%
35%29%
39%39%
61%58%
9%
2015 (n = 107) 2013 (n = 82)
Michigan State University Center for Regional Food Systems & The Wallace Center at Winrock International28

FIGURE 20: FOOD HUB CUSTOMERS BY AVERAGE PERCENT OF HUBS SELLING TO THEM BY YEARS IN OPERATION
FIGURE 20: FOOD HUB CUSTOMERS BY AVERAGE NUMBER OF HUBS SELLING TO THEM BY YEARS IN OPERATION
38%28%
35%32%
29%27%
26%31%
62%61%
26%37%
24%47%
21%31%
18%21%
18%31%
15%21%
15%25%
9%7%
8%15%
8%22%
6%12%
6%4%
8%3%
2 or fewer years (n = 42) More than 2 years (n = 72)
Restaurants/Caterers/ Bakeries/ Corporate caterers
K-12 food service
Small local or regional supermarket chains
Online stores
Colleges/Universities
CSA
Corner stores, bodegas, or small independent grocery stores
Distributors
Hospitals
Food cooperatives
Farmers markets
Large supermarkets or supercenters
Mobile retail units
Food processors
Buying clubs
Hub’s own retail storefront
Senior care
Pre-K food service
Michigan State University Center for Regional Food Systems & The Wallace Center at Winrock International 29

FINDINGS: FOOD SAFETY
A new section on the 2015 survey, food safety is receiving increasing attention and concern from food hubs as Food Safety and Modernization Act (FSMA) rules begin to affect small and mid-sized farmers.
The current food hub customer demand for food safety certification is mixed. Among hubs that sold product to businesses or institutions, 77% indicated that, on average, 35% of their customers required GAP certification.21 The remaining hubs selling to businesses or institutions (23%) had no customers who required GAP. Similarly, for the 72% of hubs selling to businesses or institutions, on average, 32% of their customers required GHP.22 However, the average does not provide a complete picture. If a hub had some customers that required either GAP or GHP, about a fifth of hubs (GAP: 16%, GHP: 18%) had 90–100% of their customers requiring certification. On the other end, about half of hubs (GAP: 48%, GHP: 50%) had only 1–10% of their customers requiring certification.
Voluntary customer food safety requirements exist in the context of federal food safety legislation and FSMA in particular (see sidebar, page 31). Food hubs are in agreement that FSMA will affect their operation in some way. Almost all (98%) food hubs acknowledged that in light of the possible implications, it was important that their producers and suppliers complied with FSMA standards (see Figure 21). Of the hubs that acknowledged the importance of FSMA compliance, 98% expressed concern over their suppliers’ ability to meet the new standards (see Figure 22).
21 Twenty-four percent of hubs who saw this question did not provide an answer. 22 Thirty-four percent of hubs who saw this question did not provide an
answer.
Michigan State University Center for Regional Food Systems & The Wallace Center at Winrock International30

Not only producers and suppliers will be affected by FSMA; food hubs will also need to comply with additional food safety requirements. Eighty-three percent of food hubs (n = 104) registered concern about their own ability to comply with FSMA. Hubs’ overall top five challenges reflect this concern. Nearly one-third (31%) of hubs (n = 117) said meeting GAP or another food safety certification was a challenge.
What is the Food Safety and Modernization Act (FSMA)? Signed into law in 2011, the Food Safety and Modernization Act is the most comprehensive U.S. food safety regulation overhaul since the Food, Drug, and Cosmetic Act of 1938. The law provides a creation process for food safety rules and accompanying guidance. Rules and guidance are drafted by the governing authority, the U.S. Food and Drug Administration, with input from other government agencies. They are then presented for industry and public comment before a final rule is issued.
What does FSMA cover? FSMA includes standards on how fresh produce is grown and handled. It covers the processing and manufacturing of food for human or animal consumption. It also provides provisions for third-party monitoring and certification and addresses food safety issues in the transportation process.
What kinds of businesses are affected by FSMA? A business is likely to be affected by FSMA if it raises livestock, grows produce, or processes, transports, or distributes food for human or animal consumption.
How long do food hubs and their producers have to comply? Businesses comply with a rule based on an effective date. Some effective dates have passed, and some will not occur until 2018. Effective dates tend to be graduated, with small farms tending to have later effective dates.
FIGURE 22: CONCERN OVER SUPPLIERS ABILITY TO COMPLY WITH FSMA FOR HUBS ANSWERING AT LEAST SOMEWHAT IMPORTANT FOR SUPPLIERS TO COMPLY WITH FSMA (N=101)
Extrememly concerned
25%
Very concerned
31%
Not at all concerned
2%
Somewhat concerned
42%
FIGURE 21: IMPORTANCE OF SUPPLIERS’ COMPLIANCE WITH FSMA STANDARDS
Note: n=103
FIGURE 22: CONCERN OVER SUPPLIERS’ ABILITY TO COMPLY WITH FSMA STANDARDS
Note: Only hubs answering that it was at least somewhat important for suppliers to comply with FSMA (n = 101) are included
FIGURE 21: IMPORTANCE THAT SUPPLIERS COMPLY WITH FSMA STANDARDS (n=103)
Somewhat important
20%
Very important41%
Not important at all2%
Extremely important
37%
Michigan State University Center for Regional Food Systems & The Wallace Center at Winrock International 31
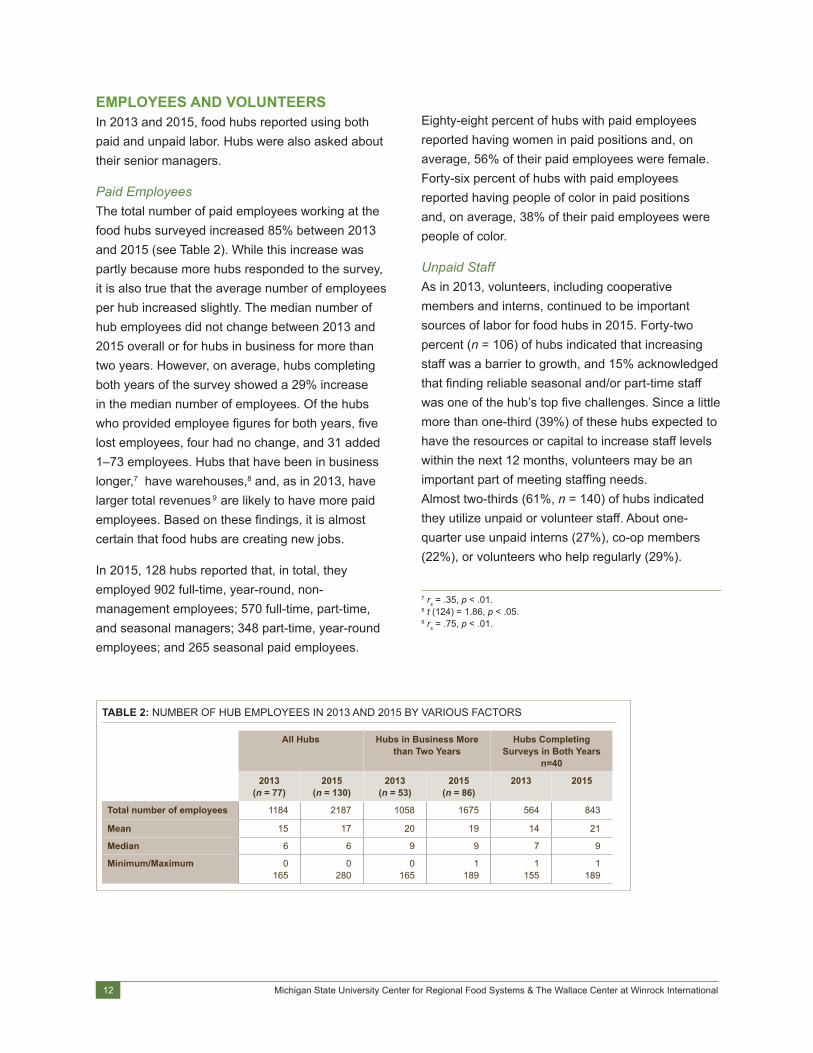
As hubs begin to think about implementing FSMA and get requests from buyers for certification, they are placing requirements for food safety training, third-party food safety certification, and/or internal food safety monitoring on their producers and suppliers. Hubs having their own incubator or farm more often place a requirement for food safety training on their own farm (56%) than on farmers and ranchers (28%) or on non-farmer producers and suppliers (23%) that they don’t own or manage (see Figure 23).
Over two-thirds of hubs prefer their producers and suppliers to have GAP (69%) and/or GHP (67%) certification, while a smaller percentage of hubs require certification (GAP: 14%, GHP: 6%; see Figure 24). Between 2012 and 2014, the percentage of hubs preferring or requiring GAP certification increased from 75% to 83%. Similarly, the percentage of hubs preferring or requiring GHP certification increased from 67% to 73%.
FIGURE 23: REQUIREMENTS FOR PRODUCER AND SUPPLIER FOOD SAFETY TRAINING
FIGURE 23: HUBS’ REQUIREMENTS FOR PRODUCER AND SUPPLIER FOOD SAFETY TRAINING
Required Required for some
47%
23%26%
51%
56%13%
31%
28%25%
Not required
Farmers and ranchers (89)
Non-farmer producers and suppliers (72)
Hub’s incubator or hub-owned farm (16)
Note: n is shown in parentheses for each category.
FIGURE 24: : HUB PREFERENCES FOR PRODUCER AND SUPPLIER FOOD SAFETY CERTIFICATION
Good Agricultural Practices (GAP) or group GAP (102)
Good Handling Practices (GHP) (93)
Note: n is shown in parentheses for each certification.
FIGURE 24: HUB PREFERENCES FOR PRODUCER AND SUPPLIER FOOD SAFETY CERTIFICATION
No preference Preferred
69%
27%
67%
6%
17%
14%
Required
Michigan State University Center for Regional Food Systems & The Wallace Center at Winrock International32

Overall, hubs are more likely to require internal monitoring methods rather than required GAP or GHP certification. Figure 25 shows the requirements hubs use to monitor producers’ and suppliers’ food safety practices.
Hubs are investing in food safety. Forty-nine percent (n = 107) have staff responsible for the hub’s internal food safety compliance. Some hubs provide personnel and services to assist with and encourage producers and suppliers to engage in food safety practices (see Table 9). One-third of hubs have staff responsible for ensuring food safety training
and compliance for suppliers and producers. As previously noted, 41% of hubs require that producers and suppliers have a food safety plan (see Figure 25), and nearly two-thirds (61%) are willing to assist producers and suppliers in the development of such plans. Similarly, 14% of hubs require GAP certification (see Figure 24), and 43% are willing to assist with or provide GAP training and certification.
Overall, 82% of hubs (n = 105) stated that they take a clear position on the importance and value of voluntary food safety programs.
FIGURE 25: HUB FOOD SAFETY REQUIREMENTS FOR PRODUCERS AND SUPPLIERS HANDLING FOOD PRODUCTS
Require proof of compliance with applicable food safety
regulations (103)
Require a food safety plan (99)
Require a copy of a yearly food safety self-audit (101)
Note: n is shown in parentheses for each certification.
Percent of hubs offering service
Assist producers and suppliers in developing or reviewing food safety plan
61%
Incentivize producer engagement with food safety 35%
Provide staff person responsible for food safety training and producers’ and suppliers’ compliance
33%
Assist with or provide GAP training and certification 43%
TABLE 9: HUBS’ FOOD SAFETY SERVICES FOR SUPPLIERS AND PRODUCERS
Note: n = 105.
FIGURE 25: HUB FOOD SAFETY REQUIREMENTS FOR PRODUCERS AND SUPPLIERS HANDLING FOOD PRODUCTS
All producers/suppliers Only farmers and ranchers
12%
23%18%
59%
34%
54%
No producers/suppliers
9%16%
75%
Michigan State University Center for Regional Food Systems & The Wallace Center at Winrock International 33

FINDINGS: FINANCES
Without a solid financial base, no business can expect long-term viability. Unlike traditional businesses occupying analogous food supply chain spaces, food hubs have additional financial challenges that come from embracing environmental and social missions. Some of these challenges may include running social programs, managing grant and donation revenue, and ensuring that people, animals, and the environment are not exploited in the business process. For these reasons, having an understanding of food hubs’ unique financial situation is important. This section examines sales and non-sales revenue as well as operational expenses.23 Recognizing that every hub is unique, a calculated financial ratio, Operating Expense Ratio (OER), is used to make financial viability comparisons. This section concludes with discussions concerning profit and loss balance, loan readiness, and startup funds.
GROSS REVENUEIn 2015, 113 food hubs in total reported gross revenues in excess of $370 million. Despite only 37% of hubs providing revenue figures in both 2013 and 2015, the percentage of hubs in each revenue category looks similar (see Figure 26).
In 2015, hubs reported as little as $5,000 to as much as $96 million in total gross revenue. Table 10 shows the number of hubs reporting and the mean, median, and range of total revenue by various categories for both survey years. Because of the large range of
revenues and the small number of hubs reporting in each category, mean and median are not the best measures to compare across years or categories.
23 In this report, gross revenue is defined as the total revenue generated from all sources and may be referred to as revenue. Total gross sales revenue is defined as the revenue generated from sale of products to customers and may be referred to as sales. Operating expenses is defined as the amount of revenue used to conduct business and may be referred to as expenses. All other definitions are included in the text.
Michigan State University Center for Regional Food Systems & The Wallace Center at Winrock International34

FIGURE 26: FOOD HUB REVENUE FOR 2013 AND 2015FIGURE 26: FOOD HUB REVENUE FOR 2013 AND 2015
2015 Survey: Food hub revenue for 2014 calendar year (N=113)
$1,000,001-$2,000,000
19%
$200,001-$500,000
25%
$100,001-$200,000
15%
$100,000 or less19%
over $7,000,0008% $2,000,001-
$7,000,0008%
$500,001-$1,000,000
6%
2013 Survey: Food hub revenue for 2012 calendar year (N=104)
$1,000,001-$2,000,000
13%
$200,001-$500,000
22%
$100,001-$200,000
15%
$100,000 or less17%
over $7,000,0006% $2,000,001-
$7,000,00013%
$500,001-$1,000,000
14%
FIGURE 26: FOOD HUB REVENUE FOR 2013 AND 2015
2015 Survey: Food hub revenue for 2014 calendar year (N=113)
$1,000,001-$2,000,000
19%
$200,001-$500,000
25%
$100,001-$200,000
15%
$100,000 or less19%
over $7,000,0008% $2,000,001-
$7,000,0008%
$500,001-$1,000,000
6%
2013 Survey: Food hub revenue for 2012 calendar year (N=104)
$1,000,001-$2,000,000
13%
$200,001-$500,000
22%
$100,001-$200,000
15%
$100,000 or less17%
over $7,000,0006% $2,000,001-
$7,000,00013%
$500,001-$1,000,000
14%
2015 Survey: Food Hub Revenuefor 2014 Calendar Year (n=113)
2013 Survey: Food Hub Revenuefor 2012 Calendar Year (n=104)
2015 2013
Percent of Hubs
Reporting
Mean Revenue
Median Revenue*
Minimum/ Maximum Revenue*
Percent of Hubs
Reporting
Mean Revenue
Median Revenue*
Minimum/ Maximum
Overall 113 (100%) $3,282,016 $351,000 $5,000–$96,000,000
104 (100%) $3,284,632 $450,000 $1,500–$75,000,000
By Years in Operation (n = 113) (n = 103)
0–2 years 30% $604,764 $172,000 $5,000–$12,000,000
32% $481,294 $175,000 $9,000–$6,000,000
3–5 years 31% $834,891 $370,000 $18,000–$6,000,000
29% $1,455,328 $571,000 $87,000–$15,000,000
6–10 years 20% $1,631,320 $509,000 $75,000–$8,000,000
14% $635,182 $250,000 $2,000–$3,000,000
11+ years 19% $13,580,409 $1,810,000 $17,500–$96,000,000
25% $10,501,792 $1,453,000 $28,000–$75,000,000
By Legal Structure (n = 108) (n = 99)
For-profit 39% $3,937,641 $1,020,000 $26,000–$70,000,000
49% $4,244,308 $455,000 $31,000–$54,700,000
Nonprofit 36% $1,146,641 $232,000 $5,000–$13,916,000
37% $833,117 $254,000 $2,000–$45,000,000
Cooperative 25% $5,232,476 $266,000 $18,000–$96,000,000
14% $7,257,470 $231,000 $25,000–$75,000,000
By Business Model (n = 113)
Farm to consumer 16% $1,406,687 $197,000 $5,000–$12,000,000
Not asked in 2013
Hybrid 53% $1,074,388 $270,000 $7,000–$16,527,000
Farm to business or institution
31% $8,030,977 $1,077,000 $50,000–$96,000,000
TABLE 10: REVENUE BY CATEGORY FOR 2015 AND 2013
* Rounded to the nearest $1,000
Michigan State University Center for Regional Food Systems & The Wallace Center at Winrock International 35

Sales RevenueIn 2015, 107 food hubs in total reported gross sales in excess of $333 million, amounting to 90% of gross revenue. Other studies report similar percentages (Fischer et al., 2013; Farm Credit East et al., 2014). Figure 27 shows the average percentage of total gross sales for hubs selling to a particular customer category in 2013 and 2015.24 For reference, Figure 20 (page 29) shows the percentage of hubs that sold to a particular category. For some hubs, one customer category accounted for a large portion of sales. Online sales accounted for 64% of total sales revenue, on average, for a little over one-quarter (28%) of hubs operating online stores. For almost half (48%) of hubs operating an online store, the online store accounted for 90% or more of the hub’s sales. Thirty-five percent of hubs operated CSA programs, and those CSAs accounted for 42% of the hub’s total sales revenue on average. Fourteen percent of hubs operating CSA programs counted on the CSA for 90% or more of their sales.
Similar to 2013, over half of hubs (61%) generated about one-third (30%) of total sales revenue, on average, from restaurants, caterers, bakeries, and corporate caterers. Since 35% of hubs (see Figure 14, page 22) sell to 2–5 different customer categories, it makes sense that several customer categories—restaurants, caterers, bakeries, corporate caterers (30%); large supermarkets or supercenters (30%); distributors (24%); and corner stores, bodegas, or small independent grocery stores (23%)—each account for about 25% to 30% of hub sales revenue each when a hub sells to them. While it is not appropriate to suggest a trend, it is interesting that at the same time online store sales increased 13% from 2013 to 2015, hub-operated retail stores (–38%) and mobile retail (–10%) decreased.
24 Five hubs did not keep track of the value of the products they brokered, but they provided estimates for the value of the brokered products as if they had physically taken possession and paid producers or suppliers for them. The sales estimates ranged from $65,000 to $1.72 million. These estimates were taken into account when calculating the value of product sold by department and customer type but were not used in revenue, sales, expense, or other financial calculations.
Michigan State University Center for Regional Food Systems & The Wallace Center at Winrock International36

FIGURE 27: AVERAGE PERCENTAGE OF TOTAL GROSS SALES FOR HUBS SELLING TO A PARTICULAR CUSTOMER CATEGORY BY YEAR
FIGURE 27: AVERAGE PERCENTAGE OF TOTAL GROSS SALES FOR HUBS SELLING TO A PARTICULAR CUSTOMER CATEGORY BY YEAR
42%49%
30%33%
30%29%
24%18%
64%51%
23%14%
20%11%
20%58%
19%27%
19%32%
12%7%
9%9%
7%
5%7%
4%14%
5%7%
Note: n is shown in parentheses for each category.* This question was not asked in 2013.
Online stores 2015 (30) 2013 (13)
CSA 2015 (37) 2013 (23)
Restaurants/Caterers/Bakeries/ 2015 (65) Corporate caterers 2013 (46)
Large supermarkets or supercenters 2015 (23) 2013 (21)
Distributors 2015 (29) 2013 (19)
Corner stores, bodegas, or small 2015 (56) independent grocery stores 2013 (31)
K-12 food service 2015 (33) 2013 (28)
Hub’s own retail storefront 2015 (11) 2013 (16)
Food cooperatives 2015 (28) 2013 (19)
Farmers markets 2015 (21) 2013 (14)
Buying clubs 2015 (19) 2013 (19)
Colleges/Universities 2015 (31) 2013 (21)
Senior care 2015 (10) 2013 *
Hospitals 2015 (21) 2013 (17)
Pre-K food service 2015 (7) 2013 (5)
Mobile retail units 2015 (8) 2013 (5)
Note: n is shown in parentheses for each category.* This question was not asked in 2013.
Michigan State University Center for Regional Food Systems & The Wallace Center at Winrock International 37

Non-Sales RevenueAmong the 75% of hubs breaking even or better (see Findings: Finances, page 41), two-thirds (66%, n = 57) covered at least 99% of operating expenses with product sales–generated revenue. The remaining one-third used non-sales-generated revenue to fill the gap and would not otherwise generate a profit.
Hubs were asked to account for revenue that was not attributed to product sales. Table 11 shows the percentage of hubs with particular revenue sources and the percentage of gross revenue from each source. Sources falls into three broad categories: grants; donations; and programs, services, and fees not generated as product sales.
Close to half (46%) of hubs reported that they had foundation grants in 2015 and that the foundation grants accounted for, as in 2013, 18% of their gross revenue. More than one-third (34%) of hubs have other revenue-generating services or operations not related to product sales that account for an average of 8% of revenue. About one-quarter of hubs receive revenue from federal government grants (25%), membership fees (25%), and donations from individuals (28%).
2015 2013
Percentage of food hubs with revenue source* (n = 61 total responding)
Average percentage of gross revenue (n in parentheses)
Average percentage of gross revenue (n in parentheses)
Grants
Foundation grants 46% 18% (28) 18% (22)
Federal government grants 25% 15% (15) 11% (15)
State government grants 15% 13 % (9) 6% (16)
Local government grants 13% 7% (8) 2% (3)
Donations
Donations from individuals 28% 4% (17) 6% (9)
Other donations 26% 5% (16) Not asked
Donations from businesses/organizations
13% 3% (8) 5% (7)
In-kind support 10% 18% (6) 4% (9)
Non-Sales Programs, Services, and Fees
Other services/operations of the food hub
34% 8% (21) Not asked
Membership fees 25% 4% (15) 11% (16)
Income from other programs of the organization
18% 8% (11) 3% (13)
Renting space to other businesses
16% 8% (10) 17% (8)
Commissions and broker fees not accounted for in product sales†
10% 15% (6) Not asked
TABLE 11: NON-SALES REVENUE CATEGORIES BY YEAR
* Based on data collection differences, the percent of hubs with each revenue source could not be calculated in 2013 in a way that made it comparable to the same calculation in 2015.† Only asked of hubs involved in brokering
Michigan State University Center for Regional Food Systems & The Wallace Center at Winrock International38

To further examine foundation, federal, and state grants, 54% of hubs with non-sales revenue reported grant revenue from at least one of these sources. Seven percent reported grant revenue from all three sources, 21% reported revenue from two of these sources, and 26% reported revenue from one of them.25 Table 12 shows the grant sources for hubs with non-sales revenue by hub legal structure and supports the premise that nonprofit hubs rely more heavily on grants than hubs with other legal structures do. For-profit and cooperative legal structures may restrict hubs from applying for some types of foundation and government grants. Nevertheless, across all hubs, foundation, federal, and/or state grants were a source of income for 60% of nonprofits, 36% of cooperatives, and 15% of for-profit hubs.
Hubs were asked if grants were critical to their ability to carry out the core functions of aggregation, distribution, and marketing of local or regional foods. Recognizing that core functions may not account for all a hub’s functions and thus all expenses, this question provides a different measure of grant dependence. Among all hubs, 45% were not at all dependent on grants to carry out core functions (Figure 28). However, for hubs with grants of any type (n = 34), 28% were highly dependent and 59% were somewhat dependent on grants to carry out their core functions.
FIGURE 28. FOOD HUB RELIANCE ON GRANT FUNDING (N=111)
Highlydependent
15%
Somewhat dependent
40%
Not at all dependent
45%
FIGURE 28: FOOD HUB RELIANCE ON GRANT FUNDING
Note: n=111
The difference in reliance on grant funding was significant for hubs in operation for two years or less and those in operation for more than two years.26 More than one-quarter (27%) of hubs in operation for two years or less were highly dependent on grants, and half (51%) were somewhat dependent. Conversely, over half (58%) of hubs in operation for more than two years were not at all dependent on grants to carry out core functions.
25 Number of sources does not indicate number of grants. A hub may have multiple grants from one source.
26 X2(2, N = 110)14.74, p < .01.
TABLE 12: PERCENTAGE OF HUBS’ GRANT REVENUE BY LEGAL STRUCTURE
Foundation Federal State
Nonprofit (n = 25) 72% 40% 28%
Cooperative (n = 18) 39% 11% 11%
For-profit (n = 17) 24% 18% 6%
Michigan State University Center for Regional Food Systems & The Wallace Center at Winrock International 39
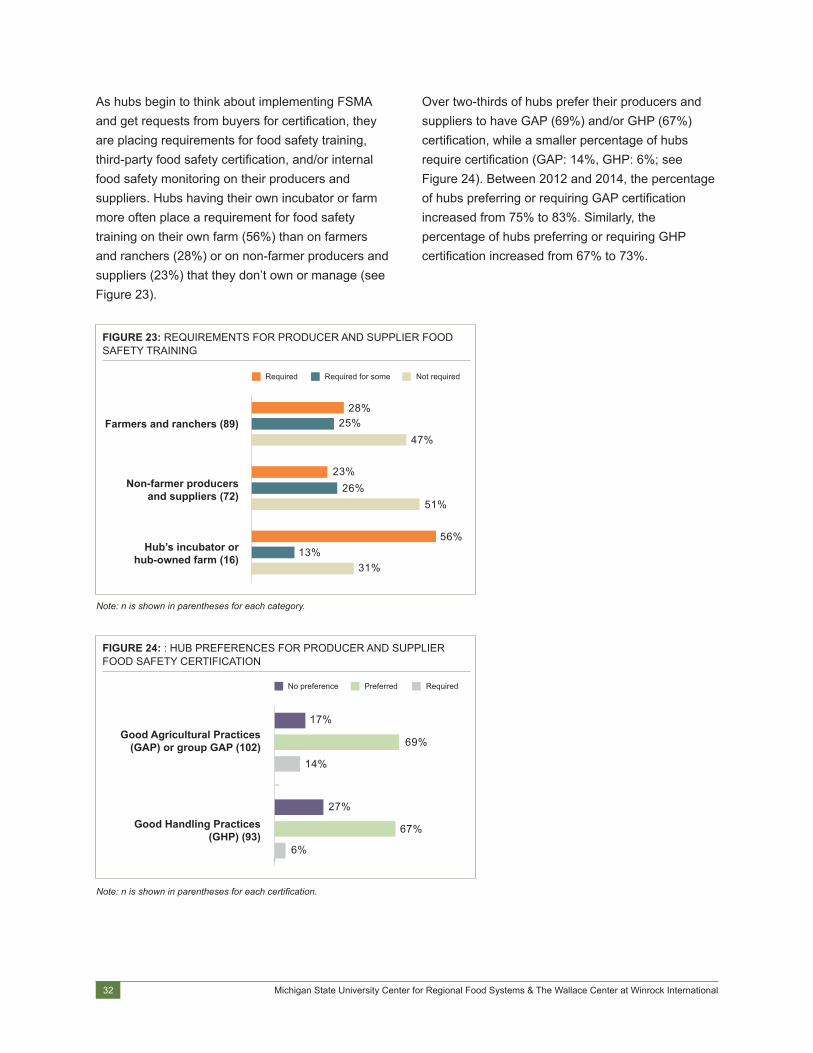
OPERATING EXPENSESHow food hubs incur operating expenses changed little between 2013 and 2015 (see Figure 29). On average, the majority of expenses (59%) were used
to procure product. One-quarter (24%) were payroll expenses. No other category represented more than 5% of operating expenses.
Telecommunications 2015 (44) 2013 (44)
All types of insurance 2015 (69) 2013 (65) Data and computer services 2015 (51) 2013 (54)
Repair/Maintenance 2015 (49) 2013 (45)
Advertising and promotional material 2015 (70) 2013 (63)
Other administration expenses 2015 (67) 2013 (63)
Packaging equipment and supplies 2015 (59) 2013 (55)
Consulting services 2015 (52) 2013 (45)
Gasoline and tolls 2015 (57) 2013 (48)
Utilities 2015 (45) 2013 (46)
Payments toward trucks 2015 (42) 2013 (43)
Payments toward facility space 2015 (63) 2013 (57)
Credit card and bank service charges 2015 (65) 2013 (47) Employee salary and benefits 2015 (73) 2013 (70)
Food and/or product purchases 2015 (65) 2013 (66)
FIGURE 29: FOOD HUB EXPENSES AS A PERCENTAGE OF REVENUE FIGURE 29: FOOD HUB EXPENSES AS A PERCENTAGE OF REVENUE
3%2%
2%2%
1%2%
1%1%
5%
59%61%
24%23%
Note: N is shown in parentheses for each expense category.
1%2%
2%2%
3%
2%
2%2%
4%
3%
2%4%
4%4%
4%
1%5%
Note: n is shown in parentheses for each expense category.
Michigan State University Center for Regional Food Systems & The Wallace Center at Winrock International40

OPERATIONAL EFFICIENCYBusiness efficiency ratios can be useful to help measure the financial health of a business. While the ratios do not reflect the nuances of different value propositions of individual businesses, they allow comparisons across different businesses or business types. The OER expresses operating expenses as a function of gross revenue.
FIGURE 30: OPERATING EXPENSE RATIO (OER)
OER = 1.005%
OER < 1.0070%
OER >1.0025%
FIGURE 30: OPERATING EXPENSE RATIO
Total Operating ExpensesTotal Gross Revenue
Operating Expense Ratio (OER)
=
When a business is covering all of its expenses with total gross revenue, OER will equal 1.00. A business with an OER greater than 1.00 has expenses in excess of its revenue and a negative profit margin. A business with an OER less than 1.00 has revenue in excess of its expenses and a positive profit margin.
In 2015, one-quarter of hubs had an OER greater than 1.00 (see Figure 30), which means that their expenses exceeded their revenue. Conversely, three-quarters of hubs were breaking even or better, with an OER of 1.00 or less.
Note: n=86
Michigan State University Center for Regional Food Systems & The Wallace Center at Winrock International 41
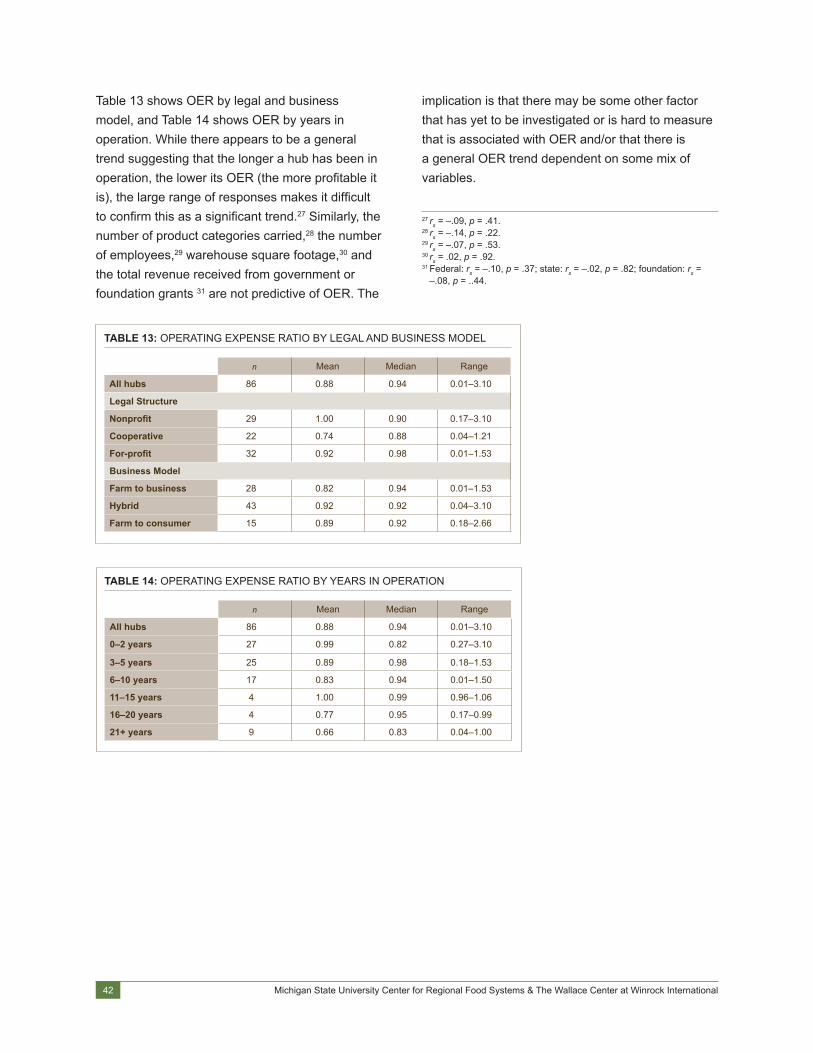
Table 13 shows OER by legal and business model, and Table 14 shows OER by years in operation. While there appears to be a general trend suggesting that the longer a hub has been in operation, the lower its OER (the more profitable it is), the large range of responses makes it difficult to confirm this as a significant trend.27 Similarly, the number of product categories carried,28 the number of employees,29 warehouse square footage,30 and the total revenue received from government or foundation grants 31 are not predictive of OER. The
n Mean Median Range
All hubs 86 0.88 0.94 0.01–3.10
Legal Structure
Nonprofit 29 1.00 0.90 0.17–3.10
Cooperative 22 0.74 0.88 0.04–1.21
For-profit 32 0.92 0.98 0.01–1.53
Business Model
Farm to business 28 0.82 0.94 0.01–1.53
Hybrid 43 0.92 0.92 0.04–3.10
Farm to consumer 15 0.89 0.92 0.18–2.66
TABLE 13: OPERATING EXPENSE RATIO BY LEGAL AND BUSINESS MODEL
n Mean Median Range
All hubs 86 0.88 0.94 0.01–3.10
0–2 years 27 0.99 0.82 0.27–3.10
3–5 years 25 0.89 0.98 0.18–1.53
6–10 years 17 0.83 0.94 0.01–1.50
11–15 years 4 1.00 0.99 0.96–1.06
16–20 years 4 0.77 0.95 0.17–0.99
21+ years 9 0.66 0.83 0.04–1.00
TABLE 14: OPERATING EXPENSE RATIO BY YEARS IN OPERATION
implication is that there may be some other factor that has yet to be investigated or is hard to measure that is associated with OER and/or that there is a general OER trend dependent on some mix of variables.
27 rs = –.09, p = .41. 28 rs = –.14, p = .22. 29 rs = –.07, p = .53. 30 rs = .02, p = .92. 31 Federal: rs = –.10, p = .37; state: rs = –.02, p = .82; foundation: rs =
–.08, p = ..44.
Michigan State University Center for Regional Food Systems & The Wallace Center at Winrock International42

n Mean Median Range
All hubs, 2013 77 1.09 1.00 0.04–6.79
All hubs, 2015 86 0.88 0.94 0.01–3.10
TABLE 15: OPERATING EXPENSE RATIO BY YEAR
Hubs with OER for Both Years n Mean Median Range
201328
0.96 1.00 0.11–1.85
2015 0.84 0.99 0.04–1.50
TABLE 16: OPERATING EXPENSE RATIO BY YEAR FOR SAME HUBS
What can be said is that, since 2013, average OER has improved both overall (see Table 15) and for same-hub comparisons (see Table 16). Recalling that a lower OER or a decrease in OER is financially
favorable, in 2015, hubs reported an average OER 19% lower than in 2013 and a median OER 6% lower. What is more compelling is that same-hub comparisons had an average OER decrease of 13%.
Second Look at Operating Expense Ratio: A Conservative EstimateHubs were not asked for total expenses. Rather, they were asked to itemize expenses by category and account for any miscellaneous expenses generally. Of the 86 hubs for which an OER was calculated, 13 gave detailed answers on miscellaneous expenses and three indicated they had miscellaneous expenses but did not give dollar values for them. This suggests that not all hubs may have reported all miscellaneous expenses. For the reporting hubs, miscellaneous expenses represented from less than 1% to as much as 46% of expenses. A second conservative calculation of OER used the average percent of miscellaneous expenses for the 13 hubs (10.7%) to estimate miscellaneous expenses for all hubs. The conservative OER estimate had a mean of 0.98 and a median of 1.04. Additionally, Counting Values: Food Hub Financial Benchmarking Study (Farm Credit East et al., 2014) examined detailed 2013 financial records for 48 food hubs. The authors concluded that the top 25% of hubs had a 4% profit and the average hub had a –2% profit (Farm Credit East et al., 2014). Comparable OERs are 0.96 and 1.02, respectively. Both OER estimates presented here and the findings of the Counting Values study
(Farm Credit East et al., 2014) show that surveyed hubs are, on average, doing better financially in 2015 than in calendar years 2013 and 2012.
Data presented in the section Findings: Networks, Challenges, Opportunities, and Barriers to Growth will show that hubs expect competition from other or new food hubs. The OER analysis suggests that despite many new food hubs entering the market since 2013, both young and more established hubs have, on average, lower OERs. Without a specific indicator that the observed decreases in OER are not a result of higher product prices or increased operational efficiencies, it is reasonable to suggest that the market for food hubs’ products is not saturated and continues to grow. This suggestion is supported by recent USDA analysis (Low et al., 2015).
Michigan State University Center for Regional Food Systems & The Wallace Center at Winrock International 43

ADDITIONAL THOUGHTS ON REVENUE, SALES, AND EXPENSES: BREAKING EVEN Using a more complex statistical technique than we have used in this report, Fischer et al. (2015b) analyzed the 2013 National Food Hub Survey data to find that, all other things being equal, hubs might expect to break even when revenue is at least $600,000. In 2015, hubs were asked if they thought this amount sounded reasonable. Interestingly, food hubs were about equally divided in their opinions. While about a third (36%) said $600,000 sounded about right, 35% said it was either too high or too low and 29% said the amount would depend on other factors. For those that said $600,000 was too high or too low, their break-even estimates averaged $935,158. Some hubs who responded that the break-even point depends on other factors said there was no “average” food hub. Others pointed to factors such as the mix of services offered, creating jobs rather than relying on volunteers, the choice of consumers being served, grants, and infrastructure expenditures. Fischer et al.’s (2015b) analysis agrees with many of the comments provided by respondents in saying that beyond the absolute amount of annual revenue a hub generates, decisions about expenditures are a hub’s next most important financial viability predictor.
ACCOUNTING PRACTICES AND LOAN READINESS Asked to identify and rank their challenges, 39% of hubs included access to capital in their top five. Debt capital, or loans, can be one source of capital. Almost half (46%, n = 111) of hubs indicated that they met with lenders to discuss debt capital in the last two years. One-third (30%) went on to apply for debt capital; of those, 82% were approved for all of the loan and 12% for part of the loan.Lenders and granting agencies require businesses applying for loans to provide various financial documents. Nine out of 10 hubs (n = 128) had current balance sheets (90%) and income statements (88%). Seventy-one percent had a monthly cash flow analysis. Thirty-nine percent of hubs had an up-to-date business plan, and 40% had an up-to-date marketing plan.
REVENUE SOURCES TO BEGIN OPERATIONS Figure 31 shows the percentage of hubs that used various beginning revenue sources by the number of years the hub has been in operation. As in 2013 (46%, n = 91), almost half of hubs began operations using the overarching organization’s or the founders’ funds. Reflecting increased interest from government and foundations in food hubs, hubs that began operation two years ago or less were more likely to use foundation grants and local or federal funding at startup. Interestingly, state funding remained constant across 2013 (23%) and 2015 (24%) for both hubs in operation more than two years and two years or less. About a quarter (21%) of hubs began business with funds from one or two sources. On average, hubs had slightly more than three beginning funding sources.The top three initial funding sources mentioned by
Michigan State University Center for Regional Food Systems & The Wallace Center at Winrock International44

FIGURE 31: PRIMARY REVENUE SOURCES TO BEGIN FOOD HUB OPERATIONS BY YEARS IN OPERATION
Business loans
Infrastructure provided by government entity
Bank loans
Local government funding
Private investors
Income from other programs of the organization
Federal government funding
State government funding
Donations from organizations
Membership fees
Foundation grants
In-kind support
Donations from individuals
Organization’s and/or founders’ own capital
nonprofits (n = 26) were foundation grants (75%), federal government funding (50%), and in-kind donations (50%). The top three sources mentioned by cooperatives (n = 14) were membership fees (64%), federal government funding (43%), and the
founders’ own capital (38%). For-profit food hubs (n = 25) ranked the founders’ own capital (76%) first, followed by private investors (32%) and state funding (20%).
FIGURE 31: PRIMARY REVENUE SOURCES TO BEGIN FOOD HUB OPERATIONS BY YEARS IN OPERATION
15%14%
27%11%
14%16%
12%8%
32%
47%49%
18%19%
38%24%
24%
21%
9%3%
24%
11%
27%19%
19%50%
32%
41%11%
2 years or less more than 2 years
Michigan State University Center for Regional Food Systems & The Wallace Center at Winrock International 45

FINDINGS: VALUES AND MISSION
Showing commitment to community through the distribution of locally and regionally produced foods is the critical value that separates food hubs from other businesses occupying the same food supply chain space. Beyond that, food hubs are addressing a variety of social goals though entrepreneurship.
LOCAL AND REGIONAL ASPECTS OF FOOD HUB PRODUCERS AND SUPPLIERSFood hubs themselves vary so widely, it is not surprising that their definitions of local vary as well. Food hub survey respondents tended to characterize their definition of local or regional in terms of mileage or geographic area or simply leave the definition up to the customer. A few hubs indicated they had separate definitions for local and regional. Respondents said they considered as little as 50 miles and as much as 500 miles from the hub to be within their definitions. Geographic areas as small as a county or as large as several states were also mentioned as definitions. Several respondents noted that anywhere within a day’s drive was acceptably local. All definitions included a reference to place that Fischer et al. (2015a) propose is the critical definitional inclusion separating food hubs from traditional wholesalers. “Food hubs are, or intend to be, financially viable businesses that
demonstrate a significant commitment to place through aggregation and marketing of regional food” (Fischer et al., 2015a, p. 97).
Eighty-seven percent of hubs (n = 95) reported that all of the farms and ranches from which they procured product were 400 miles or less from the hub’s main facility. Overall, an average of 94% of the farms and ranches from which hubs purchased product were within 400 miles of the hub. Nonfarm/ranch suppliers tended to be geographically further away. Sixty-eight percent (n = 56) of hubs reported that all of their nonfarm/ranch suppliers were located within 400 miles of the hub. On average, 82% of nonfarm/ranch suppliers were located within 400 miles. In 2013, no distinction was made between farms/ranches and other suppliers, but for reference, 81% (n = 76) of hubs stated that all of their suppliers
Michigan State University Center for Regional Food Systems & The Wallace Center at Winrock International46

were located within 400 miles of the hub. In 2015, hubs were more likely to procure product from farms and ranches and other producers that were further away from their main facility as years in business or hub revenue increased.32
Figure 32 shows the percentage of hubs by food category carrying products that were exclusively local, defined as within a 400-mile radius of the hub.33 In the 2015 survey, as reflected in the variable number of hubs answering for each category (shown in parentheses in Figure 32), hubs could answer that they did not carry a specific category. This was not true for 2013, so comparisons between 2013 and 2015 must be made carefully. In 2013 and 2015, the distinction between localness of ingredients and localness of the last step in processing was not made. For that reason, in 2013, processed food categories were left out of the analysis. In 2015, processed food categories are shown to illustrate that foods and products whose ingredients may not be exclusively local in origin are being processed or manufactured locally. Commitment to local is what
distinguishes food hubs, suggesting that localness can be conceptualized as grown locally and to some extent processed locally.
Fresh produce and herbs, noted elsewhere in this report as the hubs’ largest dollar sales volume category (page 23), is exclusively locally sourced by three-quarters (77%) of hubs. Nine out of 10 hubs locally source all eggs (91%) and/or all meat and poultry (91%).
Except for the fresh produce category, a higher percentage of farm to consumer hubs carried exclusively local product in all product categories than did hybrid hubs. The percentage of hubs carrying exclusively local product was lowest in all categories for hubs serving only wholesale markets.
32 Years in business: farms, rs = –.32, p < .01; other producers, rs = –.37, p < .01. Total revenue: farms, rs = –.35, p < .01; other producers: rs = –.29, p < .05.
33 Two hubs receiving 100% of their product from the hub’s own teaching or incubator farms stated that the farms were within 400 miles of the hub’s main facility. Because of their unique situation, these hubs are not included in Figure 32.
FIGURE 32: PERCENTAGE OF FOOD HUBS CARRYING EXCLUSIVELY LOCAL PRODUCT CATEGORIES
84%
82%
77%
76%
74%
91%
91%
87%
85%
Note: N is shown in parentheses for each product category. Exclusively local was not defined in the survey. Based on hubs’ answers, it appears that hubs defined exclusively local as locally grown and/or local final stage processing.
55%
62%
FIGURE 32: PERCENTAGE OF FOOD HUBS CARRYING EXCLUSIVELY LOCAL PRODUCT CATEGORIES
Eggs (80)
Meat and poultry (76)
Baked goods/bread (54)
Other processed/value-added (80)
Milk and other dairy products (68)
Processed produce (71)
Fresh produce and herbs (102)
Grains, beans, and flours (66)
Nonfood items (39)
Fish and seafood (21)
Coffee/Tea (40)
Note: n is shown in parentheses for each product category. Exclusively local was not defined in the survey. Based on hubs’ answers, it appears that hubs defined exclusively local as locally grown and/or local final stage processing.
Michigan State University Center for Regional Food Systems & The Wallace Center at Winrock International 47

asked to provide mission statements in 2015. They were additionally asked to reflect on their mission and indicate to what extent their mission was or was not related to specific values. In both survey years, more than 90% of hubs stated that improving human health was related to their mission (see Figure 34).
LOCAL AND REGIONAL ASPECTS OF FOOD HUB CUSTOMERSTo characterize the distance the hubs’ customers were from the hub, hubs were asked to indicate a radius from the hub within which 75% or more of their customers were located (see Figure 33). Almost half (46%) of hubs said at least that percentage of their customers were located within 50 miles of the hub. All hubs reported that at least 75% of their customers were located within a 400-mile radius. Hubs serving only business or institutional markets tended to have the most geographically distant customers, and hubs selling farm to consumer had the closest.
STATED MISSIONS AND DAILY EXPRESSION OF MISSION VALUESThe 2013 National Food Hub Survey report provided a detailed analysis of food hubs’ mission statements and examples of how food hubs were engaged in improving human health. The authors commented that extrapolating specific meaning from rather broad answers was difficult and that both stated and implied values contained in the hubs’ answers may not fully represent their priority issues. Recognizing the limitations of mission statements to fully reflect the financial, social, ethical, and/or environmental priorities food hubs may embrace, hubs were again
FIGURE 33: DISTANCE FROM THE HUB WHERE 75% OF CUSTOMERS OR MORE ARE LOCATED
FIGURE 30: EXTENT TO WHICH IMPROVING HUMAN HEALTH IN THEIR COMMUNITY WAS PART OF HUBS’ MISSION
60%
36%
2013 (n=107) 2015 (n=141)
4%
64%
30%
6%
Strongly related Somewhat related Not related
FIGURE 34: EXTENT TO WHICH IMPROVING HUMAN HEALTH IN THEIR COMMUNITY WAS PART OF HUBS’ MISSIONS
FIGURE 30: EXTENT TO WHICH IMPROVING HUMAN HEALTH IN THEIR COMMUNITY WAS PART OF HUBS’ MISSION
60%
36%
2013 (n=107) 2015 (n=141)
4%
64%
30%
6%
Strongly related Somewhat related Not related
Note: n = 107.
46%
Under 50 miles Under 100 milesUnder 200 milesUnder 400 miles
66%
83%
100%
Michigan State University Center for Regional Food Systems & The Wallace Center at Winrock International48

On average, hubs’ stated missions were heavily invested in all value areas (see Figure 35). Almost all (99%) hubs’ missions were related to increasing small and mid-sized farms’ access to markets. The
FIGURE 35: PERCENTAGE OF HUBS WITH MISSIONS RELATED TO VALUES BY LEGAL STRUCTURE
84%92%
46%35%
71%
90%
70%77%
71%
95%
78%
60%85%
98%100%
68%
94%
93%
90%
66%71%
70%
83%
76%
For-profit Cooperative
73%95%
96%82%
95%
100%100%
100%100%
Nonprofit
least related value area, addressing racial disparities through access to healthy food, was still part of more than half (55%) of hubs’ missions.
Training farmers/ranchers in best production practices
Promoting good animal welfare practices
Addressing racial disparities through access to healthy food
Ensuring food hub employees receive a fair wage
Promoting environmentally sensitive production practices
Ensuring producers/suppliers receive a fair price
Training producers/suppliers in business/marketing practices
Increasing minority producers’/suppliers’ access to markets
Increasing small/mid-sized farmers’/ranchers’ access to markets
Increasing healthy food access to economically disadvantages communities
Improving health in your community
FIGURE 35: PERCENTAGE OF HUBS WITH MISSIONS RELATED TO VALUES BY LEGAL STRUCTURE
FIGURE 35: PERCENTAGE OF HUBS WITH MISSIONS RELATED TO VALUES BY LEGAL STRUCTURE
84%92%
46%35%
71%
90%
70%77%
71%
95%
78%
60%85%
98%100%
68%
94%
93%
90%
66%71%
70%
83%
76%
For-profit Cooperative
73%95%
96%82%
95%
100%100%
100%100%
Nonprofit
Michigan State University Center for Regional Food Systems & The Wallace Center at Winrock International 49

Because the proportion of different legal structures represented by responding hubs is unequal, it is interesting to look at value areas as a function of legal structure. Legal structure dictates some of the ways hubs operate. Therefore, legal structure may influence the hubs’ choice of mission goals and values or vice versa. The percentages shown in Figure 35 reflect the hubs that stated a value was somewhat related or very related to their mission, categorized by legal structure.
Figure 35 also shows that, generally, cooperatives’ missions are focused more on farmers and nonprofits’ missions are focused more on health and racial equality, with for-profits falling somewhere in between. Nonprofit hubs were more likely to state that their missions were related to addressing racial disparities through access to healthy food34 and increasing healthy food access to economically disadvantaged communities35 than for-profit hubs.36
In the day-to-day course of running a business, a stated mission may take an ancillary position to accomplishing daily operational tasks. To measure the extent to which mission values are embedded in hub operations, hubs were asked how related certain values were to their daily operations. By comparing hubs’ intent (measured as a value’s relatedness to a stated mission) to action (measured as a value’s relatedness to day-to-day activities), a picture is formed to show the extent hubs may be creating a business culture around their stated missions (see Figure 36). Evaluating the “not related” percentages in Figure 36, for all mission values, hubs’ daily operation mission relatedness, on average, came within 2% or exceeded stated mission relatedness. In other words, hubs appear to be meeting or exceeding their stated mission’s intent in their day-to-day actions.
34 X2(1, N = 95)5.67, p < .05. 35 X2(1, N = 96)5.41, p < .05. 36 Figure 35 may show other differences. Because the number of hubs
was small for some nonprofit/for-profit and all cooperative/nonprofit/for-profit comparisons, the statistical test was not valid.
Michigan State University Center for Regional Food Systems & The Wallace Center at Winrock International50

FIGURE 36: ALIGNMENT OF HUBS’ MISSION WITH DAY-TO-DAY OPERATIONS
26% 42%
33%
6%
6%
43%
45%
5%
14%
3%
4%
3%
5%
25%
30%
26%
29%
1%
13%
16%
5%
6%
36%
28%
31%
66%
63%
32%
31%
38%
36%
19%
19%
62%
54%
33%
32%
67%
68%
30%
28%
67%
81%
30%
14%
33%
30%
42%
40%
23%
22%
51%
49%
10%
91%
90%
40%
42%
47%
42%
63%
64%
32%
30%
8%
Not at all related Somewhat related Strongly related
Day-to-day operations (144)Mission (142)
Day-to-day operations (102)Mission (103)
Day-to-day operations (143)Mission (138)
Day-to-day operations (118)Mission (116)
Day-to-day operations (145)Mission (143)
Day-to-day operations (145)Mission (140)
Day-to-day operations (146)Mission (141)
Day-to-day operations (146)Mission (140)
Day-to-day operations (146)Mission (141)
Day-to day operations (147)Mission (142)
Day-to day operations (145)Mission (141)
Training farmers/ranchers in best production practices
Promoting good animal welfare practices
Addressing racial disparities through access to healthy food
Ensuring food hub employees receive a fair wage
Promoting environmentally sensitive production practices
Ensuring producers/suppliers receive a fair price for their
product
Training producers/suppliers in business or marketing
practices
Increasing minority producers’/suppliers’ access to market
Increasing small and mid-sized farmers’/ranchers’ access to
markets
Increasing healthy/fresh food access to economically disadvantaged communities
Improving human health in your community or region
FIGURE 36: ALIGNMENT OF HUBS’ MISSIONS WITH DAY-TO-DAY OPERATIONS
Michigan State University Center for Regional Food Systems & The Wallace Center at Winrock International 51

FIGURE 37: PERCENTAGE OF HUBS ENGAGING IN NON-REVENUE-GENERATING ACTIVITIES
Food hubs were asked if they offered activities generally assumed to be non-revenue-generating. Eighty-three percent of hubs donated food to local food pantries or food banks. Six percent held health screenings (see Figure 37). Apart from the marketing or social capital value of creating goodwill, these activities are not likely to add to a hub’s bottom line. A business’s willingness to spend resources on programs or other endeavors that may not contribute to its financial bottom line supports the assertion that the business’s mission—in this case, a food hub’s mission—may extend beyond finances.
In addition, hubs engage in yet other sales activities that could be argued to have relatively smaller returns on investment and to represent a social
mission orientation. Nineteen percent of hubs selling directly to consumers offered subsidized shares. Ten percent offer consumer transportation services to and from the hub, and over a quarter (27%) operate a mobile market. Hubs mentioned other social mission activities including booths at health fairs, food preservation classes, documentary film screenings, college scholarships, donating time and a vehicle for delivery to homebound customers, and maintaining a community center. Multiple hubs mentioned a variety of hub-sponsored programs specifically targeting low-income and/or low-access populations.
Food donations to local food pantries/banks (150)
Education about community and food systems issues (149)
Nutrition or cooking education (150)
Health screenings (149)
FIGURE 37: PERCENTAGE OF HUBS ENGAGING IN NON-REVENUE-GENERATING ACTIVITIES
6%
51%
79%
83%
Note: n is shown in parentheses for each activity.
Michigan State University Center for Regional Food Systems & The Wallace Center at Winrock International52

FINDINGS: NETWORKS, CHALLENGES, OPPORTUNITIES, AND BARRIERS TO GROWTH
Rapid growth does not ensure success. It does ensure that rapid change will be required for success. Being in tune with the current business climate and anticipating challenges can allow food hubs to gather resources to plan for and address challenges before they become barriers to growth and success.
NETWORKS AND INFORMATION SOURCESHub respondents were given a list of information sources and asked to rank them from most to least important.37 More than half (52%) of hubs engaged informal networks to gather information (see Table 17). Forty-seven percent of hubs engaged formal networks or communities of practice, such as the NGFN.
The hubs that used formal networks or communities of practice ranked the usefulness of this type of structured network 40% higher than they ranked informal networking with other food hubs. This finding highlights the utility of formal networks for learning and exchanging ideas. Regional formal communities of practice specific to food hubs are rare but do exist, for example, in Michigan (Pirog et al., 2014).38 These findings suggest that it may be beneficial for hubs to
join an existing food hub community of practice and for new regional food hub communities of practice to form.
37 Hubs could choose and rank up to nine named and two hub-specified information sources. The lower the rank, the more important that particular network is. A rank of 1.0 had the highest importance.
38 Regional food hub–specific communities of practice include the Michigan Food Hub Network, the Ohio and West Virginia Food Hub Network, and the Iowa Food Hub Managers Working Group (newly formed in 2015).
Michigan State University Center for Regional Food Systems & The Wallace Center at Winrock International 53

More hubs mentioned annual meetings or conferences (44%) than university (39%), federal (36%), or nonprofit (32%) educational resources. However, university, federal, and nonprofit resources were more important to hubs than were meetings or conferences. This finding points to particular challenges for meeting and conference organizers not only to increase attendance but also to make sure the content is useful for participants and to structure opportunities for important informal networking.
Figure 38 shows what percentage of hubs ranked a mentioned information source as the first or second most important. University and nonprofit resources were most often ranked as the second most important information sources for 41% and 37% of hubs, respectively.
Percent of Hubs Mentioning Source
Average Importance Rank of Source
Informal networking with food hubs 52% 2.8
Formal communities of practice 47% 1.7
Annual meetings or conferences 44% 3.4
University’s educational resources 39% 2.8
Federal government’s educational resources 36% 3.1
Nonprofit organization’s educational resources
32% 3.2
State government’s educational resources 27% 3.7
Food policy council 16% 4.2
Local government’s educational resources 10% 5.3
TABLE 17: PERCENTAGE OF HUBS MENTIONING AND RANKING SOURCES AS IMPORTANT
Note: n = 109.
FIGURE 38: FIRST AND SECOND MOST IMPORTANT INFORMATION RESOURCES
Formal community of practice
Informal networks
Annual meetings or conferences
Federal government’s educational resources
State government’s educational resources
Nonprofit organization’s educational resources
Local government’s educational resources
University’s educational resources
FIGURE 38: FIRST AND SECOND MOST IMPORTANT INFORMATION RESOURCES
73% 6%
47%
44%
36%
14%
14%
9%
8%
19%
6%
10%
10%
37%
9%
41%
Most important Second most important
Note: n = 109.
Michigan State University Center for Regional Food Systems & The Wallace Center at Winrock International54

TOP CHALLENGESHubs were given a list of possible challenges and asked to identify and rank up to five that affect their hub. Figure 39 shows the percentage of hubs including a particular challenge in their top three. Managing growth (2013: 19%; 2015: 17%) and access to capital (2013: 14%; 2015: 15%) remained top challenges for a similar percentage of hubs across the two comparison years. As in 2013, balancing supply and demand was the top challenge cited most often. However, 37% of hubs identified it as their top challenge in 2013, whereas only 20% identified it as
such in 2015. It is unclear whether this change means that hubs are more effectively meeting the challenges of supply and demand or whether other challenges have become more pressing. Most notably, the percentage of hubs ranking GAP certification or other food safety requirements as either their top challenge or one of their top three challenges has doubled since 2013 (3% and 10% respectively in 2013).
FIGURE 39: TOP CHALLENGES FOR FOOD HUBS
Greatest challenge Second greatest challenge
20%
2%
17%
15%
6%
9%
3%
6%
2%
2%
3%
6%
3%
3%
3%
19%
15%
7%
6%
7%
10%
4%
6%
5%
3%
3%
2%
1%
3%
9%
7%
7%
10%
6%
7%
8%
8%
7%
7%
2%
3%
Third greatest challenge
FIGURE 39: TOP CHALLENGES FOR FOOD HUBS
Balancing supply and demand
Managing growth
Access to capital
Meeting GAP and/or other food safety requirements
Negotiating prices
Finding reliable seasonal and/or part-time staff
Meeting regulatory requirements
Finding appropriate technology
Availability of processing services
Lack of ownership of infrastructure
Dependence on volunteer labor
Inventory management
Meeting other buyer specifications
Maintaining product source identification
Note: n = 109.
Michigan State University Center for Regional Food Systems & The Wallace Center at Winrock International 55

BARRIERS TO GROWTHExamining barriers to growth can help businesses anticipate and avoid bottlenecks, maintain commitments, and plan for manageable growth. It can also help assistance organizations or consultants identify key focus areas. While barriers may take many forms, the 2015 survey asked about barriers that have actionable solutions over which food hub management could have some control. In the discussion of barriers, it will be useful to draw some comparisons between the challenges discussed above and barriers to growth, as some of the categories point to similar underlying issues.
Since the top identified challenge was balancing supply and demand, it is unsurprising that the most commonly identified barrier was related to supply constraints (see Figure 40). Fifty-seven percent
of hubs said that securing more product supply was limiting their growth. Additionally, 23% of miscellaneous written responses included challenges such as increasing the number of suppliers who were GAP certified, growing specialty crops or specific commodities, or finding the resources to help new farms come on board. The majority of these written responses suggest that increasing the volume and/or type of product or increasing the number of suppliers may be the underlying barrier. Between 2013 and 2015, the percentage of hubs that identified securing more product supply as a barrier increased. This is consistent with the previously posited observation that balancing supply and demand is still a big challenge despite its drop in challenge rank.
FIGURE 40: FOOD HUB BARRIERS TO GROWTH BY YEAR
Securing more product supply
Securing capital
Increasing truck capacity/delivery
Increasing warehouse space
Increasing staff
Increasing availability of processing
Consumer education
Business development assistance
Note: n = 106.
FIGURE 40: FOOD HUB BARRIERS TO GROWTH BY YEAR
2015 2013
57%47%
46%33%
45%43%
43%41%
42%49%
32%20%
32%27%
20%24%
Michigan State University Center for Regional Food Systems & The Wallace Center at Winrock International56

Access to capital was the third highest ranked challenge, and securing capital was the second most cited barrier. Between 2013 and 2015, the percentage of hubs that identified securing capital as a barrier to growth increased from one-third of hubs to almost half of hubs (46%). The percentage of hubs citing increasing availability of processing as a barrier increased from one-fifth of hubs in 2013 to almost
one-third of hubs (32%) in 2015. As the number of years a hub was in business or its total revenue increased, the total number of barriers identified decreased.39
39 Total revenue: rs = –.26, p < .05; years in business: rs = –.23, p < .05.
FIGURE 41: TIMING TO ADDRESS BARRIERS
45%
48%
36%
30%
39%
18%
46%
57%
31%
27%
47%
23%
43%
23%
30%
33%
17%
19%
13%
36%
9%
29%
6%
2%
2%
4%
7%
7%
6%
3%
10%
5%
4%
4%
2%
15%
9%
9%
less than 12 months 4 years or more1-2 years
too costly to address anytime
2-4 years
no current plans to addresss
6%
Securing more product supply (58)
Securing capital (47)
Increasing truck capacity/delivery (47)
Increasing warehouse space (44)
Increasing staff (44)
Increasing availability of processing (34)
Consumer education (33)
Business development assistance (21)
FIGURE 41: TIMING TO ADDRESS BARRIERS
Note: n is shown in parentheses for each barrier.
Figure 41 is organized from the most cited to least cited growth barrier and shows the timeframe in which hubs identifying a specific barrier anticipated they would have the resources available to address it. In all barrier categories except business assistance, more than half of the hubs said they would not have the resources to address a currently identified growth barrier within the next 12 months. Barriers associated with large capital outlay (processing availability,
warehouse space and truck capacity) were least likely to be addressed within the next year. For all barriers except processing availability and warehouse space, more than 75% of hubs felt they would be able to address the barrier in two years or less. More than half (53%) felt they could address warehouse space and 42% felt they could address processing availability within two years.
Michigan State University Center for Regional Food Systems & The Wallace Center at Winrock International 57

OPPORTUNITIES FOR GROWTHFood hubs were asked about their perception of changing demand and competition. In 2013, 96% of hubs felt the demand for hub products was growing; in 2015, 92% felt that the demand for their hub’s products had continued to grow since 2013. Two-
thirds of those said that demand had grown a lot (see Figure 42). Looking ahead to 2017, almost all hubs (98%) said that demand would continue to grow, and two-thirds expected demand to grow a lot (see Figure 43).
FIGURE 43: PERCEIVED CHANGE IN DEMAND FOR FOOD HUBS’ PRODUCTS THROUGH 2017
FIGURE 42: PERCEIVED CHANGE IN DEMAND FOR FOOD HUBS’ PRODUCTS SINCE 2013
Note: n=106
Grown a lot66%
Shrank a little4%
Grown a little26%
Stayed basically the same4%
Grow a lot66%
Stay basically the same2%
Grow a little26%
Note: n=106
Michigan State University Center for Regional Food Systems & The Wallace Center at Winrock International58

expect a little competition (see Figure 45). Hubs expect this competition will come not only from other food hubs but also CSA, producer direct sales, and existing conventional distributors creating local programs.
FIGURE 45: PERCEIVED CHANGE IN COMPETITION FOR CURRENT CUSTOMERS THROUGH 2017
Note: n=106
FIGURE 44: PERCEIVED CHANGE IN COMPETITION FOR NEW CUSTOMERS THROUGH 2017
Note: n=106
With growing demand often comes growing competition to meet demand. Eighty-three percent of hubs thought that competition for new customers would grow in the next two years (see Figure 44). They anticipated less, but still considerable, competition to keep their existing customers. One-quarter expect to encounter a lot of competition for their current customers, and another half (46%)
Grow a lot45%
Shrink a little1%
Grow a little38%
Stay basically the same
16%
Shrink a little8%
Grow a lot25%
Stay basically the same
21%
Grow a little46%
Michigan State University Center for Regional Food Systems & The Wallace Center at Winrock International 59

Figure 46 shows customer types that hubs thought would yield the most future expansion opportunities. Hubs had the option to skip a customer category if it was outside the scope of their business vision. At least one-third of hubs identified CSA, restaurants,
FIGURE 46: EXPANSION OPPORTUNITIES BY FOOD HUB CUSTOMER TYPE
CSA (68)
Restaurants, bakeries, caterers, corporate caterers (95)
Hub’s own storefront retail (52)
Online stores (80)
Colleges/Universities (86)
K-12 food service (85)
Farmers markets (54)
Large retail grocery stores (83)
Hospitals (86)
Food cooperatives or buying clubs (90)
Distributors (84)
Corner stores/Small grocery (89)
Pre-K food service (85)
Food processors (82)
Convenience stores (68)
Mobile retail units (57)
FIGURE 46: EXPANSION OPPORTUNITIES BY FOOD HUB CUSTOMER TYPE
46%
43%
33%
32%
30%
29%
28%
23%
23%
23%
20%
18%
15%
9%
7%
7%
28%
41%
31%
30%
40%
32%
33%
35%
36%
41%
27%
49%
35%
47%
18%
39%
13%
14%
17%
21%
21%
26%
18%
26%
29%
30%
36%
24%
33%
26%
34%
33%
9%
15%
8%
2%
4%
17%
8%
4%
2%
6%
2%
6%
6%
28%
9%
4%
2%
4%
9%
7%
9%
4%
8%
8%
4%
11%
7%
11%
12%
13%
12%
Many opportunities
No opportunities
Some opportunities
Unsure
Few opportunities
Note: n is shown in parentheses for each category.
caterers, bakeries, and hub-run retail stores as having many expansion opportunities. Convenience stores offered the fewest opportunities.
Michigan State University Center for Regional Food Systems & The Wallace Center at Winrock International60
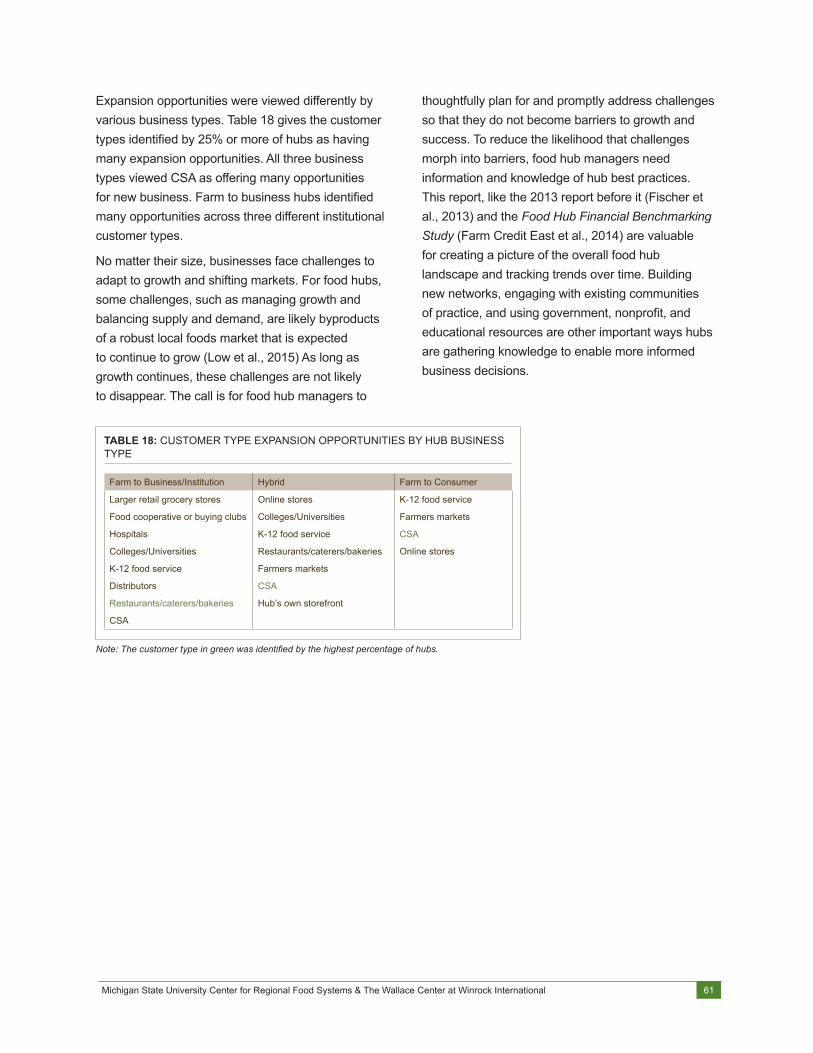
Farm to Business/Institution Hybrid Farm to Consumer
Larger retail grocery stores
Food cooperative or buying clubs
Hospitals
Colleges/Universities
K-12 food service
Distributors
Restaurants/caterers/bakeries
CSA
Online stores
Colleges/Universities
K-12 food service
Restaurants/caterers/bakeries
Farmers markets
CSA
Hub’s own storefront
K-12 food service
Farmers markets
CSA
Online stores
TABLE 18: CUSTOMER TYPE EXPANSION OPPORTUNITIES BY HUB BUSINESS TYPE
Note: The customer type in green was identified by the highest percentage of hubs.
Expansion opportunities were viewed differently by various business types. Table 18 gives the customer types identified by 25% or more of hubs as having many expansion opportunities. All three business types viewed CSA as offering many opportunities for new business. Farm to business hubs identified many opportunities across three different institutional customer types.
No matter their size, businesses face challenges to adapt to growth and shifting markets. For food hubs, some challenges, such as managing growth and balancing supply and demand, are likely byproducts of a robust local foods market that is expected to continue to grow (Low et al., 2015) As long as growth continues, these challenges are not likely to disappear. The call is for food hub managers to
thoughtfully plan for and promptly address challenges so that they do not become barriers to growth and success. To reduce the likelihood that challenges morph into barriers, food hub managers need information and knowledge of hub best practices. This report, like the 2013 report before it (Fischer et al., 2013) and the Food Hub Financial Benchmarking Study (Farm Credit East et al., 2014) are valuable for creating a picture of the overall food hub landscape and tracking trends over time. Building new networks, engaging with existing communities of practice, and using government, nonprofit, and educational resources are other important ways hubs are gathering knowledge to enable more informed business decisions.
Michigan State University Center for Regional Food Systems & The Wallace Center at Winrock International 61

DISCUSSION
Food hubs—businesses that actively manage the aggregation and distribution of source-identified food products—are receiving continued, growing attention from diverse stakeholders who see food hubs as vectors for economic growth and social and environmental change. As consumer desire for local and regional foods continues to grow and evolve, food hubs are increasing in numbers and adapting to shifting demand from intermediated local and regional food markets. The 2015 National Food Hub Survey and its predecessor, the 2013 National Food Hub Survey, represent a broad effort to aggregate national-level data on the characteristics and impact of food hubs. Together, these surveys represent the beginning of a longitudinal database for a large, broad national sample of food hubs.
Survey findings indicate that as new food hubs continue to open for business, more established food hubs continue to operate and thrive. One-third of hubs completing the survey began operations in the last two years. Three-fourths of surveyed hubs across the nation are breaking even or better. By comparison, a little over two-thirds (68%) of food hubs were breaking even or better in 2013. We think this change represents an important threshold that demonstrates the food hub model can be financially successful across a variety of legal structures and geographic or customer markets. Our findings suggest financial success coexists with mission-related success.
• Food hub suppliers and customers are almost entirely regional. More than 9 out of 10 food hub farm or ranch suppliers are located within 400 miles of the hub, and 3 out of 4 food hub customers are located within 400 miles of the hub.
• Food hubs are good for small and medium agricultural operations. More than 9 out of 10 food hubs source exclusively or mostly from farms and ranches with gross sales less than $500,000. Food hubs average nearly 80 farmer and food business suppliers.
Michigan State University Center for Regional Food Systems & The Wallace Center at Winrock International62

• Food hubs strive to increase community food access and improve health outcomes. More than 87% of food hubs work to increase access to healthy or fresh food as part of their daily operations and programs. More than 95% of food hubs work to improve human health in their communities or region as part of daily operations and programs.
Almost all food hubs expect that business will continue to grow, but not without challenges.
• Food hubs are addressing challenges that include compliance with FSMA. Forty-six percent of hubs already require producers to show proof of food safety regulation compliance. The percentage of hubs requiring GAP certification increased 8% since 2013 and fully two-thirds of hubs either prefer or require GAP certification.
• Food hubs turn to communities of practice and networks for information. Almost half of hubs rely on informal networks and/or formal networks and communities of practice to learn and share business ideas. Formal communities of practice are the most highly ranked information source.
• Food hubs are concerned about maintaining product supply and keeping up with business growth. Securing more supply is a concern for more than half of surveyed hubs; however, less than half of those concerned think they can address this problem within the next year. Managing growth can perhaps be seen as a desirable problem to have. Yet without adequate capital and delivery, staff, and warehouse capacity, each of which was mentioned as a barrier for at least 40% of hubs, growth can quickly become a liability.
In a growing and expanding market, our findings suggest that continued success will require encouraging and growing small and mid-sized producer and processor engagement with food hubs, looking beyond current customer categories, and using capital wisely to grow infrastructure. Organizations supporting food hubs can facilitate networking and manifest food safety and management training opportunities. Food hubs need support organizations to help them explore how to manage growth in ways that allow them to continue to pursue both financial and non-financial goals.
RECOMMENDATIONS FOR FURTHER STUDYBased on the findings in this report, the authors suggest several topics for additional research:
• It is clear that food hubs are different from each other in many ways. No one model will fit hubs serving wholesale, hybrid, and consumer markets. Additional research that focuses on providing financial guidance and best practices on a more targeted level could help hubs make better decisions.
• The same is true for hubs with different social missions and goals: No one model will address the challenges of balancing profit and social good. A closer examination of hubs with similar social goals may produce a useful model.
• Hubs were asked to report on behalf of their producers and suppliers. Clearly, this reporting method is limited. Research on suppliers and producers both using and not using food hubs could help hubs find new and better serve suppliers and vendors.
• Ranking challenges, barriers, and opportunities is useful in assigning utility. However, the richness of a qualitative exploration of food hub challenges and opportunities could paint a better picture that will help food hubs and those helping them anticipate and address change.
Michigan State University Center for Regional Food Systems & The Wallace Center at Winrock International 63

REFERENCESAmerican Association for Public Opinion Research. (2015). Standard definitions: Final dispositions of case codes and outcome rates for surveys (8th ed.). Lenexa, KS: Author.
Barham, J., Tropp, D., Enterline, K., Farbman, J., Fisk, J., & Kiraly, S. (2012). Regional food hub resource guide. Washington, DC: U.S. Department of Agriculture, Agricultural Marketing Service. Retrieved from http://dx.doi.org/10.9752/MS046.04-2012.
Burt, R., Silverman, S., & Goldblatt, M. (2015). Firmly rooted, the local food market expands. A.T. Kearney. Retrieved from https://www.atkearney.com/documents/10192/6773369/Firmly+Rooted+the+Local+Food+Market+Expands.pdf/863737a6-0b44-40d0-b339-da25c4563dc3.
Dillman, D. A., Smyth, J. D., & Christian, L. M. (2014) Internet, phone, mail, and mixed-mode surveys: The tailored design method (4th ed.). Hoboken, NJ: John Wiley & Sons.
Farm Credit East, the Wallace Center at Winrock International, Morse Marketing Connections, & Farm Credit Council. (2014). Counting values: Food hub financial benchmarking study. Retrieved from http://ngfn.org/resources/ngfn-database/knowledge/Food%20Hub%20Benchmarking%20Study.pdf
Fischer, M., Pirog, R., & Hamm, M. (2015a). Food hubs: Definitions, expectations, and realities. Journal of Hunger & Environmental Nutrition, 10(1), 92–99.
Fischer, M., Pirog, R., & Hamm, M. (2015b). Predictors of food hub financial viability. Journal of Hunger & Environmental Nutrition, 10(1), 100–114.
Fischer, M., Hamm, M., Pirog, R., Fisk, J., Farbman, J., & Kiraly, S. (2013). Findings of the 2013 National Food Hub Survey. East Lansing, MI: Michigan State University Center for Regional Food Systems and the Wallace Center at Winrock International. Retrieved from http://foodsystems.msu.edu/resources/2013-food-hub-survey
IBM SPSS Statistics for Windows (Version 22.0) [Computer software]. Armonk, NY: IBM Corp.
Low, S. A., Adalja, A., Beaulieu, E., Key, N., Martinez, S., Melton, S., ... Jablonski, B. B. R. (2015). Trends in U.S. local and regional food systems: Report to Congress (Administrative Publication No. 068). Washington, DC: U.S. Department of Agriculture, Economic Research Service.
Matson, J., Thayer, J., & Shaw, J. (2015). Running a food hub: A business operations guide (Vol. 2). Washington, DC: U.S. Department of Agriculture, Rural Development. Retrieved from http://www.rd.usda.gov/files/SR_77_Running_A_Food_Hub_Vol_2.pdf
Pirog, R., Harper, A., Gerencer, M., Lelle, M., & Gerencer, C. (2014). The Michigan food hub network: A case study in building effective networks for food systems change. East Lansing, MI: Michigan State University Center for Regional Food Systems. Retrieved from http://foodsystems.msu.edu/resources/michigan_food_hub_network_case_study
USDA National Resources Conservation Service. (2010). Limited Resource Farmer and Rancher (LRF/R) Beginning Farmer program definition. Washington, DC: Author. Retrieved from http://lrftool.sc.egov.usda.gov/BFRP_Definition.aspx
Michigan State University Center for Regional Food Systems & The Wallace Center at Winrock International 64

APPENDIX This appendix lists procedures for data collection and analysis and gives a tutorial for interpreting statistical test results.
DATA COLLECTION AND ANALYSIS PROCEDURESThe following sections describe how the survey was distributed and how results were analyzed.
Survey DevelopmentThe 2015 National Food Hub Survey was a combination of questions, both verbatim and modified, from the 2013 National Food Hub Survey and new questions to clarify topics, address emerging topics, or address topics not covered in the 2013 survey. Topical sections of the survey included general characteristics of the food hubs, their mission and community, employees and volunteers, infrastructure and services, farm and producers/suppliers, finances, local and regional aspects of the hubs, food safety, and challenges and opportunities. Experts at the U.S. Department of Agriculture, Michigan State University’s Center for Regional Food Systems, and the Wallace Center at Winrock International reviewed the survey questions for suitability. This research was reviewed and determined exempt by the Michigan State University Human Research Protection Program (IRB# x12-1251e).
Listed SampleThe sample was derived to include as many food hubs as possible. The sources used to compile the sample were the 2013 National Food Hub Survey responses, the USDA Food Hub Directory, the NGFN food hub database, and Internet searches conducted by investigators. These sources resulted in a list of 547 e-mail addresses for key food hub personnel. For the purposes of the survey, key food hub personnel are any individuals listed as contacts for a hub that included an e-mail address as a source of contact. A food hub may have several key personnel listed in the sample.
Food hubs completing the survey were asked to provide business names and key personnel e-mail addresses for other food hubs of which they were aware. As new key personnel were identified, they were added to the listed sample and e-mail invitation/reminder queue.
Additional ResponsesRecognizing that the listed sample was likely incomplete, investigators asked individuals at universities and institutes with ties to food hubs to distribute a generic survey link to groups with whom they worked.
Data CollectionThe survey was programmed and administered and output for this report using Qualtrics software. The survey was administered via Web with the opportunity to download, complete, and return it via fax, scanned e-mail attachment, or postal mail. Following a modified version of Dillman’s method (Dillman, Smyth, & Christian, 2014), key personnel were sent an initial invitation, and key personnel from non-responding hubs were sent multiple, varied e-mail reminders. Data collection began March 18, 2015, and ended May 17, 2015. The first or most complete response received from an individual representing a hub was used as that hub’s response in analysis.
Response RateResponse rate was calculated using American Association for Public Opinion Research (AAPOR) guidelines for Internet surveys of specifically named persons and guidelines for establishment surveys (AAPOR, 2015). Duplicate key personnel for one food hub, duplicate surveys for one food hub, those organizations screened out as non-hubs, and hubs not doing business in 2014 were removed as ineligible and not used in response rate calculations. One hundred forty-three hubs out of the 434 enterprises not identified as ineligible responded based on targeted e-mails. The response rate (RR2), which counts partial completes as responses, was 33%.
Michigan State University Center for Regional Food Systems & The Wallace Center at Winrock International65

While it is not appropriate to include them in the response rate calculation, eight additional organizations verified to be food hubs and not identified in the listed sample responded via generic survey link.
In total, 151 completed and partial surveys were used in analysis.
Data Processing and AnalysisQuantitative analysis of survey responses was carried out using IBM’s SPSS Statistics 22 for Windows. Due to the nature of the data collected from the survey, all statistical tests utilized are non-parametric. Spearman’s rho was used to measure correlations between continuous and ordinal variables.
TUTORIAL FOR INTERPRETING STATISTICAL TEST RESULTSThroughout this report, various statistical tests have been chosen depending on what is appropriate for a pair of variables. The statistical tests measure (1) the strength of the association between the two variables, (2) the direction of the association between the two variables, and (3) the odds that the association is simply random rather than real. In statistics, association is usually called correlation.
The footnotes present the statistical test results in notation standard for a specific test, but all footnotes give an r-value and a p-value. The r-value specifies the strength and direction of the correlation, and the p-value specifies the odds that the statistical test results are random.
r-ValuesRegardless of whether an r-value is notated with a sub- or superscript, it is always a number with an absolute value between 0 and 1. The higher the r-value is, the stronger the correlation between two variables. An r-value also shows the direction of the correlation as positive or negative. A positive r-value means both variables increase or decrease together. For example, as the maximum number of produce boxes that can fit in a truck increases, the total cubic space of the truck increases. A negative r-value means one variable increases as the other variable decreases, or vice versa. For example, as the number of people picking apples from a tree increases, the number of apples on the tree decreases.
p-ValuesA p-value less than .01 is considered extremely reliable in virtually all research fields. A p-value less than .05 is considered very reliable in most research fields. Any p-value less than .05 means that the results of the test are statistically significant and the results are almost certainly not random, but real.
Correlation Does Not Imply CausationWhen interpreting the results of statistical tests, it is important to know that just because two variables are correlated, one does not necessarily cause the other. For example, the number of vehicles using a road may be correlated to the number of potholes on that road. But the weight of the vehicles, the quality of the paving job, the amount of precipitation, and the number of freeze/thaw cycles might be causes of potholes. Establishing what makes something happen (causation) is complex and can rarely be accomplished by showing that two variables that happen to change in similar ways explain the problem.
Michigan State University Center for Regional Food Systems & The Wallace Center at Winrock International 66

COPY OF THE 2015 SURVEY A PDF copy of the full 2015 National Food Hub Survey can be found on Michigan State University’s Center for Regional Food Systems website: http://foodsystems.msu.edu/resources/2015-food-hub-survey
MICHIGAN STATE UNIVERSITY CENTER FOR REGIONAL FOOD SYSTEMS The Michigan State University Center for Regional Food Systems (CRFS) is an applied research, education, and outreach organization. CRFS unites the expertise of MSU faculty and staff to strengthen understanding of and engagement with regional food systems. Since 2010, CRFS has advanced food systems rooted in local regions and centered on food that is healthy, green, fair, and affordable in order to build a thriving economy, equity, and sustainability for Michigan, the country, and the planet. More about CRFS can be found at http://foodsystems.msu.edu.
THE WALLACE CENTER AT WINROCK INTERNATIONAL The Wallace Center at Winrock International serves the growing community of civic, business, and philanthropic organizations involved in building a new, good food system in the United States. In particular, the Wallace Center is focused on advancing regional, collaborative efforts to move good food—healthy, green, fair, affordable food—beyond the direct-marketing realm into larger scale, wholesale channels. The Center works from a market-based strategy to scale up the supply of healthy food; to do this, the Center applies its research and that of others to understand, document, and disseminate viable enterprise models. The National Good Food Network (NGFN), coordinated and supported by the Wallace Center, is a cross-sector center of learning and networking for individuals and organizations from all aspects of the food system, from production through distribution and processing, to consumption as well as supporters such as government and funders and investors. The NGFN Food Hub Collaboration is a partnership between the Wallace Center at Winrock International, USDA, NGFN, Michigan State University, and others. The Collaboration is working to ensure the success of existing and emerging food hubs in the U.S. by building capacity through connection, outreach, research, technical assistance, and partnerships. By supporting this crucial player in the value chain, the Collaboration aims to accelerate the growth of regional food systems that make healthy and affordable food available to all communities while fostering viable markets of scale for regionally focused producers. More about the Wallace Center and its work can be found at http://wallacecenter.org and at http://ngfn.org.
Michigan State University Center for Regional Food Systems & The Wallace Center at Winrock International67