Finding the Next Big Thing(s) in Building Energy …...Click To Edit Master Title Style Finding the...
37
Click To Edit Master Title Style Finding the Next Big Thing(s) in Building Energy Efficiency: HIT Catalyst and the Technology Demo Program November 4, 2014 3:00-4:00 PM EST
Transcript of Finding the Next Big Thing(s) in Building Energy …...Click To Edit Master Title Style Finding the...

Click To Edit Master
Title Style
Finding the Next Big
Thing(s) in Building Energy
Efficiency: HIT Catalyst and
the Technology Demo
Program
November 4, 2014
3:00-4:00 PM EST

2
Overview and Agenda
Welcome and Overview
Department of Energy: High Impact Technology Program
University of Colorado, Boulder: Ultra Low Temperature
Freezer Demonstration
Department of Energy: Technology Demonstration
Opportunities
Additional Resources
Question & Answer Session

Today’s Presenters
3
Name Organization
Amy Jiron Department of Energy
Kathy Ramirez
AguilarUniversity of Colorado, Boulder

The High Impact Technology Catalyst Team
U.S. Department of EnergyAmy Jiron
Andy MitchellCharles Llenza
Kristen Taddonio
Navigant Consulting, Inc.Collin Weber
Dan ChwastykWilliam Goetzler
Michael Deru, NRELJessica Granderson, LBNL
Linda Sandahl, PNNLMelissa Voss Lapsa, ORNL

High Impact Technology (HIT) Catalyst
Images courtesy CREE, True Manufacturing, A.O. Smith, Bernstein
Associates, Cambridge Engineering, Alliance Laundry Systems, NREL
Commercial Buildings Integration
Building Technologies Office

6
How can we catalyze the adoption of
high impact commercial building
technologies?
Owners
DesignersEngineers
ManagersOccupants Financial
Institutions
Government Utilities
ScientistsManufacturers Dealers
Suppliers
Stakeholder Engagement & Partnerships

•
•
7
We look at a variety of factors… for example, RTUs
In the U.S., packaged units:
condition 40 billion square feet of the commercial building floor space
consume 2,100 trillion Btu of primary energy annually
Many RTUs are past their typical life span, functioning at much lower efficiency levels
than new units, and are ready to be replaced.
Current market conditions indicate more than 200-300 trillion Btu/year at high penetration.
DOE developed the RTU Challenge Specification to drive new
efficiencies and launched the Advanced RTU Campaign to increase
adoption of existing efficiencies.

8
-
Putting it all together: The HIT Catalyst
Goal: The High Impact Technology (HIT) Catalyst will identify and prioritize costeffective, underutilized, energy-efficient technologies so that we can focus resource development and deployment activities.
Methodology: Cohesive step-by-step strategies move techs from newly commercialized to full adoption. Each step in the tech-to-market pipeline has a purpose and connection to the next step; all are integrated into existing BTO deployment networks.
Target Market and Audience: Deploy HITs through partnerships with the commercial buildings industry via the Better Buildings Alliance, federal leaders, regional non-profits and efficiency organizations.
Outcome: Provide commercial building stakeholders with resources and proven deployment paths to accelerate implementation and market acceptance of HITs.

9
Identification and Evaluation of HITsIdentify HITs through a rigorous prioritization process; characterize HITs based on their stage in the product life cycle; develop appropriate resources; evaluate and implement the most effective deployment activities.
1. Conduct Initial
Screen(unit savings, total
technical savings potential,
commercialization status)
2. Conduct
Secondary Screen(stakeholder input,
criticality of CBI
involvement, cost)
Demonstration
Specification
Challenge
Campaign
Broad technology
list from:
• RFI
• Prioritization Tool
• Inter-Agency
• Market
• Manufacturers
• EERE emerging
technologies
• Utility programs
High Potential
Technologies
High Impact
Technology
List
3. Select
Activities
HIT
Id
en
tification
Ma
rket
Tra
nsfo
rma
tion

10
What is the most effective market transformation pathway?
Activities
Theory of Impact: Once a company has successfully
piloted a new technology through a campaign, they will replicate that technology throughout their building portfolio.
Case Studies
Metric: Number of case studies Published
Technology Campaign
HITs support voluntary programs (leading to greater adoption and energy savings)
Installations
Metric: Number of sites/sf/orgs committed
Technology Demos
Collect HIT market transformation data (leading to higher efficiency candidate levels and energy savings)
Key OutcomesOutputs
Technology Procurement
Specifications
Metric: Number of technical specs produced
Theory of Impact: Building owners are uncertain
about the performance of new technologies and risk adverse; real building performance information will make them more likely to adopt.
Theory of Impact: Template language that outlines the
performance characteristics of proven and cost effective HITs streamlines purchasing, enables “apples to apples comparisons potentially lowering overall cost of adoption.
Greater organic adoption of HITs (leading to greater energy savings)

11
Ongoing Example - How HITs move through the PipelineScreen Plan & Develop Implement Track Market
Uptake
Reduce Energy Consumption
(BTO goal)
CBI DEPLOYMENT
STRATEGY
Direct resource development and
demonstration
Market stimulation via leading organizations
Deployment through leaders’ portfolios and
consideration for voluntary standards
Data influences cost reductions and wrap up via efficiency programs
ACTIVITIES
FY11-12: Produced parking light SPECIFICATION via BBA. FY12: Conducted DEMONSTRATION via Caliper program.
FY13-15: Campaign for uptake through the Lighting Energy Efficiency in Parking (LEEP) CAMPAIGN with marketpartners and BBA.
FY14-15: Utilities, REOs and OEMs reference specs to deploy efficiency levels broadly through voluntary programs and/or certification.
FY15: Participation in the LEEP Campaign providesreduces and information to help owner s reduce energy costs.
IMPACTS
Measurement from demos prove average savings and reduce risk for owners; case studies help make the business case.
By end of 2012, 10 BBA members representing <5% of US parking space were using spec.
Campaign quantifies actual energy savings, market uptake trajectory, and adoption by market leaders.
If 100% of parking lots and structures nationwide switched to spec-level lighting, we would save over .85 quads and $4 billion/year.
-
-
-
Measure penetration rates with market leadersConfirm tech penetration via market researchDemonstrate sufficient uptake for codes and standards consideration
Parking lightingrepresents almost 1% of all US use or 900M parking spots with 160M light fixtures.
Data from LEEP supports the development of voluntary programs and efficiency program offerings.

12
Steps to Prioritization
Phase 1: The HIT Matrix helps us identify market ready technologies including:
–
–
–
–
information on technologies developed through work by the BTO Emerging Technologies team (P-Tool);
technology-specific and national energy savings potential values;
In total, over 400 measures to evaluate.
The Matrix includes two screens for: 1) energy savings opportunity and deployment readiness; and 2) market factors.
Phase 2: Peer Workshops provide perspective on market factors and feedback on priority technologies identified in the Matrix:
–
–
–
Academia, Federal Agencies, Utility, Regional Energy Organizations
28 unique organizations and 50 individuals participated
RFI open for input by building owners/end-users and technology providers

13
•
•
•
•
•
•
What We Heard: the Preliminary HIT List
Remain aware of the need for technology groupings,
applications and packages rather than specific technology types;
address the synergies between technologies
Controls in general – across all load types – are an area where much work
needs to be done. There are many competing platforms, protocols, etc. and
many different ways to implement the control systems (individual fixture/load
level, building level, etc.). End users are confused by the
choices, afraid of technology obsolescence, and need
guidance in this space.
Don’t always assume that a pure technology solution is the answer. In some
cases, best practice or operational solutions can yield the
same results at much lower costs.
Data on “real use” and end user behavior is extremely important in weighing
the benefits of a technology, as the gap between “real use” and
“ideal use” can be large.
There is value in enabling technologies such as smart metering,
though it may be difficult to quantify independently.
Generally speaking, there can never be too much
independent, third-party demonstration data.
Academic/Industry
Federal Agencies
National Labs
Regional Organizations
Utilities

14
HIT Priority List
Measure Name Description
LED Troffers with ControlsDeploy high-efficiency (solid-state) 2x4 troffers with added
controls
Packages of Building Management and Information Systems and Whole Building
Diagnostics
Optimize whole-building management systems that enable the operation of multiple systems to minimize consumption based
on occupancy, weather, fuel prices, etc.; includes adjustment of thermostats, schedules, set points, calibration.
Auto Sash Fume Hoods for LaboratoriesDeploy restructured laboratory fume hoods with automatic sash closure. This technology has an automatic sash closure system
on a VAV hood that is controlled by an occupancy sensor.
Shading & AwningsDemonstrate energy reductions and other benefits to awnings
and other shading devices on commercial buildings.
Refrigeration Controls & Display Case Retrofits
• Use variable speed compressors in select new commercial refrigeration equipment;
• Retrofit display case doors with anti-sweat heaters, vinyl/composite door frames, and high-performance glass.
Heat Pump Water heaters
Deploy highest efficiency heat pump water heaters in residential and small commercial buildings

15
Next?
Annual HIT Matrix and Peer Reviews:
•
•
Incorporate stakeholder feedback (including today’s workshop)Select HITs for focus
Deployment Plan and Resource Development:
•
•
Evaluate existing resources, gaps, barriers and potential partnersDetermine the most effective deployment channels
Select & Execute Deployment:•
•
•
Campaigns, Technology Demonstrations, SpecificationsStrategic PartnershipsBetter Buildings
…Hand Off and Start Over
Evaluate and update each year to reflect evolving market conditions and
advances in technology.
16
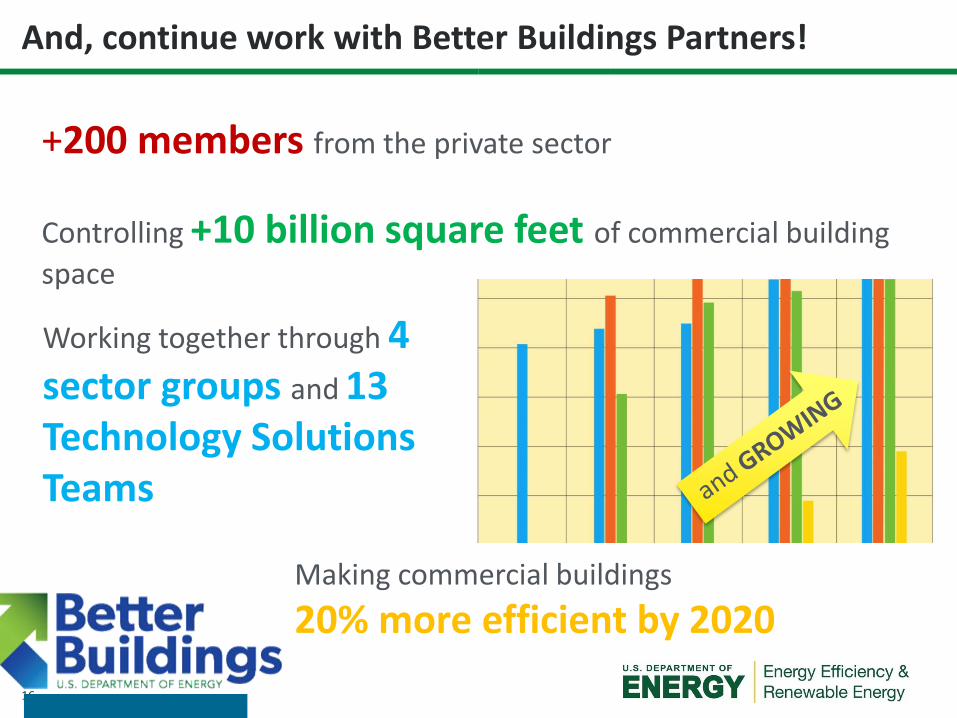
And, continue work with Better Buildings Partners!
+200 members from the private sector
Controlling +10 billion square feet of commercial building
space
Working together through 4 sector groups and 13 Technology Solutions Teams
Making commercial buildings
20% more efficient by 2020

17
Join us for Tech Day at the Better Buildings Summit
Leading Edge to Market-Ready: How Does Technology fit within the Federal Technology Framework?
•
•
The roles of different federal agencies in accelerating efficient building technologies.
Representatives from ARPA-E, ESTCP, GPG, FEMP and BTO
Innovative Energy Saving Technologies on the Market Now
•
•
Updates on new real building demonstrations,
Dynamic glazing, touchless audits and data centers.
What’s next? Tech-to-Market Projects for Next Generation Results.
•
•
•
•
A suitcase that retro-commissions small buildings,
Advanced control systems for plug and play devices,
New easy-to-install air barriers,
Promising technologies from ARPA-E’s Building Energy Efficiency Through Innovative Thermodevices (BEETIT) program.

Kathy Ramirez Aguilar
Green Labs Program Manager
University of Colorado, Boulder

Ultra Low Temperature (ULT) Freezer Demo
The purpose of the demonstration was to evaluate the energy use of high-efficiency ULTs.
Goals included: Examine the effect of field conditions on ULT energy
use Collected energy, temperature, and door opening data for each
ULT freezer in the study over a period of 5 months
Provide more information to purchasers seeking energy-efficient products
Support U.S. Department of Energy (DOE) and Better Buildings Alliance efforts to increase market penetration of high-efficiency ULTs
19

Why CU-Boulder Green Labs was Interested
20
•
•
•
•
Aware of need for market
change for lab equipment
ULT freezers have been a
focus of the CU Green
Labs Program
~150 ULT freezers at CU-
Boulder
We wanted to help!

What was required?
21
•
•
•
•
•
•
•
•
Permission to participate
Locating the right freezers
Engaging stakeholders
Working with campus legal
Responsibility for loaner
On-site set-up with Navigant
Troubleshooting
Being point of contact
(Above pictures from Navigant)

Preliminary Results from DOE Demo
We observed that the demo ULTs used between 20%
and 66% less energy than the average baseline ULT.
220
100200300400500600700800900
1000
Demo-1 Demo-2 Demo-3 AverageBaseline
Ave
rag
e E
ne
rgy U
se
(W
-h/d
ay/f
t3)
Calculated Daily Energy Use at Standard Set of Conditions: Set-point -80°C, External temp 22°C, Door opening time 90 s

Taking the Project Further
23
Engaged scientists to raise the temp from -80 to -70⁰C to
include those impacts in the
study
4 kWh/day is more
energy than a full-size
Energy Star Freezer
consumes!
(Modified Graphic from UC Davis)-

Thoughts on the Experience
24
•
•
•
•
Positive, learning
experience for Green Labs
Many pieces had to fall into
place at CU-Boulder to
enable participation
Plan for more time than
you think
Worth our time to help
influence market changes
for lab equipment

Amy Jiron
High Impact Technology Catalyst
Department of Energy

HVAC Energy Savings through Novel HLR Air Treatment Technology from enVerid Systems.
Company: enVerid Systems, Inc., based in Houston.
Offering: HLR (HVAC Load Reduction)
–
–
Novel “Intelligent scrubber” modules added to HVAC systems
Eliminates most of the outside air double digit % savings
DOE Program Objectives:
–
–
Deploy HLR retrofits in several representative commercial buildings/sites
carefully monitor, document and analyze the performance, to demonstrate the energy savings and reliability.
Technology: HLR modules continually and automatically remove CO2 and VOCsfrom indoor air, thereby greatly reducing the need for air replacement and saving much of the power that HVAC systems use to treat the outside air intake.
–
–
–
Uses novel sorbents, automatically regenerated with intelligent algorithms
A scalable, easy-to-retrofit module that can be added to the existing HVAC system,
Cooling power savings can exceed 40% at peak and indoor air quality is improved.
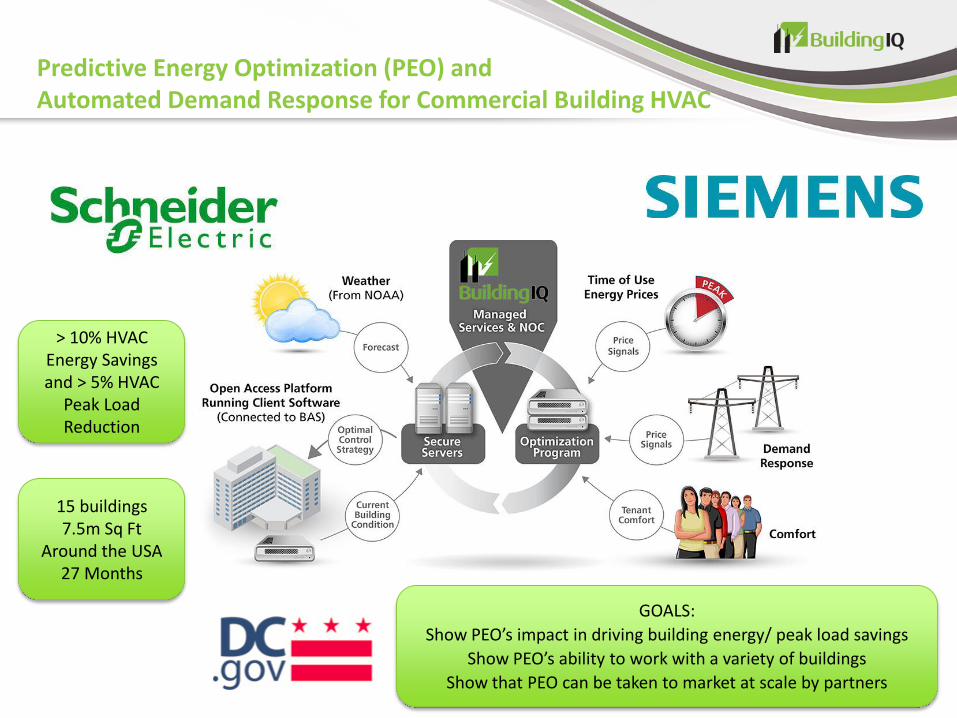
Predictive Energy Optimization (PEO) and Automated Demand Response for Commercial Building HVAC
> 10% HVAC Energy Savings and > 5% HVAC
Peak Load Reduction
GOALS:
Show PEO’s impact in driving building energy/ peak load savings
Show PEO’s ability to work with a variety of buildings
Show that PEO can be taken to market at scale by partners
15 buildings7.5m Sq Ft
Around the USA 27 Months

28
Northeast Energy Efficiency PartnershipsCommercial Advanced Lighting Control (CALC)
Demonstration and Deployment
•
•
•
•
Networked, Intelligent Lighting Control Systems
10 demonstration projects across Northeast Region
40,000 Sq. Ft. average project size
New Training and Incentive Programs to support
technology packages
Q4 2014
Q1 2015
Q2 2015
Q3 2015
Q4 2015
Q1 2016
Q2 2016
Select Technologies
Select Sites
Install Sites
• Visit www.neep.org or email [email protected] for
more information

DEMONSTRATION OF µCHP IN LIGHT COMMERCIAL HOT WATER APPLICATIONSAO Smith Corporation
Goal: To achieve 275 TBtu in annual source energy
savings in commercial buildings via large scale
deployment of µCHP in North America.
Objective: Address identified market barriers via
deployment of 8 field demonstration sites in NA
•
•
Northeast, Midwest and California;
>3000 gal/day, restaurants, hotels, healthcare,
multi-family housing
Expected Outcome: Provide stake-holders with the
information needed to build a sustainable market.
Specifically:
1. Verify value proposition of <3 year installed cost
payback
2. Identify and simplify installation and service issues
3. Create effective training for installation & service
personnel
Year 1: Site selection, market assessment, engine EPA
regulatory approval
Year 2: Site installation, refinement, sub-contractor
training
Overall Efficiency Comparing Conventional Electricity/Hot
Water Production with a µCHP System
Key Markets,
Market Value and
Unit Volume for
µCHP in NA

High Efficiency Motors for Refrigerated Open Display Cases
Type Efficiency Q-Sync advantage
Q-Sync 75% ----
Shaded Pole 19% +295%
PSC 35% +114%
ECM 60% +25%
Company: QM Power, Inc.
Technology: advanced Q-Sync fan motor technology for 7-16 watt commercial refrigeration fan applications
Objective: to install and verify performance for approximately 12,000 high efficiency Q-Sync fan assemblies in over 50 grocery sites throughout the US
Phase 1: Demonstration and Commercialization Planning, OEM Testing
Phase II: Limited Site Testing
Phase III: Site Demonstration, Testing and Deployment
If fully commercialized and adopted, Q-Sync motor applications have the potential to achieve over 0.6 quads and over $1 billion of energy savings in building applications.

31
•
•
•
•
•
•
•
•
•
Other Real Building Technology Demonstrations
Alternative Refrigerant Systems
Multi-load Washing Machines
Ultra-low Temperature Freezers
Daylighting and Lighting Controls Retrofits in Office Perimeters
Gas Unit Heaters
Heat Pump Water Heaters
LED Downlights
RTU Challenge Units
Advanced RTU Controls with Automated Fault Detection and Diagnostics

32
Participate in a Real Building Demonstration
•
•
•
•
enVerid HVAC Load Reduction: looking for office, education, retail spaces or airport terminals without demand controlled ventilation or an Energy Recovery Ventilator.
BuildingIQ Predictive Energy Optimization: already partnering with GSA and District of Columbia, looking for office, healthcare and enclosed retail malls, 100,000 sq. ft. or greater and digital controls at least on air handling units.
A.O. Smith micro-Combined Heat and Power: looking for restaurant, healthcare, hospitality, multifamily or other with hot water demand greater than 3,000 gals/day in the Northeast, Midwest and California.
Contact: [email protected]

Additional Resources

For More Information
34
Participate and Find Out About Field Demonstration Projects
o http://www4.eere.energy.gov/alliance/activities/demonstrations
Updates from the High Impact Technology Catalyst
o http://energy.gov/eere/buildings/high-impact-technology
Request For Information (RFI) on High Impact Commercial Building
Technologies
o https://eere-exchange.energy.gov/
Commercial Buildings Funding Opportunity Announcement
o http://energy.gov/eere/buildings/articles/apply-funding-
opportunity-advancing-solutions-improve-energy-efficiency

Question & Answer Session

Join Us for the Next Better Buildings
Webinar
36
Making Utility Efficiency Funds Work for You
Date: Tuesday, December 2
Time: 3:00 – 4:00 PM EST
Overview: A grocery chain, major city, and manufacturing organization each describe
how they have collaborated with utilities to bring big energy savings to their portfolios
and help reduce the overall peak electricity demand for the utility. Presenters will offer
recommendations for working with utilities to create innovative energy savings
opportunities customized to your portfolio type.
Register here.

Additional Questions? Feel Free to
Contact Us
37
Today’s
Presenters
Kathy Ramirez Aguilar
University of Colorado, Boulder
Amy Jiron
Department of Energy
DOE
Program
Leads
Holly Carr
DOE, Better Buildings Challenge
Kristen Taddonio
DOE, Better Buildings Alliance
Program
Support
Andrew Schulte
ICF International
John Jameson
ICF International
Follow us on Twitter @BetterBldgsDOE