Financing Renewable Energy in Developing Countries...
40
MOBILISING EUROPEAN RESEARCH FOR DEVELOPMENT POLICIES ON EUROPEAN REPORT DEVELOPMENT O ON N FINANCING RENEWABLE ENERGY IN DEVELOPING COUNTRIES: MECHANISMS AND RESPONSIBILITIES Prof Stephany Griffith-Jones, Initiative for Policy Dialogue, Columbia University, Prof Jose Antonio Ocampo, Initiative for Policy Dialogue, Columbia University, Dr Stephen Spratt, Institute of Development Studies
-
Upload
phungduong -
Category
Documents
-
view
222 -
download
3
Transcript of Financing Renewable Energy in Developing Countries...
MOBILISING EUROPEAN RESEARCHFOR DEVELOPMENT POLICIES
ON
E U R O P E A N R E P O R T
DEVELOPMENTOONN
FINANCING RENEWABLE ENERGY IN DEVELOPING COUNTRIES: MECHANISMS AND RESPONSIBILITIESProf Stephany Griffith-Jones, Initiative for Policy Dialogue, Columbia University, Prof Jose Antonio Ocampo, Initiative for Policy Dialogue, Columbia University, Dr Stephen Spratt, Institute of Development Studies

FINANCING RENEWABLE ENERGY IN DEVELOPING COUNTRIES: MECHANISMS AND RESPONSIBILITIES
SYNOPSIS
This paper reviews the instruments currently in use to finance renewable energy in developing countries, and considers those that have been proposed but not yet fully employed.
ON
E U R O P E A N R E P O R T
DEVELOPMENTOONN
2
3
This paper served as a background paper to the European Report on Development
2011/2012: Confronting scarcity: Managing water, energy and land for inclusive and
sustainable growth. The European Report on Development was prepared by the
Overseas Development Institute (ODI) in partnership with the Deutsches Institut für
Entwicklungspolitik (DIE) and the European Centre for Development Policy Management
(ECDPM).
Disclaimer: The views expressed in this paper are those of the authors, and should not
be taken to be the views of the European Report on Development, of the European
Commission, of the European Union Member States or of the commissioning institutes.
Financing renewable energy in developing countries: mechanisms and responsibilities
5
Contents
Contents 5 Tables & figures 6 Abbreviations 7
Introduction 8
1 Why is private renewable energy investment insufficient? 9
1.1 The economics of renewable energy 9 1.2 The supply of finance 12 1.3 Uncertainty and risk 21
2 Financial mechanisms 24
2.1 Mechanisms to alter the economics of renewable energy 24
2.1.1 Raise the costs of fossil fuels 24 2.1.2 Lower the costs of renewables 27 2.1.3 Boost the returns from renewables 27
2.2 Mechanisms to increase the supply of appropriate finance 28
2.2.1 Green bonds 28 2.2.2 Other types of bond 30 2.2.3 Concessional finance 31 2.2.4 Cornerstone and Challenge Funds 32 2.2.5 Mobilising Sovereign Fund and institutional investors’ assets 33
2.3 Mechanisms to reduce uncertainty 34
2.3.1 Guarantees linked to taxes 35
3 International transfer mechanisms and concluding comments 37
References 40
Financing renewable energy in developing countries: mechanisms and responsibilities
6
Tables & figures
Tables
Table 1.1 Top ten countries globally in terms of renewable energy potential relative to energy
use 11
Figures
Figure1.1 Relative costs for renewable energy technologies compared with each other, and
with non-renewable energy 9 Figure 1.2 Ranges of global technical potentials of RE sources 10 Figure 1.3 Global Renewable Energy Investment, 2004-10 12 Figure 1.4 Developed vs. Developing Country Renewable Energy Investment 12 Figure 1.5 Share of Developing Countries’ Renewable Energy Investments 13 Figure 1.6 Global Renewable Investment by Sector, 2004-09 14 Figure 1.7 Developing vs. Developed Sectoral Investment 2010 14 Figure 1.8 Renewable Investment forms 15 Figure 1.9 Support for Renewable Investments in Post-Crisis Stimulus Packages 15 Figure 1.10 Renewable Investment in Latin America ex Brazil, 2010 (US$ billions) 17 Figure 1.11 Renewable Investment in Africa 2010 (US$ Billions) 18 Figure 1.12 Risk List – Average Probability and Severity Scales 21 Figure 2.1 Petrol Taxes $US cent/litre, 2008 25 Figure 2.2 Renewable Energy as % of Total Energy Consumption, 2008 vs. 2020 26 Figure 2.3 DFI Investment in Renewable Energy, 2007-10 31 Figure 2.4 Key role of PFMs in supporting low-carbon funds 33 Figure 3.1 Registered project activities by host party. Total: 2,453 37
Financing renewable energy in developing countries: mechanisms and responsibilities
7
Abbreviations
AfDB African Development Bank
CAF Corporación Andina de Fomento
CAPEX Capital expenditure
CDM Clean Development Mechanism
CERs Certified Emission Reductions
CO2 Carbon Dioxide
COP Conference of the Parties
CSP Concentrated Solar Power
DFI Development Finance Institutions
EIB European Investment Bank
ETS European Trading System
ETS European Trading System
EU European Union
FIT Feed-in tariff
FTT Financial Transaction Taxes
GEEREF Global Energy Efficiency and Renewable Energy Fund
GhG Greenhouse gas
IEA International Energy Agency
IFC International Finance Corporation
IIED International Institute for Environment and Development
IPPC Intergovernmental Panel on Climate Change
JREC Johannesburg Renewable Energy Coalition
KwH Kilowatt hour
LDCs Least Developed Countries
LICs Low-income countries
MICs Middle-income countries
NOx Nitrogen oxide
PACE Property Assessed Clean Energy
PFM Public Finance Mechanisms
R&D Research and development
REDD Reducing Emissions from Deforestation and Forest Degradation
REED Rural Energy Enterprise Development
RPS Renewable Portfolio Standards
SCAF Seed Capital Assistance Facility
SRIs Socially Responsible Investors
SWF Sovereign wealth fund
UK United Kingdom
UNEP United Nations Environment Programme
US$ US dollars
USA United States of America
WEF World Economic Forum
WTA Willingness to accept
WTP Willingness to pay
Financing renewable energy in developing countries: mechanisms and responsibilities
8
Introduction
In order to halve current carbon emissions, the International Energy Agency (IEA) estimates
that, globally, US$45 trillion needs to be invested in renewable energy by 2050. This equates
to a little over US$1 trillion per year on average; in 2010 global investment in renewable
energy reached a record high of US$243 billion (UNEP and Bloomberg New Energy Finance,
2011), roughly a quarter of what is needed.
While halving global emissions seems a daunting task, it is at the bottom of the range of what
is required. In order to have a reasonable chance of keeping temperature increases below
2°C–2.4°C – the level beyond which scientists fear that feedback mechanisms could be
triggered – the Intergovernmental Panel on Climate Change (IPPC) estimates that global
emissions need to fall by between 50% and 85% by 2050. We are nowhere near on track to
achieve this; global emissions would need to peak by 2015 and decline rapidly thereafter, but
are still increasing at an accelerating rate. If current trends continue, the United Nations
estimates that global temperatures could increase by more than 6°C over the course of the
century, which is far beyond levels that human civilisation has ever experienced (Hansen et
al., 2008).
The situation is thus challenging to say the least. Of the estimated US$1 trillion of annual
investment required, around half is needed for energy efficiency or to replace existing
technologies (e.g. fossil fuel-based with renewable energy systems). Much of this is in the
developed world, but US$530 billion per year is needed for newly installed capacity, mainly in
developing economies. It is estimated that 85% of this total investment will need to come from
private sources (IEA, 2009).
While this is daunting, particularly the target for private investment, it is not impossible.
Annual fossil-fuel subsidies, for example, are around US$300 billion per year, which means
that US$530 billion of investment in 2030 would represent only 3% of global investment.
Although many felt that the 15th Conference of the Parties (COP15) in Copenhagen in 2009
was a disaster, COP16 held in Cancún in 2010 gave grounds for more optimism about the
possibility of reaching a global deal. Also, despite the difficulties in the intergovernmental
negotiations, neither the financial crisis and recession, nor the failure at Copenhagen, was able
to derail investment growth – global investments in renewable energy reached record levels in
2010. We remain well short of where we need to be, but investment is growing rapidly, and a
range of incentivising instruments have been employed to support this investment. We now
have a clearer understanding of the potential and limits of such instruments, and a range of
proposals has emerged to fill gaps or address weaknesses in the current portfolio of tools
available to policy-makers.
The purpose of this paper is to review the instruments we currently have, and to consider
those that have been proposed but not yet fully employed. To do this, however, we need to
understand why such instruments are needed in the first place, or, to put it another way, why
investment is not already flowing to the extent required. Section 2 then reviews mechanisms
in the light of this, while Section 3 considers international transfer mechanisms and concludes.
Financing renewable energy in developing countries: mechanisms and responsibilities
9
1 Why is private renewable energy investment insufficient?
Before considering how private investment could be increased to the extent needed we need to
understand the current obstacles. These can be organised into three categories:
1. The economics of renewable energy
2. The supply of finance
3. Uncertainty and risk
1.1 The economics of renewable energy
First and most fundamentally, the economics of renewable energy are generally not
competitive, as production costs per unit of energy are usually higher than for fossil fuels.
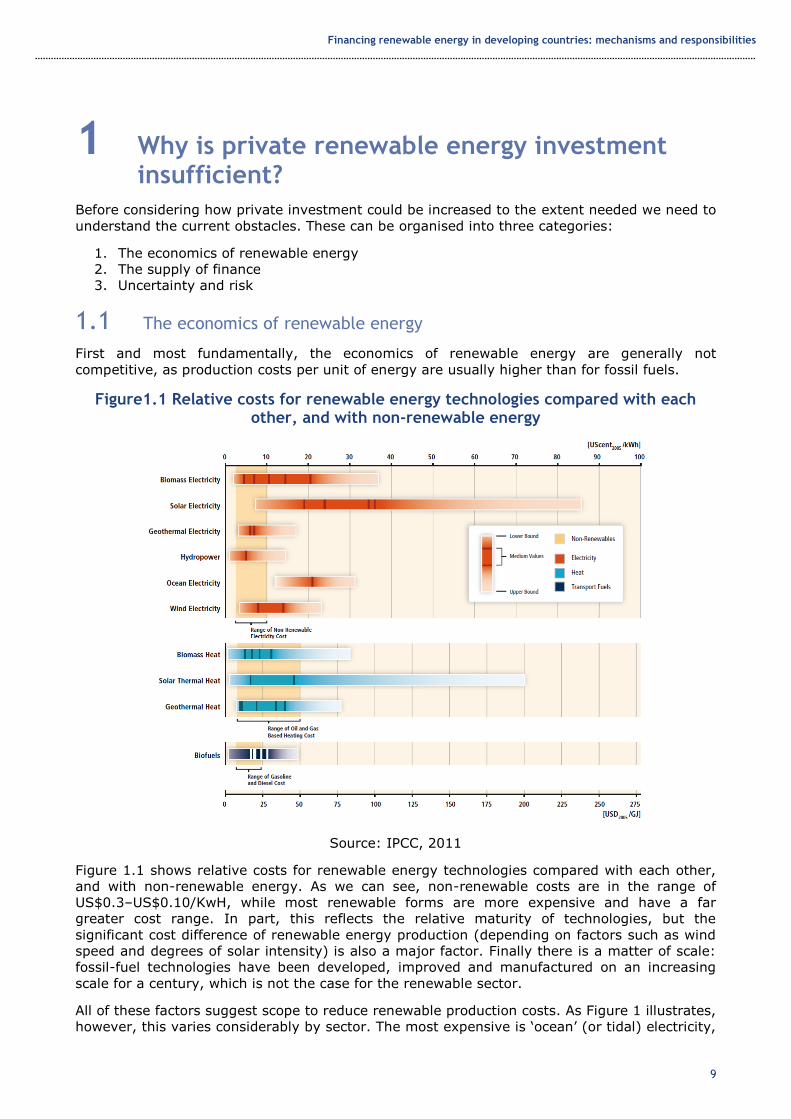
Figure1.1 Relative costs for renewable energy technologies compared with each other, and with non-renewable energy
Source: IPCC, 2011
Figure 1.1 shows relative costs for renewable energy technologies compared with each other,
and with non-renewable energy. As we can see, non-renewable costs are in the range of
US$0.3–US$0.10/KwH, while most renewable forms are more expensive and have a far
greater cost range. In part, this reflects the relative maturity of technologies, but the
significant cost difference of renewable energy production (depending on factors such as wind
speed and degrees of solar intensity) is also a major factor. Finally there is a matter of scale:
fossil-fuel technologies have been developed, improved and manufactured on an increasing
scale for a century, which is not the case for the renewable sector.
All of these factors suggest scope to reduce renewable production costs. As Figure 1 illustrates,
however, this varies considerably by sector. The most expensive is ‘ocean’ (or tidal) electricity,

Financing renewable energy in developing countries: mechanisms and responsibilities
10
which, even at the bottom of the potential cost range, remains uncompetitive with fossil fuels.
The next is solar power. At its cheapest, it is potentially competitive with fossil fuels, but mid-
range costs are well above fossil fuels. For solar power, the wide range reflects the cost
implications of different technologies. For example, large-scale Concentrated Solar Power
(CSP) techniques employed in a desert environment could produce electricity at a far lower
cost than small solar panels fitted to residential properties. Wind power is potentially cheaper
still, but remains more expensive than fossil fuels in most instances. Again, the range reflects
differing scales of energy generation, but also the different cost structures of onshore and
offshore wind. Finally, biomass, geothermal and hydropower in particular are already
competitive with fossil fuels in some circumstances (IPCC, 2011).
In addition to the absolute costs of renewable energy production, costs relative to fossil fuels
are also important. Three points should be stressed. First, fossil-fuel energy does not reflect its
full social costs. In 2006, the Stern Review described climate change as the ‘biggest market
failure in history’ as the environmental costs associated with carbon emissions are not included
in market prices (Stern, 2006). Not only are these externalities not reflected in prices, but
fossil fuels are actually subsidised to the tune of US$300 billion per year. Removing these
subsidies and incorporating external costs into non-renewable energy costs would dramatically
change relative costs. For the latter, carbon taxes would be ideal, but if that is not feasible
politically, it may be desirable to add a shadow price of carbon to evaluations of energy
projects by public agencies (see below, and also Griffith-Jones and Tyson, 2011 for European
Investment Bank (EIB) experience on this).
Second, it is more expensive to deliver non-renewable energy in some places than others. For
example, rural communities in developing countries are often not connected to grids, so that
localised, ‘off-grid’ energy production – particularly solar power – is more competitive than in a
fully networked context.
Third, as shown in the Figure 1.2, there is no shortage of renewable energy potential at the
global level. In terms of primary energy, it is already technically possible to generate many
multiples of global energy supply using solar energy. Similarly, there is ample wind or
geothermal power to meet all of today’s global electricity demand.
Figure 1.2 Ranges of global technical potentials of RE sources
Source: IPCC, 2011
Financing renewable energy in developing countries: mechanisms and responsibilities
11
Perhaps more importantly, much of this global solar power potential is concentrated in
developing countries, but there is also high potential in other areas.
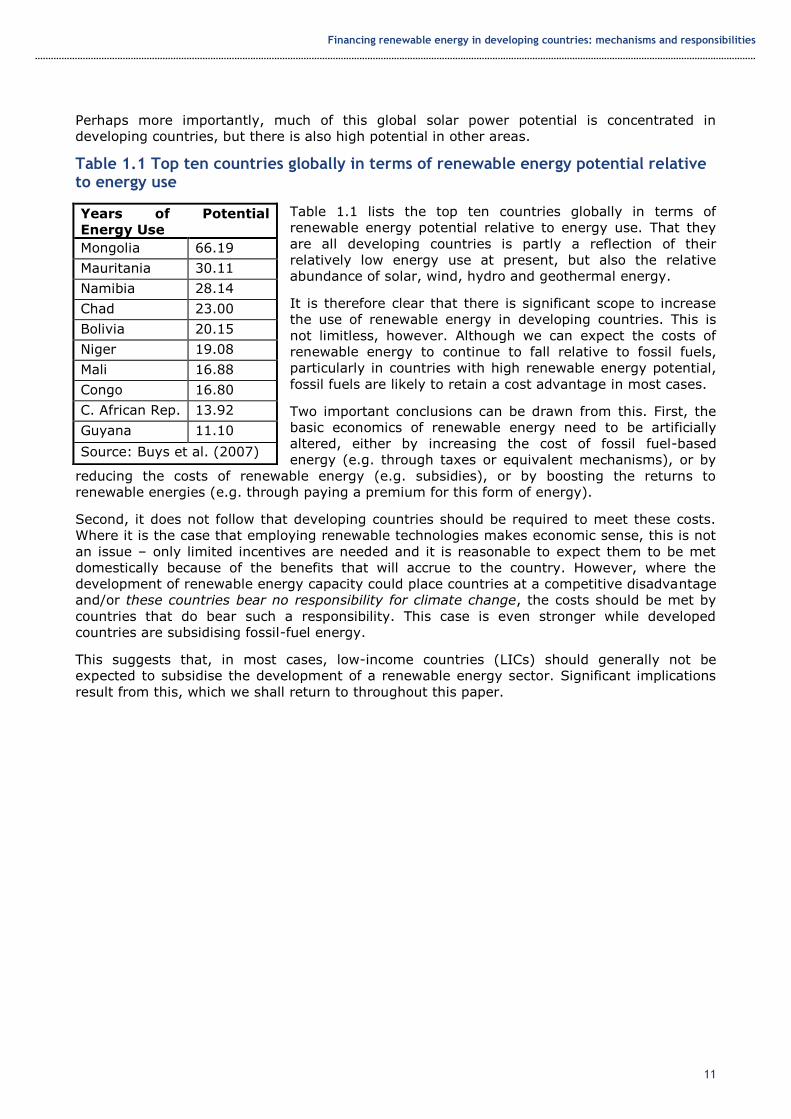
Table 1.1 Top ten countries globally in terms of renewable energy potential relative to energy use
Table 1.1 lists the top ten countries globally in terms of
renewable energy potential relative to energy use. That they
are all developing countries is partly a reflection of their
relatively low energy use at present, but also the relative
abundance of solar, wind, hydro and geothermal energy.
It is therefore clear that there is significant scope to increase
the use of renewable energy in developing countries. This is
not limitless, however. Although we can expect the costs of
renewable energy to continue to fall relative to fossil fuels,
particularly in countries with high renewable energy potential,
fossil fuels are likely to retain a cost advantage in most cases.
Two important conclusions can be drawn from this. First, the
basic economics of renewable energy need to be artificially
altered, either by increasing the cost of fossil fuel-based
energy (e.g. through taxes or equivalent mechanisms), or by
reducing the costs of renewable energy (e.g. subsidies), or by boosting the returns to
renewable energies (e.g. through paying a premium for this form of energy).
Second, it does not follow that developing countries should be required to meet these costs.
Where it is the case that employing renewable technologies makes economic sense, this is not
an issue – only limited incentives are needed and it is reasonable to expect them to be met
domestically because of the benefits that will accrue to the country. However, where the
development of renewable energy capacity could place countries at a competitive disadvantage
and/or these countries bear no responsibility for climate change, the costs should be met by
countries that do bear such a responsibility. This case is even stronger while developed
countries are subsidising fossil-fuel energy.
This suggests that, in most cases, low-income countries (LICs) should generally not be
expected to subsidise the development of a renewable energy sector. Significant implications
result from this, which we shall return to throughout this paper.
Years of Potential
Energy Use
Mongolia 66.19
Mauritania 30.11
Namibia 28.14
Chad 23.00
Bolivia 20.15
Niger 19.08
Mali 16.88
Congo 16.80
C. African Rep. 13.92
Guyana 11.10
Source: Buys et al. (2007)
Financing renewable energy in developing countries: mechanisms and responsibilities
12
1.2 The supply of finance
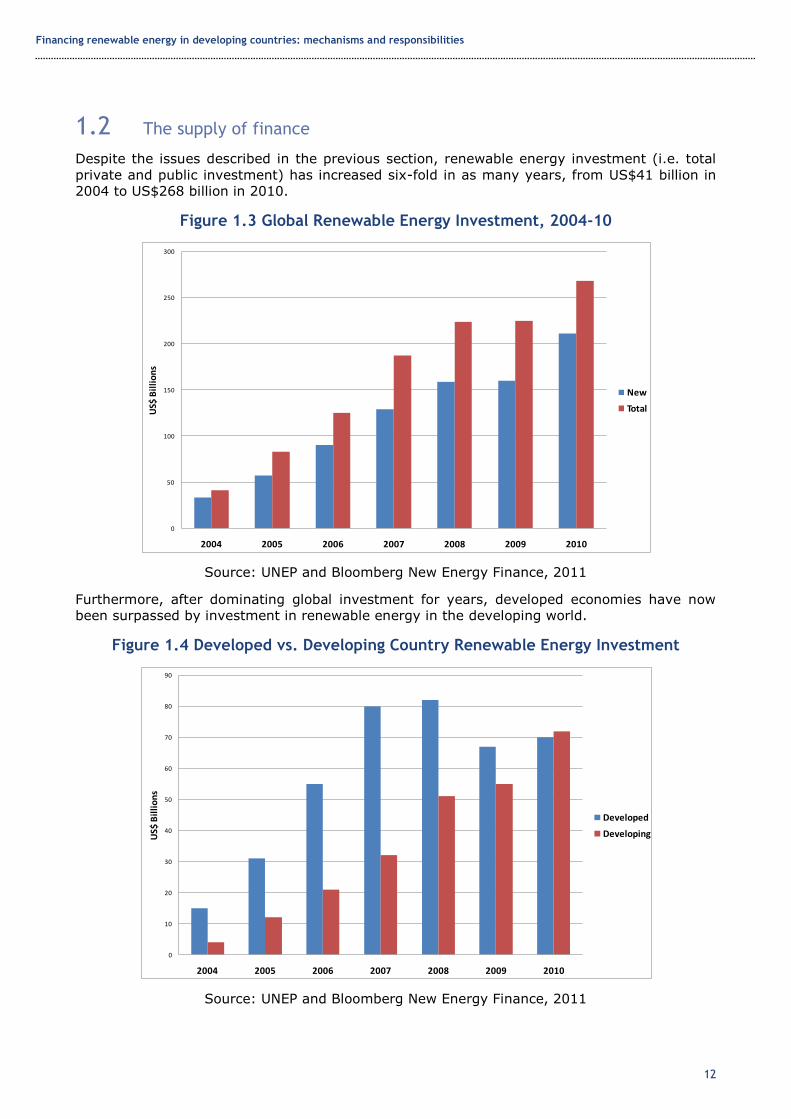
Despite the issues described in the previous section, renewable energy investment (i.e. total
private and public investment) has increased six-fold in as many years, from US$41 billion in
2004 to US$268 billion in 2010.
Figure 1.3 Global Renewable Energy Investment, 2004-10
Source: UNEP and Bloomberg New Energy Finance, 2011
Furthermore, after dominating global investment for years, developed economies have now
been surpassed by investment in renewable energy in the developing world.
Figure 1.4 Developed vs. Developing Country Renewable Energy Investment
Source: UNEP and Bloomberg New Energy Finance, 2011
0
50
100
150
200
250
300
2004 2005 2006 2007 2008 2009 2010
US$
Bil
lio
ns
Global Renewable Energy Investment, 2004-10
New
Total
0
10
20
30
40
50
60
70
80
90
2004 2005 2006 2007 2008 2009 2010
US$
Bil
lio
ns
Developed vs. Developing Country Renewable Energy Investment
Developed
Developing
Financing renewable energy in developing countries: mechanisms and responsibilities
13
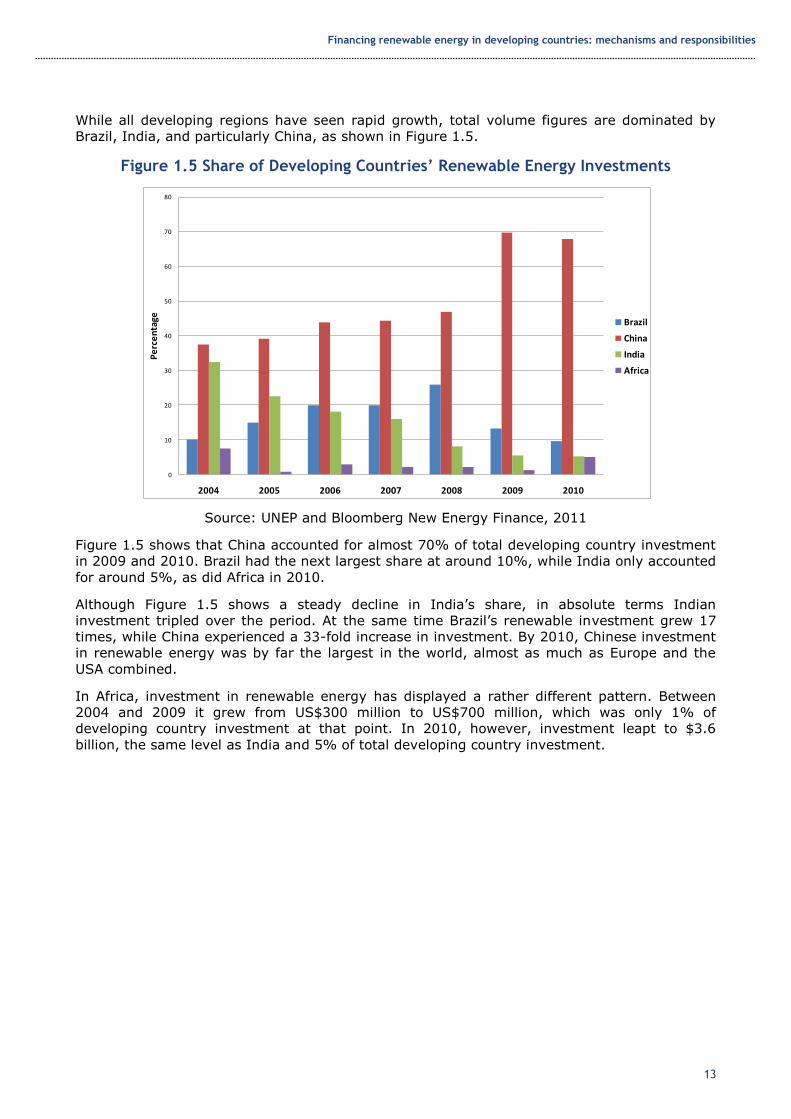
While all developing regions have seen rapid growth, total volume figures are dominated by
Brazil, India, and particularly China, as shown in Figure 1.5.
Figure 1.5 Share of Developing Countries’ Renewable Energy Investments
Source: UNEP and Bloomberg New Energy Finance, 2011
Figure 1.5 shows that China accounted for almost 70% of total developing country investment
in 2009 and 2010. Brazil had the next largest share at around 10%, while India only accounted
for around 5%, as did Africa in 2010.
Although Figure 1.5 shows a steady decline in India’s share, in absolute terms Indian
investment tripled over the period. At the same time Brazil’s renewable investment grew 17
times, while China experienced a 33-fold increase in investment. By 2010, Chinese investment
in renewable energy was by far the largest in the world, almost as much as Europe and the
USA combined.
In Africa, investment in renewable energy has displayed a rather different pattern. Between
2004 and 2009 it grew from US$300 million to US$700 million, which was only 1% of
developing country investment at that point. In 2010, however, investment leapt to $3.6
billion, the same level as India and 5% of total developing country investment.
0
10
20
30
40
50
60
70
80
2004 2005 2006 2007 2008 2009 2010
Pe
rce
nta
ge
Share of Developing Countries' Renewable Energy Investments
Brazil
China
India
Africa
Financing renewable energy in developing countries: mechanisms and responsibilities
14
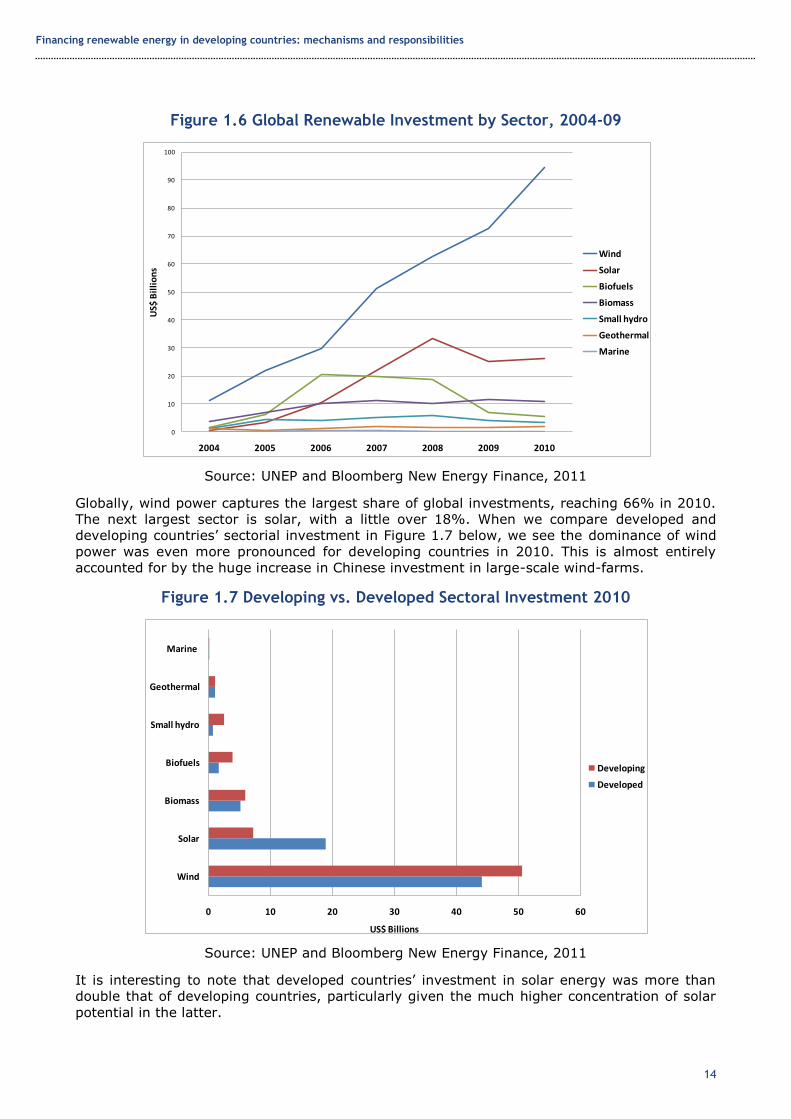
Figure 1.6 Global Renewable Investment by Sector, 2004-09
Source: UNEP and Bloomberg New Energy Finance, 2011
Globally, wind power captures the largest share of global investments, reaching 66% in 2010.
The next largest sector is solar, with a little over 18%. When we compare developed and
developing countries’ sectorial investment in Figure 1.7 below, we see the dominance of wind
power was even more pronounced for developing countries in 2010. This is almost entirely
accounted for by the huge increase in Chinese investment in large-scale wind-farms.
Figure 1.7 Developing vs. Developed Sectoral Investment 2010
Source: UNEP and Bloomberg New Energy Finance, 2011
It is interesting to note that developed countries’ investment in solar energy was more than
double that of developing countries, particularly given the much higher concentration of solar
potential in the latter.
0
10
20
30
40
50
60
70
80
90
100
2004 2005 2006 2007 2008 2009 2010
US$
Bil
lio
ns
Global Renewable Investment by Sector, 2004-09
Wind
Solar
Biofuels
Biomass
Small hydro
Geothermal
Marine
0 10 20 30 40 50 60
Wind
Solar
Biomass
Biofuels
Small hydro
Geothermal
Marine
US$ Billions
Developing vs. Developed Sectoral Investment 2010
Developing
Developed

Financing renewable energy in developing countries: mechanisms and responsibilities
15
Figure 1.8 Renewable Investment forms
Source: UNEP and Bloomberg New Energy Finance, 2011
Figure 1.8 above illustrates the three main forms of investment: technology (including
research and development (R&D) and venture capital); equipment (e.g. expansion capital from
private equity funds or public markets); and projects (i.e. new renewable energy facilities). As
can be seen, it is the latter which accounts for the majority of investment. The line on the
chart shows that this in turn is dominated by the asset financing of large facilities, compared to
small distributed capacity (e.g. residential solar capacity).
The numbers for total investment and investment growth are impressive. Despite the setback
at Copenhagen, and the global financial crisis, investment in renewable energy has continued
to grow globally.
However, there are important caveats. First, China is crucial to this story, representing a third
of all new investment in 2010. Second, renewable energy investments have been supported
globally by significant public support as part of the post-crisis stimulus packages in many
countries.
Figure 1.9 Support for Renewable Investments in Post-Crisis Stimulus Packages
Source: UNEP and Bloomberg New Energy Finance, 2011
0
20
40
60
80
100
120
140
160
180
200
2004 2005 2006 2007 2008 2009 2010
US$
Bil
lio
ns
Renewable investment forms
Technology
Equipment
Projects
Asset finance
0
10
20
30
40
50
60
70
80
2009 2010 2011 2012 2013
US$
Bil
lio
ns
Support for Renewable Investments in Post-Crisis Stimulus Packages
Financing renewable energy in developing countries: mechanisms and responsibilities
16
Due to lags in disbursing these public funds, 2010 saw a very large influx of almost US$75
billion, representing a significant proportion of total investment. Despite this support, however,
investment in Europe fell from a peak of US$47.2 billion in 2008 to US$35.2 billion in 2010.
The corresponding figures for North America were US$32.3 billion and £30.1 billion. It is the
increase in Chinese investment, from US$23.9 billion in 2008 to US$48.9 billion in 2010, which
has driven the global growth figures.
Part of China’s investment growth relates to its stimulus package but it is also a continuation
of high levels of ongoing investment, which cannot be described as ‘private’:
The source of funds for Chinese projects varied, but rarely came from Western financial
institutions. Quite often, state-owned or partially state-owned companies put up the
capital. A typical example was a 201mW wind project financed with US$ 295.3 million in
November by China Guangdong Nuclear Wind Power Co., a subsidiary of state-owned
China Guangdong Nuclear Power. (WEF, 2011: 13)
In the USA and EU, private investment remains dependent on state support, reflecting the
basic economics described in the previous section. For a variety of reasons, not least the
economic turmoil in the eurozone,1 a number of European countries are reducing their support
for renewable investment. In the USA, investment was supported by stimulus support that
allowed investors to claim back up to 30% of the CAPEX of projects in the form of grants.
Investment in the USA could thus be constrained by government spending cuts over the next
decade. This trend may have negative implications for investment in renewables (public but
also private), not just in developed but also in developing countries.
In terms of costs relative to fossil fuels, onshore2 wind remains the most competitive form of
renewable energy. In the most favourable locations, it is now on a par with or cheaper than
coal, but can still not compete with gas-fired power stations due to the low cost of natural gas.
This in large part explains the surge in wind investment in recent years, but this has still not
been enough to attract investment on purely commercial terms in many instances:
One of the largest wind projects to secure funding last year was the 845mW Shepherds
Flat wind farm being built by closely-held Caithness Energy of the US, in Oregon. It
closed a $1.3 billion loan from a group of 26 institutional investors and commercial
banks led by Citigroup, Bank of Tokyo-Mitsubishi UFJ, RBS Securities and West LB
Securities. The loan carries an 80% guarantee from the US Department of
Energy, supported by stimulus funding. [Emphasis added] (UNEP and Bloomberg
New Energy Finance, 2011: 41)
As well as the time-limited nature of these programmes, underlying demand in the USA is
falling as many states get close to fulfilling their Renewable Portfolio Standards (RPS), which
require them to supply a certain amount of energy from renewable standards. Perhaps most
fundamentally, the failure to pass supportive legislation – notably the cap and trade bill – in
the USA has further undermined appetite for risk of long-term investors. These factors were
reflected in market pessimism, where clean energy stocks underperformed the market by 20%
in 2010 (UNEP and Bloomberg New Energy Finance, 2011).
The dependence on public support of US firms has been starkly demonstrated by the filing for
bankruptcy of two major solar power companies. Following Evergreen Solar’s bankruptcy
announcement in July 2011, August saw Solyndra announce that a Chapter 11 bankruptcy
process was underway. The company had received US$527 million of taxpayer support as part
of the stimulus, as well as US$1 billion of private investment. In the context of concerns that
US companies are losing out to China in the renewable energy sector, Congressman Henry
Waxman of the House Committee on Energy and Commerce said the bankruptcies:
1 Information available at: http://www.nytimes.com/cwire/2010/07/29/29climatewire-europe-slashes-low-carbon-
energy-subsidies-a-61653.html?pagewanted=1 2 Offshore wind is a much less mature technology, with considerable technical challenges, and remains considerably
more expensive than onshore.
Financing renewable energy in developing countries: mechanisms and responsibilities
17
...are unfortunate warnings that the United States is in danger of losing its leadership
position in the clean energy economy of the future. We should be doing everything
possible to ensure the US does not cede the renewable energy market to China and
other countries.3
China is by far the biggest of the ‘big three’ developing country investors, and has focused
increasingly on wind power in recent years. At a much smaller scale, India has also focused on
wind power, while Brazil has seen investment in wind at the same level as that of biofuels.
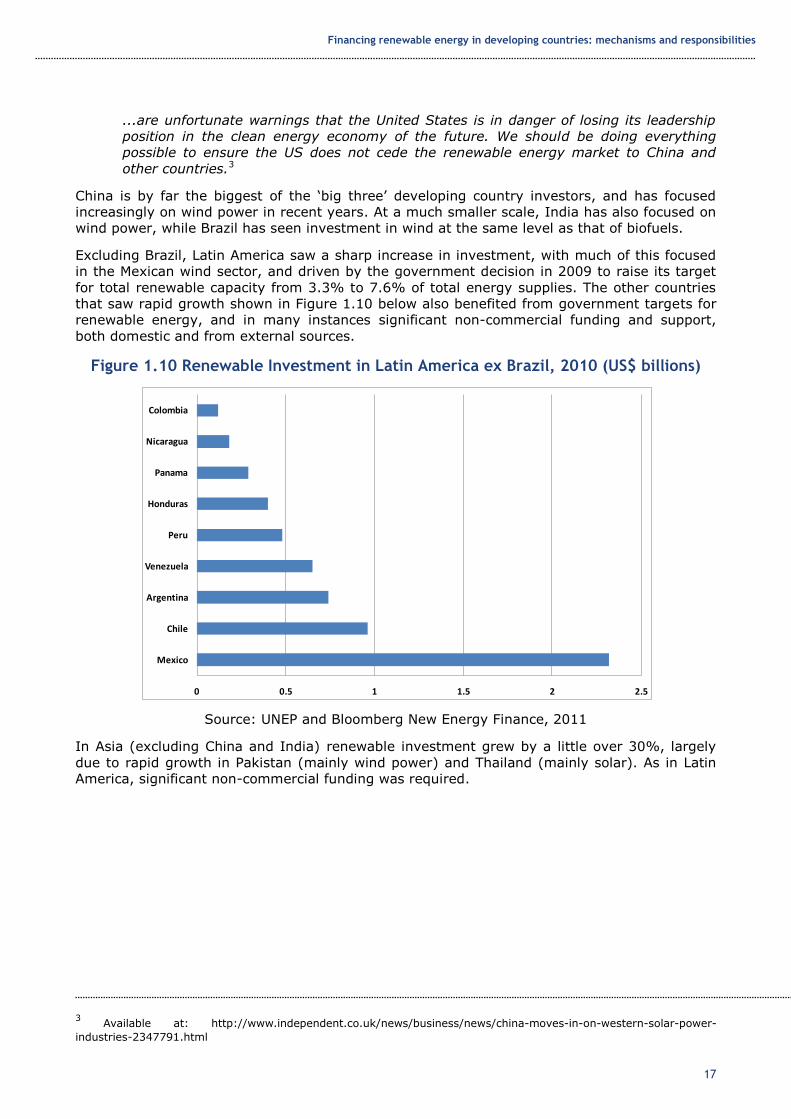
Excluding Brazil, Latin America saw a sharp increase in investment, with much of this focused
in the Mexican wind sector, and driven by the government decision in 2009 to raise its target
for total renewable capacity from 3.3% to 7.6% of total energy supplies. The other countries
that saw rapid growth shown in Figure 1.10 below also benefited from government targets for
renewable energy, and in many instances significant non-commercial funding and support,
both domestic and from external sources.
Figure 1.10 Renewable Investment in Latin America ex Brazil, 2010 (US$ billions)
Source: UNEP and Bloomberg New Energy Finance, 2011
In Asia (excluding China and India) renewable investment grew by a little over 30%, largely
due to rapid growth in Pakistan (mainly wind power) and Thailand (mainly solar). As in Latin
America, significant non-commercial funding was required.
3 Available at: http://www.independent.co.uk/news/business/news/china-moves-in-on-western-solar-power-
industries-2347791.html
0 0.5 1 1.5 2 2.5
Mexico
Chile
Argentina
Venezuela
Peru
Honduras
Panama
Nicaragua
Colombia
Renewable Investment in Latin America ex Brazil, 2010 (US$ billions)
Financing renewable energy in developing countries: mechanisms and responsibilities
18
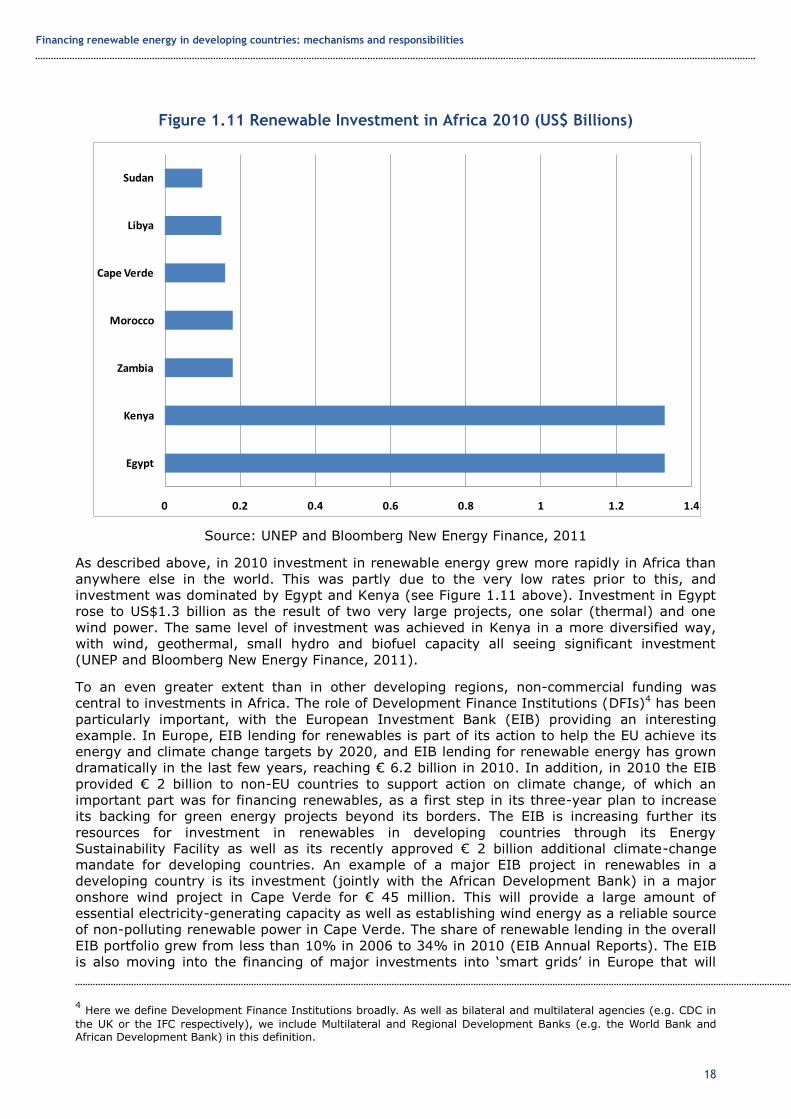
Figure 1.11 Renewable Investment in Africa 2010 (US$ Billions)
Source: UNEP and Bloomberg New Energy Finance, 2011
As described above, in 2010 investment in renewable energy grew more rapidly in Africa than
anywhere else in the world. This was partly due to the very low rates prior to this, and
investment was dominated by Egypt and Kenya (see Figure 1.11 above). Investment in Egypt
rose to US$1.3 billion as the result of two very large projects, one solar (thermal) and one
wind power. The same level of investment was achieved in Kenya in a more diversified way,
with wind, geothermal, small hydro and biofuel capacity all seeing significant investment
(UNEP and Bloomberg New Energy Finance, 2011).
To an even greater extent than in other developing regions, non-commercial funding was
central to investments in Africa. The role of Development Finance Institutions (DFIs)4 has been
particularly important, with the European Investment Bank (EIB) providing an interesting
example. In Europe, EIB lending for renewables is part of its action to help the EU achieve its
energy and climate change targets by 2020, and EIB lending for renewable energy has grown
dramatically in the last few years, reaching € 6.2 billion in 2010. In addition, in 2010 the EIB
provided € 2 billion to non-EU countries to support action on climate change, of which an
important part was for financing renewables, as a first step in its three-year plan to increase
its backing for green energy projects beyond its borders. The EIB is increasing further its
resources for investment in renewables in developing countries through its Energy
Sustainability Facility as well as its recently approved € 2 billion additional climate-change
mandate for developing countries. An example of a major EIB project in renewables in a
developing country is its investment (jointly with the African Development Bank) in a major
onshore wind project in Cape Verde for € 45 million. This will provide a large amount of
essential electricity-generating capacity as well as establishing wind energy as a reliable source
of non-polluting renewable power in Cape Verde. The share of renewable lending in the overall
EIB portfolio grew from less than 10% in 2006 to 34% in 2010 (EIB Annual Reports). The EIB
is also moving into the financing of major investments into ‘smart grids’ in Europe that will
4 Here we define Development Finance Institutions broadly. As well as bilateral and multilateral agencies (e.g. CDC in
the UK or the IFC respectively), we include Multilateral and Regional Development Banks (e.g. the World Bank and African Development Bank) in this definition.
0 0.2 0.4 0.6 0.8 1 1.2 1.4
Egypt
Kenya
Zambia
Morocco
Cape Verde
Libya
Sudan
Renewable Investment in Africa 2010 (US$ Billions)
Financing renewable energy in developing countries: mechanisms and responsibilities
19
facilitate connections of renewable energy into the main European grid (Griffith-Jones and
Tyson, 2011).
According to the EIB Annual Reports, its lending to developing countries includes a high
proportion of environmental and sustainable projects, with 33% of its financing relating to this
area in 2010. As well as direct financing, the EIB is engaged closely with developing countries
in providing technical assistance and technology transfer, adapting technology developed in its
projects in Europe. For example, solar power technology developed in Spain has been
transferred to Morocco (Source: Interviews).
An interesting feature of EIB projects is that they are subject to appraisals of environmental
and sustainability standards as part of the initial and ongoing project cycle. In addition, applied
technology is also always required by the EIB to be the best available from the perspective of
climate action. Project assessment includes a required economic rate of return which accounts
for the shadow cost of carbon which, for the EIB in 2020 will reach at least € 40 a tonne, rising
gradually from € 26 a tonne in 2006 (with a possible upward revision being studied). This
economic rate of return evaluation is undertaken in parallel to a purely financial rate of return
using market prices.
The EIB has developed a pioneering evaluation of all large projects to estimate net carbon
footprints. The absolute carbon footprint of a project is compared with a baseline which reflects
carbon emissions in absence of the project. Then a net carbon impact of projects is calculated,
using advanced models including industry-specific ones, for example for roads or shipping.
Appraising the economic rate of return, as described above, builds on the work of Little and
Mirrlees, which was widely used in the 1960s to evaluate projects with shadow prices that took
account of externalities. Such exercises are rarely done in other institutions. Just as important,
the EIB is mandated to fully incorporate environmental and social factors into its decision-
making5 and – crucially – is not required to make a market-level rate of return, though it is
supposed to break even.6
According to interviews carried out at the EIB, the calculation of an economic rate of return
(that takes account of a shadow price of carbon) has been particularly effective in promoting
projects in renewable energy that it otherwise might not have been financed, such as solar
energy projects in developing countries. However, it seems that this methodology has been
less valuable for discouraging projects with high carbon emissions. Nevertheless, the fact that
this economic evaluation is carried out, and that the EIB is committed to minimising the carbon
footprint of its projects more broadly, has had an impact on private and public project
proposals seeking EIB financing (interview material).
Another important aspect of EIB lending is that, in the context of significant externalities, it
can provide concessional lending (and finance the concessional element with EU grants) or co-
finance its non-concessional lending with EU grants to fund renewable energy projects. The
availability of large EU grants, and close collaboration between the EIB and the European
Commission, makes this difficult to replicate exactly in other institutions. Even so, the use of
global environmental fund financing could be combined further with other DFI lending.
Furthermore, the challenge of allocating relatively scarce public resources most effectively to
different blending modalities, so as to maximise their impact on reducing climate change, is
common to all institutions.
As we saw in the previous section, the circumstances of many developing countries,
particularly in rural areas, alters the economics of some low-carbon technologies. In its 2011
review of investment in renewable energy UNEP makes this point in a review of examples of
positive practice:
5 See IIED (2011) for an analysis of different global investment principles and how the EIB’s approach differs from
other bodies in this respect. 6 See Spratt and Ryan-Collins (forthcoming) for an analysis of how DFI mandates can affect their approach to these
issues, particularly with respect to the relative weight given to commercial and non-commercial factors.
Financing renewable energy in developing countries: mechanisms and responsibilities
20
In an increasing number of cases, renewable energy is not just one of the easiest non-
grid-connected options to establish, but also more cost-effective than the fossil fuel
alternatives. This trend has led to speculation that developing economies may be able
to ‘leapfrog’ developed countries in their use of renewable energy over the coming
decade. (UNEP and Bloomberg New Energy Finance, 2011: 54)
Examples of renewable energy options in developing countries are:
Generating energy in off-grid, rural power plants using discarded rice husks
Cooking at scale with solar energy (‘The world’s largest solar cooking system –
which churns out 50,000 meals a day – is installed at the temple of Shirdi in India’s
Maharashtra state’. Ibid: 56)
Powering mobile telephone masts using solar power
Converting waste to energy
Processing foods (e.g. dehydrating fresh fruits) with solar power
We could also add hydropower and geothermal energy to this list. As argued above, it is
important to distinguish approaches such as these, which make economic and social sense for
LICs, from those that may adversely affect their economic development, even though
environmental effects may be positive.
Financing renewable energy in developing countries: mechanisms and responsibilities
21
1.3 Uncertainty and risk
In reality, the preceding sections have addressed the same issues from different perspectives.
The economics of renewable energy have not been sufficiently favourable to attract private
investment on the scale required. As we saw in Section 1.2 this has led governments – to a
greater or lesser extent and in different ways – to provide financial support to the sector in a
variety of forms.
In part this is a matter of relative cost and revenues. Where costs are higher than with fossil
fuels, as is generally the case, the return on investment will be lower. This can be offset in one
of two ways – either by subsidising costs (through fiscal incentives or grants, for example), or
by boosting returns directly (paying a premium for energy generated from renewable sources,
for example).
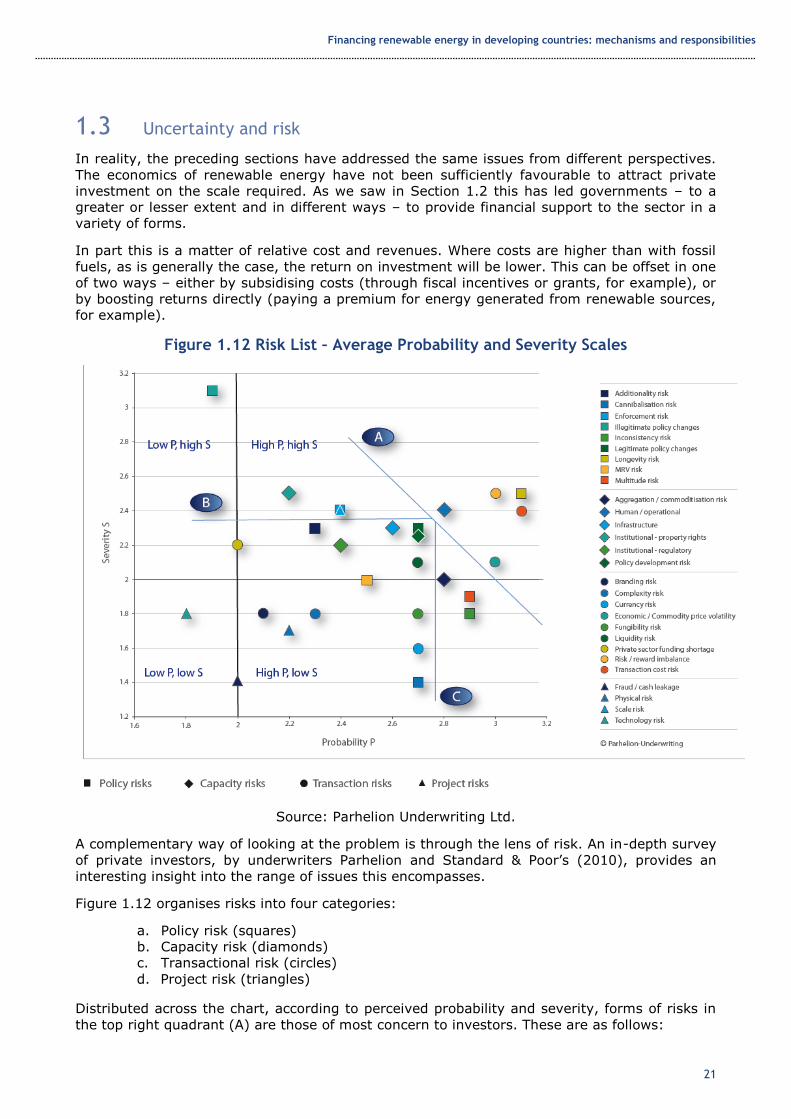
Figure 1.12 Risk List – Average Probability and Severity Scales
Source: Parhelion Underwriting Ltd.
A complementary way of looking at the problem is through the lens of risk. An in-depth survey
of private investors, by underwriters Parhelion and Standard & Poor’s (2010), provides an
interesting insight into the range of issues this encompasses.
Figure 1.12 organises risks into four categories:
a. Policy risk (squares)
b. Capacity risk (diamonds)
c. Transactional risk (circles)
d. Project risk (triangles)
Distributed across the chart, according to perceived probability and severity, forms of risks in
the top right quadrant (A) are those of most concern to investors. These are as follows:

Financing renewable energy in developing countries: mechanisms and responsibilities
22
a. Maturity mismatch
...investors are most concerned with the apparent mismatch between the long-term
nature of capital commitments inherent in climate change financing and the relatively
short time frame of climate change regulations. Investment horizons and/or capital
commitment periods can range from 20 years for a reasonably sized renewable energy
project to 50 years or more for a climate change adaptation-related investment.
(Parhelion Underwriting Ltd and Standard & Poor’s, 2010: 5)
The primary concern with ‘climate change regulations’ appears to be that government
interventions to alter the economics of the sector (such as through feed-in tariffs, for example)
are not commensurate with the investment timeframes in the infrastructure sector.
b. Risk/Reward imbalance
The second most severe risk is the same concern in a slightly different guise. For investors, the
risks involved in renewable energy may be very high. Given the timeframes involved and the
level of capital required, all infrastructure investment is risky, and infrastructure investment in
low-income/high-risk countries is particularly so. Given the need to maintain favourable
economics (often artificially) in the renewable energy sector, the risks are considerably higher.
As a result, investors feel that they should be well compensated for taking these risks, and the
concern is that over the lifetime of a project this will not be the case. When considering
investments across a range of asset classes with different risk/reward ratios, renewable energy
may seem a relatively unattractive form of investment.
c. Transaction cost risk
This risk is essentially a function of all the others. Investors fear that addressing the
complexities of renewable energy projects will be time-consuming and expensive, creating
significant transaction costs. This will also affect the risk/reward ratio negatively of course.
d. Human and operational risk
This concern partly reflects the immaturity of the sector and so its lack of established best
practice. For example, projects may be dependent upon the delivery of climate finance support
– through the Clean Development Mechanism (CDM), for example – but there is little
accumulated expertise in managing this process. Similarly, from a technological and
engineering perspective, facilities are often at the forefront of innovation, so that ‘best
practice’ does not really apply and ‘learning by doing’ is more the order of the day. Such risk
factors make investors very nervous, which is not surprising given the capital investments
involved.
Technically, the problem is the inability to measure the risks with any degree of accuracy,
which means they cannot be appropriately priced.
e. Economic/Commodity price volatility
This factor captures a number of concerns. First, the costs of fossil fuels have a large impact
on the relative returns of renewable energy. As a result, movements in global oil and natural
gas prices can fundamentally affect the relative economic attractiveness of a project.
Second, economic volatility (i.e. crises, recessions) are likely to influence the economics of
investment, through changing government priorities and their capacity and willingness to
maintain a supportive environment for the investment.
Third, the viability of renewable energy projects is fundamentally affected by current and
future carbon prices. To the extent that fossil-fuel prices reflect the environmental costs of
climate change, the higher the carbon price the more attractive will be renewable energy
projects. Besides the average price of oil and gas (and thus carbon), there is the issue of both
Financing renewable energy in developing countries: mechanisms and responsibilities
23
its short-and medium-term volatility, which impinges on the relative profitability of
renewables.
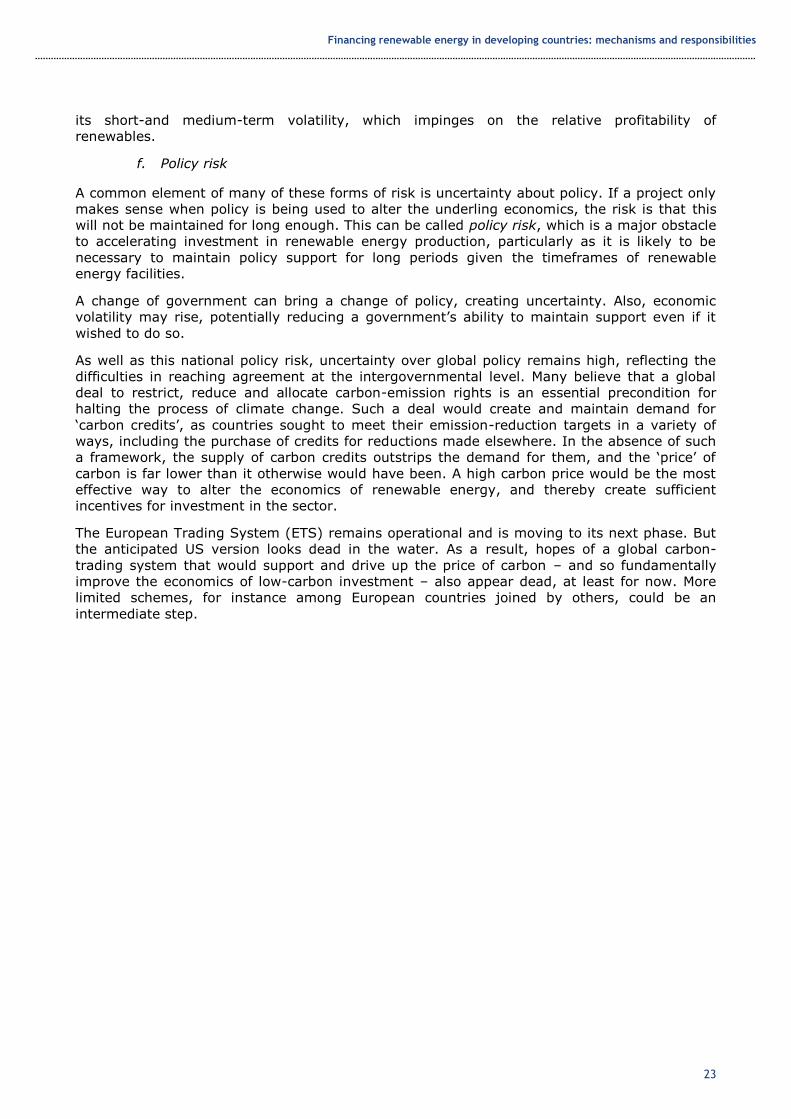
f. Policy risk
A common element of many of these forms of risk is uncertainty about policy. If a project only
makes sense when policy is being used to alter the underling economics, the risk is that this
will not be maintained for long enough. This can be called policy risk, which is a major obstacle
to accelerating investment in renewable energy production, particularly as it is likely to be
necessary to maintain policy support for long periods given the timeframes of renewable
energy facilities.
A change of government can bring a change of policy, creating uncertainty. Also, economic
volatility may rise, potentially reducing a government’s ability to maintain support even if it
wished to do so.
As well as this national policy risk, uncertainty over global policy remains high, reflecting the
difficulties in reaching agreement at the intergovernmental level. Many believe that a global
deal to restrict, reduce and allocate carbon-emission rights is an essential precondition for
halting the process of climate change. Such a deal would create and maintain demand for
‘carbon credits’, as countries sought to meet their emission-reduction targets in a variety of
ways, including the purchase of credits for reductions made elsewhere. In the absence of such
a framework, the supply of carbon credits outstrips the demand for them, and the ‘price’ of
carbon is far lower than it otherwise would have been. A high carbon price would be the most
effective way to alter the economics of renewable energy, and thereby create sufficient
incentives for investment in the sector.
The European Trading System (ETS) remains operational and is moving to its next phase. But
the anticipated US version looks dead in the water. As a result, hopes of a global carbon-
trading system that would support and drive up the price of carbon – and so fundamentally
improve the economics of low-carbon investment – also appear dead, at least for now. More
limited schemes, for instance among European countries joined by others, could be an
intermediate step.
Financing renewable energy in developing countries: mechanisms and responsibilities
24
2 Financial mechanisms
2.1 Mechanisms to alter the economics of renewable energy
In this section we will explore different mechanisms to alter the economics of renewable
energy and encourage investment by the private sector. Two issues dominate. First, measures
have to be strong enough to incentivise significant additional investment in renewables.
Second, associated costs to governments and other public bodies must be manageable and no
greater than required to provide these incentives, and must clearly be less than the level of
expected benefits. As well as direct and immediate costs, these need to include any contingent
liabilities in the future, as could be the case with unfunded guarantees, for example.
The key ‘value for money’ criterion is the effectiveness of public spending in generating
additional private investment (the leverage ratio), as well as the size of positive spillover
effects. There is always the option of direct public investment in renewables, either financed by
governments or by international organisations, and this needs to be compared with the
leveraging of private investment financed by public resources, in terms of effectiveness.
2.1.1 Raise the costs of fossil fuels
The fact that the environmental damage caused by the burning of fossil fuels is not factored
into their price is a clear example of a negative externality. The concept of an externality is
attributable to Pigou (1932), and occurs when private costs are lower than social costs. In such
a situation, private actors will produce more of a good than is socially optimal because they
capture all the returns but do not bear all the costs, a share of which are ‘externalised’. By
raising costs to producers or consumers,7 Pigouvian taxes aim to align private and social costs,
and so maintain production at socially (including environmentally) optimal levels. From a ‘value
for money’ perspective, an attractive feature of fiscal incentives is that they have the potential
to be self-financing.
There are three forms of Pigouvian taxes: first, second or third best. First-best taxes are
designed to achieve an ‘optimal’ level of pollution, so that the marginal costs of measures to
restrict pollution is equal to the marginal benefits that result from them. They seek to balance
these costs and benefits optimally across society. All carbon emissions could be eliminated of
course. The fact that this does not happen is because of the benefits – i.e. employment and
incomes – created by the activities producing the emissions.
In practice, first-best taxes remain an abstract ideal rather than a reality (Sterner, 2003). In
most cases the informational requirements to calculate marginal social benefits8 and cost
curves are prohibitively high as the basis for practical policy. Furthermore, there is uncertainty
about future social costs and benefits.
Second-best taxes do not seek to estimate marginal social benefits, but rather determine a
limit on an activity, and calibrate taxes to achieve the required reduction in the activity.
Importantly, this relates directly to the pollutant. The aim will thus be to reduce airborne
pollutants by taxing producers by volume of emission. With respect to fossil fuels, this would
tax CO2 emissions directly.
A number of countries use, or have used, second-best taxes of this kind for other forms of
pollutants. For example, Sweden dramatically reduced nitrogen oxide (NOx) emissions by the
7 It may be more equitable to tax consumption rather than production. Industrialised countries have increasingly
moved environmentally sensitive production to developing countries, or have purchased carbon-intensive products from producers in developing countries. Taxing production penalises these countries, whereas a tax on consumption would see the incidence of the tax fall on the source of demand and the end-users. 8 This requires the calculation of people’s valuation of non-traded, environmental goods. Two approaches are
commonly used. Hedonic pricing estimates people’s valuations through the prices of related goods, and is therefore a form of indirect revealed preference. Contingent valuations ask people directly about their valuations, often within a ‘willingness to pay’ (WTP) or ‘willingness to accept’ (WTA) framework.
Financing renewable energy in developing countries: mechanisms and responsibilities
25
use of a symmetrical tax/subsidy framework, which was also revenue-neutral. The tax rate
applied depends on the level of efficiency of the producer with respect to NOx emissions. If
efficiency is average, the rate is zero; if below average it becomes sharply positive; if above
average it turns negative, and the producer receives a subsidy. Penalties applied to ‘bad’
performers are therefore used to subsidise good performers.
Countries have yet to apply a framework of this kind directly to CO2 emissions. The closest is
to tax products in relation to their CO2 content, which many countries have done.9 Where this
is directly related to CO2 content (i.e. tax rates vary in proportion to products’ CO2 emissions)
it is essentially a second-best Pigouvian tax. Where it is applied to a product associated with
CO2 emissions, but not directly related to the level of emissions, it is a third-best form of
taxation.
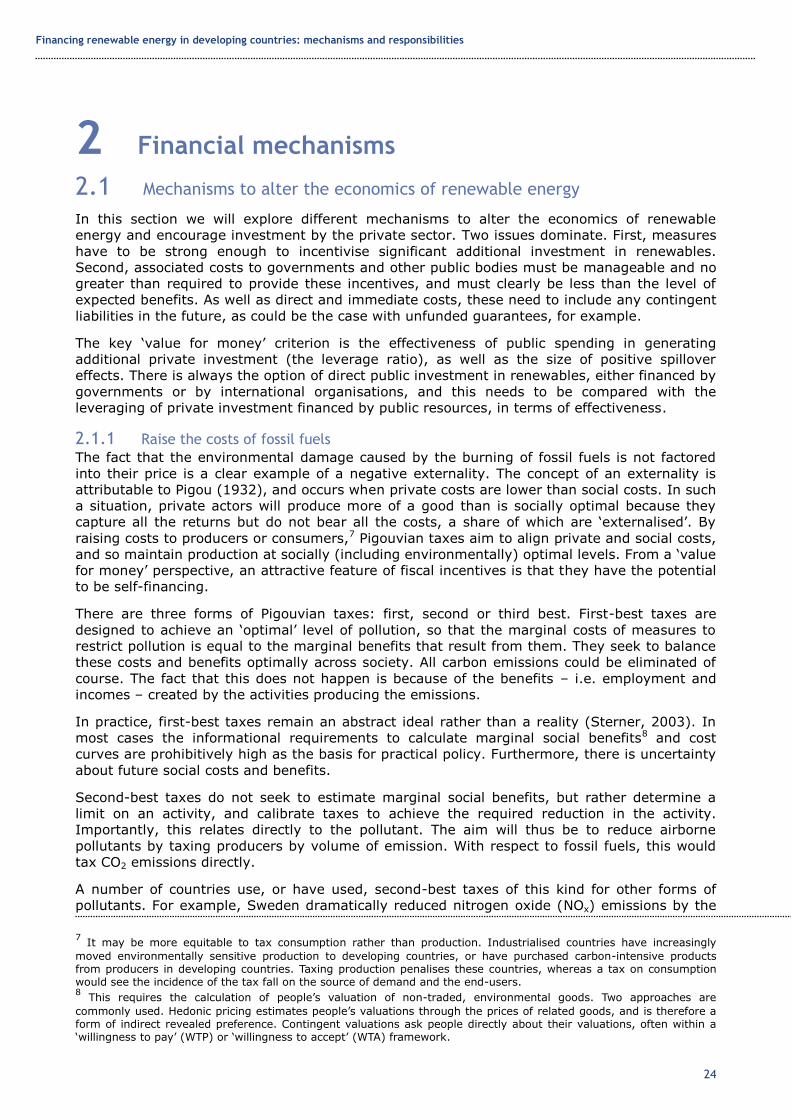
The most obvious examples are taxes on fuel. Most countries use fuel taxes to some extent,
and revenues from these forms of taxation account for 60%–70% of environmental tax
receipts globally. Rates vary enormously, however, as shown Figure 2.1.
Figure 2.1 Petrol Taxes $US cent/litre, 2008
Source: Sterner, 2011
Revenues from fuel tax are high because fuel is price-inelastic. Over the longer term, however,
elasticity increases, particularly when the availability of substitutes (e.g. public transport) is
enhanced. Sterner (2011) estimates that if European economies had applied the same rates of
tax as the USA in recent decades, demand for fuel would be a third higher than it is now.
The point is that fuel taxes can reduce fuel demand, but they need to be high and kept in place
for long periods to achieve this. The same is true of levies on the industrial use of fuel, which
will incentivise greater efficiency over time. This is not the same as reducing total usage, or
the resultant greenhouse gas (GhG) emissions, however. For this, efficiency gains have to
outstrip the rate of economic growth, and there has to be a progressive transfer to non-
polluting forms of energy throughout the economy. As we have seen, this has cost
implications, and so is likely to require carrots as well as sticks – subsidies as well as taxes.
Unlike taxes (that have the advantage of generating public revenues), subsidies come at a
fiscal cost. In some cases – as in the Swedish example – these can be financed by
9 For an overview see http://www.carbontax.org/progress/where-carbon-is-taxed/
0
20
40
60
80
100
120
140
160
Petrol Taxes $US cent/litre, 2008
Financing renewable energy in developing countries: mechanisms and responsibilities
26
complementary taxes, with no fiscal implications. Even here, however, the cost falls squarely
on the economy in question. From a development perspective, this may be unfair. The reason
why there is a need to make the transition to green growth is because of the accelerating
problem of climate change. This, in turn, is largely the result of the historical accumulation of
CO2 in the atmosphere caused by the industrialisation of today’s developed countries. During
their development process, they freely exploited the energy contained in fossil fuels. The
wealth that developed countries enjoy today can be seen, in no small part, as the
accumulation of physical capital (wealth) at the cost of the deterioration of another form of
capital (i.e. the natural capital10 represented by a sustainable environment).
While it can be argued that some middle-income countries (MICs) have also contributed to this
problem, and will increasingly do so, this is not the case with LICs. Consequently, it is
unreasonable to expect them to adopt measures that will negatively affect their own
development prospects because of factors for which they bear no responsibility.
As many developed countries are discovering, however, decoupling economic growth from GhG
emissions is extremely hard, even in relative terms. Worryingly, there is no evidence to date of
absolute decoupling – where GDP growth does not result in higher CO2 emissions. Companies
that pay carbon taxes may be put at a disadvantage when competing internationally, and on a
macro scale countries that generate a large part of their energy from renewable sources would
also tend to face higher costs.
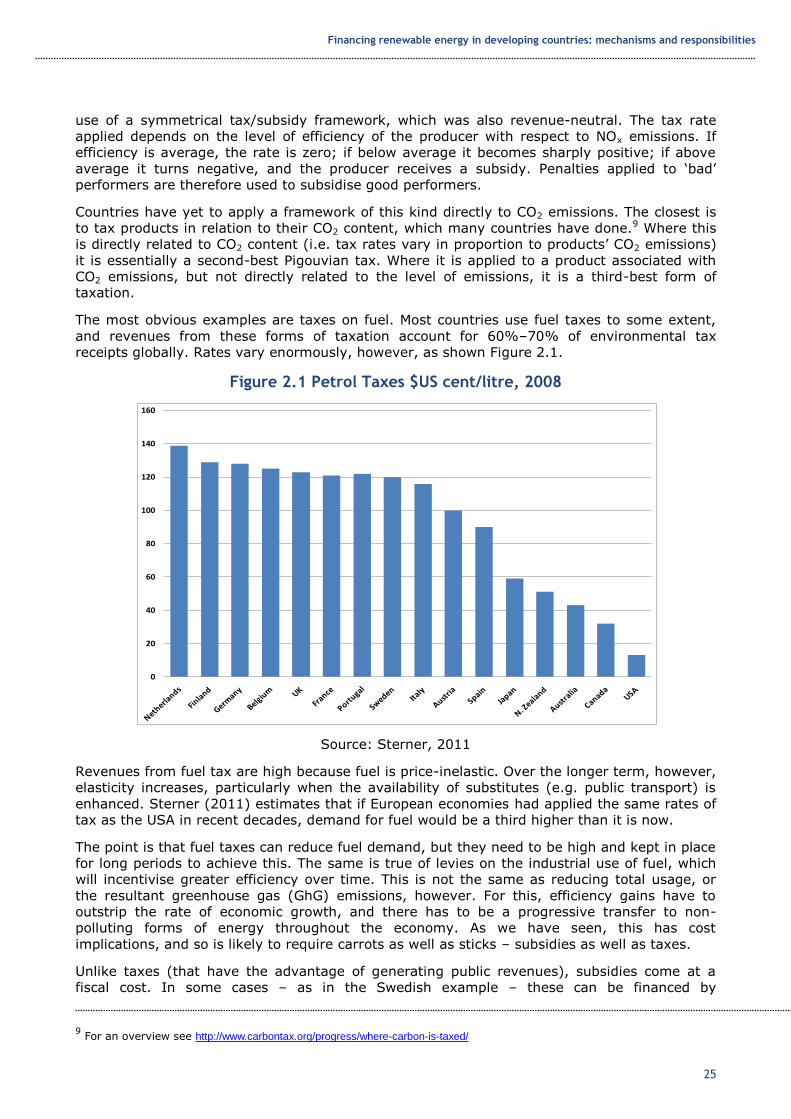
Figure 2.2 Renewable Energy as % of Total Energy Consumption, 2008 vs. 2020
Source: Eurostat
No country, even those with very strong support for environmental sustainability, envisages a
wholesale shift towards renewable energy in the foreseeable future. As shown in Figure 2.2,
just 10% of the EU-27’s energy consumption is currently from renewable sources, and this is
expected to rise to 20% by 2020. Renewables remain expensive in terms of fixed and variable
10 ‘Natural capital is the extension of the economic notion of capital (manufactured means of production) to
environmental goods and services. A functional definition of capital in general is: "a stock that yields a flow of valuable goods or services into the future". Natural capital is thus the stock of natural ecosystems that yields a flow of valuable
ecosystem goods or services into the future. For example, a stock of trees or fish provides a flow of new trees or fish, a flow which can be sustainable indefinitely. Natural capital may also provide services like recycling wastes or water catchment and erosion control. Since the flow of services from ecosystems requires that they function as whole systems, the structure and diversity of the system are important components of natural capital.’ (Costanza and Cleveland, 2008, available at: http://www.eoearth.org/article/Natural_capital)
0.0
10.0
20.0
30.0
40.0
50.0
60.0
EU-2
7
Swe
de
n
Fin
lan
d
Latv
ia
Au
stri
a
Po
rtu
gal
Ro
man
ia
Esto
nia
De
nm
ark
Lith
uan
ia
Slo
ven
ia
Fran
ce
Spai
n
Bu
lgar
ia
Ge
rman
y
Slo
vaki
a
Gre
ece
Po
lan
d
Cze
ch R
ep
ub
lic
Ital
y
Hu
nga
ry
Cyp
rus
Ire
lan
d
Be
lgiu
m
Ne
the
rlan
ds
Un
ite
dK
ingd
om
Luxe
mb
ou
rg
Mal
ta
Renewable Energy as % of Total Energy Consumption, 2008 vs. 2020
2008
2020
Financing renewable energy in developing countries: mechanisms and responsibilities
27
costs. If LICs are to develop renewable energy capacity, the additional costs incurred should
be met from external funds. Below we provide some details on current and potential
mechanisms to fulfil this role.
2.1.2 Lower the costs of renewables
If the aim of Pigouvian taxes on fossil fuels is to encourage a switch towards renewable
energy, providing subsidies for renewable energy performs the same function by altering
relative prices. In theory, a well-calibrated Pigouvian tax on CO2 emissions (second best), or
on fossil fuels (third best), would be sufficient to stimulate non-fossil-fuel forms of energy,
such as renewables (Petrakis et al., 1997). In their absence, however, many countries have
chosen to subsidise the renewable sector directly, with a particular aim of spurring R&D,
innovation and the reduction of unit costs. With learning spillovers, optimal outcomes are
approximated with two forms of subsidy: one on outputs, and the other at the market-entry or
investment point (Bläsi and Requate, 2005).
There are a number of ways to deliver subsidies, all of which reduce the direct or indirect cost.
First, grants may be made to subsidise capital expenditure. Second, loans may be provided at
concessional rates, either directly or as part of a ‘blended finance’ model. Third, the
creditworthiness of the borrower may be enhanced through providing some forms of
guarantee. In relation to the optimal subsidy models suggested by Bläsi and Requate (2005),
these mechanisms lower entry barriers to the sector and make financing more accessible and
affordable.
For example, UNEP’s Rural Energy Enterprise Development (REED)11 seeks to lower entry
barriers by providing seed capital for entrepreneurs in renewable energy in developing
countries. REED focuses on small-scale, innovative projects, which would be unlikely to attract
commercial funding, but have significant potential for scalability. A project with similar aims,
which operates across Asia and Africa, is the Seed Capital Assistance Facility (SCAF).12 Instead
of working directly with entrepreneurs, SCAF assists energy-investment funds to provide seed
financing for clean energy enterprises and projects. UNEP partners with the African and Asian
Development Banks as part of the SCAF project.
2.1.3 Boost the returns from renewables
The favoured mechanism to boost the returns of renewable energy providers has been the
feed-in tariff (FIT). With a FIT, producers of electricity from renewable sources are paid a
guaranteed premium over fossil-fuel producers. As the idea is to spur innovation and create
knowledge spillovers, FITs are generally designed to decline over time as the knowledge
benefits are generated and diffused, and the unit cost of renewable energy becomes
competitive with fossil fuels. Following their introduction in Germany, numerous developed
countries now have FITs in place. They have also become increasingly common in developing
countries, with a number of countries having implemented a FIT, or planning to do so (e.g.
Argentina, Brazil, China, Ghana, Kenya, Malaysia, Nigeria, Pakistan and South Africa).
While the goals of FITs are the same in developed and developing countries, there are
particular features of the latter that require consideration. For example, FITs in developed
countries are generally funded by a premium placed on all energy bills. Following the logic set
out above, in developing countries this could be covered by external finance from donors,
particularly in LICs.
11 Information available at: http://www.uneptie.org/energy/activities/reed/
12 Information available at: http://www.uneptie.org/energy/activities/scaf/
Financing renewable energy in developing countries: mechanisms and responsibilities
28
2.2 Mechanisms to increase the supply of appropriate finance
There are many different forms of finance, and some are more suited than others to financing
renewable energy. Even when the basic economics and returns are attractive enough, the
most important characteristic is that the finance be long term. Investment in renewable energy
can take years, or even decades, to yield good returns. What is needed, therefore, is ‘patient
capital’, which is relatively hard to obtain, given typical short-term horizons of private capital
markets.
An important element here is that large funds that have long-term liabilities (such as sovereign
wealth funds (SWFs) and/or pension funds) should become a more significant source of long-
term investment in renewables.
A relatively high-profile initiative in this area was launched by the Johannesburg Renewable
Energy Coalition (JREC),13 a group of 88 countries formed in the wake of the 2002 World
Summit on Sustainable Development. The JREC established the ‘Patient Capital Initiative’,14
which in turn led to the Global Energy Efficiency and Renewable Energy Fund (GEEREF).15
GEEREF is a fund structure, which provides capital to renewable energy funds operating in
developing countries, which:
…aims to accelerate the transfer, development, use and enforcement of environmentally
sound technologies for the world's poorer regions, helping to bring secure, clean and
affordable energy to local people. (GEEREF website)16
With founding investment from the EU, Germany and Norway, GEEREF has attracted half of its
target funding of US$200 million, and is particularly focused on attracting institutional
investors.
In its investments: ‘Priority is given to investment in countries with policies and regulatory
frameworks on energy efficiency and renewable energy’. Once again, this raises the question
of who should be bearing these costs. We have argued that the cost of feed-in tariffs in LICs
should be borne by the donor community rather than the countries themselves. It is not clear
that GEEREF adopts this approach, but may instead be incentivising countries to put in place
mechanisms that impose an economic cost.
2.2.1 Green bonds
A mechanism that has attracted increasing interest is Green Bonds. In terms of demand,
Green Bonds are particularly appealing to Socially Responsible Investors (SRIs) that give
priority to mitigating climate change. As long as the instrument can deliver a market-level
return, mainstream institutional investors and SWFs are also now considering similar types of
investment.
In addition to its traditional financing on the international capital markets, the EIB developed
an innovative instrument to raise funds for green investment, which it finances itself. This
helps develop a new Green Bond instrument (and give it liquidity), which could then be issued
by other entities, either public or private. Since 2007, the EIB has issued € 1.4 billion
(including € 0.5 billion in 2010 – Source: Interview material and EIB Annual Reports) of
‘Climate Awareness Bonds’, which are ring-fenced finance raised for the EIB's future lending to
projects supporting climate action in the fields of renewable energy and energy efficiency, both
within the EU and in developing countries.
The EIB has issued Climate Awareness Bonds through ten issues in six currencies, thus acting
as a market maker for such instruments. The bonds are linked to a newly constructed index of
13 Information available at: http://ec.europa.eu/environment/jrec/about_en.htm
14 Information available at: http://ec.europa.eu/environment/jrec/pdf/pci_summary_brochure_final.pdf
15 Information available at: http://www.geeref.com/pages/home
16 Information available at: http://geeref.com/posts/display/1

Financing renewable energy in developing countries: mechanisms and responsibilities
29
corporate responsibility in relation to the environment, thus giving confidence to SRIs. The
issuance of these bonds sets a valuable precedent for broader use of this and other similar
instruments, particularly by international, regional and national public development banks,
which would use the funds to finance private green investment. In the future private investors
could themselves directly issue the instruments, but this is unlikely to be feasible for some
time.
A key part of the attractiveness of Green Bonds is their backing by credible institutions, which
are themselves backed by sovereign states. Risks are thus effectively underwritten, enabling
the bonds to be packaged as safe instruments for institutional investors. Were they to be
issued by private investors, the bonds’ ratings would obviously be lower, reflecting the fact
that risks were no longer borne by a publicly backed body. The market would need to be more
liquid, and its uncertainty lower, before private Green Bonds would be attractive to institutional
investors.
Following the EIB’s lead, the World Bank also began issuing Green Bonds in 2008. Since then,
US$2 billion has been raised through the sale of AAA-rated bonds in 15 different currencies to
fixed-income investors,17 with the proceeds used for climate-change mitigation or adaptation
projects in developing countries. Specifically, the Bank looks to invest in projects in the
following areas:18
Solar and wind installations
Funding for new technologies that permit significant reductions in GhG emissions
Rehabilitation of power plants and transmission facilities to reduce GhG emissions
Greater efficiency in transport, including fuel switching and mass transport
Waste management (methane emissions) and construction of energy-efficient
buildings
Carbon reduction through reforestation and avoided deforestation
Coupons are compatible with their AAA status, ranging from 0.875% for 125 million Japanese
Yen in 2010 to 10% for 50 million Turkish Lira denominated bond, again in 2010. By attracting
institutional, fixed-income investors, Green Bonds have demonstrated significant potential to
raise large quantities of relatively long-term finance. Despite their potential, however, they
remain a niche product, as the rather small list of World Bank investors illustrates.
Supply is likely to elicit demand, particularly where bonds are backed by credible international
institutions. This requires them to shoulder some possible risk, but their willingness (or not) to
do so will send a clear signal to investors about the long-term viability of the markets in
question. It is useful to remember that DFIs helped develop local currency bond markets in
emerging and developing countries, a valuable precedent. Without such a credible signal,
investors may not provide capital on the scale needed to develop the infrastructure for
renewable energy. If confidence can be created, however, global capital markets could become
a valuable source of investment in renewable energy in developing countries.
By issuing such bonds, international institutions, or donor governments, can play a very
valuable market-making role, especially for LICs. In less developed countries (LICs and Least
Developed Countries (LDCs)), risks may be considerably higher and returns may be more
uncertain. The impact, in terms of reduced global carbon emissions, may be higher for LICs,
for example, than for developed economies, since the cost of investing in renewables is often
lower in poorer countries (interview material).
17 To date, the US$ investors are: California State Treasurer’s Office; CALSTERS; MMA Praxis Mutual Funds; New York
Common Retirement Fund; Sarasin; SEB Ethos rantefund; SEB Trygg Liv; Second Swedish National Pension Fund (AP2); Third Swedish National Pension Fund (AP3); Trillium Asset Management; UN Joint Staff Pension Fund. Investors in other currencies are: Adlerbert Research Foundation; AP2 – Second Swedish National Pension Fund; AP3 – Third Swedish National Pension Fund; LF Liv; MISTRA; Nikko Asset Management; Skandia Liv 18
Information available at: http://treasury.worldbank.org/cmd/pdf/WorldBank_GreenBondFactsheet.pdf
Financing renewable energy in developing countries: mechanisms and responsibilities
30
Issuing Green Bonds to fund renewables investment in developed countries is also valuable for
developing countries, as deepening and making such a market more liquid would facilitate
issuance for investment. An interesting question is whether such issuance could be extended
also to Regional Development Banks, like the African Development Bank (AfDB).
2.2.2 Other types of bond
The most straightforward and possibly cheapest option would be to raise finance using straight
government (or institutional) bonds, and earmark the revenues for renewable energy projects
in developing countries as bilateral or multilateral concessional or non-concessional lending.
This already happens to a certain extent, but is limited by fiscal constraints and the desire to
tap alternative – climate-aware – investors.
An intermediate option would be an indexed bond where the coupon is linked to an indicator
such as the price of carbon or levels of emissions. The crucial point is that yields are inversely
linked to progress on mitigating climate change, which offers investors a hedge against
inaction. As this paper has highlighted, a major obstacle to achieving a change in investment is
uncertainty surrounding future climate regimes. Indexed bonds that pay a higher return as
carbon emissions fail to fall (or carbon prices remain too low) provide a hedge for investors,
making it easier for them to invest in renewable energy projects, or other investments
dependent upon progress on mitigating climate change.19 The proposal has been largely
associated with climate-change mitigation in developed countries, but is potentially applicable
to the developing world. In line with the framework sketched out above, it would require bonds
to be issued in one jurisdiction (the UK, for example), with coupon payments linked to the
mitigation of emissions in a developing country. This would provide investors in renewable
energy in those countries with a hedge against future policy inaction that put their investments
at risk, but the risks would be borne by the donor country where the bond was issued.
Another potential structure is energy efficiency bonds. Developed in the USA as Property
Assessed Clean Energy (PACE)20 bonds, the instrument enables residential and commercial
property owners to borrow money from municipal bodies to make energy-efficiency
improvements to their properties. The financing is provided by the issuance of bonds, where
payments are met by the borrowers using the revenues saved through efficiency gains.
Alternatively, energy suppliers may issue the bonds and finance household and commercial
property owners that undertake such investments. Public utility providers (still common in
many developing countries) may be asked by governments to do so, but incentives would be
necessary for private providers to take on such a role, for example through strict energy-
efficiency targets set by regulatory authorities.
Energy efficiency bonds are thus an example of a win-win instrument. If applied to developing
countries, there would be no need for financial transfers from the donor community as the
bonds are self-financing and the changes they enable (i.e. more efficient use of energy) are
clearly beneficial to the countries concerned. However, international bond financing backed by
multilateral development banks may be necessary for countries that lack adequately developed
domestic bond markets.
Importantly, the potential of such bonds in developing countries is greater than in the
developed world because of greater inefficiencies in energy use, as well as lower cost per unit
of carbon saving. To leverage finance, however, energy efficiency bonds need to be credibly
secured. In the US version, they are backed by the property in question – with seniority over
mortgage payments. Adapting the mechanism to developing countries would require a similar
level or surety, which could be difficult, though not impossible, to achieve. Institutions like the
World Bank or the EIB could help to establish them in developing countries, where this is
desirable. If the utility provider gives the financing to the users, however, the problem largely
disappears, and the only condition necessary may be that the household or firm receiving the
19 The proposal has been supported by inter alia, the Aldersgate Group (http://www.aldersgategroup.org.uk/) and the
London Accord (http://www.longfinance.net/programmes/london-accord.html). 20
Information available at: http://pacenow.org
Financing renewable energy in developing countries: mechanisms and responsibilities
31
financing must continue to use the utility company that provided it – in fact, in many cases,
there may be no alternative provider anyway.
2.2.3 Concessional finance
Investment in renewable energy in developing countries requires long-term, patient capital.
Unfortunately, however, this is precisely the type of investment that is most difficult to attract
to developing countries. Even where the economics are more straightforward than in the
renewable sector, international investors often respond to perceived riskiness of investment in
LICs by (a) requiring a high rate of return and (b) only making relatively short-term finance
available.
This is a problem in the infrastructure sector generally. In Africa, the World Bank estimates
that an additional US$48 billion per year would be needed to fill the infrastructure-spending
gap (Foster and Briceño-Garmendia, 2010), but in 2008 the maximum private investment that
has been attracted was a little over US$12 billion. If mature infrastructure sectors cannot raise
the finance needed, it is unsurprising that infrastructure for renewable energy suffers similar
problems.
A part of the solution to both general and renewable energy infrastructure is the involvement
of DFIs, including Regional Development Banks.21 In large part because of their backing by
sovereign states, DFIs are able to provide finance at maturities that the private sector cannot.
In a recent systematic review on DFI ‘additionality’, Spratt and Ryan-Collins (2012: 2)
conclude that:
DFIs are able to: a) supply long-term finance, which is often essential for infrastructure
but frequently unavailable in LICs; b) mitigate project risk, particularly in the early
stages, thus leveraging additional finance by improving the attractiveness of deals
(again, this is often crucial in LICs); and c) provide and leverage finance counter-
cyclically, either lending when private investors will not, or retaining positions when the
private sector would pull out.
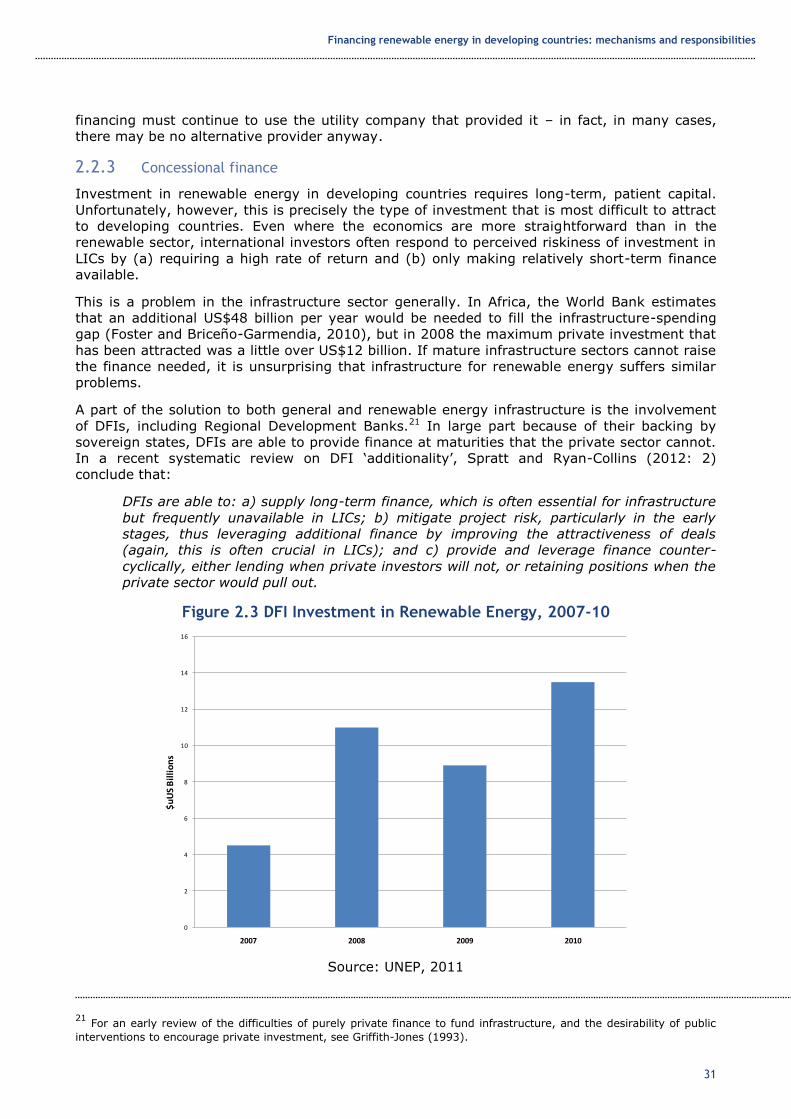
Figure 2.3 DFI Investment in Renewable Energy, 2007-10
Source: UNEP, 2011
21 For an early review of the difficulties of purely private finance to fund infrastructure, and the desirability of public
interventions to encourage private investment, see Griffith-Jones (1993).
0
2
4
6
8
10
12
14
16
2007 2008 2009 2010
$u
US
Bil
lio
ns
DFI Investment in Renewable Energy, 2007-10
Financing renewable energy in developing countries: mechanisms and responsibilities
32
Figure 2.3 illustrates that this is also the case in the renewable energy infrastructure, where
DFI investments grew significantly between 2007 and 2010. As well as the provision of finance
of longer maturities, DFIs are more able to act counter-cyclically, as evidenced by the sharp
increase in their activities in renewable energy, as well as more generally, in the wake of the
2008 global financial crisis (see, for example, Ocampo, Griffith-Jones et al., 2010, for the
latter).
As well as the favourable access to finance DFIs bring,22 most of them can provide a ‘political
umbrella’ whereby investors have confidence that they will be protected from default risk. The
logic is straightforward: investors assume that borrowers are far less likely to default if a DFI
from a donor country, or an international institution, is involved, as the borrower will not want
to jeopardise their broader relationship. The logic is also correct: the IFC, for example, has
never been part of a debt-rescheduling process and payments have never been permanently
affected in a general default (Moody’s, 2007).
As well as default risk, DFI participation provides assurances that governments will honour the
terms of contracts. While this is important in the infrastructure sector generally, where stable
and supportive regulatory structures are key, it is even more so in the renewable energy
sector, where the maintenance of price mechanisms such as FITs may be essential to ensure
the economic viability of a project.
In this regard, one of the most straightforward and effective ways to catalyse investment in
renewable energy in developing countries would be to increase the resources available to DFIs
for this purpose.23
2.2.4 Cornerstone and Challenge Funds
A number of innovative partnership models with DFIs and investors have been proposed. As
with Green Bonds, the aim is to attract institutional investors into the renewable energy sector.
Recognising that institutional investors operate at a scale far above that of individual projects,
and require a minimum level of liquidity to invest, fund-of-fund structures may be appropriate
(Vivid Economics, 2009).
Proposals also recognise the need to get the economics right, as discussed above. In this
regard, a range of Public Finance Mechanisms (PFMs) could be made available to the fund-of-
funds, where DFIs and institutional investors would co-invest.
Two options have been suggested:
a. Cornerstone funds
b. Challenge funds
In both cases the fund-of-funds would have access to PFMs. In the case of Cornerstone Funds,
these would be negotiated between the DFI and investors. For the Challenge Funds,
institutional investors would compete for access to the PFMs. These two options are illustrated
in Figure 2.4.
22 For example, by acting as the ‘lender of record’ in its B-Loan programme, the IFC is able to provide finance to its
co-investors on the same favourable terms that it itself enjoys. 23
In order to fulfil their potential, however, alterations to the financing structure and mandates of some DFIs may be
needed. See Spratt and Ryan-Collins (forthcoming) for details.
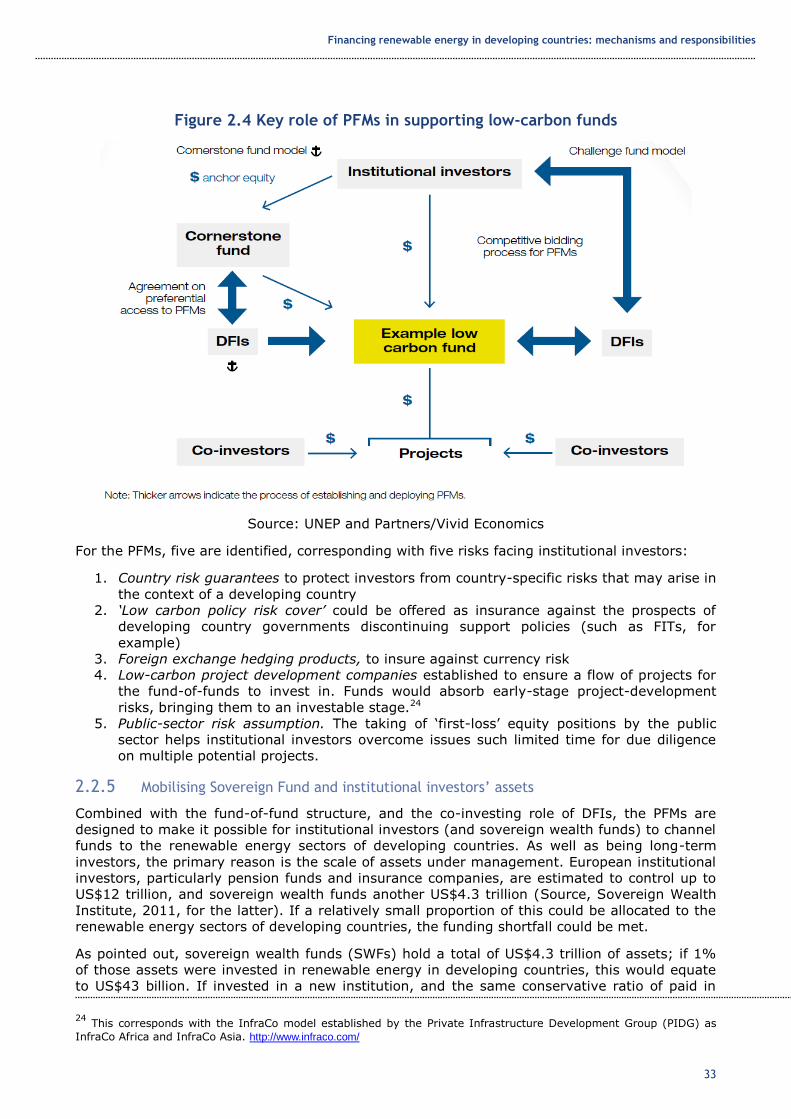
Financing renewable energy in developing countries: mechanisms and responsibilities
33
Figure 2.4 Key role of PFMs in supporting low-carbon funds
Source: UNEP and Partners/Vivid Economics
For the PFMs, five are identified, corresponding with five risks facing institutional investors:
1. Country risk guarantees to protect investors from country-specific risks that may arise in
the context of a developing country
2. ‘Low carbon policy risk cover’ could be offered as insurance against the prospects of
developing country governments discontinuing support policies (such as FITs, for
example)
3. Foreign exchange hedging products, to insure against currency risk
4. Low-carbon project development companies established to ensure a flow of projects for
the fund-of-funds to invest in. Funds would absorb early-stage project-development
risks, bringing them to an investable stage.24
5. Public-sector risk assumption. The taking of ‘first-loss’ equity positions by the public
sector helps institutional investors overcome issues such limited time for due diligence
on multiple potential projects.
2.2.5 Mobilising Sovereign Fund and institutional investors’ assets
Combined with the fund-of-fund structure, and the co-investing role of DFIs, the PFMs are
designed to make it possible for institutional investors (and sovereign wealth funds) to channel
funds to the renewable energy sectors of developing countries. As well as being long-term
investors, the primary reason is the scale of assets under management. European institutional
investors, particularly pension funds and insurance companies, are estimated to control up to
US$12 trillion, and sovereign wealth funds another US$4.3 trillion (Source, Sovereign Wealth
Institute, 2011, for the latter). If a relatively small proportion of this could be allocated to the
renewable energy sectors of developing countries, the funding shortfall could be met.
As pointed out, sovereign wealth funds (SWFs) hold a total of US$4.3 trillion of assets; if 1%
of those assets were invested in renewable energy in developing countries, this would equate
to US$43 billion. If invested in a new institution, and the same conservative ratio of paid in
24 This corresponds with the InfraCo model established by the Private Infrastructure Development Group (PIDG) as
InfraCo Africa and InfraCo Asia. http://www.infraco.com/

Financing renewable energy in developing countries: mechanisms and responsibilities
34
capital to annual loans was applied as that of the Latin American Development Bank (CAF,
based on its legal name, Corporación Andina de Fomento), US$102 billion could be lent
annually.25
Furthermore, if the same principle and mechanism were applied to investing a further 1% of
European institutional investors’ assets (reaching US$12 trillion dollars) in the paid-in capital of
Development Banks, whether the World Bank or Regional Development Banks, then the
potential for lending for renewables could go up to around US$400 billion annually. This could
significantly increase the funding available for green investment.
While this is attractive in principle, it clearly is not going to happen without complementary
measures. For example, SWFs and institutional investors require commercial returns on their
investments. Given the issues of commercial viability discussed above, this suggests the need
for a ‘blended finance’ approach, perhaps in conjunction with DFIs.26 Under such a mechanism,
grants could be blended with commercial lending, generating a market-level return and
allowing the impact of grants to be leveraged.
A related option could be to supplement or replace funds from grants to subsidise lending by
DFIs by funding from innovative sources of finance; a potential carbon tax may be the most
appropriate, but a financial transaction tax would also be a possibility (see also Noman, 2011).
2.3 Mechanisms to reduce uncertainty
This paper has discussed a number of the PFMs that are designed to reduce uncertainty.
Three main types of mechanisms are used. First, as described above, institutions can be
employed to absorb initial project risk, taking projects to the stage where they may be
attractive to international investors. Second, guarantees may be offered in a variety of areas.
Prices, for example, may be fixed within a necessary band to guarantee profitability, or loans
may be guaranteed by a public body. In the latter case, the resulting credit enhancement
eliminates uncertainty over repayment, enabling the borrower to obtain finance on better
terms. Third, insurance may be provided to protect investors from a range of potential events
that could derail a project. This could be used to offset uncertainty over the maintenance of
particular policies, or it could be related to price.
In their different ways, these mechanisms reduce the level of risk, making projects more
affordable and their economics more viable. Renewable energy projects are highly dependent
upon a small number of factors which are not economic variables, however, but driven by
policy – the maintenance of a FIT, or the implementation of a carbon tax, for example.
However, these factors are inherently uncertain, particularly given the potential economic
costs involved. Importantly, in virtually all cases, such mechanisms are considered temporary.
The assumption is that, in time, they will no longer be necessary as global and national
conditions evolve to become increasingly supportive of renewable energy.
To return to the economics of the sector, the hope and expectation is that this will steadily
improve until renewable energy is genuinely competitive with fossil fuels, at which point
supporting instruments will no longer be required. There are two routes to this outcome. First,
the price of fossil fuels increases, due to rising demand and dwindling supply, and/or increased
Pigouvian taxes. Second, the unit costs of renewable energy fall, due to the diffusion of
technological advances and the exploitation of economies of scale. Neither of the two is a
certain outcome, however.
SEFI (2008) suggests that PFMs of the kind being reviewed here can leverage private finance
with ratios of between 3 and 15:1. As a transitional means of developing a competitive
industry, this is a very sensible investment. If the industry does not become competitive,
however, it would represent a continuing drain on resources. Another way of looking at this
25 For a more detailed rationale for these calculations, see Griffith-Jones (2011).
26 Regional Development Banks would be particularly appropriate for regional schemes of renewable energy.

Financing renewable energy in developing countries: mechanisms and responsibilities
35
leverage ratio is that public funds are providing a return on the private finance invested. Using
these ratios, this has been between 6% and 30%. As long as public money is available to
provide this function, it will always be possible to elicit private funds, but this is clearly not
sustainable in fiscal terms over the longer term. Furthermore, the global financial crisis has
taught us that excessive leverage can be dangerous, if not properly monitored.
2.3.1 Guarantees linked to taxes
Given uncertainties surrounding the long-term price of oil and gas, as well as high volatility,
one interesting potential policy tool could be to introduce a variable tax on the price of oil, that
would increase as the price fell below a given level, and decrease as the price of oil increased
beyond this level. As a result, the market price of oil would be stabilised and the profitability of
investment in renewables made less uncertain. This is distinct from a Pigouvian tax on oil,
which would not provide a floor for the price.
This tax/guarantee would also generate revenue for governments, which could be used to
finance other investment in preventing or mitigating climate change; alternatively, it could be
used to reduce government debt and deficits. Guarantees of a floor on the price of oil and gas
may be a valuable mechanism for enhancing flows to low-carbon investment, particularly in
developing countries that are going through or emerging from a credit-rationing (Stiglitz and
Weiss, 1981) process.
Another way to protect the relative price of renewables is through the creation of a floor on the
price of carbon. As with oil, however, to be feasible this would need to be achieved through the
use of variable taxes. Renewable energy facilities – as well as other emission-mitigating
mechanisms – may be designed with a carbon market in mind, particularly the ability to create
and sell carbon credits into these markets. The project economics, however, may rest upon a
minimum price being received for these credits. Implicit guarantees, achieved through the use
of variable taxes, are one way of doing this.
Alternatively, a put option could be provided, which is triggered once the price falls below a
certain level. The public sector provides project investors with the put contract, guaranteeing
to buy the carbon credits at a specified price on a given date, thus eliminating price
uncertainty. Unlike the variable tax approach, however, the open-ended commitments that
providing such a put option would imply make this unrealistic as a real-world policy tool.
While not using an option mechanism, the UK became the first country to announce a floor
price on carbon in the 2011 budget.27 Starting in 2013, the price will steadily increase, with the
aim being to provide certainty for investors and producers. As will be discussed in the next
section, this mechanism is designed to do the job envisaged for the global carbon market. The
European Trading System (ETS) is the only component of a global system that is functioning,
but the UK move reflects concern that the prices generated are not high enough to produce
sufficient incentives.
A different option is to design a liquidity facility (which could be part of a broader stabilisation
fund) to help overcome the inability to obtain sufficient finance to support ongoing investment,
if the investment in the renewable becomes unprofitable due to a fall in the price of oil or gas.
Such a facility could provide the necessary financing on a temporary basis. Furthermore,
where the investment in a project in renewables was already completed, but the price of oil or
gas fell significantly, then a public liquidity facility could provide temporary credit, which could
help keep the project functioning. Precedents already exist for this latter mechanism.
One of the main reasons why the profitability of low-carbon investment is uncertain is lack of
knowledge over the future trajectory of oil or gas prices. Liquidity facilities could be used to
deal with at least part of that risk. The conceptual operationalisation of a liquidity facility is
relatively simple. The parties involved first agree upon a ‘floor value’ as the project’s minimum
cash-generation that allows payment of scheduled debt service. When establishing a floor
27 Information available at: http://www.hm-treasury.gov.uk/consult_carbon_price_support.htm
Financing renewable energy in developing countries: mechanisms and responsibilities
36
value, it is important that there is sufficient margin for deviations in the operational
performance from the initially projected levels. In the event of a major fall in the price of oil or
gas, which results in the inability of the project to repay its debts – where the cash-generation
becomes insufficient to reach the floor value – the liquidity facility is temporarily drawn upon.
A loan is made to the project’s senior lenders to be paid back when the project’s cash flow
allows. It is presumed this will happen when oil or gas prices rise. Price, availability and size of
a liquidity facility would depend on estimates based on the historical fluctuations of the real
price of oil.
Only one project to date has implemented this policy mechanism, which is located in Brazil and
focused on infrastructure: AES Tiete. In the context of infrastructure financing, however, there
are precedents for similar liquidity facilities in a somewhat different context, through currency
devaluation risk. Some precedent exists in the IFC Contingent Partial Credit Guarantees, which
are liquidity facilities for US dollars and local currency financing. The trigger for its use is a
major devaluation in the project’s host country. This guarantee is usually provided for two
years, which the IFC estimates as sufficient for the project to recover from an economic
downturn and be able to raise tariffs or prices sufficiently. In the case of a liquidity facility
linked to oil or gas prices, the period may need to be somewhat longer, in view of the cycle of
oil and gas prices.
Relatively long tenors make liquidity facilities particularly suitable for renewable financing. At
the same time the long useful life of assets in such projects is a solid basis for debt
repayments, allowing for such a liquidity facility to be viable. The liquidity facility has a
counter-cyclical element, as the project continues without a problem in the face of external
shocks, such as devaluation for the existing IFC facility, which could be applied to a drop in the
price of oil or gas for renewable energy projects.
The current crisis also opens up potential opportunities for modifying private lending and
investing practices, especially (but not only) where governments are playing some role as
shareholders. Regarding banks, it could be mandated by their regulators that a minimum (e.g.
5%) of lending must be allocated towards low-carbon technology, half of which should be
carried out in developing countries. As pointed out, the implementation could be facilitated for
commercial banks, where governments are important shareholders (including those which
were bailed out during the 2008 crisis).
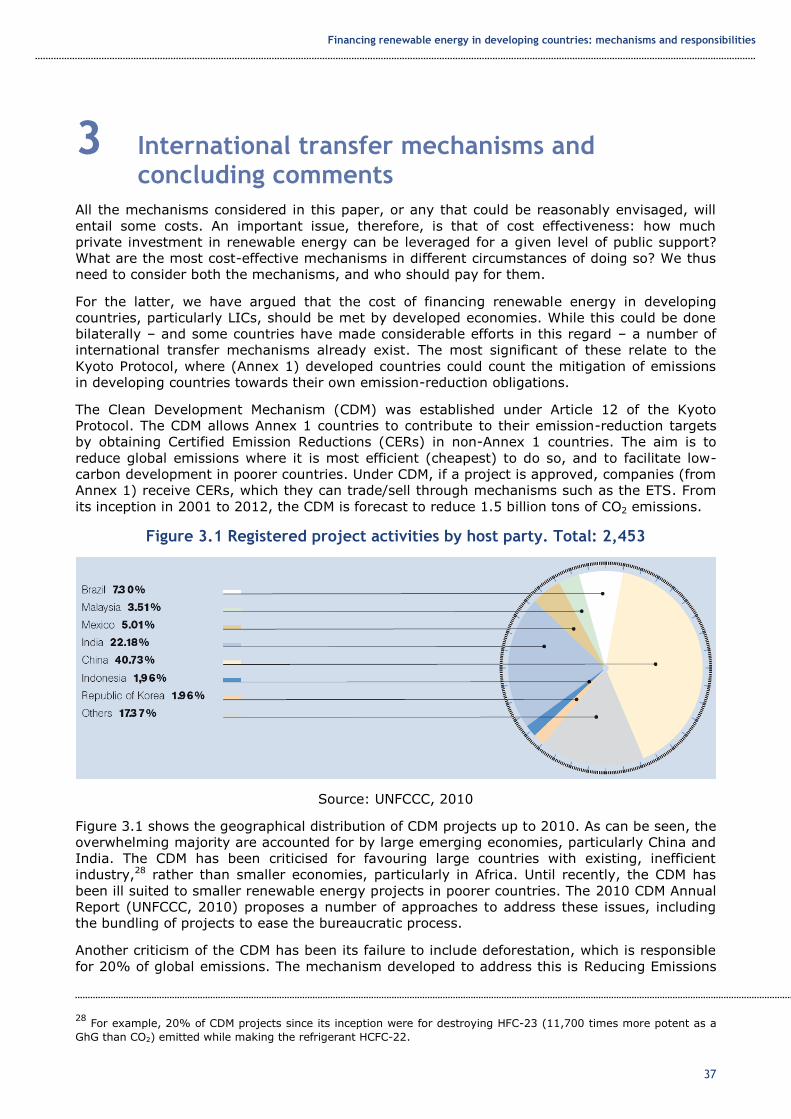
Financing renewable energy in developing countries: mechanisms and responsibilities
37
3 International transfer mechanisms and concluding comments
All the mechanisms considered in this paper, or any that could be reasonably envisaged, will
entail some costs. An important issue, therefore, is that of cost effectiveness: how much
private investment in renewable energy can be leveraged for a given level of public support?
What are the most cost-effective mechanisms in different circumstances of doing so? We thus
need to consider both the mechanisms, and who should pay for them.
For the latter, we have argued that the cost of financing renewable energy in developing
countries, particularly LICs, should be met by developed economies. While this could be done
bilaterally – and some countries have made considerable efforts in this regard – a number of
international transfer mechanisms already exist. The most significant of these relate to the
Kyoto Protocol, where (Annex 1) developed countries could count the mitigation of emissions
in developing countries towards their own emission-reduction obligations.
The Clean Development Mechanism (CDM) was established under Article 12 of the Kyoto
Protocol. The CDM allows Annex 1 countries to contribute to their emission-reduction targets
by obtaining Certified Emission Reductions (CERs) in non-Annex 1 countries. The aim is to
reduce global emissions where it is most efficient (cheapest) to do so, and to facilitate low-
carbon development in poorer countries. Under CDM, if a project is approved, companies (from
Annex 1) receive CERs, which they can trade/sell through mechanisms such as the ETS. From
its inception in 2001 to 2012, the CDM is forecast to reduce 1.5 billion tons of CO2 emissions.
Figure 3.1 Registered project activities by host party. Total: 2,453
Source: UNFCCC, 2010
Figure 3.1 shows the geographical distribution of CDM projects up to 2010. As can be seen, the
overwhelming majority are accounted for by large emerging economies, particularly China and
India. The CDM has been criticised for favouring large countries with existing, inefficient
industry,28 rather than smaller economies, particularly in Africa. Until recently, the CDM has
been ill suited to smaller renewable energy projects in poorer countries. The 2010 CDM Annual
Report (UNFCCC, 2010) proposes a number of approaches to address these issues, including
the bundling of projects to ease the bureaucratic process.
Another criticism of the CDM has been its failure to include deforestation, which is responsible
for 20% of global emissions. The mechanism developed to address this is Reducing Emissions
28 For example, 20% of CDM projects since its inception were for destroying HFC-23 (11,700 times more potent as a
GhG than CO2) emitted while making the refrigerant HCFC-22.
Financing renewable energy in developing countries: mechanisms and responsibilities
38
from Deforestation and Forest Degradation (REDD).29 REDD was designed to ascribe a value to
the carbon content of forests and their role as carbon sinks, whereby payments would be made
to developing countries to preserve their stock of forests and maintain ecosystem services.
REDD+ extended the framework to include the possibility of payments for ‘sustainable forest
management’, forest conservation and afforestation (i.e. increasing forest stocks). One of the
few successes to emerge from COP15 at Copenhagen was the commitment of US$4.5 billion of
‘fast start’ funding to REDD+ for the period 2010–12. It is estimated that up to US$30 billion
per year may ultimately be transferred to developing countries through the REDD+ system.
It remains to be seen how REDD+ will function in practice, but – as with the CDM – the
growing supply of carbon credits needs demand. It was expected that the global carbon
market would supply this demand. Developed – and perhaps emerging – economies would sign
up for binding emission-reduction targets, and a global carbon market would be created for
trading carbon credits (CERs). A binding deal to steadily reduce carbon emissions to
sustainable levels would ensure a high demand for carbon credits, supporting the price of
carbon. Furthermore, as the global carbon ‘cap’ becomes progressively tighter, the price of
carbon would rise accordingly. In such as system, carbon credits from the CDM or REDD+
mechanisms would be increasingly valuable, providing strong incentives for investors to
participate and ensuring a steady flow of financing to developing countries.
Unfortunately, however, no global deal has been reached and the global carbon market does
not exist. It remains to be seen if this situation will change, but for the present it is hard to see
how sufficient funds will be generated to fund a major shift to renewable energy in developing
countries, regardless of the mechanisms. In the absence of a carbon market to provide the
correct incentives, this requires someone to bear the costs. The IEA (2009) estimates that the
energy switch needed will cost US$10.5 trillion, half of which is needed in developing
countries. Copenhagen saw commitments to transfer US$100 million per year to developing
countries for climate-change mitigation and adaptation by 2020. As yet, the source of these
funds is unspecified, though recommendations were produced in the Report of the Secretary-
General’s High-Level Advisory Group on Climate Change Financing (2010).
The Report proposed that:
Around US$30 billion annually could be allocated towards the $100 million target
from taxes on the auctions of carbon allowances, and/or carbon taxes in developed
countries.
Up to US$10 billion annually could be generated through redirecting fossil-fuel
subsidies, or innovative instruments such as Financial Transaction Taxes (FTT).
A further US$10 billion could be raised from international shipping and aviation.
Around $11 billion of additional funds could be leveraged via DFIs.
While members of the Advisory Group disagreed on whether private flows should count
towards the US$100 billion target, it was suggested that a carbon price of US$20–US$25 per
ton could generate between US$30 and US$50 billion in increased carbon market flows, though
methodologies to make accurate estimates of these flows remain unproven.
Even if private finance does count towards the target figure, however, it is still dependent on a
sufficiently high carbon price, which requires a minimum level of demand for carbon credits.
Unless the prospects of an equitable global carbon market can be revised, it is hard to see
where this demand will come from.
In this context, and given that the economics of renewable energy are not yet competitive with
fossil fuels, there is little prospect that developing countries themselves will choose to hamper
their own economic development with higher cost energy. In such conditions, the global switch
to renewable energy, which everyone agrees is essential to avoid ‘dangerous’ and ‘runaway’
climate change, will not happen at a sufficient scale.
29 Information available at: http://www.un-redd.org/

Financing renewable energy in developing countries: mechanisms and responsibilities
39
The alternative way of correcting the issue of economic profitability would be to greatly expand
the use of grants in ‘blended finance’ models as suggested above. If correctly structured, such
mechanisms could generate a sufficiently high rate of return for long-term investors, both
private and public, seeking commercial returns, potentially unlocking the trillions of assets
controlled by institutional investors and sovereign wealth funds, as discussed above.
This would need to be managed carefully to avoid creating perverse incentives. Furthermore,
the scale of investment needed suggests that grant financing would have to be significantly
expanded to have the required impact. The potential prize is great, however. It is perhaps only
institutional investors and SWFs that have resources on the scale needed. Unlocking a
proportion of these resources through the strategic use of public resources, using some of the
mechanisms proposed in this paper, has the potential to make a real difference.
We cannot just expect this to happen. Exhorting private investors to sharply increase their
investments in (relatively) unprofitable activities that are also very risky is clearly not going to
work. Somehow the attractiveness of these investments needs to be increased. This can be
done by changing the underlying economics through functioning carbon markets, or through
creating ‘synthetic’ returns in ‘blended finance’ models. Where there are costs associated with
creating commercial incentives, we have argued here that low-income countries in particular
should not be expected to bear them.
Financing renewable energy in developing countries: mechanisms and responsibilities
40
References
Bläsi, A., and Requate, T. (2005) ‘Learning-by-Doing with Spillovers in Competitive Industries, Free Entry, and Regulatory Policy’, CAU Economics Working Paper 2005-09, Christian-Albrechts-Universität Kiel, Kiel.
Costanza, R. and Cleveland, C. (2008) ‘Natural capital’, in Encyclopedia of Earth, Eds. Cutler J. Cleveland Washington, D.C.: Environmental Information Coalition, National Council for Science and the Environment.
Foster, V. and Briceño-Garmendia, C. (eds) (2010) Africa’s infrastructure: A time for Transformation. Washington, DC, Agence Française de Développement and the World Bank.
Griffith-Jones, S. (1993) 'Globalisation of financial markets: new challenges for regulation' in R. Cooper et al., Managing the International Financial System, The Hague: FONDAD.
Griffith-Jones, S., Tyson, J. (2011) 'The European Investment Bank: Lessons for Developing Countries', paper prepared for UNU-WIDER.
Hansen, J., Mki. Sato, P. Kharecha, D. Beerling, R. Berner, V. Masson-Delmotte, M. Pagani, M. Raymo, D.L. Royer, and J.C. Zachos (2008) ‘Target atmospheric CO2: Where should humanity aim?’, Open Atmos. Sci. J., 2, 217-231, doi:10.2174/1874282300802010217.
High-level Advisory Group on Climate Change Financing (2010) Report of the Secretary-General’s High-level Advisory Group on Climate Change Financing, 5 November 2010.
IEA (2009). World Energy Outlook 2009. Paris: International Energy Agency.
IPCC (2011) IPCC Special Report on Renewable Energy Sources and Climate Change Mitigation. Prepared by Working Group III of the Intergovernmental Panel on Climate Change [O. Edenhofer, R. Pichs-Madruga, Y. Sokona, K. Seyboth, P. Matschoss, S. Kadner, T. Zwickel, P. Eickemeier, G. Hansen, S. Schlömer, C. von Stechow (eds)]. Cambridge University Press, Cambridge, United Kingdom and New York, NY, USA, 1075 pp.
Noman, A. (2011) 'Innovative Financing for Infrastructure in Low Income Countries. How Might the G20 Help?', Occasional Paper 1, African Center for Economic Transformation, July 2011.
Ocampo, J.A., Griffith-Jones, S. and Tyson J. et al. (2010) ‘The Great Recession and the Developing World’ in J.A. Alonso (ed) Development Cooperation after the Financial Crisis, Initiative for Policy Dialogue, Columbia University.
Parhelion Underwriting Ltd and Standard & Poor’s (2010) Can Capital Markets Bridge the Climate Change Financing Gap?. Available at: http://www.environmental-finance.com/download.php?files/pdf/4cc006c89e09a/Parhelion_Climate_Financing_Risk_Mapping_Report_2010.pdf.
Petrakis, E., Rasmusen, E. and Santanu, R. (1997) ‘The Learning Curve in a Competitive Industry’, The RAND Journal of Economics, Vol.28, No.2, pp. 248-268.
Pigou, A. C. (1932) The Economics of Welfare, 4th edition, London: Macmillan and Co.
Spratt, S. and Ryan-Collins, L. (2012) 'Development Finance Institutions and Infrastructure: A Systematic Review of
Evidence for Development Additionality' , Private Infrastructure Development Group (PIDG). Available at: http://www.ids.ac.uk/idspublication/development-finance-institutions-and-infrastructure-a-systematic-review-of-evidence-for-development-additionality
Stern, N. (2006) Review on the Economics of Climate Change, H.M. Treasury, UK, October2006. Available at: http://webarchive.nationalarchives.gov.uk/+/http:/www.hm-treasury.gov.uk/sternreview_index.htm.
Sterner, T. (2003) Policy Instruments for Environmental and Natural Resource Management. RFF Press, Washington D.C.
Sterner, T. (ed.) (2011) , ‘The Distributional Effects of Gasoline Taxation and Their Implications for Climate Policy’ in Fuel Taxes and the Poor, RFF Press with Environment for Development initiative.
Stiglitz, J. and Weiss, A. (1981) ‘Credit Rationing in Markets with Imperfect Information’, American Economic Review, 71(3), June, 393-410.
UNEP and Bloomberg New Energy Finance (2011) Global Trends in Renewable Energy Investment 2011. Analysis of Trends and Issues in the Financing of Renewable Energy. New York: UNEP and Bloomberg.
UNEP-SEFI (2008), Public Finance Mechanisms to Mobilise Investment in Climate Change Mitigation, final report by the United Nations Environment Programme Sustainable Energy Finance Initiative, Paris.

Financing renewable energy in developing countries: mechanisms and responsibilities
41
UNFCCC (2010) Clean Development Mechanism. Executive Board Annual Report 2010, United Nations Framework Convention on Climate Change.
Vivid Economics (2009) Catalysing low-carbon growth in developing economies. Public Finance Mechanisms to scale up private sector investment in climate solutions, Commissioned by UNEP &Partners, October 2009.
WEF (2011) Green Investing 2011. Reducing the Cost of Financing, World Economic Forum, April 2011.