Financing Energy Efficient Homes - International Energy … · FINANCING ENERGY EFFICIENT HOMES ......
52
P HILIPPINE DE T’S ERCLAES I NTERNATIONAL E NERGY A GENCY © OECD/IEA, February 2007 FINANCING ENERGY EFFICIENT HOMES Existing policy responses to financial barriers INTERNATIONAL ENERGY AGENCY AGENCE INTERNATIONALE DE L’ENERGIE IEA INFORMATION PAPER
Transcript of Financing Energy Efficient Homes - International Energy … · FINANCING ENERGY EFFICIENT HOMES ......

PH I L I P P I N E D E T’SE R C L A E S
IN T E R N A T I O N A L EN E R G Y AG E N C Y
© OECD/IEA, February 2007
FINANCING ENERGY EFFICIENT HOMES
Existing policy responsesto financial barriers
INTERNATIONAL ENERGY AGENCYAGENCE INTERNATIONALE DE L’ENERGIE
IEA INFORMATION PAPER
Financing Energy Efficient Homes: Existing Policy responses to financial barriers
ACKNOWLEDGEMENTS
The author of this paper is Philippine de T’Serclaes, Policy Analyst with the Energy Efficiency and Environment Division of the IEA.
This paper is the first in a series of publications regarding financial issues and initiatives in energy efficiency. The aim of this study is to survey and briefly evaluate current policies and measures to overcome the financial impediments to the energy efficient function of residential buildings. Although the study outlines policy recommendations, it aims to survey current efforts to encourage efficiency and remaining areas to be addressed rather than the presentation of innovative policy or financial measures.
I would like to thank Richard Baron, Richard Bradley, Nigel Jollands, Jens Lausten, Paul Waide, Thomas Gueret, Mark Ellis, and Nicolas Lefevre (IEA) for the information, comments and ideas they have provided throughout my research. Arnaud Berger (Banque Populaire d’Alsace), Tom Bastin (Defra), Jean-Jacques Urvoas (EdF), Steve Baden (RESNET), David Goldstein (California Energy Commission), and Kirsten Macey (CanEurope) also provided very useful suggestions and advice.
Sierra Peterson and Charlotte Forbes (IEA) helped edit this document.
Questions and Comments should be sent to:
Philippine de T’Serclaes
International Energy Agency 9, rue de la Fédération 75015 Paris, France [email protected]
2

Financing Energy Efficient Homes: Existing Policy responses to financial barriers
Table of Contents
Table of Contents ................................................................................................................. 3 EXECUTIVE SUMMARY ................................................................................................. 4 INTRODUCTION ............................................................................................................... 7 1 ENERGY EFFICIENCY POTENTIAL IN THE BUILDING SECTOR ............. 10
1.1 Energy consumption in buildings .......................................................................................10 1.2 Energy efficient technologies .............................................................................................10 1.3 Cost-Benefits of the technologies .......................................................................................13
2 BARRIERS TO MORE ENERGY EFFICIENT BUILDINGS ............................. 15 2.1 Nature of energy market .....................................................................................................15 2.2 Residential buildings’ context ............................................................................................17 2.3 Financial Barrier .................................................................................................................17
3 TRADITIONAL FINANCIAL SOLUTIONS.......................................................... 20 3.1 Leasing ...............................................................................................................................20 3.2 Loan Financing ...................................................................................................................20 3.3 Project Financing................................................................................................................21
4 POLICIES AND PROGRAMMES........................................................................... 23 4.1 Regulation...........................................................................................................................24 4.2 Grants and Subsidies...........................................................................................................28 4.3 Fiscal measures...................................................................................................................30 4.4 Preferential Loans...............................................................................................................32 4.5 Soft instruments..................................................................................................................35 4.6 ESCOs /3rd party financing .................................................................................................38 4.7 Revolving Fund ..................................................................................................................41 4.8 White Certificates ...............................................................................................................42
5 SUMMARY AND CONCLUSION ........................................................................... 45 REFERENCES................................................................................................................... 48
3

Financing Energy Efficient Homes: Existing Policy responses to financial barriers
EXECUTIVE SUMMARY 1. Existing buildings require over 40% of the world’s total final energy consumption, and account for 24% of world CO2 emissions (IEA, 2006a). Much of this consumption could be avoided through improved efficiency of building energy systems (IEA, 2006a) using current, commercially-viable technology. In most cases, these technologies make economic sense on a life-cycle cost analysis (IEA, 2006b). Moreover, to the extent that they reduce dependence on risk-prone fossil energy sources, energy efficient technologies also address concerns of energy security.
2. Energy efficiency’s advantages notwithstanding, most houses today fail to be as energy efficient as they could be (IEA, 2006b).
3. Numerous barriers impede the improvement of energy efficiency in homes. The energy efficiency market is still characterised by information failure, numerous perverse incentives in the energy chain, high subsidies, and disparate processes of measurement and verification1.
4. Specific features of buildings, including their residents, further limit the energy-efficient function of existing homes. Despite recognition of efficiency’s benefits, residents of established households do not easily shift habits of energy consumption. Another case of specific obstacles to households is the principal agent problem, where each actor responds to different incentives. In most cases, owners and occupiers of buildings are not the same parties. When a landlord is not responsible for the energy-utility bill, he or she has little incentive to consider equipment’s energy efficiency beyond calculation of equipment’s initial cost. As such, landlords often choose to installs initially expensive, inefficient equipment. Similarly, tenants have little incentive to pay for energy efficient equipment that they cannot take with them. Landlords make the investment decisions, while tenants shoulder financial responsibility. Consequently, both are discouraged from investing in energy efficiency.
5. The financial barrier, a general term which encapsulates initial cost barrier, risk exposure, the debates on appropriate discount factors, the nature of the financier, and controversial evaluation methods, is another important obstacle to increased energy efficient homes.
6. These different barriers mean that when the market is left alone, there is too little investment in energy efficient refurbishments. Due to the relatively weak coverage of the financial barrier in the literature, the study will focus primarily on this barrier.
7. Traditional financing mechanisms follow strict standards: reproducibility obligations and quick rates of return among them. In most cases, these factors do not apply to energy efficiency investments. Using a simple payback method to compare energy efficient investments to other traditional investments using a simple payback method disadvantages
1 The International Performance Measurement and Verification Protocol (IPMVP) does seek to establish an international framework highlighting the best practices of energy savings’ methods, however it is still not widely adopted.
4

Financing Energy Efficient Homes: Existing Policy responses to financial barriers
the former2. Furthermore, a fear of hidden costs has discouraged investors from funding energy efficiency. Even today, most financiers believe that energy efficient investments have a higher risk exposure than most traditional financing, and debate on the adequate discount rate.
8. Specific instruments have been implemented to overcome such financial barrier. Governments have implemented fiscal incentives, launched awareness campaigns, and subsidies programmes. While private actors, such as banks, have increasingly joined forces with large public institutions to offer preferential loans and other financial incentives to customers. The study will provide an overview and brief assessment of such policies and measures.
9. The observation and brief evaluation of policy measures, following a set of five pre-defined criteria—relevance, clarity, flexibility, impact, and sustainability—lead to four policy lessons.
10. First, help from both fringes of the market—the public and private sector—is needed to overcome the financial barrier. As shown by the KfW and PREVair examples, public-private partnerships tend to offer the best combination of relevance, clarity, flexibility, impact, and sustainability. Most importantly, public-private partnerships offer the unmet advantage of sustainable impact. When mere subsidies offer short term relief, public-private partnerships, by calling on forces from both actors, foster genuine market transformation.
11. Second, packages of multiple policies have proven much more effective than single measures over the long-term. Though some instruments—preferential loans—are more adequate than others—isolated grants and subsidies—overall no single policy instrument can fully resolve the problem. A review of the Australian policy measures demonstrates the long-term advantage of simultaneously addressing the initial cost barrier, information failure, and training failure of the financier. Isolated grants and subsidies are particularly ineffective in fostering long-term market transformation. A diverse set of policy packages will always be more successful in bringing about market transformation. The example of the Danish Authority’s multi-pronged policy package illustrates this global approach to financial barriers. While paying customers to purchase energy efficient boilers, the Danish Authority launched concurrent campaigns of information, labelling, and training programmes to genuinely transform the market.
12. Third, lasting changes will only come through the creation of a market for energy efficiency. Such markets today remain very rare, as weak demand for energy efficiency and efficient products requires few providers. Enlivened demand and actors’ competence in energy efficiency would strengthen markets (Urvoas, 2006). Soft instruments, such as labelling, training, and information would further spur demand for energy efficient residences. Although investors need more insurance and certainty to invest, enhanced demand will also push them to design appropriate tools for energy efficiency.
13. Finally, strong political will is required to pave the way for private investors. Broad and sustained market transformation requires the creativity and resources of private actors.
2 More details on the misleading nature and inappropriateness of such approach will be given later in the study
5

Financing Energy Efficient Homes: Existing Policy responses to financial barriers However, evidence suggests they will not enter the market in the present context. Uncertain quantification methods of energy benefits, the small size of the investments, as well as the difficult standardisation of the investment, and the continuing debate on the nature of the discount rate, still discourage investments in energy efficiency.
14. Neither markets nor public intervention will overcome the financial barrier alone. Most financial measures to address specific obstacles—such as the initial cost barrier—exist, but the absence of a common framework for energy efficiency investments and the subsequent scepticism of financiers hamper implementation of existing tools. An international framework establishing common quantification methods of energy savings in residential buildings as well as a set of adequate discount rates, could typically contribute to more favourable grounds for private investors. Although the IPMVP is a good first step in that direction, however it still needs to be heavily publicised to private investors and mainstreamed.
15. Contrary to expectations, this study’s findings emphasise that increased capital availability is not the most important tool in overcoming energy efficiency’s financial barrier. Instead, the solution lies in carefully designed policy packages, and strong political will. Policy makers should focus on reducing obstacles to the involvement of private actors.
6
Financing Energy Efficient Homes: Existing Policy responses to financial barriers
INTRODUCTION 16. Energy Efficiency (EE) leads to more energy services—such as production, transport, and heat—per unit of energy used (i.e. coal, gas, electricity). There are many advantages associated with energy efficiency improvements: increased energy security, reduced energy costs, and environmental benefits.
17. To the extent that it reduces dependence on risk-prone fossil fuel energy sources, EE adds a solution option for more energy security. The increasing energy-related tensions from changing international contexts, as illustrated by the Russia/Ukrainian gas crisis in early 2006, have raised interest in energy security, and thus in energy efficiency.
18. Moreover, energy efficiency measures offer financial benefits. Although the initial cost of some energy efficient technologies is usually higher than their less efficient counterparts, the majority of these technologies make economic sense when analysed on a life-cycle cost basis (IEA, 2003)3. Energy market liberalisation combined with an important rise in energy demand in the last thirty years has shifted responsibility to private actors and has increased strains on suppliers. Suppliers are now faced with two options: invest heavily in supply-side options or reduce demand by promoting the use of energy efficiency.
19. Further, through its reduction of energy use, EE also presents a viable option for the mitigation of human-induced CO2 emissions. The growing consensus on the need to mitigate these CO2 emissions (IPCC, 2001), has thus reinforced the emphasis on EE.
20. This combination of factors has made energy efficiency a priority for policy makers. Energy efficient technologies are particularly useful in energy-intensive sectors. For instance, in existing buildings which consume over 40% of the world total primary energy consumption (IEA, 2006a), and are responsible for growing carbon dioxide emissions4.
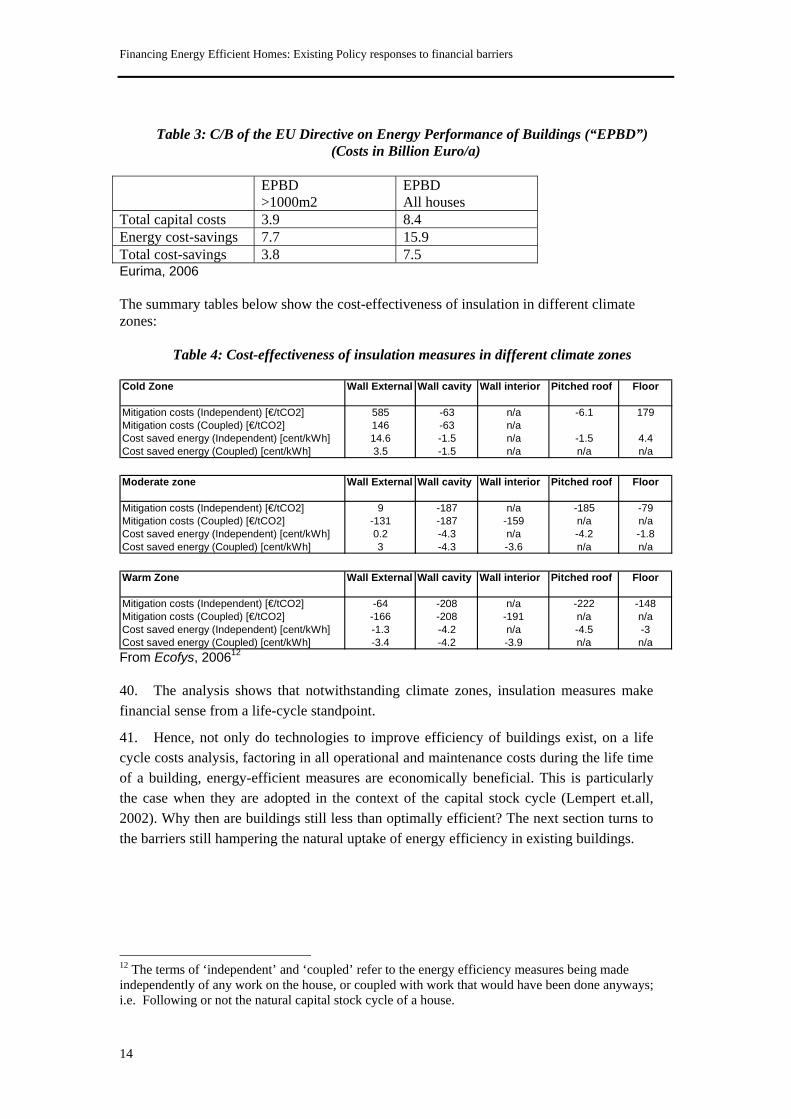
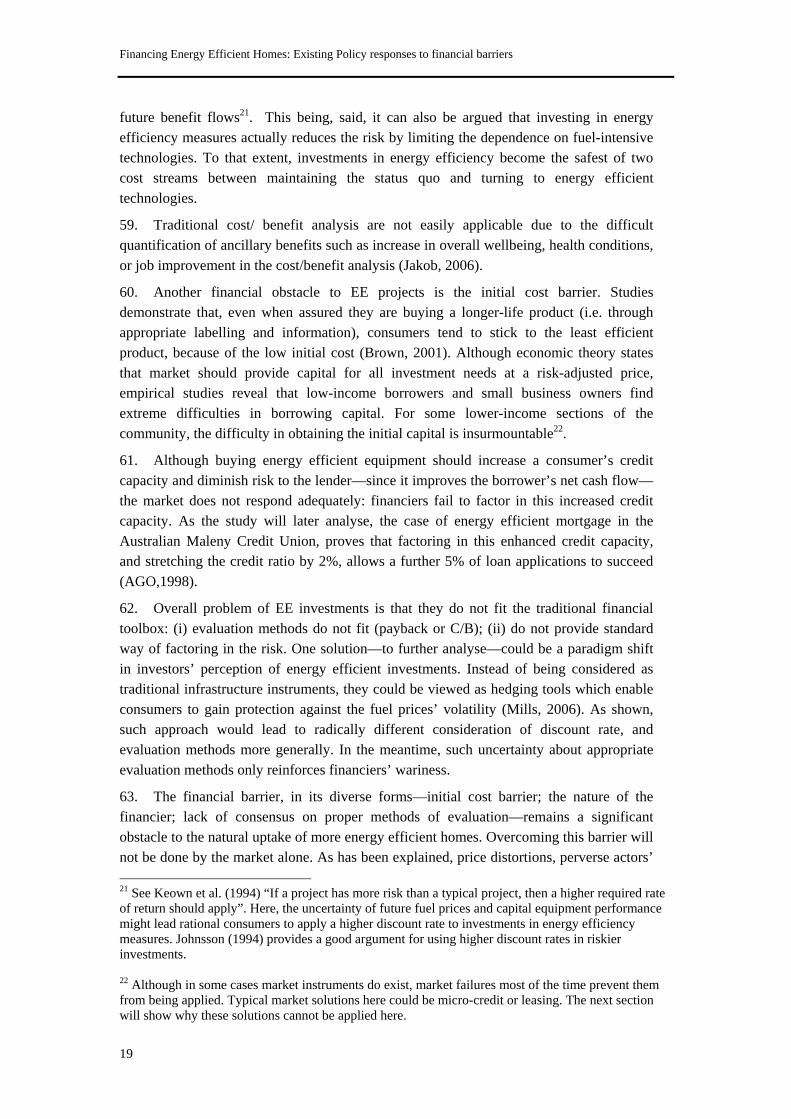
21. Technologies to improve the efficacy of households’ overall energy system exist. In cold climates where most of the energy consumed is spent on heating, energy use can be reduced significantly by improved checking processes on insulation, less infiltrations and leakages, and more efficient heating systems (especially boilers). In a hot climate, on the other hand, properly designed ventilation systems, adequate solar protection, or building inertia and insulation can reduce the need to use air conditioning5. Since the 1973 oil crisis, energy efficiency has led to a significant reduction of actual energy consumption (see Figure 1).
3 As will be discussed further along in the paper 4 From 1971 to 2002, carbon dioxide emissions from energy use in buildings grew at an annual rate of 1.8% (IEA, 2006) 5 For more detailed analysis on the existing technologies please refer to section I of the paper
7

Financing Energy Efficient Homes: Existing Policy responses to financial barriers
Figure 1: Energy Savings due to energy efficiency since 1973
Actual energy use
Additional energy use without
savings
0
20
40
60
80
100
120
140
160
1973 1975 1977 1979 1981 1983 1985 1987 1989 1991 1993 1995 1997
exaj
oule
s
50%
IEA, 2006
22. Although energy efficiency technologies exist, are commercially available and, on an average life-cycle basis, are financially beneficial, existing households continue to use more energy than necessary (IEA, 2006a). Numerous barriers explain the persistently less-than-optimal energy efficiency of existing buildings6. Among these barriers, the specificities of the energy market which can still be weighed down by remnants of formerly limited market actors, as well as the inertia in consumers’ behaviour, or the many disincentives present in the building chain, are all key in preventing energy efficient technologies’ uptake. The financial barrier, a general term which encapsulates various issues from the initial cost barrier, to the risk exposure, the discount factor issues, and the nature of the financier, is determinant in slowing down the process to more energy efficient buildings.
23. As few other studies have considered financial barriers to the energy efficient function of existing residential buildings, this study reviews current policies and programmes to overcome such financial impediments.7 Drawing on different examples, it will seek to identify which policies, or policy packages, have proven most effective in overcoming the financial barrier.
24. The next section presents energy efficient potentials in existing residential buildings. The study will describe typical energy consumption patterns, as well as existing technologies that improve buildings’ overall efficacy. The cost-effectiveness of most of these technologies will also be demonstrated. Section 2 will give an overview of the main barriers still hampering more energy efficient buildings. These obstacles will be analysed in three categories: (i) the inherent nature of the energy market; (ii) the particular context
6 Hereafter, reference to buildings will relate to household buildings 7 Case studies will only be drawn from OECD countries
8

Financing Energy Efficient Homes: Existing Policy responses to financial barriers
of the building sector; and (iii) the financial barrier8. Section 3 will present traditional financial mechanisms and explain why they are ill-fitted in the case of energy efficient investments in buildings. Section 4 will present case studies from OECD countries illustrating different attempts to overcome this financial barrier. Finally, section 5 will briefly discuss and draw policy lessons from the case studies.
8 Debates about obstacles classification in barriers and/ or failures, are ongoing. For the purpose of this paper, the study here builds on previous studies and uses a classification to present the obstacles as simply as possible. In doing so however, it does not seek to supplement others. For more detailed discussion on the nature and appropriate classification of the different obstacles please refer to Eto & Gavalove (1996), Hall & Jacob (2005), Lovins (1993), Brown (2001).
9
Financing Energy Efficient Homes: Existing Policy responses to financial barriers
1 ENERGY EFFICIENCY POTENTIAL IN THE BUILDING SECTOR
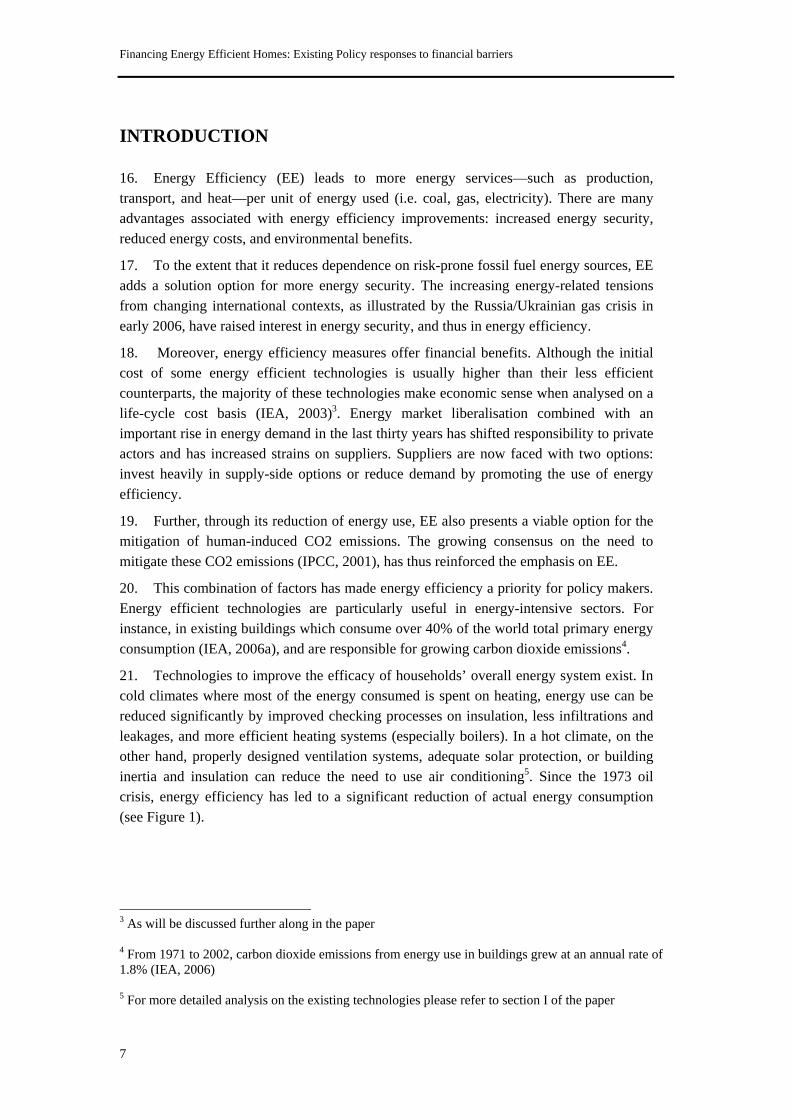
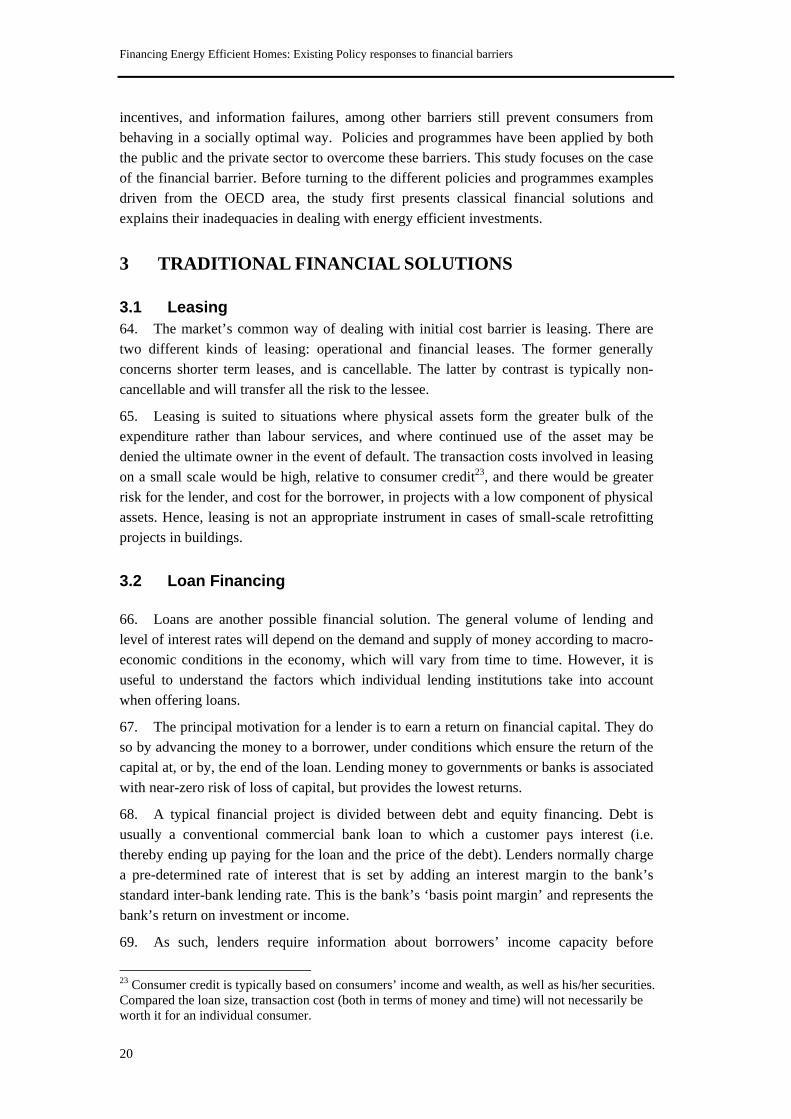
1.1 Energy consumption in buildings 25. This paper examines refurbishments which improve the energy efficiency of existing residential buildings, excluding improvements to moveable household appliances. Measures to improve household efficiency should be considered in the context of two categories of residential energy consumption: climatic zone and energy end-use. Strongly influencing household energy requirements, climatic conditions can be divided into three zones: cold, moderate and warm. Household end-use divides broadly into five sections, as illustrated in Figure 2
Figure 2: Average household energy consumption division
60%
13%
6%
5%
16%Heating and Cooling (icldwater heating)Refrigerators
Cooking
Lighting
Other ElectronicAppliances
IEA,2003
1.2 Energy efficient technologies 26. Energy efficient technologies to reduce energy consumption exist. The next few paragraphs will give an overview of these technologies and establish their cost-effectiveness.
27. When managing a house’s overall energy needs, insulation is key. As shown in the table below, different types of insulation materials and methods can make a difference to the order of 1 to 3 ratio in a household energy consumption9.
9 More sophisticated changes could even bring the difference in ratio from 1 to 5
10

Financing Energy Efficient Homes: Existing Policy responses to financial barriers 28. The table below illustrates the impact of insulation and simple energy efficient practices with the energy requirements of three standard houses. All three houses have the same size (100m2) and same volume (250m3). House 1 is a ‘classical’ house. Its insulation is at a typical current building code minimum requirement level. Energy efficiency is not factored in by its consumers, or designers (i.e. no particular orientation or fenestration). House 2 is similar to the first one in all points except in the orientation and use of shutters in the house. In addition, some basic energy efficient training has been given to its inhabitants (i.e. closing taps when washing teeth; using shutter properly etc.). House 3 is a bio-climatic house: it has proper ventilation, insulation, interior blinds etc.
Table 1: Energy consumption of three different houses House 1 House 2 House 3
Surface 100m2 100m2 100m2 Volume 250m3 250m3 250m3 Winter Temperature 19°C day
15°C night 19°C day 15°C night
19° day 15° night
Windows 16m2 Of which 3.2m2 south
16m2 Of which 11.2m2 south
28m2 Of which 22m2 south
Nights in Winter Shutters opened Shutters closed Shutters closed Day in Summer Shutters opened Shutters closed 85% Shutters closed 85% Wall insulation 7cm inside 7 cm inside 10 cm external Roof Insulation 14cm 14 cm 20 cm Heating/Cooling Needs 14 300 kWh 9 420 kWh 5 070 kWh - 34 % - 65 % From La maison Négawatts, 2005 29. There are two main insulation techniques: internal and external. Although internal insulation has long been preferred mainly for aesthetic reasons, external insulation has proven to be almost twice as effective (Ademe, 2005). Insulation can also be part of the structure when, for example, building blocks themselves are made with an insulating material (e.g. cellular concrete or honeycombed bricks).
30. Apart from technique, the material used as well as the thickness of insulation will have an impact on the house insulation properties. Proper insulation is closely related to the inertia quality of the house, sometimes called thermal mass. High inertia- which is brought about through the use of heavy materials- will tend to keep the heat within, and minimise heat variation inside. A low inertia house on the other hand, will rapidly rise and fall in temperature depending on outside temperature or solar gain. Some insulation materials and some building options favour a high inertia while others do not.
31. There are typically two kinds of insulation materials, those said to be “light”, and others said to be “heavy”. Light insulation materials are typically grouped into three different categories:
- Those with a mineral base: glass wool, rock wool, vermiculite, perlite,
fiberglass, expanded clay - Those based on honeycombed plastic material: expanded polystyrene;
extruded polystyrene; or polyurethane
11

Financing Energy Efficient Homes: Existing Policy responses to financial barriers
- Vegetable base insulators: cork, cellular wool, linen tow, cotton, coco fibre.
The ratio of efficiency between the first and last material is in the magnitude of one to five.
Table 2: Different insulation materials in decreasing order of efficiency Name Lambda (Thermal Conductivity) in W/m.K Polyurethane 0.025 Extruded Polysterene 0.029 Cork 0.036 Linen wool 0.038 Rock wool 0.04 Glass wool 0.04 Hemp wool 0.04 Expanded Polysterene 0.04 Hemp 0.048 Vermiculite 0.066 Hemp + Lime 0.12 From La maison Négawatts , 2005 32. Inertia, then, is crucial in having efficient buildings. The heavy insulation materials allow the combination of good insulation with sufficient thermal mass to improve the overall efficiency of the building. On the other hand, achieving a sufficient inertia while using light insulation materials will require sound design options (e.g. external insulation or including heavy material in the inside structure of the building). Heavy insulating materials include thick honeycombed terracotta bricks, cellular concrete building blocks, wood and hemp and lime walls.
33. Chasing leakages and inefficient technologies throughout the system is crucial. The choice in windows is very important. Efficient windows with a high resistance to heat flow (high R-values) are good in cold climates. The window’s resistance to heat flow is affected by a number of factors: the type of glazing material (glass or plastic); the number of layers of glass; the size of the air space between the layers; the filling between the layers of glass and coating; the thermal resistance or conductance of the frame and space material; and the “tightness” of the installation. The thermal resistance of a window is also influenced by the design of the window: efficient windows with many small layers of glass will typically have higher R-values (more efficient) than windows with fewer but larger layers. The thermal quality of windows has improved greatly over the recent years. Today multiple glazing, the use of rare gases (such as argon or krypton gas) between layers, as well as the choice in framing materials and glazing surfaces all allow an improved quality in the window insulation capacity. Thermal conductivity of glazing products ranges from less than 1 W/m2.K to 6W/m2.K (simple glazing). Today the best windows on the market insulate three times as well as their immediate predecessors (IEA, 2006a).
34. Beyond the building envelope, direct changes in the conditioning (heating or cooling) can also significantly improve the efficiency of a household. In heating devices for instance, potential for savings through a replacement from traditional oil and gas heating systems is significant (IEA, 2006). Inefficiencies come from the nature of the energy source, and the choice of the appliance. Dramatic progress in heaters (oil or gas)
12

Financing Energy Efficient Homes: Existing Policy responses to financial barriers
has been made since the mid-20th century. Efficiencies have risen from around 60% to more than 80% in oil-fuelled heaters. Condensing gas boilers, on the other hand, can achieve up to 97% efficiencies. Besides encouraging more efficient heaters, the correct sizing of the equipment is also important. In some cases, replacement of an old inefficient and maybe oversized boiler can reduce the total consumption by 30% to 35%. High efficiency condensing boilers convert at least 88% of their fuel into heat, compared to 78% for conventional types of boilers (EST, 2006).
1.3 Cost-Benefits of the technologies 35. Better technologies cannot be adopted if they are not easily available and financially viable. The case of the EU-building stock—which accounts for 40% of EU’s energy consumption—will be used to illustrate the cost-effectiveness (or otherwise) of most of these energy efficient technologies at an aggregate scale. The recent adoption of the European Directive on Energy Performance of Buildings10 establishes an annual target of 34Mt/a for CO2 emission reduction by the year 2010 (EPBD, 2005).
36. The most common criterion to determine the cost-effectiveness of a mitigation measure is the annualised mitigation cost in EURO per ton of CO2 avoided. On a life cycle cost basis, assessing the mitigation costs involves not only investments but operational costs, and maintenance costs (Eurima, 2006).
37. Capital cost refers to the cost of the investment in the equipment. Depending on the context, two investment scenarios should be distinguished. One when total investment costs cover energy efficiency alone (i.e. labour, applicable taxes as well as overheads and profits), and one in which refurbishments would have happened anyway and to which energy-related measures are added (i.e. which include only specific measures). The former will be referred to as ‘independent’ in Table 4, while the latter is referred to as ‘coupled’.
38. Investments are converted into constant annual capital costs by adding annual operational and maintenance costs, plus annualised capital costs.
39. Tables 4 summarises cost/benefits calculations by climate zones for all EU buildings. They are based on a public societal perspective: they reflect the compilation from studies conducted at a public level only. As such they are based on a fixed discount rate, here 4%. This discount factor might well be different if applied to individuals or firms11.
10 The details of which will be analysed later in the study 11 The ongoing debate on the appropriateness of the discount rate is discussed in the next section of the study
13
Financing Energy Efficient Homes: Existing Policy responses to financial barriers
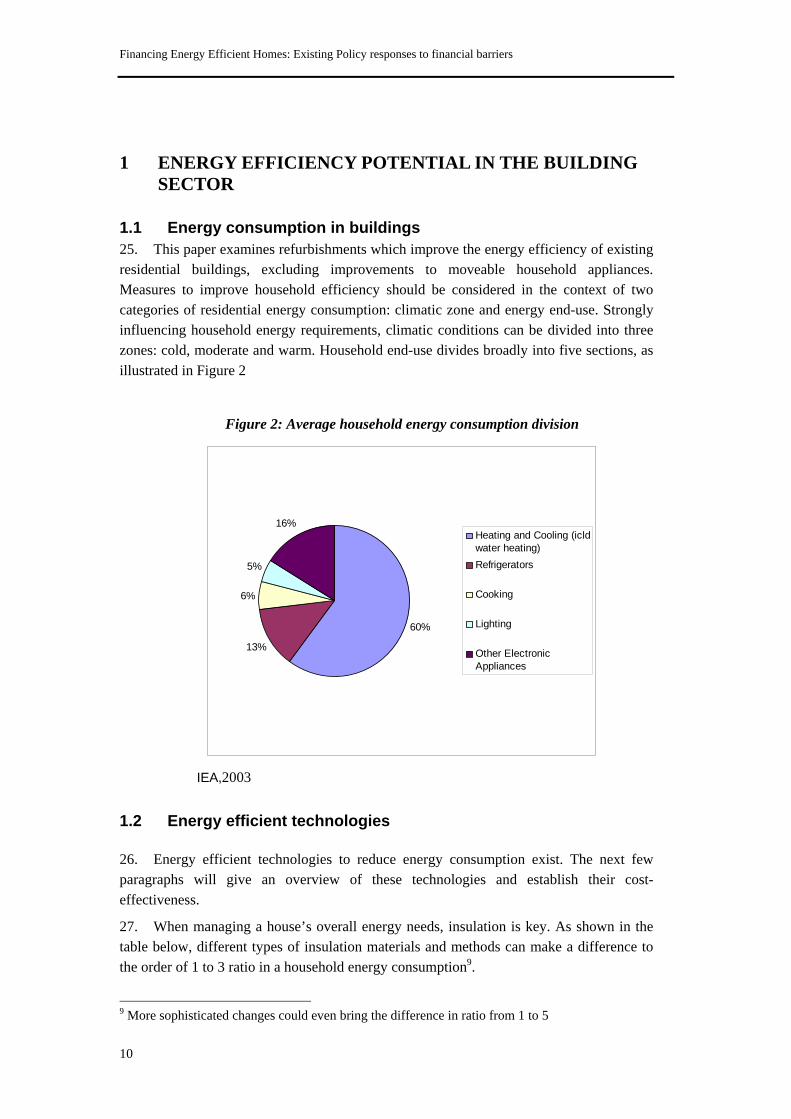
Table 3: C/B of the EU Directive on Energy Performance of Buildings (“EPBD”) (Costs in Billion Euro/a)
EPBD
>1000m2 EPBD All houses
Total capital costs 3.9 8.4 Energy cost-savings 7.7 15.9 Total cost-savings 3.8 7.5 Eurima, 2006 The summary tables below show the cost-effectiveness of insulation in different climate zones:
Table 4: Cost-effectiveness of insulation measures in different climate zones Cold Zone Wall External Wall cavity Wall interior Pitched roof Floor
Mitigation costs (Independent) [€/tCO2] 585 -63 n/a -6.1 179Mitigation costs (Coupled) [€/tCO2] 146 -63 n/aCost saved energy (Independent) [cent/kWh] 14.6 -1.5 n/a -1.5 4.4Cost saved energy (Coupled) [cent/kWh] 3.5 -1.5 n/a n/a n/a Moderate zone Wall External Wall cavity Wall interior Pitched roof Floor
Mitigation costs (Independent) [€/tCO2] 9 -187 n/a -185 -79Mitigation costs (Coupled) [€/tCO2] -131 -187 -159 n/a n/aCost saved energy (Independent) [cent/kWh] 0.2 -4.3 n/a -4.2 -1.8Cost saved energy (Coupled) [cent/kWh] 3 -4.3 -3.6 n/a n/a Warm Zone Wall External Wall cavity Wall interior Pitched roof Floor
Mitigation costs (Independent) [€/tCO2] -64 -208 n/a -222 -148Mitigation costs (Coupled) [€/tCO2] -166 -208 -191 n/a n/aCost saved energy (Independent) [cent/kWh] -1.3 -4.2 n/a -4.5 -3Cost saved energy (Coupled) [cent/kWh] -3.4 -4.2 -3.9 n/a n/a From Ecofys, 200612
40. The analysis shows that notwithstanding climate zones, insulation measures make financial sense from a life-cycle standpoint.
41. Hence, not only do technologies to improve efficiency of buildings exist, on a life cycle costs analysis, factoring in all operational and maintenance costs during the life time of a building, energy-efficient measures are economically beneficial. This is particularly the case when they are adopted in the context of the capital stock cycle (Lempert et.all, 2002). Why then are buildings still less than optimally efficient? The next section turns to the barriers still hampering the natural uptake of energy efficiency in existing buildings.
12 The terms of ‘independent’ and ‘coupled’ refer to the energy efficiency measures being made independently of any work on the house, or coupled with work that would have been done anyways; i.e. Following or not the natural capital stock cycle of a house.
14

Financing Energy Efficient Homes: Existing Policy responses to financial barriers
2 BARRIERS TO MORE ENERGY EFFICIENT BUILDINGS
2.1 Nature of energy market 42. The introduction of competition and market liberalisation are quite recent characteristics in energy markets. This heritage means that energy markets are still sometimes framed in a biased pattern where a limited number of actors get easier access to information. Decisions are consequently often taken by large equipment manufacturers, which might try to inhibit the introduction by competitors of energy-efficient, cost-effective products (Hall et. all, 2005).
43. This context also means that equipment manufacturers can choose not to share information with other players. Information failure is one of the most important barriers to the uptake of energy efficiency13: there is a lack of understanding of energy benefits, as well as a failure to get proper information on what to do once the willingness is there. There are two kinds of information obstacles: one pertains to the asymmetric access to information, while the other relates to the mere lack of available information.
44. Information failure affects energy efficient projects in various ways. First, they lead to a lack of customers’ awareness of energy efficiency’s benefits - both financial and environmental. In the residential sector the perception that energy efficiency requires sacrifices has been persistent (Kempton et al., 1985). Once overcome, this first information failure gives way to another: the absence of properly synthesised information describing financial options to assist individuals’ investments in energy efficiency (Lovins, 1992). In energy efficiency information tends to be asymmetric and there is a tendency of those who have it to want to use it opportunistically (Eto & Golove, 1996)14. As a result, information in EE is still expensive: people are not prepared to give it away and even when they do, consumers tend to mistrust it because they were misled on faulted technologies (Hall et. all, 2005). Beyond this difficult access to information, its understandability to the average customer is a major obstacle. It is sometimes very difficult for non-experts to understand the small amount of information which is available. The ability to process and understand the technicality of the given information is a challenge in and of itself. “Individuals and firms are limited in their ability to use- store, retrieve, and analyse- information” (Krempton & Montgomery, 1982).
45. Beyond information failure, the absence of standardised measurements & verifications protocol (“M&V”) has been identified as a major downturn for EE projects (Ramesohl & Dudda, 2004). The absence of a common quantification method of energy savings benefits makes it more difficult to conduct traditional cost benefits analysis. It also
13 Please refer to RAMESOHL & DUDDA for an opposite view on the subject: their empirical study suggests that the lack of adequate technical expertise and guidelines is most often quoted by customers as the most important barrier to their implementing of EE projects 14 A useful illustration of this idea is given by Eto & Golove on page 24 of their 1996 paper. Demonstrating that when two firms are involved it might well be that one will be able to benefit from the information sharing of the other, hence transaction costs would be much more efficiently reduced through institutional reforms and incentives.
15

Financing Energy Efficient Homes: Existing Policy responses to financial barriers
results in financiers having to spend more time evaluating individual EE projects, hence increasing the transaction costs of each project15.
46. The functioning of the building chain can be viewed as a further barrier to energy efficiency development. Perverse incentives are present throughout the building chain (Lovins, 1995) and apply to the different actors along the line (i.e. energy suppliers, architects; project leader; programmer etc).
47. In most cases, actors following the most economically rational line of conduct, end up running against energy efficiency. Engineers’ fee structure for instance, is based on a percentage of the capital cost of the project, subcontract, or equipment installation. The fee structure is such that designers who do extra work to create and implement innovative energy efficient systems such as a passive solar building that requires less installed equipment (such as HVAC), and end up cutting their clients’ operating costs, are actually penalised by lower fees and profits. This penalisation occurs in two different ways: i- engineers/ architects are getting a percentage on a lower cost; and ii- they are doing more work for that smaller fee. In the end they are thus enduring higher cost for lower profits. In the words of a mechanical engineer of an ASHRAE- award building, “We had a negative motivation to do it right”16.
48. Fiscal regimes can emphasise disincentive. For instance, American law allows all operating costs to be tax deductible, but not capital costs which have to be depreciated during 30 years. Consequently, building managers do not mind a high level of operating costs, with expected consequences for EE projects. Speculative builders overall tend not to consider operating costs at all because what they want is immediate resale, hence they will not consider the potential long-term advantages of carefully designed heating systems (Lovins, 1992). Furthermore, more than twelve states in the United States charge sales tax on residential energy saving devices but not on residential fuels and electricity, while only one, Rhode Island, does the opposite (Brown, 2001).
49. Biased price signals can also mislead consumers. Energy is often considered a public good. As such it tends to be heavily subsidised. Excessive subsidisation of energy prices can distort the markets, and prevent consumers receiving accurate price signals that reflect the true marginal cost of the energy use (Levine & Hirst, 1994).
50. Energy price distortions are not only caused by subsidies and regulation, they are also the consequence of excluding externalities from energy prices17. It can be argued that current energy prices do not reflect their true societal costs, as an accurate pricing would incorporate societal costs in the price of energy (Jakob, 1999).
15 This aspect will be further analysed in a coming section 16 In Lovins, 1992 p. 23 17 Externalities: The consequences or impacts of resource decisions that are not directly accounted for in the price paid for the resource. Benefits or costs generated as the result of an economic activity that do not accrue directly to the parties involved in the activity. The cost of natural resource depletion, pollution and other environmental and social factors are externalities that often are not factored into the market price of a product.
16

Financing Energy Efficient Homes: Existing Policy responses to financial barriers
2.2 Residential buildings’ context 51. The building sector itself introduces a set of specific obstacles to energy efficiency. Consumer habits, for example, have a tremendous impact on the direction that the market will follow. Their awareness of certain issues, their habits, or tastes will be pivotal in influencing market evolution. In the same line, changes will be difficult to implement, because consumers’ habits are known for their strong inertia. Studies show that on average it takes over 10 years to dramatically change consumer tastes (Eto & Golove, 1996). Typical penetration rates of new technologies oscillate between three to four years.
52. Moreover, the decision making context to improve energy efficiency is important. Whether the energy efficient improvements will be incorporated in the natural capital stock cycle, or independently, makes a huge difference.
53. Specific to the building context, moreover, is the principal agent issue, also called the landlord/ tenant paradox. This refers to the fact that in most cases, the owner and occupier of a house (or apartment) is a different person. When the tenant is responsible for the energy-utility bills, it is in the landlord’s interest to provide least-first-cost equipment rather than consider the equipment’s energy efficiency. Often this means that equipment with relatively low energy efficiency is installed. Similarly, the tenant will not be willing to pay for energy efficient equipment that they cannot take with them. Investing in EE upgrades, then, will not be a natural move for either actor.
54. Most actors in the building chain do not have adequate training and knowledge in energy efficiency (Brown, 2001). Suppliers, manufacturers, promoters, and financiers alike, tend to lack the necessary skills to adequately promote energy efficiency products to their customers (Dutruge, 2006). As the next section further analyses, financiers are generally not trained on issues of energy efficiency, and thus will not naturally promote funding for such projects, and will not know what to answer when asked about it (Hall & Jacobs, 2005). Consumers’ interviews reveal that even once consumers express a willingness to implement EE, they often find it difficult to find qualified advice from financial experts. Energy expertise is almost nonexistent within financial institutions. Even when they exist, bankers tend to barely know of the existence of tools and special provisions for EE projects (WWF, 2005).
2.3 Financial Barrier 55. Investors’ primary goal is to make money, or get a return on investment. This rate of return can be determined by three different indicators: (i) payback time, (ii) the return on investment; or (iii) the internal rate of return18.
18 The payback time indicates the average time it takes investors to get back the initial money they invested. Return on Investment (ROI) is the ratio of money gained or lost on an investment to the amount of money invested. The amount of money gained or lost may be referred to as interest, profit/loss, gain/loss, or net income/loss. The money invested may be referred to as the asset, capital, principal, or the cost basis of the investment. It is not the same thing as time, or internal rate of
17

Financing Energy Efficient Homes: Existing Policy responses to financial barriers
56. It is common practice for investors to refer to the payback time as an indicative value of their investments. Such indicator however comes as a disadvantage for energy efficient investments. On average, if considered out of context of the natural capital stock turnover cycle, energy efficiency refurbishments will take about seven to eight years to payback. When capital stock turnover is taken into account, the payback time can decrease to as little as three years on average (IEA, 2006b). As such, narrowly-informed financiers may prefer more classical investments with quicker payback time (Eto & Golove, 1996)19. Efforts should be placed on demonstrating the inappropriateness of such indicator, since amongst other things it does not allow the consideration of benefits accrued after the payback time. This is particularly inappropriate in the case of buildings since they have a lifetime of 30 years or more, hence benefits which will extend way beyond investments’ payback time20. This illustrates that most appropriate methods of evaluation for energy efficient projects would probably be a net present value or other.
57. Risk exposure is another consideration for investors. The simple correlation usually is that the higher the risk exposure, the higher the rate of investment needs to be. Commercial bankers favour investments which are safest and highest in terms of return on investment. Speculators or hedge fund managers on the other hand are more likely to take on risky investments and will be ready to spend more time analysing specific situation, should the return be worth it. Due to their relatively small size, EE investments in existing buildings do not fulfil those criteria either. They do not involve sums that are large enough, nor do they meet the profit rates under consideration. Commercial bankers will naturally be keen on all investments which are easily replicable, and for which evaluation is standardised. Energy efficiency projects’ plight therefore is not to meet any of the set criteria defined by financiers. Financiers end up not knowing how to deal with those projects and spending more time on each of them, which increases the transaction costs of each project.
58. Evaluation methods for energy efficient investments are still being debated. There is still a deep rift regarding the appropriate discount factor for evaluation of energy efficient investments. Depending on the way in which energy efficient investment is considered (i.e. an uncertain investment or a safer investments than status quo), the discount rate is arguably too low, or too high (Thompson, 1997). The standard approach to the evaluation of an energy efficient measure deals with it as a classical investment: “reflects an initial financial expenditure followed by subsequent payoff” (Sutherland, 1991). Following such view, it makes sense to apply a high discount rate which will reflect the riskiness of the
investment. The internal rate of return is the return rate which can be earned on the invested capital, or the yield of the investment. A project is a good investment proposition if its IRR is greater than the rate of interest that could be earned by alternative investments. The IRR typically includes a risk premium. 19 Martin, Y. (1998) emphasises that in 40% of cases, retrofitting measures have payback times of over 70 years, when typical industrial projects have on average a payback time of 15 years. 20 Estimates show that an average level of consumption of 50kWh/m2 per year can be reached at an average cost of the renovation of 150€/m2 which, compared to money spent on consumption before the refurbishments, considering a 4.5% loan on 20 years, would even out after only one year (Sidler, 2006)
18
Financing Energy Efficient Homes: Existing Policy responses to financial barriers
future benefit flows21. This being, said, it can also be argued that investing in energy efficiency measures actually reduces the risk by limiting the dependence on fuel-intensive technologies. To that extent, investments in energy efficiency become the safest of two cost streams between maintaining the status quo and turning to energy efficient technologies.
59. Traditional cost/ benefit analysis are not easily applicable due to the difficult quantification of ancillary benefits such as increase in overall wellbeing, health conditions, or job improvement in the cost/benefit analysis (Jakob, 2006).
60. Another financial obstacle to EE projects is the initial cost barrier. Studies demonstrate that, even when assured they are buying a longer-life product (i.e. through appropriate labelling and information), consumers tend to stick to the least efficient product, because of the low initial cost (Brown, 2001). Although economic theory states that market should provide capital for all investment needs at a risk-adjusted price, empirical studies reveal that low-income borrowers and small business owners find extreme difficulties in borrowing capital. For some lower-income sections of the community, the difficulty in obtaining the initial capital is insurmountable22.
61. Although buying energy efficient equipment should increase a consumer’s credit capacity and diminish risk to the lender—since it improves the borrower’s net cash flow—the market does not respond adequately: financiers fail to factor in this increased credit capacity. As the study will later analyse, the case of energy efficient mortgage in the Australian Maleny Credit Union, proves that factoring in this enhanced credit capacity, and stretching the credit ratio by 2%, allows a further 5% of loan applications to succeed (AGO,1998).
62. Overall problem of EE investments is that they do not fit the traditional financial toolbox: (i) evaluation methods do not fit (payback or C/B); (ii) do not provide standard way of factoring in the risk. One solution—to further analyse—could be a paradigm shift in investors’ perception of energy efficient investments. Instead of being considered as traditional infrastructure instruments, they could be viewed as hedging tools which enable consumers to gain protection against the fuel prices’ volatility (Mills, 2006). As shown, such approach would lead to radically different consideration of discount rate, and evaluation methods more generally. In the meantime, such uncertainty about appropriate evaluation methods only reinforces financiers’ wariness.
63. The financial barrier, in its diverse forms—initial cost barrier; the nature of the financier; lack of consensus on proper methods of evaluation—remains a significant obstacle to the natural uptake of more energy efficient homes. Overcoming this barrier will not be done by the market alone. As has been explained, price distortions, perverse actors’
21 See Keown et al. (1994) “If a project has more risk than a typical project, then a higher required rate of return should apply”. Here, the uncertainty of future fuel prices and capital equipment performance might lead rational consumers to apply a higher discount rate to investments in energy efficiency measures. Johnsson (1994) provides a good argument for using higher discount rates in riskier investments. 22 Although in some cases market instruments do exist, market failures most of the time prevent them from being applied. Typical market solutions here could be micro-credit or leasing. The next section will show why these solutions cannot be applied here.
19
Financing Energy Efficient Homes: Existing Policy responses to financial barriers
incentives, and information failures, among other barriers still prevent consumers from behaving in a socially optimal way. Policies and programmes have been applied by both the public and the private sector to overcome these barriers. This study focuses on the case of the financial barrier. Before turning to the different policies and programmes examples driven from the OECD area, the study first presents classical financial solutions and explains their inadequacies in dealing with energy efficient investments.
3 TRADITIONAL FINANCIAL SOLUTIONS
3.1 Leasing 64. The market’s common way of dealing with initial cost barrier is leasing. There are two different kinds of leasing: operational and financial leases. The former generally concerns shorter term leases, and is cancellable. The latter by contrast is typically non-cancellable and will transfer all the risk to the lessee.
65. Leasing is suited to situations where physical assets form the greater bulk of the expenditure rather than labour services, and where continued use of the asset may be denied the ultimate owner in the event of default. The transaction costs involved in leasing on a small scale would be high, relative to consumer credit23, and there would be greater risk for the lender, and cost for the borrower, in projects with a low component of physical assets. Hence, leasing is not an appropriate instrument in cases of small-scale retrofitting projects in buildings.
3.2 Loan Financing
66. Loans are another possible financial solution. The general volume of lending and level of interest rates will depend on the demand and supply of money according to macro-economic conditions in the economy, which will vary from time to time. However, it is useful to understand the factors which individual lending institutions take into account when offering loans.
67. The principal motivation for a lender is to earn a return on financial capital. They do so by advancing the money to a borrower, under conditions which ensure the return of the capital at, or by, the end of the loan. Lending money to governments or banks is associated with near-zero risk of loss of capital, but provides the lowest returns.
68. A typical financial project is divided between debt and equity financing. Debt is usually a conventional commercial bank loan to which a customer pays interest (i.e. thereby ending up paying for the loan and the price of the debt). Lenders normally charge a pre-determined rate of interest that is set by adding an interest margin to the bank’s standard inter-bank lending rate. This is the bank’s ‘basis point margin’ and represents the bank’s return on investment or income.
69. As such, lenders require information about borrowers’ income capacity before
23 Consumer credit is typically based on consumers’ income and wealth, as well as his/her securities. Compared the loan size, transaction cost (both in terms of money and time) will not necessarily be worth it for an individual consumer.
20

Financing Energy Efficient Homes: Existing Policy responses to financial barriers
making the loan. Lending on an unsecured asset involves greater risks, and lenders will require higher interest rates. Lenders will have incentives to maximise the charge to borrowers, but be constrained by the opportunity available to borrowers to seek loans from other sources.
70. Lending money to individuals and firms carries a more significant risk and therefore lenders will require a higher rate of interest and possibly other collateral security in order to provide the loan. The uncertainties surrounding energy savings projections do not allow investors to project incoming cashflows. As such, they do not factor in the increased credit capacity of consumers. The next section shows that banks which have been doing that have allowed increased energy efficient access.
3.3 Project Financing 71. Project Finance, or off-balance sheet payment24, by contrast to debt financing, will rely on a project’s cash flow expectations, not on an individual’s credit-worthiness. The principle behind project financing is to spread the risk between the different actors. A typical project finance structure includes a wide array of contracts between the different actors that transfers the risk and allows an adequate risk coverage and division.
72. Customers who have strong balance sheets will not have to resort to project finance. Gearing (the ratio of debt to equity) is much higher in project finance than in ‘on balance sheet’ financing. A project with 70- 80% debt and 20-30% equity is common in project financing. Compared to on balance sheet finance, banks will usually be willing to extend the length of the project finance loans to almost 15 years (because they will have much more control over the project). Another particularity of project financing is that it transfers the risk away from the financiers and spreads it amongst the different actors. Through contracting and because risk is divided between the different sponsors of the project, project financing ensures that there are different outcomes in case of non-payment.
73. Again, the uncertainties in the exact savings that will be achieved through a given energy efficiency project, plays against EE projects. Moreover, the relatively small size of EE projects will also tend to disadvantage them when considering project financing.
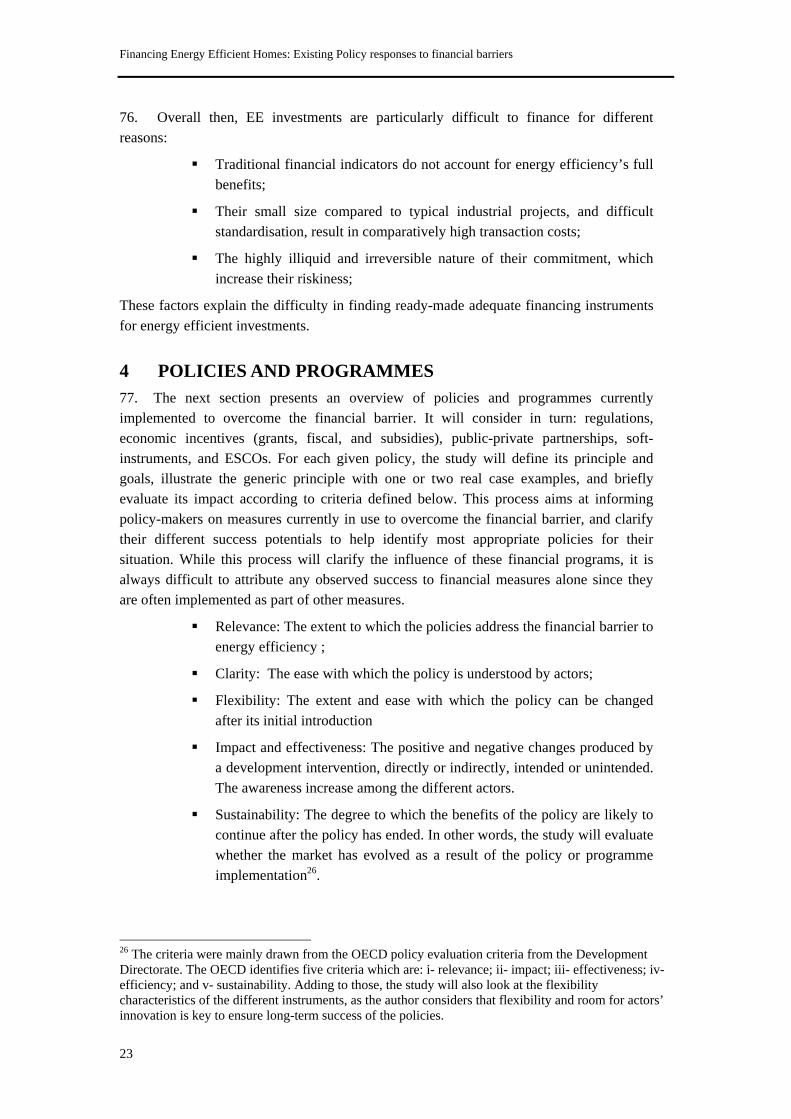
74. Figure 2 below illustrates a project financing structure. The complex array of contracts between the different actors is well represented. The diagram demonstrates the complexity and heavy transaction costs that are characteristics of such a scheme, and help to understand why it is not appropriate for small scale projects.
24 Referred to as such, because it is often structured in a way which prevents any sponsors from bearing the entire risk alone. If structured properly, the risk-sharing feature allows the project sponsors to avoid listing the project on any of their corporate balance sheets.
21

Financing Energy Efficient Homes: Existing Policy responses to financial barriers
Figure2: Example of project finance structure
75. Project Finance relies mostly on future cash flows by contrast to individual’s credit worthiness. As such it could appear as a good mechanism for EE investments. However, the large transaction costs and intricacies of project financing imply a very high threshold investment price. Typical project finance deals are not considered under USD 30 m25. This deal structure is therefore unsuitable for EE investments considered in this study. 25 An investment banker at Merrill Lynch
22
Financing Energy Efficient Homes: Existing Policy responses to financial barriers
76. Overall then, EE investments are particularly difficult to finance for different reasons:
Traditional financial indicators do not account for energy efficiency’s full benefits;
Their small size compared to typical industrial projects, and difficult standardisation, result in comparatively high transaction costs;
The highly illiquid and irreversible nature of their commitment, which increase their riskiness;
These factors explain the difficulty in finding ready-made adequate financing instruments for energy efficient investments.
4 POLICIES AND PROGRAMMES 77. The next section presents an overview of policies and programmes currently implemented to overcome the financial barrier. It will consider in turn: regulations, economic incentives (grants, fiscal, and subsidies), public-private partnerships, soft-instruments, and ESCOs. For each given policy, the study will define its principle and goals, illustrate the generic principle with one or two real case examples, and briefly evaluate its impact according to criteria defined below. This process aims at informing policy-makers on measures currently in use to overcome the financial barrier, and clarify their different success potentials to help identify most appropriate policies for their situation. While this process will clarify the influence of these financial programs, it is always difficult to attribute any observed success to financial measures alone since they are often implemented as part of other measures.
Relevance: The extent to which the policies address the financial barrier to energy efficiency ;
Clarity: The ease with which the policy is understood by actors;
Flexibility: The extent and ease with which the policy can be changed after its initial introduction
Impact and effectiveness: The positive and negative changes produced by a development intervention, directly or indirectly, intended or unintended. The awareness increase among the different actors.
Sustainability: The degree to which the benefits of the policy are likely to continue after the policy has ended. In other words, the study will evaluate whether the market has evolved as a result of the policy or programme implementation26.
26 The criteria were mainly drawn from the OECD policy evaluation criteria from the Development Directorate. The OECD identifies five criteria which are: i- relevance; ii- impact; iii- effectiveness; iv- efficiency; and v- sustainability. Adding to those, the study will also look at the flexibility characteristics of the different instruments, as the author considers that flexibility and room for actors’ innovation is key to ensure long-term success of the policies.
23

Financing Energy Efficient Homes: Existing Policy responses to financial barriers
4.1 Regulation Principle and goals 78. Regulations are state-based instruments which—as their names indicate—regulate actors’ behaviours. They tend to either impose pre-defined standards (i.e. MEPs), or command particular behaviours, such as revealing specific information. Regulations address indirectly the financial barrier by providing information useful for a market creation.
79. The study will focus here on three examples: (i) the EU Directive on the Energy Performance on Buildings; (ii) the UK Building regulation; and (iii) the Californian regulation. It will focus in turn on the cases’ objectives and impact; and then briefly evaluate their strengths or weaknesses.
Examples EU Directive on Energy Performance of Buildings (EPBD) 80. The EU Directive on the Energy Performance of Buildings (2002/9/EC) requires that a general methodology to calculate the energy performance of a building be set at a national or regional level. The methodology should be transparent and should be based on whole building energy performance. It also mandates energy ratings of all buildings at the time of construction, sale or change of occupancy. It plans to adopt thermal regulations for new buildings and major renovations based upon whole-building energy performance (Green Paper, 2005). It requires regular inspections of boilers, heating and air conditioning systems.
81. The overall quantitative targets of the measure are: (i) to reduce European building energy consumption by 10% by 2010 and 20% by 2020; (ii) to provide energy ratings of 2 million existing buildings by 2010; and (iii) to reduce carbon production by 45 million tons by 2010.
82. Thus far the Directive is not fully implemented in the majority of EU Member States but progress has been made. Several Member States including Germany, UK, France, and Denmark, have broadened the scope of their building codes to apply to all building types, include major refurbishments, and include all energy flows, and have also strengthened their minimum energy performance requirements, usually by about 25%. Many new EU Member States previously had no building energy performance requirements and so implementation of the Directive represents a major transition for these countries. The requirement for mandatory building energy certification is a new element for all but a handful of EU states, and it opens the door for many new supporting activities including those related to preferential finance for efficient buildings or refurbishments.
83. Denmark used the implementation of the EPBD directive in 2006 to strengthen its energy performance requirements for all new buildings by 25-30%. At the same time, two low-energy building ratings, class 1 and 2, were introduced. These apply to buildings consuming less than 50% and 75% of the energy respectively of the general performance requirement for new buildings. The low-energy class 2 threshold has been set as the target
24

Financing Energy Efficient Homes: Existing Policy responses to financial barriers for a new revision of the general requirements scheduled to take effect in five years’ time. Furthermore, all existing public buildings must be certified (energy labelled) every 5 years and all savings identified as having a payback time of less than 5 years must be implemented before the next certification.
84. In Germany there is a new requirement to exchange old oil-fired and gas fired boilers with highly efficient new boilers when they pass a certain age. In January 2006 the Portuguese Parliament approved legislation for implementation of the new European EPBD directive. This legislation includes mandatory use of solar heaters in all buildings. The Portuguese implementation is further expected to set a requirement for mandatory improvements of existing buildings of greater than 1 000 m² if the energy certification shows they have a poor energy performance.
UK Energy Efficient Commitments (EEC)
85. The UK implemented Building Regulations at the beginning of 2000. The programme was subsequently updated in 2003 to introduce a higher level of efficiency for boilers.
86. The Energy Efficiency Commitments (2002-2005) are the principal policy mechanisms to achieve reductions in energy efficiency in the building sector, in existing homes. Under this policy, electricity and gas suppliers are required to achieve targets for installing energy efficiency measures in the household sector. These targets do not prescribe how suppliers should attain these improvements. They can achieve their obligations by carrying out any combinations of approved measures (i.e. installing insulation or supplying low-energy light bulbs, high efficiency appliances or boilers)27.
87. The Energy Efficient Commitments promote:
Standards for most aspects of a building's construction, including its structure, fire safety, sound insulation, drainage, ventilation and electrical safety. Electrical safety was added in January 2005 to reduce the number of deaths, injuries and fires caused by faulty electrical installations Energy efficiency in buildings. The changes to the regulations on energy
conservation proposed on 13 September 2005 will save a million tonnes of carbon per year by 2010 and help to combat climate change The needs of all people including those with disabilities. They set standards
for buildings to be accessible and hazard-free wherever possible
Revisions:
On 15 March 2006, Parliament revised building regulations, and raised energy efficiency standards for new buildings. Compared to the 2000 levels, the standards will be raised by 40%, and came into effect on 6 April 2006. The new regulations will also improve compliance by requiring air pressure
testing for new buildings, simplifying the process for calculating energy performance and establishing new competent persons self-certification schemes. To help builders and building control bodies adapt to these changes the
Office of the Deputy Prime Minister (ODPM) has launched the largest ever
27 It has proven to be a very cost effective measure by the National Audit Office (NAO)
25

Financing Energy Efficient Homes: Existing Policy responses to financial barriers
training programme for new building regulations including ‘train the trainer events’, regional road shows and an e-learning pack to be issued to every Building Control Surveyor.
88. Current Energy Efficiency Commitments are expected to achieve carbon savings of around 0.4MtC by 2010, while the next Energy Efficiency Commitments should double this target to about 0.7MtC a year.
California mandatory audits
89. California by contrast has imposed mandatory audits. The Energy Efficiency Building Standards introduced a regulatory framework which lasted for the last 30 years but was revised by the energy commission since the new Governor’s accession to power in 2001. Although they primarily target new buildings, the 2005 Building Standards28 increasingly impact existing buildings by mandating efficiency testing and improvements in existing homes when heating or air conditioning equipment is replaced. The State is committed to further revise these Standards in 2008 and 2011.
90. California has also imposed another regulatory system in the late 1990s which promotes:
Uniform and accurate rating based on a single state-wide rating scale; Estimates on the potential utility bills’ savings; Training and certification procedures for home raters and quality assurance
procedures to promote accurate ratings and to protect consumers; Procedures to establish a uniform reporting system for information on residential
dwellings; Labelling procedures that meet the needs of home buyers, homeowners, renters, and
mortgage lenders 91. Phase 1 of the project was completed in 1999 and created the basic operating framework of the programme including training and certification procedures for raters, and quality assurance procedures, and data collecting and reporting requirements. Phase 2 of the program is still under completion by the Commission. The completion of this program could bring in a time-of-sale information disclosure to improve consumers’ awareness when changing products29.
Evaluation 92. Regulations are relevant to overcome the financial barrier in that they address specific gaps in the market and impose minimum thresholds of performance. They tend to be clearly understood by the different actors since they send simple messages and target a specific need. Typically, the scope and scale of the EU Directive will most probably foster the recognition of standards and infrastructure by private investors who will be able to 28 Building Energy Efficiency Standard: They impose minimum benchmarks on the technologies for insulation, wall paint, fenestration etc. 29 Amongst the most important measure endorsed by the Californian government remains the Green Building Initiative (“GBI”) which is not detailed here due to its scope of application (i.e. state owned buildings, and commercial building gs only)
26

Financing Energy Efficient Homes: Existing Policy responses to financial barriers monetise documented energy and pollution savings. Millions of buildings will be rated and tens of thousands of raters trained and certified to inspect and test a building’s energy performance.
93. On a theoretical level, regulations tend not to be flexible since they address specific needs in the market and are not updated on a regular basis. However, in practice, some regulations end up being quite flexible by imposing results yet allowing flexibility in the means to achieve them. This is the case with the UK Energy Efficiency Commitments which, while providing the advantage of defining clear quantitative targets, maintain flexibility in the means to attain them. As such, Energy Efficient Commitments leave room for innovation and creativity. However, EEC’s fail to encourage over performance by not rewarding actors that over act the targets. This is regrettable, especially in the sense that EEC targets are well set to be met- or even exceeded- by most actors (Defra, 2006). California audits, by contrast, offer a more classic illustration of inflexible regulation.
94. Amongst the main weakness of regulations is their tendency to have only a superficial and temporary impact by rendering behaviours mandatory. Although regulations can have strong temporary impact, if they are not upheld for a consistent time, this impact will remain an illusion and its effects will vanish as soon as the policy ends. As such, the limited scope of regulations both in terms of time and level of application, prevent them from being successful tools in effectively overcoming the financial barrier. The EPBD typically, has been criticised for being too restrained (Ecofys, 2006). Many have argued that it should have been extended to all buildings undergoing refurbishment, not only those bigger than 1,000 square metres. Despite the efforts and successes of Californian regulation, much remains to be done. Over three quarters of California’s homes and apartments (more than 8 million homes) were built prior to the 1982 Building Standards. Although most have been upgraded over time, considerable potential for increasing the efficiency of energy use in California’s older homes remains untapped. Governments’ imposition of mandatory labelling has triggered the increased involvement of the market.
95. When regulations are upheld for a sufficiently long time, they enable a genuine change in the market and can prove sustainable. This is the case for the UK Energy Efficiency Commitments, in that suppliers tend to develop new technologies and behavioural changes to meet the set targets. It is therefore likely that the changes will endure after EEC end. However, on seeing the progression of EEC’s, it is to be hoped that targets can evolve more rapidly instead of waiting for the next phase in 2009. Californian energy audits effectively address the weakness in energy efficiency by imposing common methodologies and requirements, and making audits compulsory. The introduction of early standards in the 1970s has allowed a growing habit in customers and has ensured a lasting impact on the market.
96. Overall, cases show that well adapted regulations can effectively phase out inefficient technologies from the market. By fixing set standards or targets, they send clear and easily understandable signals to the different actors in the market. Regulations’ main draw-back is their incapacity to respond rapidly to potential market evolution: i.e. standards are not readjusted on an instantaneous time frame. Moreover, even when regulations allow room for some flexibility, their inherent nature will disincentivise an
27

Financing Energy Efficient Homes: Existing Policy responses to financial barriers actor to over perform, as regulations have no mechanisms to reward actors who exceed the required performance target. Moreover, regulatory measures alone do not deal with all facets of the financial barrier. Typically, the initial cost barrier for the least resourceful part of the population is not addressed.
97. As a result in some cases countries have turned to direct financial intervention to facilitate the initial shift.
4.2 Grants and Subsidies Principle and goals 98. Grants and subsidies are generally applied when governments consider that the market will not provide the optimal level of energy efficient investments because of access to capital (Malinvaud, 1998). The cases of the UK Community Energy Programme and Warm Front Programme, as well as the Danish energy authority agreement regarding double glazing, are perfect illustrations of such principles.
Examples Warm Front Programme 99. The Warm Front Programme launched in the UK in 2000 is a typical illustration of a public loan. The programme was designed to provide grants to households with dependent children or the elderly. It provides an envelope of GBP 50 million and has had moderate impact as it has saved 0.4 MtC since its implementation.
100. The Community Programme, on the other hand, is aimed at the development of a sustainable market for community heating in the UK. It was launched in 2001 and is due to end in 2007. The budget was GBP 50 million and was provided by Defra. So far it has saved 0.2 MtCpa.
101. The UK has also put in place another grants programme specifically oriented towards part of the population which is least likely to have any money to spend on energy efficiency refurbishment. It is the Decent Homes Programme, which aimed at making all social homes decent by 2010. The programme is set to run from 2000 to 2010. The target was fixed on the 1.6m identified social homes that were tagged non-decent. Out of those, over 1.3 m will require improvements to their insulation to meet the threshold. It saved about 0.05 MtC pa so far, which is relatively positive, bearing in mind the objective.
Danish Energy Authority
102. In 2004, the Danish Authority concluded an agreement with the glass industry, window producers, and installers, to phase-out traditional double-glazing over a three-year period and to improve window solutions in general. The industry promised that the share of high-efficiency glazing should increase from less than 70% in 2003 to more than 90% in 2006. The remaining 10% represents the windows in unheated buildings or in places where there is no need for efficient glazing. After the phase-out, highly efficient windows with low-energy double-glazing, or better solutions, are to be used.
103. The Government provided subsidies for an information campaign, development of
28

Financing Energy Efficient Homes: Existing Policy responses to financial barriers efficient window solutions and a voluntary labelling scheme. Today, most windows are labelled and energy efficient windows are gaining market share.
Figure 3: Energy efficient windows market share for low-energy glazing
0% 20% 40% 60% 80% 100%
2003
2004
2005
2006
Actual Share
Share during public/privateincentive programme
IEA, 2006
Evaluation 104. Grants and subsidies programmes are relevant in overcoming the financial barrier to the extent that they directly fill an immediate financial gap and allow at least a temporary shift in the market. Figure 3 above illustrates the direct impact that subsidies and grants can have on a market. Moreover, by specifically targeting a given gap in the market, and directly responding to it, grants have the advantage of sending a clear message to actors in the market. As such, they usually have a very strong impact, as demonstrated by the Danish case wherein more than 70% of the market complied with the programme offered by the Government.
105. This said grants also have the limits of their advantages: by offering immediate solutions to specific needs, grants tend not to have a long lasting impact on the market. Although the market will generally pick up during the life of the programme, it will come down as soon as the programme ends. Only parallel training and awareness campaigns palliate such shortcomings. The Danish example is a good illustration of such principle: by adequately training the suppliers and consumers at the same time as the grants, they have allowed a sustainable impact of the governmental grant programme.
106. In addition to this potential shortcoming, grants have often been criticised for their lack of flexibility. As it is, it is in subisidies’ nature to be narrowly targeted and to call on specific criteria for projects to obtain loans. This excessive narrowness has been criticised by some as leading to small suppliers and manufacturers to fail getting some loan application because they do not have the time or resources to fill in a grants proposal
29

Financing Energy Efficient Homes: Existing Policy responses to financial barriers appropriately. There is a need for clarification (Dutruge, 2006).
107. Overall, then, grants programmes will prove particularly efficient in dealing with short term financing needs. However, unless coupled with adequate training and awareness programmes, they will not usually have a lasting impact on the market, nor will they be able to adapt to changing needs of the market.
4.3 Fiscal measures Principle and goals 108. Fiscal schemes are publicly defined financial incentives which aim at encouraging actors to implement more EE investments. By providing fiscal cuts or reimbursement, through fiscal credit, governments thus seek to promote energy efficient use. Many countries—France, the Netherlands, or the US—have used this tool with varying degrees of success.
Examples France 109. From 1974 to 1992, France implemented different fiscal measures to incentivise energy efficiency refurbishments in buildings. These measures, however, did not have the expected outcome. The measures’ disappointing results were mainly caused by its broad scope, which was said to encourage the rebound effect (Martin, 1998).
110. Consequently, a more recent fiscal scheme implemented after the 2000 “Plan Climat”, was designed in a way that factored in initial shortcomings. It defined very clearly (and narrowly) the retrofitting measures which could benefit from fiscal credit. The Plan Climat sets as a national objective to reduce CO2 emissions by a factor of four by the year 2050. The plan identifies energy efficiency as a major means of fulfilling these objectives and as such, the Government has introduced financial incentives to promote energy efficient projects. The ‘Crédit d’Impot’ or tax credit has emerged as the major tool for this action plan.
111. The French tax credit—like other fiscal instruments—is based on the assumption that everyone should be given incentives to invest in energy efficiency. As such, even individuals not paying any tax will be rewarded for implementing energy efficient refurbishment measures (i.e. will receive money in compensation).
112. The tax credits were formally adopted in law through the 2005 Finance Law. Overall, the measure involves the following credits:
For efficient boilers, insulation and energy meters tax credit
is 25% of the investment value; For efficient heat pumps or renewable appliances, tax relief
at 40% of the investment value (i.e. increased from a former value of 15%)
113. To benefit from the credit, the new (or renovated) installation needs to meet pre-determined energy efficiency benchmarks, defined by the government and available to customers when applying for the tax credit. There is a limit to the total amount that can be considered for tax credit set at EUR 8 000 per person per fiscal year.
30

Financing Energy Efficient Homes: Existing Policy responses to financial barriers
Figure 3: Illustration of an individual applying better insulated glazing
MIES, 2005
Operation Costs 3 000€ (taxes included) Of which: material costs 1 300€ (taxes included) Since tax credit only applies to material costs Tax credit rate for glazing 15% Total tax credit 1 300€ x 15% = 195€ Net cost for the individual 3 000 – 195 = 2 805€
California 114. The Federal Energy Policy Act of 2005 provides 2006-2007 tax credits to homeowners for specified efficiency improvements. The credit is 10% of the improvement cost, up to a two-year cap of USD 500. Incentives are also provided for major upgrades in existing commercial buildings made between August 2005 and December 2007.
Evaluation
115. Fiscal incentives are relevant indirect financial tools in that they specifically target the liquidity barrier. They aim to create demand from the market through financial incentives on energy efficient refurbishments. As such, they offer significant flexibility since the market is responsible for creating the adequate tools to respond to the demand increase. By creating less direct financial incentives rather than grants (i.e. not a direct intervention), fiscal schemes leave more room for market transformation and creativity, thereby increasing sustainability rate.
116. However, fiscal incentives often lack the adequate clarity to be understood by all actors in the market. Even when they do understand the basis of the fiscal benefit, actors will often face a lack of information on the means to implement the scheme. Moreover, fiscal measures need to last a long time to make sure the market has time to adjust and has created adequate, long lasting tools.
117. In the specific French example, the scheme is too recent to evaluate effectiveness. Although the implementation of this measure is too recent for an impact evaluation, ADEME has been overwhelmed by the number of phone calls and demand for applications received since the initiation of its marketing campaign “Faisons vite, ca chauffe!” (Act fast, its getting warm!).
118. This said, it is unclear how the measure will be able to avoid the free-riders problem. Moreover, the policy still fails to address the challenge presented by the least resourceful members of the population, who will still be unable to fill in the extra cash provision.
31
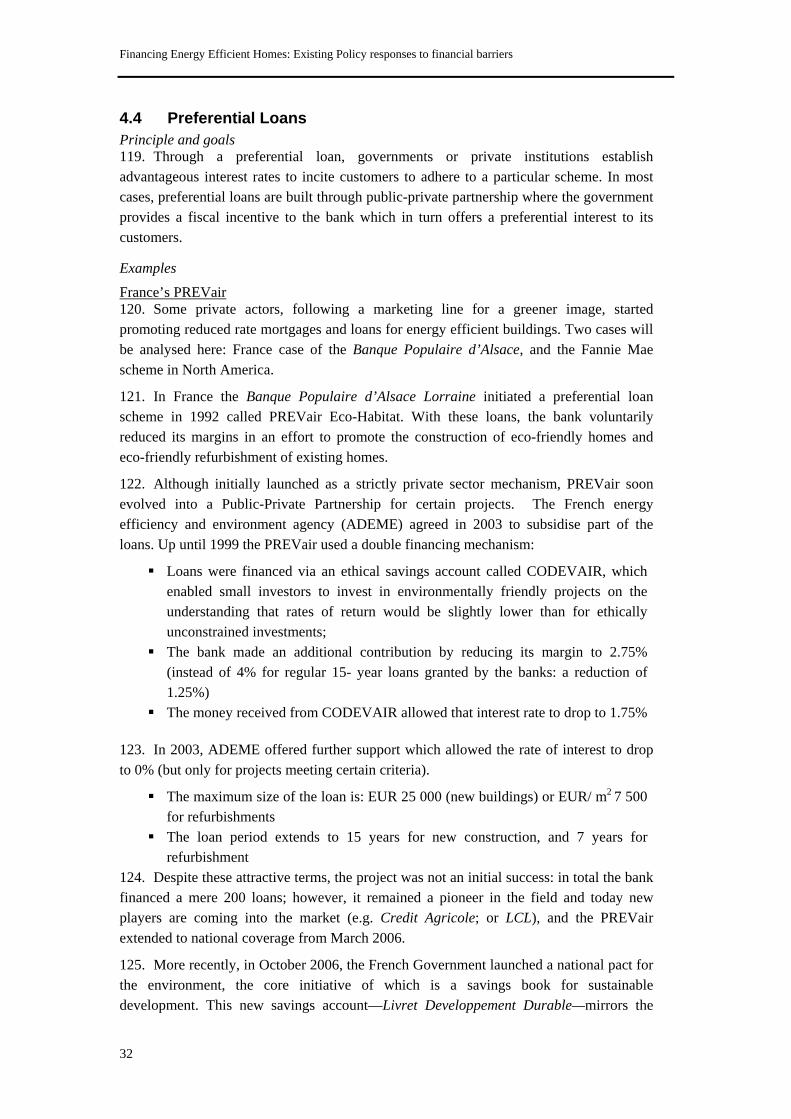
Financing Energy Efficient Homes: Existing Policy responses to financial barriers 4.4 Preferential Loans Principle and goals 119. Through a preferential loan, governments or private institutions establish advantageous interest rates to incite customers to adhere to a particular scheme. In most cases, preferential loans are built through public-private partnership where the government provides a fiscal incentive to the bank which in turn offers a preferential interest to its customers.
Examples
France’s PREVair 120. Some private actors, following a marketing line for a greener image, started promoting reduced rate mortgages and loans for energy efficient buildings. Two cases will be analysed here: France case of the Banque Populaire d’Alsace, and the Fannie Mae scheme in North America.
121. In France the Banque Populaire d’Alsace Lorraine initiated a preferential loan scheme in 1992 called PREVair Eco-Habitat. With these loans, the bank voluntarily reduced its margins in an effort to promote the construction of eco-friendly homes and eco-friendly refurbishment of existing homes.
122. Although initially launched as a strictly private sector mechanism, PREVair soon evolved into a Public-Private Partnership for certain projects. The French energy efficiency and environment agency (ADEME) agreed in 2003 to subsidise part of the loans. Up until 1999 the PREVair used a double financing mechanism:
Loans were financed via an ethical savings account called CODEVAIR, which enabled small investors to invest in environmentally friendly projects on the understanding that rates of return would be slightly lower than for ethically unconstrained investments; The bank made an additional contribution by reducing its margin to 2.75%
(instead of 4% for regular 15- year loans granted by the banks: a reduction of 1.25%) The money received from CODEVAIR allowed that interest rate to drop to 1.75%
123. In 2003, ADEME offered further support which allowed the rate of interest to drop to 0% (but only for projects meeting certain criteria).
The maximum size of the loan is: EUR 25 000 (new buildings) or EUR/ m2 7 500 for refurbishments The loan period extends to 15 years for new construction, and 7 years for
refurbishment 124. Despite these attractive terms, the project was not an initial success: in total the bank financed a mere 200 loans; however, it remained a pioneer in the field and today new players are coming into the market (e.g. Credit Agricole; or LCL), and the PREVair extended to national coverage from March 2006.
125. More recently, in October 2006, the French Government launched a national pact for the environment, the core initiative of which is a savings book for sustainable development. This new savings account—Livret Developpement Durable—mirrors the
32

Financing Energy Efficient Homes: Existing Policy responses to financial barriers principle of CODEVAIR: it is tax free and will be dedicated entirely to environmental and technological innovation. The maximum threshold for the CODEVI is EUR 6 000 (vs. previous EUR 4 600). Such a scheme is expected to raise up to EUR 10 billion30. Unlike CODEVI however, the new scheme can only be used to finance individuals’ environmental projects such as energy efficiency or renewable projects.
126. With the recent implementation of the EU directive on EPBD (i.e. in July 2006 energy accounts for all selling will be made mandatory; and in July 2007 they will be mandatory for renting as well), one can expect a growth in such initiatives: the banks are increasingly aware of the huge potential of the market31.
Germany’s KfW 127. Yet another financial mechanism was initiated in Germany in 1996 with the introduction of the Kreditanstalt fur Wiederaufbau (“KfW”) preferential loans using money from the former Marshall fund. KfW is a public bank owned jointly by the Federal Government and the Laender. In 1996, KfW launched a set of preferential loans to finance energy efficiency projects through a double-edged mechanism:
Public tax exemption for all money invested in efficiency projects; Coupled with direct public subvention;
128. The maximum amount of money distributed by loan is: EUR 35 000 (new buildings); 80 to EUR/ m2 250 000 (refurbishment). Repayment period from 20 to 30 years;
129. Overall KfW loans have been a big success: from 1996 to December 2004, they provided over 330 000 loans spread over 850 000 buildings. Some 95% of those loans were for refurbishment not construction. For the year 2004 alone, these loans amounted to a total of EUR 4.42 billion.
Australia’s Maleny Credit Union Loan 130. In 2002, the Maleny Credit Union (MCU) launched a home loan directly aimed at promoting energy efficiency investments. The loan offers a competitive interest rate for homes that meet five predefined criteria. The “Cool Home Loan” has been developed in conjunction with the Queensland Conservation Council as part of the Cool Communities initiative. The interest rate offered is 7.45% p.a. compared to a usual interest rate of 7.49% p.a.!
USA’s Fannie Mae 131. Since the late 1970s, the secondary mortgage market in the US has recognised that savings achieved through energy efficiency reduce monthly housing costs. Fannie Mae has formally accounted for these savings in its underwriting guidelines by allowing underwriters to stretch both front-end and back-end debt-to-income ratios by 2 percentage
30 Government has also fixed a new target times four for social houses. 31 This being said, a previous programme launched by the French Government in the 1990s, has proven ineffective due to an excessive amount of free riders (Martin, 1997). This time, the loan was designed such that the caveat was avoided.
33

Financing Energy Efficient Homes: Existing Policy responses to financial barriers points. Loans that allow for this stretch are called Energy Efficient Mortgages (EEMs).
132. All homes that are built to the Council of American Building Officials Model Energy Code (MEC) can qualify for an EEM. Since an ENERGY STAR Home is defined as 30% more energy efficient than a home built to the MEC, it exceeds the minimum requirements for EEMs and therefore automatically qualifies for the stretch. Primary lenders offer ENERGY STAR Home buyers the terms of the secondary market EEM coupled with the additional feature(s) they have chosen for their ENERGY STAR Mortgage.
Japan’s Government Housing Loan Corporation (GHLC)
133. For houses with a floor area less than 2 000m², standards for energy conservation for houses are used as a voluntary target with financial incentives offered by The Government Housing Loan Corperation (GHLC). The GHLC offers a long-term and fixed interest rate loan called “Flat 35” whose loan limit is 80 million yen for construction of energy conservation houses. Conditions of the loan depend on the quality of houses and energy conservation performance of houses is one of items to be evaluated. All the houses applying to the loan have to at least meet the 1980 thermal insulation standard. For houses which fulfil the 1992 standard, the amount of loan is expanded by 1 million yen. The standard set by the Energy Efficiency Law is indispensable to evaluate the energy conservation performance of houses. Furthermore, for houses which meet the 1999 standard, the amount of loan is expanded by 2.5 million yen and interest rate is lowered by 0.3% for the first 5 years.
134. The typical framework of the loan is explained below. Owners of houses who wish to take out a loan for their houses need to apply to financial institutions with certification of housing quality in hand. These are issued by independent verification facilities. After lending to owners of houses, financial institutions transfer the loan bonds to the GHLC. Financial institutions get paid in return of loan bonds from the GHLC, who issue mortgage-backed securities to investors. Investors are paid back, with interest accruing from loan and principal which they have invested. The Japanese government secured the budget of YEN 10 bn and YEN 30 bn to finance the GHLC in 2005 and 2006 respectively.
Figure 4 Framework of mortgage-backed securities
Owners of houses Application
to FLAT 35 Loan bond transfer GHLC Issue of
MBS Investors
Financial
institution
App
licat
ion
of
verif
icat
ion
I
ssue
of
ve
rific
atio
n
Verification f
Payment Payment
of
Payment of Source: Government Hous
34
Return of principal
Receipt of fund
acilities Entru
stm
ent
loan
bon
ds interest and
principal
Security for MBS
Transfer of principal
ing Loan Cooperation homepage

Financing Energy Efficient Homes: Existing Policy responses to financial barriers Evaluation
135. By calling both on public and private sector concurrently, public-private partnerships combine resources and push the market to adapt while public aid is still ongoing. As such, public-private partnerships tend to be sustainable since they tend to foster a genuine market transformation. Although they do not offer much flexibility in the targets on which they apply, they allow much flexibility in the tools to be applied by the private sector. To the extent that they target specifically the initial cost barrier to more energy efficient homes, preferential loans are very relevant in overcoming weak energy efficient buildings.
136. The combined efforts of both the public and private sector tend to affect customers’ awareness greatly. However, preferential loans schemes have tended to be criticised for being unclear. Currently, the main criticism against public-private partnerships and preferential loans remains that no wide-scale scheme has proven effective on a wide national scale. Moreover, genuine market transformation will only take place when demand is really created, it is questionable to what extent demand does not remain artificial when it is only created by public incentives. Amongst the key findings on preferential loans’ evaluation is the benefit of public-private partnerships, and of combining resources and methods.
4.5 Soft instruments Principle and goals 137. Soft instruments traditionally refer to non-regulatory measures which are less interventionist than those seen before. These measures typically include:
Training programmes;
Awareness campaigns; and
Information disclosure programme through labelling.
All of these measures are targeted at the financial barrier, although they do not do so directly. They build awareness of energy efficiency measures, and as such contribute to market creation by fostering demand.
Examples Training 138. In 2001, the Australian Greenhouse Office launched the GreenPlumbers initiative. Merging together Local Governments, community, and Industry, the GreenPlumbers are promoting more environmentally sustainable appliances. The programme aims at training both plumbers and customers.
139. The first training programme focused specifically on ways to reduce hot water heating energy consumption. In Victoria, Tasmania and South Australia, hot water heating accounts for 28% of total household greenhouse gas (GHG) emissions, and 27% of total energy use. Plumbers undergo eight hours of training which introduce them to such issues as climate change, alternative energy sources, energy star labelling scheme, and the means to present new products to customers. Since its implementation in 2001, the programme
35

Financing Energy Efficient Homes: Existing Policy responses to financial barriers has trained over 3800 plumbers across Australia, representing over 1800 plumbing businesses across six states. (GreenPlumbers, 2005)
140. Eléctricité de France (EdF), the French national electricity supplier has developed numerous programmes to promote energy efficiency both within and outside the firm. The introduction of white certificates and obligations has rapidly been transformed by the supplier as a business opportunity (Urovas, 2006).
141. EdF has launched an internal and external awareness programme on energy efficiency. Realising that most of its employers did not perceive the opportunities of energy efficiency, EdF launched an internal training programme. Today, internal awareness levels have risen tremendously. The supplier also tries to position itself as the national expert on energy efficiency, attempting to be consumers’ point of reference in case of energy efficiency queries. This training capacity is fuelled through intensive research in R&D.
Awareness campaigns
142. Awareness Campaign: the Carbon Trust launched a GBP 4 m campaign to raise businesses’ awareness of climate change and energy efficiency measures. The campaign was divided in two streams (i) ‘Lifeblood’ campaign which targeted the SMEs; (ii) the ‘Thank you’ campaign targeted at larger enterprises. The latter enabled the Carbon Trust to advise over 200 businesses, including 20% of the FTSE 100. Though the direct impact of this campaign has not been measured, the number of business clients of the Carbon Trust last year increased eight fold.
Labelling
143. As a result of the Directive on Buildings, several European countries are obliged to label the building at the time of the sale.
Box 5: Different House Labelling
Japan
USA
European Union
36

Financing Energy Efficient Homes: Existing Policy responses to financial barriers 144. In Japan, building logos were introduced as means of certification of EE building envelopes (figure 5). A logo is attached for houses which have undergone evaluation in their design-stage or for existing houses which have also undergone evaluation. The evaluation is performed for thirty items in ten categories, including energy conservation performance by designated independent facilities.
145. Thermal insulation and air-tightness are among items to be evaluated by the performance evaluation system. As for thermal insulation performance, houses are categorised into four classes based on the thermal insulation standards. Anyone can identify the relevant performance by checking evaluation results performed on purchase of the houses.
Figure 5 Logos to indicate the implementation of performance evaluation of houses
Source: IEA Workshop Energy Efficiency in Buildings: Meeting the G8 Gleneagles Challenge
Figure 6 Ratio of houses with performance evaluation performed
Source: IEA Workshop Energy Efficiency in Buildings: Meeting the G8 Gleneagles Challenge 146. Fig.6 shows the ratio of houses which have taken evaluation in the past five years. Ratio of houses for which performance evaluation has been carried out has risen in the five-year period. This figure generally shows that the public awareness to housing quality has increased accordingly, even though not all the awareness concerns energy conservation performances.
Evaluation
147. Although soft instruments are not directly aimed at overcoming the financial barrier, they contribute to it by presenting an indirect means by fostering demand. As such they
37

Financing Energy Efficient Homes: Existing Policy responses to financial barriers make a relevant contribution to overcoming the financial barrier. They have a great impact downstream/upstream. They significantly contribute to raise customers’ awareness and tend to have a real impact in their motivation. They send clear messages and are easily understood by customers. Further, in the case of labelling information, they help to clarify the situation by providing information to customers. However, they are not very flexible in the sense that they do not possess internal mechanisms which adapt to the evolution of the market and the response from consumers. Overall, labelling has proven very efficient when combined with other policies.
148. Soft instruments fill an important gap by dealing with the crucial lack of adequate energy efficient competence which otherwise prevents the creation of an autonomous energy efficient market. As such, they introduce long term sustainable tools and contribute to smooth the way for private investors. Despite their strong willingness to contribute to the change, suppliers today still believe that major efforts are needed from governments to encourage a rise in demand.
149. This said, the effectiveness of soft instruments such as labelling is still weakened by the absence of an international standard which would impose common methods and presentation for labelling. As a result, although some are user friendly, others are not at all. Box 5 (above) illustrates the varieties of energy labels.
4.6 ESCOs /3rd party financing Principle and goals 150. The basic role of an ESCO is to provide energy efficiency services to consumers, such as project finance, engineering, project management, equipment maintenance, monitoring and evaluation. An ESCO generally performs any or all of the following services: auditing, developing packages of recommended measures, arranging financing, installing or overseeing installation of measures, resident and staff education, equipment commissioning, maintenance, measuring, verifying, and guaranteeing savings.
151. These are usually made through Energy Performance Contracts (or “EPC”), which are self- reimbursing loans (i.e. that are repaid through savings). Figure 4 (below) describes the basic mechanism of an ESCO.
38
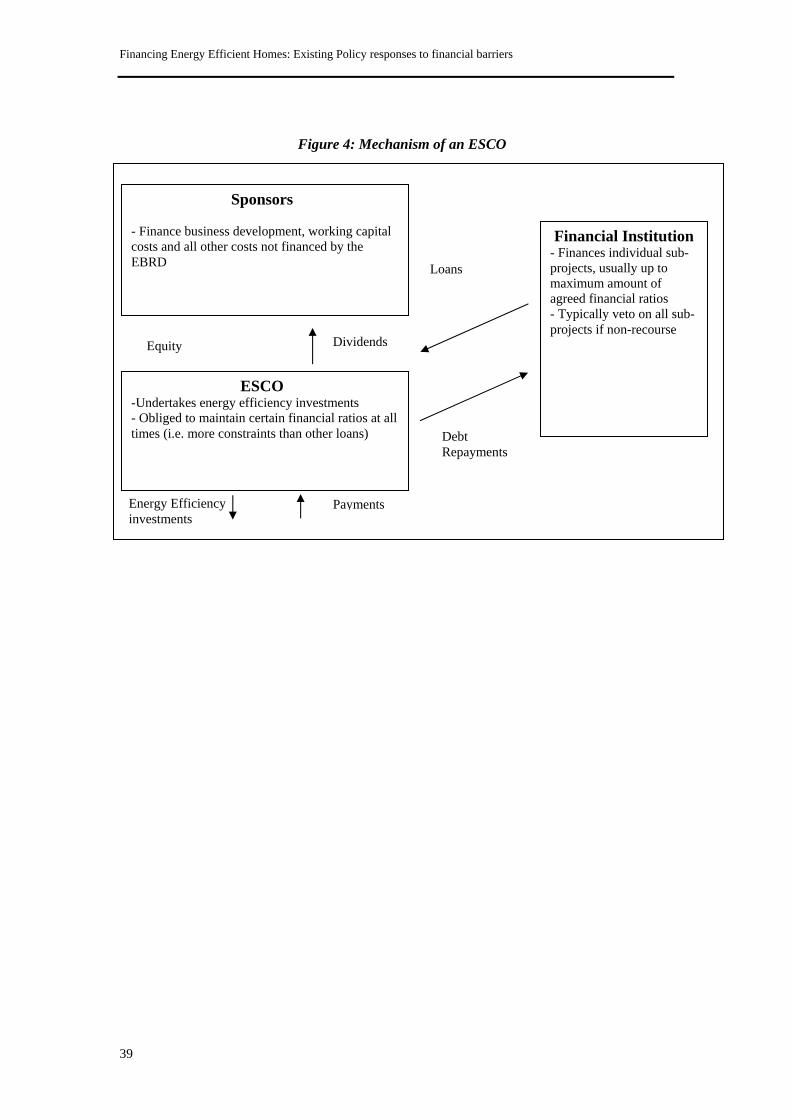
Financing Energy Efficient Homes: Existing Policy responses to financial barriers
Figure 4: Mechanism of an ESCO 152.
Loans
Financial Institution - Finances individual sub-projects, usually up to maximum amount of agreed financial ratios - Typically veto on all sub-projects if non-recourse
Equity
ESCO -Undertakes energy efficiency invest- Obliged to maintain certain financitimes (i.e. more constraints than othe
Energy Efficiency investments
Sponsors - Finance business development, working capital costs and all other costs not financed by the EBRD
39
Dividends
s
Debt Repayments
ments al ratios at all r loans)
Payment

Financing Energy Efficient Homes: Existing Policy responses to financial barriers
Energy Alliance
153. The Energy Alliance in Ukraine is an ESCO example financed by the EBRD. It was the first privately owned Ukrainian ESCO of which the majority was owned by a private equity fund established by US Congress to support regional development. The rest of the ESCO is owned by a glass manufacturer and a local engineering firm. EBRD financed USD 5 million in eight years through loans, while USD 5 million was syndicated for six years through RZB. The ESCO focused on leasing small (1-4 MW) co-generation and electricity generation engines to industrial clients. The assets are transferred to the clients at payout, enabling the client to benefit from 100% savings. The first sub-project to be financed was a producer of sunflower oil32.
154. Amongst the countries to develop ESCOs, Hungary seems the most mature market through its regulation environment, legal and budgetary independence of its cities, allowing for smooth regulation on ESCO work, increases in fuel oil prices, gas sector privatisation, differences in VAT rates and a liberalised energy markets.
Seven
155. Other examples of successful ESCOs include: the Czech Association of Environmental Technology SEVEn, which has developed a model procedure for applying the Energy Performance contracting to the public sector. The aim was to support the installation of energy efficient equipment in public sector buildings. ESCOs have been developed for upgrading heating and hot water systems in hospitals and schools. In the Bulovka Teaching Hospital, four energy conservation measures were taken in September 1995. These include switching the existing central heating system to district heating, implementing a new energy management system, installing a new air handler recovery system and converting and upgrading to a new high energy efficiency natural gas boiler. Total costs of these measures amounted to about USD 2.7 million, producing energy savings of about USD 700 000, corresponding to a four-year payback.
Evaluation
156. Although ESCOs have an important role to play in terms of consultancy and as a service provider, they are often regarded as a comprehensive solution for energy efficiency problems (Sturn, 2006). They can have a major impact on the uptake of energy efficiency by filling the gap between energy specialists and financiers, but they cannot perform all the roles—such as auditor, certifier, financier, consultant etc.
157. ESCOs are typically not always capable of bearing the financial needs of a project. They tend to lack sufficient equity capacity to endure the risks and uncertainty of an energy efficiency project. As such, they often end up having to team up with a large public fund, and assume the role of energy adviser and expert of the deal. ESCOs are no silver bullet. However, they have a pivotal role in bringing energy efficient progress to the attention of bigger financial institutions (Sturn, 2006).
158. Nevertheless, ESCOs remain powerful tools in terms of impact, relevance and
32 From an EBRD presentation at the IFC conference in London in October 2005
40

Financing Energy Efficient Homes: Existing Policy responses to financial barriers clarity. Their energy expertise allows them to fill in perfectly the liaison role and help them get the attention of major financial institutions.
159. ESCOs are a powerful tool to address some financial barriers of energy efficient projects. The projects’ relative small size—which has often been described as a downturn for private investors—can be successfully addressed through an ESCO that will bundle several similar projects of a small size, and make them more attractive for investors. ESCOs should thus work towards the creation of more region-wide ESCOs (i.e. one for Central Europe) to get increased attention from large institutional investors.
160. The difficult standardisation of the projects, however, sometimes makes it impossible to bundle them together, especially in the building sector. As such, the relatively high transaction cost of small projects can remain a problem. In addition, many institutional obstacles still hinder ESCOs full empowerment. The complete elimination of energy price control would be an important first step. Similarly, regional uniformisation of tax systems would help, as it would ensure that the energy provided by ESCOs is taxed at the same rate as national energy supplier. More importantly, ESCOs should never be seen as silver bullet to overcome the financial barrier: in the best circumstances they can help address the high transaction costs issues of EE. They can address initial cost barrier, however, they are no solutions to smaller projects difficulties, nor do they ensure that financiers will be better trained.
4.7 Revolving Fund Principle and goals 161. A revolving fund can be an alternative or a complement to an ESCO. A revolving fund offers loans which can be repaid with the extra cash available due to energy savings. The repaid loans are used to finance new energy efficiency projects.
Examples
Lithuanian Energy Efficiency Housing Pilot Project EEHPP
162. The EEHPP ran from 1996 to 2001, but the Lithuanian government transformed the repaid loans into a revolving fund, which became operational in 2001. The aim of the fund is to facilitate energy efficiency improvements in the residential and public sectors. Funding comes from the Lithuanian government, the World Bank, the Danish Ministry of Housing and Urban Affairs and the Dutch Ministry of Economics. Within four months, energy efficiency measures were implemented in more than 200 multi or single-family buildings. Projects concern new heat substations, window replacement, roof insulation, and wall insulation. The official objective of the fund is: (i) to develop and maintain housing infrastructure by stimulating private initiatives; (ii) to achieve greater energy efficiency through demand side activities; (iii) to develop private sectors; and (iv) to introduce long-term affordable financing schemes.
The European Dexia-Fondelec Energy Efficiency and Emissions Reduction Fund 163. This fund was started in 2000 and will run until 2010. It is funded by Dexia-Public Finance International Bank, FondElec Group, and EBRD. The purpose of the project is to
41

Financing Energy Efficient Homes: Existing Policy responses to financial barriers invest directly in energy-efficiency driven companies and projects, primarily in Central and Eastern Europe. The Bank will initially invest EUR 20 million. If the Fund meets the required EUR 100 million (the fixed target), an extra EUR 10 million might be provided by the Bank and will be used as a co-investment with the Fund. The Fund’s objectives are two fold: (i) to develop energy efficiency sector with macro- and micro-economic benefits for all consumers of energy; (ii) to increase the participation of the private sector in the renewal of infrastructures. The Fund’s financing of ESCOs will provide a commercial means to improve energy infrastructure without the additional debt burden. The Fund will supplement the Bank’s financing capability in the sector and will encourage the creation of co-operation between the public and private sectors. The project also includes the establishment of the first commercial investment vehicle that facilitates the distribution of carbon credits to shareholders through investment in energy-saving projects.
Evaluation
164. Revolving funds are relevant in the sense that much like grants or subsidies, they have a direct and clear impact by specifically addressing the issue of the lack of liquidity. Their straightforward application allows them to have a strong, yet temporary, impact on the financial barrier issue. Their current state, however, means that although their effect is immediate, there are no mechanisms in revolving funds aimed at sustainable progress. Revolving funds are relevant to implement specific changes, however they do not contribute to long term market transformation,unless it lasts for so long that sustained stable demand will have been created. Revolving funds do not call for any particular innovation from the market.
165. Overall, revolving funds are of great use when combined with other tools which are more focused on market creation or have sustainability as a core goal. Public financial incentives can significantly promote funds; i.e. tax credits; tariffs; depreciation; and mandated audit which all improve a fund’s market. Governments should seek to impose lower interest rates rather than average market rates to attract clients and/or other incentives for potential customers, such as project development support.
4.8 White Certificates Principle and goals 166. The core principle of white certificates is to impose efficiency targets on energy suppliers. Several countries—France, UK, Italy, and Australia—have adopted the principle. Yet all countries have different scenarios in cases of non compliance. Attributing direct responsibility to a specific actor allows influencing the market evolution by artificially creating offer.
Examples
167. According to the Directive of the European Parliament and of the Council, White Certificates are to be issued by independent certifying bodies. This process allows validating the savings claims made by actors through energy end-use efficiency measures.
168. In the French case, white certificates give way to a trading market place wherein actors not able to fulfil their obligations can buy energy certificates from other actors. In case of non-compliance of the constrained actors, the fine to be paid by suppliers is EUR
42

Financing Energy Efficient Homes: Existing Policy responses to financial barriers 2cts by kWh, which by default corresponds to the maximum price that white certificates will reach. In France, white certificates have been specifically introduced to improve existing buildings.
169. Though only suppliers receive obligations, others can apply for White Certificates:
Needs to be additional (i.e. more than what would have happened in BAU) Threshold of 1 GWh Pre-validation for constrained actors State delivers the certificate
170. The objective is set at 54 billion kWh (0.8% of the consumption). The principle is to create a market by creating demand through the obligations.
171. In Italy the scheme was implemented in early 2005, with targets defined for up to 2009. Trading was allowed to start at the end of 2005.
172. The UK scheme—by contrast to the French and Italian schemes—consists in target obligations without a market creation, or the possibility to trade the energy savings made.
173. Denmark offers an illustration of what UK obligations expansion to trading could lead to. The country has only recently allowed distribution companies to trade obligations between them (Defra, 2006). If one company achieves savings greater than its obligations, it is allowed to sell its excess to another company that has saved less then its obligation. The price at which these savings are traded would be determined bilaterally between the two companies. This scheme will allow companies to specialise in efficiency efforts for a given customer class or sub-class (IEA, 2006).
174. The Energy Efficiency Commitments (EEC) in the UK requires Distribution Network Operators (DNO) with more than 50,000 customers to achieve a total of 130 “fuel standardised lifetime discounted terawatt hours” for 2005-2008. Although the transfer of all or parts of the commitment to another DNO may be allowed as long as the Ofgem is notified and approves, there is no market for energy efficiency. The value of improving energy efficiency is therefore determined by cost and sanction.
Evaluation
175. Although most of these examples are too recent to be evaluated, the generic principle of white certificates seems most relevant in addressing the financial barrier. By imposing obligations on suppliers, and a subsequent punishment in case of non-compliance, yet leaving the market free to chose its solution, white certificates trigger creative market responses. It imposes its will on the market to find an adapted solution to meet the obligation.
176. As such, it presents a useful public-private partnership, different from preferential loans, but which offer the similar advantage of combining public and private resources to find the best solution.
177. In the French case, it is too early to judge the result of the policy. However, many actors have expressed their interest in producing white certificates.
178. Any conclusion on effectiveness of the scheme would be premature. However, it
43

Financing Energy Efficient Homes: Existing Policy responses to financial barriers appears that it could prove very effective in decreasing overall carbon emissions (depending on the baseline). It seems that it can be useful for fuel-poor who are targeted by the scheme. Moreover, in the UK, manufacturing skills, that could later be exported have been developed as a result.
179. The fact that there is no baseline however contributes to the uncertainty of the net reduction of supply. This shortcoming could typically be solved by a certificates scheme. Customers might fall for the ‘Rebound Effect’ which is to consume more energy as its marginal costs are lowered.
44

Financing Energy Efficient Homes: Existing Policy responses to financial barriers
5 SUMMARY AND CONCLUSION 180. Existing residential buildings in the OECD area represent a huge potential for energy savings (IEA, 2006a). Despite the sound financial sense of investment in commercially-viable energy efficient technologies, buildings continue to be less efficient than they could be. Numerous barriers explain the absence of an independently growing market for energy efficient investments. Figure 5 surveys the policies, instruments and programmes to surmount financial barriers to household efficiency, as previously examined in Section 4.
Figure 5: Summary table of policy evaluation
Relevance Flexibility Clarity Impact SustainabilityRegulationGrantsFiscal MeasuresPreferential LoansSoft InstrumentsESCOsRevolving FundsWhite Certificates N/A N/A
181. As illustrated, no single measure has been able to successfully meet all criteria. The analysis and evaluation of the different examples in the study lead to several conclusions.
Multi-policy packages
182. First, policies or programmes targeting separate aspects of the financial barriers are not sustainable. While isolated grants may demonstrate the direct and temporary market benefits of purely financial policy, such measures will not work upstream to create an autonomous market for energy efficient buildings.
183. Only policy packages addressing multiple facets of the financial barrier simultaneously will endure. The example of the Danish Authority’s multi-pronged policy package illustrates this global approach to financial barriers. While paying customers to purchase energy efficient boilers, the Danish Authority launched concurrent campaigns of information, labelling, and training programmes, to genuinely transform the market.
184. Examination of Australian policy packages reinforces the lessons of this Danish example: policy packages—aiming simultaneously at the lack of training, the nature of the financier, and the comprehension of the customers—have proven more successful than isolated measures in the long term.
Public-private partnerships 185. Public-private partnerships offer one of the best opportunities to meet the five evaluation criteria: relevance, flexibility, impact, clarity, and sustainability combined. Public-private partnerships enable measures to address different facets of the financial
45

Financing Energy Efficient Homes: Existing Policy responses to financial barriers barrier concurrently, and amplify policies’ effects on the market by combining the force of public and private sector actors.
186. Public- private partnerships such as PREVair and KfW have proven more successful than isolated grants for sustainable change. The Fannie Mae case is an example of demand creation by a small adjustment to classical loans due to the understanding of energy efficiency specificities; here on customers’ credit capacity.
Creating a market 187. The overall increase of residential buildings’ efficiency will require the creation of a market for energy efficiency; such markets today remain very rare. The given weak demand for energy efficiency requires few providers. Enlivened demand and actors’ competence in energy efficiency would strengthen markets (Urvoas, 2006). Soft instruments, such as labelling, training, and information would further spur demand for energy efficient residences.
188. Broad and sustained market transformation requires the creativity and resources of private actors. However, evidence suggests they will not enter the market in the present context. The uncertainties around energy savings’ evaluation and the appropriate discount rate discourage private investments in energy efficiency.
Strong political will 190. As revealed in multiple case studies, such private sector involvement requires strong political will to establish more favourable grounds for investments in energy efficiency. Notably, this could imply an international plan of action to establish a common international framework of evaluation for energy savings. As the study has underlined, private actors are still discouraged by the uncertainty surrounding evaluation of energy savings. Although fears of hidden costs have been dispelled, the absence of a set international framework of evaluation–which would settle issues such as the discount factor, or the proper method of quantification for energy efficiency’s ancillary benefits - still sap investors’ confidence.
189. The systematic imposition of efficiency benchmarks, or mandatory minimum energy performance standards, would also encourage energy efficiency investment. In creating a flexible benchmark, MEPS requires the innovation and ingenuity of market actors. MEPS push the market in a certain direction, and entice it to find the solutions to match the standards on its own.
190. A sound and comprehensive cost-benefit analysis quantifying the overall existing building market could raise its stature as a potential investment. Though financiers may express interest in the building sector, they presently know little about energy efficiency and are for the most part unwilling to rethink their formulas and ratios. Such analysis must demonstrate cost-effective risks and returns and manageable transaction costs. Once financial institutions are convinced a market exists, they will devote resources to understanding and framing specific financial structures to accommodate the market.
191. Policies to overcome financial barriers in existing households exist. Their nature and success greatly depend on the national context. The study reaches four main policy lessons. First, the need for increased public and private collaboration. The
46

Financing Energy Efficient Homes: Existing Policy responses to financial barriers complementarities of the two resources will facilitate the long term transformation of the market. Second, the different facets of the financial barrier need to be addressed simultaneously. As such, policy packages are most efficient. Thirdly, lasting impact of any policy requires genuine transformation of the market with increased demand, which will in turn encourage private actors to offer more adapted tools for energy efficiency. Finally, neither markets nor public intervention alone will overcome the financial barrier. Strong political will must first encourage private-sector energy efficiency investments. Most financial measures to address specific obstacles—such as the initial cost barrier—exist, though the absence of a common framework for energy efficiency investments and the subsequent scepticism of financiers hamper implementation of existing tools. The IPMPV typically is a good first step in that direction. Governments’ efforts should focus on making such measures known to the private sector community, and direct their attention to more sustained collaboration with the private sector.
47

Financing Energy Efficient Homes: Existing Policy responses to financial barriers
REFERENCES Ademe (2005) Energy-Efficiency Monitoring in the EU-15 Ashford, P. (1998) “Assessment of Potential For the Saving of Carbon Dioxide Emissions in European Building Stock” EuroAce www.euroace.org Ashford, P. (1999) “The Cost Implications of Energy efficiency measures in the reduction of Carbon Dioxide emissions from European Building Stock” EuroAce The European Alliance of Companies for Energy Efficiency in Buildings www.euroace.org Bach, P (2004) “An energy-efficiency policy- Problems, barriers and possibilities” Brown, E Quinlan, P. Sachs, H. Williams, D. (2002) “Tax Credits for Energy Efficiency and Green Buildings: Opportunities for State Action” American Council for an Energy-Efficient Economy Brown, M. (2001) “Market failures and barriers as a basis for clean energy policies”, Energy Policy, Vo. 29 Bertoldi, P. Rezessy,S. “Tradable Certificates for Energy Savings” European Commission Joint Research Centre Institute for Environment and Sustainability Bertoldi, P., Kromer, S. (2005) “Efficiency Valuation-Concepts and Practice” ECEEE Bertoldi, P. Rezessy,S. Langniss, O., Voogt, M.(2004b) “White, Green & Brown Certificates: How to make the most of them?” ACEEE Boonekamp, P. (2005) “Evaluation of methods used to determine realized energy savings” Energy Policy, Volume 34, Issue14 Cusatis, P. Thomas, M. (2005) Hedging Instruments & Risk Management: How to use derivative to control financial risk in any market McGraw-Hill Cavanagh, R. (1997) “Energy Efficiency in buildings and equipment: remedies for pervasive market failures” National Commission on Energy Policy California Energy Commission (2005) “Energy Action Plan II: Implementation Roadmap for Energy Policies” California Energy Commission (2005b) “Options for Energy Efficiency in Existing Buildings” California Energy Commission (2003) “Accessing the Energy Savings Potential in California’s Existing Builidings” California Environmental Protection Agency (2006) “Climate Action Team Report to Governor Schwarzenegger and the California Legislature” Capozza, A.(2005) “White Certificates: The case of Italy” DeCanio, S. (1993) “Barriers within firms to energy efficient investments” Department of
48

Financing Energy Efficient Homes: Existing Policy responses to financial barriers Economics of the University of California Santa Barbara, USA Department of Energy (DOE, 2000) “Financing an Energy-Efficient Home” Department of Environment, Food, and Rural Affairs (DEFRA, 2006) “Updated UK Climate Change Programme: Final Regulatory Impact Assessment” Department of Environment Food and Rural Affairs (DEFRA, 2006b) “Climate Change: The UK Programme 2006” Department of Environment, Food, and Rural Affairs (DEFRA, 2005) “Background Information on the Illustrative Mix” Department of Environment Food and Rural Affairs (DEFRA, 2004) “Energy Efficiency: The Government’s Plan for Action” DeCanio, S. (1998) “The efficiency paradox: bureaucratic and organizational barriers to profitable energy-saving investments” Energy Policy, Volume 26, No. 5 Dutruge, JP. (2006) “Eco-innovations, eco-investissements, quells outils financiers au service des régions et des PME/PMI?” Enviropea Dyrol, S. Tommerup, H. Svendsen, S. (2004) “Savings potential in existing Danish building stock and new construction” ACEEE Energy Charter Secretariat (ECS, 2005) “Investing in Energy Efficiency: Removing the Barriers” Energy Charter Secretariat (ECS, 2005b) “Financing Energy Efficiency: Application Manual” Energy Charter Secretariat (ECS, 2004) “Fiscal Policies for Improving Energy Efficiency: Taxations, Grants and Subsidies” Energy for Sustainable Development (ESD, 2005) “Review of the UK Insulation Sector Supply Chain” Report to Defra EU (2005) “Green Paper on Energy Efficiency” Eurima (2006) “Cost-Benefit Analysis of the existing building block” Fabozzi, F. Choudhry M (2005) The Handbook on European Fixed Income Securities Wiley Finance Godinot, S. Berthou, C. (2005) “Banques françaises et environnement: Presque tout reste à faire” Golove, W. Eto, J. (1996) “Market Barriers to Energy Efficiency: A critical reappraisal of the rationale for public policies to promote energy efficiency” Lawrence Berkeley National Laboratory Hall, N. Jacobs, P. Lutwenhiser, L. (2005) “Assessing Markets to Design Programs that more fully attack key market barriers and take advantage of market opportunities- Why do we continue to miss so many opportunities?” Energy Program Evaluation Conference, New-York
49

Financing Energy Efficient Homes: Existing Policy responses to financial barriers Hill M. (1973), “Diversity and Evenness: “A Unifying Notation and its Consequences”, Ecology, Vol. 54 (2) Awerbuch, S. (2000) Horcher, K. (2005) Essentials of Financial Risk Management John Wiley & Sons Inc. IEA (2006a) Energy Technology Perspectives: Scenarios and Strategies to 2050 IEA (2006b) World Energy Outlook IEA (2006c) Key World Energy Statistics IEA (2005) Saving Electricity in a Hurry IEA (2005b) Lessons from a Liberalised Electricity Markets IEA (2005c) Energy Policies of Australia IEA (2004) Energy Policies of France IEA (2002) Energy Policies of the United Kingdom IEA (2003) Cool Appliances IEA (2003b) Energy Policies of Japan Ingersoll, J. (1987) Theory of Financial Decision Making Studies in Financial Economics IPPC (2001) Jan Noorman, K Schoot Uiterkamp, T. (1998)Green Households? Domestic Consumers, Environment and Sustainability EarthScan Johnson, B. (1994) “Modeling energy technology choices: which investment analysis tools are appropriate? Energy Policy, 22(10) Joskow, P. Marron, D. (1992) “What does a Negawatt Really Cost? Evidence from Utility Conservation Programs” The Energy Journal, Volume 13, Issue 4 Kempton, W. Harris, C. Keith,J., Weihl, J. (1985) “Do Consumers know ‘What Works’ in Energy Conservation?” in Harris, J. Blumstein,C. eds. What works: Documenting Energy Conservation in Buildings, American Council for Energy Efficient Economy (Washington DC) Keown, A., Scott, D.,Martin, J. & Petty, J. (1994) Foundations of Finance: The Logic and Practice of Financial Management” Prentice-Hall, Englewoods Cliffs, New Jersey Krempton & Montgomerey (1982) Lees, E. (2006) “Evaluation of the Energy Efficiency Commitment 2002-2005” Report to Defra Lempert, R., Popper,S., Resetar,S. (2002) “Capital cycles and the timing of climate change policy” Pew Center on Global Climate Change Levine, M. Hirst, E. (1994) “Energy Efficiency, Market Failures, and Government Policy” Energy Analysis Program , Lawrence Berkeley Laboratory
50

Financing Energy Efficient Homes: Existing Policy responses to financial barriers Lovins, A. (1992) “Energy-Efficient Buildings: Institutional Barriers and Opportunities” Strategic Issues Paper, E Source, Inc. Lovins, A. (1993), “Institutional Inefficiency: Guidelines to overcoming the market failure that is now causing widespread energy waste” Designing a Sustainable Future Malinvaud, E. (1998) Macroeconomic Theory: A Textbook on Macroeconomic Knowledge and Analysis: Vol 35A ; Advanced Textbooks in Economics Martin, Y. (1998) La maîtrise de l’énergie: Rapport d’évaluation Comité interministériel de l’évaluation des politiques publiques- Premier Ministre Commissariat général du Plan Mathew, P. Kromer, J. Sezgen, O. Meyers, S. (2005) “Actuarial pricing of energy projects: lessons foul and fair” Energy Policy Volume 33 Mills, E. (2003) “Risk Transfer via energy-savings insurance” Energy Policy Volume 33 Mills, E. Kromer, S. Weiss,G. Mathew, P.(2006) “From volatility to value: analysing and managing financial and performance risk in energy savings projects” Energy Policy, Volume 34, Issue 1 Ministère de l’Economie des Finances et de l’Industrie (2006) “Les certificats d’économies d’énergie le dispositif français” Ministère de l’Equipement, des Transports, et du Logement “Réglementation Thermique 2000 : Plus de performance, plus de confort” Mission Interministérielle de l’Effet de Serre (MIES, 2003) “Financer la lutte contre l’effet de serre” OECD (2005) “Development, Investment and Environment: in search of Synergies” Oikonomou, V. Rietbergen, M. Patel, M. (2006) “An ex-ante evaluation of a White Certificates scheme in The Netherlands: A case study for the household sector” Energy Policy Ramesohl, S. Dudda, C. (2004) “Barriers to energy service contracting and the role of standardised measurement and verification schemes as a tool to remove them” ACEEE Recherche Developpement International (RDI, 2005) “Prets preferentiels aux particuliers pour la construction et la renovation durables” Reddy, A. (1990) “Barriers to improvements in energy efficiency” in a workshop on Energy and Global Climate Change at Lawrence Berkeley Laboratory Sadeghi, M. Shavvalpour, S. (2005) “Energy Risk Management and value risk modelling” Energy Policy Salomon, T. Bedel, S. (1999) La maison des Négawatts Terre Vivante Sidler, O. (2006) Personal interview Sioshansi, F. (2002) “The emergence of trading and risk management in liberalised electricity markets” Energy Policy Volume 30
51

Financing Energy Efficient Homes: Existing Policy responses to financial barriers Sorell, S. (2006) “The economics of energy service contracts” Energy Policy Sturm, R. (2006) “Finding the impact we seek: the pragmatist’s view” IFC, the Energy Efficiency Investment Forum Sustainable Energy Ireland (2004) “How to make your Home more efficient” Sustainable Energy Ireland (2001) “Low Income Housing: Programme Strategy 2002-2006” Sutherland, R. (1991) “Market barriers to energy efficiency investments” The Energy Journal, 12(3) Thompson, P. (1997) “Evaluating energy efficiency investments: accounting for risk in the discounting process” Energy Policy Volume 25, Issue 12 UNEP, SEFI (2005) “Public Finance Mechanisms to Catalyse Sustainable Energy Sector Growth” UNEP, SEFI (2004) “Scoping Study on Financial Risk Management: Instruments for Renewable Energy Projects” UN Economic Social Committee (UN ESC, 2005) “Financing Energy Efficiency and Renewable Energy Investments for Climate Change Mitigation” UN Economic Commission for Europe (UN ECE, 2005) “Financing Energy Efficiency and Climate Change Mitigation” Urovas, LJ. (2006) Meetings with the author Waide, P. Harrington,P. Goldstein,D. (2004) “Global initiatives on building energy efficiency” ACEEE (check the year) WEC, ADEME (2004) “Energy Efficiency: A worldwide review Indicators, Policies, Evaluation” World Bank (2006) “An Investment Framework for Clean Energy and Development: A Progress Report” WWF (2005) “Shaping the Future of Sustainable Finance”
52