FINANCIAL SUMMARY - TOYOTA MOTOR … subsidiaries under TFS include Toyota Finance Corporation,...
41
FINANCIAL SUMMARY ( All financial information has been prepared in accordance with accounting principles generally accepted in Japan) FY2001 (April 1, 2000 through March 31, 2001) English translation from the original Japanese-language document TOYOTA MOTOR CORPORATION
Transcript of FINANCIAL SUMMARY - TOYOTA MOTOR … subsidiaries under TFS include Toyota Finance Corporation,...
FINANCIAL SUMMARY( All financial information has been prepared in accordance with accounting principles generally accepted in Japan)
FY2001(April 1, 2000 through March 31, 2001)
English translation from the original Japanese-language document
TOYOTA MOTOR CORPORATION
Cautionary Statement with Respect to Forward-Looking Statements
This report contains forward-looking statements that reflect our plans and expectations. These forward-
looking statements involve known and unknown risks, uncertainties and other factors that may cause our actual
results, performance, achievements or financial position to be materially different from any future results,
performance, achievements or financial position expressed or implied by these forward-looking statements. These
factors include: (i) changes in economic conditions affecting the automotive markets in Japan, North America,
Europe and other markets in which we operate; (ii) fluctuations in currency exchange rates, particularly with respect
to the value of the Japanese yen, the United States dollar and the euro; (iii) our ability to realize production
efficiencies and to implement capital expenditures at the levels and times planned by management; (iv) changes in
the laws, regulations and government policies affecting our automotive operations, particularly laws, regulations and
policies relating to the environmental protection, vehicle emissions, vehicle fuel economy and vehicle safety, as well
as changes in laws, regulations and government policies affecting our other operations, including our
telecommunications operations and the outcome of future litigation and other legal proceedings; (v) political
instability in the markets in which we operate; (vi) our ability to timely develop and achieve market acceptance of
new products; and (vii) fuel shortages or interruptions in transportation systems, labor strikes, work stoppages or
other interruptions to or difficulties in the employment of labor in the major markets where we purchase materials,
components and supplies for the production of our products or where our products are produced, distributed or sold.
A discussion of these and other factors which may affect our actual results, performance, achievements or financial
position is contained in the "Management's Discussion and Analysis of Financial Condition and Results of
Operations" section and elsewhere in our annual report on Form 20-F, which is on file with the United States
Securities and Exchange Commission.
Consolidated 1
OVERVIEW OF ASSOCIATED COMPANIES( All financial information has been prepared in accordance with accounting principles generally accepted in Japan)
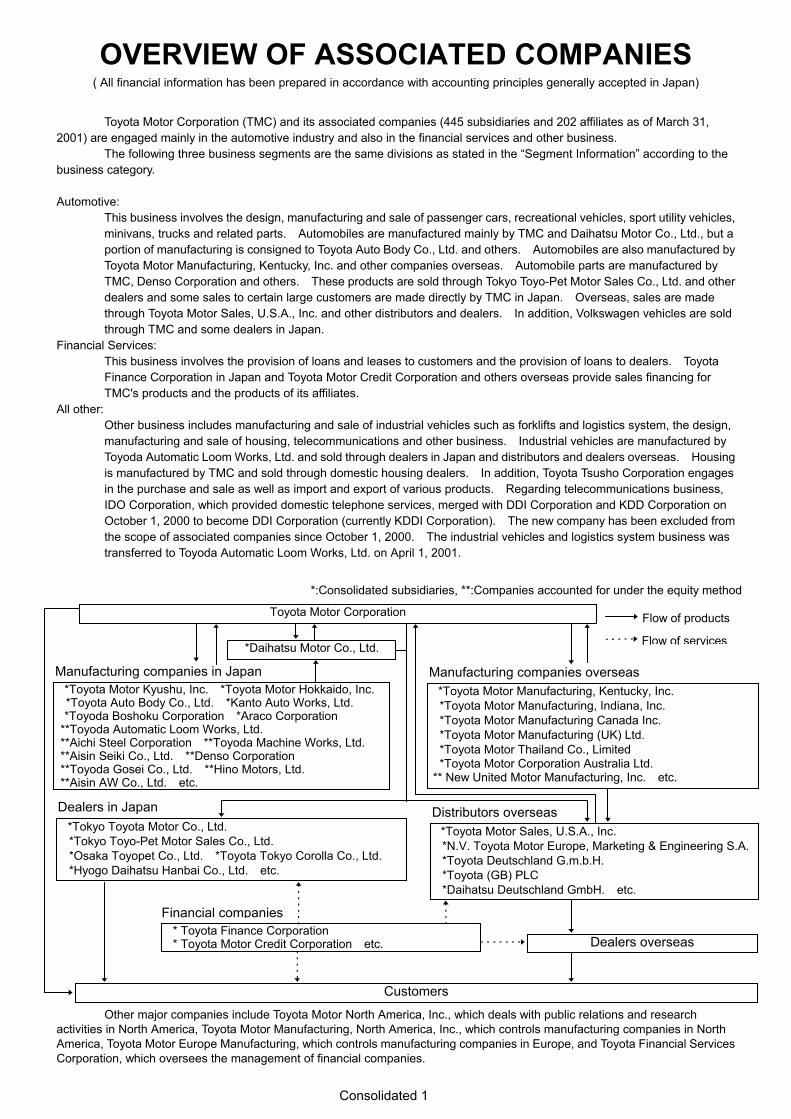
Toyota Motor Corporation (TMC) and its associated companies (445 subsidiaries and 202 affiliates as of March 31,2001) are engaged mainly in the automotive industry and also in the financial services and other business.
The following three business segments are the same divisions as stated in the “Segment Information” according to thebusiness category.
Automotive:This business involves the design, manufacturing and sale of passenger cars, recreational vehicles, sport utility vehicles,minivans, trucks and related parts. Automobiles are manufactured mainly by TMC and Daihatsu Motor Co., Ltd., but aportion of manufacturing is consigned to Toyota Auto Body Co., Ltd. and others. Automobiles are also manufactured byToyota Motor Manufacturing, Kentucky, Inc. and other companies overseas. Automobile parts are manufactured byTMC, Denso Corporation and others. These products are sold through Tokyo Toyo-Pet Motor Sales Co., Ltd. and otherdealers and some sales to certain large customers are made directly by TMC in Japan. Overseas, sales are madethrough Toyota Motor Sales, U.S.A., Inc. and other distributors and dealers. In addition, Volkswagen vehicles are soldthrough TMC and some dealers in Japan.
Financial Services:This business involves the provision of loans and leases to customers and the provision of loans to dealers. ToyotaFinance Corporation in Japan and Toyota Motor Credit Corporation and others overseas provide sales financing forTMC's products and the products of its affiliates.
All other:Other business includes manufacturing and sale of industrial vehicles such as forklifts and logistics system, the design,manufacturing and sale of housing, telecommunications and other business. Industrial vehicles are manufactured byToyoda Automatic Loom Works, Ltd. and sold through dealers in Japan and distributors and dealers overseas. Housingis manufactured by TMC and sold through domestic housing dealers. In addition, Toyota Tsusho Corporation engagesin the purchase and sale as well as import and export of various products. Regarding telecommunications business,IDO Corporation, which provided domestic telephone services, merged with DDI Corporation and KDD Corporation onOctober 1, 2000 to become DDI Corporation (currently KDDI Corporation). The new company has been excluded fromthe scope of associated companies since October 1, 2000. The industrial vehicles and logistics system business wastransferred to Toyoda Automatic Loom Works, Ltd. on April 1, 2001.
Other major companies include Toyota Motor North America, Inc., which deals with public relations and researchactivities in North America, Toyota Motor Manufacturing, North America, Inc., which controls manufacturing companies in NorthAmerica, Toyota Motor Europe Manufacturing, which controls manufacturing companies in Europe, and Toyota Financial ServicesCorporation, which oversees the management of financial companies.
Toyota Motor Corporation
*Toyota Motor Manufacturing, Kentucky, Inc.*Toyota Motor Manufacturing, Indiana, Inc.*Toyota Motor Manufacturing Canada Inc.*Toyota Motor Manufacturing (UK) Ltd.*Toyota Motor Thailand Co., Limited*Toyota Motor Corporation Australia Ltd.
** New United Motor Manufacturing, Inc. etc.
*Tokyo Toyota Motor Co., Ltd.*Tokyo Toyo-Pet Motor Sales Co., Ltd.*Osaka Toyopet Co., Ltd. *Toyota Tokyo Corolla Co., Ltd.*Hyogo Daihatsu Hanbai Co., Ltd. etc.
*Toyota Motor Kyushu, Inc. *Toyota Motor Hokkaido, Inc.*Toyota Auto Body Co., Ltd. *Kanto Auto Works, Ltd.*Toyoda Boshoku Corporation *Araco Corporation
**Toyoda Automatic Loom Works, Ltd.**Aichi Steel Corporation **Toyoda Machine Works, Ltd.**Aisin Seiki Co., Ltd. **Denso Corporation**Toyoda Gosei Co., Ltd. **Hino Motors, Ltd.**Aisin AW Co., Ltd. etc.
*Daihatsu Motor Co., Ltd.
*Toyota Motor Sales, U.S.A., Inc.*N.V. Toyota Motor Europe, Marketing & Engineering S.A.*Toyota Deutschland G.m.b.H.*Toyota (GB) PLC*Daihatsu Deutschland GmbH. etc.
Dealers overseas
Customers
Manufacturing companies in Japan Manufacturing companies overseas
Distributors overseasDealers in Japan
* Toyota Finance Corporation* Toyota Motor Credit Corporation etc.
Financial companies
*:Consolidated subsidiaries, **:Companies accounted for under the equity method
Flow of services
Flow of products
Consolidated 2
( All financial information has been prepared in accordance with accounting principles generally accepted in Japan)
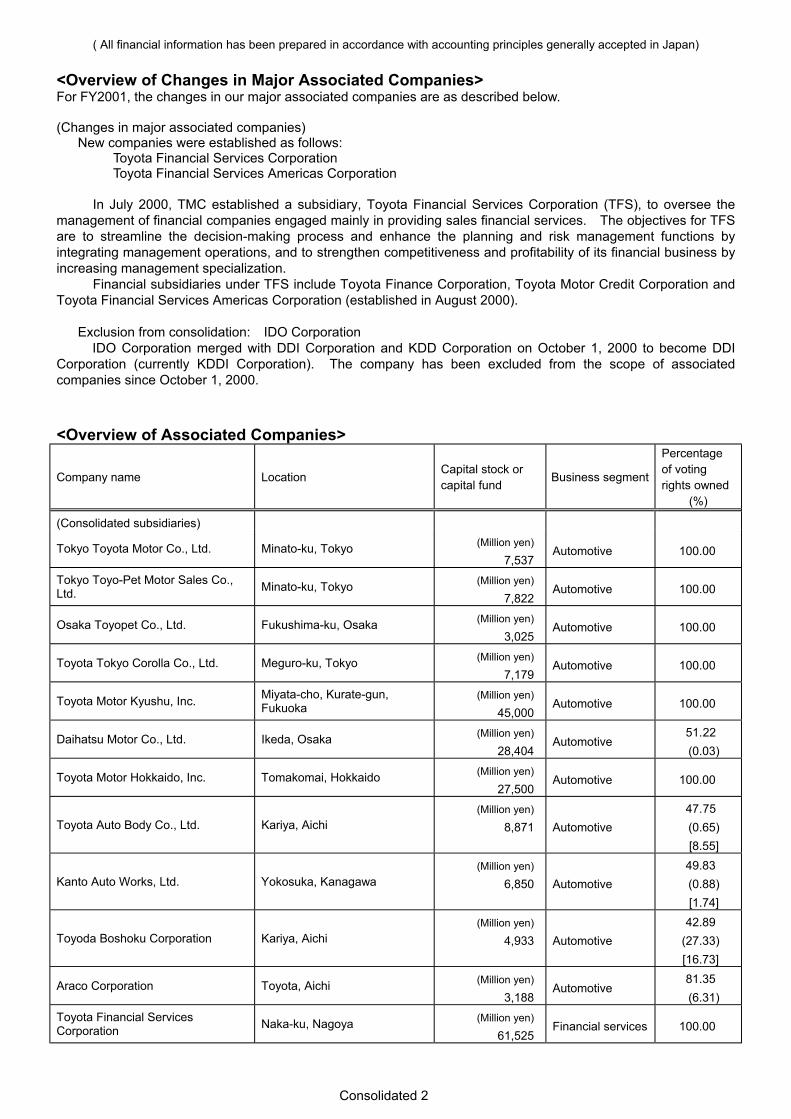
<Overview of Changes in Major Associated Companies>For FY2001, the changes in our major associated companies are as described below.
(Changes in major associated companies)New companies were established as follows:
Toyota Financial Services CorporationToyota Financial Services Americas Corporation
In July 2000, TMC established a subsidiary, Toyota Financial Services Corporation (TFS), to oversee themanagement of financial companies engaged mainly in providing sales financial services. The objectives for TFSare to streamline the decision-making process and enhance the planning and risk management functions byintegrating management operations, and to strengthen competitiveness and profitability of its financial business byincreasing management specialization.
Financial subsidiaries under TFS include Toyota Finance Corporation, Toyota Motor Credit Corporation andToyota Financial Services Americas Corporation (established in August 2000).
Exclusion from consolidation: IDO CorporationIDO Corporation merged with DDI Corporation and KDD Corporation on October 1, 2000 to become DDI
Corporation (currently KDDI Corporation). The company has been excluded from the scope of associatedcompanies since October 1, 2000.
<Overview of Associated Companies>
Company name Location Capital stock orcapital fund Business segment
Percentageof votingrights owned
(%)
(Consolidated subsidiaries)
Tokyo Toyota Motor Co., Ltd. Minato-ku, Tokyo (Million yen)
7,537Automotive 100.00
Tokyo Toyo-Pet Motor Sales Co.,Ltd. Minato-ku, Tokyo (Million yen)
7,822Automotive 100.00
Osaka Toyopet Co., Ltd. Fukushima-ku, Osaka (Million yen)
3,025Automotive 100.00
Toyota Tokyo Corolla Co., Ltd. Meguro-ku, Tokyo (Million yen)
7,179Automotive 100.00
Toyota Motor Kyushu, Inc. Miyata-cho, Kurate-gun,Fukuoka
(Million yen)
45,000Automotive 100.00
Daihatsu Motor Co., Ltd. Ikeda, Osaka (Million yen)
28,404Automotive
51. 22(0.03)
Toyota Motor Hokkaido, Inc. Tomakomai, Hokkaido (Million yen)
27,500Automotive 100.00
Toyota Auto Body Co., Ltd. Kariya, Aichi(Million yen)
8,871 Automotive47. 75(0. 65)[8.55]
Kanto Auto Works, Ltd. Yokosuka, Kanagawa(Million yen)
6,850 Automotive49.83(0.88)[1.74]
Toyoda Boshoku Corporation Kariya, Aichi(Million yen)
4,933 Automotive42.89
(27.33)[16.73]
Araco Corporation Toyota, Aichi (Million yen)
3,188Automotive
81.35(6.31)
Toyota Financial ServicesCorporation Naka-ku, Nagoya (Million yen)
61,525Financial services 100.00
Consolidated 3
( All financial information has been prepared in accordance with accounting principles generally accepted in Japan)
Company name Location Capital stock orcapital fund Business segment
Percentageof votingrights owned
(%)
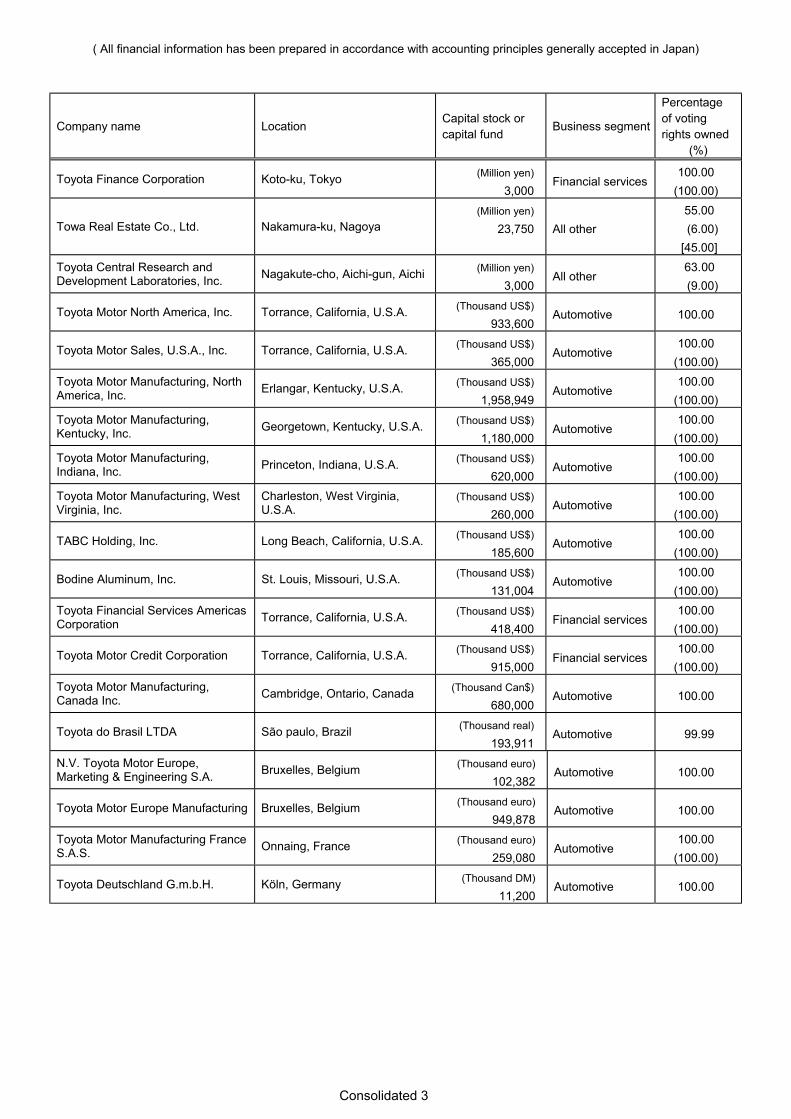
Toyota Finance Corporation Koto-ku, Tokyo (Million yen)
3,000Financial services
100.00(100.00)
Towa Real Estate Co., Ltd. Nakamura-ku, Nagoya(Million yen)
23,750 All other55.00(6.00)
[45.00]Toyota Central Research andDevelopment Laboratories, Inc. Nagakute-cho, Aichi-gun, Aichi (Million yen)
3,000All other
63. 00(9.00)
Toyota Motor North America, Inc. Torrance, California, U.S.A. (Thousand US$)
933,600Automotive 100.00
Toyota Motor Sales, U.S.A., Inc. Torrance, California, U.S.A. (Thousand US$)
365,000Automotive
100.00(100.00)
Toyota Motor Manufacturing, NorthAmerica, Inc. Erlangar, Kentucky, U.S.A. (Thousand US$)
1,958,949Automotive
100.00(100.00)
Toyota Motor Manufacturing,Kentucky, Inc. Georgetown, Kentucky, U.S.A. (Thousand US$)
1,180,000Automotive
100.00(100.00)
Toyota Motor Manufacturing,Indiana, Inc. Princeton, Indiana, U.S.A. (Thousand US$)
620,000Automotive
100.00(100.00)
Toyota Motor Manufacturing, WestVirginia, Inc.
Charleston, West Virginia,U.S.A.
(Thousand US$)
260,000Automotive
100.00(100.00)
TABC Holding, Inc. Long Beach, California, U.S.A. (Thousand US$)
185,600Automotive
100.00(100.00)
Bodine Aluminum, Inc. St. Louis, Missouri, U.S.A. (Thousand US$)
131,004Automotive
100.00(100.00)
Toyota Financial Services AmericasCorporation Torrance, California, U.S.A. (Thousand US$)
418,400Financial services
100.00(100.00)
Toyota Motor Credit Corporation Torrance, California, U.S.A. (Thousand US$)
915,000Financial services
100.00(100.00)
Toyota Motor Manufacturing,Canada Inc. Cambridge, Ontario, Canada (Thousand Can$)
680,000Automotive 100.00
Toyota do Brasil LTDA São paulo, Brazil (Thousand real)
193,911Automotive 99.99
N.V. Toyota Motor Europe,Marketing & Engineering S.A. Bruxelles, Belgium (Thousand euro)
102,382Automotive 100.00
Toyota Motor Europe Manufacturing Bruxelles, Belgium (Thousand euro)
949,878Automotive 100.00
Toyota Motor Manufacturing FranceS.A.S. Onnaing, France (Thousand euro)
259,080Automotive
100.00(100.00)
Toyota Deutschland G.m.b.H. Köln, Germany (Thousand DM)
11,200Automotive 100.00
Consolidated 4
( All financial information has been prepared in accordance with accounting principles generally accepted in Japan)
Company name Location Capital stock orcapital fund Business segment
Percentageof votingrights owned
(%)
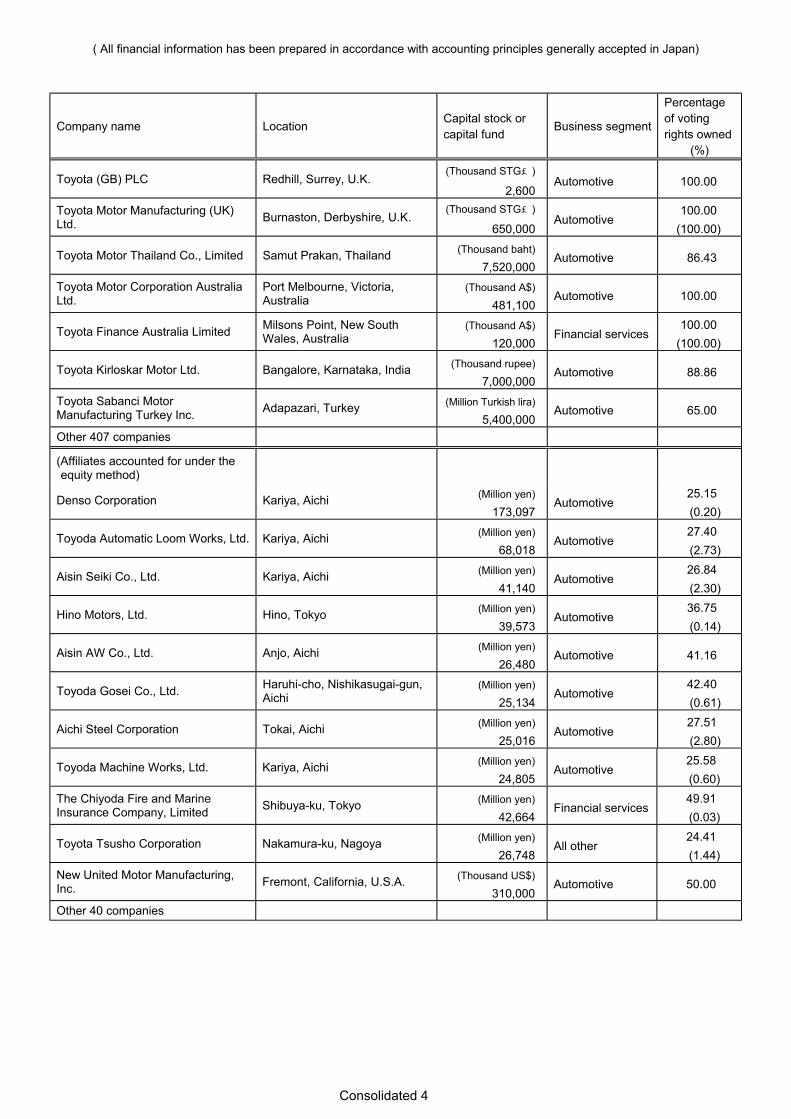
Toyota (GB) PLC Redhill, Surrey, U.K.(Thousand STG£)
2,600Automotive 100.00
Toyota Motor Manufacturing (UK)Ltd. Burnaston, Derbyshire, U.K.
(Thousand STG£)
650,000Automotive
100.00(100.00)
Toyota Motor Thailand Co., Limited Samut Prakan, Thailand (Thousand baht)
7,520,000Automotive 86.43
Toyota Motor Corporation AustraliaLtd.
Port Melbourne, Victoria,Australia
(Thousand A$)
481,100Automotive 100.00
Toyota Finance Australia Limited Milsons Point, New SouthWales, Australia
(Thousand A$)
120,000Financial services
100.00(100.00)
Toyota Kirloskar Motor Ltd. Bangalore, Karnataka, India (Thousand rupee)
7,000,000Automotive 88.86
Toyota Sabanci MotorManufacturing Turkey Inc. Adapazari, Turkey (Million Turkish lira)
5,400,000Automotive 65.00
Other 407 companies
(Affiliates accounted for under theequity method)
Denso Corporation Kariya, Aichi (Million yen)
173,097Automotive
25.15(0.20)
Toyoda Automatic Loom Works, Ltd. Kariya, Aichi (Million yen)
68,018Automotive
27.40(2.73)
Aisin Seiki Co., Ltd. Kariya, Aichi (Million yen)
41,140Automotive
26.84(2.30)
Hino Motors, Ltd. Hino, Tokyo (Million yen)
39,573Automotive
36.75(0.14)
Aisin AW Co., Ltd. Anjo, Aichi (Million yen)
26,480Automotive 41.16
Toyoda Gosei Co., Ltd. Haruhi-cho, Nishikasugai-gun,Aichi
(Million yen)
25,134Automotive
42.40(0.61)
Aichi Steel Corporation Tokai, Aichi (Million yen)
25,016Automotive
27.51(2.80)
Toyoda Machine Works, Ltd. Kariya, Aichi (Million yen)
24,805Automotive
25.58(0.60)
The Chiyoda Fire and MarineInsurance Company, Limited Shibuya-ku, Tokyo (Million yen)
42,664Financial services
49.91(0.03)
Toyota Tsusho Corporation Nakamura-ku, Nagoya (Million yen)
26,748All other
24.41(1.44)
New United Motor Manufacturing,Inc. Fremont, California, U.S.A. (Thousand US$)
310,000Automotive 50.00
Other 40 companies
Consolidated 5
( All financial information has been prepared in accordance with accounting principles generally accepted in Japan)
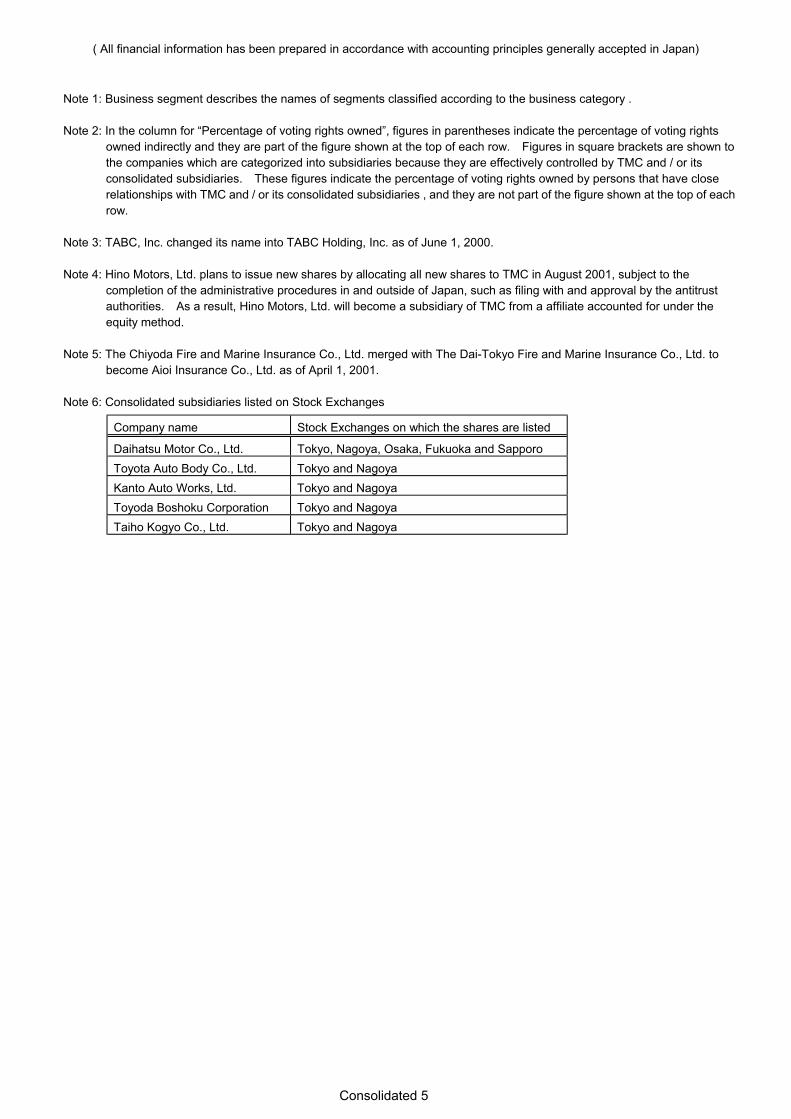
Note 1: Business segment describes the names of segments classified according to the business category .
Note 2: In the column for “Percentage of voting rights owned”, figures in parentheses indicate the percentage of voting rightsowned indirectly and they are part of the figure shown at the top of each row. Figures in square brackets are shown tothe companies which are categorized into subsidiaries because they are effectively controlled by TMC and / or itsconsolidated subsidiaries. These figures indicate the percentage of voting rights owned by persons that have closerelationships with TMC and / or its consolidated subsidiaries , and they are not part of the figure shown at the top of eachrow.
Note 3: TABC, Inc. changed its name into TABC Holding, Inc. as of June 1, 2000.
Note 4: Hino Motors, Ltd. plans to issue new shares by allocating all new shares to TMC in August 2001, subject to thecompletion of the administrative procedures in and outside of Japan, such as filing with and approval by the antitrustauthorities. As a result, Hino Motors, Ltd. will become a subsidiary of TMC from a affiliate accounted for under theequity method.
Note 5: The Chiyoda Fire and Marine Insurance Co., Ltd. merged with The Dai-Tokyo Fire and Marine Insurance Co., Ltd. tobecome Aioi Insurance Co., Ltd. as of April 1, 2001.
Note 6: Consolidated subsidiaries listed on Stock Exchanges
Company name Stock Exchanges on which the shares are listed
Daihatsu Motor Co., Ltd. Tokyo, Nagoya, Osaka, Fukuoka and SapporoToyota Auto Body Co., Ltd. Tokyo and NagoyaKanto Auto Works, Ltd. Tokyo and NagoyaToyoda Boshoku Corporation Tokyo and NagoyaTaiho Kogyo Co., Ltd. Tokyo and Nagoya
Consolidated 6
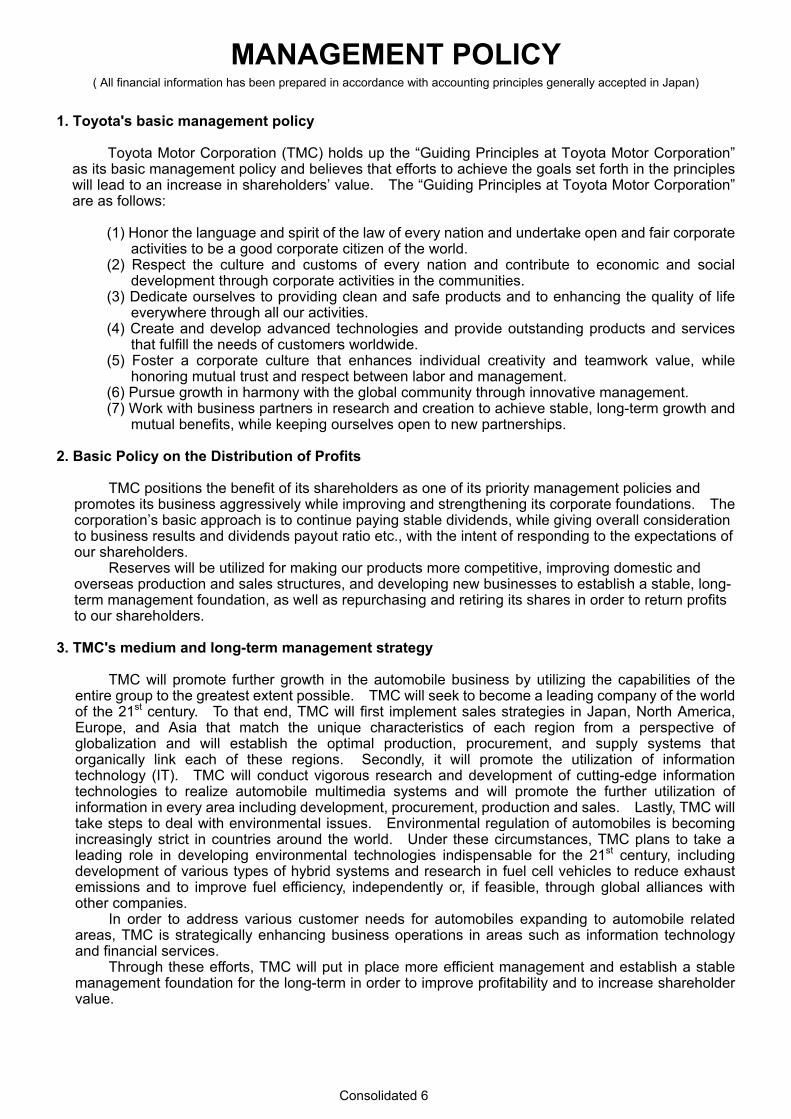
MANAGEMENT POLICY( All financial information has been prepared in accordance with accounting principles generally accepted in Japan)
1. Toyota's basic management policy
Toyota Motor Corporation (TMC) holds up the “Guiding Principles at Toyota Motor Corporation”as its basic management policy and believes that efforts to achieve the goals set forth in the principleswill lead to an increase in shareholders’ value. The “Guiding Principles at Toyota Motor Corporation”are as follows:
(1) Honor the language and spirit of the law of every nation and undertake open and fair corporateactivities to be a good corporate citizen of the world.
(2) Respect the culture and customs of every nation and contribute to economic and socialdevelopment through corporate activities in the communities.
(3) Dedicate ourselves to providing clean and safe products and to enhancing the quality of lifeeverywhere through all our activities.
(4) Create and develop advanced technologies and provide outstanding products and servicesthat fulfill the needs of customers worldwide.
(5) Foster a corporate culture that enhances individual creativity and teamwork value, whilehonoring mutual trust and respect between labor and management.
(6) Pursue growth in harmony with the global community through innovative management.(7) Work with business partners in research and creation to achieve stable, long-term growth and
mutual benefits, while keeping ourselves open to new partnerships.
2. Basic Policy on the Distribution of Profits
TMC positions the benefit of its shareholders as one of its priority management policies andpromotes its business aggressively while improving and strengthening its corporate foundations. Thecorporation’s basic approach is to continue paying stable dividends, while giving overall considerationto business results and dividends payout ratio etc., with the intent of responding to the expectations ofour shareholders.
Reserves will be utilized for making our products more competitive, improving domestic andoverseas production and sales structures, and developing new businesses to establish a stable, long-term management foundation, as well as repurchasing and retiring its shares in order to return profitsto our shareholders.
3. TMC's medium and long-term management strategy
TMC will promote further growth in the automobile business by utilizing the capabilities of theentire group to the greatest extent possible. TMC will seek to become a leading company of the worldof the 21st century. To that end, TMC will first implement sales strategies in Japan, North America,Europe, and Asia that match the unique characteristics of each region from a perspective ofglobalization and will establish the optimal production, procurement, and supply systems thatorganically link each of these regions. Secondly, it will promote the utilization of informationtechnology (IT). TMC will conduct vigorous research and development of cutting-edge informationtechnologies to realize automobile multimedia systems and will promote the further utilization ofinformation in every area including development, procurement, production and sales. Lastly, TMC willtake steps to deal with environmental issues. Environmental regulation of automobiles is becomingincreasingly strict in countries around the world. Under these circumstances, TMC plans to take aleading role in developing environmental technologies indispensable for the 21st century, includingdevelopment of various types of hybrid systems and research in fuel cell vehicles to reduce exhaustemissions and to improve fuel efficiency, independently or, if feasible, through global alliances withother companies.
In order to address various customer needs for automobiles expanding to automobile relatedareas, TMC is strategically enhancing business operations in areas such as information technologyand financial services.
Through these efforts, TMC will put in place more efficient management and establish a stablemanagement foundation for the long-term in order to improve profitability and to increase shareholdervalue.
Consolidated 7
( All financial information has been prepared in accordance with accounting principles generally accepted in Japan)
4. Measures for improvement of corporate management organizations
In addition to general meetings of shareholders, meetings of the Board of Directors, meetings ofthe Board of Corporate Auditors and auditing of financial statements by certified public accountantsand other actions required by law, TMC is taking various measures to ensure a higher level ofcorporate governance.
Specifically, the company established a “Committee of Ethics for Corporate Conduct”, comprisedof executives of the senior managing director level and higher, to verify all corporate activities from theviewpoint of legal requirements and corporate ethics. TMC also adopted guidelines regarding theconduct of employees to codify the basic attitudinal approach expected of employees. Efforts arebeing made to ensure employees strictly follow these guidelines. In addition, every year TMC holdsat least one meeting of the International Advisory Board, which is comprised of knowledgeable personsfrom foreign countries, to provide TMC with advice concerning management strategies in reference toToyota’s globalization initiatives.
Also, TMC continues to disclose information on the fiscal condition of the company toshareholders, investors, and other stakeholders. The company will continue to ensure a high level ofcorporate accountability.
Consolidated 8
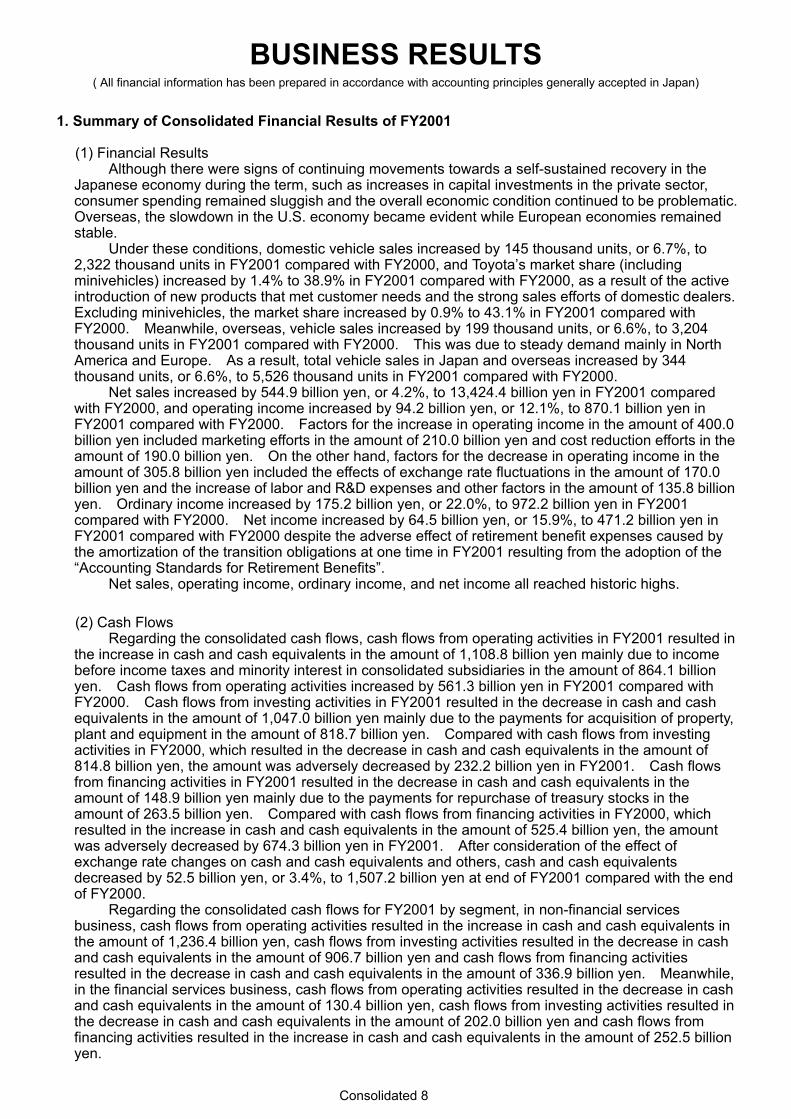
BUSINESS RESULTS( All financial information has been prepared in accordance with accounting principles generally accepted in Japan)
1. Summary of Consolidated Financial Results of FY2001
(1) Financial ResultsAlthough there were signs of continuing movements towards a self-sustained recovery in the
Japanese economy during the term, such as increases in capital investments in the private sector,consumer spending remained sluggish and the overall economic condition continued to be problematic.Overseas, the slowdown in the U.S. economy became evident while European economies remainedstable.
Under these conditions, domestic vehicle sales increased by 145 thousand units, or 6.7%, to2,322 thousand units in FY2001 compared with FY2000, and Toyota’s market share (includingminivehicles) increased by 1.4% to 38.9% in FY2001 compared with FY2000, as a result of the activeintroduction of new products that met customer needs and the strong sales efforts of domestic dealers.Excluding minivehicles, the market share increased by 0.9% to 43.1% in FY2001 compared withFY2000. Meanwhile, overseas, vehicle sales increased by 199 thousand units, or 6.6%, to 3,204thousand units in FY2001 compared with FY2000. This was due to steady demand mainly in NorthAmerica and Europe. As a result, total vehicle sales in Japan and overseas increased by 344thousand units, or 6.6%, to 5,526 thousand units in FY2001 compared with FY2000.
Net sales increased by 544.9 billion yen, or 4.2%, to 13,424.4 billion yen in FY2001 comparedwith FY2000, and operating income increased by 94.2 billion yen, or 12.1%, to 870.1 billion yen inFY2001 compared with FY2000. Factors for the increase in operating income in the amount of 400.0billion yen included marketing efforts in the amount of 210.0 billion yen and cost reduction efforts in theamount of 190.0 billion yen. On the other hand, factors for the decrease in operating income in theamount of 305.8 billion yen included the effects of exchange rate fluctuations in the amount of 170.0billion yen and the increase of labor and R&D expenses and other factors in the amount of 135.8 billionyen. Ordinary income increased by 175.2 billion yen, or 22.0%, to 972.2 billion yen in FY2001compared with FY2000. Net income increased by 64.5 billion yen, or 15.9%, to 471.2 billion yen inFY2001 compared with FY2000 despite the adverse effect of retirement benefit expenses caused bythe amortization of the transition obligations at one time in FY2001 resulting from the adoption of the“Accounting Standards for Retirement Benefits”.
Net sales, operating income, ordinary income, and net income all reached historic highs.
(2) Cash FlowsRegarding the consolidated cash flows, cash flows from operating activities in FY2001 resulted in
the increase in cash and cash equivalents in the amount of 1,108.8 billion yen mainly due to incomebefore income taxes and minority interest in consolidated subsidiaries in the amount of 864.1 billionyen. Cash flows from operating activities increased by 561.3 billion yen in FY2001 compared withFY2000. Cash flows from investing activities in FY2001 resulted in the decrease in cash and cashequivalents in the amount of 1,047.0 billion yen mainly due to the payments for acquisition of property,plant and equipment in the amount of 818.7 billion yen. Compared with cash flows from investingactivities in FY2000, which resulted in the decrease in cash and cash equivalents in the amount of814.8 billion yen, the amount was adversely decreased by 232.2 billion yen in FY2001. Cash flowsfrom financing activities in FY2001 resulted in the decrease in cash and cash equivalents in theamount of 148.9 billion yen mainly due to the payments for repurchase of treasury stocks in theamount of 263.5 billion yen. Compared with cash flows from financing activities in FY2000, whichresulted in the increase in cash and cash equivalents in the amount of 525.4 billion yen, the amountwas adversely decreased by 674.3 billion yen in FY2001. After consideration of the effect ofexchange rate changes on cash and cash equivalents and others, cash and cash equivalentsdecreased by 52.5 billion yen, or 3.4%, to 1,507.2 billion yen at end of FY2001 compared with the endof FY2000.
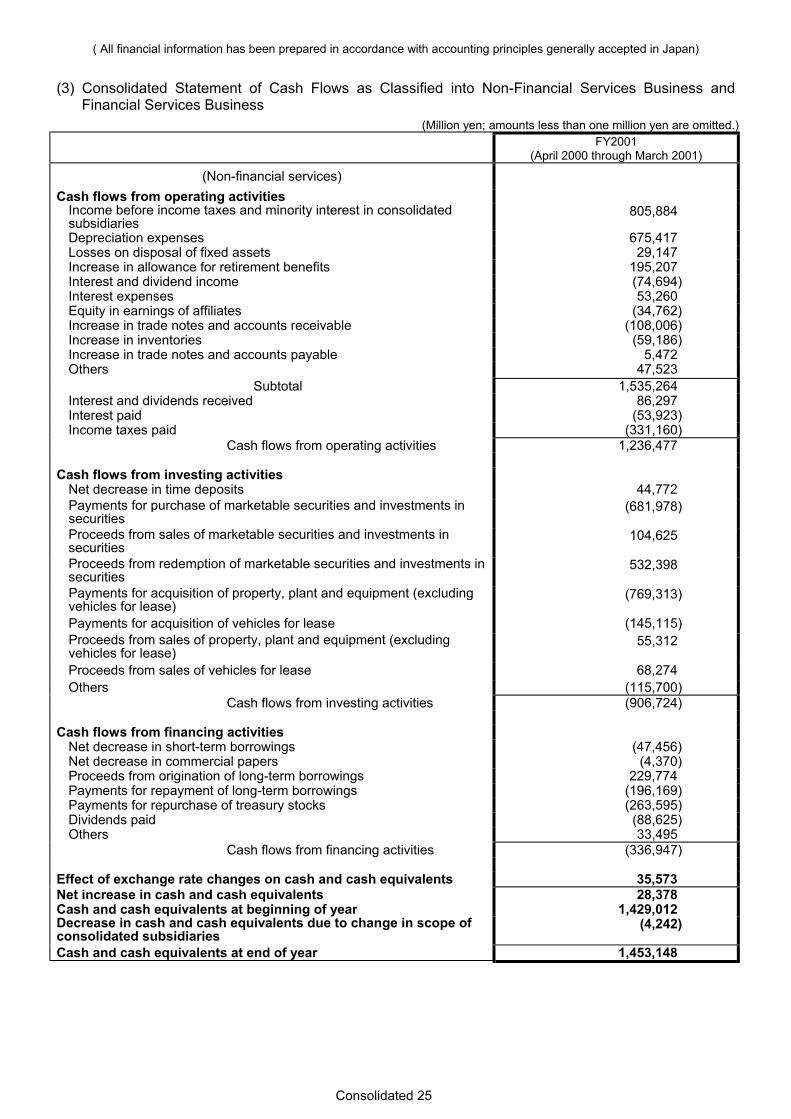
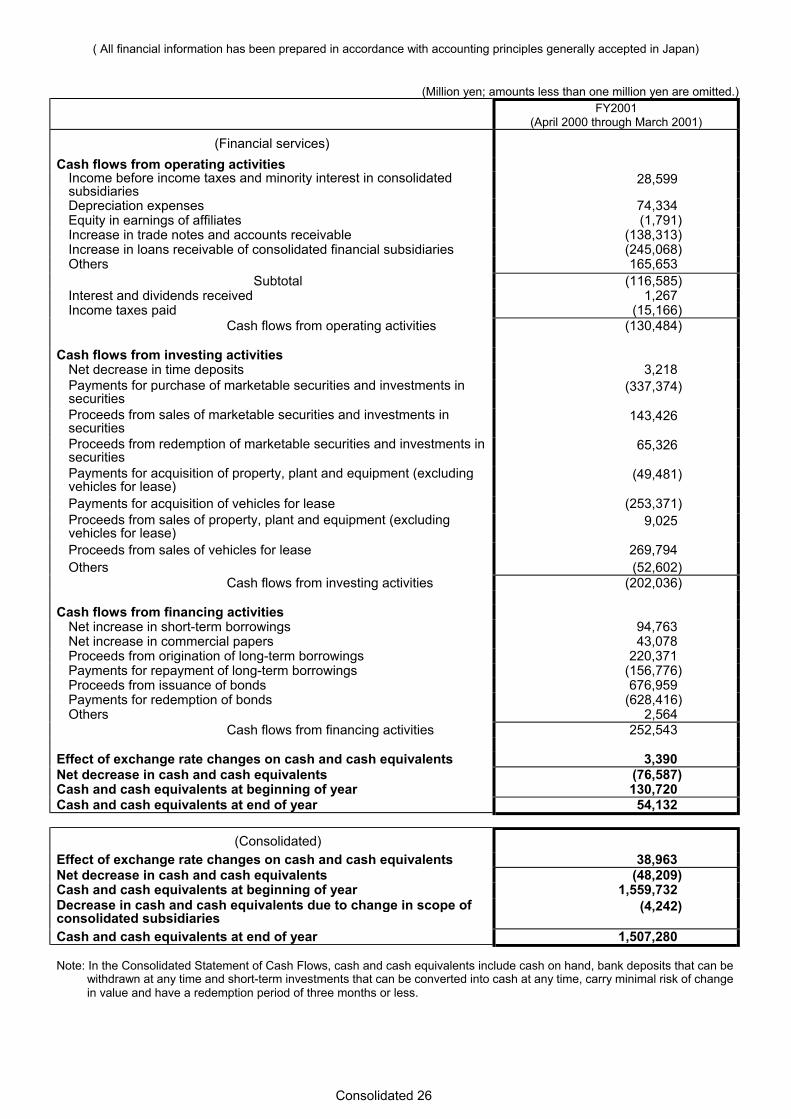
Regarding the consolidated cash flows for FY2001 by segment, in non-financial servicesbusiness, cash flows from operating activities resulted in the increase in cash and cash equivalents inthe amount of 1,236.4 billion yen, cash flows from investing activities resulted in the decrease in cashand cash equivalents in the amount of 906.7 billion yen and cash flows from financing activitiesresulted in the decrease in cash and cash equivalents in the amount of 336.9 billion yen. Meanwhile,in the financial services business, cash flows from operating activities resulted in the decrease in cashand cash equivalents in the amount of 130.4 billion yen, cash flows from investing activities resulted inthe decrease in cash and cash equivalents in the amount of 202.0 billion yen and cash flows fromfinancing activities resulted in the increase in cash and cash equivalents in the amount of 252.5 billionyen.
Consolidated 9
( All financial information has been prepared in accordance with accounting principles generally accepted in Japan)
2. Consolidated financial results of FY2001 by segment
(1) Business Segment
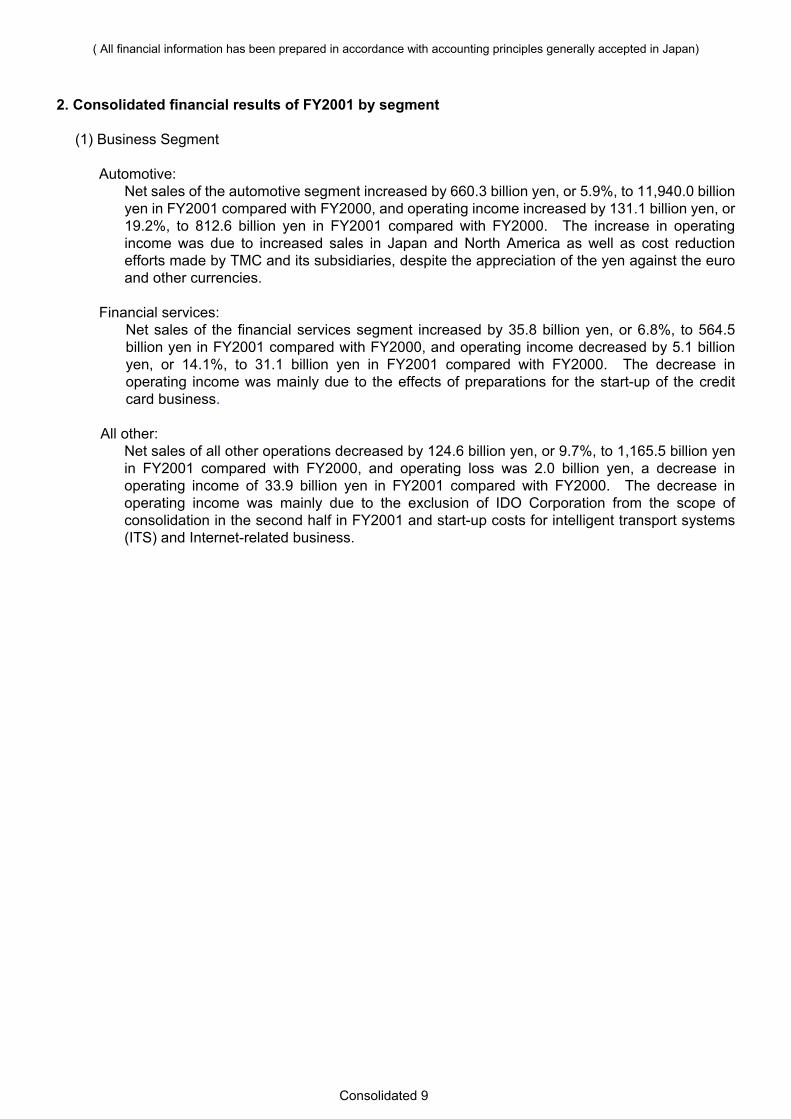
Automotive:Net sales of the automotive segment increased by 660.3 billion yen, or 5.9%, to 11,940.0 billionyen in FY2001 compared with FY2000, and operating income increased by 131.1 billion yen, or19.2%, to 812.6 billion yen in FY2001 compared with FY2000. The increase in operatingincome was due to increased sales in Japan and North America as well as cost reductionefforts made by TMC and its subsidiaries, despite the appreciation of the yen against the euroand other currencies.
Financial services:Net sales of the financial services segment increased by 35.8 billion yen, or 6.8%, to 564.5billion yen in FY2001 compared with FY2000, and operating income decreased by 5.1 billionyen, or 14.1%, to 31.1 billion yen in FY2001 compared with FY2000. The decrease inoperating income was mainly due to the effects of preparations for the start-up of the creditcard business.
All other:Net sales of all other operations decreased by 124.6 billion yen, or 9.7%, to 1,165.5 billion yenin FY2001 compared with FY2000, and operating loss was 2.0 billion yen, a decrease inoperating income of 33.9 billion yen in FY2001 compared with FY2000. The decrease inoperating income was mainly due to the exclusion of IDO Corporation from the scope ofconsolidation in the second half in FY2001 and start-up costs for intelligent transport systems(ITS) and Internet-related business.
Consolidated 10
( All financial information has been prepared in accordance with accounting principles generally accepted in Japan)
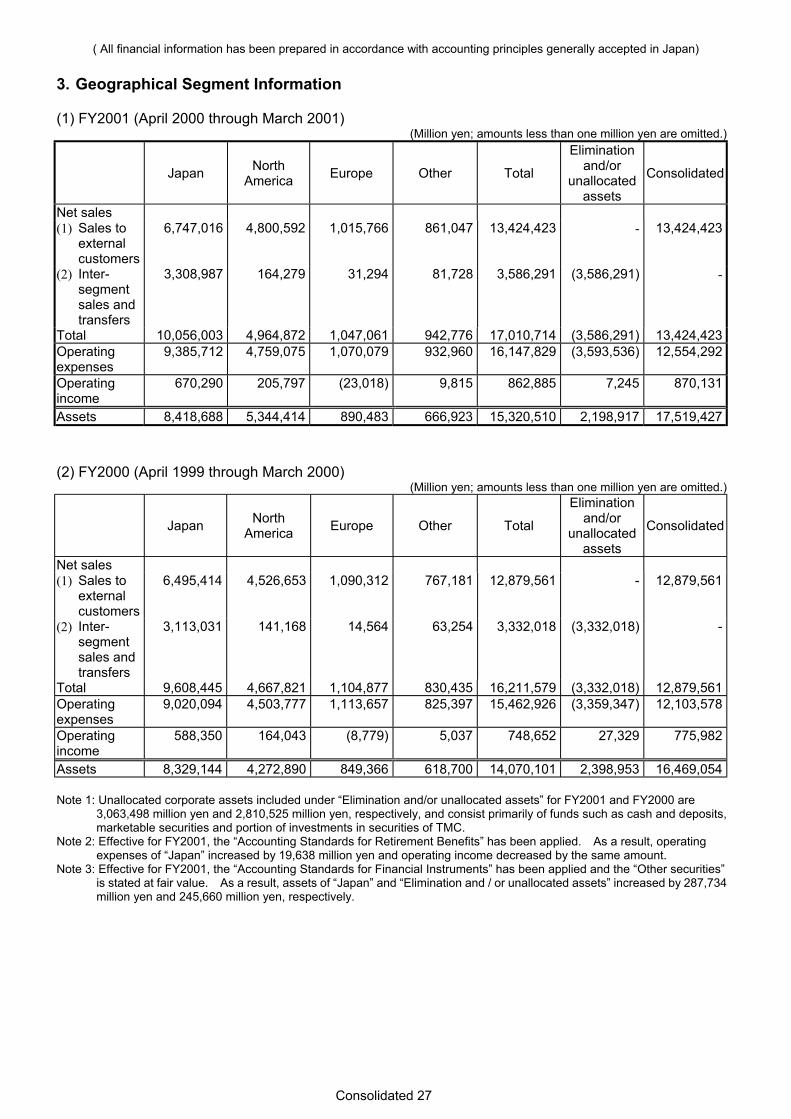
(2) Geographical Segment
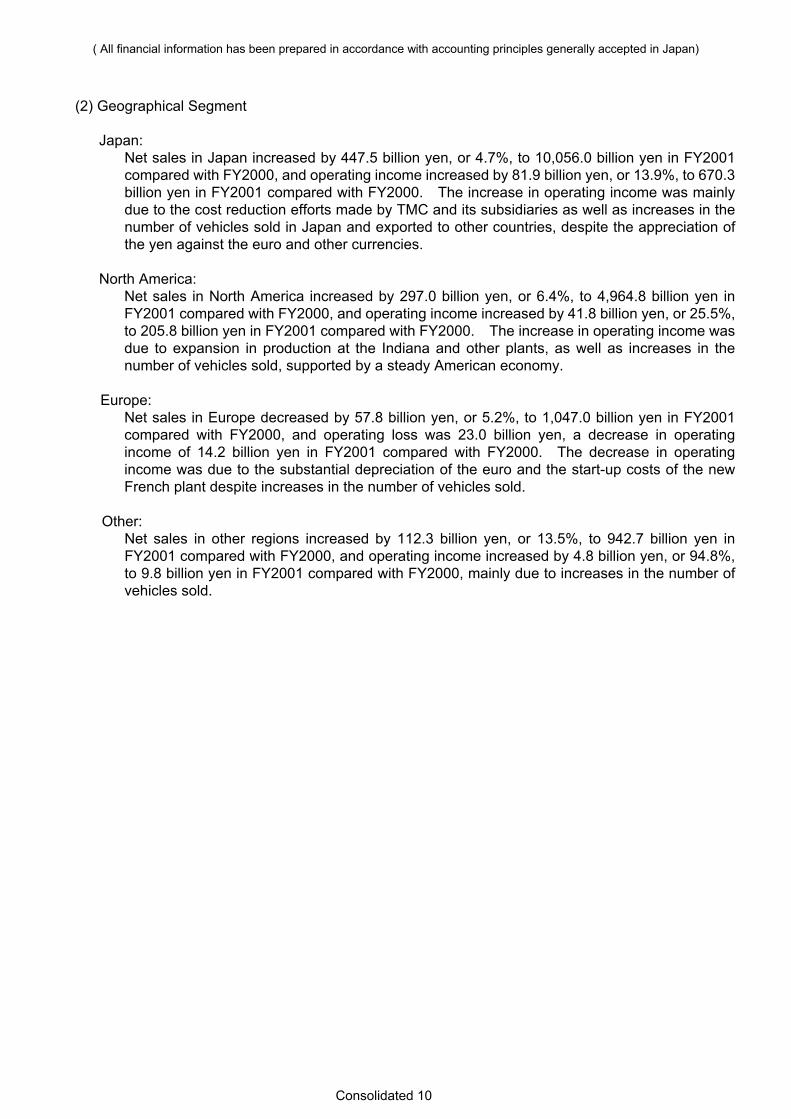
Japan:Net sales in Japan increased by 447.5 billion yen, or 4.7%, to 10,056.0 billion yen in FY2001compared with FY2000, and operating income increased by 81.9 billion yen, or 13.9%, to 670.3billion yen in FY2001 compared with FY2000. The increase in operating income was mainlydue to the cost reduction efforts made by TMC and its subsidiaries as well as increases in thenumber of vehicles sold in Japan and exported to other countries, despite the appreciation ofthe yen against the euro and other currencies.
North America:Net sales in North America increased by 297.0 billion yen, or 6.4%, to 4,964.8 billion yen inFY2001 compared with FY2000, and operating income increased by 41.8 billion yen, or 25.5%,to 205.8 billion yen in FY2001 compared with FY2000. The increase in operating income wasdue to expansion in production at the Indiana and other plants, as well as increases in thenumber of vehicles sold, supported by a steady American economy.
Europe:Net sales in Europe decreased by 57.8 billion yen, or 5.2%, to 1,047.0 billion yen in FY2001compared with FY2000, and operating loss was 23.0 billion yen, a decrease in operatingincome of 14.2 billion yen in FY2001 compared with FY2000. The decrease in operatingincome was due to the substantial depreciation of the euro and the start-up costs of the newFrench plant despite increases in the number of vehicles sold.
Other:Net sales in other regions increased by 112.3 billion yen, or 13.5%, to 942.7 billion yen inFY2001 compared with FY2000, and operating income increased by 4.8 billion yen, or 94.8%,to 9.8 billion yen in FY2001 compared with FY2000, mainly due to increases in the number ofvehicles sold.
Consolidated 11
( All financial information has been prepared in accordance with accounting principles generally accepted in Japan)
3. Distribution of Profits for FY2001
Regarding the dividends for FY2001, the interim dividend declared in November 2000 was 11 yenper share. The year-end dividend is scheduled to be increased by 1 yen to 14 yen per share, for atotal of 25 yen per share, 1 yen higher than FY2000, on an annual basis. Accordingly, the dividendspayout ratio for FY2001 is 27.8%.
In addition, TMC repurchased and retired 64 million shares in the amount of 263,595 million yenin order to return profits to its shareholders.
4. Others
Litigation in the United States
On July 12, 1999, the United States Department of Justice, acting on behalf of the UnitedStates Environmental Protection Agency, filed a lawsuit against Toyota Motor Sales, U.S.A., Inc., aconsolidated subsidiary of TMC (on November 22, 1999 TMC and Toyota Technical Center U.S.A.,Inc., a consolidated subsidiary of TMC, were added as defendants) for alleged defects in on-boarddiagnostic systems to detect gas vapor leaks installed in approximately 2.2 million units of 1996-1998 model year Toyota vehicles sold in the U.S.A. in violation of the U.S. Clean Air Act.
The Environmental Protection Agency and the Department of Justice are seeking theinjunction of sales of Toyota’s 1996-1998 model year new Toyota vehicles that do not comply withthe Clean Air Act and other applicable federal regulations, seeking TMC to take appropriate actionto remedy the alleged violation of the Clean Air Act, and seeking civil penalties of up to $27,500 foreach vehicle allegedly sold in violation of that Act.
Toyota cannot predict the timetable on which this lawsuit will proceed. Toyota believes that ithas valid defenses to this claim and intends to vigorously defend this lawsuit.
Consolidated 12
CONSOLIDATED PRODUCTION AND SALES( All financial information has been prepared in accordance with accounting principles generally accepted in Japan)
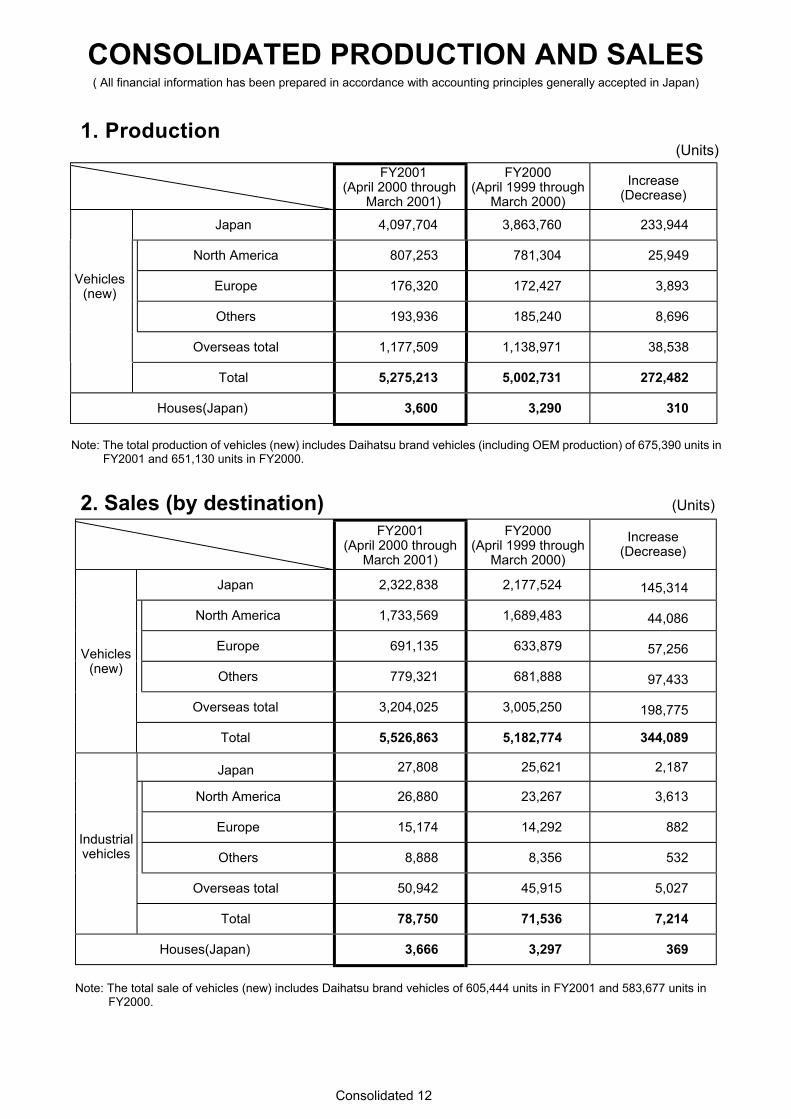
1. Production(Units)
FY2001(April 2000 through
March 2001)
FY2000(April 1999 through
March 2000)Increase
(Decrease)
Japan 4,097,704 3,863,760 233,944
North America 807,253 781,304 25,949
Europe 176,320 172,427 3,893
Others 193,936 185,240 8,696
Overseas total 1,177,509 1,138,971 38,538
Vehicles(new)
Total 5,275,213 5,002,731 272,482
Houses(Japan) 3,600 3,290 310
Note: The total production of vehicles (new) includes Daihatsu brand vehicles (including OEM production) of 675,390 units inFY2001 and 651,130 units in FY2000.
2. Sales (by destination) (Units)
FY2001(April 2000 through
March 2001)
FY2000(April 1999 through
March 2000)
Increase(Decrease)
Japan 2,322,838 2,177,524 145,314
North America 1,733,569 1,689,483 44,086
Europe 691,135 633,879 57,256
Others 779,321 681,888 97,433
Overseas total 3,204,025 3,005,250 198,775
Vehicles(new)
Total 5,526,863 5,182,774 344,089
Japan 27,808 25,621 2,187
North America 26,880 23,267 3,613
Europe 15,174 14,292 882
Others 8,888 8,356 532
Overseas total 50,942 45,915 5,027
Industrialvehicles
Total 78,750 71,536 7,214
Houses(Japan) 3,666 3,297 369
Note: The total sale of vehicles (new) includes Daihatsu brand vehicles of 605,444 units in FY2001 and 583,677 units inFY2000.
Consolidated 13
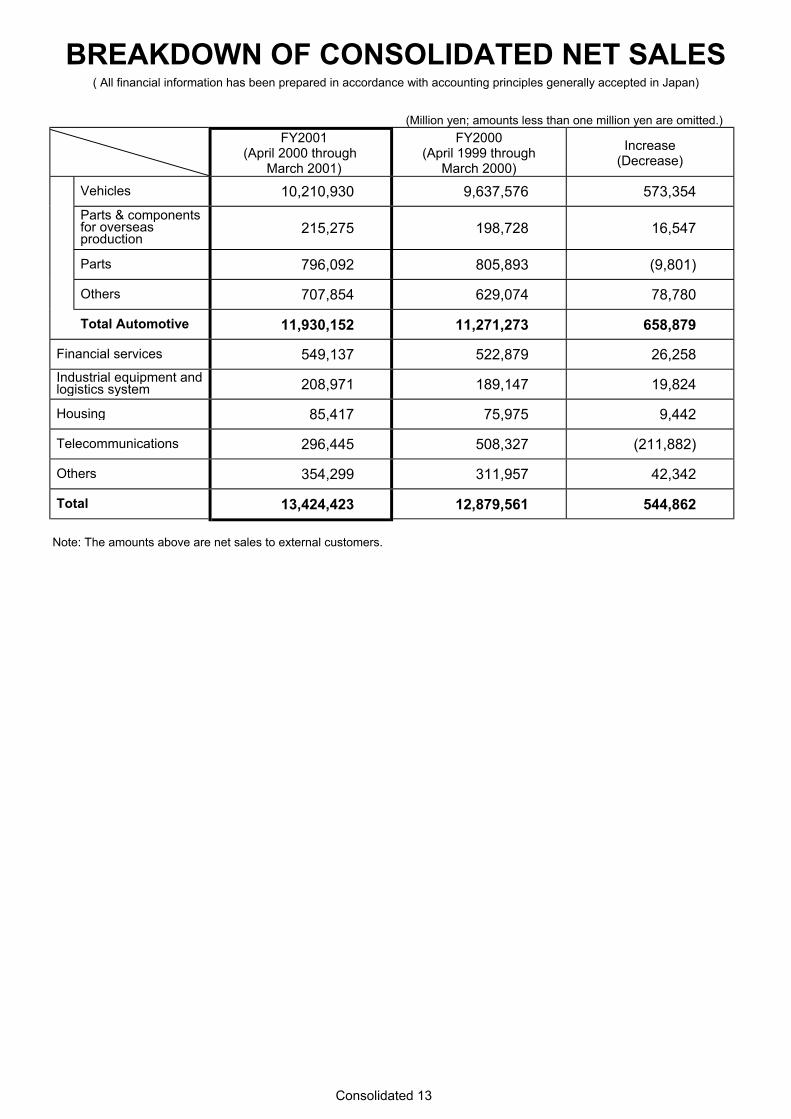
BREAKDOWN OF CONSOLIDATED NET SALES( All financial information has been prepared in accordance with accounting principles generally accepted in Japan)
(Million yen; amounts less than one million yen are omitted.)FY2001
(April 2000 throughMarch 2001)
FY2000(April 1999 through
March 2000)
Increase(Decrease)
Vehicles 10,210,930 9,637,576 573,354Parts & componentsfor overseasproduction
215,275 198,728 16,547
Parts 796,092 805,893 (9,801)
Others 707,854 629,074 78,780
Total Automotive 11,930,152 11,271,273 658,879
Financial services 549,137 522,879 26,258Industrial equipment andlogistics system 208,971 189,147 19,824
Housing 85,417 75,975 9,442
Telecommunications 296,445 508,327 (211,882)
Others 354,299 311,957 42,342
Total 13,424,423 12,879,561 544,862
Note: The amounts above are net sales to external customers.
Consolidated 14
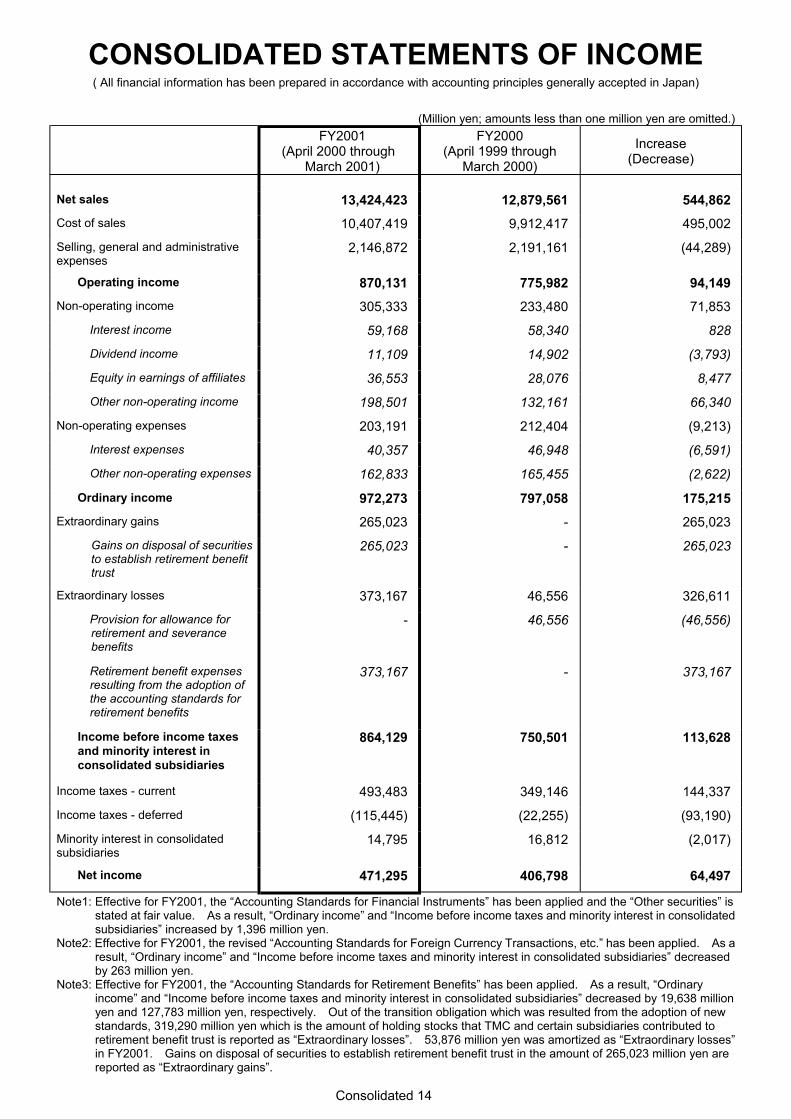
CONSOLIDATED STATEMENTS OF INCOME( All financial information has been prepared in accordance with accounting principles generally accepted in Japan)
(Million yen; amounts less than one million yen are omitted.)FY2001
(April 2000 throughMarch 2001)
FY2000(April 1999 through
March 2000)
Increase(Decrease)
Net sales 13,424,423 12,879,561 544,862Cost of sales 10,407,419 9,912,417 495,002
Selling, general and administrativeexpenses
2,146,872 2,191,161 (44,289)
Operating income 870,131 775,982 94,149Non-operating income 305,333 233,480 71,853
Interest income 59,168 58,340 828
Dividend income 11,109 14,902 (3,793)
Equity in earnings of affiliates 36,553 28,076 8,477
Other non-operating income 198,501 132,161 66,340
Non-operating expenses 203,191 212,404 (9,213)
Interest expenses 40,357 46,948 (6,591)
Other non-operating expenses 162,833 165,455 (2,622)
Ordinary income 972,273 797,058 175,215Extraordinary gains 265,023 - 265,023
Gains on disposal of securitiesto establish retirement benefittrust
265,023 - 265,023
Extraordinary losses 373,167 46,556 326,611
Provision for allowance forretirement and severancebenefits
- 46,556 (46,556)
Retirement benefit expensesresulting from the adoption ofthe accounting standards forretirement benefits
373,167 - 373,167
Income before income taxesand minority interest inconsolidated subsidiaries
864,129 750,501 113,628
Income taxes - current 493,483 349,146 144,337
Income taxes - deferred (115,445) (22,255) (93,190)
Minority interest in consolidatedsubsidiaries
14,795 16,812 (2,017)
Net income 471,295 406,798 64,497
Note1: Effective for FY2001, the “Accounting Standards for Financial Instruments” has been applied and the “Other securities” isstated at fair value. As a result, “Ordinary income” and “Income before income taxes and minority interest in consolidatedsubsidiaries” increased by 1,396 million yen.
Note2: Effective for FY2001, the revised “Accounting Standards for Foreign Currency Transactions, etc.” has been applied. As aresult, “Ordinary income” and “Income before income taxes and minority interest in consolidated subsidiaries” decreasedby 263 million yen.
Note3: Effective for FY2001, the “Accounting Standards for Retirement Benefits” has been applied. As a result, “Ordinaryincome” and “Income before income taxes and minority interest in consolidated subsidiaries” decreased by 19,638 millionyen and 127,783 million yen, respectively. Out of the transition obligation which was resulted from the adoption of newstandards, 319,290 million yen which is the amount of holding stocks that TMC and certain subsidiaries contributed toretirement benefit trust is reported as “Extraordinary losses”. 53,876 million yen was amortized as “Extraordinary losses”in FY2001. Gains on disposal of securities to establish retirement benefit trust in the amount of 265,023 million yen arereported as “Extraordinary gains”.
Consolidated 15
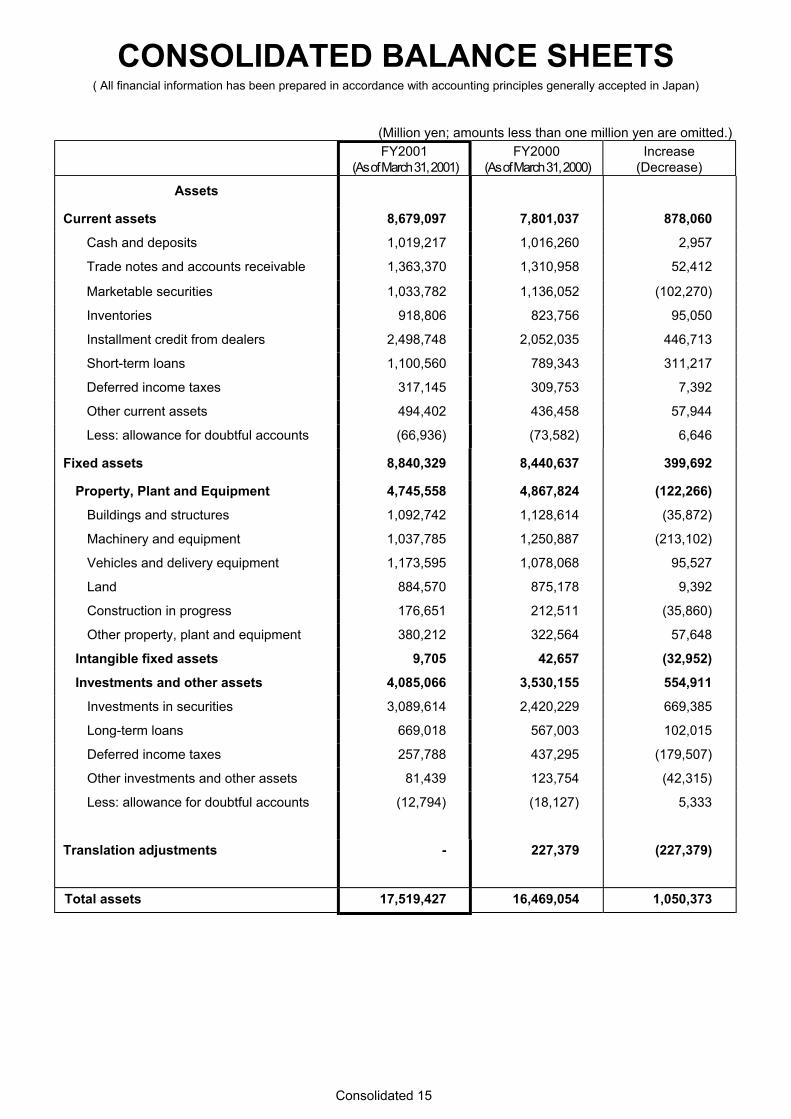
CONSOLIDATED BALANCE SHEETS( All financial information has been prepared in accordance with accounting principles generally accepted in Japan)
(Million yen; amounts less than one million yen are omitted.)FY2001
(As of March 31, 2001)FY2000
(As of March 31, 2000)Increase
(Decrease)
Assets
Current assets 8,679,097 7,801,037 878,060
Cash and deposits 1,019,217 1,016,260 2,957
Trade notes and accounts receivable 1,363,370 1,310,958 52,412
Marketable securities 1,033,782 1,136,052 (102,270)
Inventories 918,806 823,756 95,050
Installment credit from dealers 2,498,748 2,052,035 446,713
Short-term loans 1,100,560 789,343 311,217
Deferred income taxes 317,145 309,753 7,392
Other current assets 494,402 436,458 57,944
Less: allowance for doubtful accounts (66,936) (73,582) 6,646
Fixed assets 8,840,329 8,440,637 399,692
Property, Plant and Equipment 4,745,558 4,867,824 (122,266)
Buildings and structures 1,092,742 1,128,614 (35,872)
Machinery and equipment 1,037,785 1,250,887 (213,102)
Vehicles and delivery equipment 1,173,595 1,078,068 95,527
Land 884,570 875,178 9,392
Construction in progress 176,651 212,511 (35,860)
Other property, plant and equipment 380,212 322,564 57,648
Intangible fixed assets 9,705 42,657 (32,952)
Investments and other assets 4,085,066 3,530,155 554,911
Investments in securities 3,089,614 2,420,229 669,385
Long-term loans 669,018 567,003 102,015
Deferred income taxes 257,788 437,295 (179,507)
Other investments and other assets 81,439 123,754 (42,315)
Less: allowance for doubtful accounts (12,794) (18,127) 5,333
Translation adjustments - 227,379 (227,379)
Total assets 17,519,427 16,469,054 1,050,373
Consolidated 16
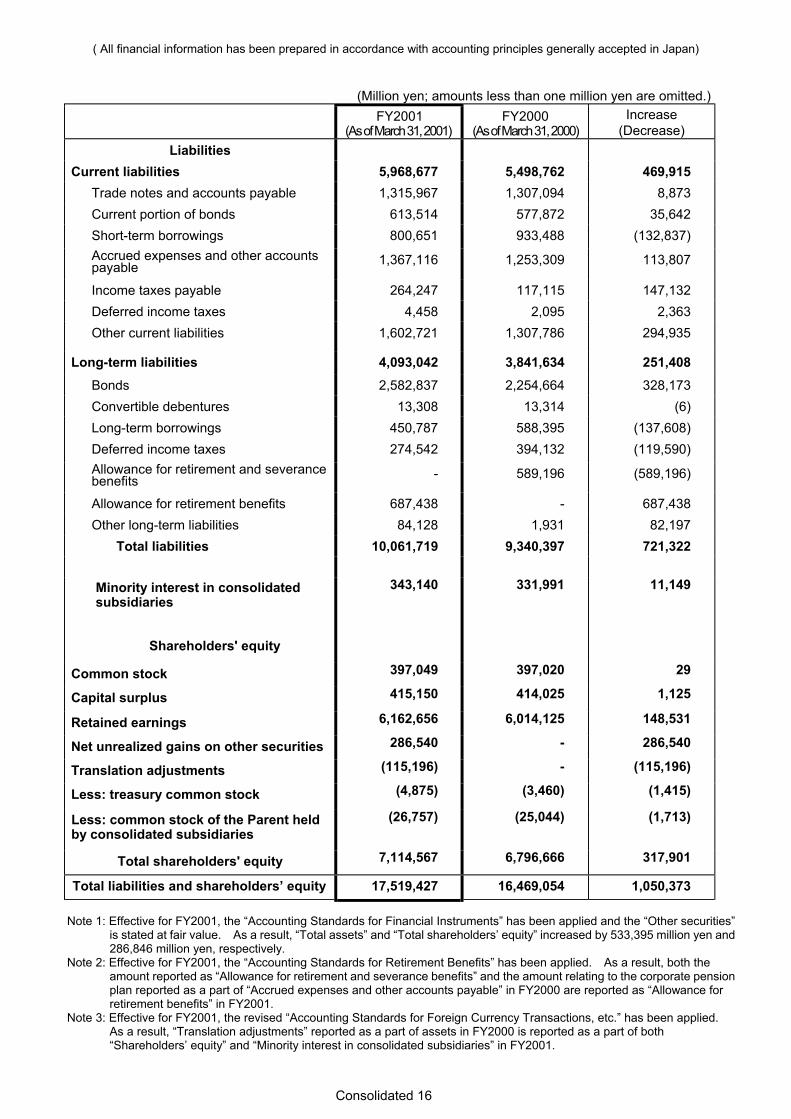
( All financial information has been prepared in accordance with accounting principles generally accepted in Japan)
(Million yen; amounts less than one million yen are omitted.)FY2001
(As of March 31, 2001)FY2000
(As of March 31, 2000)Increase
(Decrease)Liabilities
Current liabilities 5,968,677 5,498,762 469,915Trade notes and accounts payable 1,315,967 1,307,094 8,873Current portion of bonds 613,514 577,872 35,642Short-term borrowings 800,651 933,488 (132,837)Accrued expenses and other accountspayable 1,367,116 1,253,309 113,807
Income taxes payable 264,247 117,115 147,132Deferred income taxes 4,458 2,095 2,363Other current liabilities 1,602,721 1,307,786 294,935
Long-term liabilities 4,093,042 3,841,634 251,408Bonds 2,582,837 2,254,664 328,173Convertible debentures 13,308 13,314 (6)Long-term borrowings 450,787 588,395 (137,608)Deferred income taxes 274,542 394,132 (119,590)Allowance for retirement and severancebenefits - 589,196 (589,196)
Allowance for retirement benefits 687,438 - 687,438Other long-term liabilities 84,128 1,931 82,197
Total liabilities 10,061,719 9,340,397 721,322
Minority interest in consolidatedsubsidiaries
343,140 331,991 11,149
Shareholders' equity
Common stock 397,049 397,020 29
Capital surplus 415,150 414,025 1,125
Retained earnings 6,162,656 6,014,125 148,531
Net unrealized gains on other securities 286,540 - 286,540
Translation adjustments (115,196) - (115,196)
Less: treasury common stock (4,875) (3,460) (1,415)
Less: common stock of the Parent heldby consolidated subsidiaries
(26,757) (25,044) (1,713)
Total shareholders' equity 7,114,567 6,796,666 317,901
Total liabilities and shareholders’ equity 17,519,427 16,469,054 1,050,373
Note 1: Effective for FY2001, the “Accounting Standards for Financial Instruments” has been applied and the “Other securities”is stated at fair value. As a result, “Total assets” and “Total shareholders’ equity” increased by 533,395 million yen and286,846 million yen, respectively.
Note 2: Effective for FY2001, the “Accounting Standards for Retirement Benefits” has been applied. As a result, both theamount reported as “Allowance for retirement and severance benefits” and the amount relating to the corporate pensionplan reported as a part of “Accrued expenses and other accounts payable” in FY2000 are reported as “Allowance forretirement benefits” in FY2001.
Note 3: Effective for FY2001, the revised “Accounting Standards for Foreign Currency Transactions, etc.” has been applied.As a result, “Translation adjustments” reported as a part of assets in FY2000 is reported as a part of both“Shareholders’ equity” and “Minority interest in consolidated subsidiaries” in FY2001.
Consolidated 17
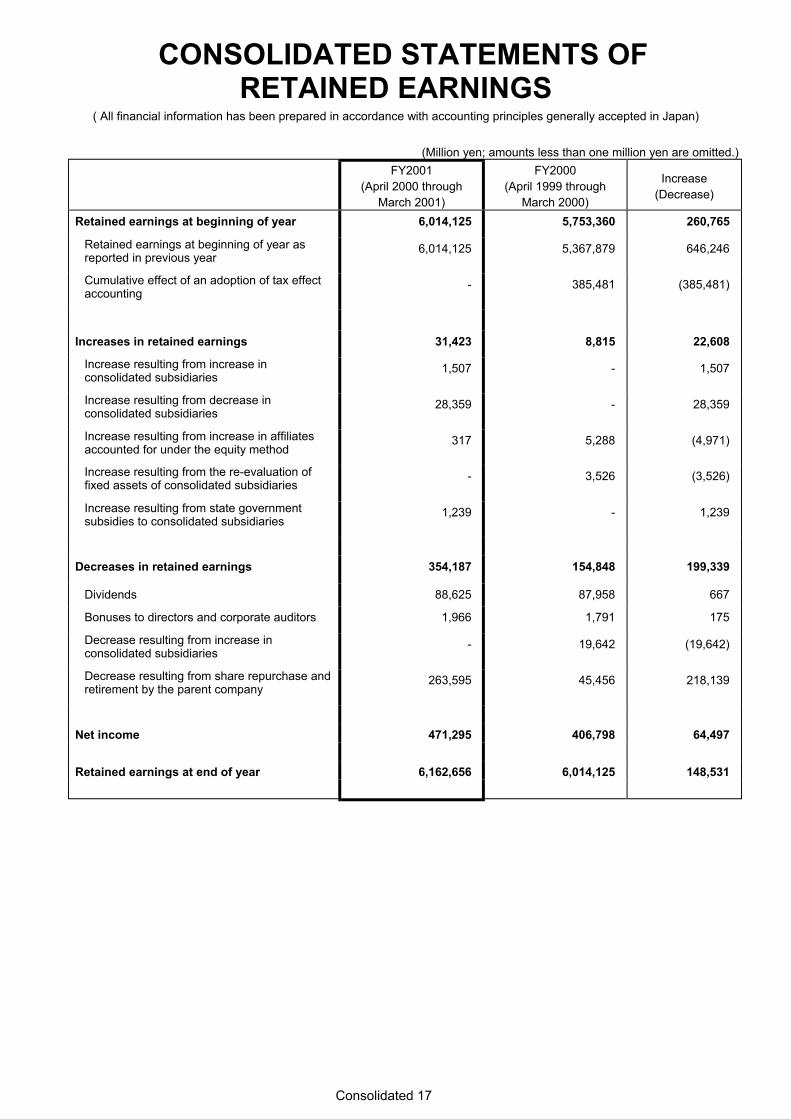
CONSOLIDATED STATEMENTS OFRETAINED EARNINGS
( All financial information has been prepared in accordance with accounting principles generally accepted in Japan)
(Million yen; amounts less than one million yen are omitted.)FY2001
(April 2000 throughMarch 2001)
FY2000(April 1999 through
March 2000)
Increase(Decrease)
Retained earnings at beginning of year 6,014,125 5,753,360 260,765
Retained earnings at beginning of year asreported in previous year
6,014,125 5,367,879 646,246
Cumulative effect of an adoption of tax effectaccounting
- 385,481 (385,481)
Increases in retained earnings 31,423 8,815 22,608
Increase resulting from increase inconsolidated subsidiaries
1,507 - 1,507
Increase resulting from decrease inconsolidated subsidiaries
28,359 - 28,359
Increase resulting from increase in affiliatesaccounted for under the equity method
317 5,288 (4,971)
Increase resulting from the re-evaluation offixed assets of consolidated subsidiaries
- 3,526 (3,526)
Increase resulting from state governmentsubsidies to consolidated subsidiaries
1,239 - 1,239
Decreases in retained earnings 354,187 154,848 199,339
Dividends 88,625 87,958 667
Bonuses to directors and corporate auditors 1,966 1,791 175
Decrease resulting from increase inconsolidated subsidiaries
- 19,642 (19,642)
Decrease resulting from share repurchase andretirement by the parent company
263,595 45,456 218,139
Net income 471,295 406,798 64,497
Retained earnings at end of year 6,162,656 6,014,125 148,531
Consolidated 18
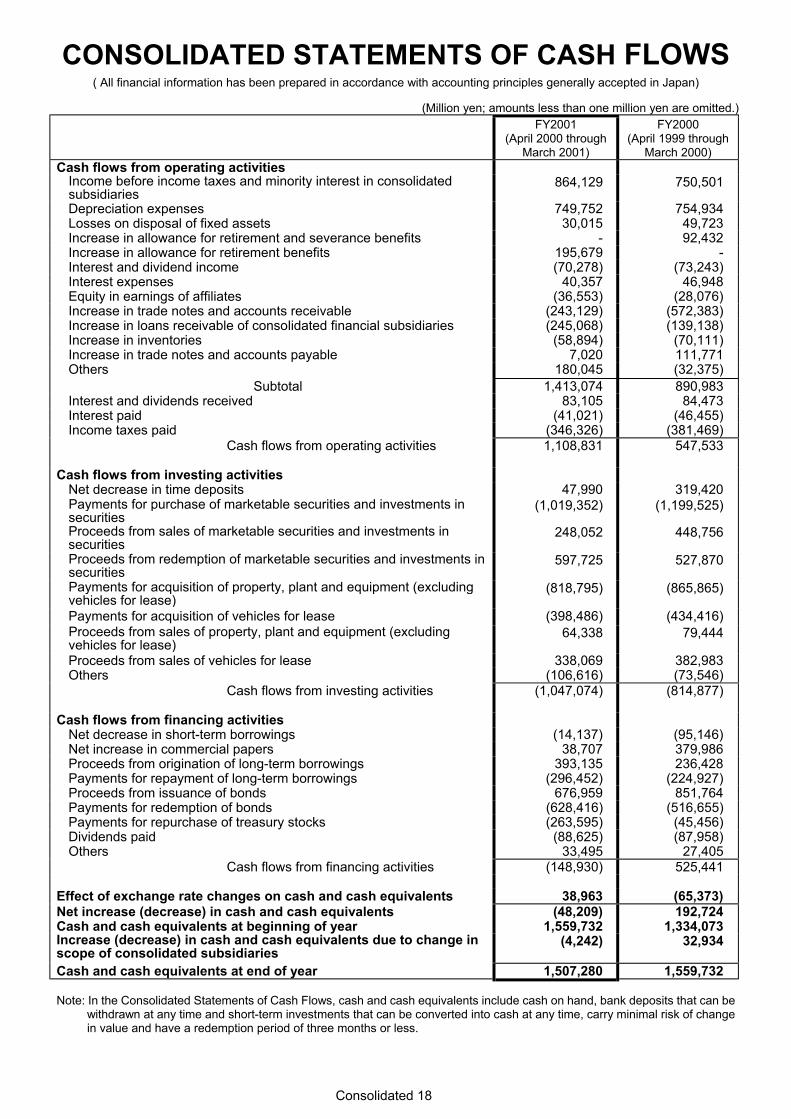
CONSOLIDATED STATEMENTS OF CASH FLOWS( All financial information has been prepared in accordance with accounting principles generally accepted in Japan)
(Million yen; amounts less than one million yen are omitted.)FY2001
(April 2000 throughMarch 2001)
FY2000(April 1999 through
March 2000)Cash flows from operating activities
Income before income taxes and minority interest in consolidatedsubsidiaries
864,129 750,501
Depreciation expenses 749,752 754,934Losses on disposal of fixed assets 30,015 49,723Increase in allowance for retirement and severance benefits - 92,432Increase in allowance for retirement benefits 195,679 -Interest and dividend income (70,278) (73,243)Interest expenses 40,357 46,948Equity in earnings of affiliates (36,553) (28,076)Increase in trade notes and accounts receivable (243,129) (572,383)Increase in loans receivable of consolidated financial subsidiaries (245,068) (139,138)Increase in inventories (58,894) (70,111)Increase in trade notes and accounts payable 7,020 111,771Others 180,045 (32,375)
Subtotal 1,413,074 890,983Interest and dividends received 83,105 84,473Interest paid (41,021) (46,455)Income taxes paid (346,326) (381,469)
Cash flows from operating activities 1,108,831 547,533
Cash flows from investing activitiesNet decrease in time deposits 47,990 319,420Payments for purchase of marketable securities and investments insecurities
(1,019,352) (1,199,525)
Proceeds from sales of marketable securities and investments insecurities
248,052 448,756
Proceeds from redemption of marketable securities and investments insecurities
597,725 527,870
Payments for acquisition of property, plant and equipment (excludingvehicles for lease)
(818,795) (865,865)
Payments for acquisition of vehicles for lease (398,486) (434,416)Proceeds from sales of property, plant and equipment (excludingvehicles for lease)
64,338 79,444
Proceeds from sales of vehicles for lease 338,069 382,983Others (106,616) (73,546)
Cash flows from investing activities (1,047,074) (814,877)
Cash flows from financing activitiesNet decrease in short-term borrowings (14,137) (95,146)Net increase in commercial papers 38,707 379,986Proceeds from origination of long-term borrowings 393,135 236,428Payments for repayment of long-term borrowings (296,452) (224,927)Proceeds from issuance of bonds 676,959 851,764Payments for redemption of bonds (628,416) (516,655)Payments for repurchase of treasury stocks (263,595) (45,456)Dividends paid (88,625) (87,958)Others 33,495 27,405
Cash flows from financing activities (148,930) 525,441
Effect of exchange rate changes on cash and cash equivalents 38,963 (65,373)Net increase (decrease) in cash and cash equivalents (48,209) 192,724Cash and cash equivalents at beginning of year 1,559,732 1,334,073Increase (decrease) in cash and cash equivalents due to change inscope of consolidated subsidiaries
(4,242) 32,934
Cash and cash equivalents at end of year 1,507,280 1,559,732
Note: In the Consolidated Statements of Cash Flows, cash and cash equivalents include cash on hand, bank deposits that can bewithdrawn at any time and short-term investments that can be converted into cash at any time, carry minimal risk of changein value and have a redemption period of three months or less.
Consolidated 19
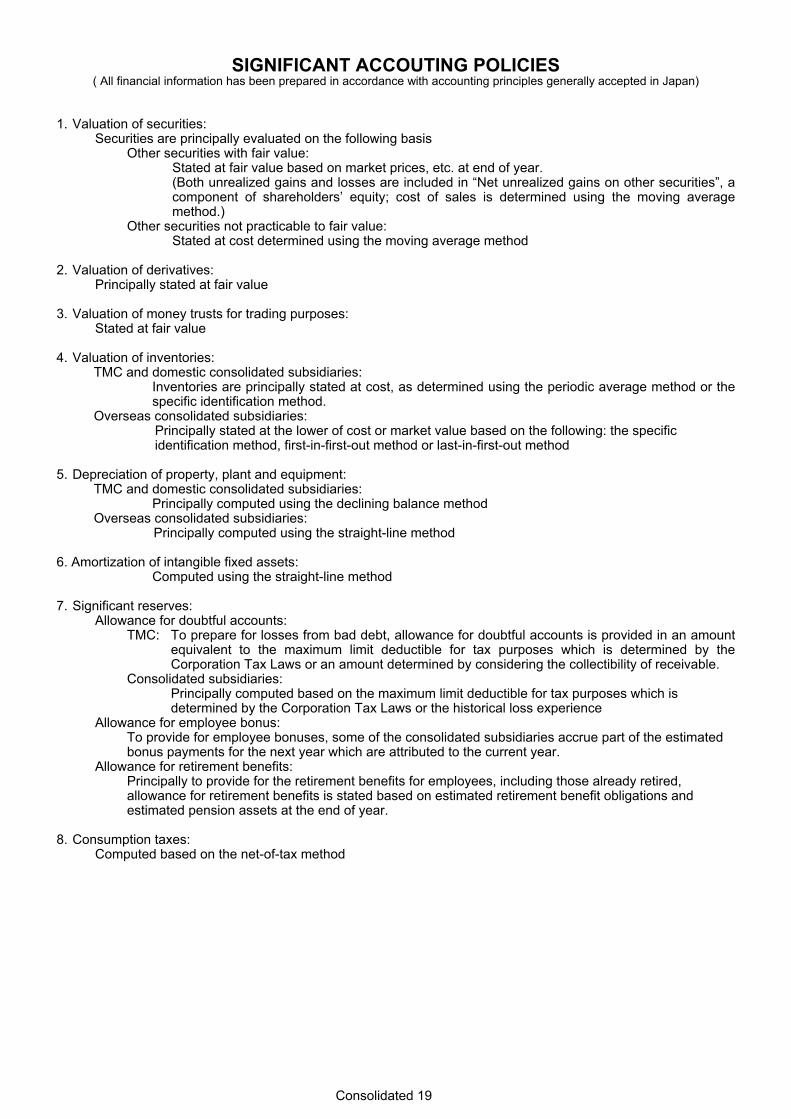
SIGNIFICANT ACCOUTING POLICIES( All financial information has been prepared in accordance with accounting principles generally accepted in Japan)
1. Valuation of securities:Securities are principally evaluated on the following basis
Other securities with fair value:Stated at fair value based on market prices, etc. at end of year.(Both unrealized gains and losses are included in “Net unrealized gains on other securities”, acomponent of shareholders’ equity; cost of sales is determined using the moving averagemethod.)
Other securities not practicable to fair value:Stated at cost determined using the moving average method
2. Valuation of derivatives:Principally stated at fair value
3. Valuation of money trusts for trading purposes:Stated at fair value
4. Valuation of inventories:TMC and domestic consolidated subsidiaries:
Inventories are principally stated at cost, as determined using the periodic average method or thespecific identification method.
Overseas consolidated subsidiaries:Principally stated at the lower of cost or market value based on the following: the specificidentification method, first-in-first-out method or last-in-first-out method
5. Depreciation of property, plant and equipment:TMC and domestic consolidated subsidiaries:
Principally computed using the declining balance methodOverseas consolidated subsidiaries:
Principally computed using the straight-line method
6. Amortization of intangible fixed assets:Computed using the straight-line method
7. Significant reserves:Allowance for doubtful accounts:
TMC: To prepare for losses from bad debt, allowance for doubtful accounts is provided in an amountequivalent to the maximum limit deductible for tax purposes which is determined by theCorporation Tax Laws or an amount determined by considering the collectibility of receivable.
Consolidated subsidiaries:Principally computed based on the maximum limit deductible for tax purposes which isdetermined by the Corporation Tax Laws or the historical loss experience
Allowance for employee bonus:To provide for employee bonuses, some of the consolidated subsidiaries accrue part of the estimatedbonus payments for the next year which are attributed to the current year.
Allowance for retirement benefits:Principally to provide for the retirement benefits for employees, including those already retired,allowance for retirement benefits is stated based on estimated retirement benefit obligations andestimated pension assets at the end of year.
8. Consumption taxes:Computed based on the net-of-tax method
Consolidated 20
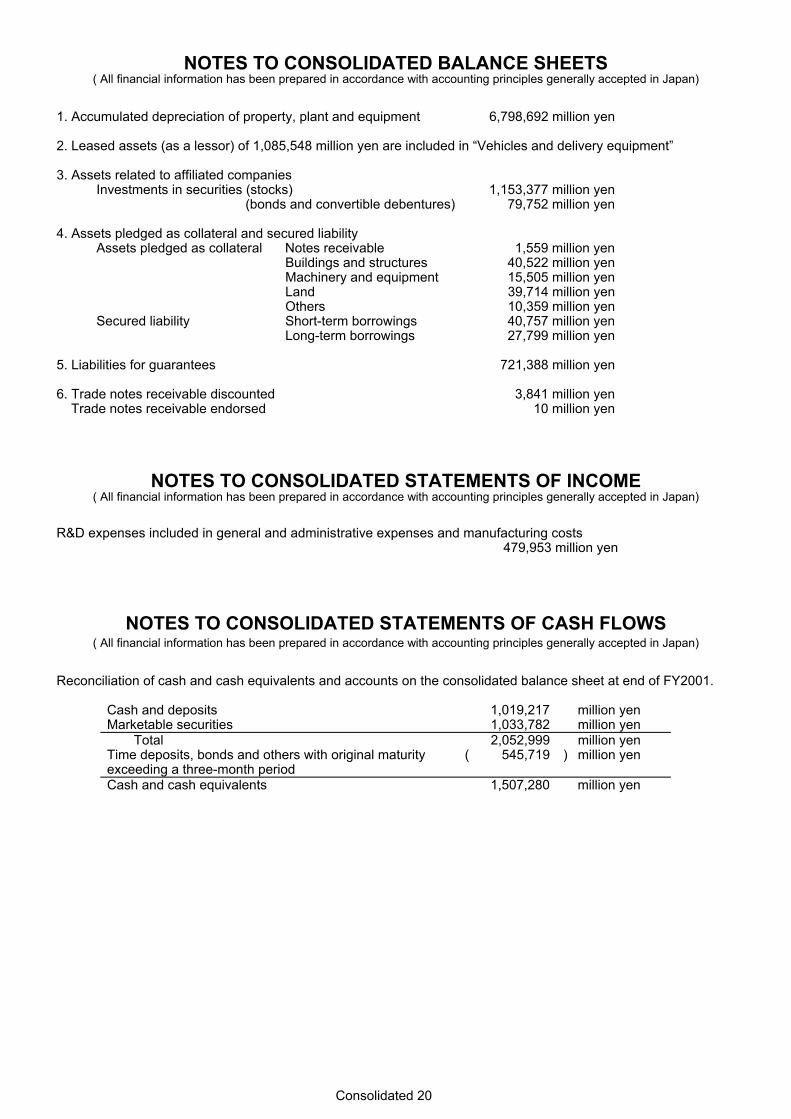
NOTES TO CONSOLIDATED BALANCE SHEETS( All financial information has been prepared in accordance with accounting principles generally accepted in Japan)
1. Accumulated depreciation of property, plant and equipment 6,798,692 million yen
2. Leased assets (as a lessor) of 1,085,548 million yen are included in “Vehicles and delivery equipment”
3. Assets related to affiliated companiesInvestments in securities (stocks) 1,153,377 million yen
(bonds and convertible debentures) 79,752 million yen
4. Assets pledged as collateral and secured liabilityAssets pledged as collateral Notes receivable 1,559 million yen
Buildings and structures 40,522 million yenMachinery and equipment 15,505 million yenLand 39,714 million yenOthers 10,359 million yen
Secured liability Short-term borrowings 40,757 million yenLong-term borrowings 27,799 million yen
5. Liabilities for guarantees 721,388 million yen
6. Trade notes receivable discounted 3,841 million yenTrade notes receivable endorsed 10 million yen
NOTES TO CONSOLIDATED STATEMENTS OF INCOME( All financial information has been prepared in accordance with accounting principles generally accepted in Japan)
R&D expenses included in general and administrative expenses and manufacturing costs479,953 million yen
NOTES TO CONSOLIDATED STATEMENTS OF CASH FLOWS( All financial information has been prepared in accordance with accounting principles generally accepted in Japan)
Reconciliation of cash and cash equivalents and accounts on the consolidated balance sheet at end of FY2001.
Cash and deposits 1,019,217 million yenMarketable securities 1,033,782 million yen Total 2,052,999 million yenTime deposits, bonds and others with original maturityexceeding a three-month period
( 545,719 ) million yen
Cash and cash equivalents 1,507,280 million yen
Consolidated 21
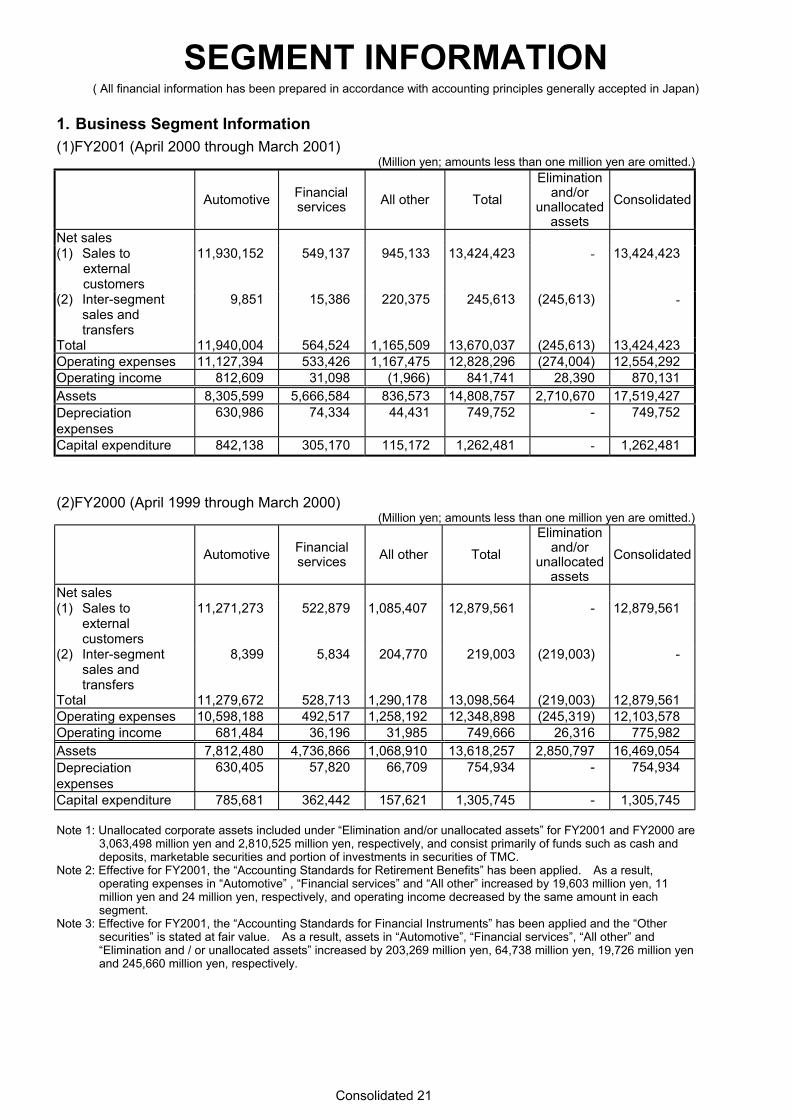
SEGMENT INFORMATION( All financial information has been prepared in accordance with accounting principles generally accepted in Japan)
1. Business Segment Information(1)FY2001 (April 2000 through March 2001)
(Million yen; amounts less than one million yen are omitted.)
Automotive Financialservices All other Total
Eliminationand/or
unallocatedassets
Consolidated
Net sales(1) Sales to
externalcustomers
11,930,152 549,137 945,133 13,424,423 - 13,424,423
(2) Inter-segmentsales andtransfers
9,851 15,386 220,375 245,613 (245,613) -
Total 11,940,004 564,524 1,165,509 13,670,037 (245,613) 13,424,423Operating expenses 11,127,394 533,426 1,167,475 12,828,296 (274,004) 12,554,292Operating income 812,609 31,098 (1,966) 841,741 28,390 870,131Assets 8,305,599 5,666,584 836,573 14,808,757 2,710,670 17,519,427Depreciationexpenses
630,986 74,334 44,431 749,752 - 749,752
Capital expenditure 842,138 305,170 115,172 1,262,481 - 1,262,481
(2)FY2000 (April 1999 through March 2000)(Million yen; amounts less than one million yen are omitted.)
Automotive Financialservices All other Total
Eliminationand/or
unallocatedassets
Consolidated
Net sales(1) Sales to
externalcustomers
11,271,273 522,879 1,085,407 12,879,561 - 12,879,561
(2) Inter-segmentsales andtransfers
8,399 5,834 204,770 219,003 (219,003) -
Total 11,279,672 528,713 1,290,178 13,098,564 (219,003) 12,879,561Operating expenses 10,598,188 492,517 1,258,192 12,348,898 (245,319) 12,103,578Operating income 681,484 36,196 31,985 749,666 26,316 775,982Assets 7,812,480 4,736,866 1,068,910 13,618,257 2,850,797 16,469,054Depreciationexpenses
630,405 57,820 66,709 754,934 - 754,934
Capital expenditure 785,681 362,442 157,621 1,305,745 - 1,305,745
Note 1: Unallocated corporate assets included under “Elimination and/or unallocated assets” for FY2001 and FY2000 are3,063,498 million yen and 2,810,525 million yen, respectively, and consist primarily of funds such as cash anddeposits, marketable securities and portion of investments in securities of TMC.
Note 2: Effective for FY2001, the “Accounting Standards for Retirement Benefits” has been applied. As a result,operating expenses in “Automotive” , “Financial services” and “All other” increased by 19,603 million yen, 11million yen and 24 million yen, respectively, and operating income decreased by the same amount in eachsegment.
Note 3: Effective for FY2001, the “Accounting Standards for Financial Instruments” has been applied and the “Othersecurities” is stated at fair value. As a result, assets in “Automotive”, “Financial services”, “All other” and“Elimination and / or unallocated assets” increased by 203,269 million yen, 64,738 million yen, 19,726 million yenand 245,660 million yen, respectively.
Consolidated 22
( All financial information has been prepared in accordance with accounting principles generally accepted in Japan)
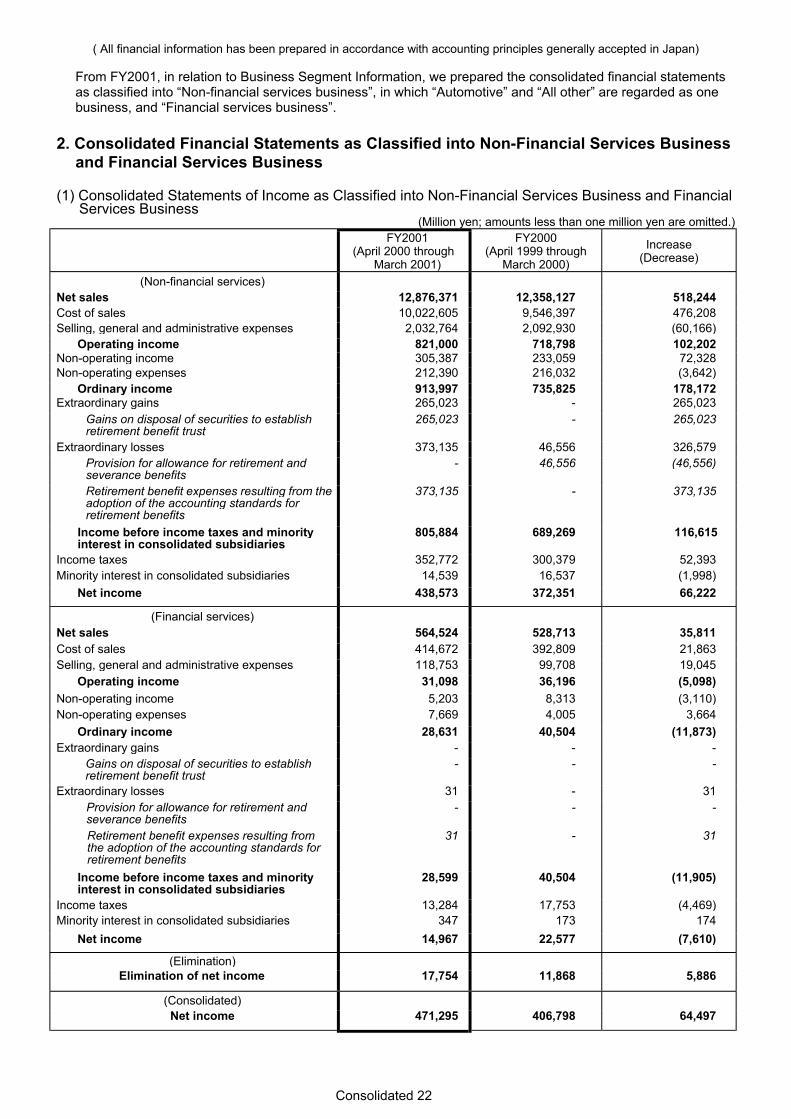
From FY2001, in relation to Business Segment Information, we prepared the consolidated financial statementsas classified into “Non-financial services business”, in which “Automotive” and “All other” are regarded as onebusiness, and “Financial services business”.
2. Consolidated Financial Statements as Classified into Non-Financial Services Businessand Financial Services Business
(1) Consolidated Statements of Income as Classified into Non-Financial Services Business and FinancialServices Business
(Million yen; amounts less than one million yen are omitted.)FY2001
(April 2000 throughMarch 2001)
FY2000(April 1999 through
March 2000)Increase
(Decrease)
(Non-financial services)Net sales 12,876,371 12,358,127 518,244Cost of sales 10,022,605 9,546,397 476,208Selling, general and administrative expenses 2,032,764 2,092,930 (60,166)
Operating income 821,000 718,798 102,202Non-operating income 305,387 233,059 72,328Non-operating expenses 212,390 216,032 (3,642)
Ordinary income 913,997 735,825 178,172Extraordinary gains 265,023 - 265,023
Gains on disposal of securities to establishretirement benefit trust
265,023 - 265,023
Extraordinary losses 373,135 46,556 326,579Provision for allowance for retirement andseverance benefits
- 46,556 (46,556)
Retirement benefit expenses resulting from theadoption of the accounting standards forretirement benefits
373,135 - 373,135
Income before income taxes and minorityinterest in consolidated subsidiaries
805,884 689,269 116,615
Income taxes 352,772 300,379 52,393Minority interest in consolidated subsidiaries 14,539 16,537 (1,998)
Net income 438,573 372,351 66,222
(Financial services)Net sales 564,524 528,713 35,811Cost of sales 414,672 392,809 21,863Selling, general and administrative expenses 118,753 99,708 19,045
Operating income 31,098 36,196 (5,098)Non-operating income 5,203 8,313 (3,110)Non-operating expenses 7,669 4,005 3,664
Ordinary income 28,631 40,504 (11,873)Extraordinary gains - - -
Gains on disposal of securities to establishretirement benefit trust
- - -
Extraordinary losses 31 - 31Provision for allowance for retirement andseverance benefits
- - -
Retirement benefit expenses resulting fromthe adoption of the accounting standards forretirement benefits
31 - 31
Income before income taxes and minorityinterest in consolidated subsidiaries
28,599 40,504 (11,905)
Income taxes 13,284 17,753 (4,469)Minority interest in consolidated subsidiaries 347 173 174
Net income 14,967 22,577 (7,610)
(Elimination)Elimination of net income 17,754 11,868 5,886
(Consolidated)Net income 471,295 406,798 64,497
Consolidated 23
( All financial information has been prepared in accordance with accounting principles generally accepted in Japan)
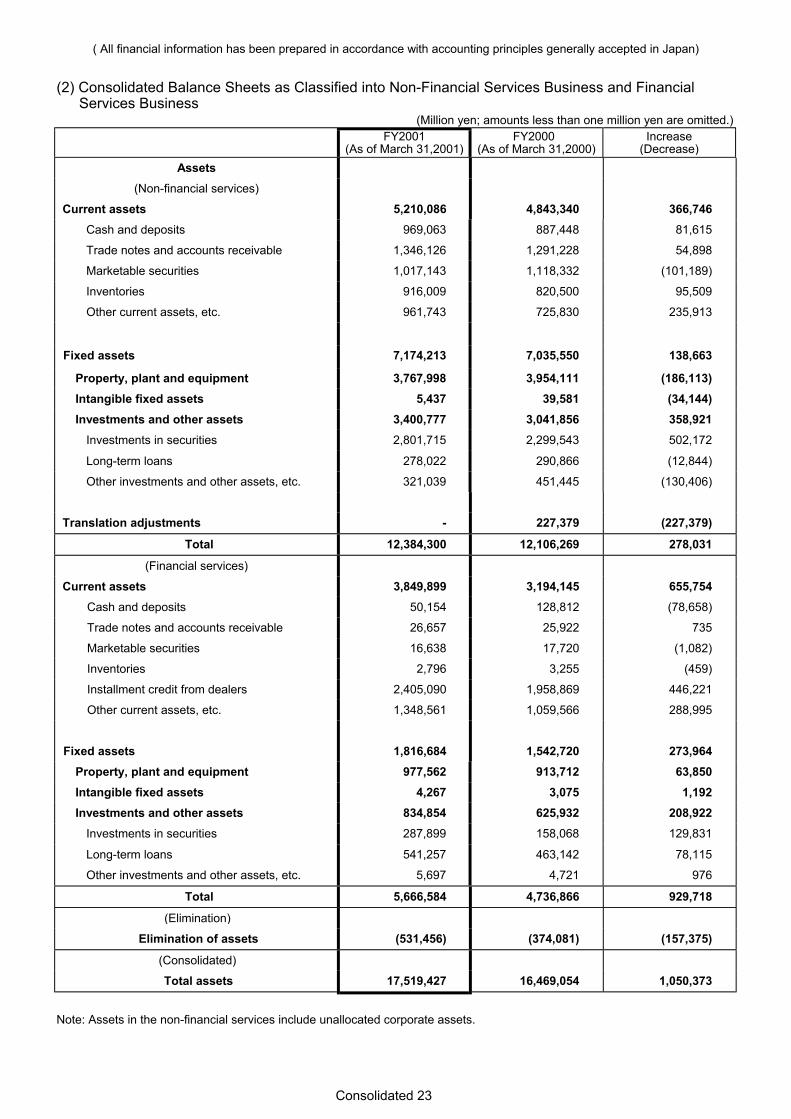
(2) Consolidated Balance Sheets as Classified into Non-Financial Services Business and FinancialServices Business
(Million yen; amounts less than one million yen are omitted.)FY2001
(As of March 31,2001)FY2000
(As of March 31,2000)Increase
(Decrease)Assets
(Non-financial services)
Current assets 5,210,086 4,843,340 366,746Cash and deposits 969,063 887,448 81,615
Trade notes and accounts receivable 1,346,126 1,291,228 54,898
Marketable securities 1,017,143 1,118,332 (101,189)
Inventories 916,009 820,500 95,509
Other current assets, etc. 961,743 725,830 235,913
Fixed assets 7,174,213 7,035,550 138,663
Property, plant and equipment 3,767,998 3,954,111 (186,113)Intangible fixed assets 5,437 39,581 (34,144)Investments and other assets 3,400,777 3,041,856 358,921
Investments in securities 2,801,715 2,299,543 502,172
Long-term loans 278,022 290,866 (12,844)
Other investments and other assets, etc. 321,039 451,445 (130,406)
Translation adjustments - 227,379 (227,379)
Total 12,384,300 12,106,269 278,031
(Financial services)
Current assets 3,849,899 3,194,145 655,754Cash and deposits 50,154 128,812 (78,658)
Trade notes and accounts receivable 26,657 25,922 735
Marketable securities 16,638 17,720 (1,082)
Inventories 2,796 3,255 (459)
Installment credit from dealers 2,405,090 1,958,869 446,221
Other current assets, etc. 1,348,561 1,059,566 288,995
Fixed assets 1,816,684 1,542,720 273,964Property, plant and equipment 977,562 913,712 63,850Intangible fixed assets 4,267 3,075 1,192Investments and other assets 834,854 625,932 208,922
Investments in securities 287,899 158,068 129,831
Long-term loans 541,257 463,142 78,115
Other investments and other assets, etc. 5,697 4,721 976
Total 5,666,584 4,736,866 929,718
(Elimination)
Elimination of assets (531,456) (374,081) (157,375)
(Consolidated)
Total assets 17,519,427 16,469,054 1,050,373
Note: Assets in the non-financial services include unallocated corporate assets.
Consolidated 24
( All financial information has been prepared in accordance with accounting principles generally accepted in Japan)
(Million yen; amounts less than one million yen are omitted.)FY2001
(As of March 31,2001)FY2000
(As of March 31,2000)Increase
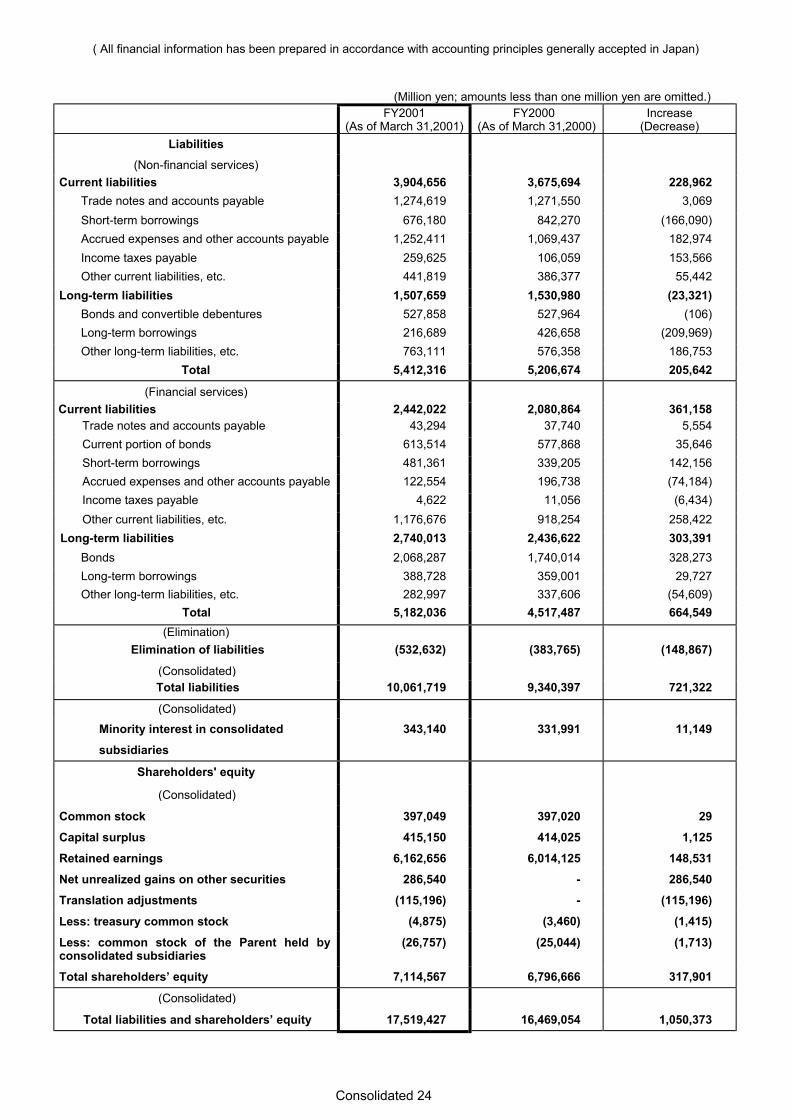
(Decrease)Liabilities
(Non-financial services)Current liabilities 3,904,656 3,675,694 228,962
Trade notes and accounts payable 1,274,619 1,271,550 3,069Short-term borrowings 676,180 842,270 (166,090)Accrued expenses and other accounts payable 1,252,411 1,069,437 182,974Income taxes payable 259,625 106,059 153,566Other current liabilities, etc. 441,819 386,377 55,442
Long-term liabilities 1,507,659 1,530,980 (23,321)Bonds and convertible debentures 527,858 527,964 (106)Long-term borrowings 216,689 426,658 (209,969)Other long-term liabilities, etc. 763,111 576,358 186,753
Total 5,412,316 5,206,674 205,642
(Financial services)Current liabilities 2,442,022 2,080,864 361,158
Trade notes and accounts payable 43,294 37,740 5,554Current portion of bonds 613,514 577,868 35,646Short-term borrowings 481,361 339,205 142,156Accrued expenses and other accounts payable 122,554 196,738 (74,184)Income taxes payable 4,622 11,056 (6,434)Other current liabilities, etc. 1,176,676 918,254 258,422
Long-term liabilities 2,740,013 2,436,622 303,391Bonds 2,068,287 1,740,014 328,273Long-term borrowings 388,728 359,001 29,727Other long-term liabilities, etc. 282,997 337,606 (54,609)
Total 5,182,036 4,517,487 664,549(Elimination)
Elimination of liabilities (532,632) (383,765) (148,867)
(Consolidated)Total liabilities 10,061,719 9,340,397 721,322
(Consolidated)Minority interest in consolidatedsubsidiaries
343,140 331,991 11,149
Shareholders' equity
(Consolidated)
Common stock 397,049 397,020 29Capital surplus 415,150 414,025 1,125Retained earnings 6,162,656 6,014,125 148,531Net unrealized gains on other securities 286,540 - 286,540Translation adjustments (115,196) - (115,196)Less: treasury common stock (4,875) (3,460) (1,415)Less: common stock of the Parent held byconsolidated subsidiaries
(26,757) (25,044) (1,713)
Total shareholders’ equity 7,114,567 6,796,666 317,901
(Consolidated)
Total liabilities and shareholders’ equity 17,519,427 16,469,054 1,050,373
Consolidated 25
( All financial information has been prepared in accordance with accounting principles generally accepted in Japan)
(3) Consolidated Statement of Cash Flows as Classified into Non-Financial Services Business andFinancial Services Business
(Million yen; amounts less than one million yen are omitted.)FY2001
(April 2000 through March 2001)
(Non-financial services)Cash flows from operating activities
Income before income taxes and minority interest in consolidatedsubsidiaries
805,884
Depreciation expenses 675,417Losses on disposal of fixed assets 29,147Increase in allowance for retirement benefits 195,207Interest and dividend income (74,694)Interest expenses 53,260Equity in earnings of affiliates (34,762)Increase in trade notes and accounts receivable (108,006)Increase in inventories (59,186)Increase in trade notes and accounts payable 5,472Others 47,523
Subtotal 1,535,264Interest and dividends received 86,297Interest paid (53,923)Income taxes paid (331,160)
Cash flows from operating activities 1,236,477
Cash flows from investing activitiesNet decrease in time deposits 44,772Payments for purchase of marketable securities and investments insecurities
(681,978)
Proceeds from sales of marketable securities and investments insecurities
104,625
Proceeds from redemption of marketable securities and investments insecurities
532,398
Payments for acquisition of property, plant and equipment (excludingvehicles for lease)
(769,313)
Payments for acquisition of vehicles for lease (145,115)Proceeds from sales of property, plant and equipment (excludingvehicles for lease)
55,312
Proceeds from sales of vehicles for lease 68,274Others (115,700)
Cash flows from investing activities (906,724)
Cash flows from financing activitiesNet decrease in short-term borrowings (47,456)Net decrease in commercial papers (4,370)Proceeds from origination of long-term borrowings 229,774Payments for repayment of long-term borrowings (196,169)Payments for repurchase of treasury stocks (263,595)Dividends paid (88,625)Others 33,495
Cash flows from financing activities (336,947)
Effect of exchange rate changes on cash and cash equivalents 35,573Net increase in cash and cash equivalents 28,378Cash and cash equivalents at beginning of year 1,429,012Decrease in cash and cash equivalents due to change in scope ofconsolidated subsidiaries
(4,242)
Cash and cash equivalents at end of year 1,453,148
Consolidated 26
( All financial information has been prepared in accordance with accounting principles generally accepted in Japan)
(Million yen; amounts less than one million yen are omitted.)FY2001
(April 2000 through March 2001)
(Financial services)Cash flows from operating activities
Income before income taxes and minority interest in consolidatedsubsidiaries
28,599
Depreciation expenses 74,334Equity in earnings of affiliates (1,791)Increase in trade notes and accounts receivable (138,313)Increase in loans receivable of consolidated financial subsidiaries (245,068)Others 165,653
Subtotal (116,585)Interest and dividends received 1,267Income taxes paid (15,166)
Cash flows from operating activities (130,484)
Cash flows from investing activitiesNet decrease in time deposits 3,218Payments for purchase of marketable securities and investments insecurities
(337,374)
Proceeds from sales of marketable securities and investments insecurities
143,426
Proceeds from redemption of marketable securities and investments insecurities
65,326
Payments for acquisition of property, plant and equipment (excludingvehicles for lease)
(49,481)
Payments for acquisition of vehicles for lease (253,371)Proceeds from sales of property, plant and equipment (excludingvehicles for lease)
9,025
Proceeds from sales of vehicles for lease 269,794Others (52,602)
Cash flows from investing activities (202,036)
Cash flows from financing activitiesNet increase in short-term borrowings 94,763Net increase in commercial papers 43,078Proceeds from origination of long-term borrowings 220,371Payments for repayment of long-term borrowings (156,776)Proceeds from issuance of bonds 676,959Payments for redemption of bonds (628,416)Others 2,564
Cash flows from financing activities 252,543
Effect of exchange rate changes on cash and cash equivalents 3,390Net decrease in cash and cash equivalents (76,587)Cash and cash equivalents at beginning of year 130,720Cash and cash equivalents at end of year 54,132
(Consolidated)Effect of exchange rate changes on cash and cash equivalents 38,963Net decrease in cash and cash equivalents (48,209)Cash and cash equivalents at beginning of year 1,559,732Decrease in cash and cash equivalents due to change in scope ofconsolidated subsidiaries
(4,242)
Cash and cash equivalents at end of year 1,507,280
Note: In the Consolidated Statement of Cash Flows, cash and cash equivalents include cash on hand, bank deposits that can bewithdrawn at any time and short-term investments that can be converted into cash at any time, carry minimal risk of changein value and have a redemption period of three months or less.
Consolidated 27
( All financial information has been prepared in accordance with accounting principles generally accepted in Japan)
3. Geographical Segment Information
(1) FY2001 (April 2000 through March 2001)(Million yen; amounts less than one million yen are omitted.)
Japan NorthAmerica Europe Other Total
Eliminationand/or
unallocatedassets
Consolidated
Net sales(1) Sales to
externalcustomers
6,747,016 4,800,592 1,015,766 861,047 13,424,423 - 13,424,423
(2) Inter-segmentsales andtransfers
3,308,987 164,279 31,294 81,728 3,586,291 (3,586,291) -
Total 10,056,003 4,964,872 1,047,061 942,776 17,010,714 (3,586,291) 13,424,423Operatingexpenses
9,385,712 4,759,075 1,070,079 932,960 16,147,829 (3,593,536) 12,554,292
Operatingincome
670,290 205,797 (23,018) 9,815 862,885 7,245 870,131
Assets 8,418,688 5,344,414 890,483 666,923 15,320,510 2,198,917 17,519,427
(2) FY2000 (April 1999 through March 2000)(Million yen; amounts less than one million yen are omitted.)
Japan NorthAmerica Europe Other Total
Eliminationand/or
unallocatedassets
Consolidated
Net sales(1) Sales to
externalcustomers
6,495,414 4,526,653 1,090,312 767,181 12,879,561 - 12,879,561
(2) Inter-segmentsales andtransfers
3,113,031 141,168 14,564 63,254 3,332,018 (3,332,018) -
Total 9,608,445 4,667,821 1,104,877 830,435 16,211,579 (3,332,018) 12,879,561Operatingexpenses
9,020,094 4,503,777 1,113,657 825,397 15,462,926 (3,359,347) 12,103,578
Operatingincome
588,350 164,043 (8,779) 5,037 748,652 27,329 775,982
Assets 8,329,144 4,272,890 849,366 618,700 14,070,101 2,398,953 16,469,054
Note 1: Unallocated corporate assets included under “Elimination and/or unallocated assets” for FY2001 and FY2000 are3,063,498 million yen and 2,810,525 million yen, respectively, and consist primarily of funds such as cash and deposits,marketable securities and portion of investments in securities of TMC.
Note 2: Effective for FY2001, the “Accounting Standards for Retirement Benefits” has been applied. As a result, operatingexpenses of “Japan” increased by 19,638 million yen and operating income decreased by the same amount.
Note 3: Effective for FY2001, the “Accounting Standards for Financial Instruments” has been applied and the “Other securities”is stated at fair value. As a result, assets of “Japan” and “Elimination and / or unallocated assets” increased by 287,734million yen and 245,660 million yen, respectively.
Consolidated 28
( All financial information has been prepared in accordance with accounting principles generally accepted in Japan)
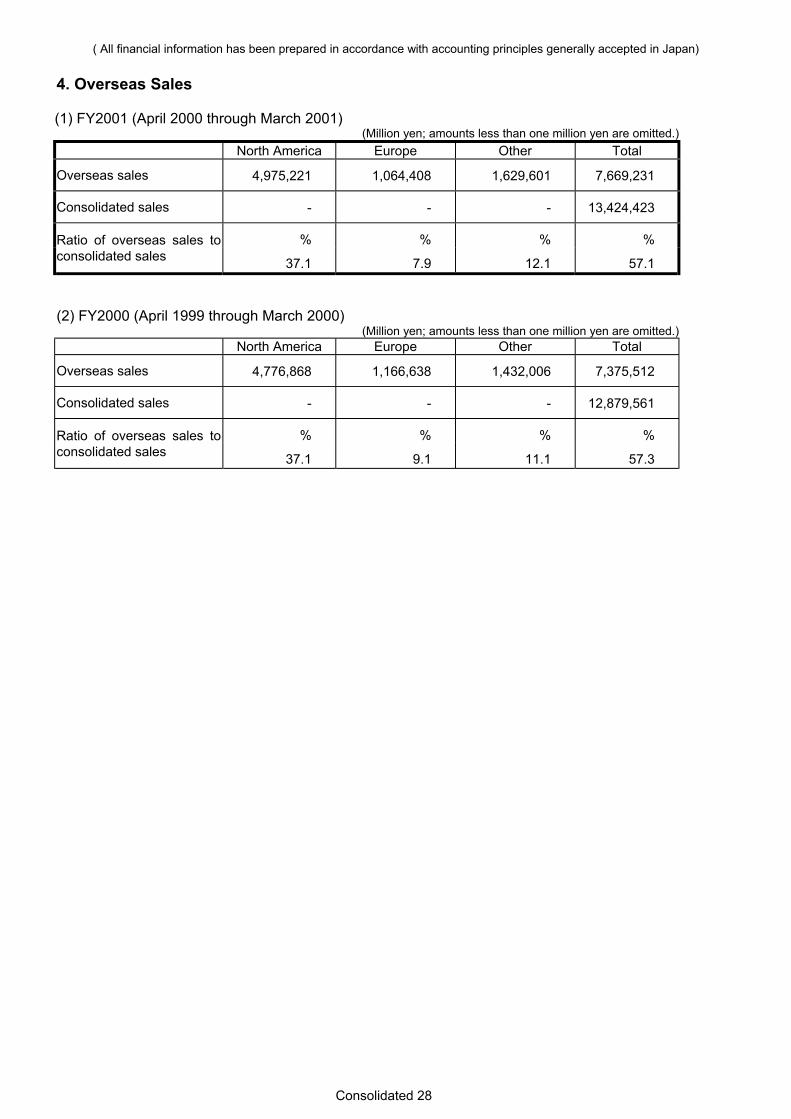
4. Overseas Sales
(1) FY2001 (April 2000 through March 2001)(Million yen; amounts less than one million yen are omitted.)
North America Europe Other Total
Overseas sales 4,975,221 1,064,408 1,629,601 7,669,231
Consolidated sales - - - 13,424,423
% % % %Ratio of overseas sales toconsolidated sales 37.1 7.9 12.1 57.1
(2) FY2000 (April 1999 through March 2000)(Million yen; amounts less than one million yen are omitted.)
North America Europe Other Total
Overseas sales 4,776,868 1,166,638 1,432,006 7,375,512
Consolidated sales - - - 12,879,561
% % % %Ratio of overseas sales toconsolidated sales 37.1 9.1 11.1 57.3
Consolidated 29
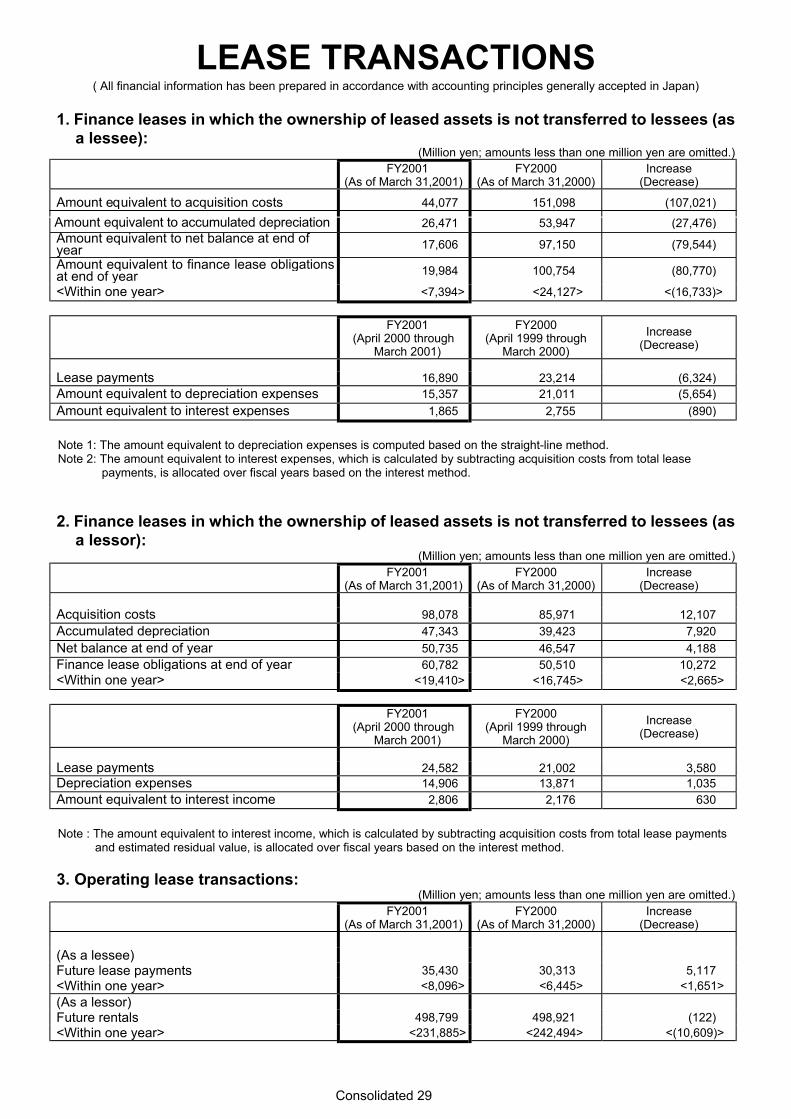
LEASE TRANSACTIONS( All financial information has been prepared in accordance with accounting principles generally accepted in Japan)
1. Finance leases in which the ownership of leased assets is not transferred to lessees (asa lessee):
(Million yen; amounts less than one million yen are omitted.)FY2001
(As of March 31,2001)FY2000
(As of March 31,2000)Increase
(Decrease)
Amount equivalent to acquisition costs 44,077 151,098 (107,021) 26,471 53,947 (27,476)
Amount equivalent to net balance at end ofyear 17,606 97,150 (79,544)Amount equivalent to finance lease obligationsat end of year 19,984 100,754 (80,770)
<Within one year> <7,394> <24,127> <(16,733)>
FY2001(April 2000 through
March 2001)
FY2000(April 1999 through
March 2000)Increase
(Decrease)
Lease payments 16,890 23,214 (6,324)Amount equivalent to depreciation expenses 15,357 21,011 (5,654)Amount equivalent to interest expenses 1,865 2,755 (890)
Note 1: The amount equivalent to depreciation expenses is computed based on the straight-line method.Note 2: The amount equivalent to interest expenses, which is calculated by subtracting acquisition costs from total lease
payments, is allocated over fiscal years based on the interest method.
2. Finance leases in which the ownership of leased assets is not transferred to lessees (asa lessor):
(Million yen; amounts less than one million yen are omitted.)FY2001
(As of March 31,2001)FY2000
(As of March 31,2000)Increase
(Decrease)
Acquisition costs 98,078 85,971 12,107Accumulated depreciation 47,343 39,423 7,920Net balance at end of year 50,735 46,547 4,188Finance lease obligations at end of year 60,782 50,510 10,272<Within one year> <19,410> <16,745> <2,665>
FY2001(April 2000 through
March 2001)
FY2000(April 1999 through
March 2000)Increase
(Decrease)
Lease payments 24,582 21,002 3,580Depreciation expenses 14,906 13,871 1,035Amount equivalent to interest income 2,806 2,176 630
Note : The amount equivalent to interest income, which is calculated by subtracting acquisition costs from total lease paymentsand estimated residual value, is allocated over fiscal years based on the interest method.
3. Operating lease transactions:(Million yen; amounts less than one million yen are omitted.)
FY2001(As of March 31,2001)
FY2000(As of March 31,2000)
Increase(Decrease)
(As a lessee)Future lease payments 35,430 30,313 5,117<Within one year> <8,096> <6,445> <1,651>(As a lessor)Future rentals 498,799 498,921 (122)<Within one year> <231,885> <242,494> <(10,609)>
Amount equivalent to accumulated depreciation
Consolidated 30
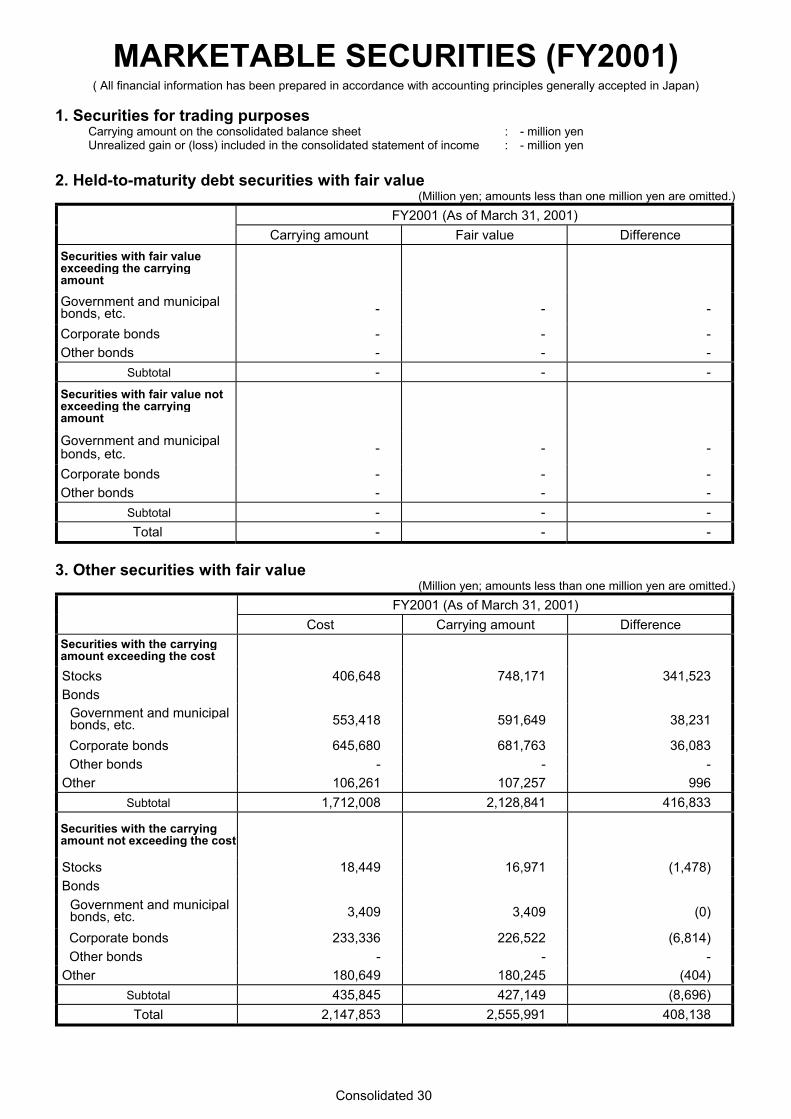
MARKETABLE SECURITIES (FY2001)( All financial information has been prepared in accordance with accounting principles generally accepted in Japan)
1. Securities for trading purposesCarrying amount on the consolidated balance sheet : - million yenUnrealized gain or (loss) included in the consolidated statement of income : - million yen
2. Held-to-maturity debt securities with fair value(Million yen; amounts less than one million yen are omitted.)
FY2001 (As of March 31, 2001)Carrying amount Fair value Difference
Securities with fair valueexceeding the carryingamount
Government and municipalbonds, etc. - - -
Corporate bonds - - -Other bonds - - -
Subtotal - - -Securities with fair value notexceeding the carryingamount
Government and municipalbonds, etc. - - -
Corporate bonds - - -Other bonds - - -
Subtotal - - -Total - - -
3. Other securities with fair value(Million yen; amounts less than one million yen are omitted.)
FY2001 (As of March 31, 2001)Cost Carrying amount Difference
Securities with the carryingamount exceeding the costStocks 406,648 748,171 341,523Bonds
Government and municipalbonds, etc. 553,418 591,649 38,231
Corporate bonds 645,680 681,763 36,083Other bonds - - -
Other 106,261 107,257 996Subtotal 1,712,008 2,128,841 416,833
Securities with the carryingamount not exceeding the cost
Stocks 18,449 16,971 (1,478)Bonds
Government and municipalbonds, etc. 3,409 3,409 (0)
Corporate bonds 233,336 226,522 (6,814)Other bonds - - -
Other 180,649 180,245 (404)Subtotal 435,845 427,149 (8,696)Total 2,147,853 2,555,991 408,138
Consolidated 31
( All financial information has been prepared in accordance with accounting principles generally accepted in Japan)
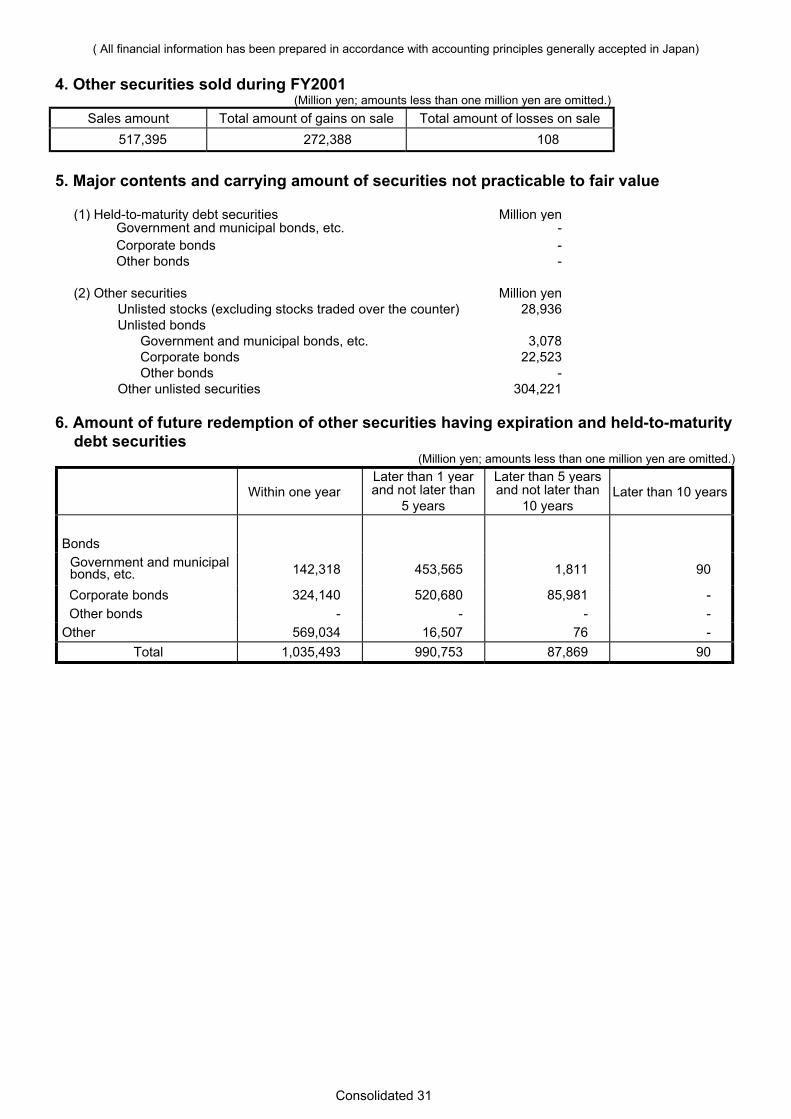
4. Other securities sold during FY2001(Million yen; amounts less than one million yen are omitted.)
Sales amount Total amount of gains on sale Total amount of losses on sale517,395 272,388 108
5. Major contents and carrying amount of securities not practicable to fair value
(1) Held-to-maturity debt securities Million yenGovernment and municipal bonds, etc. -Corporate bonds -Other bonds -
(2) Other securities Million yenUnlisted stocks (excluding stocks traded over the counter) 28,936Unlisted bonds
Government and municipal bonds, etc. 3,078Corporate bonds 22,523Other bonds -
Other unlisted securities 304,221
6. Amount of future redemption of other securities having expiration and held-to-maturitydebt securities
(Million yen; amounts less than one million yen are omitted.)
Within one yearLater than 1 yearand not later than
5 years
Later than 5 yearsand not later than
10 yearsLater than 10 years
BondsGovernment and municipalbonds, etc. 142,318 453,565 1,811 90
Corporate bonds 324,140 520,680 85,981 -Other bonds - - - -
Other 569,034 16,507 76 -Total 1,035,493 990,753 87,869 90
Consolidated 32
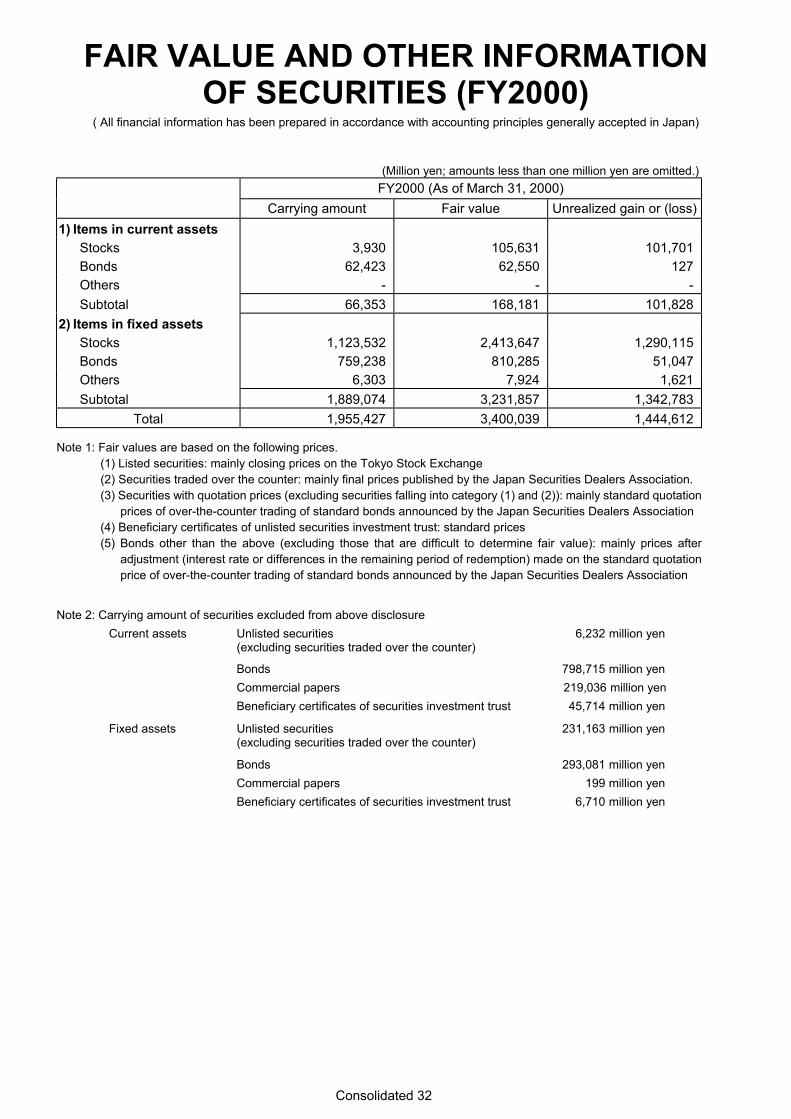
FAIR VALUE AND OTHER INFORMATIONOF SECURITIES (FY2000)
( All financial information has been prepared in accordance with accounting principles generally accepted in Japan)
(Million yen; amounts less than one million yen are omitted.)FY2000 (As of March 31, 2000)
Carrying amount Fair value Unrealized gain or (loss)1) Items in current assets
Stocks 3,930 105,631 101,701 Bonds 62,423 62,550 127 Others - - - Subtotal 66,353 168,181 101,828
2) Items in fixed assets Stocks 1,123,532 2,413,647 1,290,115 Bonds 759,238 810,285 51,047 Others 6,303 7,924 1,621 Subtotal 1,889,074 3,231,857 1,342,783
Total 1,955,427 3,400,039 1,444,612
Note 1: Fair values are based on the following prices.(1) Listed securities: mainly closing prices on the Tokyo Stock Exchange(2) Securities traded over the counter: mainly final prices published by the Japan Securities Dealers Association.(3) Securities with quotation prices (excluding securities falling into category (1) and (2)): mainly standard quotation
prices of over-the-counter trading of standard bonds announced by the Japan Securities Dealers Association(4) Beneficiary certificates of unlisted securities investment trust: standard prices(5) Bonds other than the above (excluding those that are difficult to determine fair value): mainly prices after
adjustment (interest rate or differences in the remaining period of redemption) made on the standard quotationprice of over-the-counter trading of standard bonds announced by the Japan Securities Dealers Association
Note 2: Carrying amount of securities excluded from above disclosureCurrent assets Unlisted securities
(excluding securities traded over the counter)6,232 million yen
Bonds 798,715 million yenCommercial papers 219,036 million yenBeneficiary certificates of securities investment trust 45,714 million yen
Fixed assets Unlisted securities(excluding securities traded over the counter)
231,163 million yen
Bonds 293,081 million yenCommercial papers 199 million yenBeneficiary certificates of securities investment trust 6,710 million yen
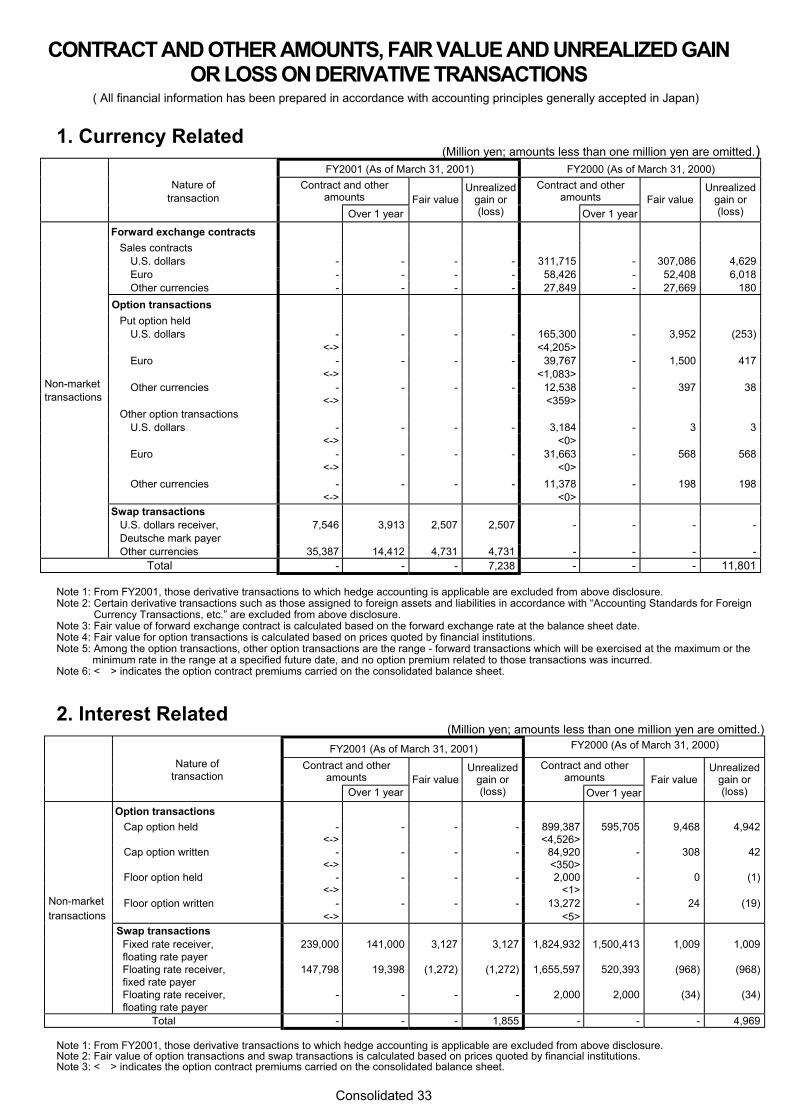
Consolidated 33
CONTRACT AND OTHER AMOUNTS, FAIR VALUE AND UNREALIZED GAINOR LOSS ON DERIVATIVE TRANSACTIONS
( All financial information has been prepared in accordance with accounting principles generally accepted in Japan)
1. Currency Related(Million yen; amounts less than one million yen are omitted.)
FY2001 (As of March 31, 2001) FY2000 (As of March 31, 2000)Contract and other
amountsContract and other
amountsNature of
transactionOver 1 year
Fair valueUnrealized
gain or(loss) Over 1 year
Fair valueUnrealized
gain or(loss)
Forward exchange contracts Sales contracts U.S. dollars - - - - 311,715 - 307,086 4,629 Euro - - - - 58,426 - 52,408 6,018 Other currencies - - - - 27,849 - 27,669 180Option transactions Put option held U.S. dollars - - - - 165,300 - 3,952 (253)
<-> <4,205> Euro - - - - 39,767 - 1,500 417
<-> <1,083> Other currencies - - - - 12,538 - 397 38
<-> <359> Other option transactions U.S. dollars - - - - 3,184 - 3 3
<-> <0> Euro - - - - 31,663 - 568 568
<-> <0> Other currencies - - - - 11,378 - 198 198
<-> <0>Swap transactions
U.S. dollars receiver,Deutsche mark payer
7,546 3,913 2,507 2,507 - - - -
Non-markettransactions
Other currencies 35,387 14,412 4,731 4,731 - - - -Total - - - 7,238 - - - 11,801
Note 1: From FY2001, those derivative transactions to which hedge accounting is applicable are excluded from above disclosure.Note 2: Certain derivative transactions such as those assigned to foreign assets and liabilities in accordance with “Accounting Standards for Foreign
Currency Transactions, etc.” are excluded from above disclosure.Note 3: Fair value of forward exchange contract is calculated based on the forward exchange rate at the balance sheet date.Note 4: Fair value for option transactions is calculated based on prices quoted by financial institutions.Note 5: Among the option transactions, other option transactions are the range - forward transactions which will be exercised at the maximum or the
minimum rate in the range at a specified future date, and no option premium related to those transactions was incurred.Note 6: < > indicates the option contract premiums carried on the consolidated balance sheet.
2. Interest Related(Million yen; amounts less than one million yen are omitted.)
FY2001 (As of March 31, 2001) FY2000 (As of March 31, 2000)
Contract and otheramounts
Contract and otheramounts
Nature oftransaction
Over 1 yearFair value
Unrealizedgain or(loss) Over 1 year
Fair valueUnrealized
gain or(loss)
Option transactions Cap option held - - - - 899,387 595,705 9,468 4,942
<-> <4,526> Cap option written - - - - 84,920 - 308 42
<-> <350> Floor option held - - - - 2,000 - 0 (1)
<-> <1> Floor option written - - - - 13,272 - 24 (19)
<-> <5>Swap transactions
Fixed rate receiver,floating rate payer
239,000 141,000 3,127 3,127 1,824,932 1,500,413 1,009 1,009
Floating rate receiver,fixed rate payer
147,798 19,398 (1,272) (1,272) 1,655,597 520,393 (968) (968)
Non-markettransactions
Floating rate receiver,floating rate payer
- - - - 2,000 2,000 (34) (34)
Total - - - 1,855 - - - 4,969
Note 1: From FY2001, those derivative transactions to which hedge accounting is applicable are excluded from above disclosure.Note 2: Fair value of option transactions and swap transactions is calculated based on prices quoted by financial institutions.Note 3: < > indicates the option contract premiums carried on the consolidated balance sheet.
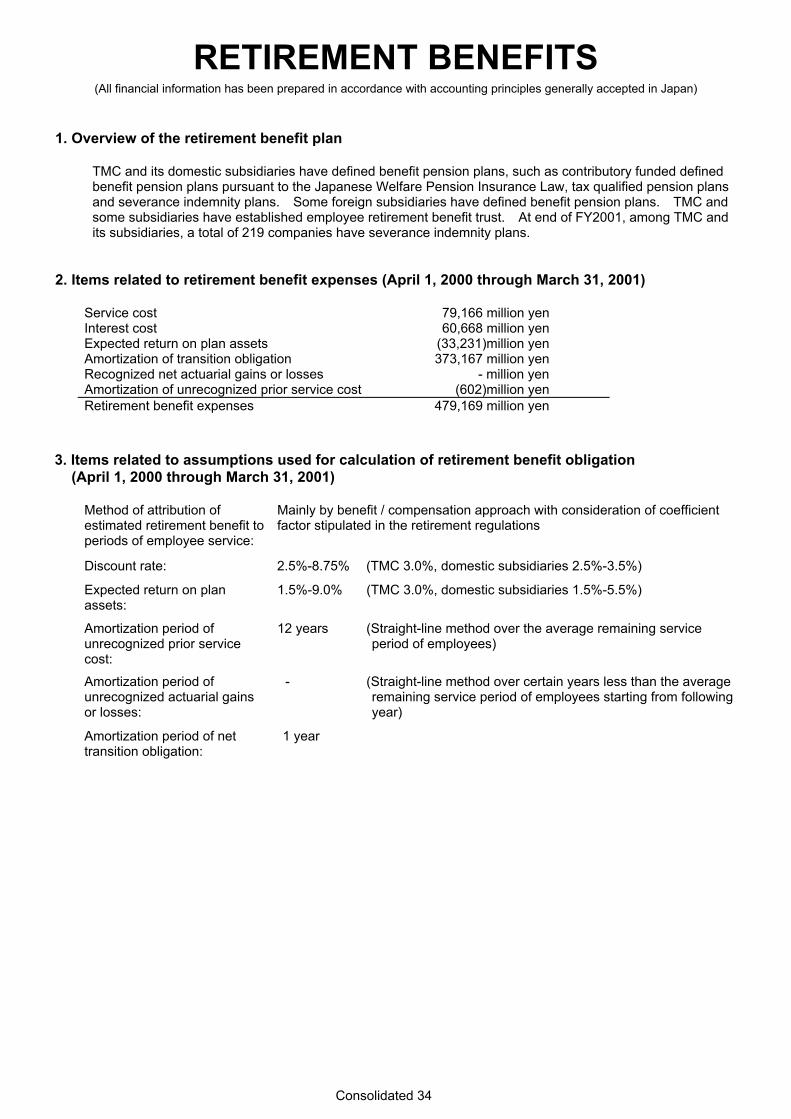
Consolidated 34
RETIREMENT BENEFITS(All financial information has been prepared in accordance with accounting principles generally accepted in Japan)
1. Overview of the retirement benefit plan
TMC and its domestic subsidiaries have defined benefit pension plans, such as contributory funded definedbenefit pension plans pursuant to the Japanese Welfare Pension Insurance Law, tax qualified pension plansand severance indemnity plans. Some foreign subsidiaries have defined benefit pension plans. TMC andsome subsidiaries have established employee retirement benefit trust. At end of FY2001, among TMC andits subsidiaries, a total of 219 companies have severance indemnity plans.
2. Items related to retirement benefit expenses (April 1, 2000 through March 31, 2001)
Service cost 79,166 million yenInterest cost 60,668 million yenExpected return on plan assets (33,231)million yenAmortization of transition obligation 373,167 million yenRecognized net actuarial gains or losses - million yenAmortization of unrecognized prior service cost (602)million yenRetirement benefit expenses 479,169 million yen
3. Items related to assumptions used for calculation of retirement benefit obligation(April 1, 2000 through March 31, 2001)
Method of attribution ofestimated retirement benefit toperiods of employee service:
Mainly by benefit / compensation approach with consideration of coefficientfactor stipulated in the retirement regulations
Discount rate: 2.5%-8.75% (TMC 3.0%, domestic subsidiaries 2.5%-3.5%)
Expected return on planassets:
1.5%-9.0% (TMC 3.0%, domestic subsidiaries 1.5%-5.5%)
Amortization period ofunrecognized prior servicecost:
12 years (Straight-line method over the average remaining serviceperiod of employees)
Amortization period ofunrecognized actuarial gainsor losses:
- (Straight-line method over certain years less than the averageremaining service period of employees starting from followingyear)
Amortization period of nettransition obligation:
1 year
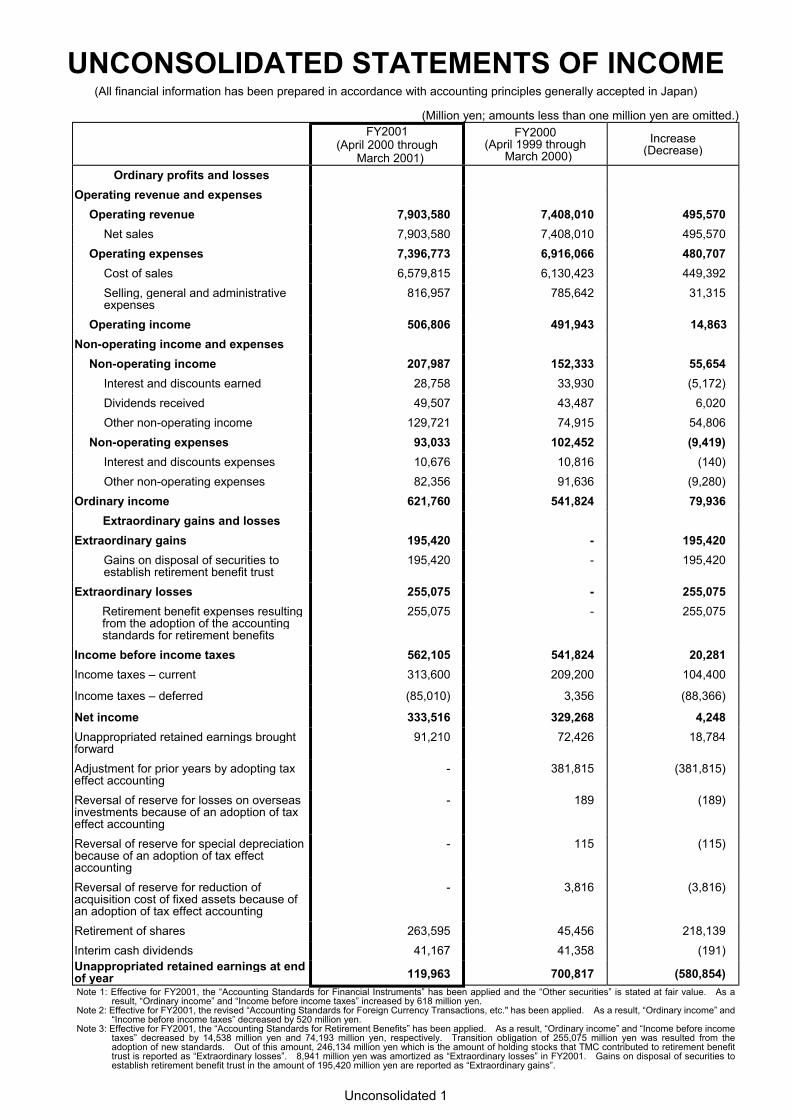
Unconsolidated 1
UNCONSOLIDATED STATEMENTS OF INCOME(All financial information has been prepared in accordance with accounting principles generally accepted in Japan)
(Million yen; amounts less than one million yen are omitted.)FY2001
(April 2000 throughMarch 2001)
FY2000(April 1999 through
March 2000)Increase
(Decrease)
Ordinary profits and lossesOperating revenue and expenses
Operating revenue 7,903,580 7,408,010 495,570Net sales 7,903,580 7,408,010 495,570
Operating expenses 7,396,773 6,916,066 480,707Cost of sales 6,579,815 6,130,423 449,392Selling, general and administrativeexpenses
816,957 785,642 31,315
Operating income 506,806 491,943 14,863Non-operating income and expenses
Non-operating income 207,987 152,333 55,654Interest and discounts earned 28,758 33,930 (5,172)Dividends received 49,507 43,487 6,020Other non-operating income 129,721 74,915 54,806
Non-operating expenses 93,033 102,452 (9,419)Interest and discounts expenses 10,676 10,816 (140)Other non-operating expenses 82,356 91,636 (9,280)
Ordinary income 621,760 541,824 79,936Extraordinary gains and losses
Extraordinary gains 195,420 - 195,420Gains on disposal of securities toestablish retirement benefit trust
195,420 - 195,420
Extraordinary losses 255,075 - 255,075Retirement benefit expenses resultingfrom the adoption of the accountingstandards for retirement benefits
255,075 - 255,075
Income before income taxes 562,105 541,824 20,281Income taxes – current 313,600 209,200 104,400
Income taxes – deferred (85,010) 3,356 (88,366)
Net income 333,516 329,268 4,248Unappropriated retained earnings broughtforward
91,210 72,426 18,784
Adjustment for prior years by adopting taxeffect accounting
- 381,815 (381,815)
Reversal of reserve for losses on overseasinvestments because of an adoption of taxeffect accounting
- 189 (189)
Reversal of reserve for special depreciationbecause of an adoption of tax effectaccounting
- 115 (115)
Reversal of reserve for reduction ofacquisition cost of fixed assets because ofan adoption of tax effect accounting
- 3,816 (3,816)
Retirement of shares 263,595 45,456 218,139Interim cash dividends 41,167 41,358 (191)Unappropriated retained earnings at endof year 119,963 700,817 (580,854)Note 1: Effective for FY2001, the “Accounting Standards for Financial Instruments” has been applied and the “Other securities” is stated at fair value. As a
result, “Ordinary income” and “Income before income taxes” increased by 618 million yen.Note 2: Effective for FY2001, the revised “Accounting Standards for Foreign Currency Transactions, etc." has been applied. As a result, “Ordinary income” and
“Income before income taxes” decreased by 520 million yen.Note 3: Effective for FY2001, the “Accounting Standards for Retirement Benefits” has been applied. As a result, “Ordinary income” and “Income before income
taxes” decreased by 14,538 million yen and 74,193 million yen, respectively. Transition obligation of 255,075 million yen was resulted from theadoption of new standards. Out of this amount, 246,134 million yen which is the amount of holding stocks that TMC contributed to retirement benefittrust is reported as “Extraordinary losses”. 8,941 million yen was amortized as “Extraordinary losses” in FY2001. Gains on disposal of securities toestablish retirement benefit trust in the amount of 195,420 million yen are reported as “Extraordinary gains”.
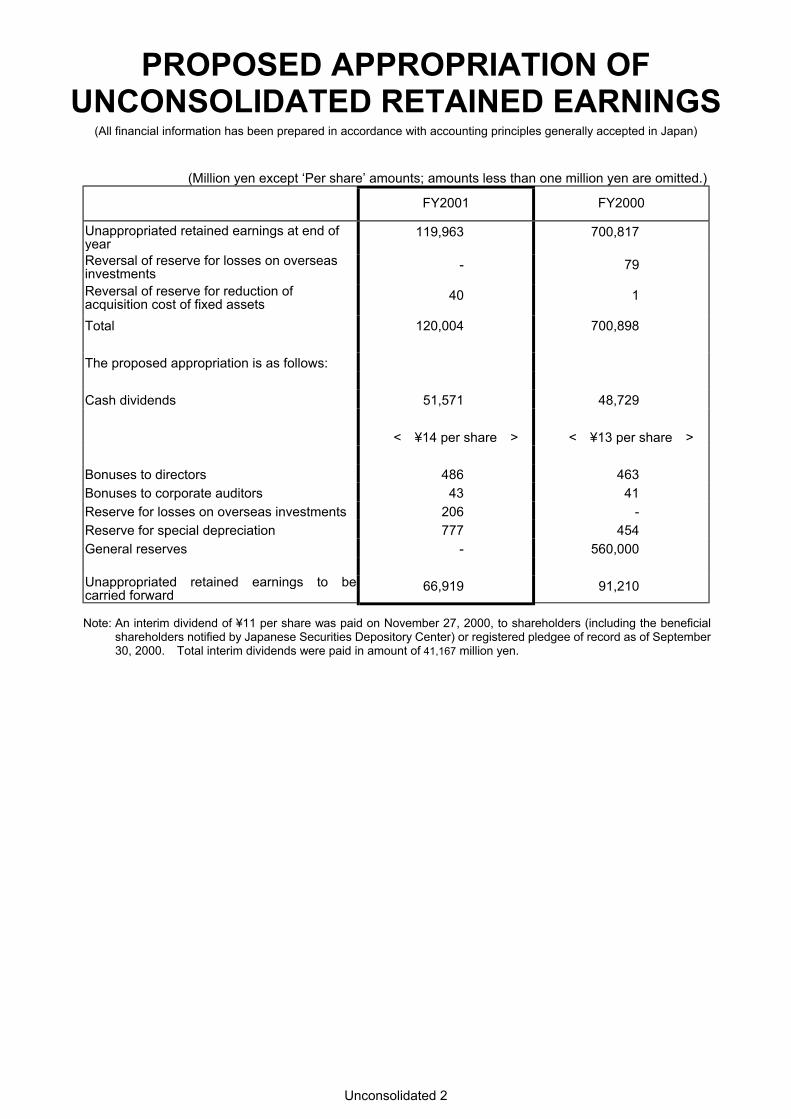
Unconsolidated 2
PROPOSED APPROPRIATION OFUNCONSOLIDATED RETAINED EARNINGS
(All financial information has been prepared in accordance with accounting principles generally accepted in Japan)
(Million yen except ‘Per share’ amounts; amounts less than one million yen are omitted.)
FY2001 FY2000
Unappropriated retained earnings at end ofyear
119,963 700,817
Reversal of reserve for losses on overseasinvestments
- 79
Reversal of reserve for reduction ofacquisition cost of fixed assets
40 1
Total 120,004 700,898
The proposed appropriation is as follows:
Cash dividends 51,571 48,729
< ¥14 per share > < ¥13 per share >
Bonuses to directors 486 463Bonuses to corporate auditors 43 41Reserve for losses on overseas investments 206 -Reserve for special depreciation 777 454General reserves - 560,000
Unappropriated retained earnings to becarried forward
66,919 91,210
Note: An interim dividend of ¥11 per share was paid on November 27, 2000, to shareholders (including the beneficialshareholders notified by Japanese Securities Depository Center) or registered pledgee of record as of September30, 2000. Total interim dividends were paid in amount of 41,167 million yen.
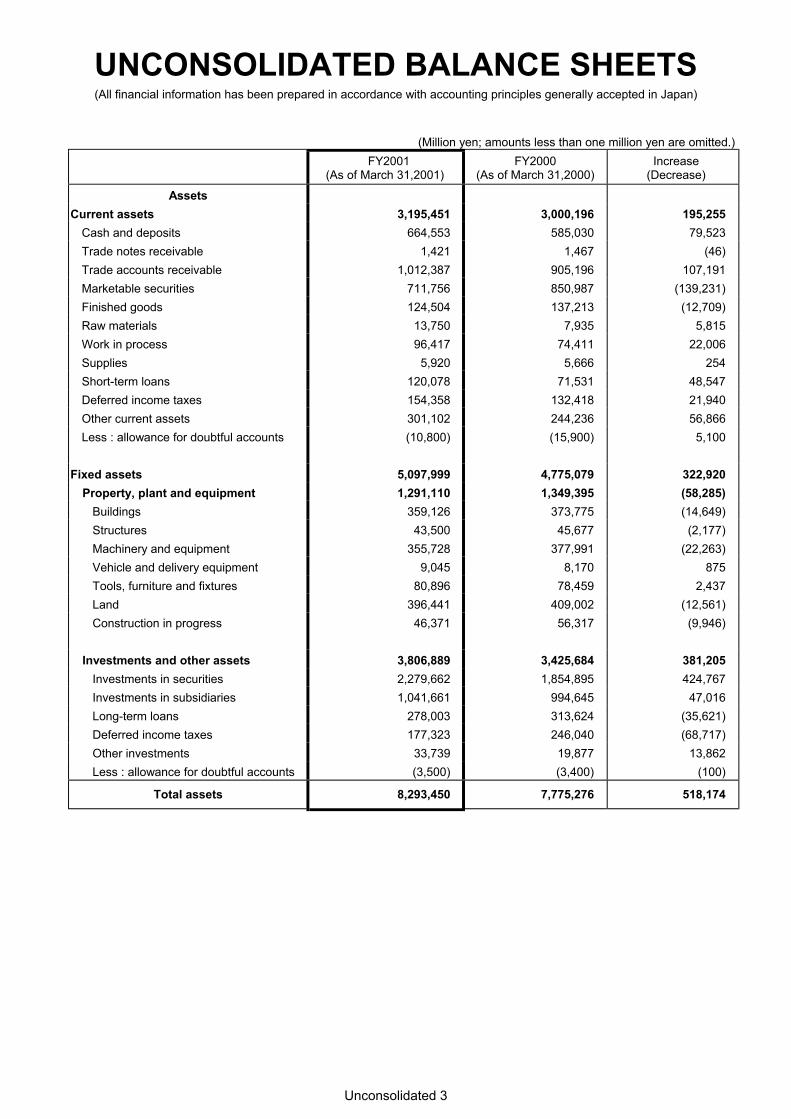
Unconsolidated 3
UNCONSOLIDATED BALANCE SHEETS(All financial information has been prepared in accordance with accounting principles generally accepted in Japan)
(Million yen; amounts less than one million yen are omitted.)FY2001
(As of March 31,2001)FY2000
(As of March 31,2000)Increase
(Decrease)
AssetsCurrent assets 3,195,451 3,000,196 195,255
Cash and deposits 664,553 585,030 79,523Trade notes receivable 1,421 1,467 (46)Trade accounts receivable 1,012,387 905,196 107,191Marketable securities 711,756 850,987 (139,231)Finished goods 124,504 137,213 (12,709)Raw materials 13,750 7,935 5,815Work in process 96,417 74,411 22,006Supplies 5,920 5,666 254Short-term loans 120,078 71,531 48,547Deferred income taxes 154,358 132,418 21,940Other current assets 301,102 244,236 56,866Less : allowance for doubtful accounts (10,800) (15,900) 5,100
Fixed assets 5,097,999 4,775,079 322,920Property, plant and equipment 1,291,110 1,349,395 (58,285)
Buildings 359,126 373,775 (14,649)Structures 43,500 45,677 (2,177)Machinery and equipment 355,728 377,991 (22,263)Vehicle and delivery equipment 9,045 8,170 875Tools, furniture and fixtures 80,896 78,459 2,437Land 396,441 409,002 (12,561)Construction in progress 46,371 56,317 (9,946)
Investments and other assets 3,806,889 3,425,684 381,205Investments in securities 2,279,662 1,854,895 424,767Investments in subsidiaries 1,041,661 994,645 47,016Long-term loans 278,003 313,624 (35,621)Deferred income taxes 177,323 246,040 (68,717)Other investments 33,739 19,877 13,862Less : allowance for doubtful accounts (3,500) (3,400) (100)
Total assets 8,293,450 7,775,276 518,174
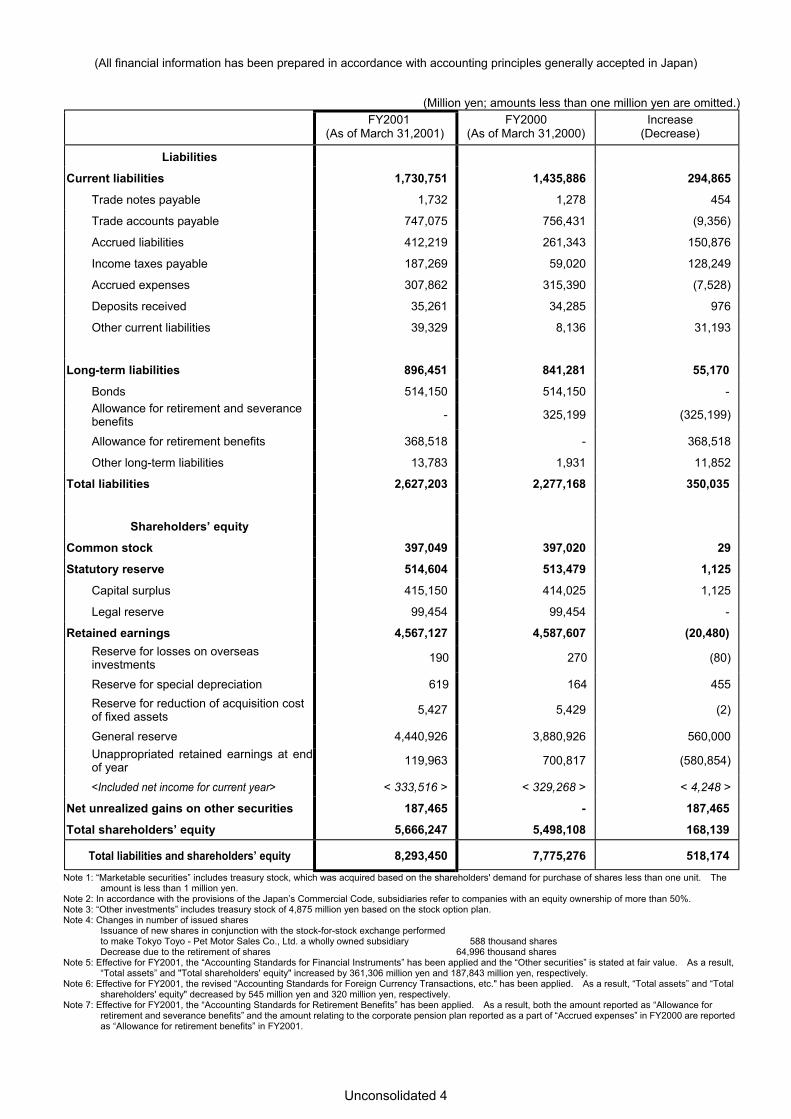
Unconsolidated 4
(All financial information has been prepared in accordance with accounting principles generally accepted in Japan)
(Million yen; amounts less than one million yen are omitted.)FY2001
(As of March 31,2001)FY2000
(As of March 31,2000)Increase
(Decrease)
Liabilities
Current liabilities 1,730,751 1,435,886 294,865
Trade notes payable 1,732 1,278 454
Trade accounts payable 747,075 756,431 (9,356)
Accrued liabilities 412,219 261,343 150,876
Income taxes payable 187,269 59,020 128,249
Accrued expenses 307,862 315,390 (7,528)
Deposits received 35,261 34,285 976
Other current liabilities 39,329 8,136 31,193
Long-term liabilities 896,451 841,281 55,170
Bonds 514,150 514,150 -Allowance for retirement and severancebenefits - 325,199 (325,199)
Allowance for retirement benefits 368,518 - 368,518
Other long-term liabilities 13,783 1,931 11,852
Total liabilities 2,627,203 2,277,168 350,035
Shareholders’ equityCommon stock 397,049 397,020 29Statutory reserve 514,604 513,479 1,125
Capital surplus 415,150 414,025 1,125
Legal reserve 99,454 99,454 -
Retained earnings 4,567,127 4,587,607 (20,480)Reserve for losses on overseasinvestments 190 270 (80)
Reserve for special depreciation 619 164 455Reserve for reduction of acquisition costof fixed assets 5,427 5,429 (2)
General reserve 4,440,926 3,880,926 560,000Unappropriated retained earnings at endof year 119,963 700,817 (580,854)
<Included net income for current year> < 333,516 > < 329,268 > < 4,248 >
Net unrealized gains on other securities 187,465 - 187,465Total shareholders’ equity 5,666,247 5,498,108 168,139
Total liabilities and shareholders’ equity 8,293,450 7,775,276 518,174Note 1: “Marketable securities” includes treasury stock, which was acquired based on the shareholders' demand for purchase of shares less than one unit. The
amount is less than 1 million yen.Note 2: In accordance with the provisions of the Japan’s Commercial Code, subsidiaries refer to companies with an equity ownership of more than 50%.Note 3: “Other investments” includes treasury stock of 4,875 million yen based on the stock option plan.Note 4: Changes in number of issued shares
Issuance of new shares in conjunction with the stock-for-stock exchange performedto make Tokyo Toyo - Pet Motor Sales Co., Ltd. a wholly owned subsidiary 588 thousand sharesDecrease due to the retirement of shares 64,996 thousand shares
Note 5: Effective for FY2001, the “Accounting Standards for Financial Instruments” has been applied and the “Other securities” is stated at fair value. As a result,“Total assets” and "Total shareholders' equity" increased by 361,306 million yen and 187,843 million yen, respectively.
Note 6: Effective for FY2001, the revised “Accounting Standards for Foreign Currency Transactions, etc." has been applied. As a result, “Total assets” and “Totalshareholders' equity" decreased by 545 million yen and 320 million yen, respectively.
Note 7: Effective for FY2001, the “Accounting Standards for Retirement Benefits” has been applied. As a result, both the amount reported as “Allowance forretirement and severance benefits” and the amount relating to the corporate pension plan reported as a part of “Accrued expenses” in FY2000 are reportedas “Allowance for retirement benefits” in FY2001.
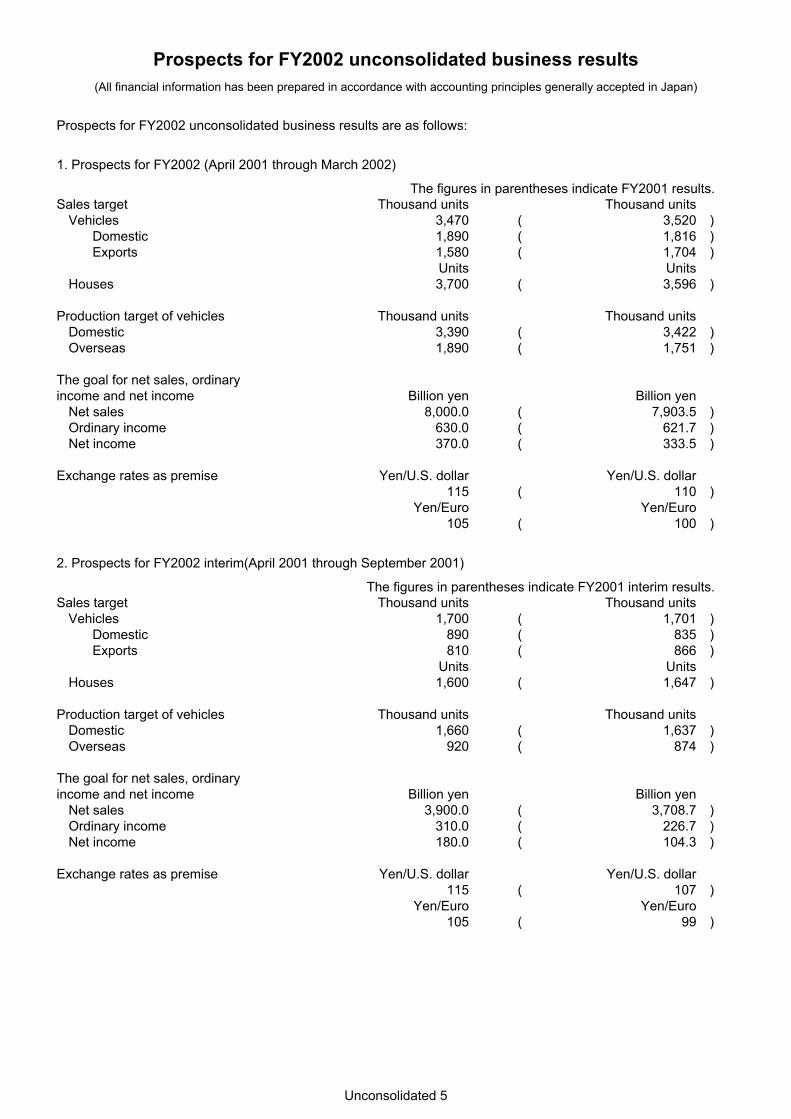
Unconsolidated 5
Prospects for FY2002 unconsolidated business results(All financial information has been prepared in accordance with accounting principles generally accepted in Japan)
Prospects for FY2002 unconsolidated business results are as follows:
1. Prospects for FY2002 (April 2001 through March 2002)
The figures in parentheses indicate FY2001 results.Sales target Thousand units Thousand units
Vehicles 3,470 ( 3,520 )Domestic 1,890 ( 1,816 )Exports 1,580 ( 1,704 )
Units UnitsHouses 3,700 ( 3,596 )
Production target of vehicles Thousand units Thousand unitsDomestic 3,390 ( 3,422 )Overseas 1,890 ( 1,751 )
The goal for net sales, ordinaryincome and net income Billion yen Billion yen
Net sales 8,000.0 ( 7,903.5 )Ordinary income 630.0 ( 621.7 )Net income 370.0 ( 333.5 )
Exchange rates as premise Yen/U.S. dollar Yen/U.S. dollar115 ( 110 )
Yen/Euro Yen/Euro105 ( 100 )
2. Prospects for FY2002 interim(April 2001 through September 2001)
The figures in parentheses indicate FY2001 interim results.Sales target Thousand units Thousand units
Vehicles 1,700 ( 1,701 )Domestic 890 ( 835 )Exports 810 ( 866 )
Units UnitsHouses 1,600 ( 1,647 )
Production target of vehicles Thousand units Thousand unitsDomestic 1,660 ( 1,637 )Overseas 920 ( 874 )
The goal for net sales, ordinaryincome and net income Billion yen Billion yen
Net sales 3,900.0 ( 3,708.7 )Ordinary income 310.0 ( 226.7 )Net income 180.0 ( 104.3 )
Exchange rates as premise Yen/U.S. dollar Yen/U.S. dollar115 ( 107 )
Yen/Euro Yen/Euro105 ( 99 )