Benchmarking Help Center Guide - Institute for Market Transformation

F i n a n c i a l B e n c h m a r k i n g a n d M a r k e t T r e n d s f o r G o v e r n m e n t C o n t r a c t o r s :
H o w D o e s Y o u r C o m p a n y C o m p a r e ?
Presented by: Lynne Gummo, CPAChristine Williamson, CPA
Partners, CohnReznickJune 14, 2017

P L E A S E R E A D
This presentation has been prepared for information purposes and general guidance only and does not constitute professional advice. You should not act upon the information contained in this publication without obtaining specific professional advice.
No representation or warranty (express or implied) is made as to the accuracy or completeness of the information contained in this publication, and CohnReznick LLP, its members, employees and agents accept no liability, and disclaim all responsibility, for the consequences of you or anyone else acting, or refraining to act, in reliance on the information contained in this publication or for any decision based on it.
This presentation and its content are the property of CohnReznick LLP and are protected by applicable copyright laws. Any unauthorized use of the information herein will be considered a violation of CohnReznick LLP’s intellectual property rights. Unless stated otherwise herein, no part of this presentation may be copied, distributed, or published, in whole or in part, without the prior written agreement of CohnReznick LLP.
1

A G E N D A
2
• Current Environment
• Demographics
• Financial Benchmarking
• FTE Benchmarking
• Contract Activity
• DCAA TrendsFinancial Ratios• Key Take Aways

Trump-onomics
Growing internal & external pressures currently impacting
theGC industry
Federal Budget Passed Through September 2017
Government’s Need for Greater Efficiencies
Impending Tax ReformPricing Pressure
Middle Market No-Mans Land
Increased Competition
Need to Grow Revenue & Profits
Increasing interest rates Increasing
combinations and M&A activity
C U R R E N T E N V I R O N M E N T
3
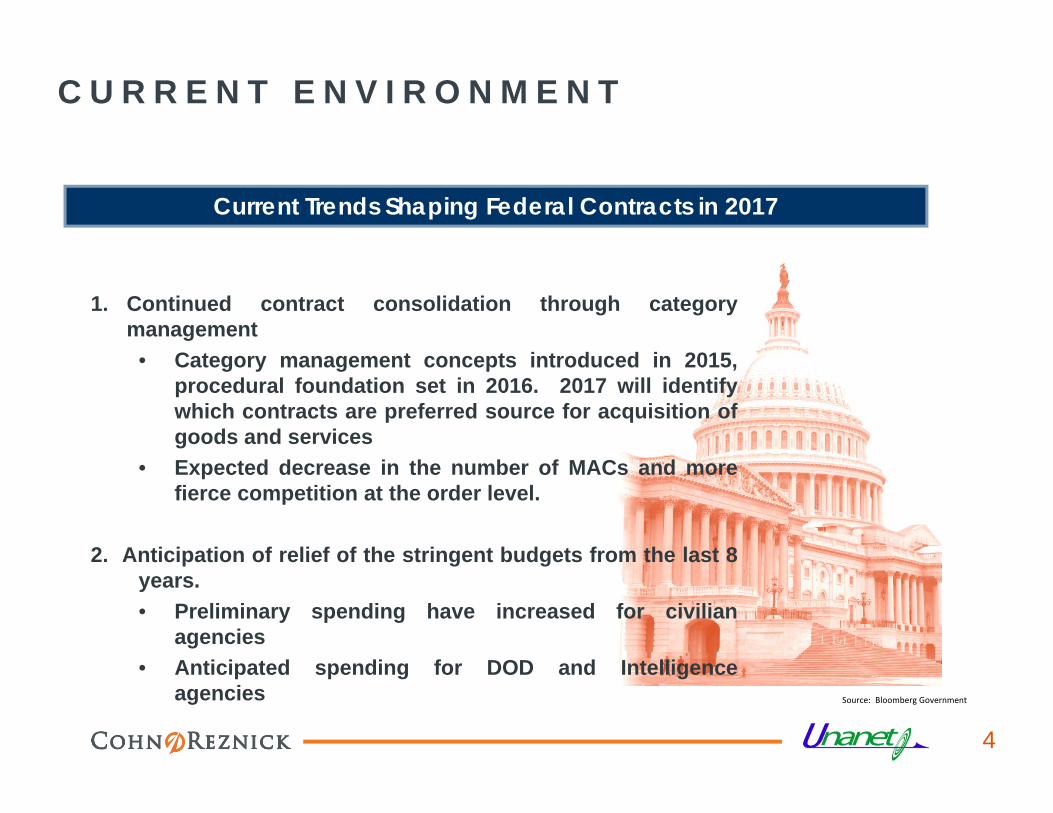
1. Continued contract consolidation through categorymanagement
• Category management concepts introduced in 2015,procedural foundation set in 2016. 2017 will identifywhich contracts are preferred source for acquisition ofgoods and services
• Expected decrease in the number of MACs and morefierce competition at the order level.
2. Anticipation of relief of the stringent budgets from the last 8years.• Preliminary spending have increased for civilian
agencies• Anticipated spending for DOD and Intelligence
agencies
Current Trends Shaping Federal Contracts in 2017
Source: Bloomberg Government
C U R R E N T E N V I R O N M E N T
4

3. Increased agency use of Simplified AcquisitionProcedures
• Simplified Acquisition Procedures (SAP) spendinghas grown.
• Threshold amounts have changed and agenciesrelying on the SAP competition procedure to avoidprotest delays.
Current Trends in the Federal Market Place
Source: Bloomberg Government
C U R R E N T E N V I R O N M E N T
5

4. Increase in compliance and accountability• Contractors are required to submit various data
points monthly due to transactional datareporting rule
• Agencies must standardize their spendingreports to comply with DATA Act by May 2017.
Current Trends in the Federal Market Place
Source: Bloomberg Government
C U R R E N T E N V I R O N M E N T
6

5. Contractors will continue to divest, merge andrestructure
• Contractors need to change to protect profits amidhigher competition.
• Strategic sourcing, aggressive small-businessutilization strategies and continued use of LPTAbid evaluation strategies.
• Companies will restructure internal operations toreduce costs. Many operating in a “virtual”environment.
• Large Prime Contractors will separate lower-margin from higher margin work. Many shiftingfocus to weapon systems.
• Combinations, spin-offs and M&A activity on therise
• Increase focus on the use of Joint Ventures
Current Trends in the Federal Market Place
Source: Bloomberg Government
C U R R E N T E N V I R O N M E N T
7

S u r v e y R e s p o n d e n t D e m o g r a p h i c s

9
S E R V I C E T Y P E S
- Engineering Services
- Custom Computer Programs
- Computer System Design
- Other Computer Related Services
- Administrative Management
- Human Resources Consulting
- R & D, Physical Engineering & Life Sciences- Other Professional Scientific and Technical

E N T I T Y S T R U C T U R E
10

O W N E R S H I P
11
34%
33%
33%
ESOP
100%
26%-49%
less 25%
72%
14%
14%PE
100%
26%-49%
less 25%

C O N T R A C T T Y P E S
12
21%
40% 39%
0%
5%
10%
15%
20%
25%
30%
35%
40%
45%
Cost Plus Time and Material Fixed Price

A G E N C I E S
13

A C C O U N T I N G S Y S T E M S
14

F i n a n c i a l B e n c h m a r k i n g

D I R E C T C O S T S
Direct Labor
Subcontract Labor
Other Direct Costs
Gross Margin
Costs as a % of Revenue
16

D I R E C T C O S T S A S A % O F R E V E N U E
17

D I R E C T L A B O R A S A % O F R E V E N U E
18
33%
25%23%
38%
0%
5%
10%
15%
20%
25%
30%
35%
40%
45%
50%
Up to $25M $25M - $50M $51 - $100M $100 - $250M

S U B C O N T R A C T O R A S % O F R E V E N U E
19
18%
28%
17% 18%
0%
5%
10%
15%
20%
25%
30%
35%
40%
45%
50%
Up to $25M $25M - $50M $51 - $100M $100 - $250M

O D C A S A % O F R E V E N U E
20
3%7%
9%4%
0%
5%
10%
15%
20%
25%
30%
35%
40%
45%
50%
Up to $25M $25M - $50M $51 - $100M $100 - $250M

G R O S S M A R G I N A S A % O F R E V E N U E
21
45%
31%
24%
29%
0%
5%
10%
15%
20%
25%
30%
35%
40%
45%
50%
Up to $25M $25M - $50M $51 - $100M $100 - $250M

I N D I R E C T C O S T S
Fringe Costs
Indirect Labor
Net Profit
Health Insurance Expense
Rent Expense
Business Development Expense
EBITDA
Costs as a % of Revenue
22

I N D I R E C T C O S T S A S A % O F R E V E N U E
23

I N D I R E C T C O S T S A S A % O F R E V E N U E
24
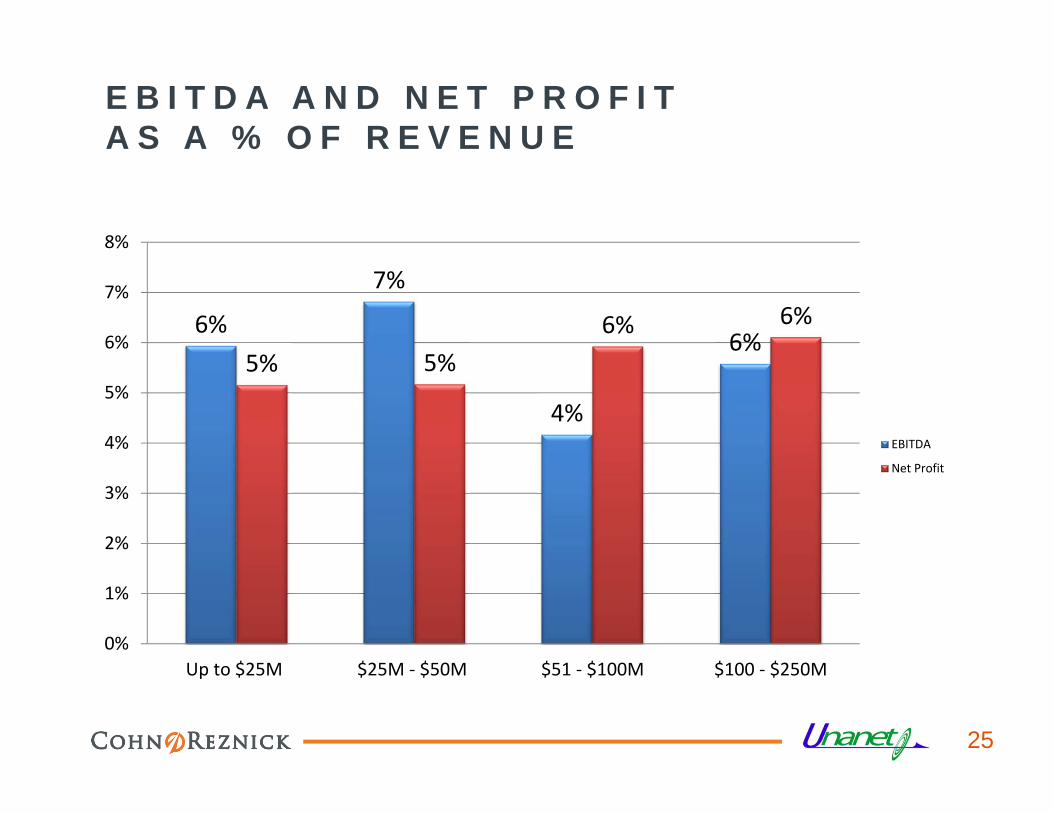
E B I T D A A N D N E T P R O F I T A S A % O F R E V E N U E
25
6%
7%
4%
6%5% 5%
6% 6%
0%
1%
2%
3%
4%
5%
6%
7%
8%
Up to $25M $25M - $50M $51 - $100M $100 - $250M
EBITDA
Net Profit

F R I N G E C O S T S A S A % O F R E V E N U E
26
17%19%
16%14%
0%
2%
4%
6%
8%
10%
12%
14%
16%
18%
20%
Up to $25M $25M - $50M $51 - $100M $100 - $250M

I N D I R E C T L A B O R A S A % O F R E V E N U E
27
10%9%
16%
3%
0%
2%
4%
6%
8%
10%
12%
14%
16%
18%
20%
Up to $25M $25M - $50M $51 - $100M $100 - $250M

N E T P R O F I T A S A % O F R E V E N U E
28
5.2% 5.2%
5.9% 6.1%
4.6%
4.8%
5.0%
5.2%
5.4%
5.6%
5.8%
6.0%
Up to $25M $25M - $50M $51 - $100M $100 - $250M

H E A L T H I N S U R A N C E A S A % O F R E V E N U E
29
4%
3%3%
3%
0%
1%
2%
3%
4%
5%
6%
7%
8%
9%
10%
Up to $25M $25M - $50M $51 - $100M $100 - $250M

R E N T A S A % O F R E V E N U E
30
2%2%
3%2%
0%
1%
2%
3%
4%
5%
6%
7%
8%
9%
10%
Up to $25M $25M - $50M $51 - $100M $100 - $250M

B D E X P E N S E A S A % O F R E V E N U E
31
2%
1%
6%
1%
0%
1%
2%
3%
4%
5%
6%
7%
8%
9%
10%
Up to $25M $25M - $50M $51 - $100M $100 - $250M

E B I T D A A S A % O F R E V E N U E
32

I N D I R E C T R A T E S
Fringe
Overhead – Government Site
Overhead – Contractor Site
Material/Subcontractor Handling
General & Administrative
Wrap rate without fee
By Revenue Segment
33

F R I N G E R A T E
34
9%13%
9%13%
9%
9%
9%
13%
4%
4%
4%
4%
0%
5%
10%
15%
20%
25%
30%
35%
30% or less 31% - 35% 36%-40% 41% +
$100 - $250M
$51 - $100M
$25M - $50M
Up to $25M
18% 30% 26% 26%
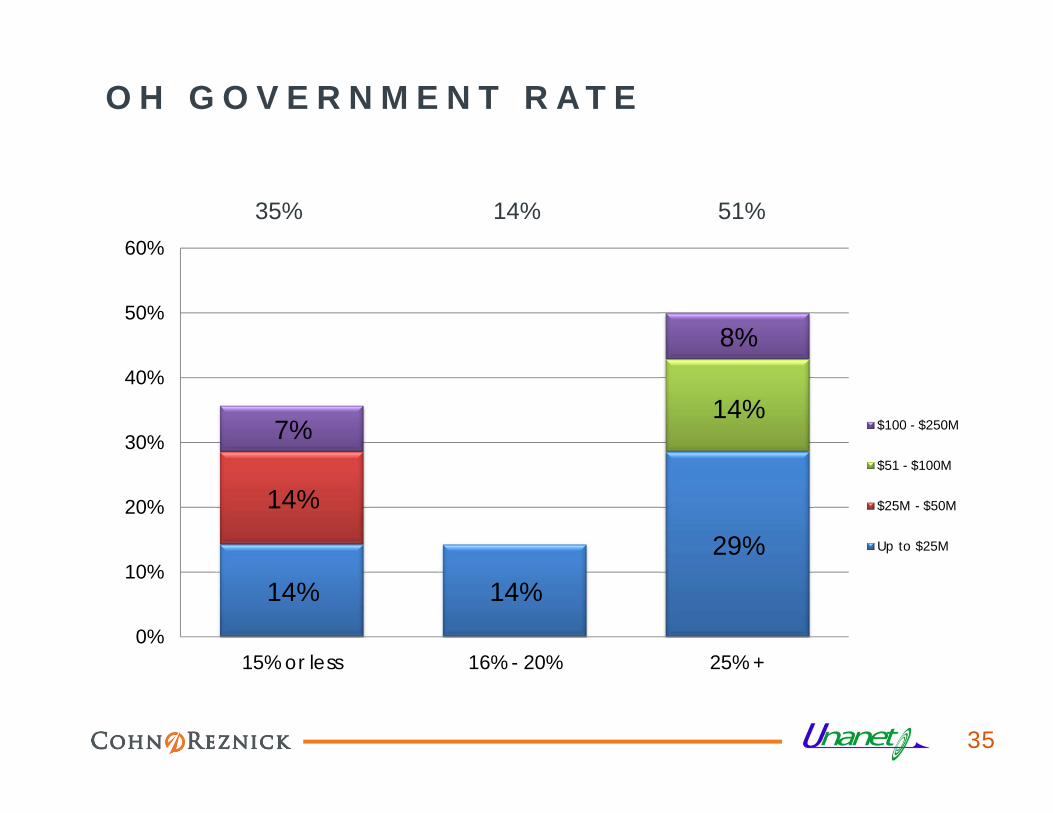
O H G O V E R N M E N T R A T E
35
14% 14%
29%
14%
14%7%
8%
0%
10%
20%
30%
40%
50%
60%
15% or less 16% - 20% 25% +
$100 - $250M
$51 - $100M
$25M - $50M
Up to $25M
35% 14% 51%

O H C O N T R A C T O R R A T E
36
18%28%
6%
6%
6%
6%
12%
6%
12%
0%
10%
20%
30%
40%
50%
60%
70%
20% or less 21% - 30% 31% +
$100 - $250M
$51 - $100M
$25M - $50M
Up to $25M
18% 24% 58%

H A N D L I N G R A T E
37
17% 67% 16%
25%
8%17%
25%
8%
17%
0%
10%
20%
30%
40%
50%
60%
70%
1% or less 2% - 5% 6% +
$100 - $250M
$51 - $100M
$25M - $50M
Up to $25M

G & A R A T E
38
9%13%
9%13%
4%
22%
9%4%
5%
4%
4%
4%
0%
5%
10%
15%
20%
25%
30%
35%
40%
45%
10% or less 11% - 15% 16%-20% 21% +
$100 - $250M
$51 - $100M
$25M - $50M
Up to $25M
17% 40% 22% 21%

W R A P R A T E W I T H O U T F E E( U S I N G G O V E R N M E N T R A T E )
39
15%
5%
15%10%
10%
15%
10%
5%
5%10%
0%
5%
10%
15%
20%
25%
30%
35%
40%
1.51 - 1.75 1.76 - 2.0 2.01 - 2.25 2.26 +
$100 - $250M
$51 - $100M
$25M - $50M
Up to $25M
35% 20% 30% 15%

F T E B e n c h m a r k i n g

F T E A N A L Y S I S
Revenue per FTE
FTEs Per Function
By Revenue Segment
41

R E V E N U E P E R F T E
42
$196,866
$245,779
$221,745
$168,146
$-
$50,000
$100,000
$150,000
$200,000
$250,000
$300,000
Up to $25M $25M - $50M $51 - $100M $100 - $250M

F T E S P E R F U N C T I O N
43
2.0 1.2 0.6 1.4 1.5 2.3 1.2
4.6
2.7 1.1
2.3
9.3
3.8 7.4
8.0
4.0
1.0
4.0
4.0
9.0 1.7
9.0
9.3
6.0
13.0
5.0
8.3
6.7
-
5.0
10.0
15.0
20.0
25.0
Accounting HR Recruiting IT Contracts BD ProjectControl
$100 - $250M
$51 - $100M
$25M - $50M
Up to $25M

C o n t r a c t A c t i v i t y

C O N T R A C T A C T I V I T Y
45

C O N T R A C T A C T I V I T Y
46

C O N T R A C T A C T I V I T Y
47
28
13
7 4
1 0 -
5
10
15
20
25
30
Active Bid Won Loss Delayed Protested
Up to $25M
Up to $25M
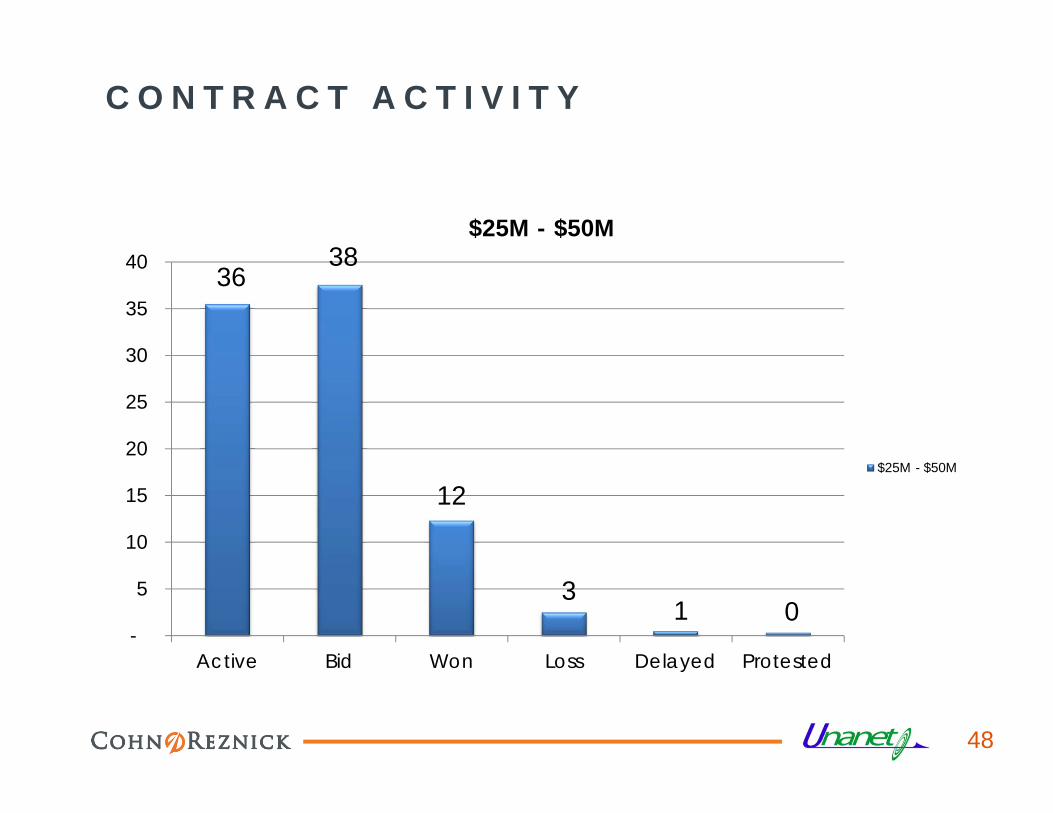
C O N T R A C T A C T I V I T Y
36 38
12
3 1 0
-
5
10
15
20
25
30
35
40
Active Bid Won Loss Delayed Protested
$25M - $50M
$25M - $50M
48

C O N T R A C T A C T I V I T Y
76 79
32 29
18
00
10
20
30
40
50
60
70
80
90
Active Bid Won Loss Delayed Protested
$51 - $100M
$51 - $100M
49

C O N T R A C T A C T I V I T Y
50

D C A A T r e n d s

D C A A T R E N D S
Types of DCAA Audits
Year Indirect Rates Audited Through
By Revenue Segment
52

T Y P E S O F D C A A A U D I T S I N 2 0 1 6
53
34%
11%
6%
11% 11% 11%
3%6% 6%
0%
5%
10%
15%
20%
25%
30%
35%
40%
IncurredCost
Pre Award Purchasingsystem
AccountingSystem
Provisionalrates
Billing review ForwardPricing
Voucher Floor checks

D C A A T r e n d s
54
19%
35%
15%
8%
19%
4%
0%
5%
10%
15%
20%
25%
30%
35%
40%
2011 2012 2013 2014 2015 2016
Year Rates Audited Thru by DCAA

K E Y T A K E A W A Y S
Infrastructure (G&A) spending is up Be aware of the struggles of no-man’s land Government shifting to purchases thru MAC’s M&A is considered on the rise – lots of shoppers Monitor your wrap rate Use of the vertical income statement analysis Be prepared for any type of possible contract audit Monitor your largest indirect expenses Share results with management Begin budget process early to see where you co lands in comparison Its healthy to benchmark!
55

C O N T A C T I N F O R M A T I O N
Christine WilliamsonCohnReznick703-847-4412Christine.Williamson@cohnreznick.com
Lynne [email protected]
Donna [email protected]
56