Final sip report
143
A REPORT ON OUTBOUND LOGISTICS FREIGHT MODEL TO ACHIEVE CUSTOMER SATISCFACTION By: SHARAD SHARMA ICFAI Business School 08BS0003081 At: HONDA SIEL CARS INDIA LIMITED (HSCIL) 1
Transcript of Final sip report

A REPORTON
OUTBOUND LOGISTICS FREIGHT MODEL TO ACHIEVE CUSTOMER
SATISCFACTION
By:
SHARAD SHARMAICFAI Business School
08BS0003081
At:
HONDA SIEL CARS INDIA LIMITED(HSCIL)
1

A ReportOn
OUTBOUND LOGISTICS FREIGHT MODEL TO ACHIEVE CUSTOMER SATISFACTION
Submitted To: Submitted By:
Dr. Suneel Arora Sharad SharmaFaculty Guide 08BS0003081ICFAI Business SchoolAhmedabad
Company Guide:
Mr. Akshay PradhanAsst. ManagerMarketing Supply ChainHonda Siel Cars India Ltd.
TABLE OF CONTENTS
2

TOPIC PAGE No.
Acknowledgments 4
About the Founder 6
About the Company 8
Introduction 23
About Logistics 48
Abstract 51
Recommendations 96
Attachment: Questionnaire 97
Glossary 102
References 103
3

Acknowledgments
I take this opportunity to thank the management of Honda Siel Cars India Ltd. for allowing me to take up the Summer Internship Program in their organization. It is not the brains that matter, what matters is who guides them, the characters, the hearts, generous qualities and progressive forces. I am grateful to the staff and executives of the company who helped me a lot with the information, supervision and co-operation.
Expressing gratitude is a difficult task and words often fall short of reflecting one’s feeling. It is my proud privilege and I undertake this task with utmost sincerity. I am grateful to Dr. Suneel Arora(Faculty Guide, ICFAI Business School) for his priceless guidance, significant suggestions and help accomplishing the project work at every step of the project.
I am highly indebted to Mr. Akshay Pradhan(Asst. Manager, Marketing Supply Chain) for assigning me this project and for his valuable help, benevolent guidance, precious advice, suggestions and encouragement without which the project would not have taken this shape.
I also extend my heartfelt thanks to Mr.Achal Paliwal under whose expertise this project was developed.
4
Last but definitely not the least I would like to thank all the staff members of the HSCIL Commercial Department who have readily responded to my request for any kind of help and support required during the tenure of the project.
5

ABOUT THE FOUNDER
Mr. SOICHIRO HONDA
The Honda story is the story of one man, Soichiro Honda, and his unparalleled achievement of bringing motor cycles to the masses. Soichiro Honda was a racer, a businessman, and a manufacturer. But most of all he was a dreamer. He dreamed of a better way of making piston rings, founded a small company, and began production. He dreamed of giving people everywhere an economical form of transportation, and began producing small motorcycles, including one built in 1949 called the D-Type Dream.
6

He also loved racing too. So his company built bigger and faster machines, two, four, five and six-cylinder race bikes and won the Isle of Man.
Honda Motor Company is by far the world's biggest motorcycle maker. Honda's first motorcycle was born out of necessity in immediate post World War II Japan, where public transportation was desperately overcrowded and gasoline severely restricted.
Looking for a solution to his, and thousands of others', personal transport problems, Honda came across a job lot of 500 war surplus two-stroke motors designed to power electric generators; nobody else wanted them so Honda picked them up cheap.
His aim was to adapt them for attachment to push-bikes and, by October 1946, his small factory in Hamamatsu was making complete, makeshift motor bikes using proprietary cycle frames. Because gasoline was in short supply, Honda adapted his motors to run on turpentine, a fuel that he himself distilled from pine trees and sold throughout Japan. Turpentine (or gas thinned out with turpentine) was not the best thing for powering motorbikes, and required a lot of strenuous pedaling to warm the engine up enough before you could get going.
Honda's first bikes were very successful and supplies of the surplus engines ran out after a few months. Business was good by then, so he decided to manufacture his own motors. Using the surplus motor as a model, Honda designed and built his own 50cc engine.
7

ABOUT THE COMPANY
HONDA HISTORY TIMELINE:
In October 1946, Soichiro Honda established the Honda Technical Research Institute in Hamamatsu, Japan, to develop and produce small 2-cycle motorbike engines. Two years later, Honda Motor Company,
Ltd. was born, and in 1959 Honda opened its first storefront in Los Angeles with six industrious employees.
8

1946: Soichiro Honda establishes the Honda Technical Research Institute.
1947: Honda produced its first product, the A-type bicycle engine.
1958: Honda super club motor bike debuts.
1959: Honda 125cc motorcycle takes 8th place in its class in the Isle
of Man TT race.
American Honda Motor Co. Inc. opens in Los Angeles, USA.
9
1960: Honda begins manufacturing motorcycle production at Suzuka factory.
1963: Honda released S500, its first sports
car in Japan.
1964: Honda enters Formula One(F1) Auto Racing for the first time.
Auto production begins at Honda’s Saitama factory in Sayama.
10

1965: Honda introduces the
E300 portable generator.
Honda recorded its first F1 victory in Mexico.
1972: Honda Civic debuts
1973: CVCC engine complies with clean air amendments for 1975.
11

1977: Honda Civic ranks firsts in U.S fuel economy tests for fourth consecutive year.
1978:
Honda Prelude debuts.
1979: Honda of American manufacturing opens and begins motorcycle assembly. 1981: Honda wins 500cc Motocross World Championship ttle for 3rd consecutive year.
1982: Honda of America manufacturing begins assembly of Honda Accord.
12

1983:
Honda Civic CRX wins first place for gasoline car fuel consumption in US tests.
1984: Honda returns to F1 racing after a 15 year hiatus.
1990: The Acura NSX, a new sports car,
debuts.
Honda wins its fifth consecutive first ranking in J.D Power Consumer Satisfaction Index.
13

Ultra fuel efficient VTEC-E engine debuts in the new Civic.
1991: Honda posts its 10th
consecutive win in the isle of Man TT.
1993: Honda’s power products are the first to meet new California emission regulations.
2000: Honda breaks ground in a new $440 million auto plan near Lincoln, Alabama.
14

2001: Honda Accord
is the bestselling car in America.
Honda Odyssey earns a double five star safety ranking for a third year in a
row.
Honda introduces the redesigned 2002 CR-V.
Honda Civic coupe becomes one of the first cars to earn an all around five star
safety rating from NHTSA.
15

Honda wins the CART manufacturing Championship for the fourth time.
2002:
ASIMO, Honda’s humanoid robot, rings the opening bell to celebrate American Honda’s 25th anniversary of being listed on the New York Stock Exchange.
Civic Hybrid becomes the first established mainstream gasoline electric hybrid engine to be sold in North America.
2003: 10,00,000th Honda vehicle is manufactured in the United States.
2004: 25th Anniversary of manufacturing in the
United States. Honda wins Indy Car manufacturing
championship.2005:
Honda wins Indy Car manufacturing championship.
Redesigned Honda Civic wins Motor Trend Car of the year award.
Honda Ridgeline wins Motor Trend Truck of the year award.
16

Honda Ridgeline is the first ever four door truck to earn top government crash test rating.
Honda delivers FCX fuel cell vehicle to world’s first individual customer
100,000th Honda hybrid vehicle is sold in the United States.
Experimental Honda Jet makes public world debut at EAA Air Venture 2005.
2006:
Honda Aircraft Company begins sales of its Honda Jet Advanced Light Jet.
Honda Fit is introduced in the United States and
17

earns highest possible government safety rating for full frontal crash performance from NHTSA.
Honda opens a new plant, Honda Precision Parts of Georgia, LLC. The plant begins mass production of five speed transmission.
Honda R&D Americas opens new Advanced Styling Centre in Pasadena, California to focus on a future styling direction for the Honda and Acura brands.
2007: FCX Clarity advanced fuel cell vehicle makes its world debut.
Delivering three times the fuel efficiency of a modern gasoline powered car with water as its only emission.
Honda completely redesigned 2008 Accord emphasizing outstanding performance, fuel economy and safety with an expressive and spacious design.
2008: Honda is named America’s “Greenest Automaker” for the fourth
consecutive time by union of concerned scientists in its biennial study of smog-forming and global-warming emissions from automaker’s U.S vehicles.
Honda breaks ground on a new $550 million automobile plant in Greensburg, Indiana.
18

HONDA IN INDIA
Honda Siel Cars India Ltd., (HSCI) was incorporated in December 1995 as a joint venture between Honda Motor Co. Ltd., Japan and Siel Limited, a Siddharth Shriram Group company, with a commitment to providing Honda’s latest passenger car models and technologies, to the Indian customers. The Honda City, its first offering introduced in 1997, revolutionized the Indian passenger car market and has ever since been recognized as an engineering marvel in the Indian automobile industry. The success of City as well as all its other models has led HSCI to become the leading premium car manufacturer in India. The total investment made by the company in India till date is Rs. 1620 crores, further investment of RS. 1000 crore is planned and being currently invested for the coming second plant in Rajasthan. The company has a capacity of manufacturing 100,000 cars.
HSCI’s state-of-the-art manufacturing unit was set up in 1997 at Greater Noida, U.P with an investment of Rs. 450 crore. The green-field project is spread across 150 acres of land (over 6,00,000 sq. m.).
The initial installed capacity of the plant was 30,000 cars per annum, which was thereafter increased to 50,000 cars on a two-shift basis. The capacity has further been enhanced to 1,00,000 units annually in February 2008 . The capacity expansion was necessitated by the excellent performance of all the Honda models, particularly the growing demand for City in India. Several modifications were done by the company with the objective of offering higher quality products to its customers, faster and quicker. The expansion process also included expansion of the covered area in the plant, from 1,07,000 sq. m. to 1,31,794 sq. m.
19

HSCI currently produces the All New City, Civic and Accord models in India and the premium SUV, CR-V is sold as a fully imported unit from Japan.
The company operates under the stringent standards of ISO 9001 for quality management and ISO 14001 for environment management.
PRODUCTS IN INDIA
20

CITY
CIVIC
21

ACCORD
CR-V
22

INTRODUCTION
INDIAN AUTOMOBILE MARKET
In 1953, the government of India and the Indian private sector initiated manufacturing processes to help develop the automobile industry, which had emerged by the 1940s in a nascent form. Between 1970 to the economic liberalization of 1991, the automobile industry continued to grow at a slow pace due to the many government restrictions. A number of Indian manufactures appeared between 1970-1980. Japanese manufacturers entered the Indian market ultimately leading to the establishment of Maruti Udyog. A number of foreign firms initiated joint ventures with Indian companies
Following the economic reforms of 1991, the automobile section underwent delicensing and opened up for 100 percent Foreign Direct Investment. A surge in economic growth rate and purchasing power led to growth in the Indian automobile industry, which grew at a rate of 17% on an average since the economic reforms of 1991. The industry provided employment to a total of 13.1 million people as of 2006-07, which includes direct and indirect employment. The export sector grew at a rate of 30% per year during early 21st century. However, the overall contribution of automobile industry in India to the world remains low as of 2007. Increased presence of multiple automobile manufacturers has led to market competitiveness and availability of options at competitive costs. India was one of the largest manufacturers of tractors in the world in 2005-06, when it produced 2,93,000 units.India’s car market has emerged as one of the fastest growing in the world. The number of cars sold domestically is projected to double by 2010, and domestic production is skyrocketing as foreign makers are
23

setting up their own production plants in India. The government’s 10-year plan aims to create a $145 billion auto industry by 2016.
Out of 400 Indian suppliers, 80 percent have the ISO 9000 certificate—the international standard for quality management.
24

INDIAN AUTOMOTIVE STATISTICS
Current Scenario India represents one of the largest two-wheeler markets in the
world, with an estimated size of 5.4 million units a year. India is the two-wheeler capital of Asia with an average of 27 two-
wheelers per thousand people, compared to China's 8 two-wheelers per thousand people.
India became the fastest growing car market in the world in 2004, growth rate of 20%.
Overview India is being recognized as potential emerging auto market. Foreign players are adding to their investments in Indian auto industry. Passenger vehicles sales crossed the mark of 1 million in 2004-05. 2/3rd of auto component production is consumed directly by
OEMs.
Cars by Price Range
Under Rs. 3 Lakhs
Maruti 800, Alto, Omni
Reva
Rs. 3-5 Lakhs Ambassador Fiat Palio Hyundai Santro, Getz,i10 Chevrolet Opel Corsa Maruti Zen,Wagon R,Swift,Versa, Ford Icon & Fiesta
25

Tata Indica, Indigo
Mahindra Bolero
Rs. 5-10 Lakhs
Chevrolet Swing, Optra, Tavera Hyundai Accent, Elantra Mahindra Scorpio Maruti Baleno Toyota Corolla, Innova Tata Safari Mitsubishi Lancer, Lancer Cedia
Honda City
Rs. 10-15 Lakhs
Ford Mondeo & Endeavour Chevrolet Forester Skoda Octavia Classic & Combi
Honda Civic & CR-V
Rs. 15-30 Lakh
Maruti Suzuki Grand Vitara Hyundai Sonata Embera, Terracan &
Tucson Mitsubishi Pajero Audi A4 Opel Vectra Honda Accord Mercedes C Class
Toyota Camry
Rs. 30-90 Lakhs
Audi A6, A8 & TT BMW X5, 5 Series & 7 Series Mercedes E Class, S Class, SLK, SL &
CLS-Class Porsche Boxster, Cayenne, 911 Carrera &
Cayman S
26

Toyota Prado
Above Rs. 1 Crore
Bentley Arnage, Continental GT & Flying Spur
Rolls Royce Phantom
Maybach
The segregation is made on Ex-Showroom price of base models.
Industry GrowthIndian Auto Market Growth for the year 2004-05
The automobile industry crossed a landmark with total vehicle production of 10 million units.
Car sales was 8,82,094 units against 8,20,179 units in 2004-05. The two-wheeler market grew by 13.6 per cent with 70,56,317
units against 62,09,765 units in 2004-05. Commercial vehicles segment grew at 10.1 per cent with 3,50,683
units against 3,18,430 units in 2004-05 The domestic automobile industry sales grew 12.8 per cent at
89,10,224 units as against 78,97,629 units in 2004-05. According to the Society of Indian Automobile Manufacturers
(SIAM), car sales was 8,82,094 units against 8,20,179 units in 2004-05.
The growth of domestic passenger car market was 7.5 per cent Car exports stood at 1,70,193 units against 1,60,670 units in 2004-
05. The two-wheeler segment, the market grew by 13.6 per cent with
70,56,317 units against 62,09,765 units in 2004-05. Motorcycles had the upward march, 17.1 per cent in domestic
market touching 58,15,417 units against 49,64,753 units in 2004-05.
Scooter segment grew by 1.5 per cent, fall at 9,08,159 units against 9,22,428 units in 2004-05.
27

Commercial vehicles segment grew at 10.1 per cent with 3,50,683 units against 3,18,430 units in 2004-05.
Medium and heavy commercial vehicles managed a growth of 4.5 per cent against 23 per cent growth in the year ended March 31, 2005.
Light commercial vehicles sales growth was 19.4 per cent at 1,43,237 units against 1,19,924 units in 2004-05.
Three-wheelers sales rose by 17 per cent at 3,60,187 units against 3,07,862 units in 2004-05.
Production of 4-Wheelers
Manufacturers
2005-06 (Apr-Mar)In Nos.
Manufacturers
2005-06 (Apr-Mar)In Nos.
Japanese OEM Korean OEM
Maruti Udyog Ltd. 572,097Hyundai Motor India Ltd.
260,440
Toyota Kirloskar Motor Pvt. Ltd.
44,975 American OEM
Honda Siel Cars India Ltd.
41,361General Motors India Pvt. Ltd.
30,687
Swaraj Mazda Ltd. 11,946 Ford India Pvt. Ltd. 26,946
Total 670,379 Total 57,633
European OEM Indian OEM
Skoda Auto India Pvt. 9.767 Tata Motors Ltd. 449,878
28

Ltd.
Daimler Chrysler India Pvt. Ltd.
1,780Mahindra & Mahindra Ltd.
128,601
Volvo India Pvt. Ltd. 1,004 Ashok Leyland Ltd. 65,085
Tatra Trucks India Ltd. 125 Force Motors Ltd. 35,728
Fiat India Pvt. Ltd. 671 Eicher Motors Ltd. 24,348
Hindustan Motors Ltd.
15,458
Total 13,347 Total 719,098
Production of 2-Wheelers
Manufacturers
2005-06 (Apr-Mar)In Nos.
Manufacturers
2005-06 (Apr-Mar)In Nos.
Japanese Indian
Hero Honda Motors Ltd.
3,006,486 Bajaj Auto Ltd. 2,042,289
Honda Motorcycle & Scooter India (Pvt.) Ltd.
603,436TVS Motor Company Ltd.
1,366,866
Yamaha Motors India Pvt. Ltd.
248,665 LML Ltd. 107,044
Suzuki Motorcycle India Pvt. Ltd.
2,328Kinetic Engineering Ltd.
82,392
29

Majestic Auto Ltd. 56,819
Kinetic Motor Company Ltd.
53,880
Royal Enfield (Unit of Eicher Ltd.)
30,596
Total 3,860,915 Total 3,739,886
Domestic Sales
The half yearly figures (April-September 2007 over April-September 2006) indicate that domestic sales of automobiles decelerated with a negative growth rate of 5.91 percent. The cumulative growth of the Passenger Vehicles segment during April-September 2007 was 12.86 percent. Passenger Cars grew by 13.16 percent, Multi Purpose Vehicles by 19.95 percent and Utility Vehicles by 8.71 percent in April-September 2007 compared to the same period last year. In April-September 2007, the Commercial Vehicles segment grew by 2.92 percent over the same period in 2006. Light Commercial Vehicles recorded a growth of 14.75 percent; however, Medium & Heavy Commercial Vehicles witnessed a fall by 5.18 percent. Bus segment registered a growth of 41.39 percent while truck segment registered a decline by 2.25 percent. Three Wheelers sales fell by 6.87 percent with sales of both Goods Carriers decreasing the highest, by 15.76 percent and Passenger Carriers by 0.57 percent during the period.
30

Two Wheeler sales registered a negative growth of 9.47 percent during April-September 2007 over April-September 2006. Though Mopeds and Scooters grew by 22.37 percent and 20.13 percent respectively, Motorcycles and Electric Two Wh eelers registered a negative growth rate of 15.20 percent and 10.74 percent respectively. Exports Automobile Exports grew by 17.13 percent during April-September 2007 over the same period last year.
Exports were led by Two Wheelers, which grew by 22.98 percent, followed by Commercial Vehicles exports at 16.53 percent and Three Wheelers exports at 11.59 percent. Passenger Vehicles Exports grew marginally with a growth rate of 1.48 percent.
Turnover of Automobile Industry 1999-00 to 2004-05
Turnover of Automobile Manufacturers
Year (Rs.In Million)
1999-00 422,933
2000-01 492,024
2001-02 499,136
2002-03 595,184
2003-04 661,769
2004-05 835,851
31

Installed Capacities in the Indian Automobile Industry 2003-04
2003-2004 2004-2005
Installed Capacity (In Million)
Installed Capacity (In Million)
a) Four Wheelers 1.51 a) Four Wheelers 1.72
b) Two &Three Wheelers
7.83b) Two &Three Wheelers
9.13
c) Engines 0.18 c) Engines 0.18
Market Share
Domestic Market Share for 2006-07
CVs 5
Total Passenger Vehicles
14
32

Total Two Wheelers
77
Three Wheelers 4
Trends in Automobile Industry
Automobile Domestic Sales Trends(Number of
Vehicles)
Category 2001-02 2002-03 2003-04 2004-05 2005-06 2006-07Passenger
Cars509088 541491 696153 820179 882208 1076408
Utility Vehicles
104253 113620 146388 176360 194502 220199
MPVs 61775 52087 59555 65033 66366 83091Total
Passenger Vehicles
675116 707198 902096 1061572 1143076 1379698
M&HCVs 89999 115711 161395 198506 207472 275600LCVs 56672 74971 98719 119924 143569 192282Total
Commercial Vehicles
146671 190682 260114 318430 351041 467882
Three Wheelers
200276 231529 284078 307862 359920 403909
Scooters 908268 825648 886295 922428 909051 940673Motorcycles 2887194 3647493 4170445 4964753 5810599 6553664
Mopeds 408263 338985 307509 322584 332741 355870
33

Electrict Two
Wheelers- - - - - 7341
Total Two Wheelers
4203725 4812126 5364249 6209765 7052391 7857548
Grand Total 5225788 5941535 6810537 7897629 8906428 10109037
Automobile Production Trends(Number of
Vehicles)
Category 2001-02 2002-03 2003-04 2004-05 2005-06 2006-07Passenger
Cars500301 557410 782562 960487 1046133 1238032
Utility Vehicles
105667 114479 146325 182018 196506 222111
MPVs 63751 51441 60673 67371 66661 84707Total
Passenger Vehicels
669719 723330 989560 1209876 1309300 1544850
M&HCVs 96752 120502 166123 214807 219295 294266LCVs 65756 83195 108917 138896 171788 225734Total
Commercial Vehicles
162508 203697 275040 353703 391083 520000
Three Wheelers
212748 276719 356223 374445 434423 556124
Scooters 937506 848434 935279 987498 1021013 943974Motorcycles 2906323 3876175 4355168 5193894 6207690 7112225
Mopeds 427498 351612 332294 348437 379994 379987Electrict Two - - - - - 7982
34

WheelersTotal Two Wheelers
4271327 5076221 5622741 6529829 7608697 8444168
Grand Total 5316302 6279967 7243564 8467853 9743503 11065142
Automobile Exports Trends(Number of
Vehicles)
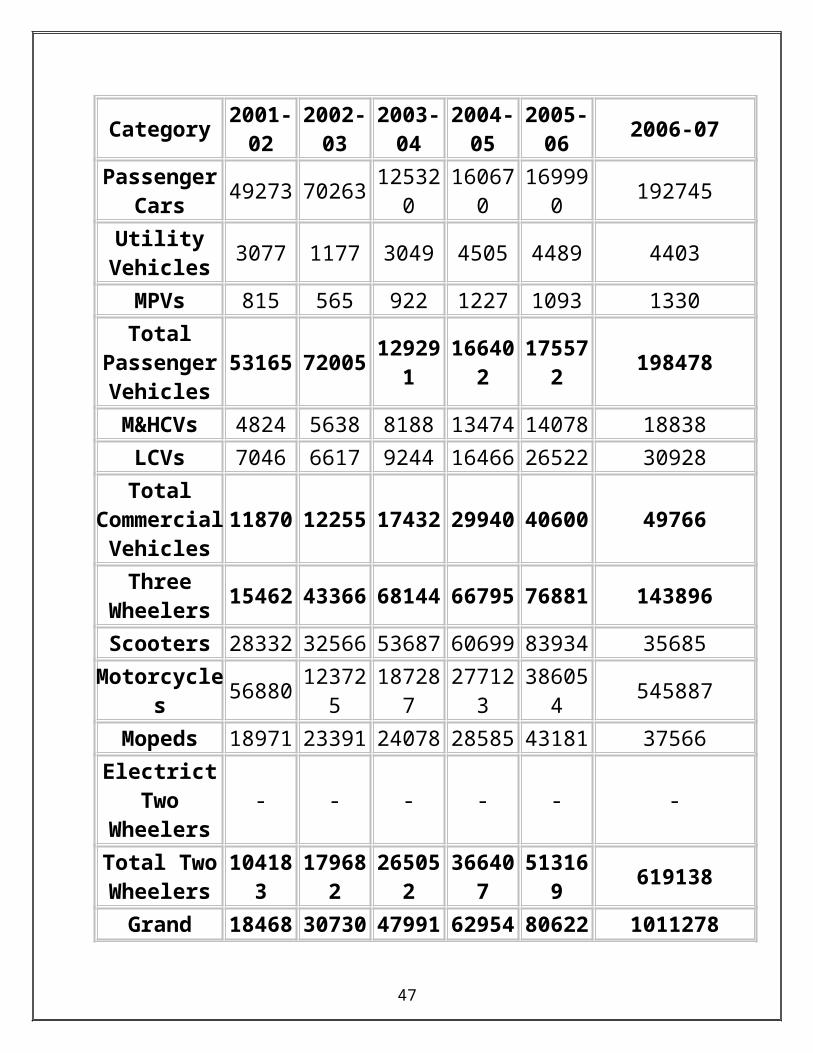
Category 2001-02 2002-03 2003-04 2004-05 2005-06 2006-07Passenger
Cars49273 70263 125320 160670 169990 192745
Utility Vehicles
3077 1177 3049 4505 4489 4403
MPVs 815 565 922 1227 1093 1330Total
Passenger Vehicles
53165 72005 129291 166402 175572 198478
M&HCVs 4824 5638 8188 13474 14078 18838LCVs 7046 6617 9244 16466 26522 30928Total
Commercial Vehicles
11870 12255 17432 29940 40600 49766
Three Wheelers
15462 43366 68144 66795 76881 143896
Scooters 28332 32566 53687 60699 83934 35685
35

Motorcycles 56880 123725 187287 277123 386054 545887Mopeds 18971 23391 24078 28585 43181 37566
Electrict Two Wheelers
- - - - - -
Total Two Wheelers
104183 179682 265052 366407 513169 619138
Grand Total 184680 307308 479919 629544 806222 1011278
Forecasted Growth
The following points are taken from the forecasted statistical report,
Automobile industry expert predicts that by 2050 every sixth car in the world will be for Indians.
By 2010 India will take over Germany in sales volumes and Japan by 2012
The Indian automobile component industry is estimated to triple from USD 63 billion to USD 190 billion within a span of six years by 2012.
Estimated turnover USD 12 billlion, plus components revenue USD 3 billion, this is the vastness of Indian automobile industry. Industry analysts predict this industry to touch USD 13000 million mark by 2010, a cumulative growth of 9.5% annually. It is said that for every Re 1 spent, the auto sector returns Rs. 2.24 to the Indian economy.
By 2010, India is expected to witness over Rs 30,000 crore of investment.
36

Component industry's growth was only 9% between 1997-2000. But between 2000-2005 it has grown to 20%. It is projected 17% between 2005-2014.
According to estimation the compound annual growth rate (CAGR) of Indian Automobile sales will grow at 9.5% and will touch a mark of 13,008 million by 2010.
CURRENT INDIAN AUTO MARKET SHARE
37

The latest trend in the Indian Auto Market depicts that a major chunk of the Automobile Industry in India still belongs to the Two Wheelers i.e 76.49%. It is followed by the Passenger Vehicles including cars, SUV’s(Sports Utility Vehicles) and MUV’s(Multi Utility Vehicles) i.e 15.96%.Last comes the Commercial Vehicles including Trucks, Trailers, Earthmovers etc and the Three Wheelers.
THE INDIAN FOUR
38

WHEELER INDUSTRY
The 4W industry in India has not quite matched up to the performance of its counterparts in other parts of the world. The primary reason for this has been the all-pervasive regulatory atmosphere prevailing till the opening up of the industry in the mid-1990s. The various layers of legislative Acts sheltered the industry from external competition for a long time. Moreover, the industry was considered low-priority as cars were thought of as "unaffordable luxury".
Initially in the post-liberalisation period, the automotive sector, especially the passenger car segment, saw a boom. The buoyancy in the sector was derived primarily from economic vibrancy, changes in Government policies, increase in purchasing power (especially of the upper middle class), improvement in life styles, and availability of car finance. The
39

passenger car industry was finally deregulated in 1993, and many companies, both Indian and foreign (like Daewoo, Ford, General Motors, and DaimlerChrysler), entered the market. However, the smooth sailing was suddenly disrupted in the last quarter of FY1996. The automobile industry, which contributed substantially to industrial growth in FY1996, failed to maintain the same momentum between FY1997 and FY1999. The overall slowdown in the economy and the resultant slowdown in industrial production, political uncertainty and inadequate infrastructure development were some of the factors responsible for the slowdown experienced by the automobile industry. In FY2000, the sector experienced a turnaround, posted positive growth rates and witnessed the launch of many new models. But the spectacular growth in FY2000 was followed by a decline in FY2001 and only a marginal growth of 0.5% in FY2002.
40

However, since FY2003, industry sales have increased at a 3-year CAGR of 17.4% to 1.14 million in FY2006. Although there was a slowdown in FY2006, after the high growth in FY2004-05, the recent high growth has been on the strength of an increase in the disposable income of middle-income salaried people, release of pent-up demand, and easy availability of credit.
Low Penetration, but Rising Share of World Production
Although the Indian
41

automobile industry has come a long way since the deregulation in 1993, India does not rank well among its global peers in many respects, viz., the contribution of the sector to industrial output, number of cars per person, employment by the sector as a percentage of industrial employment, number of months' income required to purchase a car, and penetration of cars.
However, the major car manufacturers worldwide consider India a good potential market and they foresee a large
42

future demand here. As can be seen from the table below, India is now a major global producer of cars, with India's share in world production increasing from 1.6% in 2000 to 2.7% in 2005.
Two things that stunted growth of the Indian automobile industry in the past have been low demand and lack of vision on the part of the original equipment manufacturers (OEMs). However, the demand has picked up after the liberalization of the regulatory environment, and global
43

OEMs who enjoy scale economies both in terms of manufacturing and research and development (R&D) entered the Indian market. This has resulted in a significant shift in the way business is conducted by suppliers, assemblers and marketers.
Spending on Vehicles and Transport
India's private final consumption expenditure (PFCE) on transport was estimated at around Rs. 3,124 billion in FY2005, accounting for around 16.5% of total PFCE. This comprises three categories: personal transport equipment, operation of personal transport equipment, and purchase of transport services.
44

In terms of PFCE, the share of transport in total PFCE has witnessed rapid growth since the mid-1980s. By comparison, the share remained at around 3-5% till the mid-1980s.
The motor vehicles sector is also an important source of central excise duties. Central excise duty collections from motor vehicles were Rs. 54.70 billion during FY2005, accounting for 6% of central excise duty collections.
45

Taxes on vehicles, passengers and goods also form an important component of states' tax collections, and formed 8.7% of states' own tax collections during FY2005.
DEMAND CHARACTERISTICS
Passenger Cars
In developed markets, engine capacity and wheel-base are the bases of segmentation of passenger cars: price
46
does playa role but only up to a point. Since affordability is the most important demand driver in India, the domestic car market has until now been segmented on the basis of vehicle price. Price-based competition takes place in a continuum rather than in segments since nearly all the models are launched in multiple versions at different price points. As a result, a higher-end variant may compete with a lower-end variant of a car in a segment above it.
MUVs
The MUV segment consists of vehicles that are suited to both rural and urban areas. In rural areas where the roads are usually bad, these vehicles are used as goods carriers and also for public transportation. Northern and Western India account for nearly two-thirds of the demand for MUV. Specifically, in States like
47

Rajasthan, Madhya Pradesh, Uttar Pradesh and Maharashtra, the demand for MUVs is the largest. There are three segments of buyers for MUVs: the private market, Government, and the Defence. Until the 1990s, the Government and Defence segments accounted for the largest share of the market. The reduction in Government and defence spending since the 1990s has substantially reduced sales to these two segments. This has pushed private sector purchases into greater prominence.
There are three sub-segments of the UV / MUV segment: the hard-top, soft-top and pick-up.
48

The hard-top version consists of the higher-end Sports Utility Vehicles (SUVs) that have been present in the Indian markets since FY1999. Following the success of the higher-end SUVs, the share of the hard top segment in total MUV sales has registered an increase. Soft-top MUVs, which are largely dependent on sales in the rural and semi-urban markets where the vehicles serve as modes of mass transportation (maxi taxi), have witnessed a contraction in volumes in recent years. The declining share of the soft-top sub-segment is attributable largely to the increasing acceptance of SUVs as an alternative to soft-tops (and even higher end-cars). That apart, soft-top sales have also been affected by a decline in rural income, increase in sales tax in some states, increase in diesel prices, enforcement of strict emission control norms, and restraints on the issue of licenses to use soft-top vehicles as rural taxis.
Demand Structure
49

When the industry was deregulated in 1993, the global carmakers chose to operate in the high price-high value segment. However, the strategy did not work as the market for premium and luxury vehicles in India was not large enough. MUL was entrenched in the low price-low value segment, and given its scale economies, it could not be dislodged. In the latter half of the 1990s, foreign car manufacturers changed their strategy. It was still difficult to remove MUL from its market leadership in the dominant low price-low value segment as scale economies formed the basis of competition in this segment. Thus, the global players changed the price-value equation by offering superior value at a price that was still higher than that of the Maruti 800 and Omni, but significantly lower than of the cars in the high price-high value segment. The process gained momentum in FY2000 when the growth in the car market was led by the Compact segment.
50

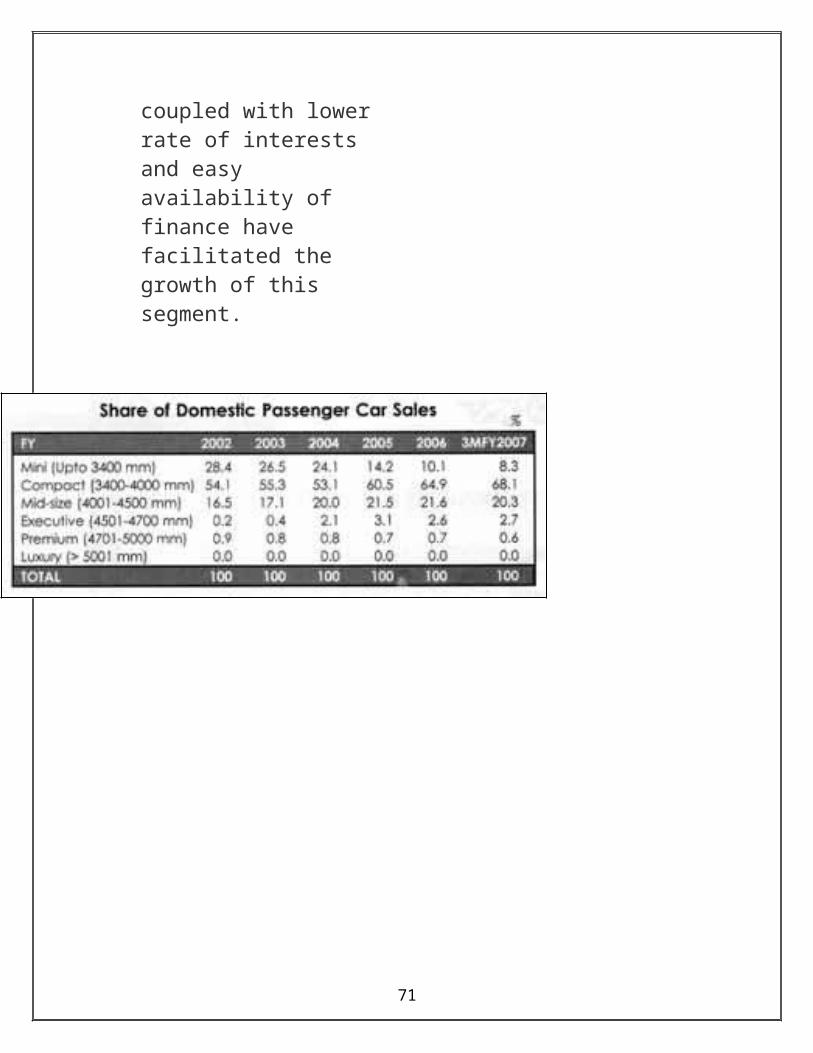
Although the compact segment now accounts for 65% of domestic sales of passenger cars, in recent years, the mid-size segment has captured a rising share of the market, and since 2004, sales in the mid-size segment have exceeded sales in the mini-segment. The growth in this segment has been led by new launches, lower prices, and the significant success of four models - MUL's Esteem, Honda's City, HMIL's Accent, and TML's Indigo. Introduction of stripped down versions of the vehicles in the Mid-size segment, attractive pricing by manufacturers (who also offer sales incentives) coupled with lower rate of interests and easy availability of finance have facilitated the growth of this segment.
51

Low Penetration Levels
Although India's 4W sales have increased in recent years, penetration levels are low at around 0.9%. Till the last decade, the industry was considered low priority as cars were thought of as 'unaffordable luxury', and treated as such through Government policies. Although reduction in excise duties, favorable Government
52

policies, and lower prices have resulted in significant increase in penetration, India's passenger car penetration is low by global standards-1.3% in Chino, 59% in EU, and 81% in the US. Estimates from Notional Sample Survey 58th Round (2002) indicates that ownership of four-wheelers (car or jeep) is restricted to about 4.4% of urban households, and 0.6% of rural households. During 2002-03, ownership of cars/jeeps was restricted to around 0.9 million households in rural areas, and 2.57 million households in urban areas. Car penetration is high in Chandigarh, Delhi, Goa, and Kerala. However, penetration is extremely low in the eastern states of Bihar, West Bengal, Orissa; and central states such as Madhya Pradesh and Chattisgarh.
53

ABOUT LOGISTICS
Logistics is the organized movement of materials and, sometimes, people. The term was first associated with the military but gradually spread to cover business activities. Logistics Management is defined as a business planning framework for the management of material, service, information and capital flows. It includes the increasingly complex information, communication and control systems required in today's business environment. Logistics management includes a whole gamut of processes like planning, procurement, transportation, maintenance, distribution and replacement of personnel and material.
The process of logistics management differs from one firm to another. In some firms, all these activities are placed within a single logistics department; in others, they are shared among the departments. The firm may also go in for what is called third-party logistics, which is a contract with an outside party to perform specific logistics services.
The following indicative list gives some of the functions that a firm's logistics management system is supposed to perform:
1. Customer Service: All the activities that are done to keep the existing customers satisfied come under the gamut of customer service.
2. Demand Forecasting: This process includes various statistical measures that enable the firm to estimate the demand in the future, which in turn helps in proper demand management.
3. Documentation Flow: This process covers the movement of the paperwork that accompanies the movement of physical product.
4. Interplant Movements: This is only applicable to those firms where
54

production process is accomplished in more than one plant, requiring the movement of semi-finished products from one plant to another.
5. Inventory Management: Inventory management requires a cost effective maintenance of stocks of goods and materials.
6. Order Processing: Order processing starts with the receipt of an order from a customer and ends when the order is ready for packaging.
7. Packaging: Packaging is done mainly to protect the product when it is being transported from the source to the destination. It can also be used for promotional purposes.
8. Parts and Service Support: This covers the whole after-sales service process.
9. Plant and Warehouse Site Selection: This function is carried to determine where the plant and the warehouse are going to be located, keeping cost-benefit analysis in mind.
10. Production Scheduling: This function's task is to balance demand for products with the existing plant capacity and availability of inputs.
11. Purchasing: This is a very important function in the logistics management as the quality of inputs that are purchased determines the quality of the finished product. Vendor selection is an important sub-process of this function.
12. Returned Products: There are many categories of returned products. A few are subjects of product recalls, meaning that a safety defect or hazard has been discovered. E.g. laptop battery recall by Dell. These products are removed from the shelves, and both retailers and consumers attempt to return them to the manufacturer. This is a form of reverse distribution, with goods moving in the opposite direction of their usual flow.
55

13. Salvage Scrap Disposal: How a firm takes care of its waste material is covered in this function. The firm might recycle its waste or sell the waste to various processors who specialize in recycling it.
14. Traffic Management: All the transport requirements needed to move a firm's freight is known as traffic management.
15. Warehouse and Distribution Centre Management: This logistics activity involves management of the locations where the firm's inventories are stored
.
56

ABSTRACT
OBJECTIVE OF THE PROJECT
The Outbound Logistics Model Aims to maximize the profit, safety, quality, quantity and utilization of resources involved in the delivery of vehicles produced (CITY, CIVIC, ACCORD, CR-V) to the dealerships spread throughout the country. It is a technique followed by HSCIL to minimize the cost incurred in the delivery of vehicles to the dealerships, thereby enhancing the business relations between the company, dealers and transporters, which at last will lead to a happy and satisfied customer.
The outbound logistics model will have the following value-addition to the company:
It will provide a higher degree of automation in the decision of freights to be paid for the delivery of cars to the transporters.
It will help the company to identify alternative routes and clubbing of different routes that can be followed by the transporters for the safe and in time delivery of cars.
It will reduce the transit damage of cars by a considerable amount.
It will enhance business relations with the transporters and the dealers.
57

HSCIL OUTBOUND LOGISTICS FREIGHT MODEL
There are several criteria and considerations that are analyzed in order to estimate the total cost incurred by the transporters in delivering the vehicles to the various locations and hence calculate the most appropriate freight for those locations. Following are the major criterions that are considered for calculating the net cost and thus the net freight:
NON-NEGOTIABLE: The freight for delivering the vehicles that comes out as the output of all the calculations done is a non-negotiable sum. This means that this is the freight which all the transporters have to accept if they wish to do business with the company. ONE WAY: Freight is paid to the transporters for a one way journey i.e delivering vehicles from HSCIL plant to the respective dealership(s).
REASONABLE PROFIT: The net freight which comes out after considering and analyzing all the factors is calculated after including a reasonable profit margin to both the company(HSCIL) and the transporter.
58

PER CAR PER KM: The net freight which comes out for a particular location is expressed basically in terms of per car per km measure. This means that the freight is paid to the transporter for a single car per kilometer.
LOCATION TO LOCATION: The freight which is paid to the transporter is calculated based upon various other factors and the distance from HSCIL plant to the city in which the dealership is located. This means that the distance is considered from HSCIL plant to the city and not from HSCIL plant to the dealership.
CAPITAL INVESTMENT: This is the cost that is incurred as the capital investment for a particular year. It includes:
Cost of Chassis of the carrier Cost of the body of the carrier Insurance Charges Taxes(Goods Tax, Road Tax, Permit Fees)
FIXED COST / ANNUM: This includes:
Registration Charges Goods Tax Road Tax Basic Permit Cost National Permit
59

Fitness of the vehicle PUC(Pollution Under Control) Insurance Driver/Cleaner Salary Office Expenses Interest Depreciation
VARIABLE COST / KM: This includes cost of:
Diesel Tyres of the carrier Repairs & Maintenance Lashing Belt Cost Miscellaneous Trip Expense Toll taxes Telephone Expense GPS tracking device
EMPTY RUNNING FACTOR: This involves the cost that is incurred when the carrier has to travel unloaded. This is basically an overhead to the transporters. This includes the cost of travelling unloaded after delivering the vehicles to the respective dealership(s) and then travelling up to the nearest auto plant to collect their vehicles as the return load for any other location(s).
60

METHODOLOGY
APPROACHES TO THE OUTBOUND LOGISTICS FREIGHT MODEL:
There are 3 approaches to the outbound logistics model:
Model based approach- In this, freight is decided based upon the vehicle model viz City, Civic, Accord or CRV. This is because each of the car is having a different price tag and subsequently the risk of damage for each model is different.
Route based approach- In this, freight is decided based upon the routes from the source (HSCIL) to the destination (dealership) followed by the transporters. The model helps to seek the most advantageous routes that can be followed by the transporters to reduce the cost incurred.
Carrier based approach- In this, freight is decided based upon the carrier in which the car is to be delivered. There are two carriers hired by the company viz:
Truck- In the truck category there is a single model namely the TR4 which has the capability of loading 4 cars.
Trailer- In the trailer category there are two models namely the TR6 and TR8 having the capability of loading 6 and 8 cars respectively.
61

CURRENT FREIGHT MODEL OF HSCIL
DIFFERENT ZONES: HSCIL has divided the entire country into six different zones in order to ease the freight calculations and simplify the estimation of distances. All the dealerships in India are accordingly categorized in the various zones.
62

63

HSCIL DEALERSHIPS
DELHI/NCR: Delhi, Noida, Faridabad, Gurgaon, Ghaziabad
NORTH: Chandigarh, Hissar, Jammu, Amritsar, Ludhiana, Patiala, Jalandhar, Jaipur, Jodhpur, Udaipur, Agra, Bareilly, Kanpur, Lucknow, Meerut, Dehradun
EAST: Guwahati, Bhubaneshwar, Jamshedpur, Kolkatta, Siliguri
CENTRAL: Bhopal, Indore, Jabalpur, Raipur, Nagpur
WEST: Ahmedabad, Mehsana, Rajkot, Surat, Vadodara, Aurangabad, Jalagaon, Kolhapur, Mumbai, Nasik, Pune
SOUTH: Hyderabad, Secunderabad, Vijaywada, Vishakhapatnam, Bangalore, Hubli, Mangalore, Mysore, Calicut, Cochin, Trivandrum, Chennai, Coimbatore, Madurai
64

DIESEL RATES FOR MAJOR CITIES
Applicable from: June 06, 2008Agartala 34.43Ahmedabad 39.99Aizwal 34.29Ambala 34.6Banglore 39.8Bhopal 39.05Bhubhaneswar 37.89Chandigarh 34.69Dehradun 37.02Gangtok 37.39Guwahati 35.53Hyderabad 38.25Imphal 34.21Itanagar 34.48Jaipur 37.37Jammu 35.05Jullunder 34.27Kohima 34.52Lucknow 37.73Panjim 37.61Patna 36.79Pondicherry 35.77Raipur 38.63Ranchi 36.76Shillong 34.62Shimla 35.49Srinagar 35.99Trivandrum 38.29Delhi 34.8Kolkata 35.81Mumbai 39.54Chennai 37.13
65

66
Chassis (TATA 3516) 890000 20000 Registration Charges
Body (TR4 - 4 CityZX eqv) 450000 1,580 Goods Tax
Insurance 25242 4000 Road Tax
Charges (taxes ) 80805 3225 Basic Permit Cost (5yr validity)
Good Tax,Road Tax,Permit Fees 50000 National Permit (avg 10 states)
Fitness ect 2000 Fitness
80805
TOTAL 1446047
FREIGHT RATE TRUCK(TR4)
CAPITAL INVESTMENT

67
Year Y1 Y2 Y3 Y4 Y5 Y6 Y7
Registration Charges 0 0 0 0 0 0
Goods Tax 1,580 1,580 1,580 1,580 1,580 1,580
Road Tax 4000 4000 4000 4000 4000 4000
Basic Permit Cost (5yr validity) 0 0 0 0 3225 0
National Permit (avg 10 states) 50000 50000 50000 50000 50000 50000
Fitness 2000 2000 2000 2000 2000 2000
Pollution UCC Test 640 640 640 640 640 640
Insurance 21287 17069 13695 11266 9052 7281
Driver / Cleaner Salary 180000 180000 180000 180000 180000 180000 180000
Office Expenses 33360 33360 33360 33360 33360 33360 33360
Interest (spread over 5 yrs) 125924 95531 61284 22693 0 0 0
Depreciation @ WDV - 7Yrs 433814 303670 212569 148798 104159 72911 51038
Effective No of months 12 12 12 12 12 12 12 TOTAL PER CAR
TOTAL 773098 692069 562502 456766 387005 356769 329899 569726 142432
Moderated Share of Fleet 16% 25% 19% 19% 19% 3% 1%
Weighted Fixed Cost 123696 173017 104063 86786 71596 8919 1649
FIXED COST / ANNUM
Cost Head Yr 1 Yr 2 Yr 3 Yr 4 Yr 5 Yr 6 Yr 7
Net Variable Cost/ KM 15.84 15.84 16.12 16.12 16.39 16.39 16.67
Fixed Cost / km 10.74 9.61 7.81 6.34 5.38 4.96 4.58
Less Salvage Value
TOTAL 26.58 25.46 23.93 22.46 21.77 21.35 21.25
Profit @10% 2.66 2.55 2.39 2.25 2.18 2.13 2.13
TOTAL RATE / KM 29.24 28.00 26.33 24.71 23.95 23.48 23.38Moderated Share of Fleet 16% 25% 19% 19% 19% 3% 1% TOTAL PER CAR
Weighted Total Cost 4.68 7.00 4.87 4.69 4.43 0.59 0.12 26.38 6.59
TOTAL COST / KM

68
Cost Head Yr 1 Yr 2 Yr 3 Yr 4 Yr 5 Yr 6 Yr 7
Diesel 8.76 8.76 8.76 8.76 8.76 8.76 8.76
Tyres 1.24 1.24 1.24 1.24 1.24 1.24 1.24
Repairs & Maint 1.10 1.10 1.38 1.38 1.65 1.65 1.93
Misc Trip Expense 1.4 1.4 1.4 1.4 1.4 1.4 1.4
Toll taxes 1.4 1.4 1.4 1.4 1.4 1.4 1.4
Comm Expenses 0.00 0.00 0.00 0.00 0.00 0.00 0.00
Net Variable Cost/ KM 13.86 13.86 14.13 14.13 14.41 14.41 14.68
Less Salvage Value 0.00 0.00 0.00 0.00 0.00 0.00 0.00
TOTAL RATE / KM 13.86 13.86 14.13 14.13 14.41 14.41 14.68 TOTAL PER CAR
Empty Running - Variable Cost 16% 25% 19% 19% 19% 3% 1% 14.08 3.52
Weighted Empty Running Cost 2.22 3.46 2.61 2.69 2.67 0.36 0.07
EMPTY RUNNING -VARIABLE COST
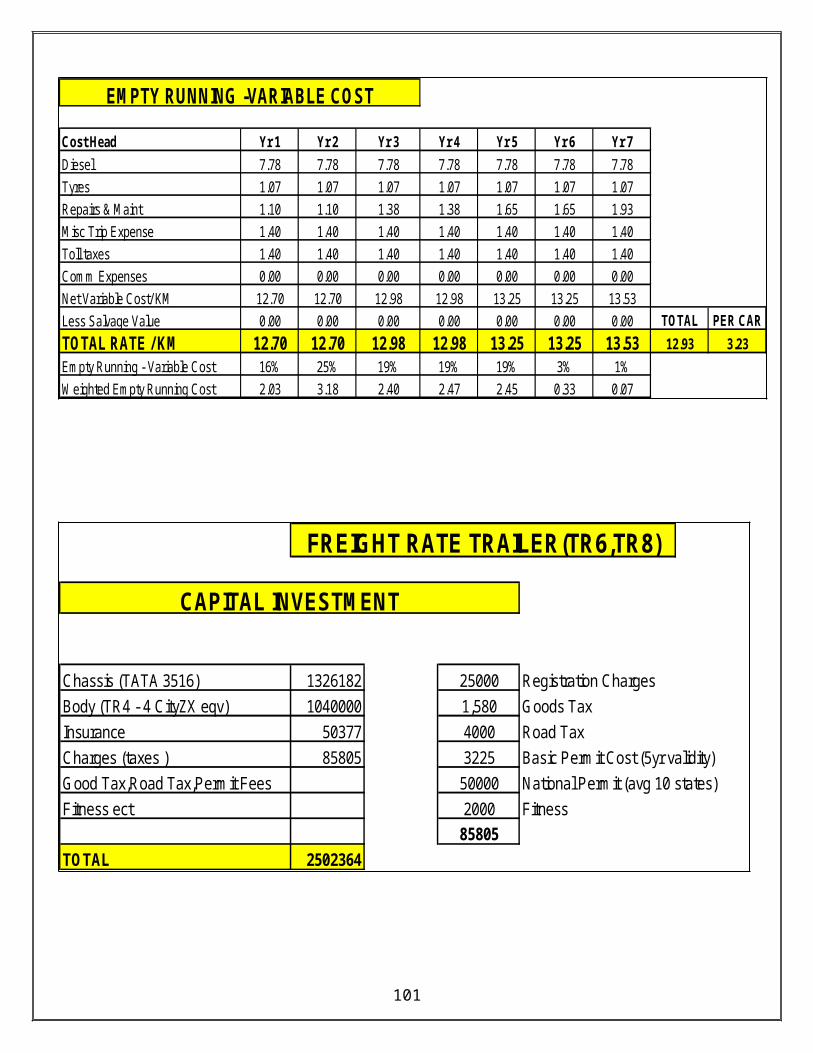
Chassis (TATA 3516) 1326182 25000 Registration Charges
Body (TR4 - 4 CityZX eqv) 1040000 1,580 Goods Tax
Insurance 50377 4000 Road Tax
Charges (taxes ) 85805 3225 Basic Permit Cost (5yr validity)
Good Tax,Road Tax,Permit Fees 50000 National Permit (avg 10 states)
Fitness ect 2000 Fitness
85805
TOTAL 2502364
FREIGHT RATE TRAILER
CAPITAL INVESTMENT

69
Year Y1 Y2 Y3 Y4 Y5 Y6 Y7
Registration Charges 0 0 0 0 0 0
Goods Tax 1,580 1,580 1,580 1,580 1,580 1,580
Road Tax 4000 4000 4000 4000 4000 4000
Basic Permit Cost (5yr validity) 0 0 0 0 3225 0
National Permit (avg 10 states) 50000 50000 50000 50000 50000 50000
Fitness 2000 2000 2000 2000 2000 2000
Pollution UCC Test 640 640 640 640 640 640
Insurance 43394 35946 29987 25699 21789 18662
Driver / Cleaner Salary 180000 180000 180000 180000 180000 180000 180000
Office Expenses 33360 33360 33360 33360 33360 33360 33360
Interest (spread over 5 yrs) 206,051 156,319 100,280 37,133 - 0 0
Depreciation @ WDV - 7Yrs 750709 525496 367847 257493 180245 126172 88320
Effective No of months 12 12 12 12 12 12 12 TOTAL PER CAR
TOTAL 1170120 996789 775653 596193 477524 422766 378562 793993 198498
Moderated Share of Fleet 16% 25% 19% 19% 19% 3% 1%
Weighted Fixed Cost 187219 249197 143496 113277 88342 10569 1893
FIXED COST / ANNUM
Cost Head Yr 1 Yr 2 Yr 3 Yr 4 Yr 5 Yr 6 Yr 7
Diesel 12.42 12.42 12.42 12.42 12.42 12.42 12.42
Tyres 2.07 2.07 2.07 2.07 2.07 2.07 2.07
Repairs & Maint 1.32 1.32 1.65 1.65 1.98 1.98 2.31
Lashing Belt Cost 0.11 0.11 0.11 0.11 0.11 0.11 0.11
Misc Trip Expense 1.40 1.40 1.40 1.40 1.40 1.40 1.40
Toll taxes 1.35 1.35 1.35 1.35 1.35 1.35 1.35
Telephone Expense 0.41 0.41 0.41 0.41 0.41 0.41 0.41
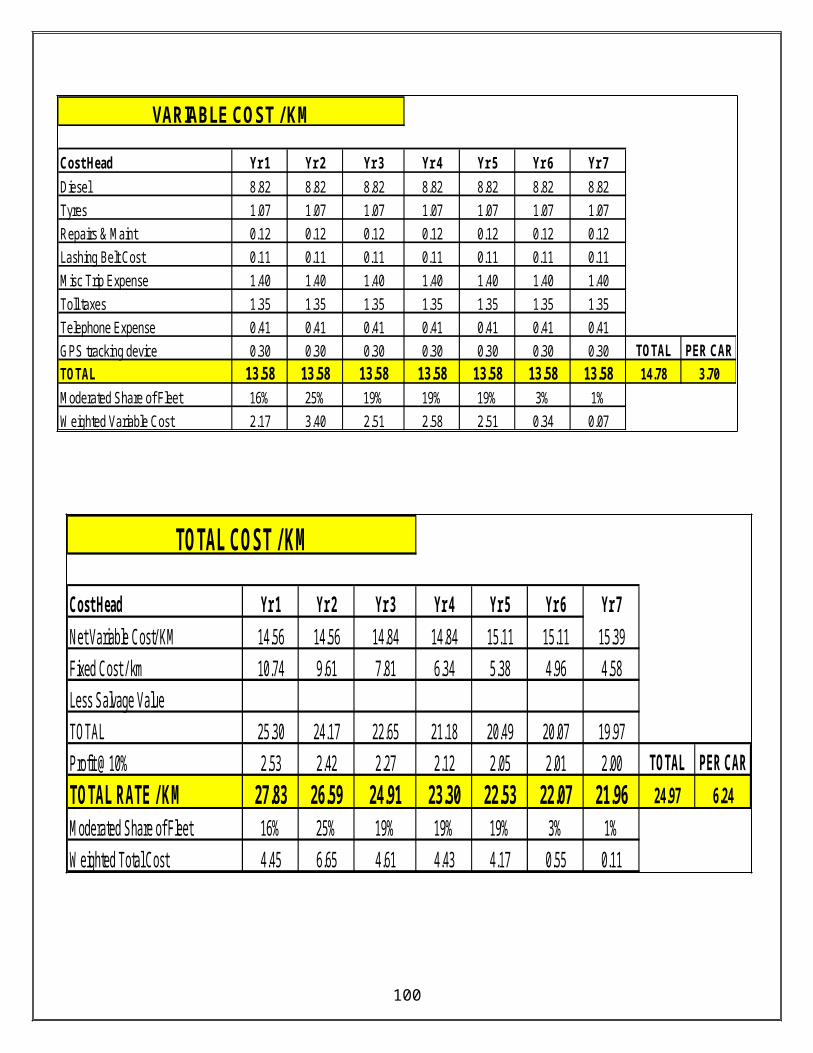
GPS tracking device 0.30 0.30 0.30 0.30 0.30 0.30 0.30 TOTAL PER CAR
TOTAL 19.38 19.38 19.71 19.71 20.04 20.04 20.37 19.64 3.27
Moderated Share of Fleet 16% 25% 19% 19% 19% 3% 1%
Weighted Variable Cost 3.10 4.84 3.65 3.74 3.71 0.50 0.10
VARIABLE COST / KM
70
Cost Head Yr 1 Yr 2 Yr 3 Yr 4 Yr 5 Yr 6 Yr 7
Net Variable Cost/ KM 19.38 19.38 19.71 19.71 20.04 20.04 20.37
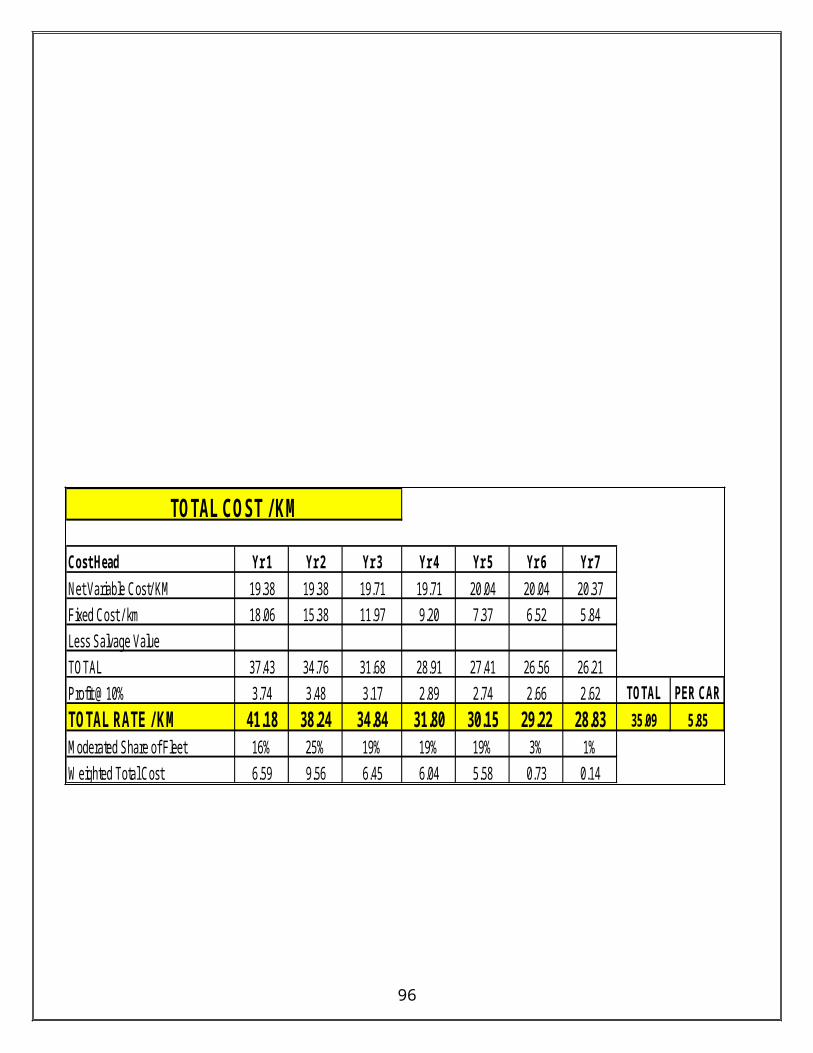
Fixed Cost / km 18.06 15.38 11.97 9.20 7.37 6.52 5.84
Less Salvage Value
TOTAL 37.43 34.76 31.68 28.91 27.41 26.56 26.21
Profit @10% 3.74 3.48 3.17 2.89 2.74 2.66 2.62 TOTAL PER CAR
TOTAL RATE / KM 41.18 38.24 34.84 31.80 30.15 29.22 28.83 35.09 5.85
Moderated Share of Fleet 16% 25% 19% 19% 19% 3% 1%
Weighted Total Cost 6.59 9.56 6.45 6.04 5.58 0.73 0.14
TOTAL COST / KM
PROPOSED FREIGHT MODEL OF HSCIL
71
Cost Head Yr 1 Yr 2 Yr 3 Yr 4 Yr 5 Yr 6 Yr 7
Diesel 11.29 11.29 11.29 11.29 11.29 11.29 11.29
Tyres 2.07 2.07 2.07 2.07 2.07 2.07 2.07
Repairs & Maint 1.32 1.32 1.65 1.65 1.98 1.98 2.31
Misc Trip Expense 1.4 1.4 1.4 1.4 1.4 1.4 1.4
Toll taxes 1.4 1.4 1.4 1.4 1.4 1.4 1.4
Comm Expenses 0.00 0.00 0.00 0.00 0.00 0.00 0.00
Net Variable Cost/ KM 17.43 17.43 17.76 17.76 18.09 18.09 18.42
Less Salvage Value 0.00 0.00 0.00 0.00 0.00 0.00 0.00 TOTAL PER CAR
TOTAL RATE / KM 17.43 17.43 17.76 17.76 18.09 18.09 18.42 17.70 2.95
Empty Running - Variable Cost 16% 25% 19% 19% 19% 3% 1%
Weighted Empty Running Cost 2.79 4.36 3.29 3.37 3.35 0.45 0.09
EMPTY RUNNING -VARIABLE COST

CURRENT DIESEL RATESApplicable from Januray 29,2009Agartala 29.77Ahmedabad 34.62Aizwal 29.79Ambala 29.75Bangalore 34.8Bhopal 34.02Bhubhaneswar 33.07Chandigarh 30.75Dehradun 32.31Gangtok 31.93Guwahati 31.43Hyderabad 33.9Imphal 29.85Itanagar 30.49Jaipur 32.58Jammu 31.07Jullunder 30.34Kohima 30.54Lucknow 32.12Panjim 32.88Patna 32.59Pondicherry 31.54Raipur 33.38Ranchi 31.62Shillong 30.04Shimla 31.62Srinagar 32.29Trivandrum 33.28Delhi 34.8Kolkata 35.81Mumbai 39.54Chennai 37.13
72

73
Chassis (TATA 3516) 890000 20000 Registration Charges
Body (TR4 - 4 CityZX eqv) 450000 1,580 Goods Tax
Insurance 25242 4000 Road Tax
Charges (taxes ) 80805 3225 Basic Permit Cost (5yr validity)
Good Tax,Road Tax,Permit Fees 50000 National Permit (avg 10 states)
Fitness ect 2000 Fitness
80805
TOTAL 1446047
FREIGHT RATE TRUCK(TR4)
CAPITAL INVESTMENT
Year Y1 Y2 Y3 Y4 Y5 Y6 Y7
Registration Charges 0 0 0 0 0 0
Goods Tax 1,580 1,580 1,580 1,580 1,580 1,580
Road Tax 4000 4000 4000 4000 4000 4000
Basic Permit Cost (5yr validity) 0 0 0 0 3225 0
National Permit (avg 10 states) 50000 50000 50000 50000 50000 50000
Fitness 2000 2000 2000 2000 2000 2000
Pollution UCC Test 640 640 640 640 640 640
Insurance 21287 17069 13695 11266 9052 7281
Driver / Cleaner Salary 180000 180000 180000 180000 180000 180000 180000
Office Expenses 33360 33360 33360 33360 33360 33360 33360
Interest (spread over 5 yrs) 125924 95531 61284 22693 0 0 0
Depreciation @ WDV - 7Yrs 433814 303670 212569 148798 104159 72911 51038
Effective No of months 12 12 12 12 12 12 12 TOTAL PER CAR
TOTAL 773098 692069 562502 456766 387005 356769 329899 569726 142432
Moderated Share of Fleet 16% 25% 19% 19% 19% 3% 1%
Weighted Fixed Cost 123696 173017 104063 86786 71596 8919 1649
FIXED COST / ANNUM

74
Cost Head Yr 1 Yr 2 Yr 3 Yr 4 Yr 5 Yr 6 Yr 7
Diesel 8.82 8.82 8.82 8.82 8.82 8.82 8.82
Tyres 1.07 1.07 1.07 1.07 1.07 1.07 1.07
Repairs & Maint 0.12 0.12 0.12 0.12 0.12 0.12 0.12
Lashing Belt Cost 0.11 0.11 0.11 0.11 0.11 0.11 0.11
Misc Trip Expense 1.40 1.40 1.40 1.40 1.40 1.40 1.40
Toll taxes 1.35 1.35 1.35 1.35 1.35 1.35 1.35
Telephone Expense 0.41 0.41 0.41 0.41 0.41 0.41 0.41
GPS tracking device 0.30 0.30 0.30 0.30 0.30 0.30 0.30 TOTAL PER CAR
TOTAL 13.58 13.58 13.58 13.58 13.58 13.58 13.58 14.78 3.70
Moderated Share of Fleet 16% 25% 19% 19% 19% 3% 1%
Weighted Variable Cost 2.17 3.40 2.51 2.58 2.51 0.34 0.07
VARIABLE COST / KM
Cost Head Yr 1 Yr 2 Yr 3 Yr 4 Yr 5 Yr 6 Yr 7
Net Variable Cost/ KM 14.56 14.56 14.84 14.84 15.11 15.11 15.39
Fixed Cost / km 10.74 9.61 7.81 6.34 5.38 4.96 4.58
Less Salvage Value
TOTAL 25.30 24.17 22.65 21.18 20.49 20.07 19.97
Profit @10% 2.53 2.42 2.27 2.12 2.05 2.01 2.00 TOTAL PER CAR
TOTAL RATE / KM 27.83 26.59 24.91 23.30 22.53 22.07 21.96 24.97 6.24
Moderated Share of Fleet 16% 25% 19% 19% 19% 3% 1%
Weighted Total Cost 4.45 6.65 4.61 4.43 4.17 0.55 0.11
TOTAL COST / KM

75
Cost Head Yr 1 Yr 2 Yr 3 Yr 4 Yr 5 Yr 6 Yr 7
Diesel 7.78 7.78 7.78 7.78 7.78 7.78 7.78
Tyres 1.07 1.07 1.07 1.07 1.07 1.07 1.07
Repairs & Maint 1.10 1.10 1.38 1.38 1.65 1.65 1.93
Misc Trip Expense 1.40 1.40 1.40 1.40 1.40 1.40 1.40
Toll taxes 1.40 1.40 1.40 1.40 1.40 1.40 1.40
Comm Expenses 0.00 0.00 0.00 0.00 0.00 0.00 0.00
Net Variable Cost/ KM 12.70 12.70 12.98 12.98 13.25 13.25 13.53
Less Salvage Value 0.00 0.00 0.00 0.00 0.00 0.00 0.00 TOTAL PER CAR
TOTAL RATE / KM 12.70 12.70 12.98 12.98 13.25 13.25 13.53 12.93 3.23
Empty Running - Variable Cost 16% 25% 19% 19% 19% 3% 1%
Weighted Empty Running Cost 2.03 3.18 2.40 2.47 2.45 0.33 0.07
EMPTY RUNNING -VARIABLE COST
Chassis (TATA 3516) 1326182 25000 Registration Charges
Body (TR4 - 4 CityZX eqv) 1040000 1,580 Goods Tax
Insurance 50377 4000 Road Tax
Charges (taxes ) 85805 3225 Basic Permit Cost (5yr validity)
Good Tax,Road Tax,Permit Fees 50000 National Permit (avg 10 states)
Fitness ect 2000 Fitness
85805
TOTAL 2502364
FREIGHT RATE TRAILER(TR6,TR8)
CAPITAL INVESTMENT

76
Year Y1 Y2 Y3 Y4 Y5 Y6 Y7
Registration Charges 0 0 0 0 0 0
Goods Tax 1,580 1,580 1,580 1,580 1,580 1,580
Road Tax 4000 4000 4000 4000 4000 4000
Basic Permit Cost (5yr validity) 0 0 0 0 3225 0
National Permit (avg 10 states) 50000 50000 50000 50000 50000 50000
Fitness 2000 2000 2000 2000 2000 2000
Pollution UCC Test 640 640 640 640 640 640
Insurance 43394 35946 29987 25699 21789 18662
Driver / Cleaner Salary 180000 180000 180000 180000 180000 180000 180000
Office Expenses 33360 33360 33360 33360 33360 33360 33360
Interest (spread over 5 yrs) 206,051 156,319 100,280 37,133 - 0 0
Depreciation @ WDV - 7Yrs 750709 525496 367847 257493 180245 126172 88320
Effective No of months 12 12 12 12 12 12 12 TOTAL TR6 TR8
TOTAL 1170120 996789 775653 596193 477524 422766 378562 793993 132332 99249.13
Moderated Share of Fleet 16% 25% 19% 19% 19% 3% 1%
Weighted Fixed Cost 187219 249197 143496 113277 88342 10569 1893
PER CAR
FIXED COST / ANNUM
Cost Head Yr 1 Yr 2 Yr 3 Yr 4 Yr 5 Yr 6 Yr 7
Diesel 11.03 11.03 11.03 11.03 11.03 11.03 11.03
Tyres 1.78 1.78 1.78 1.78 1.78 1.78 1.78
Repairs & Maint 1.32 1.32 1.65 1.65 1.98 1.98 2.31
Lashing Belt Cost 0.11 0.11 0.11 0.11 0.11 0.11 0.11
Misc Trip Expense 1.40 1.40 1.40 1.40 1.40 1.40 1.40
Toll taxes 1.35 1.35 1.35 1.35 1.35 1.35 1.35
Telephone Expense 0.41 0.41 0.41 0.41 0.41 0.41 0.41
GPS tracking device 0.30 0.30 0.30 0.30 0.30 0.30 0.30 TOTAL TR6 TR8
TOTAL 17.70 17.70 18.03 18.03 18.36 18.36 18.69 17.97 2.99 2.25
Moderated Share of Fleet 16% 25% 19% 19% 19% 3% 1%
Weighted Variable Cost 2.83 4.43 3.34 3.43 3.40 0.46 0.09
VARIABLE COST / KM
PER CAR
Cost Head Yr 1 Yr 2 Yr 3 Yr 4 Yr 5 Yr 6 Yr 7
Net Variable Cost/ KM 17.70 17.70 18.03 18.03 18.36 18.36 18.69
Fixed Cost / km 18.06 15.38 11.97 9.20 7.37 6.52 5.84
Less Salvage Value
TOTAL 35.76 33.08 30.00 27.23 25.73 24.88 24.53
Profit @10% 3.58 3.31 3.00 2.72 2.57 2.49 2.45 TOTAL TR6 TR8
TOTAL RATE / KM 39.34 36.39 33.00 29.95 28.30 27.37 26.98 33.24 5.54 4.16
Moderated Share of Fleet 16% 25% 19% 19% 19% 3% 1%
Weighted Total Cost 6.29 9.10 6.10 5.69 5.24 0.68 0.13
TOTAL COST / KM
PER CAR

Trucks or more commonly known as TR4’s are the carriers having the ability to carry 4 cars (4 Honda Citys since it is the smallest in size of all the other Honda Cars).
77
Cost Head Yr 1 Yr 2 Yr 3 Yr 4 Yr 5 Yr 6 Yr 7
Diesel 10.03 10.03 10.03 10.03 10.03 10.03 10.03
Tyres 1.78 1.78 1.78 1.78 1.78 1.78 0.11
Repairs & Maint 1.32 1.32 1.65 1.65 1.98 1.98 2.31
Misc Trip Expense 1.4 1.4 1.4 1.4 1.4 1.4 1.4
Toll taxes 1.4 1.4 1.4 1.4 1.4 1.4 1.4
Comm Expenses 0.00 0.00 0.00 0.00 0.00 0.00 0.00
Net Variable Cost/ KM 15.88 15.88 16.21 16.21 16.54 16.54 16.87
Less Salvage Value 0.00 0.00 0.00 0.00 0.00 0.00 0.00 TOTAL TR6 TR8
TOTAL RATE / KM 15.88 15.88 16.21 16.21 16.54 16.54 16.87 16.15 2.69 2.02
Empty Running - Variable Cost 16% 25% 19% 19% 19% 3% 1%
Weighted Empty Running Cost 2.54 3.97 3.00 3.08 3.06 0.41 0.08
EMPTY RUNNING -VARIABLE COST
PER CAR

Trailers or more commonly known as TR6’s and TR8’s are the carriers having the ability to carry 6 and 8 cars (6 and 8 Honda Citys since it is the smallest in size of all the other Honda Cars).
From the above excel worksheets it can be seen that first the cost of all the factors like Capital Investment, Fixed Cost, Variable Cost and the Empty Running Cost are estimated.
78
Cost Head Yr 1 Yr 2 Yr 3 Yr 4 Yr 5 Yr 6 Yr 7
Diesel 11.03 11.03 11.03 11.03 11.03 11.03 11.03
Tyres 1.78 1.78 1.78 1.78 1.78 1.78 1.78
Repairs & Maint 1.32 1.32 1.65 1.65 1.98 1.98 2.31
Lashing Belt Cost 0.11 0.11 0.11 0.11 0.11 0.11 0.11
Misc Trip Expense 1.40 1.40 1.40 1.40 1.40 1.40 1.40
Toll taxes 1.35 1.35 1.35 1.35 1.35 1.35 1.35
Telephone Expense 0.41 0.41 0.41 0.41 0.41 0.41 0.41
GPS tracking device 0.30 0.30 0.30 0.30 0.30 0.30 0.30 TOTAL TR6 TR8
TOTAL 17.70 17.70 18.03 18.03 18.36 18.36 18.69 17.97 2.99 2.25
Moderated Share of Fleet 16% 25% 19% 19% 19% 3% 1%
Weighted Variable Cost 2.83 4.43 3.34 3.43 3.40 0.46 0.09
VARIABLE COST / KM
PER CAR

Here it can be observed that the Variable Cost is included twice i.e one is for the loaded carrier and the other is for the unloaded one. This is separately estimated since the variable cost components are different when the carrier travels loaded and when it travels unloaded.
Then the working part begins in which the basic calculations are based upon the diesel cost.In the above table it can be seen that carriers going to the south and west zones get themselves about 80% of the total diesel in Noida since it is the starting destination and the rest of 20% re-filled at Vapi.This partition is done in order to prevent undesired activities like theft of the diesel money or selling diesel by the driver or cleaner of the carrier.
Moreover almost all the transporters have their branch offices throughout the country and are available 24×7 to attend any kind of emergency with the carriers.
Conclusion:
1. So it can be seen that by applying the current diesel rates itself the weighted rate came down from Rs 37.25 to Rs 33.09 i.e a decrease of approximately 11.17%.
This had the following consequences:
79

TRUCK: The diesel cost per km reduced from Rs 9.93 to Rs 8.82m i.e
The empty running diesel cost per km reduced from Rs 8.76 to Rs 7.78
TRAILER: The diesel cost per km reduced from Rs 12.42 to Rs 11.03
The empty running diesel cost per km reduced from Rs 11.29 to Rs 10.03
2. Also in the current model the tyres being used by the transporters in their carriers are of MRF which costs about Rs 22800 per pair, but after suggesting them to replace their tyres to CEAT which costs about Rs 19,600 per pair the tyre cost per km reduced from Rs 1.24 per km to Rs 1.07 i.e a decrease of about 13.71% in case of truck and in case of trailer from Rs 2.07 to Rs 1.78 i.e a decrease of about 14.01%.
EMPTY RUNNING
Empty Running is a very essential component for calculating the total cost incurred and estimating the net freight per car per km to be paid for the transportation. Empty Running is critical since the carriers have to bring some or the other load in its return journey because bringing an
80

empty carrier is a huge overhead for the transporters. Moreover since the variable cost incurred is separate for both a loaded carrier and an unloaded one, thus both the costs are separately included to calculate the net freight per car per km.
This can be explained in the following steps:
1. Carrier gets the load from HSCIL plant for a dealership situated at a particular city.
2. Carrier takes the load from HSCIL plant to that dealership.
3. It delivers the cars at the dealership.
4. The carrier then travels to another nearest automobile plant to deliver their cars to a dealership located near to the HSCIL plant.
5. It picks the load from that plant and delivers to a dealership near to the HSCIL plant.
6. It again gets ready to pick further load from the HSCIL plant for delivering it to the same or any other location.
EMPTY RUNNING FACTOR
Empty Running Factor can be simply defined as the ratio of the distance travelled by the carrier unloaded to get the return load from a specific location and the total distance travelled from HSCIL plant to a particular location.
81

For e.g:
Suppose the carrier travels from HSCIL plant to say a location A about 500 km far. It delivers the load at that location and then it moves to the nearest plant B 100 km far to get the return load. Then mathematically
Empty Running Factor = 100/500 % = 20%
500 km 100 km
EMPTY RUNNING EXAMPLE
CURRENT EMPTY RUNNING FACTORS
82
HSCIL
AB

ZONE EMPTY RUNNING FACTOR
DELHI/NCR 100%
NORTH 80%
EAST 76%
WEST 19%
CENTRAL 59%
SOUTH 14%
PROPOSED EMPTY RUNNING FACTORS
DELHI/NCR ZONE
83

DEALERSHIP LOCATIONS:
Noida Delhi Faridabad Ghaziabad Gurgaon
A carrier carrying the load from HSCIL plant to any of the above locations will come to Maruti Suzuki plant situated in Gurgaon, after delivering the Honda vehicles at its dealerships. This is because Maruti Suzuki is the only company other than Honda in this area which is not
only nearest in distance but also the largest business provider to any of the transporter operating in the Delhi/NCR area.
84
MARUTI SUZUKI GURGAON
MARUTI SUZUKI GURGAON
MARUTI SUZUKI GURGAON
MARUTI SUZUKI GURGAON
MARUTI SUZUKI GURGAON
DESTINATION NEAREST AUTOMOBILE PLANT LOCATION
DELHI/NCRNOIDA
DELHI
FARIDABAD
GHAZIABAD
GURGAON

So by using the formula for calculating the empty running factor, the new empty running factor comes out to be 0% for all the locations. This is because Gurgaon comes under the same zone and hence all the carriers move to it for collecting the return load from Maruti Suzuki. Therefore, because of being situated in the same location the empty running distance from all the above locations to Maruti Suzki plant is assumed zero.
Hence after taking an average of the empty running factors for all the locations, the weighted average empty running factor for the Delhi/NCR zone comes out to be 0%
85
DISTANCE(km) NEAREST EMPTY RETURN LOAD(KM) RUNNING FACTOR
0.00%0.00%0.00%0.00%0.00%
NOIDADELHI
FARIDABADGHAZIABADGURGAON
DELHI/NCR
115115
115
DESTINATION
115 00000115

NORTH ZONE
DEALERSHIP LOCATIONS:
Chandigarh Hissar Jammu Amritsar Ludhiana Patiala Jalandhar Jaipur Jodhpur Udaipur Agra Bareilly Kanpur Lucknow Meerut Dehradun
86

For all the locations except Lucknow and Meerut, the nearest auto plant is Maruti Suzuki. However for both these exceptions the nearest auto plant is Mahindra & Mahindra.
87
MARUTI SUZUKI GURGAON
MARUTI SUZUKI GURGAON
MARUTI SUZUKI GURGAON
MARUTI SUZUKI GURGAON
MARUTI SUZUKI GURGAON
MARUTI SUZUKI GURGAON
MARUTI SUZUKI GURGAON
MARUTI SUZUKI GURGAON
MARUTI SUZUKI GURGAON
MARUTI SUZUKI GURGAON
MARUTI SUZUKI GURGAON
MARUTI SUZUKI GURGAON
MARUTI SUZUKI GURGAON
MARUTI SUZUKI GURGAON
MAHINDRA & MAHINDRA HARIDWAR
MARUTI SUZUKI GURGAON
MAHINDRA & MAHINDRA HARIDWAR
DESTINATION NEAREST AUTOMOBILE PLANT LOCATION
JAIPUR
LUCKNOW
CHANDIGARH
JODHPUR
UDAIPUR
AGRA
MEERUT
DEHRADUN
HISSAR
KARNAL
JAMMU
AMRITSAR
JALANDHAR
LUDHIANA
PATIALA
BAREILLY
KANPUR
NORTH
DISTANCE(km) NEAREST LOCATION EMPTY RETURN LOAD(KM) RUNNING FACTOR
GURGAON 89.18%GURGAON 89.17%GURGAON 72.11%GURGAON 81.47%GURGAON 83.64%GURGAON 96.69%GURGAON 77.40%GURGAON 66.77%GURGAON 56.00%GURGAON 57.14%GURGAON 61.11%GURGAON 82.67%GURGAON 77.24%GURGAON 92.21%HARIDWAR 89.01%GURGAON 82.61%HARIDWAR 25.00%
HISSARKARNALJAMMU
AMRITSARJALANDHARLUDHIANAPATIALA
BAREILLYKANPUR
NORTH
JAIPUR
LUCKNOW
900
290475
CHANDIGARH
JODHPURUDAIPUR
AGRA
MEERUTDEHRADUN
214272
DESTINATION
266
298351
217
137554414495
385325
363
680190
475
202
260
305240
555115
826 4725501672244384949565

Hence after taking an average of the empty running factors for all the locations, the weighted average empty running factor for the North zone comes out to be 75.26%
EAST ZONE
DEALERSHIP LOCATIONS:
Guwahati Bhubaneshwar Jamshedpur Kolkatta Siliguri
88
HINDUSTAN MOTORS UTTARPARA,KOLKATTA
HINDUSTAN MOTORS UTTARPARA,KOLKATTA
HINDUSTAN MOTORS UTTARPARA,KOLKATTA
HINDUSTAN MOTORS UTTARPARA,KOLKATTA
HINDUSTAN MOTORS UTTARPARA,KOLKATTA
DESTINATION NEAREST AUTOMOBILE PLANT LOCATION
EAST
SILIGURI
GUWAHATI
JAMSHEDPUR
KOLKATTA
BHUBANESHWAR

Hence after taking an average of the empty running factors for all the locations, the weighted average empty running factor for the East zone comes out to be 28.22%
CENTRAL ZONE
DEALERSHIP LOCATIONS:
Bhopal Indore Jabalpur Raipur Nagpur
89
DISTANCE(km) NEAREST LOCATION EMPTY RETURN LOAD(KM) RUNNING FACTOR
UTTARPARA,KOLKATTA 53.62%UTTARPARA,KOLKATTA 21.85%UTTARPARA,KOLKATTA 24.50%UTTARPARA,KOLKATTA 0.00%UTTARPARA,KOLKATTA 41.11%
KOLKATTABHUBANESHWAR
GUWAHATIJAMSHEDPUR
EAST
SILIGURI
DESTINATION
20161350180016151474
0606
1081295441

WEST ZONE
DEALERSHIP LOCATIONS:
Ahmedabad Rajkot Surat Vadodara Aurangabad
90
DISTANCE(km) NEAREST LOCATION EMPTY RETURN LOAD(KM) RUNNING FACTOR
UTTARPARA(KOLKATTA) 22.27%UTTARPARA(KOLKATTA) 0.00%UTTARPARA(KOLKATTA) 47.50%UTTARPARA(KOLKATTA) 37.29%UTTARPARA(KOLKATTA) 46.48%
BHOPALINDORE
JABALPUR
RAIPURNAGPUR
CENTRAL
DESTINATION
7501035104011801450
1670
494440674
HINDUSTAN MOTORS UTTARPARA(KOLKATTA)
HINDUSTAN MOTORS UTTARPARA(KOLKATTA)
HINDUSTAN MOTORS UTTARPARA(KOLKATTA)
HINDUSTAN MOTORS UTTARPARA(KOLKATTA)
HINDUSTAN MOTORS UTTARPARA(KOLKATTA)
DESTINATION NEAREST AUTOMOBILE PLANT LOCATION
BHOPAL
INDORE
JABALPUR
RAIPUR
NAGPUR
CENTRAL

Jalagaon Kolhapur Mumbai Nasik Pune
91

Hence after taking an average of the empty running factors for all the locations, the weighted average empty running factor for the West zone comes out to be 16.42%
92
TATA MOTORS,G.M,MERCEDEZ BENZ PUNE
SKODA,AUDI AURANGABAD
SKODA,AUDI AURANGABAD
SKODA,AUDI AURANGABAD
SKODA,AUDI AURANGABAD
SKODA,AUDI AURANGABAD
SKODA,AUDI AURANGABAD
TATA MOTORS,G.M,MERCEDEZ BENZ PUNE
MAHINDRA & MAHINDRA MUMBAI
MAHINDRA & MAHINDRA NASIK
TATA MOTORS,G.M,MERCEDEZ BENZ PUNE
DESTINATION NEAREST AUTOMOBILE PLANT LOCATION
GOA
RAJKOT
SURAT
AURANGABAD
JALAGAON
KOLHAPUR
AHMEDABAD
VADODARA
NASIK
PUNE
WEST
MUMBAI
DISTANCE(km) NEAREST LOCATIONRETURN LOAD(KM)
PUNEAURANGABADAURANGABADAURANGABADAURANGABADAURANGABADAURANGABAD
PUNEMUMBAINASIKPUNE
WEST
NASIKPUNE
GOA
RAJKOTSURAT
AURANGABADJALAGAONKOLHAPUR
AHMEDABAD
348VADODARA
133513501245
MUMBAI
488488
DESTINATION
11452160
2380
338488
0127
127713791905167014701765
00

SOUTH ZONE
DEALERSHIP LOCATIONS:
Hyderabad Secunderabad Vijaywada Vishakhapatnam Bangalore Hubli Mangalore Mysore Calicut Cochin Trivandrum Chennai Coimbatore Madurai
93
MAHINDRA & MAHINDRA ZAHEERABAD
MAHINDRA & MAHINDRA ZAHEERABAD
MAHINDRA & MAHINDRA ZAHEERABAD
MAHINDRA & MAHINDRA ZAHEERABAD
TOYOTA BANGALORE
TOYOTA BANGALORE
TOYOTA BANGALORE
TOYOTA BANGALORE
TOYOTA BANGALORE
TOYOTA BANGALORE
HYUNDAI,FORD,VOLVO,BMW,HINDUSTAN MOTORS,MITSUBISHI CHENNAI
HYUNDAI,FORD,VOLVO,BMW,HINDUSTAN MOTORS,MITSUBISHI CHENNAI
TOYOTA BANGALORE
DESTINATION NEAREST AUTOMOBILE PLANT LOCATION
COCHIN
TRIVANDRUM
CHENNAI
COIMBATORE
MADURAI
HUBLI
MANGALORE
MYSORE
BANGALORE
HYDERABAD
SECUNDERABAD
VIJAYWADA
VISHAKHAPATNAM
SOUTH

Hence after taking an average of the empty running factors for all the locations, the weighted average empty running factor for the South zone comes out to be 9.92%
94
DISTANCE(km) NEAREST LOCATION EMPTY RETURN LOAD(KM) RUNNING FACTOR
ZAHEERABAD 7.25%ZAHEERABAD 7.89%ZAHEERABAD 0.00%ZAHEERABAD 13.11%BANGALORE 0.00%BANGALORE 18.13%BANGALORE 11.16%BANGALORE 5.08%BANGALORE 17.77%BANGALORE 17.94%
CHENNAI 0.00%CHENNAI 15.24%
BANGALORE 15.34%27752842
COCHINTRIVANDRUM
CHENNAICOIMBATORE
MADURAI
HUBLIMANGALORE
MYSORE
BANGALORE
HYDERABADSECUNDERABAD
VIJAYWADAVISHAKHAPATNAM
SOUTH
DESTINATION
436
5335760
423
312
18751875221023802375
32102690
2080267024993000
298127
1480
136
0377

FREIGHT COMPARISON
Now after all the calculations the final freight calculation per car per km is performed.
Mathematically net freight per car per km is calculated by using the formula:
NET FREIGHT/CAR/KM= [(WEIGHTED EMPTY RUNNING/COST/CAR) X ( EMPTY RUNNING FACTOR)] + WEIGHTED TOTAL COST/KM/CAR
TRUCK:
NET FREIGHT/CAR/KM= [3.22 X Empty Running Factor] + 6.23
DELHI/NCR ZONE
LOCATION OLD FREIGHT NEW FREIGHT CHANGENoida 10.63 6.23 41.39%Delhi 10.63 6.23 41.39%
Faridabad 10.63 6.23 41.39%Ghaziabad 10.63 6.23 41.39%Gurgaon 8.50 6.23 41.39%
AVERAGE 10.20 6.23 38.46%
95
NORTH ZONE
LOCATION OLD FREIGHT NEW FREIGHT CHANGEChandigarh 8.90 9.10 2.26%
Hissar 8.90 9.10 2.26%Karnal 9.27 8.55 7.75%Jammu 8.89 8.85 0.41%
Amritsar 8.89 8.92 0.37%Jalandhar 8.90 9.34 4.98%Ludhiana 8.89 8.72 1.89%
Patiala 8.90 8.38 5.84%Jaipur 8.89 8.03 9.64%
Jodhpur 8.89 8.07 9.22%Udaipur 8.89 8.20 7.79%
Agra 8.87 8.89 0.25%Bareilly 8.87 8.72 1.72%Kanpur 8.87 9.20 3.71%
Lucknow 8.87 9.10 2.55%Meerut 10.63 8.89 16.37%
Dehradun 8.89 7.04 20.87%AVERAGE 9.01 8.65 3.83%
EAST ZONE
LOCATION OLD FREIGHT NEW FREIGHT CHANGEGuwahati 8.98 7.96 11.40%
Jamshedpur 8.98 6.93 22.79%Bhbaneshwar 8.76 7.02 19.88%
Kolkatta 8.36 6.23 25.48%Siliguri 8.98 7.55 15.88%
AVERAGE 8.81 7.14 19.08%
96

CENTRAL ZONE
LOCATION OLD FREIGHT NEW FREIGHT CHANGEBhopal 9.43 6.95 26.33%Indore 7.83 6.23 20.43%
Jabalpur 9.43 7.76 17.71%Nagpur 8.70 7.43 14.59%Raipur 9.38 7.73 16.74%
AVERAGE 8.93 8.08 19.16%
WEST ZONE
LOCATION OLD FREIGHT NEW FREIGHT CHANGEGoa 7.27 6.73 7.37%
Ahmedabad 7.02 7.60 8.30%Rajkot 7.27 7.41 1.89%Surat 7.03 7.39 5.18%
Vadodara 6.78 7.13 5.16%Aurangabad 7.27 6.23 14.31%
Jalagaon 7.27 6.53 10.23%Kolhapur 6.69 6.63 0.86%Mumbai 6.69 6.23 6.88%
Nasik 6.78 6.23 8.11%Pune 6.30 6.23 1.11%
AVERAGE 6.94 6.76 2.58%
97

SOUTH ZONE
LOCATION OLD FREIGHT NEW FREIGHT CHANGEHyderabad 6.69 6.46 3.38%
Secunderabad 6.69 6.48 3.08%Vijaywada 6.69 6.23 6.88%
Vishakhapatnam 7.27 6.65 8.50%Bangalore 6.40 6.23 2.66%
Hubli 6.78 6.81 0.50%Mangalore 6.69 6.59 1.50%
Mysore 6.69 6.39 4.43%Cochin 6.69 6.80 1.68%
Trivandrum 6.69 6.81 1.76%Chennai 6.30 6.23 1.11%
Coimbatore 6.69 6.72 0.46%Madurai 6.69 6.72 0.51%
AVERAGE 6.69 6.62 2.05%
98

TRAILER:
NET FREIGHT/CAR/KM= [2.68 X Empty Running Factor] + 5.53
DELHI/NCR ZONE
LOCATION OLD FREIGHT NEW FREIGHT CHANGENoida 10.15 5.53 45.52%Delhi 10.15 5.53 45.52%
Faridabad 10.15 5.53 45.52%Ghaziabad 10.15 5.53 45.52%Gurgaon 8.28 5.53 33.21%
AVERAGE 9.78 5.53 43.06%
NORTH ZONE
LOCATION OLD FREIGHT NEW FREIGHT CHANGEChandigarh 8.66 7.92 8.54%
Hissar 8.66 7.92 8.55%Karnal 9.03 7.46 17.36%Jammu 8.66 7.71 10.93%
Amritsar 8.66 7.77 10.26%Jalandhar 8.66 8.12 6.22%Ludhiana 8.66 7.60 12.19%
Patiala 8.66 7.32 15.48%Jaipur 8.66 7.03 18.81%
Jodhpur 8.66 7.06 18.46%Udaipur 8.66 7.17 17.23%
Agra 8.63 7.75 10.25%Bareilly 8.63 7.60 11.93%Kanpur 8.63 8.00 7.29%
99
Lucknow 8.63 7.92 8.28%Meerut 10.15 7.74 23.71%
Dehradun 8.66 6.20 28.41%AVERAGE 8.76 7.55 13.76%
EAST ZONE
LOCATION OLD FREIGHT NEW FREIGHT CHANGEGuwahati 8.75 6.97 20.38%
Jamshedpur 8.75 6.12 30.11%Bhbaneshwar 8.53 6.19 27.47%
Kolkatta 8.14 5.53 32.06%Siliguri 8.75 6.63 24.21%
AVERAGE 8.58 6.29 26.85%
CENTRAL ZONE
LOCATION OLD FREIGHT NEW FREIGHT CHANGEBhopal 9.18 6.13 33.26%Indore 7.49 5.53 26.17%
Jabalpur 9.18 6.80 25.89%Nagpur 8.47 6.53 22.91%Raipur 9.04 6.78 25.05%
AVERAGE 8.67 6.55 26.66%
WEST ZONE
LOCATION OLD FREIGHT NEW FREIGHT CHANGEGoa 6.88 5.95 13.53%
Ahmedabad 6.84 6.67 2.45%Rajkot 7.08 6.51 8.06%
100
Surat 6.84 6.50 4.99%Vadodara 6.60 6.28 4.86%
Aurangabad 7.08 5.53 21.89%Jalagaon 7.08 5.78 18.41%Kolhapur 6.51 5.86 9.91%Mumbai 6.51 5.53 15.05%
Nasik 6.60 5.53 16.21%Pune 6.13 5.53 9.79%
AVERAGE 6.74 5.97 11.38%
SOUTH ZONE
LOCATION OLD FREIGHT NEW FREIGHT CHANGEHyderabad 6.51 5.72 12.07%
Secunderabad 6.51 5.74 11.80%Vijaywada 6.51 5.53 15.05%
Vishakhapatnam 7.08 5.88 16.93%Bangalore 6.20 5.53 10.81%
Hubli 6.60 6.02 8.85%Mangalore 6.51 5.83 10.46%
Mysore 6.51 5.67 12.96%Cochin 6.51 6.01 7.74%
Trivandrum 6.51 6.01 7.67%Chennai 6.21 5.53 10.95%
Coimbatore 6.51 5.94 8.78%Madurai 6.51 5.94 8.74%
AVERAGE 6.51 5.80 10.99%
101

RECOMMENDATIONS
For calculating the net freight per car per km the distances should be taken from the automobile plant to the dealership in order to be more accurate.
The net freight per car per km should not be same for all the cars i.e City, Civic, Accord and CR-V since all of them are of different costs and simultaneously the risk associated with each of them is different.
102

While calculating the weighted diesel rate the refilling stations should be different for carriers going to different zones since VAPI cannot serve as the re-fill station when the carrier is going to east or central zone locations.
More emphasis should be laid on the SALVAGE VALUE
ATTACHMENT: QUESTIONNAIRE
103

104
Q.1 Which are the companies other than HONDA your company is currently associated with?
MARUTI SUZUKI
HYUNDAI
TATA MOTORS
GENERAL MOTORS
MAHINDRA & MAHINDRA
HINDUSTAN MOTORS
FIAT
SKODA
AUDI
MERCEDEZ BENZ
FORD
TOYOTA
BMW
VOLKWAGON
VOLVO
PLEASE TICK THE OPTION YOU CHOOSE
Q.3 Which company's trucks/trailers form the major part of your fleet?
TATA MOTORS
ASHOK LEYLAND
ANY OTHER PLEASE SPECIFY________________________
100% TOTAL

105
Q.2 What is the current fleet strength of your company?
1-150
151-300
301-600
601-1000
>1000
TRUCK(TR4) TRAILER(TR6) TRAILER(TR8)Q.5 Which are the routes/zones your carriers operate the most?
DELHI/NCR
NORTH
EAST
WEST
CENTRAL
SOUTH
100% TOTAL
Q.4 What is the percentage contribution of below mentioned tyres in your total fleet?
MRF
APOLLO TYRES
CEAT
JK TYRES
ANY OTHER PLEASE SPECIFY__________________________________
100% TOTAL

106
Q.6 What is the average waiting period of your company's carrier in each route?
1-5 DAYS
6-10 DAYS
11-15 DAYS
>15 DAYS
TRUCK(TR4) TRAILER(TR6) TRAILER(TR8)
Q.7 Which is the maximum distance(in kms) that your company carrier travel for getting a return load from other OEM?
50-100
101-200
201-400
401-600
>600

107
Q.8 Which are the locations at which your company gets the carriers refuelled?
ZONE
DELHI/NCR
NORTH
EAST
WEST
CENTRAL
SOUTH
LOCATIONS
Q.9 What is the average fuel tank capacity(in litres) of your company carrier?
100-250
251-500
501-750
>750
TRUCK(TR4) TRAILER(TR6) TRAILER(TR8)

GLOSSARY
Carrier: Over here carrier refers to the Truck or Trailer used for delivering the cars.Load: Load refer to the cars being deliveredOEM: Original Equipment Manufacturer. It means that company or plant which makes the entire product like cars.Salvage Value: The cost of loss incurred per km by the company in case of an accident, theft or any other calamity.
108
Q.10 Which factor is most crucial to your company during the delivery of cars to the dealerships among all others?
SAFETY
QUANTITY
QUALITY
COST
TIME
CARRIER UTILIZATION

Freight: it refers to the rent for transporting the cars to the dealership. It is paid by the company to the transporters.Truck TR4: A carrier which has the ability to carry 4 cars. Trailer TR6: A carrier which has the ability to carry 6 carsTrailer TR8: A carrier which has the ability to carry 8 carsSUV: Sports Utility Vehicle i.e a vehicle used for off-road purpose while simultaneously having the luxurious feel of a car.MUV: Multi Utility Vehicle i.e a vehicle used for loading and transporting small quantities of loadLCV: Light Commercial Vehicle i.e a small truck or tempo used for delivering relatively more quantity of load than the MUV.HCV: Heavy Commercial Vehicle i.e a bigger truck or trailer or more commonly known as the TR4, TR6 or TR8.
REFERENCES
Marketing Management- by Philp Kotler and Kevin Lane Keller
A Practical Guide to Transportation and Logistics-by Michael B. Stroh The Economic Times, 23-03-2009 www.honda-logistics.co.jp
109

www.hondacarindia.com
www.siamindia.com www.mapsofindia.com www.mapxl.com www.google.com
110