
Final Report to Lake Erie Protection Fund For: SG 501-2015 …lakeerie.ohio.gov/Portals/0/LEPF/Final...
25
1 Final Report to Lake Erie Protection Fund For: SG 501-2015 Can household water purification filters remove microcystin from drinking water? September 30, 2016 Prepared by: Justin D. Chaffin, PhD The Ohio State University Franz Theodore Stone Laboratory Ohio Sea Grant P.O. Box 119, 878 Bayview Ave. Put-in-Bay, OH 43456-0119
Transcript of Final Report to Lake Erie Protection Fund For: SG 501-2015 …lakeerie.ohio.gov/Portals/0/LEPF/Final...

1
Final Report to Lake Erie Protection Fund
For: SG 501-2015
Can household water purification filters remove microcystin from drinking water?
September 30, 2016
Prepared by:
Justin D. Chaffin, PhD
The Ohio State University
Franz Theodore Stone Laboratory Ohio Sea Grant
P.O. Box 119, 878 Bayview Ave.
Put-in-Bay, OH 43456-0119

2
Abstract
Toxic cyanobacterial blooms are a global threat to human health due to contamination of
drinking water. In order to ensure public safety, water treatment plants must have the capability
to remove cyanotoxins from water. Recently, however, there have been several instances when
microcystin, a very common and potent hepatic cyanotoxin, has been detected in tap water. This
research investigated if commercially available pitcher-style water purifiers are able to remove
microcystin from water. Microcystin was extracted from 2 naturally occurring blooms in Lake
Erie, diluted to initial concentrations ranging from 1 to 5 ppb, and then subjected to 3 different
types of purifiers. The 3 purifiers tested had filter cartridges that had different sources of
activated carbon and water percolated through the filter at different rates. Results showed that the
purifier with the fastest percolation rate (126 seconds/L) and coconut-based activated carbon
removed 50% or less of the microcystin, while the purifier with the slowest percolation rate (374
seconds/L) and a blend of activated carbon decreased microcystin to below detectable levels in
all experiments. Dissolved organic nitrogen was also measured and removal efficiency followed
a similar pattern to microcystin. Thus, the ability of the pitcher-style purifiers to remove
microcystin was a function of contact time and source of activated carbon in the filter cartridge.
While some purifiers can serve as an additional barrier against microcystin, it is still
recommended to switch water sources if local tap water is known to be contaminated with
microcystin.

3
Introduction
Toxin-producing, freshwater cyanobacterial blooms have become a global threat to the
safety of drinking water (He et al., 2016; O’neil et al., 2012; Qin et al., 2010). Cyanobacteria
have the potential to produce several “cyanotoxins” that negatively impact several organ systems
of vertebrates, including humans (Carmichael, 1992). One of the most potent cyanotoxins,
microcystin, is commonly produced by several genera of cyanobacteria and was responsible for
the 2014 “do not drink” advisory in Toledo, Ohio that left more than 400,000 residents without
potable tap water (Bullerjahn et al., 2016). Unfortunately, cyanobacterial blooms are predicted to
become more severe and wide-spread with climate change if land use practices are not altered to
minimize nutrient (phosphorus and nitrogen) input to surface waters (Michalak et al., 2013; Paerl
et al., 2016). Recent improvements to land use and sewage treatment are ongoing in effort to
prevent blooms, but in the meantime the ability to remove microcystin from surface water to
insure public safety is crucial.
The majority of research conducted regarding removing microcystin from drinking water
has occurred at the water treatment plant scale. Common methods include activated carbon (Ho
et al., 2011), UV light and hydrogen peroxide oxidation (He et al., 2012), and ozone (Hitzfeld et
al., 2000). At the resident scale, Pawlowicz et al., (2006) showed that carbon-based under-the-
sink filters that are connected to the faucet will remove more than 99.7% of microcystin spiked
into deionized water. However, they also showed that pleated paper and string wound filters
allowed more than 90% of microcystin to pass through (Pawlowicz et al., 2006). Thus, the
effectiveness of the filters depends on how the filter is created. The ability of point-of-use filters,
such as pitcher-style water purifiers, to remove microcystin from water have not been tested.
4
The objective of this project was to determine if household pitcher-style water purifiers
are effective at removing microcystin from water. Microcystin was extracted from 2 natural Lake
Erie cyanobacterial blooms (Microcystis and Planktothrix blooms) which were subjected to the
purifiers. This method replicates a more realistic scenario than spiking pure microcystin in
deionized water, as water treatment plants draw in lake water that contains natural organic matter
(NOM) along with potentially toxic cyanobacteria. It is likely that NOM would also break
through the treatment process if microcystin broke through, as evident as taste and odor
problems associated with drinking water (Watson et al., 2016), and because NOM competes with
microcystin for adsorption sites on activated carbon (Lambert et al., 1996). Initial concentrations
of the microcystin in these experiments were between 0.8 and 5.0 ppb, which spans the range of
likely microcystin concentrations in Toledo’s tap water during the 2014 crisis (Qian et al., 2015).
Three different types of purifier filter cartridges were tested in both new and expired conditions.
Finally, repeated filtering through the purifiers was tested to determine if microcystin removal
could be increased with increased filter contact time. Additionally, dissolved organic nitrogen
(DON) was quantified as a proxy for dissolved organic compounds, other cyanotoxins, and taste
and odor compounds.
Methods
Microcystin collection and experiment preparation
Lake water containing microcystin-producing cyanobacteria was collected on 24 July,
2015 from Put-in-Bay during a Microcystis surface scum and on August 10, 2015 from Sandusky
Bay during a Planktothrix bloom. Approximately 20 L of water was collected from each bloom
and subjected to 4 freeze/thaw cycles to lyse cells and extract microcystin, and concentration was

5
measured using ELISA (see below). The water was held at -20°C until experimentation. On the
day of an experiment, water was thawed, filtered through GFF filters (0.45 µm) to remove
cellular debris, and diluted with deionized (DI) water to lower the microcystin concentration to 1
to 5 ppb.
Microcystin congeners present in the bloom-extracted samples were identified and
quantified by GreenWater Laboratories (Palatka, Florida, USA) by liquid chromatography with
tandem mass spectrometry (LC-MS/MS). Fourteen congeners were analyzed for and method
detection limit ranged from 0.01 to 0.05 ppb for each congener.
Water purifiers
Commercially-available pitcher-style water purifiers and corresponding filter cartridges
were purchased from a local super market. Three different purifier brands were tested and each
brand’s had unique filter cartridge components (Table 1). Thus, tests were conducted on the
components of the filter cartridge and not necessarily the brands as each brand may manufacture
different ‘grades’ of filter cartridge. All pitchers used in the study held between 2.4 L and 2.6 L
of water. Three separate pitcher-style water purifiers of each type were used as replicates (9 total
pitchers) and water poured into pint glasses served as a non-purified control.
New filter cartridges were installed according to manufacturer instructions. In order to
determine if the filter cartridges would somehow result in a false positive for microcystin, 1 L of
DI water was poured into the pitchers and that water was sampled for microcystin after it had
percolated through the filter cartridge. All samples in this test were below the detection limit.
Additionally, pH and chloride concentration were measured and verified to be within range so as
to not adversely affect the microcystin ELISA test (pH between 5 and 11, Cl < 0.10 mg/L). The
tests described below were also conducted on expired filter cartridges, which were expired by

6
pouring tap water through the pitchers until the cartridge was considered to be expired according
to manufacturer instructions.
Percolation rates of the purifiers were quantified by timing the length of time elapsed as 1
L of tap water to percolate through each filter. For the remainder of this report, each purifier is
identified by the time needed for 1 L to percolate (seconds/L).
Experimental methods
Objectives of this study were designed to determine if the pitcher-style water purifiers (1)
can remove microcystin and dissolved organic nitrogen (DON) from water, (2) will leak
microcystin after remaining idle for 4 hours (as if filled and placed in a refrigerator for future
use), and (3) if microcystin will become unbound from the filter cartridge upon filtering
microcystin-free water. In order to determine if the pitchers remove microcystin and DON from
water, 1 L of water containing microcystin was poured into each purifier. Water samples were
collected both before and immediately after all water percolated through the filter cartridge. Each
purifier was subsampled 3 times for microcystin by pipetting 10 mL of water from the pitcher
purifier into an amber glass vial (which were averaged to determine the microcystin
concentration for that purifier) and one 150 mL sample was collected for DON analysis by
pouring water from the purifier into a 250-mL polycarbonate bottle. Microcystin analysis began
immediately while the DON samples were stored at -20°C until analysis. To determine if the
filter cartridges leaked microcystin back into the water, microcystin samples were also collected
4 hours after initial filtration. Finally, to determine if microcystin became unbound from the filter
cartridge the water was discarded and 1 L of DI water (microcystin free water) was poured into
the purifier and sampled for microcystin after it percolated through the filter cartridge. These

7
experiments were conducted with new and expired filter cartridges and with two naturally
occurring sources of microcystin in Lake Erie (Microcystis and Planktothrix blooms).
Percolation rates differed remarkably among the 3 types of purifiers (see results, Table
1); therefore, an experiment was designed to determine if increased filter contact time would
increase microcystin and DON removal. In separate experiments using new filter cartridges, 1L
of Microcystis-microcystin water was poured into each purifier and sampled for microcystin as
above. The water was then poured out of the purifier, into a clean glass beaker, and then back
into the purifier. This process was repeated 3 times with a microcystin sample collected after
each percolation. Water for DON analysis was only sampled after the final purification step. This
experiment was conducted twice, once using water with an initial microcystin concentration of
0.96 ppb and then again with initial water with microcystin concentration of 4.8 ppb.
Quantification Analysis
Microcystin was quantified using enzyme-linked immunosorbent assay (ELISA)
following Ohio EPA protocol #701.2 with Abraxis kits. All standards and subsamples were
analyzed in duplicate. For all ELISA results accepted in this research, the R2 values between
known concentrations standards (0.0 to 5.0 ppb) and measured absorbance were 0.98 or greater,
lab reagent blanks (LRB) were all below the reporting limit, and low calibration range check
(LCRC, 0.4 ppb) were within acceptable ranges. Microcystin concentration results less than 0.15
ppb were considered below detectable levels. All ELISA tests were conducted by analysts
certified by the Ohio EPA.
DON was quantified using Kjeldahl digestions and quantification as ammonia, following
standard method EPA 351.2. All DON samples were analyzed in duplicate.
Data analysis

8
Many of the samples analyzed with ELISA gave microcystin concentrations below
detectable concentrations (< 0.15 ppb). However, ELISA will always estimate a concentration
value greater than 0.05 ppb, even for lab reagents blanks (DI water) which have zero
microcystin. The estimated concentrations were used to calculate treatment averages even when
the value was less than the method detection limit (MDL). Analysis of variance (ANOVA) with
a post hoc Tukey test was used to test for differences among treatments.
Results
Filter contact times were remarkably different among the 3 types of purifiers as 1 L of tap
water needed 125.9 ± 2.41 seconds, 230.9 ± 7.30 seconds, and 374.0 ± 2.41 seconds to pass
through the filters. These contact times converted to flow rates gave 0.48 ± 0.009 L/min, 0.26 ±
0.009 L/min, and 0.16 ± 0.001 L/min. For the remainder of this report, each filter type is
identified by the contact time of 1 L (126-purifier, 231-purifier, 374-purifier).
Microcystin-RR was the most abundant congener identified from both the Microcystis
and Planktothrix bloom extractions (Table 2). Microcystin-YR and –LR were found in both
samples. Low levels of Microcystin-HtyR and [DAsp3]microcystin-LR identified from
Microcystis and Planktothrix, respectively (Table 2). Nine other congeners that were tested for in
both samples were below method detection limit.
Figures in the result section display the treatment averages of the estimated microcystin
concentration and values less than the MDL, but the true microcystin concentration could range
from zero to 0.15 ppb. Hence, it could not be confirmed or denied that the purifiers removed
100% of the microcystin.

9
Initial microcystin concentration in the Microcystis-extracted water was 3.3 ppb (Fig.
1A). Microcystin concentration significantly (P < 0.001) decreased following percolation
through each purifier, but was detected in the filtered water from 2 of the 3 purifiers (Fig. 1A).
The 126-purifier decreased microcystin to 1.88 ± 0.21 ppb and the 231-purifier decreased
microcystin to 0.50 ± 0.05 ppb. Microcystin was decreased to non-detectable levels by the 374-
purifier. Microcystin concentration in the filtered water did not change 4 hours after percolation,
and microcystin was not detected in DI water that was filtered through the purifiers. The
experiment was repeated for expired filter cartridges with Microcystis-extracted microcystin with
an initial concentration of 1.94 ppb (Fig. 1B). Following percolation, water from the 126-purifier
was significantly similar to the non-filtered control. The 231-purifier decreased microcystin to
0.25 ± 0.03 ppb and the 374-purifier decreased microcystin to non-detectable levels. Again, the
microcystin concentrations did not change after 4 hours and were not detectable following a DI
water flush. Planktothrix-extracted microcystin had an initial concentration of 2.90 ppb (Fig.
1C). The 126-purifier decreased microcystin to 0.28 ± 0.03 ppb, while the 231- and 374-purifiers
decreased microcystin to below detectable levels. Again, the microcystin concentrations did not
change after 4 hours and were not detectable following a DI water flush.
Dissolved organic nitrogen (DON) was measured on water that passed through the
purifiers (but was not measured following 4 hour and not after a DI flush). In the new filter
Microcystis-extracted experiment, the initial DON concentration was 252.9 ppb and the 126-,
231-, and 374-purifier significantly (P < 0.001) decreased DON to 191.9 ± 6.7 ppb, 144.2 ± 11.9
ppb, and 21.9 ± 2.1 ppb, respectively (Fig. 2A). In the expired Microcystis-extracted experiment,
the 126-purifier decreased DON to the lowest levels while the water of 374-purifier had
significantly similar DON concentration as the non-filtered control (Fig. 2B). Initial DON of the

10
Planktothrix-extracted experiment was much higher than the Microcystis-extracted water at
782.5 ppb (Fig. 2C). DON concentration actually increased following percolation through the
126-purifier, while the 231- and 374-purifier decrease DON to 272.5 ± 12.5 ppb and 18.0 ± 2.2
ppb, respectively (Fig. 2C).
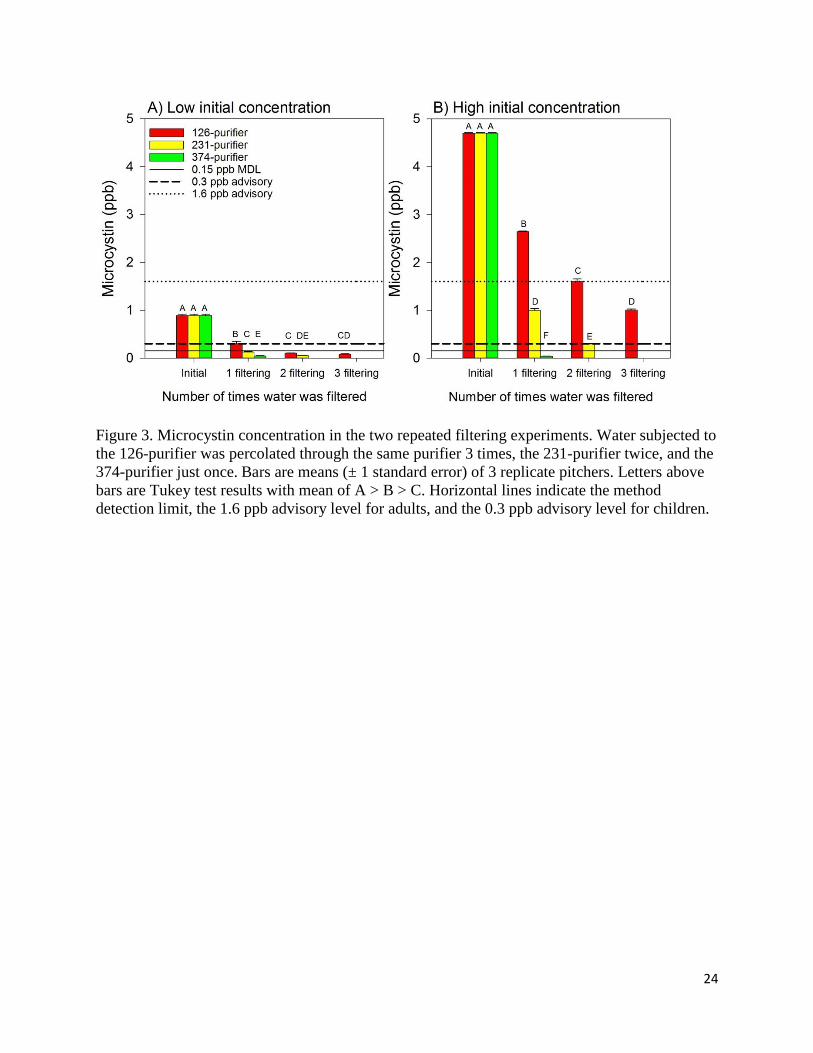
Because percolation rates (i.e. contact times) differed an experiment to equalize contact
time was conducted. The quickest percolating purifier (126 seconds/L), was about 3 times as fast
as the slowest percolating 374-purifier. Water from the 126-purifier was filtered 3 times in total
(refiltered 2 times after initial contact) to increase contact time to a similar contact time as the
374-purifier. The filter with the intermediate contact time of 231 seconds/L was filtered twice.
Therefore, this experiment standardized contact time among the 3 purifiers. Initial concentrations
for the 2 experiments conducted were 0.89 ppb (Fig. 3A) and 4.70 ppb (Fig. 3B) of Microcystis-
extracted microcystin. The 374-purifier decreased microcystin to below detectable levels in both
the low and high initial microcystin experiment after 1-time percolation (Fig. 3). The 231- and
126-purifier decreased microcystin concentration in a step-wise fashion, but the 231-purifier
decreased microcystin more than the 126-purifier. In the high microcystin experiment, the 231-
purifier decreased microcystin to 1.00 ± 0.03 ppb after one percolation then to 0.29 ± 0.02 ppb
after two percolations, while the 126-purifier decreased microcystin to 2.64 ± 0.01 ppb, 1.60 ±
0.05 ppb, and 1.01 ± 0.02, respectively, ppb after each percolation step (Fig. 3B).
DON was only determined after the final percolation step for the repeated percolation
experiment. There was no significant difference in DON concentration among the purifiers in the
low initial concentration experiment (P = 0.059; Fig. 4A). Initial DON concentration was 240.4
in the high experiment (Fig. 4B). After 3-time percolation through the 126-purifier, DON was
reduced to 115.0 ± 9.60 ppb, while 2-time percolation through the 231-purifier reduced DON to

11
80.0 ± 1.45 ppb. DON concentration was reduced to 19.0 ± 7.39 ppb after 1-time percolation
through the 374-purifier.
Discussion
It has been forecasted that toxic cyanobacterial blooms will increase in magnitude under
current climate change scenarios (Michalak et al., 2013; Paerl and Huisman, 2008). Therefore, it
is paramount that all possible actions (land use and water treatment actions) are taken to remove
cyanobacterial toxins from water to provide safe drinking water. A common question asked of
scientists who study cyanobacteria and water treatment plant operators by the public is “Does my
water pitcher filter out microcystin?” Results from this study demonstrated that water pitcher-
style purifiers can add another layer of defense against microcystin; however, the amount of
microcystin removed varied among different purifiers.
The ability of each purifier to remove microcystin and DON was largely a function of
percolation rates as the filter with the quickest percolation (lowest contact time) removed the
least amount of microcystin and DON whereas the filter with the slowest percolation (greatest
contact time) decreased microcystin to below detectable levels in all experiments. The
experiment of repeated percolations with high initial microcystin (Fig. 3B) suggested that more
microcystin would have been removed by the 126- and 231-purifiers if they had longer contact
times. However, after the third time the microcystin-water was poured through the 126-purifier
(total contact time of 378 seconds/L) the microcystin concentration was still at 1.0 ppb, which
was unlike the one-time percolation of the 374-purifier which decreased microcystin to below
detectable levels. This result also indicates that the contents of the filter cartridges also impacted
microcystin removal.

12
Activated carbon is a major component of all three filter cartridges tested and is one of
the several methods used by water treatment plants to remove dissolved organics, including
microcystin, from drinking water (as reviewed by He et al. 2016). There are several sources of
activated carbon (wood, coal, coconut, peat moss) and their efficiency to remove organics varies
due to the size of pores created upon activation (“micropores” < 2.0 nm, “mesopores” 2-50 nm,
and “macropores” > 50 nm). The small pores are more suited for adsorption of small compounds
while larger pores are more suited for the adsorption of high molecular weight compounds.
Microcystins are in the 1-3 nm range and more effectively adsorbed by mesopores (Pendleton et
al., 2001). Coconut shells, which produce micropores upon activation (Donati et al., 1994;
Pendleton et al., 2001), were listed as the main carbon source for the 126-purifier. Thus, the 126-
purifier is not well suited to remove microcystin due to the lack of mesopores. Wood-based
activated carbon produces both micropores and mesopores and has been shown to have the
highest microcystin removal efficiency (Donati et al., 1994; Pendleton et al., 2001). The 231-
and 374-purifiers advertise that a “blend” of activated carbon was used; however, the
composition of that carbon blend was unknown.
Microcystin concentration did not differ between samples collected immediately after
percolation and 4 hours after percolation (Fig. 1). Furthermore, microcystin was not detected in
DI water that was percolated through the purifiers after the microcystin-laden water was
discarded. These results indicate that microcystin bound to the activated carbon did not become
unbound with repeated use. These were true for both new and expired filter cartridges; however,
the expired 126-purifiers did not significantly decrease microcystin (Fig. 1B).
Microcystin is a very common toxin produced by many different bloom-forming
cyanobacteria genera, but cyanobacteria can produce many other toxins that have harmful

13
impacts on human health, such as anatoxin, saxitoxin, and cylindrospermopsin (Huisman et al.,
2010). However, the results of this study cannot be extrapolated to the other cyanotoxins due to
the differing molecular size (anatoxin-a 165 g/mol, saxitoxin 300 g/mol, cylindrospermopsin 415
g/mol, microcystins 900-1050 g/mol (Carmichael, 1992; Ho et al., 2011)) and the efficiency of
different activated carbon to remove different size of organic molecules. For example, Ho et al.
(2011) showed that the adsorption of cylindrospermopsin and microcystins by coal-based
powdered activated carbon differed at shorter contact times and small doses; however, Ho et al.
(2011) also showed that with increased contact time and dose that both cyanotoxins were
effectively 100% removed from water.
During times when microcystin has been detected in drinking water above advisory limits
and a “do not drink” advisory is issued, it is recommended that users switch water sources for
consumption. The US EPA current advisory levels for microcystin are based on a 10-day average
at concentrations of 0.3 ppb for children and 1.6 ppb for adults. Only 1 of the 3 purifiers tested in
this research decreased microcystin to less than 0.3 ppb in all tests (it was also below detectable
levels). Furthermore, because the relatively high method detection limit of ELISA (0.15 ppb), it
is unknown if the 374-purifier removed all of the microcystin. Therefore, when microcystin is
known to be in tap water, it is suggested the consumers switch to bottled water or obtain water
from another public water system. However, for consumers who may not trust public drinking
water due to undetected microcystin (either below detection limits or in between tests) and
instead purchase bottled water, pitcher style water purifiers would be a more-economical and
less-wasteful "safety net" option than bottled water. However, purifiers were intentionally not
identified by brand/model in this report, users may not be able to directly relate their purifier
these results.

14
The global public health organization NSF International recently issued a new protocol
(#477) that will allow manufacturers of point-of-use water purifiers to make claims that their
product can decrease microcystin to concentrations less than 0.3 ppb (NSF International, 2016).
Results from this study indicate only the 374-purifier would achieve that certification. However,
the lower the initial microcystin concentration the greater the chance that any purifier can
decrease microcystin to 0.3 ppb. For example, the 126-purifier achieved 0.3 ppb when the initial
microcystin concentration was 0.89 ppb (Fig. 3A), but the 126-purifier did not achieve 0.3 ppb
when initial microcystin concentration was 1.9 ppb or greater (Figs. 1A, B, C, 3B).
In conclusion, the amount of microcystin removed by point-of-use pitcher style purifiers
differed by type of filter cartridge. The purifier that was most effective at removing microcystin
had the slowest percolation time and a cartridge not solely based from coconut shell activated
carbon, whereas the purifier with the quickest rate of percolation and coconut-based activated
carbon removed the least amount of microcystin. Because cyanobacterial blooms will likely
persist in the near future, water pitcher purifiers maybe an effective method for consumers to
remove microcystin from tap water if there is concern about trace levels of microcystin passing
through treatment undetected on non-testing days. Nonetheless, it is still recommended that
consumers switch water sources during times when microcystin is known to be present in tap
water.
Acknowledgements
This project was funded through the Lake Erie Protection Fund. The LEPF is supported by tax-
deductible donation and voluntary contributions of Ohioans who purchase a Lake Erie license
plate featuring the Marblehead lighthouse, Toledo Harbor lighthouse, or the Lake Erie life

15
preserver. Please see the Commission’s web page: www.lakeerie.ohio.gov. Stone Lab research
aides Erica Fox, Callie Nauman, Kristen Slodysko, and Keara Stanislawczyk and undergraduate
research students Brittany Dalton, Morgan Potts, and Emily Richards conducted the laboratory
work during this research.

16
Changes and hurdles
In summer 2015 the undergraduate students arrived at the lab about one month before
funding began and had to leave just as the supplies started to arrive. Therefore an extension was
requested and received to allow 2016 students work on the project. In spring 2016, 3
undergraduate students were selected to work in the lab and offered to work on 1 of several
research projects, but none of them selected to work on this water pitcher experiment because
they wanted to study the ecology of blooms. Despite none of the students wanting to write a
report for this project, all 3 students had roles in the project. The students were the ones who
extracted the microcystin, poured the microcystin-laden water into the pitchers, collected the
samples, timed the percolation rates of the pitchers, and helped with sample analysis.
In the proposal we indicated that an experiment would have been conducted with pure
microcystin spiked into deionized water. However, that was not feasible due to Ohio State
University codes regarding concentrated pure microcystin in the laboratory. The project would
have been significantly delayed in order to be permitted to have pure microcystin in the lab.
Thus, the experiments were pure microcystin were omitted and replaced with the repeated
filtering experiments (Figs. 3 and 4). Furthermore, deionized water spiked with microcystin does
not simulate natural settings because natural organic matter will also be present in the natural
water and that organic matter competes with microcystin for binding on the activated carbon.
Dissolved organic nitrogen was added to the sample analysis because we wanted another
parameter to measure along with microcystin.
Different congeners of microcystin from the initial bloom sources were identified.
17
Activities and Timeline
July – August 2015: Purchased supplies required for the study. Collected Microcystis and
Planktothrix bloom samples.
September – October 2015: Conducted the experiments using Microcystis-extracted microcystin
and analyzed the samples for microcystin and DON (Figs. 1A, 1B, 2A, and 2B).
November 2015- May 2015: Analyze data from the experiments conducted. Found out that the
pure microcystin experiment was not feasible and developed plans for summer 2015.
June - August 2016: Undergraduate researchers at the lab. Conduct the remaining experiments.
Continued data analysis and began writing the report.
September 2016: Finalize and submit report. Poster developed that will be on display in our
Aquatic Visitors Center beginning May 2017. Results from the project were shared at Stone Lab
education and outreach events and the results will continued to be shared past the funding
timeline of the project.
Deliverables
We learned that the ability of pitcher-style purifiers to remove microcystin depended on
filter contact time and the type of activated carbon in the filter cartridge. Quick percolation
through the filter (short filter contact time) and coconut-based activated carbon had the lowest
efficiency at removing microcystin. The purifier that had slow percolation (high filter contact

18
time) and a blend of activated carbon decreased microcystin to below detection in all
experiments. This information can be shared with the public who are looking for additional
protection from microcystin in tap water.
A poster highlighting the results and conclusions from this research will be on display in
our Aquatic Visitors Center in 2017, which receives over 25,000 visitors each summer.
A future edition of Ohio Sea Grant’s publication “Twineline” will feature the results of
this project. That edition will be published and mailed to subscribers in October 2016. That
edition will also be available at this link https://ohioseagrant.osu.edu/products/twineline as soon
as it is finished have a final file.
3 undergraduate research students were helped with this research.

19
References
Bullerjahn, G.S., McKay, R.M., Davis, T.W., Baker, D.B., Boyer, G.L., D’Anglada, L.V.,
Doucette, G.J., Ho, J.C., Irwin, E.G., Kling, C.L., Kudela, R.M., Kurmayer, R., Michalak,
A.M., Ortiz, J.D., Otten, T.G., Paerl, H.W., Qin, B., Sohngen, B.L., Stumpf, R.P., Visser,
P.M., Wilhelm, S.W., 2016. Global solutions to regional problems: Collecting global
expertise to address the problem of harmful cyanobacterial blooms. A Lake Erie case
study. Harmful Algae, 54, 223–238. doi:10.1016/j.hal.2016.01.003
Carmichael, W. W., 1992. Cyanobacteria secondary metabolites—the cyanotoxins. J. Appl.
Bacteriol. 72, 445–459. doi:10.1111/j.1365-2672.1992.tb01858.x
Donati, C., Drikas, M., Hayes, R., Newcombe, G., 1994. Microcystin-LR adsorption by
powdered activated carbon. Water Res. 28, 1735–1742. doi:10.1016/0043-
1354(94)90245-3
He, X., Liu, Y.-L., Conklin, A., Westrick, J., Weavers, L.K., Dionysiou, D.D., Lenhart, J.J.,
Mouser, P.J., Szlag, D., Walker, H.W., 2016. Toxic cyanobacteria and drinking water:
Impacts, detection, and treatment. Harmful Algae, 54, 174–193.
doi:10.1016/j.hal.2016.01.001 He, X., Pelaez, M., Westrick, J.A., O’Shea, K.E., Hiskia, A., Triantis, T., Kaloudis, T., Stefan,
M.I., de la Cruz, A.A., Dionysiou, D.D., 2012. Efficient removal of microcystin-LR by
UV-C/H2O2 in synthetic and natural water samples. Water Res., 46, 1501–1510.
doi:10.1016/j.watres.2011.11.009
Hitzfeld, B.C., Höger, S.J., Dietrich, D.R., 2000. Cyanobacterial toxins: removal during drinking
water treatment, and human risk assessment. Environ. Health Perspect. 108, 113–122.
Ho, L., Lambling, P., Bustamante, H., Duker, P., Newcombe, G., 2011. Application of powdered
activated carbon for the adsorption of cylindrospermopsin and microcystin toxins from
drinking water supplies. Water Res. 45, 2954–2964. doi:10.1016/j.watres.2011.03.014
Huisman, J., Matthijs, H.C.P., Visser, P.M. (Eds.), 2005. Harmful Cyanobacteria. Springer.
Lambert, T.W., Holmes, C.F.B., Hrudey, S.E., 1996. Adsorption of microcystin-LR by activated
carbon and removal in full scale water treatment. Water Res., 30, 1411-1422.
Michalak, A.M., Anderson, E.J., Beletsky, D., Boland, S., Bosch, N.S., Bridgeman, T.B.,
Chaffin, J.D., Cho, K., Confesor, R., Daloğlu, I., DePinto, J.V., Evans, M.A., Fahnenstiel,
G.L., He, L., Ho, J.C., Jenkins, L., Johengen, T.H., Kuo, K.C., LaPorte, E., Liu, X.,
McWilliams, M.R., Moore, M.R., Posselt, D.J., Richards, R.P., Scavia, D., Steiner, A.L.,
Verhamme, E., Wright, D.M., Zagorski, M.A., 2013. Record-setting algal bloom in Lake
Erie caused by agricultural and meteorological trends consistent with expected future
conditions. Proc. Natl. Acad. Sci. 110, 6448–6452. doi:10.1073/pnas.1216006110

20
NSF International, 2016. http://www.nsf.org/newsroom/nsf-international-certifies-first-water-
filters-that-reduce-microcystin-in. Accessed 15 March 2016.
O’Neil, J.M., Davis, T.W., Burford, M.A., Gobler, C.J., 2012. The rise of harmful cyanobacteria
blooms: the potential roles of eutrophication and climate change. Harmful Algae 14, 313–
334.
Paerl, H.W., Gardner, W.S., Havens, K.E., Joyner, A.R., McCarthy, M.J., Newell, S.E., Qin, B.,
Scott, J.T., 2016. Mitigating cyanobacterial harmful algal blooms in aquatic ecosystems
impacted by climate change and anthropogenic nutrients. Harmful Algae, 54, 213–222.
doi:10.1016/j.hal.2015.09.009
Paerl, H.W., Huisman, J., 2008. Blooms Like It Hot. Science 320, 57–58.
doi:10.1126/science.1155398
Pawlowicz, M.B., Evans, J.E., Johnson, D.R., Brooks, R.G., 2006. A study of the efficacy of
various home filtration substrates in the removal of microcystin-LR from drinking water.
J. Water Health 4, 99–107. Pendleton, P., Schumann, R., Wong, S.H., 2001. Microcystin-LR Adsorption by Activated
Carbon. J. Colloid Interface Sci. 240, 1–8. doi:10.1006/jcis.2001.7616
Qian, S.S., Chaffin, J.D., DuFour, M.R., Sherman, J.J., Golnick, P.C., Collier, C.D., Nummer,
S.A., Margida, M.G., 2015. Quantifying and reducing uncertainty in estimated
microcystin concentrations from the ELISA method. Environ. Sci. Technol. 49, 14221–
14229.
Qin, B., Zhu, G., Gao, G., Zhang, Y., Li, W., Paerl, H.W., Carmichael, W.W., 2010. A drinking
water crisis in Lake Taihu, China: linkage to climatic variability and lake management.
Environ. Manage. 45, 105–112. doi:10.1007/s00267-009-9393-6
Watson, S.B., Monis, P., Baker, P., Giglio, S., 2016. Biochemistry and genetics of taste- and
odor-producing cyanobacteria. Harmful Algae, Global Expansion of Harmful
Cyanobacterial Blooms: Diversity, ecology, causes, and controls 54, 112–127.
doi:10.1016/j.hal.2015.11.008

21
Tables
Table 1. Pitcher-style water purifiers used in this study and their contract time in seconds per L
(the length of time for 1 L of tap water to percolate through each filter cartridge) and their
advertised source of activated carbon. Values are mean ± 1 SE of 3 separate filter cartridges.
Purifier Contact time (seconds/L) Activated Carbon
Identifier for this
report
Brand "A" 125.9 ± 2.41 Coconut 126-purifer
Brand "B" 230.9 ± 7.30 "Blend" 231-purifier
Brand "C" 374.0 ± 2.41 "Blend" 374-purifier
Table 2. Microcystin congeners as percent of total in the Microcystis-extracted and Planktothrix-
extracted experiments. “ND” indicates non-detect due to concentration below the method
detection limit of 0.01 to 0.05 ppb for each congener.
Microcystin- Microcystis Planktothrix
[DAsp3] MC-RR ND ND
MC-RR 45.45% 75.00%
MC-YR 22.73% 12.50%
MC-HtyR 4.54% ND
MC-LR 27.27% 6.25%
[DAsp3] MC-LR ND 6.25%
[Dha7] MC-LR ND ND
MC-HilR ND ND
MC-WR ND ND
[DLeu1] MC-LR ND ND
MC-LA ND ND
MC-LY ND ND
MC-LW ND ND
MC-LF ND ND

22
Figures
Figure 1. Microcystin concentration (parts per billion) immediately following percolation
through pitcher-style purifiers (“post filter”), 4 hours after percolation, and in deionized water
percolated through the purifiers after the microcystin-laden water was discarded (“DI rinse”).
Experiments were conducted with microcystin extracted from Microcystis (A, B) and
Planktothrix (C). Bars are means (± 1 standard error) of 3 replicate pitchers. Letters above bars
are Tukey test results with mean of A > B > C. Horizontal lines indicate the method detection
limit, the 1.6 ppb advisory level for adults, and the 0.3 ppb advisory level for children. “NS” =
no sample. DI water was not poured into the non-filtered controls and analyzed.

23
Figure 2. Dissolved organic nitrogen concentration in water that percolated through pitcher-style
purifiers and extracted from extracted from Microcystis (A, B) and Planktothrix (C). Bars are
means (± 1 standard error) of 3 replicate pitchers. Letters above bars are Tukey test results with
mean of A > B > C. Horizontal line indicate the method detection limit.
24
Figure 3. Microcystin concentration in the two repeated filtering experiments. Water subjected to
the 126-purifier was percolated through the same purifier 3 times, the 231-purifier twice, and the
374-purifier just once. Bars are means (± 1 standard error) of 3 replicate pitchers. Letters above
bars are Tukey test results with mean of A > B > C. Horizontal lines indicate the method
detection limit, the 1.6 ppb advisory level for adults, and the 0.3 ppb advisory level for children.

25
Figure 4. Final dissolved organic nitrogen concentration in water that was subjected to the 126-
purifier 3 times, the 231-purifier twice, and the 374-purifier once. DON was not measured after
each percolation step (as in Figure 3). Bars are means (± 1 standard error) of 3 replicate pitchers.
Letters above bars are Tukey test results with mean of A > B > C. Horizontal line indicate the
method detection limit.


![CALIFORNIA [ADVANCE RELEASE] · Sh Sh MgCp SG SG SG SG SG SG SG SG SG Fe Fe Gr-s Gr-s Per CS Pum Pum Salt Salt Salt S-o S-o Zeo Dia Bent Bent Bent B B Clay Clay Dia DS DS DS DS DS](https://static.fdocuments.net/doc/165x107/5d435e0888c993ea558bc1de/california-advance-release-sh-sh-mgcp-sg-sg-sg-sg-sg-sg-sg-sg-sg-fe-fe-gr-s.jpg)