Final Presentation - eCAL · PDF fileSo what will PESES do? Use networked accelerometers to...
19
Final Presentation
Transcript of Final Presentation - eCAL · PDF fileSo what will PESES do? Use networked accelerometers to...
Final Presentation

The Problem
Safety risk to building inspectors & first responders
Cost of inspections
Cost of building downtime
Resources spread thin: thousands of buildings could be damaged with few engineers to inspect

Current System
Engineers check building by building to determine which structures are safe to enter.
Buildings are tagged as red, yellow, or green.
The USGS has attempted to develop a sensor network for large structures, but this has not been implemented on a large scale.
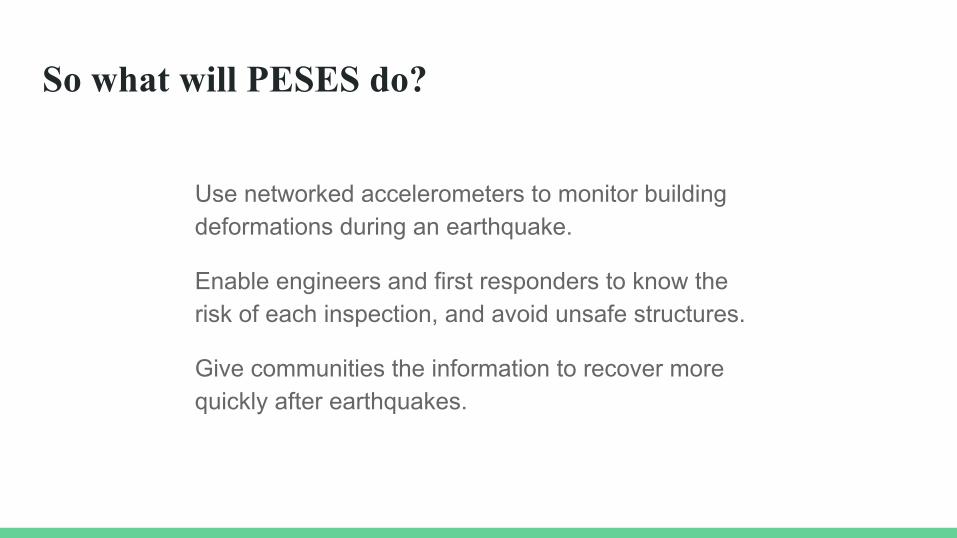
So what will PESES do?
Use networked accelerometers to monitor building deformations during an earthquake.
Enable engineers and first responders to know the risk of each inspection, and avoid unsafe structures.
Give communities the information to recover more quickly after earthquakes.
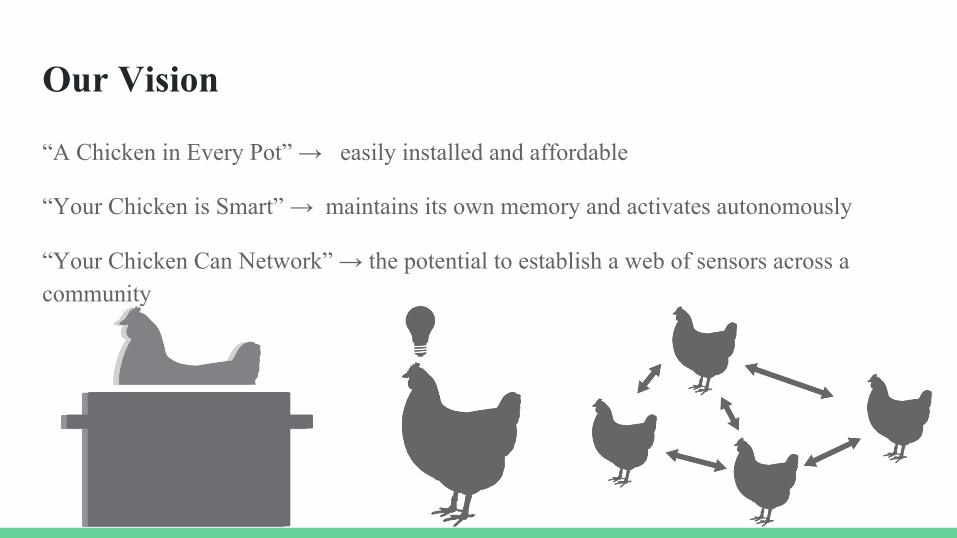
“A Chicken in Every Pot” → easily installed and affordable
“Your Chicken is Smart” → maintains its own memory and activates autonomously
“Your Chicken Can Network” → the potential to establish a web of sensors across a community
Our Vision
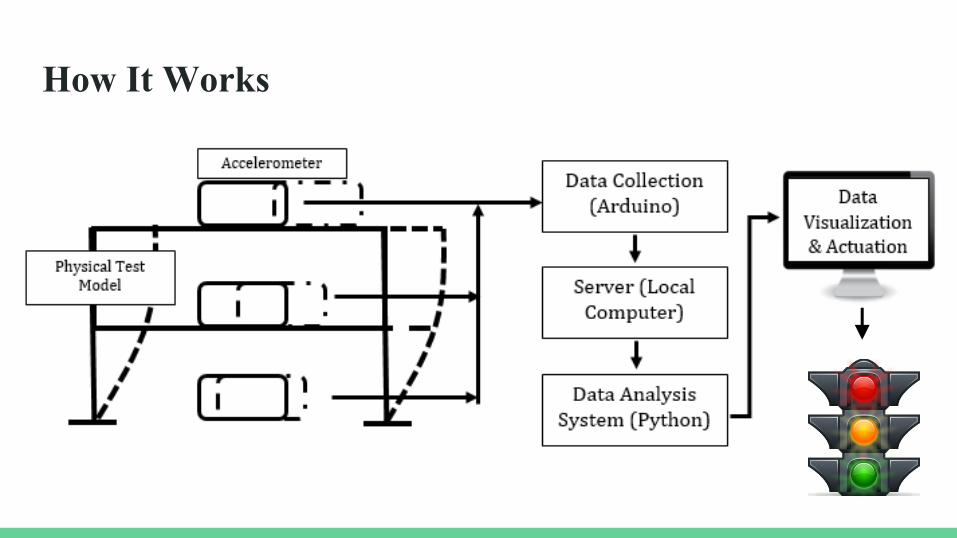
How It Works

Sparkfun Triple Axis Accelerometer
size of a quarter
$ 16
Accurate to within .01 g
Small, cheap, and accurate
Hardware

Finding Displacements
Double integral of the acceleration readings using trapezoidal method

Filtering the Data
Bandpass Butterworth Filter
Isolate structural response and eliminate low and high frequency noise

Bandpass Butterworth Filter
Isolate structural response and eliminate low and high frequency noise
Filtering the Data

Bandpass Butterworth Filter
Isolate structural response and eliminate low and high frequency noise
Filtering the Data
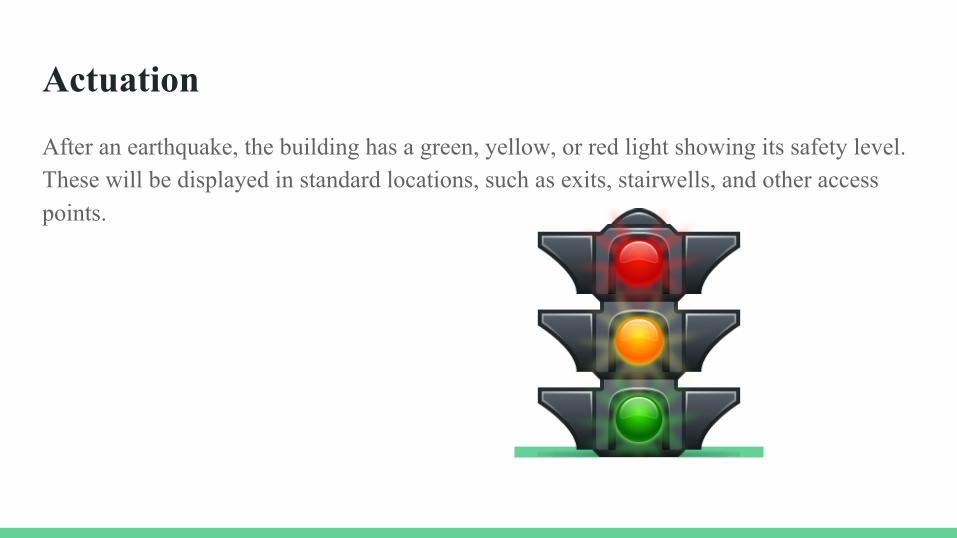
After an earthquake, the building has a green, yellow, or red light showing its safety level. These will be displayed in standard locations, such as exits, stairwells, and other access points.
Actuation
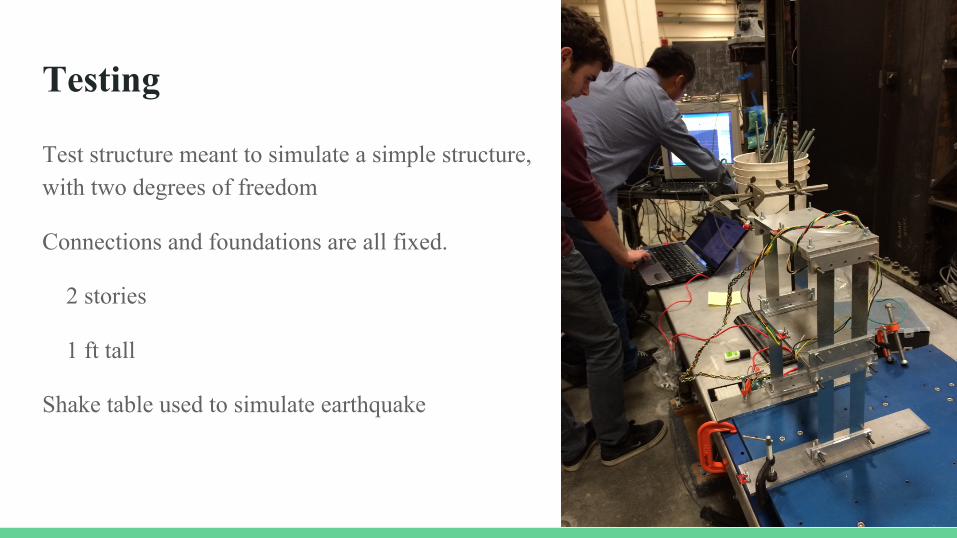
Testing
Test structure meant to simulate a simple structure, with two degrees of freedom
Connections and foundations are all fixed.
2 stories
1 ft tall
Shake table used to simulate earthquake

Demo

Web Visualization
Three levels of detail for data visualization:
Network level detail
Displays number of buildings networked, and if any of them are flagged as red.
Structure level detail
Displays structure health and status of sensors.
Also will display relevant plots, such as floor drift, one of the variables that can be used to evaluate structural safety.
Sensor Level detail
Displays sensor position data, this will allow for users to identify the locations in the structure that might experience the highest level of damage.

SensorStructure
Web Visualization examples

Web Visualization limitations
Due to the fact that heroku can only handle 10,000 data points, our prototype is only able to display short shake events.
In order to accurately integrate to position, the sensors must be reading at 1000 Hz, which reach 10,000 data points after 10 seconds. When split among 3 sensors, we aren’t able to display date continuously.
We do implement a memory management program to limit the amount of data we push to the server, so only important information is sent to heroku. Non-shaking data is ignored and overwritten before ever being sent to the server.

PESES Impact PotentialSave tens of thousands of man-hours formerly used for Rapid Visual Screening after an earthquake.
Greece 1999: 180,000 buildings damaged, 15-30 minutes/inspection → ~70,000+ man-hours
Christchurch, NZ 2011: 170,000 buildings damaged/destroyed → ~64,000+ man-hours
Enhance first-responder and inspector safety.
Reduce building down time.
Efficiently allocate disaster recovery resources
https://www.unicef.org/education/files/VisualEvaluationFEMA_154.pdfhttp://link.springer.com/article/10.1007/s40091-016-0118-9http://www.bbc.com/news/world-asia-35612298
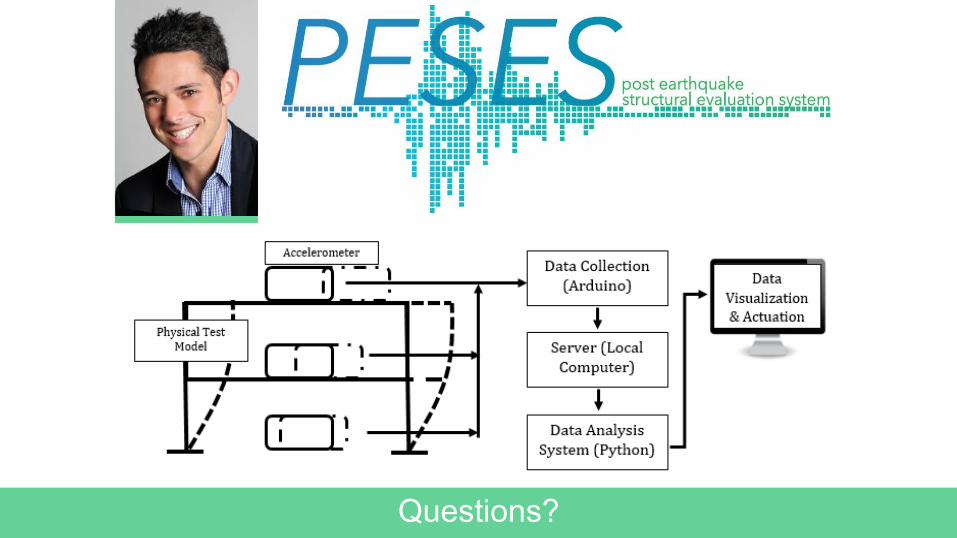
Questions?