
FINAL GALlLEO PROPULSION SYSTEM IN-FLIGHT CHARACTERIZATION
28
FINAL GALlLEO PROPULSION SYSTEM IN-FLIGHT CHARACTERIZATION T.J. Barber’ Jet Propulsion Laboratory California Institute of Technology Pasadena, California F.A. Krug+ and K.P. Renner+ Deutsche Forschungsanstalt fur Luft- und Raumfahrt e.v. (DLR) 06erpfaffenhofen, Germany Abstract The Galileo Retro-Propulsion performed excellently throughout eight-year Galileo Jupiter mission. state-of-the-art, pressure-fed, propulsion system, provided to Module (RPM) the ambitious, The RPM is a bipropellant NASA by the Federal Republic of Germany. Some Galileo RPM pressure transducers drifted linearly versus time since launch. Consumable usage was generally well within specifications, including propellant usage. Maneuver performance continued to be excellent during the orbital tour of Jupiter. No 1O-N thruster thermal instabilities were observed during the mission, likely due to a conservative, pulse- mode operating strategy. Apparent performance shifts of the lateral thrusters were detected and remain unexplained. Nearly all Galileo 1O-N thrusters exceeded ground performance thrust k?VdS by 10/. tO !5Yo. The soft-seat pressure regulator, now isolated, exhibited exemplary performance during the Galileo mission. Conversely, oxidizer and fuel check valve performances were out of specification and highly non-repeatable for the three main 400-N engine burns. However, the 400-N engine performances were only slightly impacted, and a highly successful Jupiter Orbit Insertion and orbital tour were realized. L Introduction Galileo’s voyage of discovery continues to rewrite the textbooks of planetary science in the 1990’s. Originally conceived more than twenty years ago, the Galileo nominal mission is nearing completion after a challenging eight years in flight. “ Member Technical Staff + Wissenschaftlicher Mitarbeiter der DLR The three primary science objectives of the Galileo mission are (1) to investigate the physical state and chemical composition of the Jovian atmosphere, (2) to investigate the physical state and chemical composition of the Jovian satellites, and (3) to investigate the physical structure and dynamics of the Jovian magnetosphere. The Galileo spacecraft, comprised of an atmospheric entry probe and orbiter, was launched October 18, 1989, aboard the space shuttle Atlantis. An Inertial Upper Stage (IUS) booster placed Galileo on the proper heliocentric path, a six-year looping Venus-Earth-Earth-Gravity Assist (VEEGA) trajectory to Jupiter (see Figure 1). This circuitous route was necessary given the many mission constraints and redesigns following the Challenger disaster in 1986.’ Galileo’s VEEGA cruise was far from uneventful. Flybys of Venus and the Earth (twice) were executed successfully, both with respect to 1- Figure 1: Galileo Heliocentric Trajectory 1 American Institute of Aeronautics and Astronautics Copyright @ 1997 American Institute of Aeronautics and Astronautics, Inc. All rights reserved
Transcript of FINAL GALlLEO PROPULSION SYSTEM IN-FLIGHT CHARACTERIZATION

FINAL GALlLEO PROPULSION SYSTEMIN-FLIGHT CHARACTERIZATION
T.J. Barber’Jet Propulsion Laboratory
California Institute of TechnologyPasadena, California
F.A. Krug+ and K.P. Renner+Deutsche Forschungsanstalt fur Luft- und Raumfahrt e.v. (DLR)
06erpfaffenhofen, Germany
Abstract
The Galileo Retro-Propulsionperformed excellently throughouteight-year Galileo Jupiter mission.state-of-the-art, pressure-fed,propulsion system, provided to
Module (RPM)the ambitious,The RPM is a
bipropellantNASA by the
Federal Republic of Germany. Some Galileo RPMpressure transducers drifted linearly versus timesince launch. Consumable usage was generallywell within specifications, including propellantusage. Maneuver performance continued to beexcellent during the orbital tour of Jupiter. No 1O-Nthruster thermal instabilities were observed duringthe mission, likely due to a conservative, pulse-mode operating strategy. Apparent performanceshifts of the lateral thrusters were detected andremain unexplained. Nearly all Galileo 1O-Nthrusters exceeded ground performance thrustk?VdS by 10/. tO !5Yo. The soft-seat pressureregulator, now isolated, exhibited exemplaryperformance during the Galileo mission.Conversely, oxidizer and fuel check valveperformances were out of specification and highlynon-repeatable for the three main 400-N engineburns. However, the 400-N engine performanceswere only slightly impacted, and a highlysuccessful Jupiter Orbit Insertion and orbital tourwere realized.
L Introduction
Galileo’s voyage of discovery continues torewrite the textbooks of planetary science in the1990’s. Originally conceived more than twentyyears ago, the Galileo nominal mission is nearingcompletion after a challenging eight years in flight.
“ Member Technical Staff+ Wissenschaftlicher Mitarbeiter der DLR
The three primary science objectives of the Galileomission are (1) to investigate the physical stateand chemical composition of the Jovianatmosphere, (2) to investigate the physical stateand chemical composition of the Jovian satellites,and (3) to investigate the physical structure anddynamics of the Jovian magnetosphere.
The Galileo spacecraft, comprised of anatmospheric entry probe and orbiter, was launchedOctober 18, 1989, aboard the space shuttleAtlantis. An Inertial Upper Stage (IUS) boosterplaced Galileo on the proper heliocentric path, asix-year looping Venus-Earth-Earth-Gravity Assist(VEEGA) trajectory to Jupiter (see Figure 1). Thiscircuitous route was necessary given the manymission constraints and redesigns following theChallenger disaster in 1986.’
Galileo’s VEEGA cruise was far fromuneventful. Flybys of Venus and the Earth (twice)were executed successfully, both with respect to
1-
Figure 1: Galileo Heliocentric Trajectory
1American Institute of Aeronautics and Astronautics
Copyright @ 1997 American Institute of Aeronautics and Astronautics, Inc. All rights reserved

Figure 2: Galileo Jupiter Arrival Geometry
uniaue science observations and with respect tothe acquisition of the proper gravity assists to getto Jupiter. First-rate planetary science wasaccomplished during VEEGA as well, including (1)the first reconnaissance of a main-belt asteroid,951 -Gaspra, October, 1991; (2) the first discoveryof a natural satellite (Dactyl) of an asteroid, 243-Ida, August, 1993; and (3) the first and onlytelescope to directly image a comet or asteroid(fragments of Comet Shoemaker-Levy 9)impacting a planet (Jupiter).
Along with profound science successes, therewere many notable engineering successes duringVEEGA. The Jupiter atmospheric entry probe wassuccessfully released on July 13, 1995. Twoweeks later, the Galileo 400-N (main) engine wasused post-launch for the first time, with greatsuccess. Prior to 1995, the main engine was lastfired in June, 1983. Perhaps most stunningly, onDecember 7, 1995 (PST), Galileo recorded aunique success in the history of planetaryexploration—the first entry into an outer (giant)planet atmosphere (by the probe) and the firstorbital capture around a giant planet (by theorbiter). Figure 2 displays the Galileo arrivalgeometry, demonstrating the time criticality ofthese two mission-essential events.
Coupled with the successes, however, weresome noteworthy engineering setbacks duringVEEGA. A partially deployed (and henceunusable) High Gain Antenna (HGA) and a “sticky”Data Memory Subsystem (DMS) tape recorderbrought special challenges to the Galileo flightteam. Fortunately, the flight team was able toovercome these challenges through modifications
.
RJ .713492 km - 1
Figure 3: Galileo Jovian Orbital Tour Petal Plot
> the ground receivers of the Deep SpaceNetwork (DSN), extensive changes to Galileo flightsoftware, an improved DMS tape conditioningprofile, and additional new DMS-relatedautonomous fault protection routines.
After orbit insertion, the orbiter began touringJupiter’s “miniature solar system,” executingmultiple orbits about Jupiter (see Figure 3), all butone with a very close satellite flyby (of Europa,Ganymede, or Callisto). These close encounterswith the satellites not only allow detailed scientificinvestigation, the gravity assist obtained from thetarget satellite literally enables the orbital tour.’
The nominal Galileo End-Of-Mission (EOM) isDecember, 1997. A follow-on mission utilizing theGalileo orbiter—the Galileo Europa Mission(GEM)–was recently approved. This two-yearmission, from December, 1997 to December,1999, will continue to unveil the mysteries of theJovian system, with repeated Europa flybysfollowed by four repeated Callisto encounters andone nominally planned close encounter withvolcanically active 10.
il. The Spacecraft
Galileo was the second planetary spacecraft tobe launched from the space shuttle, following theMagellan mission to Venus, which was launchedMay, 1989. Due to the payload bay sizeconstraints for the shuttle, several key portions ofthe Galileo spacecraft were designed to bedeployed following separation from the payloadbay, including the HGA, Radioisotope
2American Institute of Aeronautics and Astronautics

Thermoelectric Generator (RTG) booms, andmagnetometer boom. Therefore, the launchconfiguration differs somewhat from the cruiseconfiguration.
Figure 4 shows the Galileo spacecraft cruiseconfiguration with a partially deployed HGA andthe probe attached. The HGA unfurled onlypartially after the initial deploy command issuedApril, 1991, leading to an asymmetric, “claw-shaped” HGA. In 1992, the decision was made touse the LGA in case all efforts to free the boundribs of the HGA would be unsuccessful. Severalsubsequent attempts to open the HGA were made,to no avail.
Unique among planetary missions, Galileo is aspin-stabilized, dual-spin spacecraft. Except forone optical instrument, the spinning (spun) portionof the spacecraft contains all the fields andparticles science instruments, allowing theseinstruments an omni-directional view. Thestationary (despun) portion of the spacecraftcontains a scan platform with imaging scienceinstruments that require stable pointing. This
design, though challenging to the designers,combines both the science advantages of Voyager(three-axis stabilized) and Pioneer (spin-stabilized)in one spacecraft. A complete description of theGalileo spacecraft may be found in the literature.’
Due to the weak solar intensity at Jupiter (< 55W/m’ on average), the orbiter is powered by twoRTGs. The total RTG power output decreasesfrom 572 W at the beginning of the mission to 456W by end-of-year 1999, the nominal completion ofGEM.
The Command and Data Subsystem (CDS),with components both on the spun and despunportions of the orbiter, represents a significantimprovement over the Voyager computerhardware. Closely tied to the CDS is thepreviously mentioned DMS, which allowsspacecraft science and engineering data to berecorded and returned to Earth at a later time. TheDMS is an essential mission element with a LGA-only mission—it has been used extensively toreturn the probe entry data as well as data fromeach satellite encounter during the orbital tour.
/PLASMA-WAVE AA N T E N N A A
\
LOW-GAI\ANTENNA
PARTICLES DETECTOR
=
PLASMA SCIENCE
._. —.— .—-------- --. --— - - HEAVY ION COUNTER (BACK)
DUST DETECTOR
RETROPROPULSION MODULE
/ WIPROBE “ 1
‘-l
SCAN PLATFORM, CONTAINING:RELAY JUPITERANTENNA
● ULTRAVIOLET SPECTROMETERATMOSPHERIC “ SOLID-STATE IMAGING CAMERA
PROBE “ NEAR-INFRARED MAPPING SPECTROMETER“ PHOTOPOLARIMETER RADIOMETER
RADIOISOTOPETHERMOELECTRIC
GENERATORS (RTG)(2 PLACES)
Figure 4: Galileo Spacecraft in Nominal Cruise Configuration
J MAGNETOMETERSENSORS
3American Institute of Aeronautics and Astronautics

The telecommunications subsystem utilizes S-band uplink and downlink, primarily communicatingwith NASA’s DSN 70-m antennas in Goldstone,California; Madrid, Spain; and Canberra, Australia.In fact, improvements in receiver hardware andsignal coding (coupled with extensive Galileo flightsoftware changes) have literally enabled the LGA-only orbital mission. No X-band command andtelemetry communications have been possible,due to the HGA anomaly. The X-band radiofrequency was used during HGA troubleshootingactivities, however.
The Attitude and Articulation ControlSubsystem (AACS) is responsible for maintainingthe inertial pointing and spin rate for the Galileospacecraft, as well as scan platform pointing.AACS attitude changes are accomplished by firingtwo of the twelve 10-N bipropellant thrusters of theRPM. Hence, the RPM and AACS subsystemsare closely related and the RPM/AACS interface isquite critical.
Extensive on-board fault protection against amultitude of fault conditions is provided on Galileo.These fault protection algorithms are necessarilyautonomous, due to long (up to almost one hour)one-way communication times, the high demandfor DSN tracking coverage, and the loss ofcommunication experienced during solarconjunction.
Ill. RPM Hardware Su~
The Galileo RPM is a bipropellant, pressure-fed propulsion system provided to NASA by theFederal Republic of Germany. The RPM providesall the propulsive capability necessary for thecomplex Galileo mission. A hyperboliccombination of monomethylhydrazine (MMH) andnitrogen tetroxide (NTO) is utilized for twelvetrajectory correction and attitude (spin andpointing) maintenance 1O-N thrusters and one 400-N main engine used for large Galileo trajectorymaneuvers. As shown in Figure 5, a set of six 10-N thrusters is mounted in each of two thrusterclusters, which extend approximately two metersfrom the RPM body center on opposite booms.The 400-N engine is centered in the RPM structureand is initially covered by the probe (see Figure4)—protected from micrometeorites by thesurrounding spacecraftlprobe hardware.Therefore, the engine could not be fired until theprobe was released.
‘“B K+.*B
‘LIBV-ZIB-ZIP.
Figure 5: RPM 3D View
The RPM is a self-contained, primary load-bearing structure of the Galileo spacecraft.Principal components of the central RPM bodyinclude two helium pressurant tanks, two MMHpropellant tanks, and two NTO propellant tanks, allconnected with an integrating truss. Other RPMcomponents include a pressurization and feedsystem, consisting of two Pressurant ControlAssemblies (PCAS) on two separate equipmentpanels. One of these panels also carries theoxidizer feed system, called the PropellantIsolation Assembly (PIA-1 ), and the secondincludes the fuel feed system, called PIA-2. Alsoincluded is a thermal control system (for booms,thruster clusters, and the 400-N engine) consistingof thermal blankets, Radioisotope Heater Units(RHUS), electrical heaters, and electrical cabling.Details on the mission requirements, design, andpre-launch performance qualification of the RPMhave been published.’
Figure 6 is the RPM pressurization and feedsystem schematic. A great deal of redundancywas built into the pressurization and feed system,both for shuttle safety reasons and for faulttolerance during this lengthy mission. Helium isprovided to the propellant tanks via one of tworedundant pressure regulators. Only the primarypressure regulator was utilized in flight.
4American Institute of Aeronautics and Astronautics

PCA-1TH 1-0THE1 0—TM2
THE2 PCA-2——— ——— ———. — ———.
TO t
Figure 6: RPM Pressurization and Feed System Schematic
The pressurization system was designed toavoid a repetition of the regulator leakage seen onthe Viking mission to Mars. A soft-seat regulatorwas selected to minimize sensitivity to particulatecontamination. The parallel redundant regulatorconfiguration included a backup regulatorpositively isolated from downstream contaminationby a normally closed pyro valve. Check valveswere provided to minimize MMH and NTO vapormigration upstream of the propellant tanks. Sincepropellant vapor mixing (after permeation throughcheck valves) was the probable cause of theViking regulator leak, the Galileo check valveswere constructed of a unique soft-seat design thatyields extremely low reverse leakage levels. Toguard against possible leaking thruster valves,back-pressure relieving latch valves were provided
upstream of the thrusters for reversible isolation.
The design and performance of the 10-Nthruster and the 400-N engine mentioned abovehave been documented.’ Thermal control for the10-N thruster is accomplished by film-cooling ofthe combustion chamber, MMH regenerativecooling of the engine throat, and radiative coolingof the nozzle. Re-testing of the 10-N thruster inearly 1989 demonstrated some thermal instabilitiesduring continuous-mode operation and some hotoperation during pulse-mode operation at certainduty cycles (duty cycle = Tw/[TOn+T0,~).5 Highoxidizer-to-fuel mixture ratios and/or high totalpropellant mass flow rates or higher propellanttemperatures generally aggravated the instabilitiesand hot operation. Therefore, to preclude these
5American Institute of Aeronautics and Astronautics

instabilities, the Galileo RPM operates the 10-Nthruster in pulse-mode only, with quite low dutycycles and with a curtailed tank pressure andtemperature range. This mode of operation,though challenging to the flight team, has workedwell in flight, as is evident from the excellentGalileo navigation throughout the mission.
Thruster thermal performance is determinedfrom temperature transducers mounted to thecluster and thruster chambers. Four of the 10-Nthruster temperature transducers failed early in themission.e This has little consequence for themission since cluster temperatures adequatelycharacterize 10-N thruster thermal performance.
KGalileo 1O-N Thruster Operation
The ambitious nature of the Galileo missionputs severe demands on the propulsion system forattitude maintenance, Trajectory CorrectionManeuvers (TCMS) during cruise, Orbit TrimManeuvers (OTMS) during orbital tour, and largeAV maneuvers—specifically, the Orbiter DeflectionManeuver (ODM), Jupiter Orbit insertion (JOI)burn, and the PeriJove Raise (PJR) maneuver.Many attitude correction functions are provided forthe dual spinning Galileo. First, spin corrections tothe nominal (all-spin or dual-spin) spin rate areallowed for, correcting solar torques and maneuvererrors caused by thruster misalignments, engineperformance changes, etc. In addition, large spin-rate change maneuvers (from 2.89 rpm to10.5 rpm in all-spin mode) are a missionrequirement for probe attitude stabilization, prior toprobe release, since the Jovian atmospheric entryprobe has no attitude correction capability. Also,operation of the 400-N engine requires a minimumspin rate near 10 rpm as well, for centrifugalpropellant management in the propellant tanksduring the 400-N acceleration, as well as for thrustvector control. Two sets of redundant spin-up andspin-down thrusters are used for these purposes(see Figure 7). Nominally, the S2A and S1 Athrusters are the primary spin-up and spin-downthrusters, respectively.
The capability to turn the spacecraft by meansof a precession maneuver is necessary in theGalileo mission for thermal reasons (early missiononly), acquiring science data, maintainingcommunication with the Earth and maintainingcelestial reference, and finally for so-called turn-burn maneuvers. Three types of precession
TOP Vzsu:
SZDS VISU:A s/c muxz’lrDzNAL AXIS
L2B
P2A 1 \-22A -Z2B
+
ZIB ZIA
~OLS :A
BW4C14 A A BSANCH B
I Operated ThrusterManeuver Branch A I Branch BAttitude Control:- Spin-Up- Spin-Down- Precession Control- Turns
Trajectory Control:- Plus-Axial Av
- Minus-Axial Av- Lateral Av
S2ASIA
PIA/P2AZ1AIZ2A
P I AZIA/Z2APIA/P2A
S2BS1 B
L1 B/L2BZ1 BIZ2B
LIBZI B/z2BL1 BIL2B
Figure 7: RPM IO-N Thruster Configuration
maneuvers have been executed—SpacecraftInertial TURNS (SITURNS), sun acquisitions, andHGA (pointing) corrections. SITURNS may beperformed in two different modes—balanced orunbalanced. Balanced SITURNS are performed onthe P-thrusters, firing simultaneously once perspacecraft revolution to cancel out the net Av, asmay be seen in Figure 7. Conversely, unbalancedSITURNS may be executed by firing either the A-branch or B-branch Z-thrusters alternately, onceper revolution. Note that in this case, adeterministic Av is imparted to the spacecraft.Unbalanced turns are nearly three times morepropellant-efficient than balanced turns, but theassociated Av must be accounted for in trajectoryoptimization. Both types of turns have beenutilized extensively during the Galileo mission.
HGA (or pointing) corrections allow the HGAboresight as well as the 1.GA boresight to be
6American Institute of Aeronautics and Astronautics

pointed to the Earth. Though the spacecraftexclusively uses a wider beam S-bandtelecommunication link over LGA-1 (which has thesame boresight direction as the HGA), LGA-1pointing tolerances are also quite tight due to theaggressive data return strategy from the Jupitersystem (given the HGA deployment failure). Inaddition, pointing corrections are necessary duringmaneuvers because thruster misalignments orperformance shifts can cause the spacecraft toprecess sufficiently such that the AACS star setchosen for the maneuver (for accurate attitudereference) is no longer viable. Like balancedSITURNS, pointing corrections are performed onthe P-thrusters in a balanced mode.
Sun acquisitions allow the spacecraft to startat any off-sun attitude and return to (near) sun-point. They are performed also using the P-thruster couple, but since their on-times are notindividually calculated to balance their impulse, asmall Av is imparted to the spacecraft during a sunacquisition. These maneuvers were usedsparingly in the last few years, since celestialreference was almost always available (and hencethe use of SITURNS was possible).
Many relatively small TCMS and OTMS (Av <
40 m/s) are necessary throughout interplanetarycruise and the Jovian orbital tour. Thesemaneuvers are basically o f t w o types—deterministic and statistical. The capability toperform these relatively small maneuvers isprovided in both the *z-direction (along thespacecraft spin axis) and in the lateral direction. A“vector mode” maneuver represents one way,then, to perform a given maneuver. In this case,the spacecraft’s attitude remains unchangedthroughout the maneuver and the proper amountof AV is achieved by splitting the AV into the correctamount of lateral and (*) axial firing. Alternatively,the maneuver may be accomplished by firstprocessing to the appropriate attitude (“turn”), firingalong either the lateral Qr axial direction (“burn”),and then processing back (“unwind”) to the originalattitude via a SITURN or sun acquisition. Suchturn-burn-unwind maneuvers can offer propellantsavings when compared with the analogous vectormode maneuver, depending on Av magnitude anddirection.
Lateral thruster segments have beenemployed very frequently in Galileo TCMS andOTMS. In this operating mode, the L1 B and L2B
thrusters fire alternately, once per revolution. Thethruster on-times are set individually such that thenet torque on the spacecraft is zero. However, asmall AV component is generated along the z-axiseach time a lateral maneuver is executed which isaccounted for in the maneuver design. Since theinertial firing position (clock angle) may bespecified for a lateral maneuver, a lateral Av maybe achieved in any lateral direction.
Two types of 10-N thruster axial maneuvershave been executed on Galileo. The mostcommon is a PULZ (axial -z) maneuver, whichimparts a velocity increment to the spacecraft inthe -z direction. Unlike the unbalanced turn mode,this type of maneuver fires each of two Z-thrusterssimultaneously twice per revolution, canceling thenet torque. Another type of axial maneuver is thePOSZ (axial +z) maneuver, which increases thespacecraft velocity in the +Z direction. As may beseen in Figure 7, only the PIA and LIB thrustershave a thrust component in the spacecraft +Zdirection. A POSZ maneuver does not cause thespacecraft to precess, since the PI A thruster isfired twice per revolution, applying oppositetorques. Since the thrust component of PIAthruster in the +Z direction is not large (sin 210),this type of maneuver is not very efficient and isgenerally avoided, if possible, even by occasionallybiasing the trajectory slightly.
There is one common Galileo propulsiveactivity that is performed to maintain the RPM. Atleast every twenty-three days (a numberdetermined through theoretical modeling), all RPM1O-N thrusters are operated for a minimum on-timeof 1.2 s. These so-called thruster ‘(flushes” arenecessary to limit the build-up of products from theinteraction of NTO with some small stainless steelcomponents (nearly all hardware in contact withNTO is made of a titanium alloy which resists suchcorrosion). These products may accumulate to thepoint that they could clog filters or small flowpassages.’ There has been no evidence of suchcontamination during the Galileo mission.
Flushing maneuvers are designed to impart aslittle Av as possible, but it is clear that the Av in the-z direction (from all the Z-thrusters) will notcancel. Navigation has accepted this AV in the -zdirection, since it is of small magnitude (< 35 mm/sfor all four Z-thrusters, total) and, more importantly,because it is predictable in magnitude anddirection. These thruster flushes have had little
7American Institute of Aeronautics and Astronautics

C3ST,ART400-N ENGINE DECISION FLOW DIAGRAM
rLEGEND 1 w’!! ,FP . FAULT PROTECTION1 VI . LATCH VALVE INDICATION
L--4=*
!YCLE 40JN LVS E?CC Ev ,~N,,,E)$/PEN 4LMN LVS 12sEFORE JOI H. FP ENAF+ LED
CON PV CONTfiOLDURING EARLYPART OF BURN
\IIIGNITION II
kETYYEIL—
L.~N LV OK/ OPEN$
JOI
ON LV CONTRO~
9.
10N ODM
Ir
4CON LV OK ;4;; OKWU8 O(DNT WORKPv Wml LIKELY FAJLT ONE EV STUCK
TRY “LIB AGAlhCYCLE402N LVS E-m
OPEN PV ANIIOPEN 401N LVS E-125 LEAVE OPEN WITH
LVS CLOSEDLEAVE PV CLOSEO
TEUPEHATUilECAP VENT E+OS CYCLE THE EV
EV IGNITION IF S/C IMF’UL$EoCCURS EV IS
TERMINATE W’LVS OPEN
IF EV NEVEN OPEN=~NOJOl
&!-GION 00N
4cQN LV STUCKOPEN RISKINDICATED OPENPVIEV UNTRIED
NEVEf{ ENABLE HELOSS FP
4LYJN PV CONTHOL
OPEN A LV E*)
BYPASS LV E-$3n1
FIRE PC17 E lb
EV IGNITION(ND PRDTECTION FOFPC-17!PV FAILUREI
TERMINATE PVILVS
ISO REGULATOR 2sAFTER LV CLOSE (HeLOSS PROTECTION)
Figure 8: 400-N Engine Flow Diagram
?
Fid
@ OP$EO
Y
B
,( L. NII(”N I
TOUR88RANCH ONLy
BYPASS LVS E%”
CAP VENT E+OS
EV IGNITION
TEN UINATt W LVS
.@ pREVIOUS Lv
BY$ASS
LRZL i
Jol
IN ~ UNLESSl$,REG (PfllME 81) NEVER OPENlENNOJOl
operational impact on the Galileo mission, since accomplish these checks. In order to minimize thetrajectory correction has not been adversely adverse effect of a valve failure (stuck open oraffected and because the total propellant cost ofthruster flushes throughout the entire mission isonly around 8.5 kg (<1?’. of the total usablepropellant). One side benefit of the thrusterflushes is the ability to analyze 10-N thrusterperformance versus ground test performance forotherwise unused engines like the B-branch S-thrusters.
V. 400-N Enaine Operation
Operation of the Galileo 400-N engine broughtvery different challenges to the propulsion systemgiven the six year “in-flight” wait time before its firstuse. The correct operation of all hardwarecomponents was partially verified, componentswhich include latch valves, pneumaticallycontrolled engine valves, an electromagnetic pilotvalve, propellant filters, oxidizer and fuel checkvalves and the pressure regulator. Figure 8represents the flow diagram that was developed to
stuck closed), two diagnostic activities wereperformed in-flight prior to the first nominal burn.Before pressurization of the pilot valve, the 400-Nlatch valves were commanded (opened/closed) 25times. All actuations were successful as indicatedby reed switches. The function of the pilot valve isto pneumatically actuate the engine valves, whichstarts a 400-N engine burn. A two-second (wake-up) burn was performed to verify the engine valvesand pilot valve open/close functions and also topositively confirm the open state of the latch valvesduring the burn. The wake-up burn did verify thatthe engine and all associated valves workedproperly.
All 400-N burns are accelerometer controlled,unlike 10-N thruster firings. The required Av iscommanded to the spacecraft and the on-boardburn task compares this value with the one whichis derived from the accelerometer. As soon as thecommanded Av is achieved, the burn is shut down.
8American Institute of Aeronautics and Astronautics

Because the accelerometer mainly contributes tothe Av uncertainty, a calibration burn would bevaluable to assure a high accuracy at the criticalJupiter Orbit Insertion. Therefore, the less timecritical ODM, performed on the 400-N engine,served also as an accelerometer calibration burn.
A major effort during the preparation of the400-N burns was put into the development ofnew/updated autonomous on-board fault protectionroutines to avoid mission critical impacts frommalfunctioning propulsion system hardware duringa burn. Potential internal helium leaks in the pilotvalve were guarded against by monitoring thehelium tank pressure; they could have beenmitigated by firing a pyre-valve and thus closingthe open pilot valve port (“helium-loss” protection).This would have required subsequent engineoperation control via the latch valves only, anoperational mode which was tested during groundtests in Germany in 1994 and 1995. The “over-pressure” algorithm checked the propellant tankpressures against an upper limit. It would haveisolated the pressure regulator if the tankpressures were to rise above a set limit. A “low-pressure” protection was implemented to shutdown the engine in case the propellant linepressures dropped below a specified limit, possiblycaused by plugged filters. Nominal changes in tankpressures required the maintenance of t h ethresholds, especially for the “helium-loss”protection. Risk assessments, fault probabilitiesand the criticality of a given maneuver for themission led to the decision that “helium-loss”protection was to be used for all three 400-Nmaneuvers, the “over-pressure” protection forODM and PJR and the “low-pressure” protectionfor PJR only.
An algorithm to protect against accelerometermalfunction was active during 400-N burns.Undetectable sensor errors would shift the burntime to the highest or lowest value. To protectagainst large accelerometer errors, the burn timewas forced to stay between a minimum and amaximum limit. In case a total accelerometerfailure would have been detected, the burn timewould have defaulted to a nominal value. Theseparameters were set for each burn according tothe expected system performance and thecriticality of the maneuver.
The PJR Maneuver completed the 400-Noperations. Now only one requirement remains:
the engine temperature has to stay warm enoughto keep the propellant in the wetted lines, valvesand volumes from freezing. This requirement isaccomplished by a prime and redundant heater.The remainder of mission will be performed on 10-N thrusters in blow-down mode–-the regulator wasisolated post-PJR.
VI. Consumable Summary
The primary RPM consumables are propellant(MMH and NTO) and latch and engine valvecycles (for both the IO-N thrusters and the 400-Nengine). The usable propellant remaining is one ofthe most critical spacecraft consumables since itmay be a life-limiting resource for the GEMmission. However, accumulated radiation damageand, less likely, RTG power output decay arecontenders as well. Also, given additional usageof the 1O-N thrusters during GEM, 1O-N latch andthruster valve cycles are important consumablesas well.
10-N thruster and 400-N engine models havebeen developed based on ground test data. Fromthese models, estimates of the oxidizer and fuelconsumption during a given maneuver may beobtained. Specifically, the oxidizer and fuel tankpressures, maneuver on-time, and propellanttemperatures are entered as input. Output fromthe model includes the specific impulse (Isp), totalmass flow, engine thrust, and mixture ratio. Fromthe total mass flow and mixture ratio, the oxidizerand fuel consumed during the maneuver can bedetermined.
Despite a large unexpected propellantexpenditure (approximately 50 kg) for HGAdeployment attempts, the propellant margin (i.e.,propellant left at the end of mission) has improvedsubstantially since launch. In particular, the usablepropellant remaining at the end of the nominal tour(at a 90% confidence level) has increased from -58kg at launch to a current value of +49 kg. Positivepropellant margins exist even at the end of GEM,with values of +19 kg following the first 10 flyby inlate 1999 and +9 kg after a subsequent 10 flyby(and end of GEM). This marked improvement inpropellant margin is primarily due to improvementsin optimization of the placement and magnitude ofTCMS and OTMS, excellent navigation, theselection of a very low Av cost orbital tour, and theuse of unbalanced turns versus more costlybalanced turns.
9American Institute of Aeronautics and Astronautics

6 0 0 1
/
/;’-/’ “
/,; ‘ “.4’ ‘
5orl!’rl T!rll310 330 350
//,
n, a r “sm.
o FM OTM Q “<age
— pr.,o.,d C.”,”. tpk”l
.3 q,,,. OK cm,
+3 ,Igrr!a f.,, .0”,
4 - ati 01 prqmml (35!9”,,
},, ,1, >1
370 390 410
fuel mass consumed [kg]
Figure 9: Usable Propellant Masses and Residuals
It is clear that in a bipropellant system likeGalileo, the usable propellant is a strong functionof the actual mixture ratio used by the propulsionsystem. Post-launch test data indicates the 10-Nmixture ratios as modeled by the RPM AnalysisTeam may have a 4% overprediction.”’ A morerecent analysis taking into account the actualusage of the thrusters adjusts this number to 27..
Also, pressure transducer drift uncertaintieselucidated in Chapter X also cloud thedetermination of the actual mixture ratio used. Infact, the latter effect applies to a!! missionpropellant, not just the 30?40 or so expelled throughthe 10-N thrusters.
Each maneuver has been carefullyreconstructed using the observed telemetry for thepropellant tank pressures and propellanttemperatures. Figure 9 shows the calculatedoxidizer and fuel consumption (as of 15-Mar-97)with their uncertainties shown by the error bars(“cross”) in the lower left corner. The cross on theupper right shows the propellant masses when thefuel is depleted (in a 30 case) assuming a mixtureratio of 1.555 for the remainder of the mission. Atotal of 27 kg of propellant have to be set aside tocove r the past and future consumptionuncertainties, the “remaining”, the propellantloading uncertainties, as well as the real propellantholdup in the propellant lines and tanks. A pre-launch estimate had 34 kg of propellant labeled as“unusable.” NOW 7 kg of that have been releasedas usable. This increase is also reflected in thepropellant margin numbers given above andillustrates how reserve for uncertainties can bereleased as more information is gathered.
Table 1 shows a summary of the propellantusage during the Galileo mission through March
Table 1: Propellant Usage Breakdown
o F t tlAs of March 15, 1997 [k;] [k;] [:;]RPM Maintenance 4.18 2.72 6.90Attitude Control 20.87 13.46 34.33HGA Anomaly Activity 30.51 19.96 50.46Science Turns 1.92 1.22 3.14Delta-V Maneuver
400N 377.60 228.70 606.3110N 90.83 59.69 150.53
Total consumed 525.92 325.75 851.67
Real Holdup 2.25 0.60 2.85Consumption Uncertainty (30 7.87 5.16 13.03Remaining at 30 Fu Depletior 10.98 0.00 10.98Still Usable 47.78 32.69 80.47
Total Loaded 594.80 364.20 959.00
15, 1997. Notice that the vast majority of usablepropellant was used during 400-N engine and 10-NAV thruster maneuvers. Two-thirds of the totalpropellant usage occurred during the three large400-N engine burns: ODM, JOI, and PJR. It isnoteworthy that more propellant was used to try todeploy the HGA than was used for nominal attitudecontrol throughout the entire mission (to date).Science turn usage is well within allocations; thesemaneuvers turn the spacecraft for scienceobservation purposes only. Incidentally, if thepropellant were used to depletion (not likely, giventhe propellant margin numbers mentioned above),the most likely outcome would be that the MMHsupply would deplete first, with approximately13.7 kg of NTO remaining unused in the Ox tanks.
The RPM Analysis Team is also the cognizantgroup for latch and thruster valve cycles. Latchvalves are actuated once for each separatepropulsive event, such as a maneuver segment(10-N or 400-N), SITURN, spin or HGA correct,etc. The limit on latch valve cycles is 4000 pereach of the 10-N A- and B-thruster branches, aswell as the 400-N engine branch. As of March 15,1997, there were 1115 cycles (Z’.g~o of lifetime)on the 10-N A-branch oxidizer and fuel latchvalves, 625 (15.6% of lifetime) on the 10-N B-branch latch valves, and 30 (0.8Y0 of lifetime) onthe 400-N latch valves. Latch valve cycles arecertainly not a mission-limiting consumable for theGalileo GEM mission.
Thruster valve cycles are somewhat marginal.Table 2 shows the executed number of thruster
10American Institute of Aeronautics and Astronautics

Table 2: RPM Engine Summary
As of Cycles On-Time ThroughputMarch 15, 1997 [rein] [kg]21A Thruster 2881 48.47 8.1722A Thruster 2891 48.64 8.1521 B Thruster 1929 33.01 5.64Z2B Thruster 1929 33.02 5,67PIA Thruster 12452 211.47 41,06P2A Thruster 10686 186,25 35,93LIB Thruster 17685 351.34 67.27L2B Thruster 17685 292.70 56.93SIA Thruster 2086 38.65 7,51S1 B Thruster 275 3.98 0.79S2A Thruster 1897 37.96 7.45S2B Thruster 275 4.04 0.80400N Engine 4 78.01 606.31
pulse cycles for each 10-N thruster as of March15, 1997. The thruster pulse limit was increasedafter launch from 23,000 pulses to 35,000 pulsesafter additional ground tests.’ Notice that, asGalileo approaches the end of the nominalmission, the most used thrusters (LIB and L2B)have just barely exceeded half of their allocatedthruster pulses. Initial studies of the GEM missionalso suggest that not even the L-thrusters and PIAthruster, the most used engines, will reach theconsumable limit of 35,000 cycles. PIA thrusterusage may be reduced by biasing the trajectory todecrease the likelihood of POSZ clean-upmaneuvers or through increased usage ofunbalanced turns (either implementation offerspropellant savings as well, due to the inefficientnature of the POSZ maneuver and the balancedturn). In summary, thruster valve cycles are alsonot thought to be a mission-limiting consumable forthe GEM mission.
!/lLTCM/OTM Summa
Between launch in October of 1989 and March15, 1997, a total of thirty-eight 10-N and four 400-Nmaneuvers (including the 2 s wake-up burn) wereexecuted on the spacecraft. Thirteen planned10-N TCMs/OTMs were canceled due to excellentspacecraft navigation. Of note, two of the Jupiterapproach TCMS (TCM-27 and TCM-28) and thefirst two orbit trim maneuvers following JOI (OTM-1and OTM-2) were canceled due to a lower-than-originally-planned 10 (gravity assist) flyby coupledwith a modification to the orbital tour. Specifically,the first orbit around Jupiter was shortened byapproximately one week (one Ganymede orbital
period) versus the original design, savingpropellant and yet essentially preserving theplanned orbital tour after the second Ganymedeflyby.
Despite occasional unexplained shifts in 10-Nthruster performance (see Chapter Vlll), all thirty-eight Galileo 10-N TCMS and OTMS executed wellwithin requirements. It should be stressed that10-N maneuvers employ a ground-determinedburn time that is uplinked to the spacecraft. This isin contrast to main engine maneuvers, which useaccelerometer data to close the 400-N pilot valveonce the proper AV is obtained. The 400-Nmaneuvers also executed well within requirementsfor ODM, JOI, and PJR (for main engine firings,the requirements pertain to accelerometeraccuracy).
For Galileo maneuvers, the best estimate formaneuver performance is obtained from theNavigation Team’s Orbit Determination (OD)solution following a maneuver. Table 3summarizes the delivered performance during alltwenty-five trajectory correction maneuvers, up toand including orbit insertion at Jupiter. TCM-25(ODM) and TCM-29 (JOI) used the 400-N engine;all other TCMS were performed on the 10-Nthrusters. The values of AV displayed in the fourththrough sixth columns represent the designedvalues for the necessary spacecraft velocityincrement in the axial and lateral directions,respectively. The next three columns wereobtained from OD solutions and represent theexecuted accuracy ([AvEXECUTE(, /AvDE~lGNE[, - 1 ]*1 OOYO)during the axial and lateral components,respectively, of each maneuver.
Notice from Table 3 that the deliveredexecution error has generally decreased with time,as expected given the learning curve associatedwith modeling the 10-N thrusters. Indeed, the fiveTCMS with the largest execution errors were thefirst five performed. A summary of the 10-N TCMstatistics is provided at the bottom of Table 3. The10-N TCM execution error is 10 = 1.09Y0. Noticealso from Table 3 that the 400-N maneuverexecution error decreased markedly for JOI versusODM. It was important to accurately calibrate theaccelerometers based on the results of ODM,because the (propellant) cost of fixing JOIunderburns or overburns was very significant.
11American Institute of Aeronautics and Astronautics

Table 3: TCM Summary Table
Starting Maneuver Design Dv Execution Error IDate - Description +Z -2 L +Z -z L Total I
(m/s) (m/s)TCM-1 11/9/89 remove launch bias & 1st Venus target 15.60 ‘%4 “ 0) %#%G%-1TCM-2 12/22/89TCM-4A 4/9/90TCM-4B 5/1 1/90TCM-5 7/1 7/90rcM-6 1 0/9/90ICM-7 11/13/90TCM-8 11 /28/90TCM-9A 1 2/1 9/90rCM-9B 3/20/91rcM-lo 7/2/91rcM-11 1 0/9/91rCM-12 10/24/91rcM-14 814/92rcM-15 10/9/92rCM-16 11/13/92[CM-17 11/28/92rcM-19 319193rcM-20 8/1 3193rcM-22 1 0/4193rCM-22A 2/1 5/94rcM-23 4/1 2/953DM 7/27/95[CM-26 8129195Jol 12/7195
2nd & final Venus target1st Earth-1 target part 11st Earth-1 target part 22nd Earth-1 target3rd Earth-1 targetfinal Earth-1 targetTCM-7 cleanuppost Earth-1 cleanupGaspra target part 1Gaspra target part 2Gaspra target cleanupGaspra target cleanup1st Earth-2 target2nd Earth-2 targetfinal Earth-2 targetpost Earth-2 cleanupfinal Ida targetIda target cleanupfinal probe entry targetprobe target cleanupprobe target cleanupOrbit Defl. (incl. Wake-up Burn 7/24)1st. (& final) ODM cleanupJupiter Orbit Insertion
0.16
0.72
0.481.09
0.02
0.20
0.090.050.410.40
0.022.120.07
0.090.05
61.850.86
644.40
0.72 2.4224.7511.280.590.190.670.05 1.235.292.27 0.463.650.34 0.400.32
20.960.610.890.02
0.6138.66
0.04 -0.180.06 -0.32
0.44
2.480.811.22
0.612.680.36
0.00-0.22-0.36
-1.21-0.780.14
2,17-2.30-2.17-0.19-1.591.26
-0.60-0.250.57
-0.910.03
-0.531.300.69
-0.34-0.01
0.53-0.15-0.04-0.01
-0.34
2,14-2.30-2.171.390.321.46
-0.40-0.250.53
-0.910.01
-0.551.300.64
-0.34-0.02-0.220.54
-0.15-0.25-0.17-1.21-0.650.14
Demonstrated 1O-N 1s Execution Error —— 1.0970 I
Table 4: OTM Summary Table
Starting Maneuver Design Av Execution ErrorDate Description +Z -z L +Z -z L Total
(m/s) (m/sPJR 3/1 4/96 Peri-Jove Raise maneuver 377.10) ‘ m ’ s ) “ ) ~OTM-4OTM-5OTM-6OTM-7OTM-8OTM-9OTM-11OTM-12OTM-14OTM-15OTM-16OTM-17OTM-19OTM-21
513/966/1 2/966/24/9661301968/5/96
8127/969/9/96
10/819611/1 0/9611/26/9612/1 5/9612/23/96
2/61972/23/97
1st G1 target cleanup2nd G1 target cleanupfinal G1 target cleanuppost-Gl cleanupG1 to G2 apoapsis maneuver1st & final G2 target cleanuppost-G2 cleanupG2 to C3 apoapsis maneuverpost C3 cleanupC3 to E4 apoapsis maneuverE4 target cleanuppost E4 cleanupE4 to E5 apoapsis maneuverpost E6 cleanup
0.45 1.17 0.28 0.070.18 0.50 0.14 0.250.06 0.48 1.00 -0.380.58 0.00 0.30
4.61 -0.450.00 0.08 0.87 -0.80
5.74 -0.690.59 0.11 -0.02 -0.21
2.33 -0.490.06 0.23 0.61 -0.97
0.02 0.11 0.97 -0.541.97 -1.05
0.21 0.83 0.94 0.210.91 -0.33
0.170.22
-0.390.30
-0.45-0.80-0.69-0.05-0.49-0.88-0.49-1.050.27
-0.33
OTM-22 3113197 E6 to G7 apoapsis maneuver 0.13 15.75 0.77 0.26 0.26
Demonstrated 1O-N lcr Execution Error —— 0.46 yO
12American Institute of Aeronautics and Astronautics

Table 4 is the analogous OTM performancetable to Table 3. The first orbit trim maneuver,OTM-3 (PJR), was the final use of the 400-Nengine. Again, accelerometer data dictated theshut-down of this maneuver, with very little residualexecution error. 10-N OTM performance (OTM-4through OTM-22) continues to be excellent, withan execution error 10 = 0.46Y0. For all 1O-Nmaneuvers to date, the execution error is 10 =0.897.. This demonstrated maneuver accuracy iswell within 30 requirements (LAT = 4.6Y0, POSZ =6.OYO, PULZ = 3.8%).
WI. 1O-N Thruster Performance
All maneuvers using the 10-N thrusters arefired in pulse-mode. The Galileo spacecraft (.S/C)is in dual-spin during all 10-N maneuvers exceptduring spin-up and spin-down and all-spin spincorrects. All pulse durations are less than 3 s long,if the thruster is fired once per S/C revolution(about 19s) and 1.5s if fired twice per WCrevolution. The maximum number of pulses fired ina pulse train, called a maneuver segment, islimited to 500 pulses (per thruster). All maneuverswere designed using the Propulsion SystemSimulation Program (PSSP). PSSP simulates thepressurization system and the propellant tanks aswell as the propellant feed system. It alsocalculates the thrust and mass f low of eachengine. PSSP was built empirically from groundtest data. It includes a model for each thruster, themain engine, the pressure regulator, the checkvalves, the propellant tanks, the pressurant tanksand all of the propellant feed lines.
Axial -Z Maneuvers
The so-called PULZ maneuver is executed byfiring two Z-thrusters in pulse-modesimultaneously. Depending on the maneuver, thepulses were between 0.57s and 0.93s in duration(the allowed range for PULZ firing is 0.01 s to0.96 s). During the mission, the number of pulsesin a PULZ maneuver segment varied between 4pulses and 166 pulses per thruster (the allowedrange is 1 to 500 pulses).
There are two redundant Z-thruster pairs, oneconnected to the A-branch and one to theB-branch. The B-branch thrusters are usednominally for the pulsed -Z maneuvers. It wasdiscovered very early in the mission that the Z(B)thrusters impart less spin error to the S/C than the
,.. ...,7 ‘\
/ ‘! ,Y.. *+-.’
\/r
..,’‘L -- . ...” .~
..—-—-.— . —. ——
PULZ maneuver segment
Figure 10: Combined Thrust of Both Z(B)Thrusters During PULZ Maneuvers
Z(A) thrusters, possibly due to differences inthruster misalignment and plume impingement.Since launch we have performed 20 PULZmaneuver segments. The relative thrusterperformance, i. e., the observed combined thrustof both Z(B) thrusters versus the thrustreconstructed by PSSP using the actual RPMtelemetry measurements, is shown in Figure 10.On the average, weighted with the maneuver size,the observed overperformance (versus a ground-test data-based model) is about +2.06Y0.
The maneuver excursion errors in pointing andspin are illustrated in Figure 11 and Figure 12,respectively. The specific pointing errors are non-directional and therefore counted always positive;they vary between 2.9 mrad and 14.7 mrad per100 S/C revolutions. This, of course, did turn theAV direction by about the same angle. The actualmaximum error was 7.4 mrad (at TCM-26) versusthe requirement to be less than 10 mrad. Most ofthe attitude disturbing torque is caused by plumeimpingement effects on the stator, which is held
,. ,,
4pant(.g error, normalized [mradll OOr]
pmttng error, to!dl [mad]
/~,
/ ~\
Imlili.p”l i
!if{{[ L-
PULZ maneuver segment
Figure 11: Pointing ExcursionsManeuvers
12
10
o
tt+l I1 +-.2
~~~~ -::..cwm
During PULZ
13American Institute of Aeronautics and Astronautics

q. spin error nam)al, zed [mrad/s/100r]
m spin error total [mradls]
~w+
P
PULZ nmeuver sement
Figure 12: Spin Rate Excursions During PULZManeuvers
inertially fixed. This causes the effective thrustgenerated by one thruster to be different at one“side” of the S/C versus the other “side.” Thisphenomenon was recognized at TCM-1, about 15days after launch. The remedy for this was to splitlarger PULZ maneuvers into an even number ofmaneuver segments of about equal size. By doingthat, the stator could be inertially moved from oneside to the other between segments, effectivelycanceling the attitude excursion generated byplume impingement onto the stator.
From Figure 11 one can deduce that thespecif ic pointing excursions grew from about5 mrad/100r to about 12 mrad/100r betweenTCM-20 and TCM-26. The main event during thatperiod was the release of the probe, which waspart of the despun section of the S/C.
The spin excursion is required to remain withinabout f5 mrad/s. This assures that the thrusterswill not be firing outside an allowed burn arcassuming the nominal on-time (a burn arc violationoccurs if the spin error is larger than 6.6 mrad/s).An error of this magnitude also equals thecapability of one spin correction maneuver. Thelargest error experienced during any PULZmaneuver was less than 0.6 mrad/s (see Figure12). The normalized spin excursion was also low,less than 1.5 mrad/s per 100 S/C revolutions.
Lateral Maneuvers (LAT)
The lateral maneuver uses both L-thrusters,firing them alternately one-half S/C revolutionapart. Hence, these firings occur in the sameinertial direction. Each pulse bit exerts, in additionto the translator impulse, a small y-torque. This
+ ___________T
Lateral Benlgo Mancu ter Sogn)ent
Figure 13: Transverse Pointing Excursions DuringLAT Maneuvers
causes the S/C to precess around the +x rotoraxis. The next pulse, from the other L-thruster,generates a reverse y-torque, turning the S/Cback. Lateral maneuvers are designed toeffectively zero out all these y-torque bits andminimize the remaining S/C pointing excursion.This is done by adjusting the individual firing timesof the two L-thrusters such that their y-torque bitsare of equal size. In order to do that, the thrustsand the moment arms of the two L-thrusters haveto be calculated in the maneuver design.
Figure 13 shows the resulting specific pointingexcursion observed during all lateral maneuversegments executed on Galileo. It turns out that thepointing excursions were signif icant for mostmaneuver segments, indicating that the actualthrusts or moment arms were different from thepredicted thrusts and modeled moment arms.However, the lateral maneuvers were alwaysbroken up into segments small enough to neverexceed the pointing requirement of +41 mrad. Thehighest total error of 32 mrad occurred in OTM-22,which also had the highest normalized error of14 mrad/100 r.
There could be also other effects causingthese attitude excursions; e. g., a rigid-body modelas assumed in the maneuver design does notsufficiently match the actual S/C behavior(propellant sloshing, boom flexing, etc.) or perhapsthere could be inaccurate modeling of the massproperties, including the center of masscoordinates (which in turn determine the thrustermoment arms). No conclusive explanation hasbeen found to why these y-torque bits are sounbalanced. Not only that, the imbalance seems tohave changed throughout the mission. This shift
14American Institute of Aeronautics and Astronautics

8 -—-––—--–—–- --—–- -- -–- ---T 16
Lateral (Benign) Mancuvar Sog”wnt
Figure 14: Individual L-Thruster Performance
has also defied explanation. In our reconstruction,we tested the postulate that the pointingexcursions were due to variations in the thrustoutput, Figure 14 shows how the thrust of the LIBand L2B thrusters have to vary if performanceshifts caused all of the observed pointingexcursions. The L1 B thruster particularly wouldhave to decrease in its thrust output betweenlaunch and the last segment of TCM-10, “recover”in TCM-11, TCM-12 and the first segment ofTCM-14, and finally drop again in thrust output toabout the same low level as in TCM-1 O. In order tominimize maneuver errors, the PSSP databasewas ad justed severa l t imes throughout themission. The overall maneuver-size weightedperformance of the L1 B thruster versus the(ground-test data-based) model is -0.38%, with astandard deviation of 2.2Y0. The L2B thrusterperformance is much tighter; the data 10 is only1.0% and the average overperformance is +1.1 O%.
The spin rate excursions during all lateralmaneuver segments were small, except duringTCM-22. For some reason, the pointing errorsduring that maneuver were negligible, but the spinerrors were significant. This was typically thecase—lateral thruster pointing and spin excursionsgenerally behaved reciprocally.
Figure 15 shows the normalized spinexcursions throughout all lateral maneuvers. Themost remarkable part of the figure is that both thepointing excursion as well as the spin errorchanged direction between TCM-11 and TCM-12(91 -282 and 91-297). This is so distinct that itsuggests that an unmodeled change in the S/Cmass properties may have caused a shift in theS/C’s center of mass.
Lateral (Eemgn) Maneuver Segment
Figure 15: Spin Excursion During LAT Maneuvers(Compared with Attitude Excursion)
The error of the center of mass between modeland flight necessary to cause the observed spinand pointing excursions is shown in Figure 16. Theerror in y-axis is solely determined by the observedspin error, and the error along the z-axis is drivenby the observed pointing error. Unfortunately, nomechanism could be identified resulting in an errorof the center of mass depicted in Figure 16. Inaddition to that, most changes in the real S/C massproperties would also show up in the wobble.However, no significant unexplained wobblechanges have been observed,
It should be noted that the large att i tudeexcursions and the related spin excursions aredefinitely systematic and not statistical. However,no definite cause could be identified, but severalcandidates are viable: (1) flexible S/C elementmodel errors (propellant sloshing, boom flexing,etc.) versus rigid body models; (2) inaccuratemodeling of the S/C center of mass location; or (3)actual shifts in thruster output.
0020
.. .
. .“ ..*. *“. “.
.. . .* .
.a.
-00 I 0 L . . . . . . ..h..”.- . . . .. Am+m . . . . . ..l . . . . . . . . ,.,, . . . . . . . . . . ...””.-.....,,,.0 Oao -0 MO -0040 .0020 0 OGil 00?0 0040 0 OGO 0080
c o n] d,splacernent along y-axis [.,]
I
Figure 16: Postulated Error in S/C Center of Mass
15American Institute of Aeronautics and Astronautics

20
15.. .
8g 10PE.
5:a’c.co,..
i .5
s.
“~ -10
:-15
-20
POSZ maneuver segment
Figure 17: Pointing Excursions During POSZManeuvers
Axial +Z Maneuvers
The POSZ maneuver uses only one thruster.The PIA thruster fires twice per S/C revolution,one-half S/C revolution apart. The on-times forboth pulses are the same, effectively canceling thelateral AV component and also the y-torque bits.Ideally, there should be no effect on the pointing ofthe WC during POSZ firings.
In fact, the normalized pointing excursion wasless than 3.2 mrad/100 r during all POSZmaneuvers except for OTM-9 and OTM-16, thetwo smallest POSZ maneuvers (accordingly, thesehad the largest uncertainty in determining theactual pointing excursion; see Figure 16). The nextworst specific pointing excursion of 3.2 mrad/100 roccurred at TCM-23. With a pointing requirementof 10 mrad, the segment size was limited to about300 S/C revolutions. The maneuver-size weightedaverage pointing excursion was 0.97 mrad/100 r.The actual total pointing errors were less than orequal to 1 mrad for all POSZ segments, well withinthe pointing requirement of 10 mrad for POSZmaneuvers.
The actual total spin excursions (Figure 18)were between O mrad/s and -4 mrad/s, which iswithin one spin correction capability of t5 mrad/s.The weighted average for the normalized spinerrors were 5.2 mrad/s per 100 r. There are noburn arc violations until the81 mrad/s; however, a spin rateAACS software trips wheneverchanges by more than 33 mrad/s.
error reachesmonitor in thethe spin rate
POS2 “,a”euver seg”,e”t
Figure 18: Spin Excursions During POSZManeuvers
The thrust model in the propulsion softwarewas modified to closer match the observed thrustperformance. The Av-weighted overperformance is4.!7%. compared to the original ground test data.The relative overperformance for each maneuversegment is shown in Figure 19. There has been noobservation of any thrust degradation.
P-Thruster Turns
The performance of the P-thruster couple or A-branch Z-thruster couple during balanced andunbalanced spacecraft turns, respectively, may bedetermined from RPM and AACS data. UnlikeTCMS and OTMS, spacecraft turn maneuvers donot fire a commanded number of thruster pulses.Rather, an AACS control algorithm ceases thrusterfiring when the correct spacecraft attitude hasbeen obtained. Therefore, a thrusteroverperformance (versus ground test levels) wouldshow up as a reduced number of thruster pulses,not as an overshoot of the targeted inertial attitude.
81
OLll!+++l+ t++llltt+ I
POSZ Maneuver Segment
Figure 19: Relative Thrust Performance of PIAThruster During POSZ Maneuvers
16American Institute of Aeronautics and Astronautics

The average thrust of the P-thruster or A-branch Z-thruster couple may be determined by examiningthe attitude change of the spacecraft during themaneuver, together with the relevant spacecraftproperties (e.g., spin rate and rotor moment ofinertia). This observed thrust for the thrustercouple may be compared with the modeled thrustlevel for the couple to determine the relativeperformance of the thruster pair. It should bementioned that the individual performance of eachP-thruster or A-branch Z-thruster is not discerniblefrom this process.
Over 200 P-thruster maneuvers were analyzedto determined the performance of the P-thrustercouple versus ground test levels. This analysisincludes all balanced turns and sun acquisitionsbetween launch and March 15, 1997. It w a sdetermined that the P-thruster coupleoverperformed by an average level of +4.97.versus pre-launch levels. This number has beenr e d u c e d f r o m a v a l u e o f +6.57. o b t a i n e dprev ious ly ; an er ror was found in the pr ioranalysis.’ Even with this reduction, it appears thatthe P-thrusters are overperforming more than anyof the other 10-N thrusters. Moreover, the averageperformance level has shifted very little (<0.2?’.)throughout the mission, in contrast with postulatedin-flight L-thruster performance shifts (>5Yo).
Figure 20 charts the P-thruster performanceduring the 201 turn maneuvers, viewed as afunction of the executed turn angle of precession.It may be noted from the figure that largedeviations from the (turn angle-weighted) averageoverperformance of +4.9Y0 occur only for smallturns. This is as expected, since the relativecontribution of the attitude uncertainty is moredominant for smaller turns.
o 20 40 60 80 100 120 140 160 i 80
TURN ANGLE [ deg ]
Figure 20: P-Thruster Performance vs. Turn Angle
The high overperformance of +4.97. for the P-thruster couple is excellently corroborated by theinferred overperformance of +4.67. for the PIAthruster during POSZ maneuvers, mentionedabove. No other thruster has averaged as high ofan overperformance during TCMs/OTMs. Givenan overperformance of +4.6Y0 for the P1 A thrusterand +4.9Y0 for the P-thruster couple, this requiresan overperformance of +5.2Y0 for the P2A thruster.This is not at all hard to imagine, and the resulting(slight) torque imbalance in such a case wouldgenerally not be visible to the Galileo NavigationTeam during balanced precession maneuvers.Uncertainties in the P-thruster plume impingementlosses and thruster misalignments further cloudattempts to determine the individual thrust levelsfor the PI A and P2A thrusters during precessionmaneuvers.
n-Branch Z-Thruster Turns
Between launch and March 15, 1997, a total oftwenty-six unbalanced turns were performed onthe Galileo spacecraft. Unbalanced turns offermany advantages versus their balancedcounterparts, including: smaller pointing and spinexcursions, two-thirds less propellant usage, moreequal division of 10-N thruster usage, betterthruster thermal characterization (since the Z2Atemperature transducer has ~ failed), less turn-time required, etc.’ All twenty-six unbalanced turnswere analyzed to determined their relativeperformance versus ground test levels.
Figure 21 displays the A-branch Z-thrustercouple overperformance, viewed as a function ofthe executed turn angle of precession. The (turnangle-weighted) average performance for allunbalanced turns is +3.30/., again representing an
01 1 I I
o 2 0 4 0 60
TURN ANGLE [de!i
Figure 21: Z-Thruster Performance
.1
1
80 100
vs. Turn Angle
17American Institute of Aeronautics and Astronautics

overperformance versus ground test levels.Compared with the balanced turns, unbalancedturns appear to be more repeatable (with respectto average overperformance).
The only other A-branch Z-thruster maneuversthat were analyzable in the Galileo mission werethe first two (PULZ maneuver) portions of TCM-1,just 15 days after launch in 1989. The averageoverperformance values determined for these twoTCM-1 segments were +0.1 ~0 and +1 .5Y0,somewhat lower than the +3.3Y0 average found forunbalanced turns. This is perhaps not surprising,since each Z-thruster fires twice per S/C revolutionin a PULZ maneuver, while each Z-thruster onlyfires once per revolution during unbalanced turns.Hence, the performance differences may be due todifferences in plume impingement between the twosides of the spacecraft at which the Z-thrusters arefired. Also, it should be noted that TCM-1 utilizedNTO and MMH that were not yet fully saturatedwith helium; it is known that the performance levelis lower for unsaturated versus saturatedpropellants.
S-Thruster Maneuvers
A complete analysis of S-thruster maneuvers(thruster flush, spin correction, spin-up, and spin-down maneuvers) between launch and March 15,1997, was undertaken. The S1 B and S2Bthrusters (backup S-thrusters) have only beenused in thruster flush maneuvers (which fire twopulses each), while the S1 A and S2A thrusters(primary S-thrusters) have been used duringthruster flushes, spin corrections (again, firing twopulses each), and most extensively in large spin-up/spin-down maneuvers.
A total of five spin-up and five spin-downmaneuvers were executed on the S2A and S1 Athrusters, respectively. These large spin-ratechange maneuvers were executed for spin-up/spin-down demonstration, probe release, ODM,JOI, and PJR (in chronological order). Typicallyfiring 300-400 pulses, these maneuvers offered thebest characterization of S-thruster performanceduring the Galileo mission. Future S-thrusterusage is expected to be minimal.
SIA Thruster
A total of 136 SIA thruster maneuversbetween launch and March 15, 1997 were
investigated; in fact, all maneuvers amenable toanalysis were included. Some spin correctionsand many thruster flushes were not analyzable—the spin corrections due to lack of spacecraft datawhile at a large off-Earth attitude, and the thrusterflushes due to a lack of time resolution for a new,less time-consuming thruster flush sequenceutilized since 1993. However, continuing frequentspin corrections and the five spin-down maneuvershave allowed a much more thorough S1 A thrusterperformance characterization than was possiblefour years ago.’
Figure 22 displays the SIA thrusterperformance versus ground test levels as afunction of the thruster on-time (per pulse). Nodistinction is made between short and long pulsetrains in this plot. A constrained exponential fit ofthe data of Figure 22 was made, since it is knownfrom ground test data that below an on-time ofapproximately 0.6 seconds, the performance startsto drop off (the “pulse-mode” effect). Comparisonsbetween ground test data anti the exponential fit ofFigure 22 show that the in-flight pulse-mode effectis consistent with expectations.
Notice also from the figure that the asymptoticvalue of the overperformance is very nearly +4Y0versus ground test models. In fact, the average ofall 101 data points with an on-time greater than 0.6seconds (an approximate point where theoperation may be considered “steady-state”) is+4.OYO. The large spread in the flight data is notsurprising, given the very limited spin rate changeimparted to the spacecraft during thruster flushesand spin corrections, ancl hence the largeassociated uncertainty in the change in Galileo’sspin rate during these maneuvers.
20 ,
0 0 1 0 2 0 3 0 4 0 5 0 6 0 7 0 8 0 9 1 1.1 1,2 13 14
THflUSTEFl ON TIME [ S ]
Figure 22: SIA Thruster Performance vs. On-Time
18American Institute of Aeronautics and Astronautics

The average overperformance during the fivespin-down maneuvers, arguably the “best”numbers for SIA thruster performance, are quite abit lower than average value of +4.OYO determinedabove. Specifically, the five spin down maneuversdisplayed the following overperformance values:demonstration, +2.2Yo; probe release, +2.8Yo;O D M , +0.9?4.; JOI, +2.8Yo; and PJR, +1.7Y0.Incidentally, the first four spin-down maneuversutilized a thruster duty cycle of 1.3 seconds on/3.9seconds off, while the PJR spin-down employed analternate duty cycle of 0.9 seconds on/O.9 secondsoff . This was necessary due to propellantunporting concerns near the end of PJR. Dutycycle dependency for these five maneuvers shouldbe of little consequence, since thruster on-timesabove 0.6 seconds are essentially steady-state.
The reason that the five large spin-downmaneuvers underperform versus other SIAthruster maneuvers (spin corrections and thrusterflushes, which require only two pulses each) isunknown. However, it is possible that it is relatedto a temporary, minor reduction of 10-N filmcooling, a phenomenon that was observed in thetime traces of the S1 A temperature transducerduring all five spin-down maneuvers. Figure 23shows all five S1 A thruster temperature transducertraces during spin-downs. A minor thermal risemay be seen during each of the five spin-downmaneuvers. This result was not unexpected, sinceground test data showed some very similarthermal characteristics of the same thruster whenfired at these most thermally stressful duty cycles(1.3 seconds on/3.9 seconds off or 0.9 secondson/O.9 seconds off). In fact, the five spin-downmaneuvers remain the only examples of anyreduction of 10-N thruster film cooling observed in
A-I
m DEMO (3J93)
. PR08E RELEASE
. ODM
- 5 0 5 1 0 1 5 2 0 2 5 3 0 35 40 45 50 55
Burn II.* [rmnl
Figure 23: SIA Thruster Temperature DuringSpin-Down Maneuvers
the Galileo mission. This is also not surprising,given the curtailed operating range employed bythe Galileo 10-N thrusters, as well as the quitebenign duty cycles used for all other types of 10-Nmaneuvers in flight.
Further evidence corroborating the aboveexplanation for the relative underperformance ofthe large versus small SIA thruster maneuversmay be found by studying the S2A thruster, usedfor spin corrections, thruster flushes, and largespin-up maneuvers. Specifically, no differences inS2A thruster performance were noted for largeversus small maneuvers, unlike the SIA thruster.Moreover, no loss of film cooling was noted for anyS2A thruster burn, also unlike the SIA thruster. Itis quite conceivable that the temporary reduction infilm cooling during the five large spin-downmaneuvers caused an additional 1-30/. decrease inthe SIA thrust versus smaller maneuvers. Thishad no operational impact—in fact, the spin-rate“overshoot” was actually reduced in these fivecases, since the spin-up and spin-down algorithmsare essentially open-loop.
S2A Thruster
A total of 108 S2A thruster maneuversbetween launch and March 15, 1997 wereinvestigated; in fact, all maneuvers amenable toanalysis were included. As before, some spincorrections, and all thruster flushes after 1993were not analyzable. Continuing frequent spincorrections and the five spin-up maneuvers alsohave allowed a much more thorough S2A thrusterperformance characterization than was possiblefour years ago.’
Figure 24 displays the S2A thrusterperformance versus ground test levels as afunction of the thruster on-time (per pulse). Nodistinction is made between short and long pulsetrains in this plot. Similar to the SIA thruster,comparisons between ground test data and theexponential fit of Figure 24 show that the in-flightpulse-mode effect is consistent with expectations.
Notice also from the figure that the asymptoticvalue of the 0VerPWfOrrni3nCe k +2.50/. versusground test models. The average of all 86 datapoints with an on-time greater than 0.6 seconds is+2.6°A; this is the appropriate number to use for anaverage performance value for the S2A thruster.As before, the large spread in the flight data is not
19American Institute of Aeronautics and Astronautics

o 01 02 03 04 05 06 07 08 09 1 1,1 1.2 1.3 1,4
THFOJSTEHON-TIME [s]
Figure 24: S2A Thruster Performance vs. On-Time
surprising, given the very small spin rate changeimparted to the spacecraft during thruster flushesand spin corrections.
S1 B and S2B Thrustefi
As mentioned previously, both B-branch S-thrusters have been used in thruster flushes only,kept healthy in the unlikely event that they wouldneed to replace a failed A-branch S-thruster. Allthruster flushes between launch and early 1993were analyzed to determine B-branch S-thrusterperformance. No performance assessment waspossible after early 1993, given a change to thestandard thruster flush sequence, mentionedabove.
A duty cycle dependence assessment isimpossible for the S1 B and S2B thrusters, sincethruster flushes only used a very limited on-timerange of approximately 0.9-1.3 seconds. Thisrange is essentially equivalent to steady-state, soall 58 S1 B and 60 S2B data points obtained wereused in determining steady-state averages.
I .s1s . S7EI 1“
0 9 095 1 1.05 1.1 1.15 1.2 1.?5 1 3 1.35
THRUSTER ON-TIME [ s 1
Figure 25: S1 BLS2B Thruster Performance vs.On-Time
Table 5: 10-N Thruster Performance Summary
IO-N ThrusterNumber of Performance vs. Ground Test
Data Samples (average * Ifs)
LIB 147 -0.38% * 0.17%L2B 147 +1.10% * 0.07%
zlB&z2B 22 +2 06% i 0.13%PIA (POSZ) 20 +4.57% * 0.13?0
PIA & P2A (TURN) 201 +4.89% i 0.11%21A & 22A (TURN) 26 +3.29% * 0.05%
S I A 101 +4.02% * 0.27%
S2A 86 +2.63% i 0,36%S I B 58 +2 82% * 0.42%
S2B 60 +2 54% + 0.267a
Figure 25 displays the S1 B and S2Boverperformance data as a function of thruster on-time” per pulse. Note from the figure that the S1 Band S2B thruster data sets are quitecomplementary, and that there is no detectableduty cycle dependence for either thruster over thison-time range (as expected). The average S1 Boverperformance is +2.8Y0, only slightly differentthan the S2B average overperformance of +2.5Y0.This is very much within the observed flight rangefor the other 10-N thrusters, demonstrating somegeneral consistency in 10-N overperformanceversus ground test levels.
IO-N Thruster Performance Summary
Table 5 represents the best estimate for the10-N thruster performance during all analyzed10-N thruster activities through March 15, 1997.Per formance est imates of the Gal i leo 10-Nthrusters are vital to characterize the engines,since maneuver firing durations are determined apriori (e.g., they are not governed byaccelerometer cut-off). The 1 CT errors stated in thetable represent the calculated standard deviationof the average value for the different maneuverreconstructions. Therefore, small values for C T
correspond to large sample sizes and/or small in-flight demonstrated variability.
Notably, Table 5 displays strong evidence for agenerally consistent overperformance of a fewpercent for all 1O-N thrusters versus ground testlevels. The reason for this general 10-N thrusteroverperformance is not known; however, it isconceivable that a systematic error in the 10-Nthrust stand in Lampoldshausen, Germany, couldexplain the trend. In fact, if the impulse bitsdetermined at Lampoldshausen being under-reported by 2.8Y0, this minimizes the statisticalspread in the flight data versus ground test levels
20American Institute of Aeronautics and Astronautics

(if it is assumed that all Galileo 10-N thrusters areperforming the same in flight as in ground test).
However, it was earlier shown that there mayhave been a statistically significant shifts in L-thruster performance during the Galileo mission.Therefore, the inclusion of the L-thrusters in theabove assessment is suspect. Excluding the L-thrusters, the statistical variation in the flight data isminimized assuming that the impulse bitsmeasured at Lampoldshausen are being under-reported by 3.50/.. Whether or not the L-thrustersare included, either interpretation is potentially asignificant finding which may have implications forfuture testing in the 10-N thruster test stand forother projects.
LX. 400-N Enuine Performance
Table 6 lists all the important parameters for all400-N burns, including 10 error bounds. It alsogives some information on how the differentparameters were derived. The specific impulsewas interpolated from measured ground test data.After the ODM in July, 1995, the 400-N model (inthe PSSP software) was updated to match theobserved performance. In particular, the thrustturned out to be about 1.8% lower than modeled inPSSP for ODM reconstruction. The ground testdata suggested that the original modeloverestimated the specific impulse (Isp) by about0.59’.. The remaining error was attributed to anoverprediction of the total mass flow by about1.3%. The reconstruction of the subsequent JOIManeuver as well as the PJR Maneuver confirmedthe same discrepancy between the actualperformance and the original model.
The Orbiter Deflection Maneuver wasexecuted on July 27, 1995. Three days prior, asmall two-second burn (see Chapter V) wasexecuted to verify the proper engine operationafter the engine was “stored” for six years inflight.Two seconds were enough to detect and identifyany conceivable failure modes without riskingmuch propellant (or the spacecraft) in case therewas a functional problem. The thrust output wasabout 10% lower than during the first 2 s of any ofthe subsequent 400-N usages. This phenomenonwas attributed to the fact that the propellant feedlines (a few meters in length) were wetted only aweek before the wake-up burn, and some heliumgas and propellant froth (generated during the line
Table 6: Summary of ODM, JOI and PJR
Parameter I O D M I JOI I PJR I derived fromPOX [bar] 16.80 I 16.30 16.80 Ifrom RPM telemetrv
+/-0.10 +/-0. 10 +/-0. 10PFU [bar] 16.95 17.14 16.33 from RPM telemetry
+/-0.10 +/-0.10 +/-0. 10TOX [“C] 16.5 1 3 0 14.4 from RPM telemetry
MR [1]
‘- ~ ~1 +til-Isp [s] 307.6 306.7
3 9 5 0 $% $!:*
+/-1 .8
F [N]
At rS) 306.13 29
I 307.4 Ibased on ground tests
l%%L-mmF-)40,40 1430.27 from AACS telemetry
1
m, [W I 201:+-El=-? 2 1967.2 1584.1 from ground records+/-3,0 +/-3.6
Av [m/s]
E
6t.11 645.23 376.29 from Navigation+/-0.2 +/-0.02
AmOX [kg] 25,2 234.9 117.3 from Am and MR+/-1.4 +/-1 .0
ArnFU [kg] 151 144.9 68.6 from Am and MR+/-1 .0 +/-0.6
Am [kg] 4 0 4 379.8 185.9 from mi, Av and Isp+/-2 1 +/-1 .5
filling process) were still present in the propellantlines.
The wake-up burn was fixed to be exactly 2 s.F o r g r e a t e r a c c u r a c y , t h e O D M b u r n w a saccelerometer controlled. The imparted Av was
1.2% low, since the accelerometers were not yetin-flight-calibrated for a 400-N maneuver.
The largest maneuver was JOI. The 400-Nmodel as well as the accelerometer calibrationwere updated based on the observations at ODM.JOI was cut off as planned by the accelerometers,leaving an eXeCUtiOn error in AV Of +0.1 s~o.
Reconstruction revealed that the 400-Nperformance was about 0.6% lower than predictedby the RPM model (which was updated afterODM). This was mainly due to the anomalousbehavior of the oxidizer side check valve in thepressure control system of the RPM. The amountof the pressure drop across the oxidizer checkvalve could not be predicted very well for JOIbecause of the short burn duration at ODM.
The final 400-N maneuver (PJR) was carriedout on March 14, 1996. It was about half the sizeof JOI. The execution error again was determined
21American Inslitute of Aeronautics and Astronautics

by the performance of the accelerometer. The Avfell short by about 0.27.. The thrust output,however, was 0.8% lower than expected due toanother anomaly. The fuel side check valve did notpass sufficient helium gas to keep the regulatedpressure at the expected level. This behavior wasa new development following JOI, where there wasno indication of a flow restriction in the fuel sidecheck valve.
X. Pressurization System
Shortly after launch in October, 1989, thepropellant tanks were pressurized by firing a set ofpyro valves, putting the prime pressure regulatoron line. Then the combined pressure regulator andcheck valve operation consisted of subsequentfilling and lock-up events, which were caused bypropellant expulsion and tank temperaturevariations. Sometimes the regulator or checkvalves did not lock up completely but continuedtrickling helium over months. This “fine regulationmode” should not be confused with leaking,because it occurred without raising the tankpressures (this was possible due to propellantconsumption or slowly decreasing tanktemperatures). No leak or degradation could bedetected until the pyro valve PC17 (see Figure 6)was fired to prepare for 400-N engine operation.This valve pressurized the engine valve and wasfed by the line between pressure regulator andcheck valves. The propellant tank pressures weresuch that a cracking of the fuel but not the oxidizercheck valve was expected. However, propellanttank filling occurred on both sides. Other evidencefrom the ODM burn suggested that the oxidizercheck valve might have lost its reseat pressure oreven became stuck open; however, unknownabsolute tank pressure values (due to pressuretransducer drift) clouded this determination.
The uncertainty in the state of the oxidizercheck valve levied a particular challenge on theflight team between ODM (July, 1995) and post-PJR (April, 1996); namely, to keep tank pressuresand temperatures nearly constant to avoid anychance of opening the fuel check valve and forcingoxidizer vapor (and any condensed NTO) into theMMH tubing and MMH tanks. The main heatsources for the tank structure are the power busregulator shunts. Therefore, temperature controltranslated into control of power consumption,which af fected the ent i re operat ion of thespacecraft.
Since the power requirements for the orbitaltour post-PJR and the effort to keep tanktemperatures constant were incompatible, thedecision was made to capture the tank pressurestate immediately after the F’JR burn by isolatingthe pressure regulator. From previous experience(ODM and JOI), a positive pressure differencebetween the MMH and NTO tanks was expected,which mitigates vapor transport between the tanks.However, a MMH check valve malfunction duringPJR (see later this chapter) reversed the tankpressure difference. Fortunately, an observableleak did not occur and one of the check valvesapparently held the pressure difference. But thedilemma between power and temperature controlstill existed. Careful assessment of the situationshowed that it would be safe to raise the tanktemperatures to the operational levels required inthe tour. Because the pressurant tubing wasflushed with helium by the previous burn, even ifpressure equalization of the NTO and MMH tankswould occur, it would not be catastrophic.Furthermore, the risk of a reaction between NTOand MMH would have increased with time due todiffusion and condensation of NTO vapor in thetubing. In April, 1996 the power margin and thusthe tank temperatures were raised to a level whichwould not be exceeded for the rest of the mission.Subsequently the lower (and variable) operationalpower margin for the orbital tour was established.Now there is good data post-PJR, followingregulator isolation, that suggest that the oxidizercheck valve must be closed. This means that thevapor transport threat never existed.
The pressure regulator performed perfectlythroughout the mission. As indicated by the heliumand propellant tank pressures, the reconstructedregulator characteristic (downstream pressureversus upstream pressure and helium flow rate)during 400-N burns reflected the pre-launchground measurements. Although the downstreampressure is not accessible via direct measurement,this information could be derived from thecombined NTO and MMH check-valve behavior.Except for some variations in the early missionafter pressurization, the cracking and lock-uppressure history demonstrated the expected shiftversus the upstream pressure.
A lock-up always had to be induced bythermally raising the tank pressures. If not forcedto lock up, the soft-seat regulator demonstrated itsremarkable ability to keep the output pressure at
22American Institute of Aeronautics and Astronautics

❑ .O
I
800 1 Osa
2.6
2 4x ODM burn + ODM fill.up . JOI burn A JOI fill-up
2.2 . PJR burn . PJR f[ll-up -1983 test
2[ x O D M .JOI . PJRI I
0.6
0.4
0.2
0
.
161,}
o 200 400
I
600 0 0.02 0.04 0.06 0.08 0.1 0.12 0.14 0.16 0.18 0.2
flow rate [g/s]
Figure 28: NTO Check Valve Characteristic
having a characteristic similar to a fixed orifice.Although the reseat pressure may have been zero(depending on the assumed ciownstream pressure,which is unknown due to pressure transducerdrift), the data showed an existing crackingpressure and evidence of a nominal checkingfunction. From Figure 28, which represents thepressure drop across the check valve versus thehelium flow rate on the oxidizer side, the checkvalve performed repeatably for all threemaneuvers. The hysteresis between the “open”characteristic, as the helium flow increases, andthe subsequent “close” characteristic post-burndemonstrates the difference between cracking andreseat pressure. The line in Figure 28 representsthe ground test of the NTO check valve in 1983;one “anchoring” data point is off-scale to the right.
The fuel check valve performance wasdifferent during each 400-N maneuver. Figure 29(and also the MMH tank pressure, Figure 27)illustrates this remarkable change in characteristic.At ODM it showed high cracking pressure, thenopened wider than required (“overshoot”) and
tme after burn start (PJH X72) [s]
Figure 26: NTO Tank Pressure During ODM, JOIand PJR
an almost constant level over months in a fineregulation mode. It opened and closed many timesduring such periods but it never really locked up.The ullage increase caused by thruster flushesand other small 1O-N maneuvers wascompensated with exceedingly low helium flowrates.
However, during 400-N burns, restrictedhelium flow through the check valves resulted inlarger than anticipated pressure drops in both theoxidizer and fuel tanks. By comparing the blow-down and regulated portions of the three 400-Nburns (see Figure 26 and Figure 27), only theMMH tank pressure during JOI indicated a nominalbehavior; i.e., a pure blow-down portion followedby a constant-pressure regulated portion. Theslight up-shift is an expected regulator response tothe decreasing helium tank pressure.
The oxidizer check valve showed a flowrestriction during all 400-N engine maneuvers,
18 ,
2 6
2 4
2 2
2-k.m 1.8
~ 1.6g 1.4
$ 1.221$~ 0.8
0.6
0 4
0.2
0
. ODM burn u ODM f!ll-up A JOI burn a JO I fill-up
. PJR bum . PJR f!ll.up ~ 1983 test
. “ closeo
I
8 0 01551 I 1 1
0 200 400 600
tme after burn start (PJFI x? 2) [s]
I1000
0 0.02 0.04 0.06 0.08 0.1 0.12 0.14 0.16 018 0.2
flow rate [g/s]
Figure 29: MMH Check Valve CharacteristicFigure 27: MMH Tank Pressure During ODM, JOI
and PJR
23American Institute of Aeronautics and Astronautics
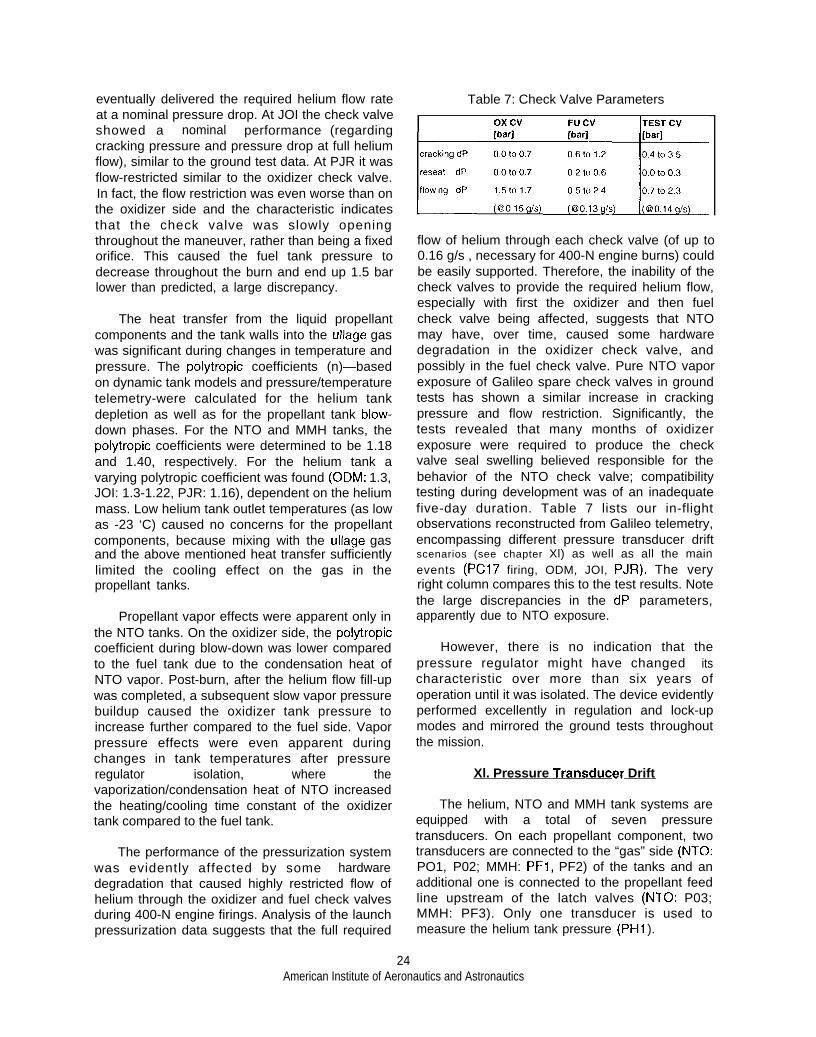
eventually delivered the required helium flow rateat a nominal pressure drop. At JOI the check valveshowed a nominal performance (regardingcracking pressure and pressure drop at full heliumflow), similar to the ground test data. At PJR it wasflow-restricted similar to the oxidizer check valve.In fact, the flow restriction was even worse than onthe oxidizer side and the characteristic indicatesthat the check valve was slowly openingthroughout the maneuver, rather than being a fixedorifice. This caused the fuel tank pressure todecrease throughout the burn and end up 1.5 barlower than predicted, a large discrepancy.
The heat transfer from the liquid propellantcomponents and the tank walls into the ullage gaswas significant during changes in temperature andpressure. The polytropic coefficients (n)—basedon dynamic tank models and pressure/temperaturetelemetry-were calculated for the helium tankdepletion as well as for the propellant tank blow-down phases. For the NTO and MMH tanks, thepolytropic coefficients were determined to be 1.18and 1.40, respectively. For the helium tank avarying polytropic coefficient was found (ODM: 1.3,JOI: 1.3-1.22, PJR: 1.16), dependent on the heliummass. Low helium tank outlet temperatures (as lowas -23 ‘C) caused no concerns for the propellantcomponents, because mixing with the ullage gasand the above mentioned heat transfer sufficientlylimited the cooling effect on the gas in thepropellant tanks.
Propellant vapor effects were apparent only inthe NTO tanks. On the oxidizer side, the polytropiccoefficient during blow-down was lower comparedto the fuel tank due to the condensation heat ofNTO vapor. Post-burn, after the helium flow fill-upwas completed, a subsequent slow vapor pressurebuildup caused the oxidizer tank pressure toincrease further compared to the fuel side. Vaporpressure effects were even apparent duringchanges in tank temperatures after pressureregulator isolation, where thevaporization/condensation heat of NTO increasedthe heating/cooling time constant of the oxidizertank compared to the fuel tank.
The performance of the pressurization systemwas evidently affected by some hardwaredegradation that caused highly restricted flow ofhelium through the oxidizer and fuel check valvesduring 400-N engine firings. Analysis of the launchpressurization data suggests that the full required
Table 7: Check Valve Parameters
E:zflow of helium through each check valve (of up to0.16 g/s , necessary for 400-N engine burns) couldbe easily supported. Therefore, the inability of thecheck valves to provide the required helium flow,especially with first the oxidizer and then fuelcheck valve being affected, suggests that NTOmay have, over time, caused some hardwaredegradation in the oxidizer check valve, andpossibly in the fuel check valve. Pure NTO vaporexposure of Galileo spare check valves in groundtests has shown a similar increase in crackingpressure and flow restriction. Significantly, thetests revealed that many months of oxidizerexposure were required to produce the checkvalve seal swelling believed responsible for thebehavior of the NTO check valve; compatibilitytesting during development was of an inadequatefive-day duration. Table 7 lists our in-flightobservations reconstructed from Galileo telemetry,encompassing different pressure transducer driftscenarios (see chapter Xl) as well as all the mainevents (PC17 firing, ODM, JOI, PJR). The veryright column compares this to the test results. Notethe large discrepancies in the dP parameters,apparently due to NTO exposure.
However, there is no indication that thepressure regulator might have changed itscharacteristic over more than six years ofoperation until it was isolated. The device evidentlyperformed excellently in regulation and lock-upmodes and mirrored the ground tests throughoutthe mission.
Xl. Pressure Trans~ucer Drift
The helium, NTO and MMH tank systems areequipped with a total of seven pressuretransducers. On each propellant component, twotransducers are connected to the “gas” side (NTO:PO1, P02; MMH: PF1, PF2) of the tanks and anadditional one is connected to the propellant feedline upstream of the latch valves (NTO: P03;MMH: PF3). Only one transducer is used tomeasure the helium tank pressure (PH1 ).
24American Institute of Aeronautics and Astronautics
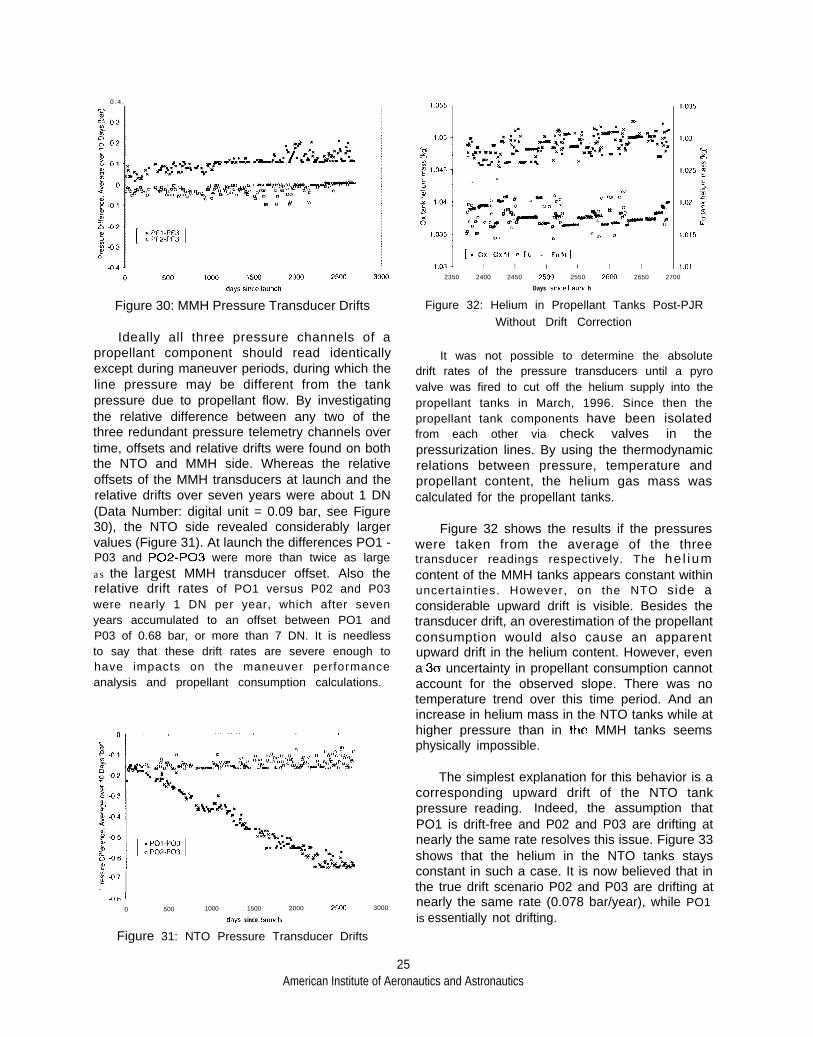
0 . 4 ,
Figure 30: MMH Pressure Transducer Drifts
Ideally all three pressure channels of apropellant component should read identicallyexcept during maneuver periods, during which theline pressure may be different from the tankpressure due to propellant flow. By investigatingthe relative difference between any two of thethree redundant pressure telemetry channels overtime, offsets and relative drifts were found on boththe NTO and MMH side. Whereas the relativeoffsets of the MMH transducers at launch and therelative drifts over seven years were about 1 DN(Data Number: digital unit = 0.09 bar, see Figure30), the NTO side revealed considerably largervalues (Figure 31). At launch the differences PO1 -P03 and P02-P03 were more than twice as largeas the largest MMH transducer offset. Also therelative drift rates of PO1 versus P02 and P03were nearly 1 DN per year, which after sevenyears accumulated to an offset between PO1 andP03 of 0.68 bar, or more than 7 DN. It is needlessto say that these drift rates are severe enough tohave impacts on the maneuver performanceanalysis and propellant consumption calculations.
.3.07
. I.~~ 1
0 500 1000 1500 2000 25CQ
days since launch
Figure 31: NTO Pressure Transducer Drifts
3000
. “
[XOX OxfI1 =Fu - Fufll
1 I II I I
2350 2400 2450 2mil 2550 ?Cioo 2650 2700
Days s,r,ce Laum h
Figure 32: Helium in Propellant Tanks Post-PJRWithout Drift Correction
It was not possible to determine the absolutedrift rates of the pressure transducers until a pyrovalve was fired to cut off the helium supply into thepropellant tanks in March, 1996. Since then thepropellant tank components have been isolatedfrom each other via check valves in thepressurization lines. By using the thermodynamicrelations between pressure, temperature andpropellant content, the helium gas mass wascalculated for the propellant tanks.
Figure 32 shows the results if the pressureswere taken from the average of the threetransducer readings respectively. The he l iumcontent of the MMH tanks appears constant withinuncertainties. However, on the NTO side aconsiderable upward drift is visible. Besides thetransducer drift, an overestimation of the propellantconsumption would also cause an apparentupward drift in the helium content. However, evena 3a uncertainty in propellant consumption cannotaccount for the observed slope. There was notemperature trend over this time period. And anincrease in helium mass in the NTO tanks while athigher pressure than in the MMH tanks seemsphysically impossible.
The simplest explanation for this behavior is acorresponding upward drift of the NTO tankpressure reading. Indeed, the assumption thatPO1 is drift-free and P02 and P03 are drifting atnearly the same rate resolves this issue. Figure 33shows that the helium in the NTO tanks staysconstant in such a case. It is now believed that inthe true drift scenario P02 and P03 are drifting atnearly the same rate (0.078 bar/year), while PO1is essentially not drifting.
25American Institute of Aeronautics and Astronautics

IJll}lll 110?2350 2404 2450 2503 2550 2m3 2650 27CQ
Days sfnce Launch
Figure 33: Helium in Propellant Tanks Post-PJRWith Drift Correction
A more advanced method was necessary toevaluate the helium pressure transducer drift ratedue to the larger quantization steps of1.08 bar/DN. Right at the toggle point, the pressureis known most accurately; i.e., the average of thetwo values. By calculating the helium mass only atthose toggle points, the much better resolution ofthe temperature sensors determines the dataspread. During intervals without helium flow, a driftin the calculated helium mass is directly related toa pressure transducer drift. Two time periods ofcomparable size were chosen to determine theapparent pressure transducer drift rates at twodifferent pressure levels. Before pressure regulatorisolation there was only one period large enoughwithout helium flow (see also chapter X11, Figure36) between October, 1993, and September, 1994(pre-ODM). The other period comprises the timeafter pressure regulator isolation March, 1996, untilApril, ”1997 (post PJR).
From Figure 34 and Figure 35 anslope in the Helium mass is apparent
. . . .. .
. .. . . . ..&– a - -. .
_A. .—---. I . . . .-.. . . .
. .
upwardin both
..*
1450 1500 1550 1600 1650 1700 1750
Days since Launch
Figure 34: Helium Tank Contents Pre-ODM
2350 24EF3 2450 25CQ 2550 2600 2650 2700 2750
Days since Launch
Figure 35: Helium Tank Contents Post-PJR
cases. The derived linear drift rates are0.40 *0.13 (lo) bar/year pre-ODM (Figure 34) and0.039 +0.001 (lo) bar/year post-PJR (Figure 35).The more recent data suggest that the heliumpressure transducer is very stable with respect todrifting at the current pressure of 44 bar. However,earlier in the mission the drift rate could have beenten times—with a high uncertainty-as large at apressure above 140 bar. There is not sufficientdata to decide whether this effect is time related ordependent on the absolute pressure level.
This investigation shows that the totalmeasurement error of two of the pressuretransducers (P02 and P03) exceeded therequirement of *2Y0 full scale after 6.2 years inorbit. It should be stated, though, that the specifiedin-orbit operating life (6 years) has been surpassedand the specified ground shelf life (5 years) wasalready exceeded at launch—the sensors wereshipped 1980.
X11. Helium Budaet
The RPM Analysis Team tracks the totalhelium mass on the spacecraft as a function oftime. This total should remain nearly constant,since only 48 g of helium out of approximately2700 g loaded is dissolved in the liquid propellantsand expelled along with them during maneuvers.Helium should just relocate from the pressuranttanks to the propellant tanks during periods ofpressure regulation. Therefore, since the amountof ullage helium in each tank is calculable fromspacecraft telemetry assuming a certain propellantmass in the tanks, the total may be added up toverify that it is invariant. This so-called “heliumbudget” offers an independent check of the healthof the propulsion system (particularly with regard
26American Institute of Aeronautics and Astronautics

.1,>
2 5 TFu Tank Solut,on O. Tank Solut,on
T2+ I
I He Tank
f
0 5 I.I
_ ,. --
“1, .. -.’
,. .-~ - ___ _––-—— —. r —,- .——
0 —----- + --- - -+----- + to 500 1000 1 50+1 Zocm
Days since Launch
[
Fu Tank Ullag/
~-----
1
0. Tank Ullag
4’,25cm
Figure 36: RPM Helium Budget
to possible helium or propellant leakages).
3ooil
Figure36 represents a typical plot of the helium budget.The two curves at the bottom represent the heliumin the propellant tanks; the top curve is the totalhelium.
Figure 37 is an enlarged view of the gaseoushelium mass in the propellant and helium tanks.Although the curve in Figure 37 should haveremained constant, it actually appears to increaseuntil about day 1750. This apparent increase maybe explained by a systematic error in the IO-Npropellant consumption model used by the RPMAnalysis Team of about 3%. This is very unlikelygiven the observed overperformance of the 10-Nthrusters. However, a helium pressure transducerdrift up to 0.4 bar/year might have occurred duringthe first five years, when the helium tank pressurewas above 140 bar. A non-linearity in the heliumpressure transducer calibration curve could alsocreate this signature since the helium pressuredecreased with propellant consumption. So far,there is evidence (see chapter Xl) for making apressure transducer drift in the high pressurerange the most likely explanation.
2 7 3
27251,
‘“l I 1
2 7 1 5
~ 271
{ 2 705Ep ~,
2 6 9 5
2 6 9
2 6 8 5
2681 “ +’lltti
o 5 0 0 1000 15cm 2000 25cm 3012Q
Days since Launch
Figure 37: Total Gaseous Helium Mass
The three main 400-N maneuvers occurred atdays 2110 (ODM), 2243 (JOI) and 2341 (PJR).The helium budget across ODM and JOI, whichtogether consumed 44?40 of the total propellantloaded, seems to be flat. Figure 37 shows that itdrops to a lower value at PJR, however. An error(near 30) in the propellant consumption at PJRcould have caused this shift. Again, more likely is anon-ideal behavior of the helium pressuretransducer during the drop from 63 bar to 44 baracross PJR.
The helium budget shows no evidence of anexternal or internal leak in the Galileopressurization system. This demonstrates theutility of the Galileo teflon soft seat check valveand regulator design
X111. Concluskm3
The Galileo Retro-Propulsion Module hasperformed excellently throughout over seven yearsof flight operations, and Galileo navigation hasbeen superb. The EOM propellant margin, definedat the ninetieth percent confidence level for tensatellite encounters in the Jovian system, hasimproved from -58 kg at launch to +49 kg. TheRPM met the great challenges of interplanetarytrajectory correction and attitude control during thesix-year circuitous trip to Jupiter. Additionally, the400-N engine successfully provided crit icaltrajectory corrections three times during themission, most notably at Jupiter Orbit Insertion,December 7, 1995 (PST).
Very few in-flight anomalies have occurred inthe RPM through March, 1997. A total of four ofthe twelve 10-N thruster temperature transducershas failed open circuit, all within the first threeyears of the mission. This has had no operationalimpact on the RPM Team, since clustertemperature measurements adequatelycharacterize 10-N thruster behavior. Someunexplained shifts in lateral thruster performancehave been observed. However, maneuver deliveryaccuracy has still been excellent overall. Inaddition, some pressure transducers continueddrifting linearly versus time, exacerbating attemptsto analyze RPM performance.
Most notably, the Galileo NTO and MMH soft-seat check valves exhibited very high flowing AP’sversus ground test levels. This effect, only
27American Institute of Aeronautics and Astronautics

discernible during the three 400-N engine firings,had major programmatic implications for theGalileo project, particularly with respect toconcerns of NTO vapor transport to the MMH linesand tanks. Specifically, flight power margins weremaintained within tight limits, “on-the-shelf” 400-Nmaneuver sequences were extensively modified,and additional ground testing of NTO-contaminated check valves was undertaken.
The pressure regulator demonstratedexemplary performance during more than six yearsof operation, before finally being pyro-isolatedfollowing PJR. A calculated helium mass budgetfor the RPM demonstrated that there were nodiscernible internal or external helium leaks.Additionally, the helium mass budget also alloweda cross-check of propellant consumption, as wellas characterization of the pressure transducer driftrates.
1O-N thruster performance has generally been1 % to 5% higher than the best estimate for theground-tested thrust levels. Many 10-N maneuvertypes were analyzed—all propulsive maneuvers(TCMs/OTMs) as well as spacecraft attitude turnsand spin rate change maneuvers, in addition tosome thruster flushing maneuvers.
400-N engine performance was excellent,particularly for JOI and PJR, due to very precisecalibration of the Galileo accelerometers followingODM. Actual 400-N burn times were within 2-3%of ground predictions, which is quite goodconsidering the deleterious effect of impededcheck valve helium flow.
RPM consumables have been well withinspecifications. The prospects for completion of theGalileo nominal mission (as well as the GalileoEuropa Mission) remain excellent. Operation ofthe Galileo RPM was a very challenging, highlyrewarding experience for all personnel involved.The Galileo RPM experience offers a noteworthymodel for success in international cooperation inspacecraft propulsion.
Acknowledgment%
The research described in this paper wascarried out by the Jet Propulsion Laboratory,California Institute of Technology and the GermanSpace Operations Center (GSOC), Division of theGerman Aerospace Research Establishment,
DLR, under contracts with the NationalAeronautics and Space Administration (NASA) andthe Federal Republ ic of Germany (FRG)Bundesminister fur Forschung und Technologies(BMFT), respectively. The authors wish toacknowledge the following individuals whocontributed to this research: N. Ausman, R. Barry,K. Bohnhoff, R. Cowley, K. Dar, B. Gounley, C.Guernsey, W, Hagenest, C. Jennings, R. Killinger,M. Landano, H. Long, K. Mantha, D. McPherson,T. Neilson, W. O’Neil, H. Schweig, W. Tyler, S.Tyler, J. Weiss.
References
‘ D’Amario, Louis A.; Bright, Larry E,; Byrnes, Dennis V.;Johannesen, Jennie R,; and Ludwinski, Jan M,: “Galileo 1989VEEGA Mission Description,” AAS Paper 89-431, August, 1989.
2 Diazl Al; and Casani, John R,: “Galileo on Track to Jupiter,”Astronautics & Aeronautics, February, 1983.
3 Jones, C. P.; and Landano, M. R.: “The Galileo SpacecraftSystem Design,” A1/vl Paper 83-0097, January, 1983,
4 Bohnhoff, K,, “Retro Propulsion Module (RPM) BipropellantUnified System for Galileo,” IAF Paper 82-326, September,1982,
‘ Immich, H,; Langel, G,; and Munding, G,: “Satellite UnifiedBipropellant Propulsion System Experiences andImprovements,” ANA Paper 89-2506, July, 1989.
‘ Barber, T.J.; Krug, F.A. and Froidevaux, B. M.: “initial GalileoPropulsion System In-Flight Characterization” AMA Paper 93-2117, June, 1993,
7 Cole, T. W.; Frisbee, R. H,; and Yavrouian, A. H.: “Analysis ofFlow Decay Potential on Galileo,” AIAA Paper 87-2016, June,1987.
* Gotzig, “Galileo Test Report for 1O-N Thruster S/N 16 PulsePerformance, Low Temperature Start-Up and Delta Life Tests,”DASA Document RPM-TR 1500-91-16, July, 1992
9 Kuhne, J. F.W., “Galileo - RPM Updated 10-N ThrusterPerformance Model (Based on S/N 16- May 1991 Tests)j”DASA Document RPM-PN 1500-92-01 A, October, 1992
2 8American Instifute of Aeronautics and Astronautics