
Final - AFSA
46
Financial Statement Analysis N.L Dalmia Institute of Management Studies and Research 1 Table of Contents ECONOMIC ANALYSIS ............................................................................................................................. 2 GDP Growth Rate and Inflation Trends: ............................................................................................ 2 Impact of Global Economic Trends: ................................................................................................... 4 SECTOR ANALYSIS................................................................................................................................... 8 Sector Growth: ................................................................................................................................... 9 Market share of major players in FMCG: ........................................................................................ 10 SWOT / Porters of the Sector........................................................................................................... 11 Contribution to GDP: ........................................................................................................................ 14 Regulatory Framework: ................................................................................................................... 15 Competitive Advantage Peculiar to FMCG: ..................................................................................... 16 Forecasted Sector Growth ............................................................................................................... 16 DABUR INDIA LTD: ................................................................................................................................ 20 Introduction:..................................................................................................................................... 20 Performance and Market Share of Dabur in various products: ..................................................... 21 Major Competitors ........................................................................................................................... 22 Profitability Trend ............................................................................................................................ 23 Sales Trend: ...................................................................................................................................... 23 Share Holding Pattern changes: ....................................................................................................... 24 Core Management Team: ................................................................................................................ 24 Financial Ratio Analysis: ....................................................................................................................... 25 Profitability Ratios:........................................................................................................................... 25 Turnover Ratios: ............................................................................................................................... 27 Valuation Ratios: .............................................................................................................................. 29 Leverage Ratios: ............................................................................................................................... 31 Liquidity Ratio: ................................................................................................................................. 32 Cash Flow Analysis: .............................................................................................................................. 33 Comparative Analysis: .......................................................................................................................... 37 Balance Sheet: .................................................................................................................................. 37 Profit and Loss: ................................................................................................................................. 39 Common Size Analysis.......................................................................................................................... 41 Balance Sheet: .................................................................................................................................. 41 Profit & Loss: .................................................................................................................................... 44 Free Cash Flow to the Firm .................................................................................................................. 46 Share Price Trend: ................................................................................................................................ 46
-
Upload
ankit-jhaveri -
Category
Documents
-
view
101 -
download
0
Transcript of Final - AFSA

Financial Statement Analysis
N.L Dalmia Institute of Management Studies and Research
1
Table of Contents ECONOMIC ANALYSIS ............................................................................................................................. 2
GDP Growth Rate and Inflation Trends: ............................................................................................ 2
Impact of Global Economic Trends: ................................................................................................... 4
SECTOR ANALYSIS ................................................................................................................................... 8
Sector Growth: ................................................................................................................................... 9
Market share of major players in FMCG: ........................................................................................ 10
SWOT / Porters of the Sector........................................................................................................... 11
Contribution to GDP: ........................................................................................................................ 14
Regulatory Framework: ................................................................................................................... 15
Competitive Advantage Peculiar to FMCG: ..................................................................................... 16
Forecasted Sector Growth ............................................................................................................... 16
DABUR INDIA LTD: ................................................................................................................................ 20
Introduction: ..................................................................................................................................... 20
Performance and Market Share of Dabur in various products: ..................................................... 21
Major Competitors ........................................................................................................................... 22
Profitability Trend ............................................................................................................................ 23
Sales Trend: ...................................................................................................................................... 23
Share Holding Pattern changes: ....................................................................................................... 24
Core Management Team: ................................................................................................................ 24
Financial Ratio Analysis: ....................................................................................................................... 25
Profitability Ratios:........................................................................................................................... 25
Turnover Ratios: ............................................................................................................................... 27
Valuation Ratios: .............................................................................................................................. 29
Leverage Ratios: ............................................................................................................................... 31
Liquidity Ratio: ................................................................................................................................. 32
Cash Flow Analysis: .............................................................................................................................. 33
Comparative Analysis: .......................................................................................................................... 37
Balance Sheet: .................................................................................................................................. 37
Profit and Loss: ................................................................................................................................. 39
Common Size Analysis .......................................................................................................................... 41
Balance Sheet: .................................................................................................................................. 41
Profit & Loss: .................................................................................................................................... 44
Free Cash Flow to the Firm .................................................................................................................. 46
Share Price Trend: ................................................................................................................................ 46

Financial Statement Analysis
N.L Dalmia Institute of Management Studies and Research
2
ECONOMIC ANALYSIS
GDP Growth Rate and Inflation Trends: Real GDP: Real Gross Domestic Product (real GDP) is a macroeconomic measure of the value of economic output adjusted for price changes (i.e., inflation or deflation). This adjustment transforms the money-value measure, nominal GDP, into an index for quantity of total output. According to an update of its World Economic Outlook by International Monetary Fund, India is set to become the world’s fastest growing major economy ahead of China, in the next couple of years. India is expected to grow at 7.6% in 2016 as per recent updates by the IMF.
Index of Industrial Production: The Index of Industrial Production (IIP) is an index for India which details out the growth of various sectors in an economy such as mining, electricity and manufacturing. The all India IIP is a composite indicator that measures the short-term changes in the volume of production of a basket of industrial products during a given period with respect to that in a chosen base period. It is compiled and published monthly by the Central Statistical Organisation (CSO) six weeks after the reference month ends. The IIP which had slipped into negative territory during the year is indicating a revival over the next few months touching a high of 5% in February 2015.

Financial Statement Analysis
N.L Dalmia Institute of Management Studies and Research
3
Inflation Trends: The recent decline in Oil prices have been favourable for India which imports almost 80% of its domestic oil needs. This has led to reduced imports, curtailed inflationary pressures and helped the government’s finances by reducing its subsidy bill. India’s inflation is measure by two trends, Consumer Price Index (CPI) and Wholesale Price Index (WPI). India’s consumer inflation (depicted in CPI) which had been stubbornly high in the double digits between 2010 and 2013, has come down to about 5% currently, in part due to RBI’s tight monetary policy and sharp decline in commodity prices. From November 2014 onwards the WPI has started to show deflationary trends. Cooling of inflation is generally a positive indicator for consumption and demand and has helped reduce pressure on margins across the industry.
While these indicators are positive for the industry, on the ground revival in business is still slow and taking more time than expected. FMCG Sector: According to the Nielson Global Survey of Consumer Confidence and Spending Intentions, India was at the top spot in consumer confidence among 60 countries at 129 in the fourth quarter of 2014, up from 126 in the third quarter and an average of 120 from 2009 until 2014. This was also near its all-time high of 131 in the fourth quarter of 2010.

Financial Statement Analysis
N.L Dalmia Institute of Management Studies and Research
4
Despite a marked buoyancy in consumer confidence as reported by Nielsen, it did not translate into increased consumption across sectors including the FMCG industry. The sector reported muted growth for most part of the year with some key segments even reporting de-growth, blamed largely on the sense of uncertainty prevailing among consumers during the past few years.
If fiscal 2013-14 was considered a tough year for Indian consumer sector, it only worsened in 2014-15. Though the emerging trends did indicate that the growth deceleration has bottomed out, it was still too early to detect any signs of recovery. According to the Nielson Company, FMCG sector growth rates slipped further to low single digits around the middle around the middle of fiscal 2014-15. With growth rates beginning to inch up marginally towards the end of the fiscal, the sector is expected to stage a recovery in the coming quarters.
Impact of Global Economic Trends:
1. Big Data Data explosion is underway as the ability to acquire, store and process data continues to improve exponentially. This includes social media related brand engagement scores generated through mentions, searches, likes, comments etc. all of which can be analysed to deliver meaningful insights.

Financial Statement Analysis
N.L Dalmia Institute of Management Studies and Research
5
The FMCG world already had weekly consumer sales, brand tracking, consumer panels, shopper data from friendly and well compensated retailers and another few hundred metrics depending on which data/analytics organisation you talk to. 95% of the data being generated and sold to eager marketers and analysts is useless. Some of it, due to its very high frequency of delivery is probably detrimental to the business, as it leads the organisation to believe in a short term truth that does not actually exist in the long term. This leads to poor strategic options being taken. The smarter organisations will buy only the relevant data (manage information costs), deduce the correct linkages to consumer behaviour and use it effectively to develop products, manage trade and communicate effectively to consumers.
2. Speed of social media Information now moves at a rapid speed. A tweet, FB post or a Youtube video can go viral in hours. No longer can an organisation sell a product that was unsaleable in a developed market due to health concerns in another less developed market as regulations had not caught up. Regulations will take time to catch up but consumer information is just a Google search away. The brands may not all be global but we have the global consumer who may live in Australia, but shops from the UK & China and is aware of the child labour issues at the tea gardens in Assam where her tea comes from. To get an idea of the volume and speed: when Germany defeated Argentina in the final there were 618,725 tweets per minute. PSY’s music video ‘Gentleman’ had 100 million views in 4 days. Information dissemination will be rapid and with no place to hide. Smarter brands will use this effectively to reach globally while limiting brand communication costs.
3. Health Concerns: This will continue to impact consumer food buying decisions. This is one of the biggest trends with a few key sub trends
a. Fresh & locally sourced and at premium prices Consumer desire for fresher products without any additives will drive development of fresh, locally sourced, ready to cook products. A number of these products will appear in the “chilled” part of the supermarket. This growth will be at the cost of highly processed products in a tin or pouch, stored at ambient temperatures with long shelf life ranging from 6 months to a few years, will decline. Organisations with experience in managing a chilled supply chain will get a head start.
b. Increase in boutique / artisan manufacturers To provide locally sourced products there will be an increase in the number of small artisan or gourmet producers who will showcase their products in a non-commercial package while demanding premium prices. Most small operators will fail, but a constant pipeline of local producers will emerge, motivated in some way by the growing number of food shows which makes many believe they are the next Jamie Oliver. This will continue for a while till the bigger organisations figure out a smart way to operate local operations again. This will be hard as they would have spent a good part of the last 20 years closing local factories for bigger more efficient units in cheap labour markets
c. Sugar Everything with high sugar in products disguised as ‘food’ will need to re-invent itself at some point in the future. Cereals with 20%+ sugar are definitely on the way out and this trend will continue to accelerate. Sugary beverages, confectionery, snacks and biscuits etc. will see reduced consumption and will have to re-invent themselves with smaller pack sizes (150ml can of fizzy), warn consumers of over consumption, and not be seen to be fighting

Financial Statement Analysis
N.L Dalmia Institute of Management Studies and Research
6
this trend among others. This will happen voluntarily or the local laws will take over. Consumer knowledge of high sugar products to avoid will improve dramatically over the next 10 years. Grocery shopping apps will not only tell you how much you have bought in dollars, but also the total nutritional value of your purchase: for e.g. what percent of your weekly purchase was sugar. Fat was the old villain, now it is sugars turn. Will obesity reduce? I hope so. Organic and Free Range will continue to grow and will gain substantial market share in some categories. Current flaky rules around what is organic or free range will be tightened as more players get attracted to this segment. Brands will enter this premium segment to overcome the low profits of the mass segments.
4. Online grocery shopping This is growing rapidly in most developed markets albeit off a small base. While most major brick and mortar retailers now offer online shopping and delivery, the birth of smaller online retailers with tight product lines and deeper prices will begin to emerge. Most modern developed market retailers carry anything from 10,000 to 25,000 Stock Keeping Units (product lines). Imagine an online retailer with only 500 SKUs or even lower. And when some of these tight range online retailers grow big, brands which grew on the strength of adding a new flavour or fragrance every quarter will struggle as category and range management for a 500 SKU business will be easier, but brutal for brand owners.
5. Environment & Sustainability Organisations that can demonstrate sustainability across their total ecosystem will benefit from stronger consumer bonding scores. However the ability to charge a premium to cover increased costs will remain limited as consumers will increasingly see sustainability as a given rather than a perk to be afforded by few. The Tesla of the FMCG world is still to be created. However, the larger manufacturers will try and create separate brands and business units to capture the green consumer, some of these will succeed provided they manage to distance their legacy brand from the new green offering.
6. Manufacturing Consolidation As mega factories open across Asia and Eastern Europe, cost of production will continue to come down due to massive economies of scale. Helped by the increase in number of free trade zones and agreements, it will make less sense to have factories all over the world – rather a mega unit optimised to be placed near source of raw materials and the bigger markets. Over the last 50 years the growth of global FMCG organisations has been driven by trying to sell a broadly similar product to all parts of the world. This has also resulted in organisations becoming more centralised in new product and brand development while keeping local operations to optimise the in-market execution.
7. Retailer polarisation The current trend of the price discounters and premium high end retailers both growing at the expense of the middle ground retailers will continue for a while till the middle ground figures out a way to fight back. Fight back they will with sharper and more relevant positioning (using themes of sustainability, ethical & local sourcing, etc.) while re-inventing their range architecture and pricing strategies. Those that don’t will perish rapidly as they get stuck in the middle with reducing share and supplier investment (trade spend)

Financial Statement Analysis
N.L Dalmia Institute of Management Studies and Research
7
8. Ageing How different would a supermarket product range look if everyone shopping there was 50+. Filled with fresh foods, fish (salmon), wholegrain and few premium sweet offerings along with a large aisle of health supplements. This demographic has more money and will place a higher value on food quality. The challenge will be for brands to appear relevant to this ageing demographic while being ‘cool’ enough to attract the younger consumers.

Financial Statement Analysis
N.L Dalmia Institute of Management Studies and Research
8
SECTOR ANALYSIS Fast-moving consumer goods (FMCG) or Consumer Packaged Goods (CPG) are products that are sold quickly and at relatively low cost. Examples include non-durable goods such as soft drinks, toiletries, over-the-counter drugs, processed foods and many other consumables. In contrast, durable goods or major appliances such as kitchen appliances are generally replaced over a period of several years. FMCG have a short shelf life, either as a result of high consumer demand or because the product deteriorates rapidly. Some FMCGs, such as meat, fruits and vegetables, dairy products, and baked goods, are highly perishable. Other goods, such as alcohol, toiletries, pre-packaged foods, soft drinks, chocolate, candies, and cleaning products, have high turnover rates. The sales are sometimes influenced by some holidays and season. Though the profit margin made on FMCG products is relatively small (more so for retailers than the producers/suppliers), they are generally sold in large quantities; thus, the cumulative profit on such products can be substantial. FMCG is probably the most classic case of low margin and high volume business. As explained above, FMCG consists of a lot of varieties of products. Some of them are given below:
Food & Beverages: Holding a share of 18% in the FMCG segment, the size of the Food and Beverage segment is estimated to be USD 8.5 billion. This segment includes products like staples / cereals, bakery products, snacks, chocolates, ice cream, tea/coffee/soft drinks, processed fruits and vegetables, dairy products, and branded flour.

Financial Statement Analysis
N.L Dalmia Institute of Management Studies and Research
9
Health Care: Health care holds a share of 32% (one of the largest share in the FMCG market) and the size is estimated at USD 15.2 billion. This segment includes products like OTC health products like digestive products etc, and Ethicals. Household and Personal Care: Standing as the largest stakeholder of the FMCG sector, household and personal care occupies close to 50% of the market share of the FMCG sector. Estimated at close to USD 23 billion this is the largest selling sector. It includes Oral care, hair care, care, skin care, cosmetics/deodorants, perfumes, feminine hygiene and paper products, Fabric wash, household cleaners.
Sector Growth: The FMCG sector has grown at an annual average of about 11 per cent over the last decade. The overall FMCG market is expected to increase at (CAGR) of 14.7 per cent to touch US$ 110.4 billion during 2012-2020, with the rural FMCG market anticipated to increase at a CAGR of 17.7 per cent to reach US$ 100 billion during 2012-2025.Food products is the leading segment, accounting for 43 per cent of the overall market. Personal care (22 per cent) and fabric care (12 per cent) come next in terms of market share. Growing awareness, easier access, and changing lifestyles have been the key growth drivers for the consumer market. A Crisil report on the growth of various sectors in India till Q3 of FY 15 is given below:
If we have a close look, we can see that FMCG sector stands at the 5th position in the growth among all the sectors in India with an average of 7% YoY (Year-on-Year).
Financial Statement Analysis
N.L Dalmia Institute of Management Studies and Research
10
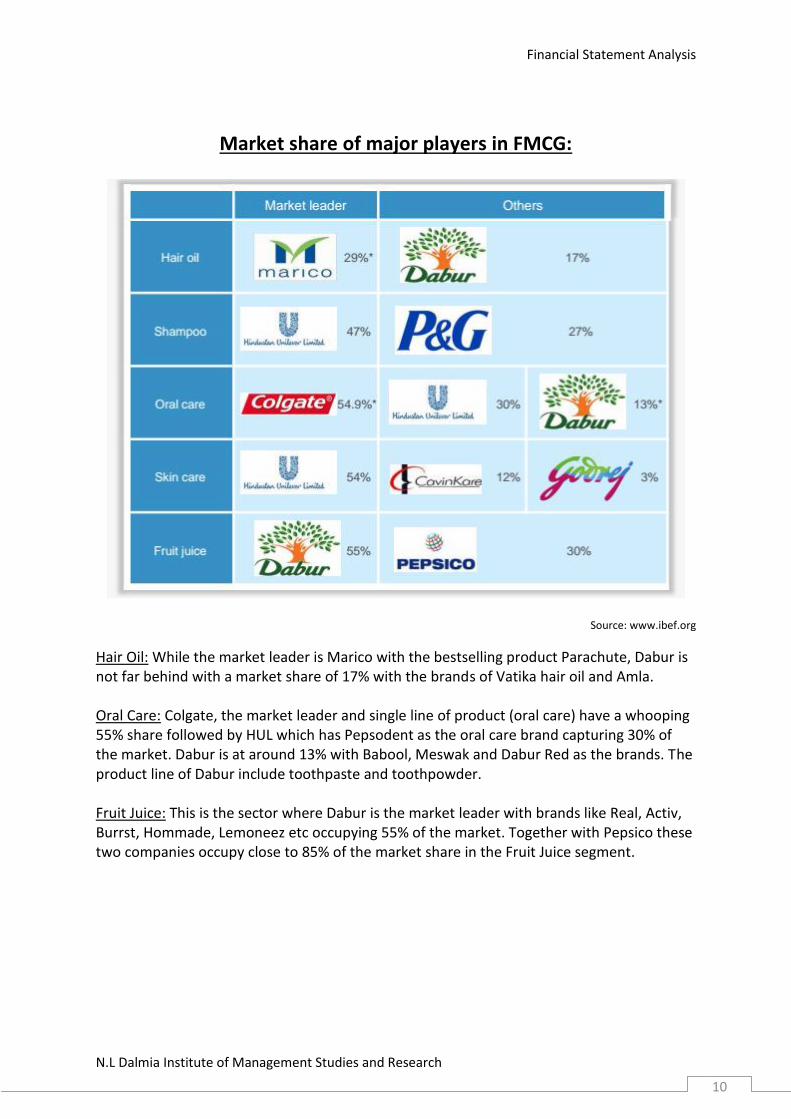
Market share of major players in FMCG:
Source: www.ibef.org
Hair Oil: While the market leader is Marico with the bestselling product Parachute, Dabur is not far behind with a market share of 17% with the brands of Vatika hair oil and Amla. Oral Care: Colgate, the market leader and single line of product (oral care) have a whooping 55% share followed by HUL which has Pepsodent as the oral care brand capturing 30% of the market. Dabur is at around 13% with Babool, Meswak and Dabur Red as the brands. The product line of Dabur include toothpaste and toothpowder. Fruit Juice: This is the sector where Dabur is the market leader with brands like Real, Activ, Burrst, Hommade, Lemoneez etc occupying 55% of the market. Together with Pepsico these two companies occupy close to 85% of the market share in the Fruit Juice segment.

Financial Statement Analysis
N.L Dalmia Institute of Management Studies and Research
11
SWOT / Porters of the Sector SWOT Analysis:
Strengths: Presence of established distribution networks in both urban and rural areas: FMCG is one of the strongest sectors in terms of distribution networks. One may not find a book to write on in the remote areas, but a soap to bathe with is easily available. Presence of well-known brands in the FMCG sector: Due to its popularity of the brands and the loyalty and trust the consumers have it is fairly easy to introduce a new product by the existing companies. Foreign Direct Investment: With an ease in the FDI policy of 100% in Single brand retail and 51% in Multi-brand retail, the government is only helping the sector to grow. Entry by foreign brands will aid in increase in the variety for the consumers. There are various such policies by the government which act as catalysts in the growth of the sector. Weakness: Lower Scope of Investing in technology for small players: Not all the companies in the sector are leaders and operate on a large scale. It is sometimes difficult for the small single product manufacturers to operate on a large scale and take the benefit of economies of scale. Also, due to limited capital infusion and low scale of operations, technological advancements are limited to these companies.

Financial Statement Analysis
N.L Dalmia Institute of Management Studies and Research
12
Counterfeit Products: FMCG sector is one of the highly targeted sector by companies bringing in counterfeit products. These counterfeit products penetrate in the rural sector where brand awareness is a little less hence earn the benefits of the actual brand. Opportunities: Untapped Rural Market: India comprises of 70% rural markets. Despite having a vast distribution network, rural and semi-urban markets account only for 35% of the revenues in the FMCG sector. There is a big opportunity here for the companies to grow. Rising Income Levels: Incomes have risen at a brisk pace in India and will India’s nominal per capita income (USD) continue rising given the country’s strong economic growth prospects. According to IMF, nominal per capita income is estimated to have recorded a CAGR of 5.43 per cent over 2010-19E. Threats: Removal of Import Restrictions: Having less import restrictions will only hamper the domestic companies. The domestic brands will be replaced by international brands in the Indian market. Slowdown in rural demand: Rural demand is cyclical in nature and depends upon the seasons. Since the rural population depends on agriculture for their income, a bad monsoon (or any bad crop favouring season for that matter) will hamper the demand of the FMCG. Rupee Depreciation: The recent volatility in commodity prices and weakness in Indian rupee makes it difficult for companies to finalize raw material prices, which affect the final price of the product.

Financial Statement Analysis
N.L Dalmia Institute of Management Studies and Research
13
Competitive Rivalry (High): Private label brands competing with Mainframe brands: Small private label brands in the sector have similar products but due to lower quality they are priced at a discount and hence compete with the mainframe brands. Competition from MNC’s: Multi-national corporations give a big competition to the domestic manufacturers. Due to the economies of scale which benefit the MNC’s at large, they are able to price their products at a discount. Threat of New Entrants (High): Huge Investments in Setup: There is a high setup cost involved in opening a manufacturing unit of an FMCG. Due to the high volume the companies are required to setup huge factories with a large production capacity hence the high costs of setup. Aggressive Spending on Advertisements: FMCG is such an industry where the advertisements are a major expenditure to increase the sales volumes. Hence, a very high cost is involved in spending on the advertisements (mainly print and television). Substitute Products (High): Presence of Multiple brands: Since there are many brands in the FMCG sector competing against each other on similar products the force of Substitute products is high.

Financial Statement Analysis
N.L Dalmia Institute of Management Studies and Research
14
Narrow Product Differentiation: Since many companies have similar products, there is narrow product differentiation among the competitors. Bargaining Power of Suppliers (Low): Big FMCG companies are able to dictate the prices through local sourcing from a fragmented group of key commodity suppliers. Bargaining Power of Customers (High): Low switching cost: The cost of switching for the customers of the FMCG sector is extremely low hence the bargaining power of the customers is high. Influence of marketing strategies: Since FMCG sector spends most of its selling expenses on advertisements, there is a direct influence of the marketing strategies on the customers. Availability of same or similar alternatives: When a customer knows he/she has a choice of another brand in the same product, it becomes easy to evaluate the rate the brands and then decide what to choose. This increases the bargaining power of the customers.
Contribution to GDP: The fast-moving consumer goods (FMCG) sector is an important contributor to India's GDP. India's FMCG sector is the fourth largest sector in the economy and creates employment for more than three million people. Its principal constituents are household care, personal care and food and beverages. The market is expected to maintain a high growth rate as the the population (particularly the middle class and rural segments) converts to branded products. In 2014, retail e-commerce sales in India generated over five billion U.S. dollars. That figure is expected to increase to over 17 billion U.S. dollars by 2018. With an approximate share of 2.2% in the current GDP of India, FMCG is the 4th largest sector in the Indian economy in terms of size.

Financial Statement Analysis
N.L Dalmia Institute of Management Studies and Research
15
Regulatory Framework: The upcoming Union Budget has depicted certain changes in the Regulatory Framework of the FMCG sector. The confirmation of the below changes will only be formalised when the budget is announced officially however, below are the excerpts: GST:
1. Implementation of GST from April 1, 2016. 2. The rate of GST on services is likely to be 14 per cent and on goods is proposed to be
20 per cent. 3. FMCG sector wants an early rollout of the Goods‐and‐Services tax (GST) so as to
reduce supply chain constraints, improve competitiveness of FMCG companies against unorganised players.
Excise Duty 1. Excise duty on instant tea, quick brewing black tea, and ice tea would be decreased
to reduce the retail price by 30 per cent. 2. Excise duty on other beverages and lemonade would be decreased to reduce retail
sale price by 35 percent Relaxation of License Rules:
1. Industrial license is not required for almost all food and agro-processing industries, barring certain items such as beer, potable alcohol and wines, cane sugar, and hydrogenated animal fats and oils as well as items reserved for exclusive manufacture in the small-scale sector.
Statutory Minimum Price:
1. In October 2009, the government amended the Sugarcane Control Order, 1966, and replaced the Statutory Minimum Price (SMP) of sugarcane with Fair and Remunerative Price (FRP) and the State-Advised Price (SAP)
FDI in Organized Retail: 1. The government approved 51 per cent FDI in multi-brand retail in 2006, which will
boost the nascent organised retail market in the country. 2. It also allowed 100 per cent FDI in the cash and carry segment and in single-brand
retail. Add FDI inflows: Rise over current years Food Security Bill:
1. FSB would reduce prices of food grains for Below Poverty Line (BPL) households, allowing them to spend resources on other goods and services, including FMCG products.
2. This is expected to trigger higher consumption spends, particularly in rural India, which is an important market for most FMCG companies.

Financial Statement Analysis
N.L Dalmia Institute of Management Studies and Research
16
Telecom Regulatory Authority of India (TRAI) advertising regulations: 1. FMCG companies, which are top advertisers on television (above 50 per cent share),
are likely to face the twin risks of reduced inventory to advertise, which could be cut by 25–30 per cent, and increased prices as broadcasters hike prices.
SETU Scheme:
1. Government has initiated Self Employment and Talent Utilisation (SETU) scheme to boost young entrepreneurs. Government has invested USD163.73 million for this scheme.
Source: SBI, Union Budget 2015 – 16, TechSci Research
Competitive Advantage Peculiar to FMCG: Distribution Network: Since FMCG is one sector where reach to the remotest corner of the country is of utmost importance, this is one competitive advantage the FMCG has over other sectors. Today we might not find a small mobile phone in the interiors of Maharashtra or India but a soap, shampoo or other toiletries are definitely available. Electricity may not reach in the interiors but a book and a pencil will definitely reach. This strength of the FMCG sector in its distribution network can be considered as a competitive advantage which FMCG has over any other sector.
Forecasted Sector Growth The size of FMCG in India in 2015 was close to USD 47.3 billion and expected to grow at a CAGR of 20.6% and is expected to reach USD 103.7 billion till 2020.
Rural – set to rise Rural areas expected to be the major driver for FMCG, as growth continues to be high in these regions. Rural areas saw a 14 per cent, as against 12 per cent rise in urban areas and is expected to grow at a CAGR of 18.1% by 2025. Most companies rushed to capitalize on this, as they quickly went about increasing direct distribution and providing better infrastructure. Companies are also working towards creating specific products specially targeted for the rural market.

Financial Statement Analysis
N.L Dalmia Institute of Management Studies and Research
17
The Government of India has also been supporting the rural population with higher minimum support prices (MSPs), loan waivers, and disbursements through the National Rural Employment Guarantee Act (NREGA) program. These measures have helped in reducing poverty in rural India and given a boost to rural purchasing power. Hence rural demand is set to rise with rising incomes and greater awareness of brands. Total rural income, which is currently at around USD572 billion, is projected to reach USD1.8 trillion by FY21.
Urban trends: The urban segment is the largest contributor to the sector, Urban/rural industry break-up (2015) accounting for around 65 per cent of total revenue and had a market size of around USD20.74 billion in 2015 Urban market accounts for around 65% of the total revenue of the FMCG sector.

Financial Statement Analysis
N.L Dalmia Institute of Management Studies and Research
18
With rise in disposable incomes, mid- and high-income consumers in urban areas have shifted their purchasing trend from essential to premium products. In response, firms have started enhancing their premium products portfolio. Indian and multinational FMCG players are leveraging India as a strategic sourcing hub for cost-competitive product development and manufacturing to cater to international markets. What the millenniums expect According to a study by TMW and Marketing Sciences that surveyed 2,000 people across different age groups ranging, young consumers are the most ‘rational’ and likely to spend more time weighing up potential purchases. The survey also suggests that younger people are using recommendations from their peers about products and services in order to make rational purchase decisions. According to the study, shoppers aged 18 to 24 are 174 per cent more likely to use recommendations on social media than shoppers aged 25 and over. Another key factor today is – speed. Today's consumer wants packaged goods that work better, faster, and smarter. The “need for speed" trend highlights the importance of speed as a potentially decisive purchase factor for packaged goods products in a world where distinctions between products are shrinking. Younger consumers express the greatest need for speed, not a huge surprise for the smartphone generation. Datamonitor's 2013 Consumer Survey found that younger consumers those in the 15-24 year old age group were twice as likely to say that "results are achieved quickly" has a "very high amount of influence" on their health and beauty product choices than consumers in the oldest age group, those aged 65 or older. Speed matters, and 2014 will almost certainly see the introduction of new game-changing timesavers.

Financial Statement Analysis
N.L Dalmia Institute of Management Studies and Research
19
Road Ahead FMCG brands would need to focus on R&D and innovation as a means of growth. Companies that continue to do well would be the ones that have a culture that promotes using customer insights to create either the next generation of products or in some cases, new product categories. One area that we see global and local FMCG brands investing more in is health and wellness. Health and wellness is a mega trend shaping consumer preferences and shopping habits and FMCG brands are listening. Leading global and Indian food and beverage brands have embraced this trend and are focused on creating new emerging brands in health and wellness.
Source: www.shine.com

Financial Statement Analysis
N.L Dalmia Institute of Management Studies and Research
20
DABUR INDIA LTD:
Introduction: Dabur India Ltd is one of the leading FMCG Companies in India. The company is also a world leader in Ayurveda with a portfolio of over 250 Herbal/Ayurvedic products. They operate in key consumer products categories like Hair Care, Oral Care, Health Care, Skin Care, Home Care and Foods. The company's FMCG portfolio includes five flagship brands with distinct brand identities, Dabur as the master brand for natural healthcare products, Vatika for premium personal care, Hajmola for digestives, Real for fruit juices and beverages and Fem for fairness bleaches and skin care products. The company operates through three business units, namely consumer care division (CCD), international business division (IBD) and consumer health division (CHD). Their CCD business is divided into four key portfolios: healthcare, personal care, home care and foods. Their CHD business offers a range of healthcare products. Their IBD business includes brands, such as Dabur Amla and Vatika. The company has a wide distribution network, covering over 2.8 million retail outlets with a high penetration in both urban and rural markets. Their products also have a huge presence in the overseas markets and are available in over 60 countries across the globe. Their brands are highly popular in the Middle East, SAARC countries, Africa, US, Europe and Russia. Product Profile: The Product Profile of Dabur includes variety of product lines in the FMCG segment:
I. Health Care a. Supplements: Glucose D and Dabur Honey b. Digestives : Dabur Pudin Hara and Dabur Hajmola c. OTC Healthcare : Dabur Lal Tail, Dabur Honitus, Dabur Gripe Water
II. Personal Care
a. Hair Care : Dabur Vatika, Dabur Amla b. Oral Care : Dabur Red, Dabur Babool c. Skin Care : Fem, Dabur Gulabari, Dabur UVeda
III. Foods
Dabur Real, Dabur Activ, Burrst, Hommade, Lemoneez, Capsico
IV. Home Care Sani Fresh Shine, Odonil, Odomos, Odopic
V. Consumer Health Ethical For over 125 years, Dabur has mastered the art of producing Ayurvedic preparations, blending traditional knowledge of drug manufacturing with scientific update. Today, Dabur's Consumer Health Division -- which looks after marketing of Ayurvedic

Financial Statement Analysis
N.L Dalmia Institute of Management Studies and Research
21
medicines and Ayurvedic Over-The-Counter products -- has redefined the Ayurvedic market and healthcare promotion activities involving leading Ayurvedic practitioners across the globe. At Dabur, we have more than 350 Shastriya (Classical) Ayurvedic preparations, which form an important part of every Ayurvedic practitioner’s daily practice.
VI. Professional Grooming Products: This is a range of differentiated offering for the women and contains grooming products. a. OxyLife Facial b. Fem Queen’s Pearl Facial c. Fem Gold Facial d. Fem Body Bleach
VII. Guar Gum
Dabur India is one of the foremost companies who started manufacturing guar gum and other natural gums products in India. The manufacturing facility was christened as Natural Gums Division. With over 30 years rich experience, Dabur India is supplying its natural gums products under brand name DABISCO.
Performance and Market Share of Dabur in various products:
Share Sector Brand
75% Branded Honey Market Dabur Honey
65% Ayurvedic Medicine Chyawanprash
60% Digestive Tablets Hajmola
90% Herbal Digestive Tablets Pudin Hara
55% Fruit Juices Real

Financial Statement Analysis
N.L Dalmia Institute of Management Studies and Research
22
Major Competitors

Financial Statement Analysis
N.L Dalmia Institute of Management Studies and Research
23
Profitability Trend
The operating profit as well as the net profit are showing an upward trend over the past 10 years except for 2011-12 where it has shown a decline. This decline is due to the higher change in the total expenditure as compared to the change in sales.
Sales Trend:
The sales have been on a rise over the past 10 years which is a positive sign for the
company. The company has grown at a CAGR of 16.8% which is well above the industry
CAGR of 11%.

Financial Statement Analysis
N.L Dalmia Institute of Management Studies and Research
24
Share Holding Pattern changes:
There are no major changes in the shareholding pattern. Only minor changes in the FII and NRI holdings but they are not very significant.
Core Management Team: Mr. P D Narang Group Director
Mr. Sunil Duggal CEO
Mr. Mohit Malhotra CEO- IBD, Dabur International Ltd.
Mr. George Angelo ED-Sales
Mr. Sudhir Achar VP- R & D
Mr. K K Chutani ED-Marketing
Mr. Sharukh Khan Head- Operations
Mr. Ashok Kumar Jain VP(Finance) & Company Secretary
Mr. Lalit Malik CFO
Mr. Arun Gupta VP-Corporate Affairs
Mr. Vikram Bali Director- Business Planning & Reporting, Dabur International Ltd.
Mr. V Krishnan Executive Director-HR
Mr. Adarsh Sharma Busines Head
Mr. Jude Linhares VP-Manufacturing
Mr. Vivek Dhir Chief Marketing Officer, Dabur International Ltd.
Mr. Saibal Sengupta VP- Corporate Accounts

Financial Statement Analysis
N.L Dalmia Institute of Management Studies and Research
25
Financial Ratio Analysis:
Profitability Ratios:
a. EBITDA Margin: The EBITDA margin ratio shows that every rupee a company generates in revenues results in what percentage of profits before all taxes and interest is paid. This percentage can be used to compare the company’s efficiency and profitability to other companies regardless of size.
The increase in the EBITDA margins of Emami is more than Dabur due to the difference in certain manufacturing expenses which are explained above.
b. PAT Margin: The PAT margin is a profitability ratio that measures the amount of net income earned with each rupee of sales generated by comparing the net income and net sales of a company. In other words, the PAT margin ratio shows what percentage of sales are left over after all expenses are paid by the business.
Dabur: In the past 3 years the EBITDA margin has remain almost stagnant and they have never crossed the industry average. Though the sales have been increasing their total expenditure has also increased. This is due to the higher cost of allocation in packing materials. Dabur has changed the packing materials for many brands like Fem during the course of the year. Emami: In the past 3 years the EBITDA margin has been increasing and they are always above the industry average. Their packing material cost has lowered due to fall in oil prices however, they have a larger amount of cost allocation in Sales and Distribution (Advertising being a large part of their expenditure) and there is scope of reducing the cost here.
Dabur: The PAT has increased marginally but has always been just below the industry average. The reason has been explained above in the EBITDA margin. The decrease in the Interest cost has been more or less compensated by the increase in the Depreciation amount and hence there is not much change in the PAT margin due to factors coming after EBITDA. Emami: The PAT has been on a rise and has also surpassed the industry average. This effect has come from the EBITDA due to reasons explained above.

Financial Statement Analysis
N.L Dalmia Institute of Management Studies and Research
26
The above difference in PAT Margins is due to the difference in the EBITDA margins which is a result of the huge difference in the packing material cost.
c. Return on Capital Employed (ROCE): Return on capital employed or ROCE is a
profitability ratio that measures how efficiently a company can generate profits from its capital employed by comparing net operating profit to capital employed. In other words, return on capital employed shows investors how many dollars in profits each dollar of capital employed generates. This ratio does not take into consideration the Tax payments and the finance costs.
d. Return on Equity / Return on Net Worth: The return on equity ratio or ROE is a
profitability ratio that measures the ability of a firm to generate profits from its shareholders investments in the company. In other words, the return on equity ratio shows how much profit each rupee of common stockholders' equity generates. When there are no Preference Shares in the company, the Return on Net Worth is equal to the Return on Equity.
Dabur: ROCE is well above the industry average and has remained somewhat in the range of 43% - 46%. Emami: ROCE is above the industry average and has consistently increased over the past 3 years. Emami has been increasing its profitability continuously at an increasing rate whereas Dabur is increasing its profitability at a consistent rate. This change in profitability coupled with no change in the capital employed has given increasing returns to Emami as compared to Dabur.
DuPont Analysis Dabur: The Return to the Equity shareholders have reduced over the past 3 years. This can be attributed to the Equity Multiplier in 2014 and to Asset Turnover ratio in 2015. Emami: The Return to the Equity shareholders have
increased. A close look via the DuPont Analysis we
can attribute this increase to the PAT Margin since
that has increased significantly.

Financial Statement Analysis
N.L Dalmia Institute of Management Studies and Research
27
e. Return on Assets: The return on assets ratio, often called the return on total assets, is a profitability ratio that measures the net income produced by total assets during a period by comparing net income to the average total assets. In other words, the return on assets ratio or ROA measures how efficiently a company can manage its assets to produce profits during a period.
Turnover Ratios:
a. Fixed Asset Turnover: The fixed asset turnover ratio is an efficiency ratio that measures a company’s return on their investment in property, plant, and equipment by comparing net sales with fixed assets. In other words, it calculates how efficiently a company is a producing sales with its machines and equipment.
Dabur: The Return on Assets have reduced over the past 3 years. This can be attributed to acquiring of new assets but not using them efficiently. This is not a good sign for the company. Emami: If we see in 2014, the Return has increased due to increase in sales and almost no change in total assets. In 2015, the company has increased its assets (fixed and current both) however, the proportion of increase of assets is more than that of sales and thus has reduced the return on Assets in 2015.
Dabur: The efficiency of Dabur in terms of using its Fixed Assets is well above the industry standards and has increased over the past 3 years. Emami: The efficiency of Emami in terms of using its Fixed Assets is below the industry standards but has increased over the past 3 years. Dabur is utilizing its Fixed Assets well however, Emami are not able to utilize their Fixed assets efficiently.

Financial Statement Analysis
N.L Dalmia Institute of Management Studies and Research
28
b. Inventory Turnover Ratio: The inventory turnover ratio is an efficiency ratio that shows how effectively inventory is managed by comparing cost of goods sold with average inventory for a period. This measures how many times average inventory is "turned" or sold during a period. In other words, it measures how many times a company sold its total average inventory rupee amount during the year.
c. Debtors Turnover Ratio: Accounts receivable turnover is an efficiency ratio or activity
ratio that measures how many times a business can turn its accounts receivable into cash during a period. In other words, the accounts receivable turnover ratio measures how many times a business can collect its average accounts receivable during the year.
d. Creditors Turnover Ratio: The accounts payable turnover ratio is a liquidity ratio that shows a company's ability to pay off its accounts payable by comparing net credit purchases to the average accounts payable during a period. In other words, the accounts payable turnover ratio is how many times a company can pay off its average accounts payable balance during the course of a year.
Dabur: They are efficient enough to convert their inventory into sales as their Inventory Turnover ratio is well above the industry standards. Emami: They are highly efficient to convert their inventory into sales as their Inventory Turnover ratio is well above the industry standards. Emami is better at converting their inventory into sales than Dabur. This is a sign of good inventory management.
Dabur: This ratio has been decreasing over the past 3 years and is also below the industry average. This may be due to the long credit period to the debtors. Emami: The ratio has been increasing over the past 3 years and is also well above the industry standards. Their debtors have reduced and a better Turnover may be because of the short credit period. Emami has been able to convert its debtors into cash much faster than Dabur and hence more efficient in terms of the credit policies. We do not know the credit policies at the moment however, looking at the ratio we may safely assume a shorter credit period than Dabur.

Financial Statement Analysis
N.L Dalmia Institute of Management Studies and Research
29
Valuation Ratios: a. Price/Earnings Ratio: The price earnings ratio, often called the P/E ratio or price to
earnings ratio, is a market prospect ratio that calculates the market value of a stock relative to its earnings by comparing the market price per share by the earnings per share. In other words, the price earnings ratio shows what the market is willing to pay for a stock based on its current earnings.
b. Price / Book Value Ratio: The price to book ratio, also called the P/B or market to book ratio, is a financial valuation tool used to evaluate whether the stock a company is over or undervalued by comparing the price of all outstanding shares with the net assets of the company. In other words, it’s a calculation that measures the difference between the book value and the total share price of the company.
Dabur: The P/E has been increasing over the past 3 years. This implies that the market is asking for more investment as compared to the earnings it is giving to the shareholders. Emami: If we have a close look at the P/E of the past 3 years, we see a sudden rise in the P/E in 2015. This is due to the increase in the share price in the market from around Rs 450 in Mar 2014 to around Rs 960 in Mar 2015. Dabur has been giving a consistent increase in the P/E whereas Emami has suddenly increased its P/E.
Dabur: There is no change in the Creditors Turnover
ratio which means that they have been able to pay off
their creditors at the same rate as they used to.
Emami: They have reduced their Creditors turnover
ratio considerably in 2014. This has been due to
increase in creditors and decrease in purchases of raw
materials. It is not clear as to why creditors have
increase even though purchases have reduced. In 2015
it remained stable at 5.70.

Financial Statement Analysis
N.L Dalmia Institute of Management Studies and Research
30
c. EV/EBITDA: An enterprise multiple is a ratio used to determine the value of a
company. The enterprise multiple looks at a firm as a potential acquirer would, because it takes debt into account - an item which other multiples like the P/E ratio do not include.
d. Dividend Payout Ratio: The dividend payout ratio measures the percentage of net income that is distributed to shareholders in the form of dividends during the year. In other words, this ratio shows the portion of profits the company decides to keep to fund operations and the portion of profits that is given to its shareholders
Dabur: The P/BV ratio has been consistently increasing. This shows that the investors have faith in the growth of the company and hence are paying a higher amount as compared to the book value of the share. Emami: The P/BV has been similar for 2 years but has increased in 2014-15. This is due to the increase in share price as explained above.
Dabur: This ratio has been increasing since the past 3 years. This is showing an optimistic valuation of the company with respect to its earnings. Emami: This ratio declined in 2014 but increased significantly in 2015. In spite of reducing the debt of the company, the EV/EBITDA has increased and this can be attributed purely to the increase in the share price of the Equity.

Financial Statement Analysis
N.L Dalmia Institute of Management Studies and Research
31
Leverage Ratios:
a. Debt-Equity Ratio: The debt to equity ratio is a financial, liquidity ratio that compares a company's total debt to total equity. The debt to equity ratio shows the percentage of company financing that comes from creditors and investors. A higher debt to equity ratio indicates that more creditor financing (bank loans) is used than investor financing (shareholders).
b. Interest Coverage Ratio: The interest coverage ratio is a financial ratio that measures
a company’s ability to make interest payments on its debt in a timely manner. Unlike the debt service coverage ratio, this liquidity ratio really has nothing to do with being able to make principle payments on the debt itself. Instead, it calculates the firm’s ability to afford the interest on the debt.
Dabur: The Debt-Equity has been decreasing over the past 3 years and is well below the industry average. The decreasing D/E Ratio does not give a leverage to the Equity shareholders which can be seen in the reducing ROE and being below the industry average gives scope to the company to raise more debt. Emami: The Debt-Equity has been decreasing over the past 3 years and is well below the average. This company has not taken the benefit of the financial leverage however, the ROE has increased purely due to an increase in PAT. Also, this company has scope of raising more Debt in case further capital is required.
Dabur: Dabur has given close to 50% of their earnings as
dividends and it has been increasing marginally over the past
3 years.
Emami: They have given close to 40% of their earnings as
dividend to their shareholders.
Dabur has given more dividend out of its earnings than
Emami. In spite of this, Emami has a higher P/E ratio which
shows that investors are more optimistic about Emami than
Dabur and are ready to pay more price in the market to
Emami.

Financial Statement Analysis
N.L Dalmia Institute of Management Studies and Research
32
Liquidity Ratio: a. Current Ratio: The current ratio is a liquidity and efficiency ratio that measures a
firm's ability to pay off its short-term liabilities with its current assets. The current ratio is an important measure of liquidity because short-term liabilities are due within the next year.
b. Quick Ratio: The quick ratio or acid test ratio is a liquidity ratio that measures the ability of a company to pay its current liabilities when they come due with only quick assets. Quick assets are current assets that can be converted to cash within 90 days or in the short-term. Cash, cash equivalents, short-term investments or marketable securities, and current accounts receivable are considered quick assets.
Dabur: The ICR of Dabur is much above the
industry standards which implies that the ability
of the company to pay off its Interest out of the
Earnings is crazy!
Emami: The ICR of Emami is way above the
industry standards which implies that the ability
of the company to pay off its interest out of the
earnings is crazily awesome!
Dabur: The Current Ratio is well below the industry standard for this company and has remained stagnant at 1.00. This company has a bad Current Asset management. Emami: The current ratio has increased and is well above the industry standards. This increase can be attributed to an increase in the current assets and a reduction in the current liabilities.
Dabur: Dabur has a Quick Ratio of close to 0.6. This
implies that for ever Re 1 of the Current liabilities, the
company has 60p to pay off.
Emami: They have a Quick ratio of close to 1.4 which
implies that for every Re 1 of current liabilities, they have
Re 1.4 to pay it off.
Emami can pay off its Creditors quicker than Dabur and
will still have 40p left with them per Re 1.

Financial Statement Analysis
N.L Dalmia Institute of Management Studies and Research
33
Cash Flow Analysis: Dabur: Year Mar 15 Mar 14 Mar 13
Cash Flow Summary
Cash and Cash Equivalents at Beginning of the year
146.34 67.39 35.72
Net Cash from Operating Activities
839.2 712.23 702.55
Cash Flow From Operating Activities
Net Profit before Tax & Extraordinary Items
976.53 861.33 749.67
Adjustment For
Depreciation 65.97 53.89 49.05
Interest (Net) -102.45 -70.33 -57.47
P/L on Sales of Assets 1.11 0.82 0.66
P/L on Sales of Invest -17.95 -17.02 -9.56
Prov. & W/O (Net) 46.71 25.95 24.73
P/L in Forex -0.87 -1.31 -1.08
Others 23.96 0 0
Total Adjustments (PBT & Extraordinary Items)
16.48 -8 6.33
Op. Profit before Working Capital Changes
993.01 853.33 756
Adjustment For
Trade & 0th receivables -42.98 -52.47 -20.88
Inventories 7.6 -57.88 28.83
Trade Payables 85.66 147.75 86.76
Total (OP before Working Capital Changes)
50.28 37.4 94.71
Cash Generated from/(used in) Operations
1,043.29 890.73 850.71
Direct Taxes Paid -204.09 -178.5 -148.16
Total-others -204.09 -178.5 -148.16
Cash Flow before Extraordinary Items
839.2 712.23 702.55
Net Cash Used in Investing Activities
-613 -98.43 -345.9
Cash Flow from Investing Activities
Investment in Assets :
Purchased of Fixed Assets -111.06 -96.18 -85.4
Sale of Fixed Assets 14.93 1.06 5.39
Financial/Capital Investment :
Purchase of Investments -6,259.30 -6,544.59 -4,607.18

Financial Statement Analysis
N.L Dalmia Institute of Management Studies and Research
34
Sale of Investments 5,654.59 6,451.48 4,303.63
Interest Received 84.67 85.62 49.45
Loans to Subsidiaires 0 1.2 -9
Others 3.21 2.98 -2.8
Net Cash Used in Financing Activities
-336.8 -534.9 -327.8
Cash Flow From Financing Activities
Proceeds:
Proceeds from Issue of shares (incl share premium)
45.5 0.05 0.04
Proceed from 0ther Long Term Borrowings
0 0 3.35
Proceed from Short Tem Borrowings
86.89 0 0
Payments:
Of the Long Tem Borrowings 0 -0.84 -0.46
Of the short term Borrowings -2.05 -196.45 -34.75
Dividend Paid -394.79 -278.78 -243.43
Interest Paid -5.14 -11.42 -12.94
Others -67.16 -47.41 -39.58
Net Cash Used in Financing Activities
-336.75 -534.85 -327.77
Net Inc/(Dec) in Cash and Cash Equivalent
-110.5 78.95 28.87
Cash and Cash Equivalents at End of the year
35.83 146.34 64.59
Dabur: The cash flow from operating activities has increased over the past 3 years. Cash used in investing activities declined in 2014 but increased substantially in 2015 due to the purchases of fixed assets. Cash used in financing activities increased in 2014 but decreased in 2015 due to the increase in the payments for short term borrowings and dividends in 2014 and receiving proceeds form short term borrowings and issue of shares in 2015. Overall there was a net increase in cash flows and then a decline over the past 3 years.

Financial Statement Analysis
N.L Dalmia Institute of Management Studies and Research
35
Emami:
Year Mar 15 Mar 14 Mar 13
Cash Flow Summary Cash and Cash Equivalents
at Beginning of the year 263.37 278.66 272.48
Net Cash from Operating Activities 496.62 378.49 326.64
Cash Flow From Operating Activities
Net Profit before Tax & Extraordinary Items 576.98 456.07 376.73
Adjustment For Depreciation 31.48 32.82 21.19
Interest (Net) -52.1 -39.24 -33.12
Dividend Received -101.23 -17.73 -0.47
P/L on Sales of Assets 0.26 0.4 0.55
P/L on Sales of Invest 85.82 -2.44 -5.2
Prov. & W/O (Net) -7.62 8.87 0
P/L in Forex -7.33 -3.11 5.74
Total Adjustments (PBT & Extraordinary Items) -50.72 -20.43 -11.31
Op. Profit before Working Capital Changes 526.26 435.64 365.42
Adjustment For Trade & 0th receivables 17.93 -5.93 20.05
Inventories 18.17 -24.36 -2.85
Trade Payables 23.56 38.59 -11.24
Others 6.06 14.46 4.3
Total (OP before Working Capital Changes) 65.72 22.76 10.26
Cash Generated from/(used in) Operations 591.98 458.4 375.68
Interest Paid(Net) 0 0 0
Direct Taxes Paid -95.36 -75.63 -49.04
Advance Tax Paid 0 0 0
Others 0 0 0
Total-others -95.36 -75.63 -49.04
Cash Flow before Extraordinary Items 496.62 382.77 326.64
Extraordinary Items Others 0 -4.28 0
Net Cash Used in Investing Activities -217.08 -130.14 -118.71
Cash Flow from Investing Activities
Investment in Assets :

Financial Statement Analysis
N.L Dalmia Institute of Management Studies and Research
36
Purchased of Fixed Assets -99.75 -58.36 -77.55
Sale of Fixed Assets 1.19 0.67 1.74
Financial/Capital Investment :
Purchase of Investments -1,811.06 -1,305.22 -616.52
Sale of Investments 1,527.44 1,167.26 538.94
Investment Income 0 0 0
Interest Received 56.54 44.65 39.95
Dividend Received 101.23 17.73 0.47
Others 7.33 3.13 -5.74
Net Cash Used in Financing Activities -220.74 -263.64 -201.75
Cash Flow From Financing Activities
Proceeds: Dividend Paid -181.19 -188.94 -120.86
Interest Paid -5 -3.58 -6.41
Others -34.55 -71.12 -74.48
Net Cash Used in Financing Activities -220.74 -263.64 -201.75
Net Inc/(Dec) in Cash and Cash Equivalent 58.8 -15.29 6.18
Cash and Cash Equivalents at End of the year 322.17 263.37 278.66
Emami: the cash flow from operating activities has increased over the past 3 years. Cash used in investing activities has increased due to the rise in purchases of fixed assets and investments. Cash used in financing activities has increased in 2014 due to dividend payments and then reduced in 2015 due to repayment of loans as per the annual report. Overall the net cash flows have declined and then increased in the past 3 years.

Financial Statement Analysis
N.L Dalmia Institute of Management Studies and Research
37
Comparative Analysis:
Balance Sheet: Dabur : Year Mar 15 Mar 14 Mar 13
SOURCES OF FUNDS :
Share Capital 0.73 0.05 0.05
Reserves Total 25.03 24.2 23.23
Equity Share Warrants -- -- --
Equity Application Money -- -- --
Total Shareholders Funds 22.81 21.51 20.13
Secured Loans -11.52 -20.83 17.52
Unsecured Loans 327.89 -87.93 -13.61
Total Debt 191.56 -81.7 -11.43
Other Liabilities 6.6 2.19 -2.99
Total Liabilities 26.24 7.57 14.22
APPLICATION OF FUNDS :
Gross Block 7.74 8.66 8.59
Less : Accumulated Depreciation 13.34 13.43 14.98
Less:Impairment of Assets -- -- --
Net Block 4.42 6.01 5.34
Lease Adjustment -- -- --
Capital Work in Progress -26.96 -1.99 47.41
Producing Properties -- -- --
Investments 58.99 8.99 85.65
Current Assets, Loans & Advances
Inventories -1.36 11.57 -5.34
Sundry Debtors 4.85 26.55 13.9
Cash and Bank -58.34 76.66 -35.55
Loans and Advances 34.77 -14.55 -12.07
Total Current Assets -8.88 21.25 -9.37
Less : Current Liabilities and Provisions
Current Liabilities 8.79 20.2 9.94
Provisions -15.55 15.27 28.19
Total Current Liabilities 3.43 19.08 13.62
Net Current Assets -68.44 32.98 -56.7
Miscellaneous Expenses not written off -- -- --
Deferred Tax Assets -1.52 2.57 -0.92
Deferred Tax Liability 10.96 15.67 13.42
Net Deferred Tax 18.08 24.75 26.08

Financial Statement Analysis
N.L Dalmia Institute of Management Studies and Research
38
Liabilities have increased at a low rate due to the reduction in loans and debt in 2014 but it has increased significantly due to the increase in borrowings in the form of loans and debt in 2015. Assets have increased due to the increase in inventories, debtors and cash and cash equivalents in 2014 and investments in 2015. Emami:
Year Mar 15 Mar 14 Mar 13
SOURCES OF FUNDS :
Share Capital 0 50.03 0
Reserves Total 31.29 18.87 11.74
Equity Share Warrants -- -- --
Equity Application Money -- -- --
Total Shareholders Funds 30.52 19.48 11.48
Secured Loans -48.56 -62.53 -59.54
Unsecured Loans 3.85 -47.85 -39.39
Total Debt -23.37 -56.67 -53.34
Other Liabilities 40.16 81 36.87
Total Liabilities 29.09 14.22 0.18
APPLICATION OF FUNDS :
Gross Block -40.1 9.53 10.27
Less : Accumulated Depreciation -71.65 16.22 25.88
Less:Impairment of Assets -- -- --
Net Block 13.46 -0.23 -6.61
Lease Adjustment -- -- --
Capital Work in Progress 195.85 -80.87 -32.79
Producing Properties -- -- --
Investments 69.33 81.14 102.45
Current Assets, Loans & Advances
Inventories -13.3 21.7 2.6
Sundry Debtors -24.36 -6.54 1.96
Cash and Bank 23.13 -5.11 2.43
Loans and Advances -3.66 -3.09 -30.45
Total Current Assets 4.13 0.51 -3.31
Less : Current Liabilities and Provisions
Current Liabilities 15.7 35.19 -10.5
Provisions -18.76 -26.58 4.1
Total Current Liabilities 0.12 -2.07 -2.23
Net Current Assets 8.03 3.16 -4.4
Miscellaneous Expenses not written off -- -- --
Deferred Tax Assets 15.29 143.19 15.16
Deferred Tax Liability 60.12 -14.94 -1.37
Net Deferred Tax 158.66 -64.99 -5.66

Financial Statement Analysis
N.L Dalmia Institute of Management Studies and Research
39
Liabilities have increased due to an increase in shareholder's funds and other liabilities in 2014 and increase in reserves and unsecured loans in 2015. Assets have increased in 2014 due to the rise in inventory and in 2015 due to the increase in Net-block of assets and capital work-in-progress.
Profit and Loss: Dabur:
Year Mar 15 Mar 14 Mar 13
INCOME :
Sales Turnover 11.76 11.98 15.88
Excise Duty 32.49 12.91 28.41
Net Sales 11.52 11.97 15.75
Other Income 25.71 16.37 70.89
Stock Adjustments 161.77 -148.09 -143.18
Total Income 12.21 12.99 14.1
EXPENDITURE :
Raw Materials 14.52 12.22 -19.46
Power & Fuel Cost 1.48 7.46 0
Employee Cost 14.26 16.85 26.22
Other Manufacturing Expenses 1.32 12.97 1,228.78
Selling and Administration Expenses 11.09 12.37 23.95
Miscellaneous Expenses 34.53 11.64 -8.48
Less: Pre-operative Expenses Capitalised -- -- --
Total Expenditure 12.11 12.68 12.35
Operating Profit 12.61 14.37 22.5
Interest -48.89 5.16 30.5
Gross Profit 13.91 14.59 22.33
Depreciation 22.42 9.87 -25.55
Profit Before Tax 13.37 14.89 27.71
Tax 13.04 19.23 32.48
Fringe Benefit tax -- -- --
Deferred Tax 13.48 19.66 -24.3
Reported Net Profit 13.46 13.73 27.58
The total income has increased due to the rise in sales. The expenditures such as raw materials and miscellaneous have increased considerably. Depreciation expense has increased whereas the tax expenses have reduced. The PAT has increased at a diminishing rate over the past 3 years.

Financial Statement Analysis
N.L Dalmia Institute of Management Studies and Research
40
Emami:
Year Mar 15 Mar 14 Mar 13
INCOME :
Sales Turnover 19.1 4.59 17.51
Excise Duty 19.61 -5.08 42.53
Net Sales 19.09 4.79 17.07
Other Income 57.31 14.63 3.01
Stock Adjustments -153.85 198.89 -134.41
Total Income 18.16 6.05 19.03
EXPENDITURE :
Raw Materials 7.82 -3.33 19.45
Power & Fuel Cost 27.06 10.9 23.8
Employee Cost 12.61 27.9 26.53
Other Manufacturing Expenses -3.05 32.16 16.81
Selling and Administration Expenses 27.94 1.8 18.31
Miscellaneous Expenses 21.42 -1.62 -31.03
Less: Pre-operative Expenses Capitalised -- -- --
Total Expenditure 15.39 1.39 18.03
Operating Profit 25.56 20.91 22.31
Interest 25.96 -36.23 -60.77
Gross Profit 25.56 21.79 26.41
Depreciation -4.08 54.88 13.62
Profit Before Tax 27.71 19.92 27.22
Tax 56.53 16.12 39.62
Fringe Benefit tax -- -- --
Deferred Tax -185.49 984.15 -202.5
Reported Net Profit 18.43 23 26.07
The total income has increased at a low rate in 2014 but at a higher rate in 2015. The expenditures have increased in the same pattern as sales interest reduced in 2014 then increased in 2015 depreciation increased in 2014 then fell in 2015 hence PAT has increased over the past 3 years at a low rate in 2014 but at a higher rate in 2015.

Financial Statement Analysis
N.L Dalmia Institute of Management Studies and Research
41
Common Size Analysis
Balance Sheet: Dabur:
Year Mar 15 Mar 14 Mar 13
SOURCES OF FUNDS :
Share Capital 7 8.78 9.44
Reserves Total 86.14 86.97 75.33
Equity Share Warrants 0 0 0
Equity Application Money 0 0 0
Total Shareholders Funds 93.15 95.75 84.77
Secured Loans 0.63 0.9 1.22
Unsecured Loans 4.52 1.33 11.89
Total Debt 5.15 2.23 13.1
Other Liabilities 1.71 2.02 2.13
Total Liabilities 100 100 100
APPLICATION OF FUNDS :
Gross Block 44.77 52.46 51.93
Less : Accumulated Depreciation 17.56 19.56 18.55
Less:Impairment of Assets 0 0 0
Net Block 27.21 32.9 33.38
Lease Adjustment 0 0 0
Capital Work in Progress 0.49 0.84 0.92
Producing Properties 0 0 0
Investments 70.9 56.29 55.56
Current Assets, Loans & Advances
Inventories 21.95 28.1 27.09
Sundry Debtors 13.51 16.26 13.82
Cash and Bank 4.94 14.97 9.12
Loans and Advances 7.49 7.01 8.83
Total Current Assets 47.89 66.35 58.86
Less : Current Liabilities and Provisions
Current Liabilities 36.95 42.88 38.38
Provisions 8.1 12.1 11.29
Total Current Liabilities 45.05 54.98 49.67
Net Current Assets 2.84 11.36 9.19
Miscellaneous Expenses not written off 0 0 0
Deferred Tax Assets 0.95 1.22 1.28
Deferred Tax Liability 2.96 3.37 3.13
Net Deferred Tax -2.01 -2.15 -1.85
Total Assets 100 100 100

Financial Statement Analysis
N.L Dalmia Institute of Management Studies and Research
42
The major portion of liabilities is shareholder's funds due to reserves. The share of total debt has increased at a low rate in 2014 and high rate in 2015. The major chunk of assets are held in the form of investments. The next share is in block of assets and inventories.

Financial Statement Analysis
N.L Dalmia Institute of Management Studies and Research
43
Emami:
Year Mar 15 Mar 14 Mar 13
SOURCES OF FUNDS :
Share Capital 1.78 2.3 1.75
Reserves Total 93.23 91.67 88.08
Equity Share Warrants 0 0 0
Equity Application Money 0 0 0
Total Shareholders Funds 95.01 93.97 89.83
Secured Loans 0.66 1.65 5.02
Unsecured Loans 1.23 1.52 3.34
Total Debt 1.88 3.17 8.36
Other Liabilities 3.11 2.86 1.81
Total Liabilities 100 100 100
APPLICATION OF FUNDS :
Gross Block 47.33 102.01 106.37
Less : Accumulated Depreciation 14.1 64.2 63.09
Less:Impairment of Assets 0 0 0
Net Block 33.23 37.81 43.28
Lease Adjustment 0 0 0
Capital Work in Progress 1.96 0.85 5.1
Producing Properties 0 0 0
Investments 39.33 29.98 18.9
Current Assets, Loans & Advances
Inventories 9.28 13.82 12.97
Sundry Debtors 4.46 7.61 9.3
Cash and Bank 25.56 26.8 32.25
Loans and Advances 4.93 6.61 7.78
Total Current Assets 44.23 54.84 62.31
Less : Current Liabilities and Provisions
Current Liabilities 13.28 14.82 12.52
Provisions 7.7 12.23 19.03
Total Current Liabilities 20.98 27.05 31.55
Net Current Assets 23.25 27.79 30.77
Miscellaneous Expenses not written off 0 0 0
Deferred Tax Assets 0.95 1.07 0.5
Deferred Tax Liability 1.92 1.55 2.08
Net Deferred Tax -0.97 -0.48 -1.58
Total Assets 100 100 100
Shareholder's funds form a major part of liabilities in the form of reserves (90%-95%) block of assets, investments and cash and bank balances form major chunk of assets. Comparing the 2 companies, we can say that Dabur is utilizing its cash better by investing it and Emami has scope of investing the cash and bank balances.

Financial Statement Analysis
N.L Dalmia Institute of Management Studies and Research
44
Profit & Loss: Dabur:
Year Mar 15 Mar 14 Mar 13
INCOME :
Sales Turnover 98.29 98.68 99.57
Excise Duty 1.33 1.12 1.13
Net Sales 96.96 97.56 98.45
Other Income 2.46 2.2 2.13
Stock Adjustments 0.58 0.25 -0.58
Total Income 100 100 100
EXPENDITURE :
Raw Materials 38.56 37.78 38.04
Power & Fuel Cost 0.9 1 1.05
Employee Cost 7.02 6.89 6.66
Other Manufacturing Expenses 13.5 14.95 14.95
Selling and Administration Expenses 16.75 16.92 17.01
Miscellaneous Expenses 4.48 3.74 3.78
Less: Pre-operative Expenses Capitalised 0 0 0
Total Expenditure 81.21 81.28 81.5
Operating Profit 18.79 18.72 18.5
Interest 0.18 0.39 0.42
Gross Profit 18.61 18.33 18.08
Depreciation 1.18 1.08 1.11
Profit Before Tax 17.43 17.25 16.97
Tax 3.65 3.62 3.43
Fringe Benefit tax 0 0 0
Deferred Tax 0.17 0.17 0.16
Reported Net Profit 13.61 13.46 13.38
The PAT is approximately 13% of the sales over the past 3 years. Expenditures are approximately 81% of sales as there is huge expenses in raw materials and selling and administration expenses.

Financial Statement Analysis
N.L Dalmia Institute of Management Studies and Research
45
Emami:
Year Mar 15 Mar 14 Mar 13
INCOME :
Sales Turnover 97.61 96.84 98.2
Excise Duty 1.86 1.84 2.06
Net Sales 95.75 95 96.14
Other Income 4.86 3.65 3.38
Stock Adjustments -0.61 1.35 0.48
Total Income 100 100 100
EXPENDITURE :
Raw Materials 34.48 37.79 41.45
Power & Fuel Cost 0.57 0.53 0.5
Employee Cost 6.79 7.13 5.91
Other Manufacturing Expenses 0.93 1.13 0.91
Selling and Administration Expenses 27.02 24.96 26
Miscellaneous Expenses 1.29 1.25 1.35
Less: Pre-operative Expenses Capitalised 0 0 0
Total Expenditure 71.08 72.78 76.13
Operating Profit 28.92 27.22 23.87
Interest 0.23 0.22 0.36
Gross Profit 28.69 27 23.51
Depreciation 1.48 1.83 1.25
Profit Before Tax 27.21 25.17 22.26
Tax 4.61 3.48 3.18
Fringe Benefit tax 0 0 0
Deferred Tax 0.36 -0.5 -0.05
Reported Net Profit 22.24 22.19 19.13
PAT is on an average 20.5% of sales over the 3 years. Expenditure is approximately 73% of sales with major expenses being raw materials and selling and administration. Comparing the two companies, it is seen that Dabur needs to reduce its raw material expenses.

Financial Statement Analysis
N.L Dalmia Institute of Management Studies and Research
46
Free Cash Flow to the Firm
Dabur Emami
Years 2013 2014 2015 2013 2014 2015
Free Cash Flow to the Firm 671.3 675.16 810.33 419.32 379.34 353.14
Share Price Trend:
As depicted in the graph, the share price of Dabur has always remained between Rs 230.00 and Rs 310.00 over the past 52 weeks.


