FILLING THE GAP - thedialogue.org · 2 Filling the Gap: How the US Energy Boom is Shaping Latin...
12
How the US Energy Boom is Shaping Latin American Refining Markets Lisa Viscidi ENERGY WORKING PAPER MARCH 2015 T he shale revolution in the United States marks one of the most dramatic shifts in the global oil industry in decades. After more than 20 years of declining output, US crude oil production increased by some 75% between 2008 and 2014, making the United States the largest oil producer in the world. The implications of this shift are being witnessed across the globe, perhaps most importantly in neighboring countries of the Western Hemisphere, which have long served as a natural market for crude and oil product trade with the United States. For Latin America and the Caribbean, a region facing growing demand and a widening deficit of refining capacity, the United States has now emerged as the leading supplier of imported oil products. However, to what extent this trend will continue depends on multiple factors, including fluctuations in US oil demand, the fate of the US crude export ban, and Latin America’s push to increase refining capacity. The success of policies to curb demand in Latin America, such as the elimination of fuel subsidies, increased vehicle efficiency standards, and the promotion of alternative transportation, will also play an important role in future oil product demand. The US has transformed from the world’s largest oil product importer to the number one exporter. FILLING THE GAP US Oil Product Exports Flood Latin America Due to declining domestic demand and increasing refining capacity, the United States has transformed from the world’s largest oil product importer to the number one oil product exporter. Although the United States has not built new refineries in almost 40 years, expansions and upgrades of existing plants have increased the country’s total capacity from 16.9 million b/d in 2004 to 17.9 million b/d in 2014. 1 At the same time, demand has fallen from a peak of almost 19 million b/d in 2005 to 16.6 million b/d in 2014 as a result of improved fuel efficiency standards, technological advances like telecommuting, and demographic trends, such as an aging population that drives less. 2
Transcript of FILLING THE GAP - thedialogue.org · 2 Filling the Gap: How the US Energy Boom is Shaping Latin...

How the US Energy Boom is Shaping Latin American Refining MarketsLisa Viscidi
ENERGY WORKING PAPER MARCH 2015
T he shale revolution in the United States marks one of the most dramatic shifts in the global oil industry in decades. After more than 20 years of declining
output, US crude oil production increased by some 75% between 2008 and 2014, making the United States the largest oil producer in the world. The implications of this shift are being witnessed across the globe, perhaps most importantly in neighboring countries of the Western Hemisphere, which have long served as a natural market for crude and oil product trade with the United States. For Latin America and the Caribbean, a region facing growing demand and a widening deficit of refining capacity, the United States has now emerged as the leading supplier of imported oil products.
However, to what extent this trend will continue depends on multiple factors, including fluctuations in US oil demand, the fate of the US crude export ban, and Latin America’s push to increase refining capacity. The success of policies to curb demand in Latin America, such as the elimination of fuel subsidies, increased vehicle efficiency standards, and the promotion of alternative transportation, will also play an important role in future oil product demand.
The US has transformed
from the world’s largest
oil product importer to the
number one exporter.
FILLING THE GAP
US Oil Product Exports Flood Latin America Due to declining domestic demand and increasing refining capacity, the United States has transformed from the world’s largest oil product importer to the number one oil product exporter. Although the United States has not built new refineries in almost 40 years, expansions and upgrades of existing plants have increased the country’s total capacity from 16.9 million b/d in 2004 to 17.9 million b/d in 2014. 1 At the same time, demand has fallen from a peak of almost 19 million b/d in 2005 to 16.6 million b/d in 2014 as a result of improved fuel efficiency standards, technological advances like telecommuting, and demographic trends, such as an aging population that drives less. 2

Filling the Gap: How the US Energy Boom is Shaping Latin American Refining Markets2
ForewordI am pleased to present “Filling the Gap: How the US Energy Boom is Shaping Refining Markets in Latin America” by Lisa Viscidi, Director of the Energy, Climate Change and Extractive Industries Program at the Inter-American Dialogue.
This report, made possible with the generous support of the Inter-American Development Bank, highlights findings from a Dialogue-hosted workshop that convened a group of leading experts on refining markets in the Americas. The report is the first in a three-part series on the impact of the North American energy boom on Latin American and Caribbean refined product, crude oil, and liquefied natural gas markets.
The dramatic increase in unconventional oil and gas production in North America has catalyzed a shift in energy flows throughout the Western Hemisphere. The United States, previously the world’s largest importer of refined petroleum products, has become the number one oil product exporter. Facing growing demand and a widening deficit of refining capacity, Latin America has been flooded with US oil products.
In light of this gap, Latin American countries must choose whether to build refineries to meet growing demand or take advantage of the surplus of US capacity to delay costly downstream investments. Building new refineries can
bring benefits in terms of energy security, improved trade balances, and investment and jobs for the local economy. As this report shows, however, Latin American refiners will struggle to compete with those in the United States, which enjoy access to cheap natural gas, discounted US crude, and existing infrastructure. Viscidi argues that US energy and export policies should therefore factor into Latin American countries’ downstream policies and plans.
To close the refining gap, Latin American policymakers should also look to curb demand by cutting subsidies, imposing fuel economy standards, and creating stronger regulatory and fiscal incentives to promote alternative transportation.
We are grateful to Paul Shortell and Maria Mendoza for their excellent research assistance. The views expressed in this report are those of the author alone and are aimed at stimulating a discussion on an important public policy issue.
MICHAEL SHIFTER
President
Plans to upgrade and build new refineries have usually been delayed or even scrapped due to the lack of capital to build expensive infrastructure, cost overruns, and market uncertainty.

ENERGY WORKING PAPER | MARCH 2015
Filling the Gap: How the US Energy Boom is Shaping Latin American Refining Markets 3
Crude oil production, meanwhile, is soaring due to a rapid increase in light oil production from shale formations and rising output from the US Gulf of Mexico. US crude production rose from about 5.5 million b/d in 2010 to 8.7 million b/d in 2014, 3 while imports from Canada are also growing as oil sands production increases. Rising US oil production, declining demand, and the ban on crude exports mean the US refining system is awash with crude. This oversupply has led to a discount on US crude and encouraged refiners to run at close to 100% of capacity. As a result, US refining output has grown while oil product exports tripled between 2004 and 2014.4
FIGURE 1 : US CONSUMPTION AND REFINING CAPACITY, 2004-2014Source: US Energy Information Administration
The shale revolution and crude export ban have also made US refiners more competitive in the global market. The downstream business is generally much less profitable than oil exploration and production, and with oil prices at around $100 per barrel in recent years, refining margins globally have been low. But access to cheap natural gas to power refineries, discounted crude from the United States, and existing infrastructure have helped US refiners to beat competition from Europe as well as emerging market regions with limited refining capacity, such as Latin America. Global refining margins improved in the second half of 2014, as the decline in the price of oil products
lagged behind the drop in crude prices, but that gap is already closing -- leaving refiners outside of the United States at a disadvantage once again. The United States has a particularly large surplus of distillates, including diesel, which is increasingly in demand across the globe to fuel trucks and other commercial transportation. Higher US diesel prices, driven by strong growth in global demand, have prompted a shift in refining capacity towards diesel. US exports of gasoline and other fuels are also up. 5
Although the decline in international oil prices since mid-2014 will likely curb US oil production growth in the near term, long-term projections for US oil product exports are bullish. This suggests the country will remain an important supplier for Latin America and other regions, though Middle East exports are expected to capture some market share. US exports of oil products will increase from roughly 2.8 million b/d in 2014 to approximately 3.7 million b/d by 2040, according to projections from the US Energy Information Administration (EIA). 6
Latin America is the main destination for US refined products, receiving half of all exports in 2014. Exports to the region quadrupled over ten years to 1.9 million b/d in 2014. 7 Latin America is also increasingly dependent on US supplies, which accounted for about three quarters of the region’s product imports by volume in 2013. 8
Latin America 50%
Europe 19%
Canada 13%
East Asia 13%
Africa 4%
Middle East 1%
FIGURE 2 : US OIL PRODUCT EXPORTS BY REGION, 2014Source: US Energy Information Administration
14500
15000
15500
16000
16500
17000
17500
18000
18500
19000
2004 2005 2006 2007 2008 2009 2010 2011 2012 2013 2014
US CRUDE OIL DISTILLATION CAPACITY (THOUSAND B/D)
14,500.00
15,000.00
15,500.00
16,000.00
16,500.00
17,000.00
17,500.00
18,000.00
18,500.00
19,000.00
2004 2005 2006 2007 2008 2009 2010 2011 2012 2013 2014
US CRUDE OIL DISTILLATION CAPACITY (THOUSAND B/D)
US CONSUMPTION OF FINISHED PETROLEUM PRODUCTS (THOUSAND B/D) 14,500.00
15,000.00
15,500.00
16,000.00
16,500.00
17,000.00
17,500.00
18,000.00
18,500.00
19,000.00
2004 2005 2006 2007 2008 2009 2010 2011 2012 2013 2014
US CRUDE OIL DISTILLATION CAPACITY (THOUSAND B/D)
US CONSUMPTION OF FINISHED PETROLEUM PRODUCTS (THOUSAND B/D)

Filling the Gap: How the US Energy Boom is Shaping Latin American Refining Markets4
0
100
200
300
400
500
600
700
Guatemala Central America
China Colombia Mexico Brazil Venezuela Argen@na Chile US
CONSUMPTION OF OIL KBOE/DAY PER 10 MILLION INHABITANTS GDP PER CAPITA (100 USD)
Rising Demand Drives Latin America’s Dependence on US Oil ProductsLatin America’s appetite for oil has grown rapidly over the past decade, and the region is the third fastest growing oil demand center after Asia and the Middle East. Latin American demand is projected to reach 9.9 million b/d by 2020 and 11.3 million b/d by 2035, with gasoline and diesel accounting for some three quarters of new demand.9 In part, booming consumption reflects the region’s strong economic growth over the past decade. Increasing economic output and growing middle classes have fueled electricity demand and triggered a surge in vehicle ownership. But demand growth varies widely across countries and is affected by other factors, including energy efficiency, the use of alternative fuels, and domestic pricing policies.
In several countries, energy subsidies have encouraged higher consumption of oil products. Venezuela has had among the lowest fuel prices in the world for decades, encouraging demand and costing the government billions of dollars. In 2013 alone, Venezuela’s government reportedly spent over 12 billion dollars to keep gasoline prices below 6 cents per gallon, and the country has the highest per capita oil consumption in the region. 10 11 Many other Latin American countries, including Mexico, Ecuador, and Argentina, have offered some level of fuel subsidy in recent years, contributing to increased oil demand. 12
The extent to which countries use alternative fuels or vehicles for transportation, such as ethanol, natural gas, or electric vehicles, also influences oil demand. Brazil’s per capita oil consumption has traditionally been relatively low due to the widespread use of ethanol in cars. But as oil prices rose in 2011-2014, fuel price caps in Brazil forced
state oil company Petrobras to sell gasoline and diesel at below-market rates. This prompted car owners with flex-fuel vehicles that can run on gasoline or ethanol to shift away from relatively expensive ethanol. The amount of oil used for power generation compared with other sources, like natural gas or renewable energy, also impacts demand. In Mexico, where liquid fuels account for 20% of power generation,13 per capita oil consumption is relatively high in comparison to per capita GDP.
Alternative transportation fuels are increasingly used throughout Latin America, although their scale and impact remain limited. At present, only 0.2% of energy used in transportation comes from electricity, compared to 97.1% from oil. 14 Natural gas vehicle (NGV) penetration has been more widespread. The region accounts for 27% of the global NGV fleet, and Argentina, Brazil, Colombia, and Bolivia boast among the largest fleets in the world. 15
FIGURE 3 : PER CAPITA GDP VS. PER CAPITA OIL PRODUCT CONSUMPTION, 2013Source: Authors’ Calculations based on Inter-American Development Bank and World Bank Data

ENERGY WORKING PAPER | MARCH 2015
Filling the Gap: How the US Energy Boom is Shaping Latin American Refining Markets 5
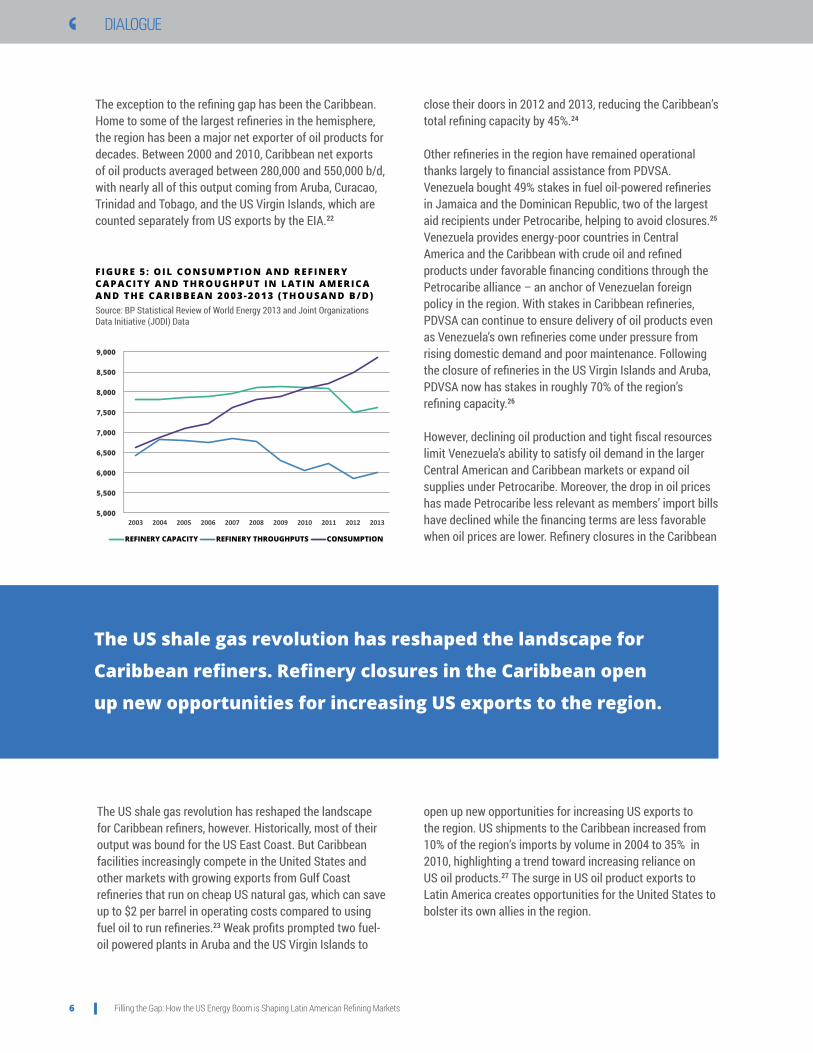
Latin America’s Refining Gap WidensAs Latin America’s oil demand grows, the region’s refinery output has remained essentially flat over the last decade, leading to the rise in oil product imports. The shortfall more than doubled to almost 2 million b/d in 2013 compared to less than 800,000 b/d in 2003.16
1917
50
631227
41
199
176
2911282
168320
1540301
3650 73
For years, several countries have sought to increase their refining capacity. But plans to upgrade and build new refineries have usually been delayed or even scrapped due to the lack of capital to build expensive infrastructure, cost overruns, and market uncertainty. Ecuador has been planning a Pacific coast refinery since 2007, and only seven years later agreed to financing with its Chinese partners. Mexico first raised plans to build the Tula refinery in 2008 but tabled them, citing the high costs of construction.18 And in Brazil, Petrobras announced plans in 2005 to build the Abreu e Lima refinery in Pernambuco state in partnership with Venezuelan state oil company Petróleos de Venezuela (PDVSA). But construction was delayed for years as the partners sought to iron out an agreement until PDVSA finally abandoned the project. Petrobras ultimately decided to go it alone, and the project has cost more than $18 billion compared to an initial estimate of $2.5 billion.19 Fraudulent transactions related to the project are now at the center of the largest corruption scandal in Brazilian history, which has forced Petrobras to suspend many of its contracts with suppliers and revisit its downstream plans.
Most Latin American refineries have also been running far below capacity, due mainly to technical problems and lack of proper maintenance, meaning throughput is even lower than capacity (see Figure 5). In Venezuela, which has 1.2 million b/d of capacity, throughput is down to 800,000 b/d. Mexico and Ecuador are also struggling to maintain capacity. Overuse of aging infrastructure and poor maintenance have also resulted in costly accidents. A major explosion at Venezuela’s largest refinery destroyed several storage tanks in 2012,20 while fires at Brazilian refineries in Rio de Janeiro and Paraná temporarily halted production in November 2013.21
FIGURE 4 : REFINING CAPACITY BY COUNTRY, 2012 (THOUSAND B/D) 17
Source: Authors’ Calculations based on Inter-American Development Bank and World Bank Data
Latin America also has the world’s most extensive bus rapid transit system, ferrying 19 million passengers per day in 59 cities throughout the region.
Filling the Gap: How the US Energy Boom is Shaping Latin American Refining Markets6
The exception to the refining gap has been the Caribbean. Home to some of the largest refineries in the hemisphere, the region has been a major net exporter of oil products for decades. Between 2000 and 2010, Caribbean net exports of oil products averaged between 280,000 and 550,000 b/d, with nearly all of this output coming from Aruba, Curacao, Trinidad and Tobago, and the US Virgin Islands, which are counted separately from US exports by the EIA.22
The US shale gas revolution has reshaped the landscape for Caribbean refiners, however. Historically, most of their output was bound for the US East Coast. But Caribbean facilities increasingly compete in the United States and other markets with growing exports from Gulf Coast refineries that run on cheap US natural gas, which can save up to $2 per barrel in operating costs compared to using fuel oil to run refineries.23 Weak profits prompted two fuel-oil powered plants in Aruba and the US Virgin Islands to
close their doors in 2012 and 2013, reducing the Caribbean’s total refining capacity by 45%.24
Other refineries in the region have remained operational thanks largely to financial assistance from PDVSA. Venezuela bought 49% stakes in fuel oil-powered refineries in Jamaica and the Dominican Republic, two of the largest aid recipients under Petrocaribe, helping to avoid closures.25 Venezuela provides energy-poor countries in Central America and the Caribbean with crude oil and refined products under favorable financing conditions through the Petrocaribe alliance – an anchor of Venezuelan foreign policy in the region. With stakes in Caribbean refineries, PDVSA can continue to ensure delivery of oil products even as Venezuela’s own refineries come under pressure from rising domestic demand and poor maintenance. Following the closure of refineries in the US Virgin Islands and Aruba, PDVSA now has stakes in roughly 70% of the region’s refining capacity.26
However, declining oil production and tight fiscal resources limit Venezuela’s ability to satisfy oil demand in the larger Central American and Caribbean markets or expand oil supplies under Petrocaribe. Moreover, the drop in oil prices has made Petrocaribe less relevant as members’ import bills have declined while the financing terms are less favorable when oil prices are lower. Refinery closures in the Caribbean
The US shale gas revolution has reshaped the landscape for
Caribbean refiners. Refinery closures in the Caribbean open
up new opportunities for increasing US exports to the region.
5,000
5,500
6,000
6,500
7,000
7,500
8,000
8,500
9,000
2003 2004 2005 2006 2007 2008 2009 2010 2011 2012 2013
REFINERY CAPACITY REFINERY THROUGHPUTS CONSUMPTION
FIGURE 5 : OIL CONSUMPTION AND REFINERY CAPACITY AND THROUGHPUT IN LATIN AMERICA AND THE CARIBBEAN 2003-2013 (THOUSAND B/D)Source: BP Statistical Review of World Energy 2013 and Joint Organizations Data Initiative (JODI) Data
open up new opportunities for increasing US exports to the region. US shipments to the Caribbean increased from 10% of the region’s imports by volume in 2004 to 35% in 2010, highlighting a trend toward increasing reliance on US oil products.27 The surge in US oil product exports to Latin America creates opportunities for the United States to bolster its own allies in the region.
ENERGY WORKING PAPER | MARCH 2015
Filling the Gap: How the US Energy Boom is Shaping Latin American Refining Markets 7
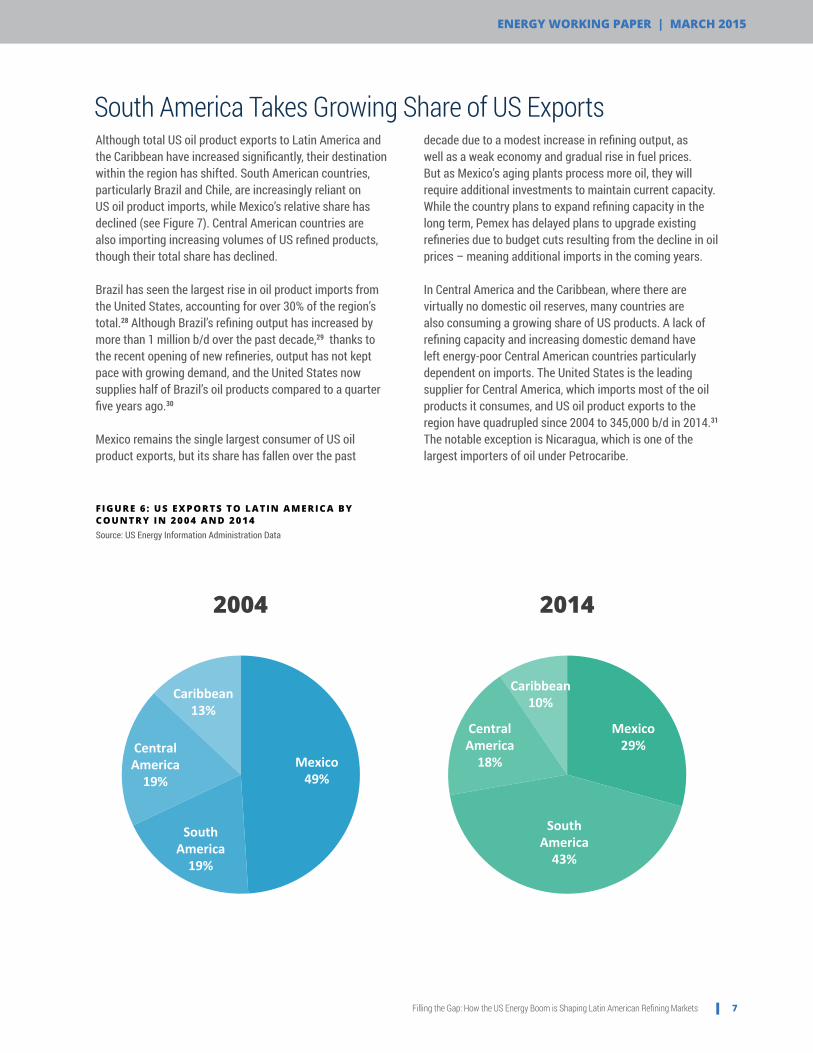
South America Takes Growing Share of US ExportsAlthough total US oil product exports to Latin America and the Caribbean have increased significantly, their destination within the region has shifted. South American countries, particularly Brazil and Chile, are increasingly reliant on US oil product imports, while Mexico’s relative share has declined (see Figure 7). Central American countries are also importing increasing volumes of US refined products, though their total share has declined.
Brazil has seen the largest rise in oil product imports from the United States, accounting for over 30% of the region’s total.28 Although Brazil’s refining output has increased by more than 1 million b/d over the past decade,29 thanks to the recent opening of new refineries, output has not kept pace with growing demand, and the United States now supplies half of Brazil’s oil products compared to a quarter five years ago.30
Mexico remains the single largest consumer of US oil product exports, but its share has fallen over the past
decade due to a modest increase in refining output, as well as a weak economy and gradual rise in fuel prices. But as Mexico’s aging plants process more oil, they will require additional investments to maintain current capacity. While the country plans to expand refining capacity in the long term, Pemex has delayed plans to upgrade existing refineries due to budget cuts resulting from the decline in oil prices – meaning additional imports in the coming years.
In Central America and the Caribbean, where there are virtually no domestic oil reserves, many countries are also consuming a growing share of US products. A lack of refining capacity and increasing domestic demand have left energy-poor Central American countries particularly dependent on imports. The United States is the leading supplier for Central America, which imports most of the oil products it consumes, and US oil product exports to the region have quadrupled since 2004 to 345,000 b/d in 2014.31 The notable exception is Nicaragua, which is one of the largest importers of oil under Petrocaribe.
Mexico 49%
South America 19%
Central America 19%
Caribbean 13%
2004
Mexico 29%
South America 43%
Central America 18%
Caribbean 10%
2014
FIGURE 6 : US EXPORTS TO LATIN AMERICA BY COUNTRY IN 2004 AND 2014Source: US Energy Information Administration Data
Filling the Gap: How the US Energy Boom is Shaping Latin American Refining Markets8
US Exports Are Buoyed By Surging Demand For Transportation FuelsThe types of finished products flowing to Latin America and the Caribbean have also changed substantially as US exports have expanded. Rapidly growing exports of transportation fuels, particularly diesel and gasoline, have steadily displaced the share of fuel oil, which is used mainly for heating, power generation, and industry.32 In Brazil, diesel demand is driven by its use in trucks; as the main means for transporting goods across the country, trucks consume roughly half of Brazil’s vehicle fuel.33 The use of diesel in Brazilian ethanol plants and irrigation pumps for agricultural production is also driving demand. In Mexico, US regulations implemented in 2006 mandating the use of ultra-low sulfur diesel in many cross-border trucks contributed to the quadrupling of US exports of low-sulfur distillates to Mexico between 2009 and 2013.34
US gasoline shipments to Latin America have also risen, nearly tripling over the past decade.35 Mexico remains the single largest market for gasoline, taking in over 90% of US gasoline shipments to Latin America between 2000 and 2008, thanks to its proximity to US refineries. US gasoline exports to other Latin American countries have also grown. Rising car ownership in Central America has propelled gasoline import growth of more than 500% since 2008 in Costa Rica, Guatemala, and Panama, though recent mandates for ethanol blending could help moderate motor fuel consumption.36 In South America, capacity constraints have led countries that were once self-sufficient in refining, such as Brazil, Ecuador, and Venezuela, to import small but increasing amounts of gasoline.37 In the short term, fuel from India and other countries appears to have filled most of this gap,38 but greater imports of US gasoline could be on the horizon as demand grows.
Demand for fuel oil, in contrast, has dropped, in part due to changing patterns of electricity generation in the hemisphere.39 The percentage of oil products consumed by the electricity sector has decreased over the past decade as countries seek to increase the share of cleaner natural gas, hydropower, and renewable sources in the matrix.40 Much of US fuel oil is destined for Central America and the Caribbean, where it competes with Venezuelan exports attractively financed under Petrocaribe.
Plans to Expand Refining Capacity Could Ease Long Term ConstraintsPlans to upgrade and build new refineries throughout Latin America could ease tight supply conditions over the next decade. In Brazil, two new plants under construction are near completion, while another two are planned. Petrobras intends to add some 1 million b/d of additional refining capacity by 2020 to become self-sufficient in refining. Colombia’s Ecopetrol plans to reopen its refinery in Cartagena – which was temporarily shut down during the expansion – at double its previous capacity. And Ecuador’s planned Pacific Refinery could produce 200,000 to 300,000 b/d. Mexico, in contrast, has delayed its refining expansion plans until after 2020.
Combined projections would suggest that Latin America will increase its refining capacity by over 2 million b/d, while oil demand is expected to grow by about 1 million b/d to 9.9 million b/d in 2020.41 Thus, if all of the proposed refineries are built by 2020, the region’s refining capacity will surpass its demand, closing the gap that has contributed to the boom in US imports in recent years.
However, given the region’s history of failing to meet refining expansion plans, it is unlikely that all of these projects will come online on schedule, and imports from the United States could remain steady or further increase. In a recent study entitled Tipping the Scale: Latin America Refined Product Markets to 2020, ESAI Energy finds that Latin American and Caribbean refiners will add only 620,000 b/d to refining capacity through the end of the decade.42 According to the study, the expansions will be led by two new refineries in Brazil -- Petrobras’ 230,000 b/d RNEST refinery at Abreu e Lima and the 165,000 b/d first phase of COMPERJ in Rio de Janeiro – as well as Ecopetrol’s 165,000 b/d replacement unit in Cartagena, Colombia.
Given the region’s history of failing to meet refining expansion plans, it is unlikely that all of these projects will come online on schedule, and imports from the United States could remain steady or further increase.

ENERGY SECURITY BENEFITS Building new refineries can provide energy security and improved trade balances by reducing reliance on imports. Oil producers that are self-sufficient in refining capacity will be less vulnerable to supply shocks and price fluctuations.
CONCLUSIONLooking ahead, the trend of rising US oil product exports to Latin America is likely to continue but will depend on multiple factors, including US oil demand and export policies as well as refining capacity and oil demand in Latin America. US oil product exports are expected to grow amid a modest decline in domestic demand over the next two decades. This decline will be led by a sharp decrease in gasoline consumption due to improved vehicle efficiency and changing driving patterns. Meanwhile, refining capacity in Latin America is likely to increase but not enough to meet additional demand. Brazil and Colombia will move toward self-sufficiency in refining capacity, while the gap in other countries, such as Venezuela and Mexico, is expected to grow.
To boost supply of refined oil products, Latin American countries should consider adding refining capacity to meet growing demand. But downstream planning is complex and must take into account multiple factors. Refineries often take 5-10 years to complete, so countries must decide today if they want additional capacity in place over the next decade. Three key factors will drive the decision to expand refining capacity:
LOCAL INVESTMENT Constructing refineries -- while costly for state oil companies (and ultimately tax payers) that foot the bill -- brings billions of dollars in investment and jobs for the local economy. This benefit was Brazil’s main rationale for planning three new refineries in the poor northeastern region of the country even though domestic demand is centered in the more populous southeast.
US CRUDE EXPORT POLICYLatin American governments are currently benefitting from surplus US refining capacity that allows them to delay costly downstream investments. And new refineries in the region will struggle to compete with those in the United States. Lifting the US crude export ban would rebalance the market and make it easier for refiners in Latin America and elsewhere to compete. Although the outlook on this decision remains uncertain, there are signs of increasing political support in the United States to reverse the crude export ban.
1
2
3

To close the refining gap, Latin American policymakers should also look to curb demand by erasing fuel subsidies, raising fuel economy standards and upgrading existing refineries, and promoting alternative fuels:
Reversing subsidies is a notoriously difficult move politically. But some countries, such as Brazil and Argentina, have been under increasing economic pressure to reduce the burden of subsidies, particularly when oil prices were around $100 per barrel. The recent decline in oil prices offers an opportunity. Policymakers should cut subsidies while global oil prices are low and consumers will not be affected, and leave market-based rates in place as oil prices rise in the future.
Fuel economy standards also have a tremendous impact on demand, as the US experience demonstrates. Vehicle efficiency standards and fuel quality vary widely by country and by region within countries, but Latin America’s overall record is poor. Only Mexico has enacted obligatory fuel economy standards. Latin America should impose fuel economy standards similar to those in the United States and other developed countries. Upgrading refineries to improve efficiency also significantly reduces oil consumption and improves fuel quality.
Promoting alternative transportation, such as electric and natural gas vehicles, and better public transportation systems, would also curtail oil demand while reducing climate emissions and pollution. Latin America’s abundance of hydropower and natural gas create a unique opportunity to supply a cleaner transportation system. Policymakers can strengthen regulatory and fiscal incentives in order to promote the widespread use of alternative transportation.
1
2
3

ENERGY WORKING PAPER | MARCH 2015
Filling the Gap: How the US Energy Boom is Shaping Latin American Refining Markets 11
FOOTNOTES
1. US Energy Information Administration
2. US Energy Information Administration
3. US Energy Information Administration
4. US Energy Information Administration
5. US Energy Information Administration
6. US Energy Information Administration, Annual Energy Outlook 2014
7. US Energy Information Administration
8. Authors’ calculations, based on JODI and EIA data
9. Organization of Petroleum Exporting Countries (OPEC), 2013 World Oil Outlook
10. Nick Miroff, “For Venezuela, the magic land of cheap gas, a big hike” The Washington Post, 19 January 2014.
11. World Bank
12. Authors’ calculations, based on data from the Organization for Economic Cooperation and Development (OECD), Inventory of Estimated Budgetary Support and Tax Expenditures for Fossil Fuels 2013 and World Bank data
13. Comisión Nacional de Energía de Chile Estadísticas
14. IIASA GEA Model Database: http://www.iiasa.ac.at/web-apps/ene/geadb/dsd?Action=htmlpage&page=about#intro
15. http://www.ngvjournal.com/ngv-statistics-2/
16. Joint Organizations Data Initiative (JODI)
17. The estimates in this figure do not account for temporary closures related to the expansion or retrofit of facilities in countries including Colombia, Costa Rica, and Mexico. Countries with less than 20,000 b/d of refining capacity, such as Paraguay and Suriname, are also not depicted.
18. Noé Cruz Serrano, “Pemex no construirá refinería en Tula” El Universal, 2 November 2013
19. Paul Kiernan and William Connor, “Petrobras Net Profit Falls 20%” The Wall Street Journal, 8 August 2014
20. “A tragedy foretold: A fatal refinery blast will not help Hugo Chávez” The Economist, 1 September 2012
21. Jeff Fick, “Industrial Accidents Test Brazil Fuel Plan” The Wall Street Journal, 6 January 2014
22. US Energy Information Administration
23. “Valero’s Aruba closure deepens Atlantic refinery woes” Reuters, 19 March 2012
24. Authors’ calculations, based on US Energy Information Administration data
25. Petróleos de Venezuela, Informe de Gestión Anual 2013
26. Authors’ calculations, based on US Energy Information Administration data
27. US Energy Information Administration
28. Joint Organizations Data Initiative (JODI)
29. US Energy Information Administration
30. US Energy Information Administration
31. US Energy Information Administration
32. Joint Organizations Data Initiative (JODI)
33. Rachel Hogg, “Bosch: Brazil – land of cars” Automotive World, 31 March 2014
34. US Energy Information Administration
35. US Energy Information Administration
36. BP Global, BP Statistical Review of World Energy 2014
37. Joint Organizations Data Initiative (JODI)
38. Jeb Blout, “Analysis: Petrobras fuel woes make Brazil dependent on U.S., India” Reuters, 22 January 2014
39. Joint Organizations Data Initiative (JODI)
40. Inter-American Development Bank Energy Innovation Center Data. The percentage of oil products used has decreased from 14% in 2000 to 11% in 2011, the latest year on record.
41. Organization of Petroleum Exporting Countries (OPEC), 2013 World Oil Outlook.
42. ESAI Energy, Tipping the Scale: Latin America Refined Product Markets to 2020

www.thedialogue.org


![Filling the Talent Gap [case study]](https://static.fdocuments.net/doc/165x107/54634bc9af79597c138b4dc3/filling-the-talent-gap-case-study.jpg)