Fig. 22-2 American RevolutionFrench RevolutionU.S. Civil War 1900 1850 1800 1750 1795 1809 1798 1830...
34
Fig. 22-2 American Revolution French Revolution U.S. Civil War 1900 1850 1800 1750 1795 1809 1798 1830 1831–1836 1837 1859 1837 1844 1858 The Origin of Species is published. Wallace sends his hypothesis to Darwi Darwin begins his notebooks. Darwin writes essay on descent with modifica Darwin travels around the world on HMS Beagle. Malthus publishes “Essay on the Principle of Population.” Lyell publishes Principles of Geology. Lamarck publishes his hypothesis of evolution. Hutton proposes his theory of gradualism. Linnaeus (classification) Cuvier (fossils, extinction) Malthus (population limits) Lamarck (species can change) Hutton (gradual geologic change) Lyell (modern geology) Darwin (evolution, natural selection) Wallace (evolution, natural selection) Evolution Unit Lecture Part I Ch 22,23 Theory: fact based
-
Upload
diane-bell -
Category
Documents
-
view
216 -
download
1
Transcript of Fig. 22-2 American RevolutionFrench RevolutionU.S. Civil War 1900 1850 1800 1750 1795 1809 1798 1830...

Fig. 22-2
American Revolution French Revolution U.S. Civil War1900185018001750
1795
1809
1798
18301831–1836
1837
1859
18371844
1858The Origin of Species is published.Wallace sends his hypothesis to Darwin.
Darwin begins his notebooks.Darwin writes essay on descent with modification.
Darwin travels around the world on HMS Beagle.
Malthus publishes “Essay on the Principle of Population.”
Lyell publishes Principles of Geology.
Lamarck publishes his hypothesis of evolution.
Hutton proposes his theory of gradualism.
Linnaeus (classification)
Cuvier (fossils, extinction)Malthus (population limits)
Lamarck (species can change)
Hutton (gradual geologic change)
Lyell (modern geology)
Darwin (evolution, natural selection)
Wallace (evolution, natural selection)
Evolution Unit Lecture Part I Ch 22,23
Theory: fact based

Darwin’s proposed mechanism, natural selection, explained the observable patterns in evolution
* artificial selection• Observation #1: Members of a
population often vary greatly in their traits (snails)
• Observation #2: Traits are inherited from parents to offspring
• Observation #3: All species are capable of producing more offspring than their environment can support (puffball fungus)
• Observation #4: Owing to the lack of food or other resources, many of these offspring do not survive.
• Inference #1: Individuals whose inherited traits give them a higher probability of surviving and reproducing in a given environment tend to leave more offspring that other individuals.
• Inference #2 This unequal ability of individuals to survive and reproduce will lead to the accumulation of favorable traits in the population over generations.

Fig. 22-10

Fig. 22-11
Sporecloud
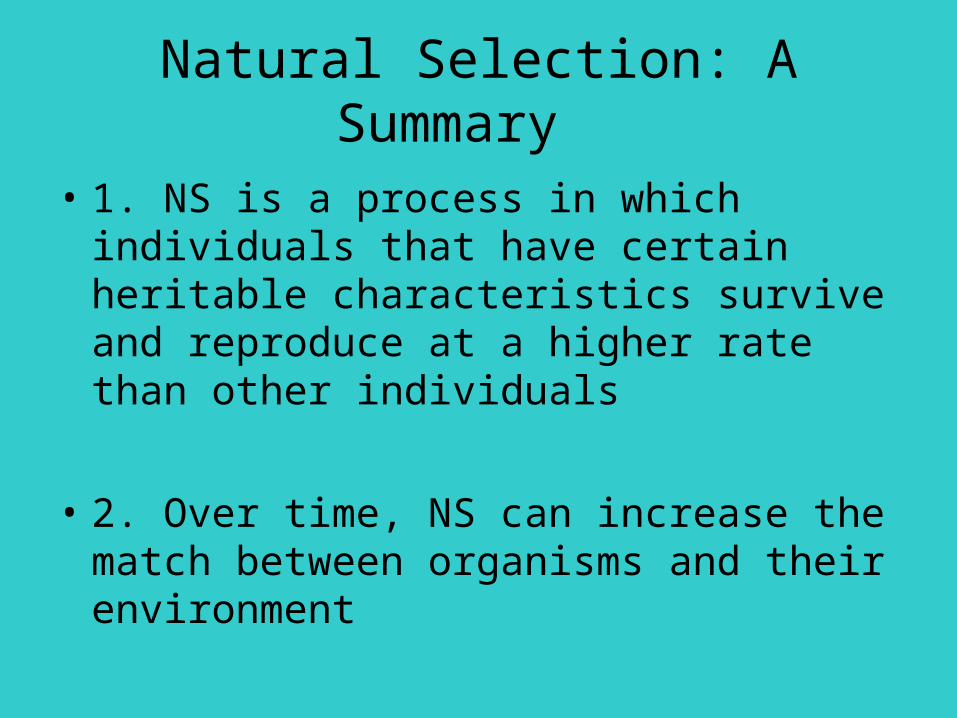
Natural Selection: A Summary
• 1. NS is a process in which individuals that have certain heritable characteristics survive and reproduce at a higher rate than other individuals
• 2. Over time, NS can increase the match between organisms and their environment

Fig. 22-12
(b) A stick mantid in Africa
(a) A flower mantid in Malaysia

• 3. If an environment changes, or if individuals move to a new environment, NS may result in adaptation to these new conditions, sometimes giving rise to new species in the process
• “INDIVIDUALS DO NOT EVOLVE!”
• POPULATIONS EVOLVE OVER TIME

Fig. 22-13
Predator: Killifish; preysmainly on juvenileguppies (which do notexpress the color genes)
Guppies: Adult males havebrighter colors than thosein “pike-cichlid pools”
Experimentaltransplant ofguppies
Pools withkillifish,but noguppies priorto transplant
Predator: Pike-cichlid; preys mainly on adult guppies
Guppies: Adult males are more drab in colorthan those in “killifish pools”
Sourcepopulation
Transplantedpopulation
Sourcepopulation
Transplantedpopulation
Nu
mb
er o
fco
lore
d s
po
ts
Are
a o
f co
lore
dsp
ots
(m
m2 )
1212
1010
88
6 6
4 4
22
0 0
RESULTS
EXPERIMENT

Evidence
• Direct observations of Evolutionary Change (predation, HIV resistance)
• Fossil record (transition fossils)
• Homology (common ancestry)embryology, vestigial structures and genetic: hox genes (gene conservation)
• Biogeography

Fig. 22-15
Bristolia insolens
Bristolia bristolensis
Bristolia harringtoni
Bristolia mohavensis
Latham Shale dig site, SanBernardino County, California
Dep
th (
met
ers
)
0
2
4
6
8
10
12
14
16
18
1
2
3
3
1
2
44

Fig. 22-16
(a) Pakicetus (terrestrial)
(b) Rhodocetus (predominantly aquatic)
(c) Dorudon (fully aquatic)
Pelvis andhind limb
Pelvis andhind limb
(d) Balaena (recent whale ancestor)

Fig. 22-17
Humerus
Radius
Ulna
Carpals
Metacarpals
Phalanges
Human WhaleCat Bat

Fig. 22-18
Human embryoChick embryo (LM)
Pharyngealpouches
Post-analtail

Fig. 22-19
Hawks andother birds
Ostriches
Crocodiles
Lizardsand snakes
Amphibians
Mammals
Lungfishes
Tetrapod limbs
Amnion
Feathers
Homologouscharacteristic
Branch point(common ancestor)
Te
trapo
ds
Am
nio
tes
Bird
s
6
5
4
3
2
1

Fig. 22-20
Sugarglider
Flyingsquirrel
AUSTRALIA
NORTHAMERICA

EVOLUTION OF POPULATIONS Adapt, Migrate or Die
• Genes Mutate
• Individuals are selected
• Populations Evolve

Fig. 23-3
13.17 19 XX10.169.128.11
1 2.4 3.14 5.18 6 7.15
9.10
1 2.19
11.12 13.17 15.18
3.8 4.16 5.14 6.7
XX
Geographic variation
Genetic variation

Fig. 23-4
1.0
0.8
0.6
0.4
0.2
046 44 42 40 38 36 34 32 30
GeorgiaWarm (21°C)
Latitude (°N)
MaineCold (6°C)
Ldh
-B b
alle
le f
req
uen
cyCLINE

How do we measure evolution?
• The smallest unit of measure is an allele.
• Variation in a population – measured at the nucleotide level or gene level
Hardy Weinberg equation• * can be used to test whether a population
is evolving
• * 2 independent mathematicians

Fig. 23-6
Frequencies of alleles
Alleles in the population
Gametes produced
Each egg: Each sperm:
80%chance
80%chance
20%chance
20%chance
q = frequency of
p = frequency of
CR allele = 0.8
CW allele = 0.2

Fig. 23-7-1
SpermCR
(80%)
CW
(20 %
)
80% CR ( p = 0.8)
CW (20%)
20% CW (q = 0.2)
16% ( pq) CRCW
4% (q2) CW CW
CR
(80%
)
64% ( p2) CRCR
16% (qp) CRCW
Eg
gs

Fig. 23-7-2
Gametes of this generation:
64% CRCR, 32% CRCW, and 4% CWCW
64% CR + 16% CR = 80% CR = 0.8 = p
4% CW + 16% CW = 20% CW = 0.2 = q

Fig. 23-7-3
Gametes of this generation:
64% CRCR, 32% CRCW, and 4% CWCW
64% CR + 16% CR = 80% CR = 0.8 = p
4% CW + 16% CW = 20% CW = 0.2 = q
64% CRCR, 32% CRCW, and 4% CWCW plants
Genotypes in the next generation:

Fig. 23-7-4
Gametes of this generation:
64% CR CR, 32% CR CW, and 4% CW CW
64% CR + 16% CR = 80% CR = 0.8 = p
4% CW + 16% CW = 20% CW = 0.2 = q
64% CR CR, 32% CR CW, and 4% CW CW plants
Genotypes in the next generation:
SpermCR
(80%)
CW
( 20%
)
80% CR ( p = 0.8)
CW (20%)
20% CW (q = 0.2)
16% ( pq) CR CW
4% (q2) CW CW
CR
(80%
)
64% ( p2) CR CR
16% (qp) CR CW
Eg
gs

HW continued
• Significant change = allele frequency shift = evolving population
• Consider PKU 1 in 10000 in the US • If all assumptions hold for PKU then the
frequency of individuals in the population born with PKU will correspond to q2
• PKU demonstrates that harmful recessive alleles can be concealed in a pop due to heterozygotes
• PKU cannot breakdown phenylalanine

5 conditions for HW
• 1. No mutations:
• 2. Random mating
• 3. No natural selection
• 4. Extremely large population size
• 5. No gene flow

Fig. 23-8-3
Generation 1
CW CW
CR CR
CR CW
CR CR
CR CR
CR CR
CR CR
CR CW
CR CW
CR CW
p (frequency of CR) = 0.7q (frequency of CW
) = 0.3
Generation 2
CR CWCR CW
CR CW
CR CW
CW CW
CW CW
CW CW
CR CR
CR CR
CR CR
p = 0.5q = 0.5
Generation 3p = 1.0q = 0.0
CR CR
CR CR
CR CR
CR CR
CR CR
CR CR CR CR
CR CR
CR CR CR CR
Natural selection, genetic drift and gene flow can alter allele frequencies in a pop

Genetic drift
• Chance events can cause allele frequencies to fluctuate unpredictably from one generation to the next especially in small population

Founder’s Effect
• When a few individuals become isolated from a larger population, this smaller group may establish a new population whose gene pools differs from the source population

Fig. 23-9
Originalpopulation
Bottleneckingevent
Survivingpopulation

Fig. 23-10
Numberof allelesper locus
Rangeof greaterprairiechicken
Pre-bottleneck(Illinois, 1820)
Post-bottleneck(Illinois, 1993)
Minnesota, 1998 (no bottleneck)
Nebraska, 1998 (no bottleneck)
Kansas, 1998 (no bottleneck)
Illinois
1930–1960s
1993
Location Populationsize
Percentageof eggshatched
1,000–25,000
<50
750,000
75,000–200,000
4,000
5.2
3.7
93
<50
5.8
5.8
5.3 85
96
99
(a)
(b)

Effects of Genetic Drift
• 1. Significant in small populations
• 2. Can Cause allele frequencies to change at random
• 3. can lead to a loss of genetic variation within populations
• 4. can cause harmful alleles to become fixed

Fig. 23-11

Gene Flow
• The transfer of alleles into or out of a population due to the movement of fertile individuals or their gametes
• Gene flow tends to reduce the genetic differences between populations
• Single population with a common gene pool