
Fig 1. Hancock Gorge catchment (Blue: BIF; Yellow: Tertiary...
150
Marandoo Phase II spring and gorge water assessment Page 21 of 40 evaporation from Hancock gorge is minimal. Fig 1. Hancock Gorge catchment (Blue: BIF; Yellow: Tertiary colluvium after 1:250,000 geology map). Photo 1. Groundwater discharge to streambed in Tertiary colluvium upstream of Hancock Gorge. Flow continues downstream to support pool levels in Hancock Gorge. Vegetation comprising bulrushes & Cajuputs indicative of the relative permanency of pools. References de la Hunty, L. E., 1965, 1:250,000 Mt Bruce Geological Sheet; Geological Survey of Western Australia,.
Transcript of Fig 1. Hancock Gorge catchment (Blue: BIF; Yellow: Tertiary...
Marandoo Phase II spring and gorge water assessment Page 21 of 40
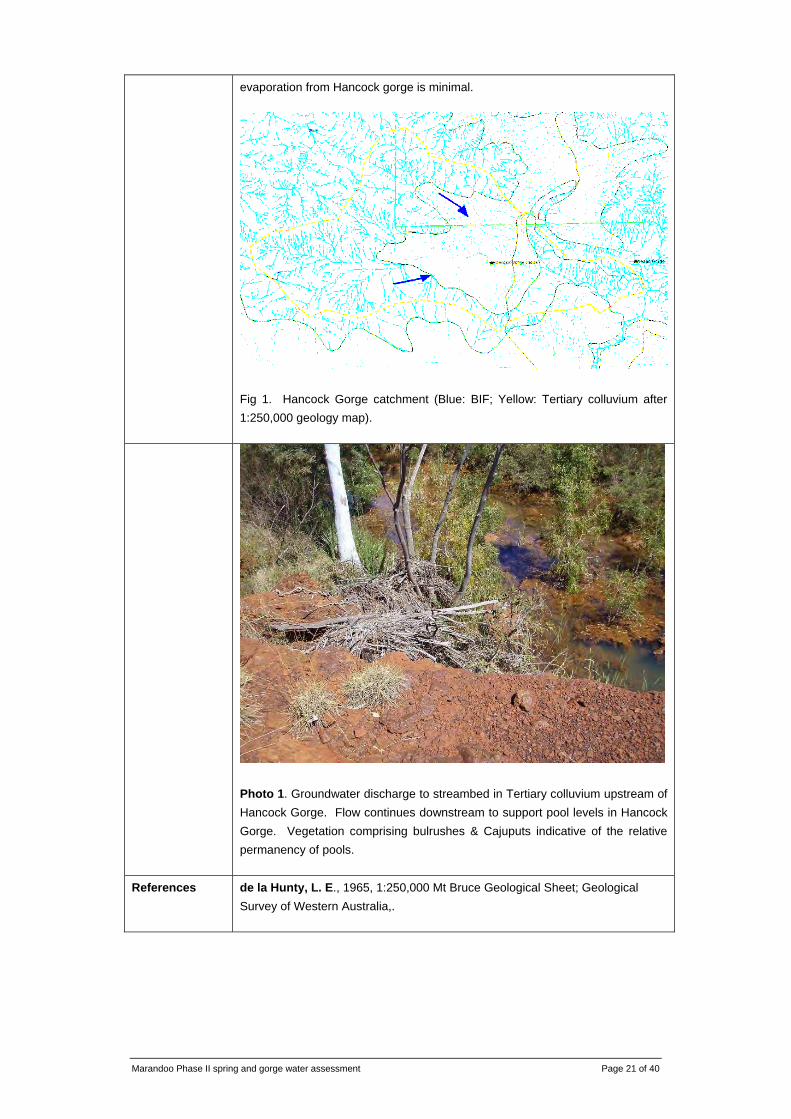
evaporation from Hancock gorge is minimal.
Fig 1. Hancock Gorge catchment (Blue: BIF; Yellow: Tertiary colluvium after 1:250,000 geology map).
Photo 1. Groundwater discharge to streambed in Tertiary colluvium upstream of Hancock Gorge. Flow continues downstream to support pool levels in Hancock Gorge. Vegetation comprising bulrushes & Cajuputs indicative of the relative permanency of pools.
References de la Hunty, L. E., 1965, 1:250,000 Mt Bruce Geological Sheet; Geological Survey of Western Australia,.

Marandoo Phase II spring and gorge water assessment Page 22 of 40
Site Weano Gorge
Classification Perennial groundwater fed gorge pools
GDA94 Reference
50,631,440mE, 7,526,410mN (approximate mid point of gorge)
Location Weano Gorge is located within Karijini National Park to the north of Hancock Gorge approximately 35km north of Marandoo mine site on small a tributary drainage line of the Fortescue River catchment.
RL of groundwater discharge
~660m RL from 1:50,000 digital topography & based on observation of surface pools in gorge in Oct 2007.
Catchment Area Approximately 12km2
Water Quality Water quality measured on 26th July was 270 to 300uS/cm; pH varied between 7.1 and 7.6. Temperature varied between 7 and 11oC.
Measured Flow Surface flow was measured in July 2008 at between 330 to 440m3/day; increasing downstream. Groundwater was seen to be issuing from bedding planes within the gorge upstream from Handrail Pool.
Geological Setting
Gorge cuts through Joffre Member of the Brockman Iron Formation, Hamersley Group. Minor Tertiary colluvium cover occurs at top of catchment outside of gorge. Even at the upper sections of ponded surface water in the gorge rested on bedded Joffre Member.
Hydrogeological Setting
Weano Gorge surface catchment lies north and west of the gorge. Groundwater appears to seep from the Joffre Member within the gorge itself and no upstream seepage from Tertiary colluvium was observed. This maybe confirmed from the relative consistent water chemistry measured along the length of the gorge in comparison to that seen in Hancock Gorge, where upstream water is derived from Tertiary outcrop. Thus the surface pools in Weano Gorge are dependent on groundwater flow in the Hamersley Group (Joffre Member).
Limited groundwater level information is available to estimate throughflow or discharge. However, surface flow in the upper reaches of Weano Gorge was limited to small volumes (<1L/sec) between large, still pools, and increased downstream marginally to roughly 5L/sec.
Testing the age of the groundwater may indicate whether seepage from the bedded Joffre Member is related to modern catchment recharge (given its limited extent).

Marandoo Phase II spring and gorge water assessment Page 23 of 40
Photo 1. Groundwater discharge to gorge through the Joffre Member. Carbonate encrustation indicate groundwater levels up to 500mm higher than October 2007. Most carbonate precipitation occurs on the north wall of the gorge only.
References de la Hunty, L. E., 1965, 1:250,000 Mt Bruce Geological Sheet; Geological Survey of Western Australia,.

Marandoo Phase II spring and gorge water assessment Page 24 of 40
Site Joffre Falls
Classification Perennial groundwater fed falls and gorge pool
GDA94 Reference
50,630,561mE, 7,523,332mN (approximate local of falls)
Location Joffre Falls is located within Karijini National Park approximately 30km north northeast of Marandoo mine site on small a tributary to the Fortescue River catchment.
RL of groundwater discharge
~680m RL from 1:50,000 digital topography & based on observation of surface flow upstream of the falls in Oct 2007.
Catchment Area Approximately 520 km2
Water Quality Water quality was measured using a field EC and pH meter in July 2008. EC at the head of the falls was 2200uS/cm. Nearby stranded pools contained salt encrustations and EC was 8700uS/cm. The pH was 8.1 and water temperature was 6oC. Upstream of the falls in a ponded pool adjacent to a road culvert, water EC was 1220uS/cm, indicating the impact of evapotranspiration along tributaries to Joffre falls on the large catchment plan to the north.
Measured Flow Surface flow was measured using a hand held flow probe at the top of the falls at 1.6ML/day.
Geological Setting
The Falls cascade over the Joffre Member of the Brockman Iron Formation, Hamersley Group. Upstream of the falls comprises a catchment of Tertiary Colluvium and scree shedding from large highland areas of basement rock (Brockman Iron Formation) with peaks over 1000m AHD.
Hydrogeological Setting
Joffre Falls surface catchment lies due south of the falls and comprises Tertiary colluvium with north draining ephemeral tributaries fed by run-off from the Mt Oxer group of peaks. Bulrushes and disconnected small surface pools occur in an unnamed north trending tributary that drains the Tertiary colluvium roughly 2 km upstream from the falls. At the falls, no obvious groundwater contribution is evident from the Joffre Member (see photo 1.).
The surface catchment comprises roughly 520km2 of which approximately 30% comprises Tertiary colluvium. Limited bore information is available for observing groundwater levels or making throughflow calculations. Recharge to the Tertiary colluvium assuming 1% of annual rainfall of 450mm equates to 1.9ML/day, slightly more than measured surface flow of 1.6ML/day. Water quality along the surface tributary indicated loss from the system through evapotranspiration was common. Water quality over the Joffre Falls is significantly higher in TDS and pH than other gorge waters. The presence of mature E. Vitrix and E. Camaldulensis contributing to increased salinity through evapotranspiration.
Marandoo Phase II spring and gorge water assessment Page 25 of 40
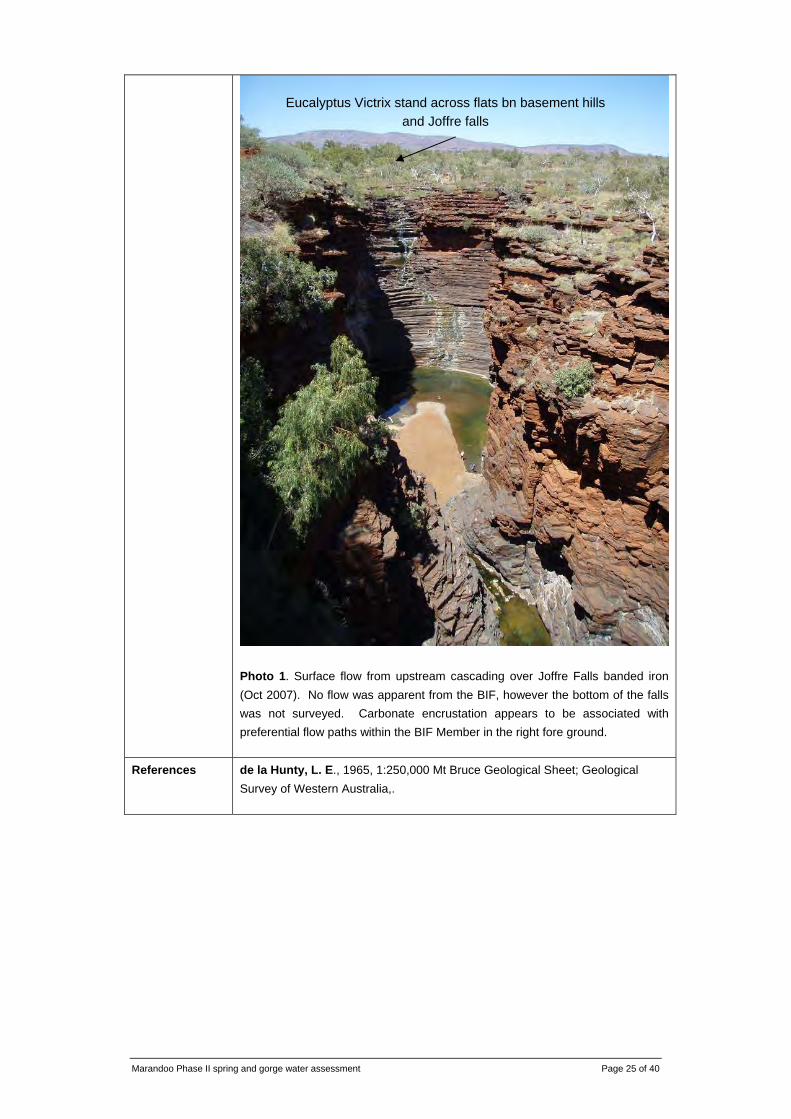
Photo 1. Surface flow from upstream cascading over Joffre Falls banded iron (Oct 2007). No flow was apparent from the BIF, however the bottom of the falls was not surveyed. Carbonate encrustation appears to be associated with preferential flow paths within the BIF Member in the right fore ground.
References de la Hunty, L. E., 1965, 1:250,000 Mt Bruce Geological Sheet; Geological Survey of Western Australia,.
Eucalyptus Victrix stand across flats bn basement hills and Joffre falls

Marandoo Phase II spring and gorge water assessment Page 26 of 40
Site Kalamina Gorge
Classification Perennial groundwater fed falls and gorge pools
GDA94 Reference
50,644,288mE, 7,520,320mN (approximate local of falls)
Location Kalamina Gorge is located within Karijini National Park approximately 37km northeast of Marandoo mine site on small a tributary to the Fortescue River catchment.
RL of groundwater discharge
~675m RL from 1:50,000 digital topography & based on observation of discontinuous surface pools approximately 1.7km upstream of the falls in Oct 2007.
Catchment Area Upstream catchment area of approximately 24 km2 for the falls alone (downstream gorge catchment is greater)
Water Quality Water quality was measured in three locations along Kalamina tributary and gorge. At the upstream extent of surface flow EC was in the order of 1200uS/cm and pH of 7.4. Downstream at the falls the surface water EC was 800uS/cm, and specifically, groundwater seeping from bedded basement had an EC of 580uS/cm and pH of 8.2. It was also 3oC warmer than the collective flow over the falls.
Measured Flow Surface flow was measured using a hand held flow probe at the top of the falls at 1.1ML/day.
Geological Setting
The Kalamina Falls cascade over the Joffre Member of the Brockman Iron Formation, Hamersley Group. Upstream of the falls comprises an upper catchment of Brockman Iron Formation with a valley fill of Tertiary Colluvium and scree shedding from the basement areas. Note there are several other tributaries to Kalamina Gorge with larger catchment areas downstream of the falls.
Hydrogeological Setting
Kalamina Falls surface catchment lies due south of the falls and comprises Tertiary colluvium with north draining ephemeral tributaries fed by run-off from Brockman Iron Formation basement. Bulrushes and Cajuputs occur roughly 1.7km upstream in an unnamed north trending tributary that drains the Tertiary colluvium. At the falls, minor groundwater contribution appears evident from preferential pathways in the banded iron formation.
The surface catchment comprises roughly 24km2 of which approximately 50% comprises Tertiary colluvium. Limited bore information is available for observing groundwater levels or making throughflow calculations. Recharge to the Tertiary colluvium assuming 1% of annual rainfall of 450mm equates to 300m3/d. Discharge over the falls was measured at roughly 3 times this rate in July 2008.
The change in water quality downstream indicates a contribution of groundwater from bedded basement rock with significantly lower conductivity groundwater

Marandoo Phase II spring and gorge water assessment Page 27 of 40
than the upstream Tertiary groundwater.
There are significantly larger pools downstream of the falls surrounded by phreatophytic vegetation indicating perennial surface water in the pools and continued contribution from basement groundwater to surface flow.
Photo 1. Phreatophytes occur approximately 1.7km upstream from falls at approximately 643,500mE, 7,519,200mN. Elevation 680m RL.
Photo 2. Surface flow from upstream cascading over Kalamina Falls banded iron outcrop (Oct 2007). Minor flow was apparent from the BIF, associated with preferential flow paths within the BIF Member in the right fore ground. Approximate elevation of falls 650m RL.

Marandoo Phase II spring and gorge water assessment Page 28 of 40
References de la Hunty, L. E., 1965, 1:250,000 Mt Bruce Geological Sheet; Geological Survey of Western Australia,.

Marandoo Phase II spring and gorge water assessment Page 29 of 40
Site Dales Gorge; Circular Pool
Classification Perennial groundwater fed falls and pools
GDA94 Reference
50,660,692mE, 7,513,758mN (approximate local of pool)
Location Circular Pool is located within Karijini National Park approximately 48km northeast of Marandoo mine site on small a tributary to the Fortescue River catchment.
RL of groundwater discharge
~635m RL from 1:50,000 digital topography & based on observation of water flow at Circular Pool in Oct 2007.
Catchment Area Upstream catchment area of approximately 65 km2
Water Quality Water quality of groundwater seeping from bedded Dales Gorge Member was 580uS/cm and between 19 and 21oC. The pH was around 6.5. However in the pool itself the pH was 7.8 and water temperature was 11oC. The pH continued to increase and the temperature decrease along the flow path within the gorge to 8.4 and 6oC, respectively.
Measured Flow Surface flow was measured using a hand held flow probe at the top of the falls at 1.3ML/day.
Geological Setting
Circular pool occurs at the base of a ~80m gorge. The walls of the gorge are primarily cemented geothitic Tertiary laterite detritus with basal coarse pebble conglomerate. A thin weathered profile (1-2m) exists within in-situ Dales Gorge Member. At the contact with fresh Dales Gorge Member groundwater issues from the walls and cascades into a permanent pool.
Hydrogeological Setting
Circular Pool and falls surface catchment lies due north and comprises Tertiary colluvium, lucastrine clay, pisolitic and limonitic detritus filling south draining ephemeral tributaries fed by run-off from ridges formed by Brockman Iron Formation basement. There is no perennial surface flow in the area above the gorge; groundwater runs along the contact between the weathered and fresh Dales Gorge Member (see Photo 1.) and cascades from the wall of the gorge into a pool.
Owing to the multiple sources of water dripping out of the wall rock it is difficult to determine groundwater through flow into the pool, but estimates in the order of 8-10L/sec are reasonable orders of magnitude. Surface flow from the pool continues to the south for a short distance with continued contribution from groundwater through preferential pathways is evidenced along the gorge. The gorge links up with Fortescue Falls tributary before trending eastwards and then north northeast to the Fortescue valley.
The EC of surface water remains relatively consistent along the length of the
Marandoo Phase II spring and gorge water assessment Page 30 of 40
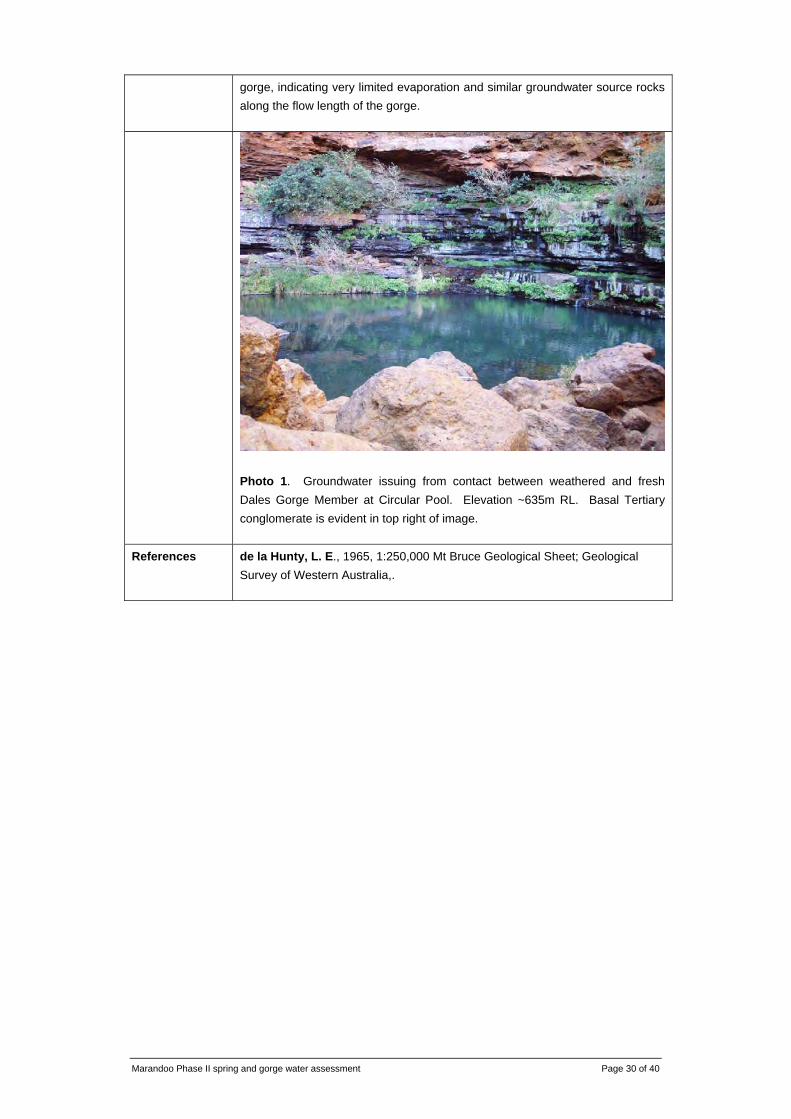
gorge, indicating very limited evaporation and similar groundwater source rocks along the flow length of the gorge.
Photo 1. Groundwater issuing from contact between weathered and fresh Dales Gorge Member at Circular Pool. Elevation ~635m RL. Basal Tertiary conglomerate is evident in top right of image.
References de la Hunty, L. E., 1965, 1:250,000 Mt Bruce Geological Sheet; Geological Survey of Western Australia,.
Marandoo Phase II spring and gorge water assessment Page 31 of 40
Site Fortescue Falls & Fern Pool
Classification Perennial groundwater fed gorge water.
GDA94 Reference
50,659,238mE, 7,513,496mN (approximate local of pool)
Location Fern Pool is located within Karijini National Park approximately 47km northeast of Marandoo mine site on small a tributary to the Fortescue River catchment.
RL of groundwater discharge
~655m RL from 1:50,000 digital topography & based on the mapped location of the most upstream pool within the gorge. Fern Pool was not visited in October 2007.
Catchment Area Upstream catchment area of approximately 340 km2
Water Quality Water quality was measured at Fern pool and on several places downstream of Fortescue Falls. Water EC was consistently around 780uS/cm.
Measured Flow Surface flow was measured just upstream of Fortescue Falls and further downstream using a handheld flow probe. Flow increased downstream from 3.4 to 4.6ML/day.
Geological Setting
Fern Pool lies in the western extension of Dales Gorge. The gorge cuts through the Dales Gorge Member and up stream through Tertiary detrital. This gorge contains numerous pools along its length commencing at approximately 655m RL. They feed a tributary that eventual links up with another coming from Circular Pool.
Hydrogeological Setting
Similar to Circular Pool and falls, the surface catchment comprises Tertiary colluvium, lucastrine clay, pisolitic and limonitic detritus filling north draining ephemeral tributaries fed by run-off from ridges formed by Brockman Iron Formation basement. It is unknown if there is perennial surface water in the catchment upstream of the gorge (i.e. in Tertiary sediments) as no access above Fern Pool was possible (Heritage constraint). However the elevated EC in comparison to Circular Pool; where definitively there is no Tertiary groundwater from observation, would indicate that groundwater is near surface and evapotranspiration from the watertable is greater here than the Circular Pool tributary, i.e. groundwater is derived from tertiary rocks.
Surface flow increases along the flow length of the gorge indicating the stream is a gaining tributary and the main source of groundwater is from the bedded Dales Gorge Member of the Brockman Iron Formation downstream of Fern Pool. Form measured surface flow the gorge gains approximately 1.6ML/per km downstream of the falls.
Marandoo Phase II spring and gorge water assessment Page 32 of 40
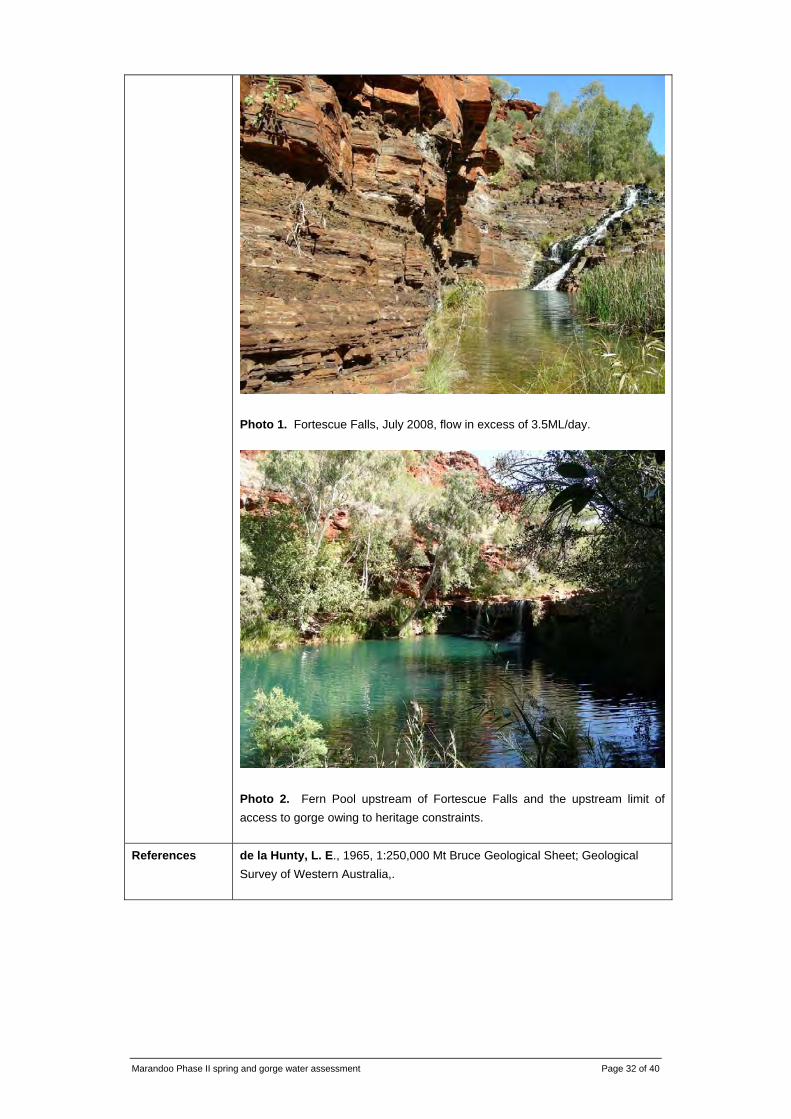
Photo 1. Fortescue Falls, July 2008, flow in excess of 3.5ML/day.
Photo 2. Fern Pool upstream of Fortescue Falls and the upstream limit of access to gorge owing to heritage constraints.
References de la Hunty, L. E., 1965, 1:250,000 Mt Bruce Geological Sheet; Geological Survey of Western Australia,.
Marandoo Phase II spring and gorge water assessment Page 33 of 40
Site Banjima Pool
Classification Perennial pool.
GDA94 Reference
50,623,207mE, 7,490,600mN (approximate local of pool)
Location Banjima Pool is located within Karijini National Park approximately 9.5km southeast of Marandoo mine site on small a tributary to the Turee Creek Catchment (Ashburton).
RL of groundwater discharge
~705m RL from 1:50,000 digital topography & based on the site visit in August 2007.
Catchment Area Upstream catchment area of approximately <1 km2
Water Quality Water quality was measured in July 2008 and was very similar to rainwater quality with an EC of just 118uS/cm. The pH was 7 and temperature 10oC.
Measured Flow Nil, stagnant pool, green algae was present within pool.
Geological Setting
Banjima Pool occurs within a creek line high in the Turee Creek catchment south of the Marandoo ridge. The pool is formed downstream of a resistant band of cemented Tertiary laterite that has been ground out by large boulders during high rainfall events.
Hydrogeological Setting
Banjima pool is more than likely supported by local rainfall and is not dependent on underlying groundwater levels that are estimated at least 25 – 30m below ground level. The very narrow steep sided walls of the pool limit exposure to sunlight and evaporation of pool water is minimal, as evidenced by the very low electrical conductivity. Algae was evident in the pool in August 2007.

Marandoo Phase II spring and gorge water assessment Page 34 of 40
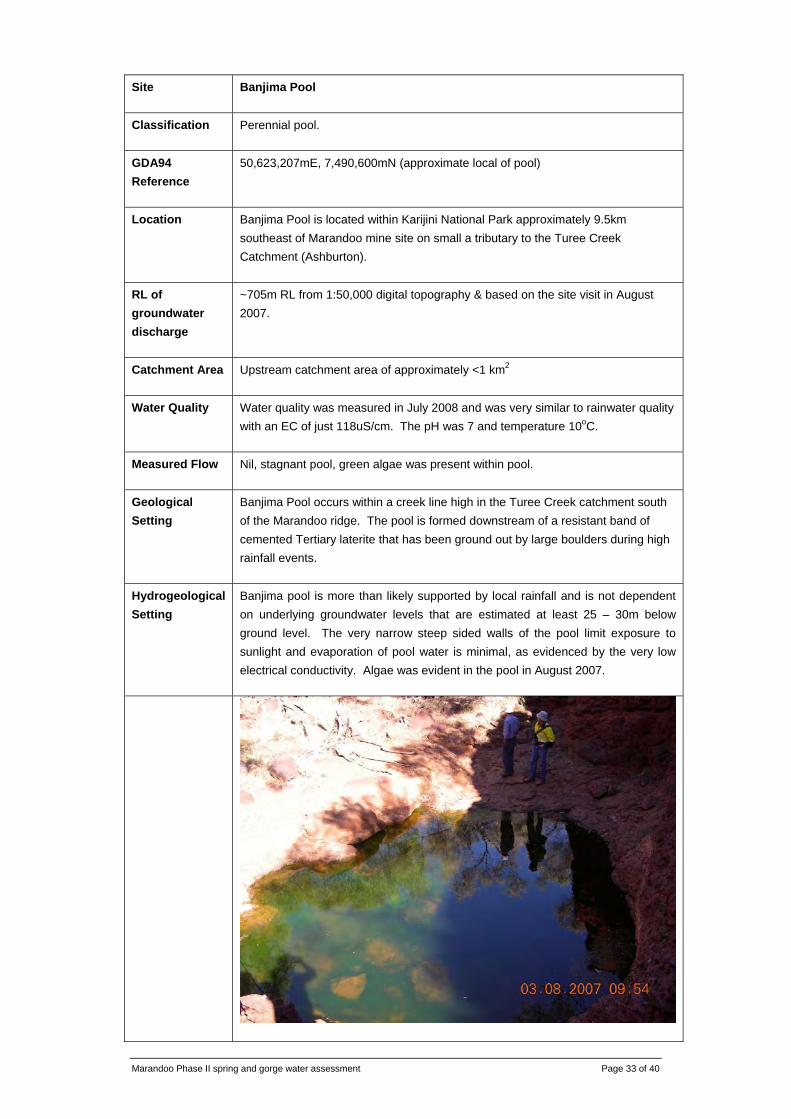
Photo 1. Looking downstream (south) at laterite outcrop and demonstrating the shading effect of the narrow gorge. Green algae and grinding boulders apparent within pool. No groundwater dependent vegetation is associated with pool which is incised into the peneplain by ~6m.
References
Marandoo Phase II spring and gorge water assessment Page 35 of 40
Site Mindthi Spring
Classification Semi-permanent river pool.
GDA94 Reference
50,629,719mE, 7,486,482mN (approximate local of pool)
Location Mindthi Spring is located within Karijini National Park approximately 18km southeast of Marandoo mine site on small a tributary to the Turee Creek catchment (Ashburton).
RL of groundwater discharge
~678m RL from 1:50,000 digital topography & based on a site visit to the pool in January 2008.
Catchment Area
Upstream catchment area of approximately 375 km2, excluding Mt Bruce flats, which is assumed (when it over flows) to also run southeast into the Turee Creek catchment.
Water Quality Water quality was measured in July 2008 and EC was 1630uS/cm. The pH was 7.6 and the water temperature was 17oC, indicative of a groundwater source/origin.
Measured Flow Nil, stagnant pool
Geological Setting
Mindthi Spring lies in a gravel river bed shaded by fronds of a large date palm. The pool occurs on the active down cutting side of a bend in an ephemeral drainage line. The riverbed cuts through weakly cemented gravely clay with ironstone pebbles and calcrete. The calcrete extends back to the west comprising some ~6km2. The upper catchment basement rocks comprise volcanic, shale, dolomite and BIF of the Hamersley Group; and Tertiary detritus of alluvium, colluvium and calcrete.
Hydrogeological Setting
The pool occurs within course gravel of an ephemeral drainage line. The riverbed is incised less than 2m into surrounding plain. Spring waterlevels have been measured intermittently since 2003 and demonstrate a variation of less than 0.8m in dry periods (pool is assumed inaccessible in the wet, see Figure 1). The potential cause for the spring in justapostion is the calcrete to the west of the drainage line that has been dissected by the creek on its eastern extent. The calcrete is most likely saturated, as evidenced by the extensive salt crust along the western banks of the creek (Photo 2) and high water temperature of the pool. Groundwater flow through the calcrete discharges to Mindthi Spring (see Figure 2) as the topographic low point owing to creek bed erosion. The surrounding vegetation comprises sparse E. Camaldelensis with some reeds and exotic date palms that are not necessarily groundwater dependent; but indicative of a shallow watertable (~5m below surface). Given the evidence presented and relative level of the pool being coincident with the regional groundwater level across Mt Bruce Flats, Mindthi Spring is more than likely groundwater dependent. It is unlikely more springs/pools occur downstream from Mindthi Spring.

Marandoo Phase II spring and gorge water assessment Page 36 of 40
Mindthi Spring
676
676.5
677
677.5
678
Dec-01 Dec-02 Dec-03 Dec-04 Dec-05 Dec-06 Dec-07 Dec-08
Wat
erle
vel m
RL
Figure 1. Spring level monitoring at Mindthi Spring (conducted by Tom Price Technical Services). Water levels are generally higher in cooler months.
Figure 2. Postulated mode of occurrence for Mindthi Spring justapositioned at the eastern extent of a large calcrete body dissected by the creek drainage.

Marandoo Phase II spring and gorge water assessment Page 37 of 40
Photo 1. Location of Mindthi Spring adjacent to large clump of date palms in river gravel bed. In January 2008 the pool water was well shaded by palm fronds (~1m2 in surface area, ~50cms deep).
Photo 2. Extent of salt crust on west facing wall downstream of Mindthi Spring in July 2008. Drainage line abuts edge of low calcrete peneplain dissected by the drainage.

Marandoo Phase II spring and gorge water assessment Page 38 of 40
Photo 3. Waterlevel in July 2008, pool appears larger (the date palm fronds had been hacked away in between visits?)
References

Marandoo Phase II spring and gorge water assessment Page 39 of 40
Appendix B. Groundwater surface water major ions
mg/L
Sample ID and date
Electrical Conductivity
uS/cm pH Field Temp
oC Cl SO4 HCO3 Ca Mg K Na Si Br
Total dissolved
solids Banjima 23/07/2008 118 7.00 9.7 8 15 40 10 3 3.8 5.1 1.8 1.1 85
Weano #1 25/07/2008 260.4 7.08 11.8 48 3 40 3.3 9.2 3.8 26 21 0.2 133
Hancock #2 25/07/2008 274 7.77 11.7 57 2 40 4.3 9.4 3.7 30 17 <0.2 146
Hancock #3 25/07/2008 276.7 7.88 8.7 57 1 40 4.1 9.1 3.6 29 16 <0.2 144
Weano #2 25/07/2008 297 7.69 8.2 52 2 55 4.3 11 3.9 28 21 <0.2 156
Weano #3 25/07/2008 304 7.65 11.9 52 2 60 4.6 12 4 29 20 <0.2 164
Hancock Stream 25/07/2008 409 6.84 8 51 4 35 2.9 8.1 2.8 29 15 0.2 133
Kalamina #3 24/07/2008 556 8.24 15 61 8 160 19 23 7.8 42 33 0.6 321
Circular Pool 24/07/2008 583 6.78 21.7 90 20 100 20 22 6.7 32 26 1.6 291
Fern Pool 24/07/2008 786 7.80 14.9 110 25 180 30 27 8.9 48 26 2.2 429
Hamersley #1 23/07/2008 870 8.40 15.9 67 52 300 52 40 9.3 36 15 <0.2 556
Kalamina #2 24/07/2008 893 8.30 11.7 110 4 260 35 33 15 100 32 0.3 557
Joffre #2 25/07/2008 1211 7.34 6.7 190 29 260 63 64 14 60 34 <0.2 680
Kalamina #1 24/07/2008 1216 7.44 14.1 150 8 400 21 27 14 160 20 0.5 780
Mindthi 23/07/2008 1628 7.60 17 230 120 340 64 63 17 110 15 <0.2 944
Windmill #1 25/07/2008 2132 6.58 21.8 430 78 240 110 110 22 95 35 <0.2 1085
Joffre Falls #1 25/07/2008 2217 8.13 6.4 430 61 340 94 110 23 140 27 <0.2 1198
Code:
Rainwater Tertiary sediment derived spring or gorge water BIF derived spring or gorge water Mixed source spring or gorge water

Marandoo Phase II spring and gorge water assessment Page 40 of 40

RTT0807/061/08 MATTISKE CONSULTING PTY LTD
CONDITION AND COMPOSITION OF FLORA AND VEGETATION
ALONG CREEK SYSTEMS NEAR DISCHARGE POINTS
MARANDOO, PHASE 2
Prepared for:
Rio Tinto
Prepared by:
Mattiske Consulting Pty Ltd
August 2008
MATTISKE CONSULTING PTY LTD
Vegetation Monitoring
RTT0807/061/08 MATTISKE CONSULTING PTY LTD
TABLE OF CONTENTS
Page
1. SUMMARY 1
2. INTRODUCTION 22.1 Climate 22.2 Flora and Vegetation 2
3. OBJECTIVES 3
4. METHODS 3
5. RESULTS 45.1 Photographic Observations 45.2 Understorey 45.3 Trees 5
6. DISCUSSION 7
7. LIST OF PARTICIPANTS 7
8. ACKNOWLEDGMENTS 7
9. REFERENCES 8
TABLES
1: Location of Transects 1 to 18 on the Creek System west of Mt Bruce (GDA94)
FIGURES
1: Summary of Condition of Eucalyptus sp. (irrespective of species), 20082: Summary of Condition of Eucalyptus victrix, 20083: Summary of Condition of Acacia citrinoviridis, 2008
APPENDICES
A: Photographic Record of Sites along Creeklines, Marandoo, 2008 B: Distribution of Understorey Species on the Marandoo Transects, 2008

Vegetation Monitoring 1.
RTT0807/061/08 MATTISKE CONSULTING PTY LTD
1. SUMMARY
Mattiske Consulting Pty Ltd was commissioned by Rio Tinto to undertake an independent assessment ofthe condition of the flora and vegetation along a creek system west of Mt Bruce, near the proposeddischarge areas associated with the dewatering activities of the Marandoo Phase 2 mining operation.
The following report provides an interim summary of observations and recordings to date on thecondition of the flora and vegetation along the valley system. As such it is intended to provide asummary of the current condition of the vegetation and the pattern of species distributions of theunderstorey species within the creek systems at a range of sites associated with discharge points and aseries of control or reference sites (due to their location on different flow lines and downstream from thedischarge points) that are not likely to be impacted by the proposed discharge activities).
The creek systems and plains west of Mt Bruce are dominated by woodlands of Acacia citrinoviridis withoccasional patches of Eucalyptus victrix and Eucalyptus xerothermica (MA01). The lack of Eucalyptuscamaldulensis and Melaleuca argentea on the transects reflected the lack of major flowlines and thedominance of wattle species on the floodplains and creek systems. The vegetation along the creeksystems is determined by the surface, sub-surface, and groundwater hydrology and soil conditions.Therefore it is predictable that if these local hydrological conditions change then the vegetation would beexpected to respond.
The condition of the vegetation transects varied slightly. In general the occurrence of fires in recentdecades has influenced the condition of the tree species and the condition of many of the older trees.Other influences have included the presence of the invasive Buffel Grass in many of the sites.
The current condition of the dominant trees (Eucalyptus victrix and Acacia citrinoviridis) reflected someslight stress in many of the tree stems; however there was an absence of recent deaths in the main treespecies. The majority of the dead trees appear to have resulted from recent fires. Many of these deadtrees were being replaced by younger seedlings. The understorey results reflect local differences in thedistribution of species along the respective transects and as a result when combined with quantitativecover data (collected during the survey) the understorey data as collected provides base summary of thedistribution and condition of the species at the respective sites.
The tree and understorey data as collected provides additional information that can be compared withregional datasets being developed to provide a sound basis for setting criteria to enable the differentiationof seasonal and site specific impacts on the condition of the vegetation in the region. The latter isimportant in setting criteria, as most communities reflect some physiological stress. At this juncture theAcacia citrinoviridis is slightly healthier than the Eucalyptus victrix; however the absence of recentdeaths in the trees tends to reflect the lack of recent changes. There are some dead trees in the transectareas, however many of these deaths appear to have occurred in response to the passage of fires.

Vegetation Monitoring 2.
RTT0807/061/08 MATTISKE CONSULTING PTY LTD
2. INTRODUCTION
Mattiske Consulting Pty Ltd was commissioned by Rio Tinto to undertake an independent assessment ofthe condition of the flora and vegetation along a creek system west of Mt Bruce, near the proposeddischarge areas associated with the dewatering activities of the Marandoo mining operation, Figure 1.This monitoring program supplements earlier similar studies in the Marandoo area and will be used toestablished a monitoring program near the proposed discharge points.
The following report provides an interim summary of observations and recordings to date on the flora andvegetation along the valley system. As such it provides a summary of the current condition of thevegetation and the pattern of species distributions of the understorey species within the creek system.
2.1 Climate
Beard (1990) described the climate of the Pilbara region as arid tropical with summer rain, with an annualprecipitation of 250-300mm. Beard noted the local influence of topography on the rainfall recordings.
Updated climatic data from the Bureau of Meteorology (2008) for Tom Price indicates that the rainfalloccurs in the months from December to June. The mean annual rainfall at Newman is 310.2mm andWittenoom (north of Karijini National Park) is 458.8mm.
The other major influence on the flora and vegetation in the Pilbara Region is the heavy rains that occurduring and immediately following cyclonic events. Cyclones develop off the northwest coast and oftencross the coastline between Karratha and Port Headland, then pass inland resulting in cyclonic rainfallevents inland.
Average maximum summer temperatures are generally between 30oC and 50oC and winter temperaturesbetween 20oC and 30oC. In this climatic area, the evaporation greatly exceeds the mean annual rainfall.
2.2 Flora and Vegetation
The work in July 2008 concentrated on recording the condition of the tree and understorey species on 18transects (Appendix A). Particular attention was placed on the condition of the perennial species as thesespecies are more likely to reflect longer term changes in local hydrological site conditions, Appendix B.
The creek systems near Mt Bruce occur within the Pilbara Bioregion as defined in the InterimBiogeographical Regionalisation for Australia (IBRA) (Thackway and Cresswell 1995 and EnvironmentAustralia 2000). The vegetation along the creek systems near Mt Bruce are dominated by Acaciacitrinoviridis with some patches of Eucalyptus victrix (see Photographs in Appendix A). These areas aresubjected to infrequent flows of up to 1 metre following localised rainfall events or cyclonic events. Theriver bed in this area is a mosaic of coarse sands and alluvial soils.
The vegetation system of the valley systems varies from Open Woodlands of Eucalyptus victrix andAcacia citrinoviridis to shrublands of Acacia pyrifolia and Acacia bivenosa on alluvial flats. Thesecommunities are similar to those highlighted by (Beard, 1975) and Hopkins et al. (2001) for the PilbaraRegion.
The vegetation along the creek systems is determined by the water availability, soil conditions andchannel morphology.
Vegetation Monitoring 3.
RTT0807/061/08 MATTISKE CONSULTING PTY LTD
3. OBJECTIVES
Mattiske Consulting Pty Ltd was commissioned by Rio Tinto to undertake an independent assessment ofthe condition of the flora and vegetation along the creek line systems near the discharge points west of MtBruce, near the Marandoo mining operations.
As part of the flora and vegetation assessment, the specific objectives were to:
• collect and identify the vascular plant species present in the creek systems and adjacentplains;
• review the physiological stress in the vegetation on the creek system through observations,photographic evidence and recordings on the vegetation through the establishment of a seriesof transects for monitoring, if required; and
• submit a report summarizing the findings.
4. METHODS
All plant specimens collected during the field surveys were pressed, dried and fumigated in accordancewith the requirements of the Western Australian Herbarium. The plant species were identified and thencompared with pressed specimens housed at the Western Australian Herbarium. Where appropriate, planttaxonomists with specialist skills were consulted. Nomenclature of the species recorded follows theWestern Australian Herbarium standards (2008a, 2008b).
The conservation status of all species was checked against the most recent Schedules and relevant listsincluding those of the Western Australian Herbarium (2008a, 2008b), Department of Environment andConservation (2008a), Environment Protection and Biodiversity Conservation Act (1999) and theWildlife Conservation Act (1950). Plants of local or regional significance were identified using theirconservation status, locations of previous records (Western Australian Herbarium 2008a, 2008b), andGuidance Statement 51 (Environmental Protection Authority 2004).
A series of 18 transects (a minimum of 50m x 10m wide) were established within the valley creek lineand distributed so that some transects were the near discharge area and some were well beyond thepotential zone of influence (northern transects), Figure 1.
The trees were ranked according to the following scale:H - HealthySS - Slightly StressedS - StressedVS - Very StressedRD - Recent Death (bark present and dead foliage still present on tree)MD - Moderate Death (bark present, fine twigs remaining on branches, leaves/foliage not present)OD -- Old Death (bark may be lost, fine twigs on branches lost and leaves/foliage not present)

Vegetation Monitoring 4.
RTT0807/061/08 MATTISKE CONSULTING PTY LTD
Table 1: Location of Transects 1 to 18 on the Creek System west of Mt Bruce (GDA94)
Start Start Direction End EndTransect NoEasting Northing Degrees Easting Northing
MCPL-MA01 608093 7501016 275 607995 7501045
MCPL-MA02 606347 7500576 55 606388 7500599
MCPL-MA03 606374 7500544 70 606419 7500560
MCPL-MA04 606158 7500976 - 606178 7501025
MCPL-MA05 606200 7500964 21 606222 7501007
MCPL-MA06 607068 7499631 53 607109 7499656
MCPL-MA07 607098 7499563 65 607142 7499578
MCPL-MA08 605592 7505192 68 605628 7505223
MCPL-MA09 605593 7505273 - 605641 7505277
MCPL-MA10 600116 7511010 198 600090 7510916
MCPL-MA11 598986 7513203 34 599041 7513281
MCPL-MA12 598200 7517174 117 598242 7517154
MCPL-MA13 598226 7517223 113 598265 7517197
MCPL-MA14 605030 7501984 138 605058 7501947
MCPL-MA15 604952 7501905 122 604997 7501883
MCPL-MA16 597720 7522420 21 597740 7522467
MCPL-MA17 597682 7522438 39 597715 7522477
MCPL-MA18 605648 7504645 51 605728 7504703
5. RESULTS
5.1 Photographic Observations
The photo-points for the monitoring sites are provided in Appendix A.
The creek systems and plains west of Mt Bruce are dominated by woodlands of Acacia citrinoviridis withoccasional patches of Eucalyptus victrix and Eucalyptus xerothermica (MA01). The lack of Eucalyptuscamaldulensis and Melaleuca argentea and the dominance of wattle species on the floodplains and creeksystems on the transects reflected the lack of major flowlines.
The condition of the vegetation transects varied slightly and this is reflected in the photographs inAppendix A and the data as presented in the tree graphs in the following sections. In general theoccurrence of fires in recent decades has influenced the condition of the tree species and the condition ofmany of the older trees. Other influences have included the presence of the invasive Buffel Grass inmany of the sites.
5.2 Understorey
The distribution of the understorey species along the transects is summarized in Appendix B. Numericaldata on percentage cover alive in the respective 10m x 10m quadrats along the transects were notincluded in this summary, however this data will be used in longer term assessments of trends incondition of the vegetation. This data has been supplied separately to Rio Tinto for future investigations.
No plant taxa as recorded in the assessment areas are gazetted as Declared Rare Flora pursuant tosubsection (2) of section 23F of the Wildlife Conservation Act (1950).
Vegetation Monitoring 5.
RTT0807/061/08 MATTISKE CONSULTING PTY LTD
No plant taxa as recorded in the assessment areas are listed as Threatened pursuant to Schedule 1 of theEnvironment Protection and Biodiversity Conservation Act (1999) was recorded in the surveyed area. NoPriority flora species, as defined by the Department of Environment and Conservation (2008a), wererecorded in the transects as assessed in July 2008.
Therefore if changes result from discharge activities, the conservation status of the species within thevalley system will be minimal.
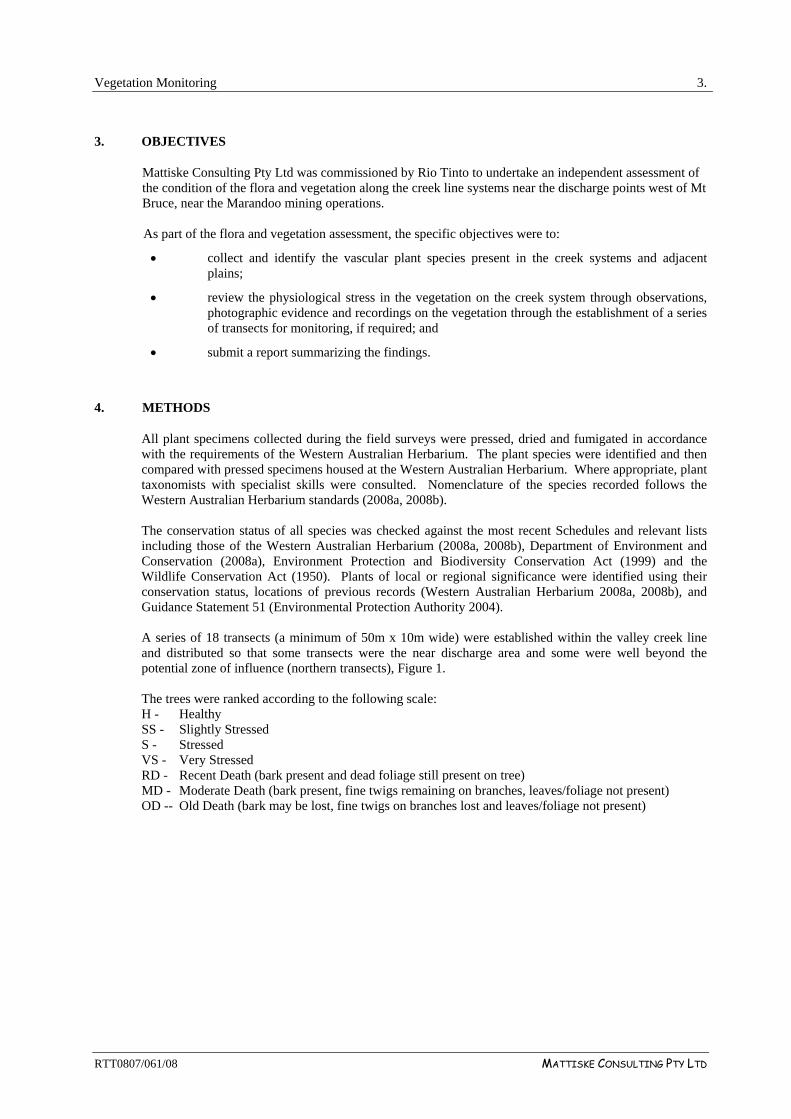
5.3 Trees
The condition of all of the Eucalypt species is summarized in Figure 1. The results indicate that many ofthe tree stems are slightly stressed or stressed and that only a few old deaths were recorded in TransectMA10. It is noteworthy that there are no recent deaths, although there are some sparse or scattered verystressed trees (where the foliage cover has been lost on part of the canopies).
Eucalyptus sp. combined
0
5
10
15
20
25
MA01 MA02 MA03 MA04 MA05 MA06 MA07 MA08 MA09 MA10 MA11 MA12 MA13 MA14 MA15 MA16 MA17 MA18
Site number
Num
ber o
f Tre
e St
ems
Healthy Slight Stressed Stressed Very Stressed Recent Death Moderate Death Old Death
Figure 1: Summary of Condition of Eucalyptus sp. (irrespective of species), 2008
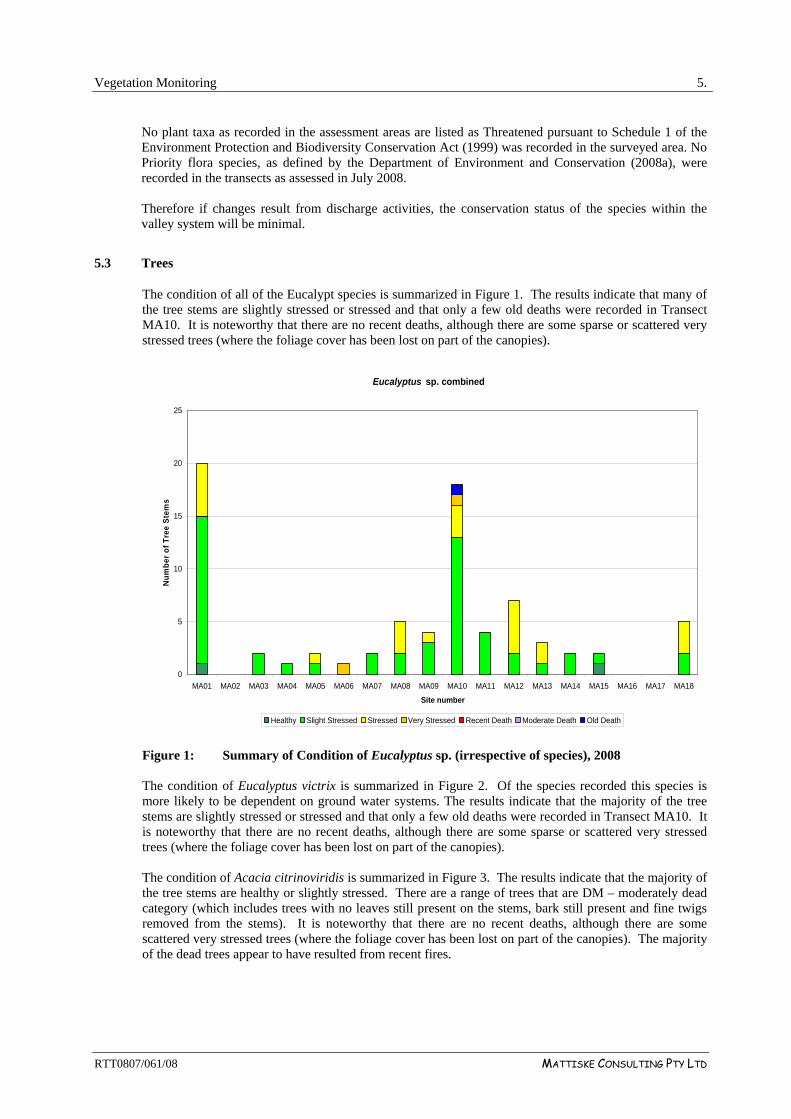
The condition of Eucalyptus victrix is summarized in Figure 2. Of the species recorded this species ismore likely to be dependent on ground water systems. The results indicate that the majority of the treestems are slightly stressed or stressed and that only a few old deaths were recorded in Transect MA10. Itis noteworthy that there are no recent deaths, although there are some sparse or scattered very stressedtrees (where the foliage cover has been lost on part of the canopies).
The condition of Acacia citrinoviridis is summarized in Figure 3. The results indicate that the majority ofthe tree stems are healthy or slightly stressed. There are a range of trees that are DM – moderately deadcategory (which includes trees with no leaves still present on the stems, bark still present and fine twigsremoved from the stems). It is noteworthy that there are no recent deaths, although there are somescattered very stressed trees (where the foliage cover has been lost on part of the canopies). The majorityof the dead trees appear to have resulted from recent fires.
Vegetation Monitoring 6.
RTT0807/061/08 MATTISKE CONSULTING PTY LTD
Eucalyptus victrix
0
2
4
6
8
10
12
14
16
18
20
MA01 MA02 MA03 MA04 MA05 MA06 MA07 MA08 MA09 MA10 MA11 MA12 MA13 MA14 MA15 MA16 MA17 MA18
Site number
Num
ber o
f Tre
e St
ems
Healthy Slight Stressed Stressed Very Stressed Recent Death Moderate Death Old Death
Figure 2: Summary of Condition of Eucalyptus victrix, 2008
Acacia citrinoviridis
0
20
40
60
80
100
120
MA01 MA02 MA03 MA04 MA05 MA06 MA07 MA08 MA09 MA10 MA11 MA12 MA13 MA14 MA15 MA16 MA17 MA18
Site number
Num
ber o
f Tre
e St
ems
Healthy Slight Stressed Stressed Very Stressed Recent Death Moderate Death Old Death
Figure 3: Summary of Condition of Acacia citrinoviridis, 2008

Vegetation Monitoring 7.
RTT0807/061/08 MATTISKE CONSULTING PTY LTD
6. DISCUSSION
The current condition of the dominant trees (Eucalyptus victrix and Acacia citrinoviridis) reflected someslight stress in many of the tree stems; however there was an absence of recent deaths in the main treespecies. The majority of the dead trees appear to have resulted from recent fires. Many of these deadtrees were being replaced by younger seedlings. The understorey results reflect local differences in thedistribution of species along the respective transects and as a result when combined with quantitativecover data (collected during the survey) the understorey data as collected provides base summary of thedistribution and condition of the species at the respective sites.
The tree and understorey data as collected provides additional information that can be compared withregional datasets being developed to provide a sound basis for setting criteria to enable the differentiationof seasonal and site specific impacts on the condition of the vegetation in the region. The latter isimportant in setting criteria, as most communities reflect some physiological stress. At this juncture theAcacia citrinoviridis is slightly healthier than the Eucalyptus victrix; however the absence of recentdeaths in the trees tends to reflect the lack of recent changes. There are some dead trees in the transectareas, however many of these deaths appear to have occurred in response to the passage of fires.
7. LIST OF PARTICIPANTS
The following personnel of Mattiske Consulting Pty Ltd have been involved with this project:
Principal Ecologist: Dr E. M. Mattiske
Ecologists: Mr J SeeMr R BurrowsMr T SleighMs L MaddoxMs C BryanMs R Chesney
8. ACKNOWLEDGMENTS
The author would like to thank the staff of Rio Tinto for assistance with this project.

Vegetation Monitoring 8.
RTT0807/061/08 MATTISKE CONSULTING PTY LTD
9. REFERENCES
Beard, J.S. (1975)Vegetation Survey of Western Australia - Pilbara. Explanatory Notes and Map Sheet 5,1:1000000 series. Vegetation Survey of Western Australia. University of Western AustraliaPress, Nedlands.
Beard, J.S. (1990)Plant Life of Western Australia. Kangaroo Press.
Bureau of Meteorology (2008Climate Averages for specific sites. Publicly available data prepared by the Bureau ofMeteorology, Commonwealth of Australia.http://www.bom.gov.au/climate/averages/tables/ca_wa_names.shtml
Commonwealth of Australia (1999)Environment Protection and Biodiversity Conservation Act 1999.http://www.deh.gov.au/biodiversity/threatened/species/index.html
Department of Agriculture and Food (2008)Declared Plants List. Publicly available list prepared by the Department of Agriculture,Western Australia.
Department of Environment and Conservation (2008)Declared Rare and Priority Flora List. Publicly available list prepared by the Department ofConservation and Land Management, Western Australia.
Department of Environment, Water, Heritage and the Arts (2008) National list of Threatened Species, Ecological Communities and Threatening Processes.Commonwealth of Australia. http://www.environment.gov.au/cgi-bin/forms/sprat/public/publicthreatenedlist.pl?wanted=flora
English, V. and Blyth, J. (1997)Identifying and conserving threatened ecological communities in the South West BotanicalProvince. National Parks and Wildlife and Department of Conservation of Land Management,Western Australia.
English, V. and Blyth, J. (1999)Development and application of procedures to identify and conserve threatened ecologicalcommunities in the South-West Botanical Province of Western Australia. Pacific ConservationBiology, Volume 5, pp 124 – 138.
Environment Australia (2000)Revision of the Interim Biogeographic Regionalisation of Australia (IBRA) and the Developmentof Version 5.1. - Summary Report. Department of Environment and Heritage, Canberra.
Environmental Protection Authority (2004)Guidance for the Assessment of Environmental Factors (in accordance with the EnvironmentalProtection Act 1986) – Terrestrial Flora and Vegetation Surveys for Environmental ImpactAssessment in Western Australia. No. 51, June 2004, Western Australia.
Government of Western Australia (2003)Wildlife Conservation (Rare Flora) Notice 2003http://www.calm.wa.gov.au/plants_animals/watscu/pdf/flora/wildlife_cons_notice_flora2003.pdf
Hopkins, A.J.M., Beeston, G.R, and Shepherd, D.P. (2001)A database on the vegetation of Western Australia. Stage 1. Technical Report Number 251.

Vegetation Monitoring 9.
RTT0807/061/08 MATTISKE CONSULTING PTY LTD
Hussey, B.M.J., Keighery, G.J., Cousens, R.D., Dodd, J. and Lloyd, S.G. (1997)Western Weeds: A guide to the weeds of Western Australia. Plant Protection Society of WesternAustralia (Inc), Western Australia.
Payne, A.L., Van Vreeswyk, A.M.E., Hennig, P. and Leighton, K.A. (2002)Pilbara Ranges Project Rangeland Survey. Agriculture WA (issued November 2004).
Thackway, R. and Cresswell, I.D. (1995)An Interim Biogeographic Regionalisation for Australia: a framework for setting priorities in thenational reserves system cooperative program. Australian Nature Conservation AgencyCanberra.
Western Australian Herbarium (2008a)Florabase. Department of Conservation and Land Management. http://www.calm.wa.gov.au
Western Australian Herbarium (2008b)Max. Department of Conservation and Land Management, Perth.
A12.APPENDIX A: PHOTOGRAPHIC RECORD OF SITES ALONG CREEKLINES, MARANDOO, 2008
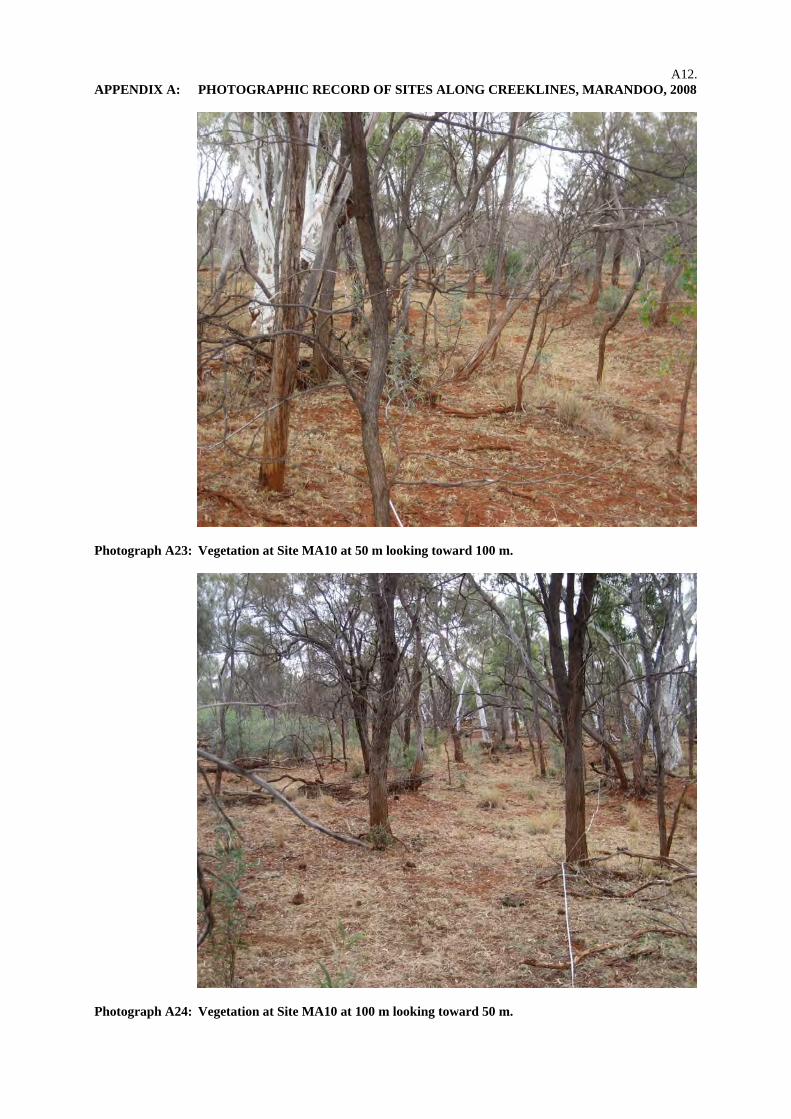
Photograph A23: Vegetation at Site MA10 at 50 m looking toward 100 m.
Photograph A24: Vegetation at Site MA10 at 100 m looking toward 50 m.
A13.APPENDIX A: PHOTOGRAPHIC RECORD OF SITES ALONG CREEKLINES, MARANDOO, 2008
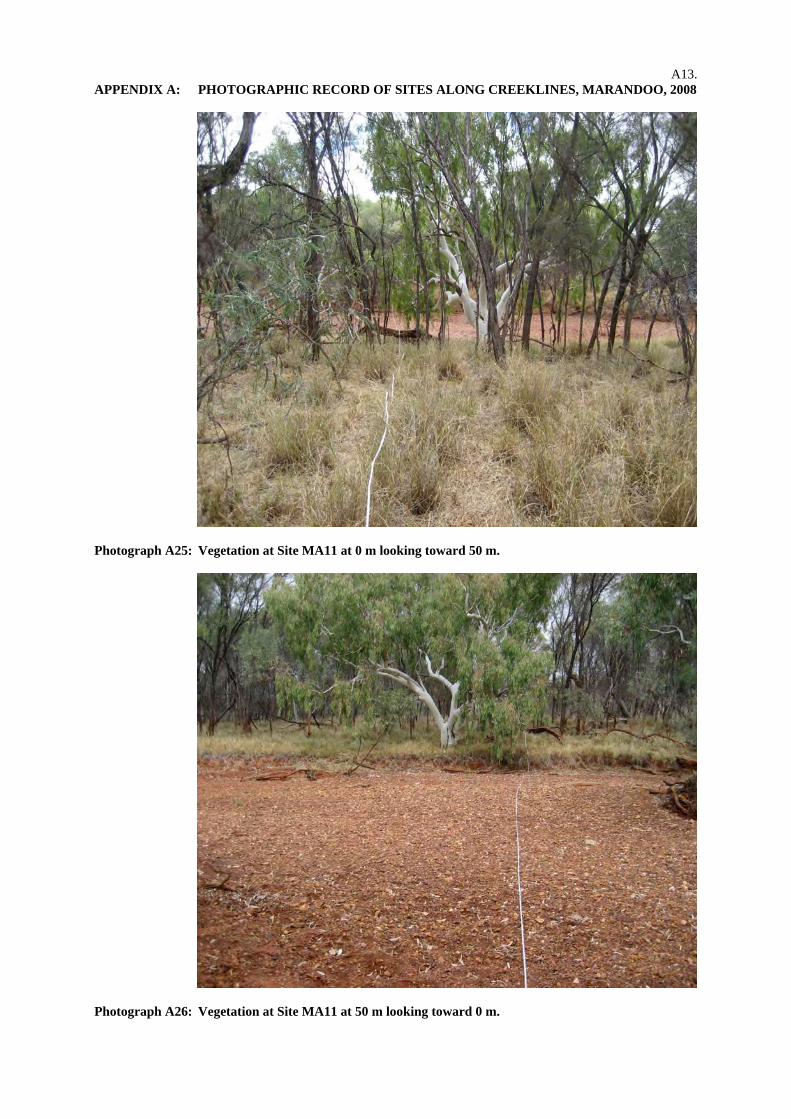
Photograph A25: Vegetation at Site MA11 at 0 m looking toward 50 m.
Photograph A26: Vegetation at Site MA11 at 50 m looking toward 0 m.
A14.APPENDIX A: PHOTOGRAPHIC RECORD OF SITES ALONG CREEKLINES, MARANDOO, 2008
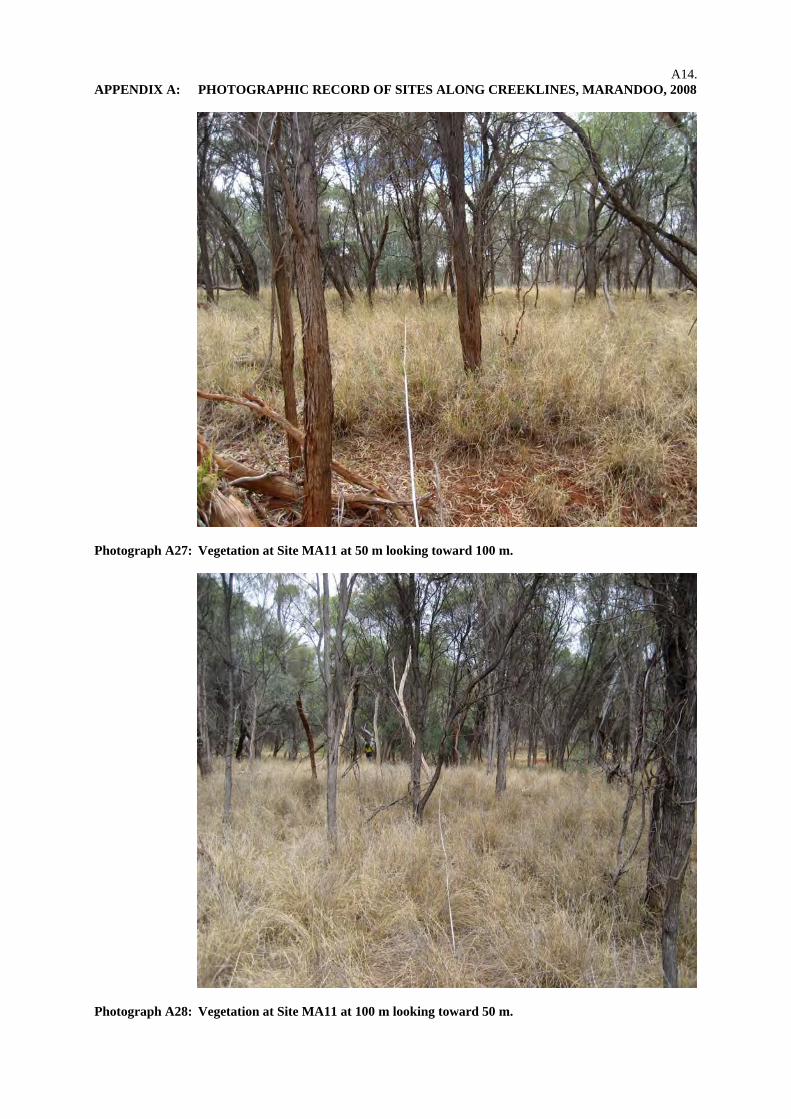
Photograph A27: Vegetation at Site MA11 at 50 m looking toward 100 m.
Photograph A28: Vegetation at Site MA11 at 100 m looking toward 50 m.

A15.APPENDIX A: PHOTOGRAPHIC RECORD OF SITES ALONG CREEKLINES, MARANDOO, 2008
Photograph A29: Vegetation at Site MA12 at 0 m looking toward 50 m.
Photograph A30: Vegetation at Site MA12 at 50 m looking toward 0 m.

A16.APPENDIX A: PHOTOGRAPHIC RECORD OF SITES ALONG CREEKLINES, MARANDOO, 2008
Photograph A31: Vegetation at Site MA13 at 0 m looking toward 50 m.
Photograph A32: Vegetation at Site MA13 at 50 m looking toward 0 m.
A17.APPENDIX A: PHOTOGRAPHIC RECORD OF SITES ALONG CREEKLINES, MARANDOO, 2008
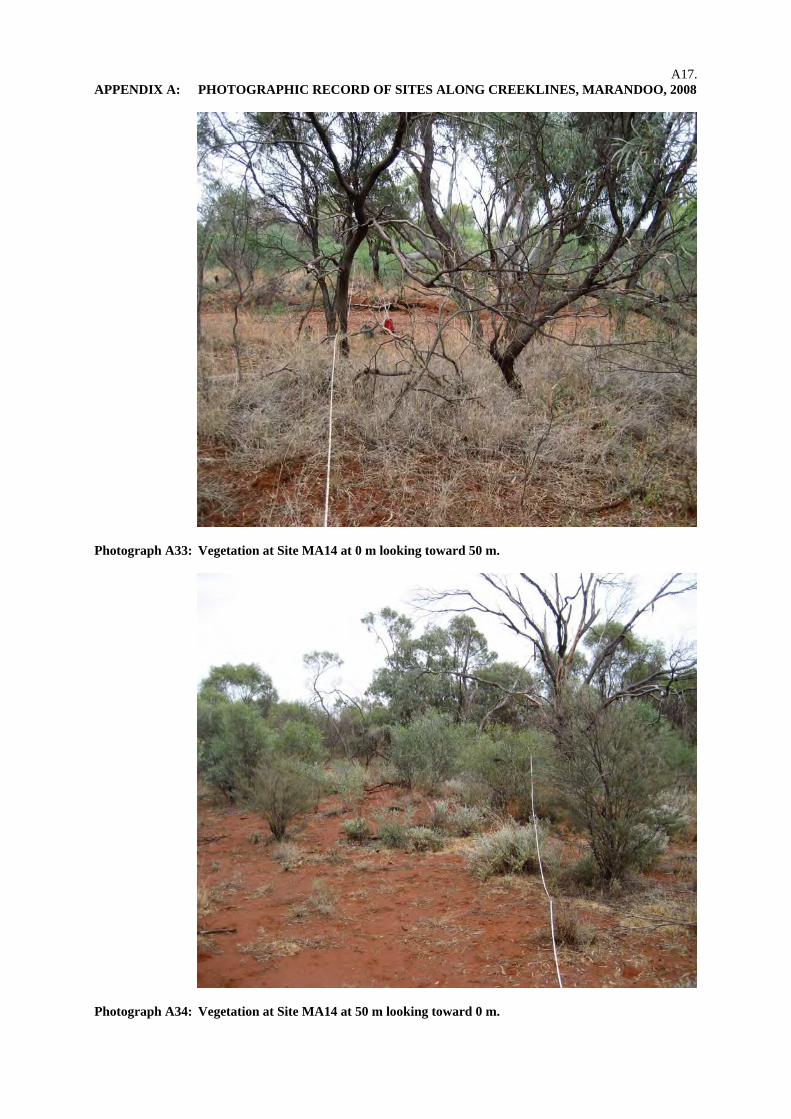
Photograph A33: Vegetation at Site MA14 at 0 m looking toward 50 m.
Photograph A34: Vegetation at Site MA14 at 50 m looking toward 0 m.

A18.APPENDIX A: PHOTOGRAPHIC RECORD OF SITES ALONG CREEKLINES, MARANDOO, 2008
Photograph A35: Vegetation at Site MA15 at 0 m looking toward 50 m.
Photograph A36: Vegetation at Site MA15 at 50 m looking toward 0 m.

A19.APPENDIX A: PHOTOGRAPHIC RECORD OF SITES ALONG CREEKLINES, MARANDOO, 2008
Photograph A37: Vegetation at Site MA16 at 0 m looking toward 50 m.
Photograph A38: Vegetation at Site MA16 at 50 m looking toward 0 m.

A20.APPENDIX A: PHOTOGRAPHIC RECORD OF SITES ALONG CREEKLINES, MARANDOO, 2008
Photograph A39: Vegetation at Site MA17 at 0 m looking toward 50 m.
Photograph A40: Vegetation at Site MA17 at 50 m looking toward 0 m.

A21.APPENDIX A: PHOTOGRAPHIC RECORD OF SITES ALONG CREEKLINES, MARANDOO, 2008
Photograph A41: Vegetation at Site MA18 at 0 m looking toward 50 m.
Photograph A42: Vegetation at Site MA18 at 50 m looking toward 0 m.
A22.APPENDIX A: PHOTOGRAPHIC RECORD OF SITES ALONG CREEKLINES, MARANDOO, 2008
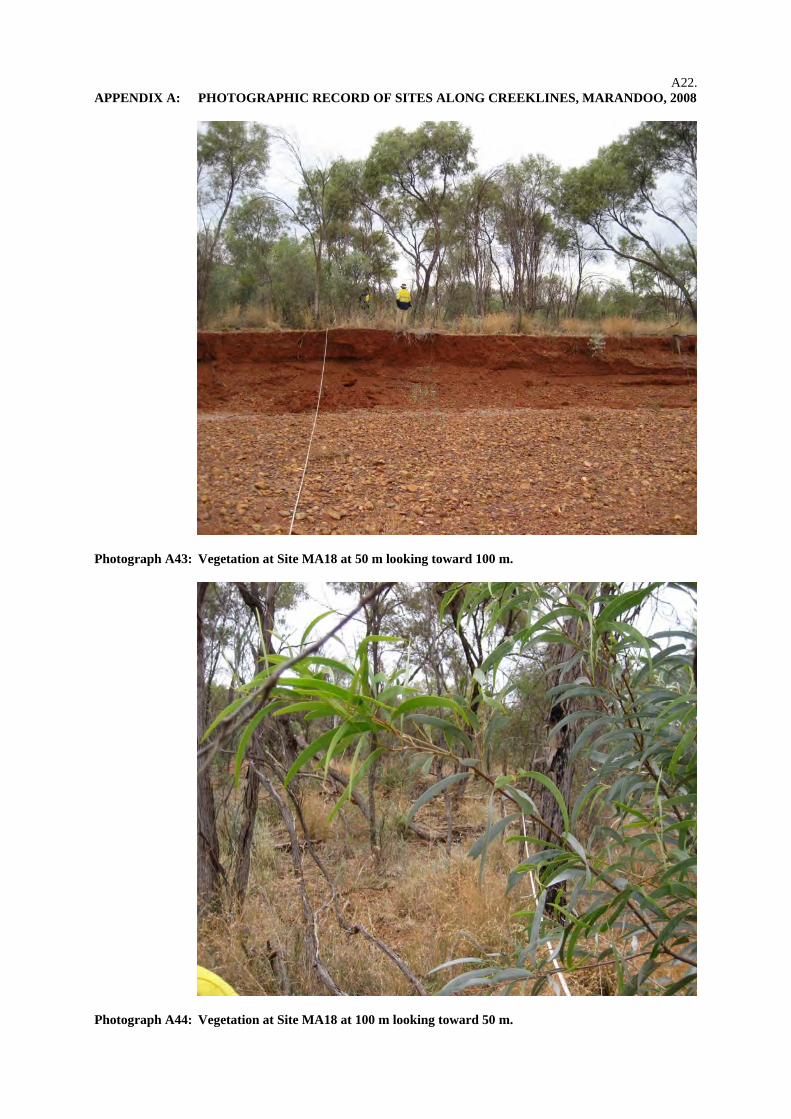
Photograph A43: Vegetation at Site MA18 at 50 m looking toward 100 m.
Photograph A44: Vegetation at Site MA18 at 100 m looking toward 50 m.
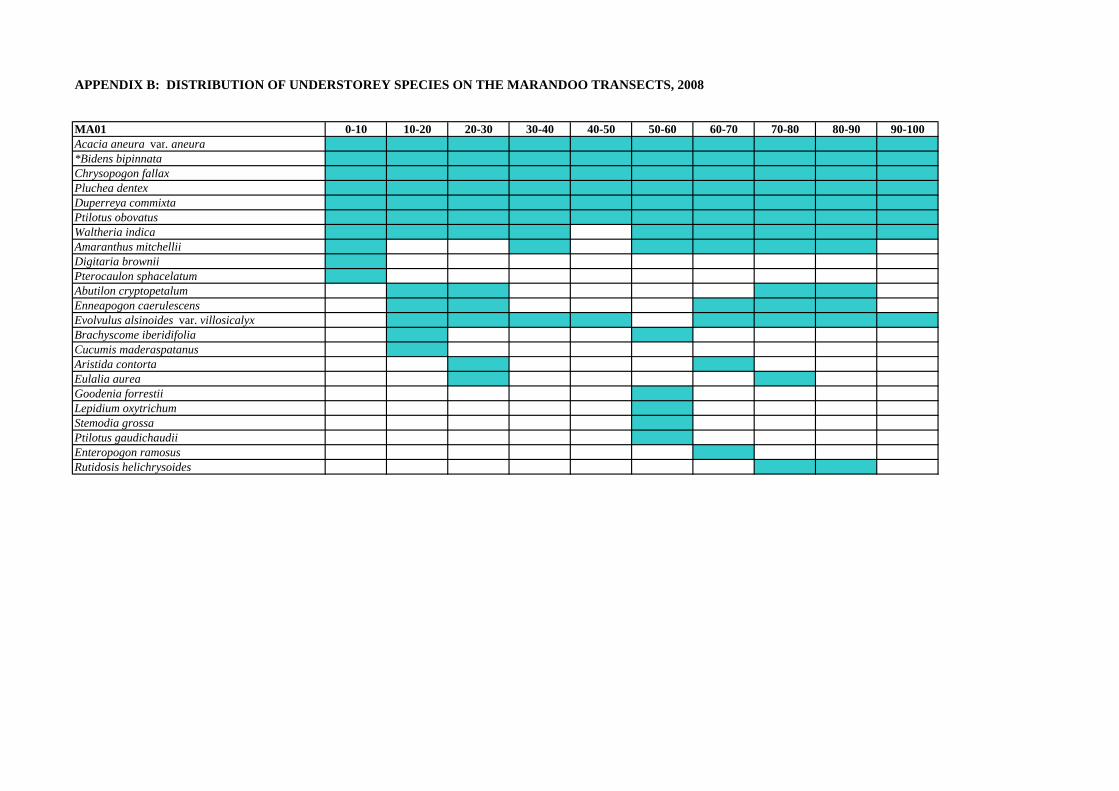
APPENDIX B: DISTRIBUTION OF UNDERSTOREY SPECIES ON THE MARANDOO TRANSECTS, 2008
MA01 0-10 10-20 20-30 30-40 40-50 50-60 60-70 70-80 80-90 90-100Acacia aneura var. aneura*Bidens bipinnataChrysopogon fallaxPluchea dentexDuperreya commixtaPtilotus obovatusWaltheria indicaAmaranthus mitchelliiDigitaria browniiPterocaulon sphacelatumAbutilon cryptopetalumEnneapogon caerulescensEvolvulus alsinoides var. villosicalyxBrachyscome iberidifoliaCucumis maderaspatanusAristida contortaEulalia aureaGoodenia forrestiiLepidium oxytrichumStemodia grossaPtilotus gaudichaudiiEnteropogon ramosusRutidosis helichrysoides

APPENDIX B: DISTRIBUTION OF UNDERSTOREY SPECIES ON THE MARANDOO TRANSECTS, 2008
MA02 0-10 10-20 20-30 30-40 40-50Themeda triandra Dicladanthera forrestiiEvolvulus alsinoides var. villosicalyxAbutilon dioicumAristida inaequiglumis*Bidens bipinnataChrysopogon fallaxDuperreya commixtaEnneapogon caerulescensGoodenia forrestiiPtilotus obovatusSantalum lanceolatum Sida arenicolaSida fibulifera*Cenchrus ciliarisAcacia tetragonophyllaAmaranthus mitchelliiCajanus marmoratusEulalia aureaHybanthus aurantiacusPanicum effusumSida rohlenae subsp. rohlenaeAcacia aneura var. aneuraCymbopogon ambiguusSenna artemisioides subsp. helmsiiAchyranthes asperaSolanum sturtianum

APPENDIX B: DISTRIBUTION OF UNDERSTOREY SPECIES ON THE MARANDOO TRANSECTS, 2008
MA03 0-10 10-20 20-30 30-40 40-50Stemodia grossaEnneapogon caerulescensEvolvulus alsinoides var. villosicalyxPtilotus obovatusThemeda triandraAbutilon oxycarpum Acacia aneura var. aneuraCajanus marmoratusCymbopogon ambiguusDicladanthera forrestiiIsotropis forrestiiPanicum effusumSolanum sturtianumWaltheria indicaAmaranthus mitchelliiPluchea dentex*Bidens bipinnata*Cenchrus ciliarisChrysopogon fallaxCleome viscosaDuperreya commixtaEnteropogon ramosusEulalia aureaEuphorbia myrtoidesPterocaulon sphacelatumSida rohlenae subsp. rohlenaeCucumis maderaspatanusParaneurachne muelleriAcacia citrinoviridisHelichrysum gilesiiAbutilon cryptopetalumAchyranthes asperaBrachyscome iberidifoliaGoodenia forrestiiRutidosis helichrysoidesSida fibulifera

APPENDIX B: DISTRIBUTION OF UNDERSTOREY SPECIES ON THE MARANDOO TRANSECTS, 2008
MA04 0-10 10-20 20-30 30-40 40-50Ptilotus obovatusWaltheria indicaThemeda triandraAbutilon cryptopetalum*Cenchrus ciliarisDicladanthera forrestiiDuperreya commixtaAcacia aneura var. aneuraChrysopogon fallaxEnneapogon caerulescensEulalia aurea*Bidens bipinnataGoodenia forrestiiHelichrysum gilesiiIsotropis forrestiiStemodia grossaAcacia citrinoviridisPtilotus exaltatusAbutilon oxycarpumEnneapogon polyphyllusEvolvulus alsinoides var. villosicalyxParaneurachne muelleriPtilotus gaudichaudiiSclerolaena costata

APPENDIX B: DISTRIBUTION OF UNDERSTOREY SPECIES ON THE MARANDOO TRANSECTS, 2008
MA05 0-10 10-20 20-30 30-40 40-50Achyranthes asperaCenchrus ciliarisCucumis maderaspatanusEnteropogon ramosusPtilotus obovatusThemeda triandra*Cenchrus ciliarisAbutilon cryptopetalum*Bidens bipinnataCajanus marmoratusPterocaulon sphacelatumWaltheria indicaAcacia citrinoviridisCleome viscosaAmaranthus mitchelliiDicladanthera forrestiiDuperreya commixtaRutidosis helichrysoidesSida arenicolaAcacia aneura var. aneuraChrysopogon fallaxEvolvulus alsinoides var. villosicalyxParaneurachne muelleriSenna artemisioides subsp. helmsiiSenna artemisioides subsp. x artemisioidesSolanum sturtianum

APPENDIX B: DISTRIBUTION OF UNDERSTOREY SPECIES ON THE MARANDOO TRANSECTS, 2008
MA06 0-10 10-20 20-30 30-40 40-50Eulalia aureaPanicum effusumStemodia grossaAmaranthus mitchellii*Bidens bipinnataCenchrus ciliarisChrysopogon fallaxCucumis maderaspatanusPtilotus obovatusThemeda triandraDuperreya commixtaWaltheria indica*Sonchus oleraceusPtilotus macrocephalusGlycine canescensAristida latifoliaDicladanthera forrestiiEnneapogon polyphyllusSida arenicola

APPENDIX B: DISTRIBUTION OF UNDERSTOREY SPECIES ON THE MARANDOO TRANSECTS, 2008
MA07 0-10 10-20 20-30 30-40 40-50Amaranthus mitchellii*Bidens bipinnataCenchrus ciliarisPanicum effusumThemeda triandraPtilotus obovatusChrysopogon fallaxEuphorbia myrtoidesEulalia aureaAchyranthes asperaCleome viscosaCucumis maderaspatanusCymbopogon ambiguusDicladanthera forrestiiPluchea dentexSolanum sturtianumSporobolus australasicusStemodia grossaTephrosia rosea var. clementiiDuperreya commixtaWaltheria indicaAbutilon cryptopetalumAcacia citrinoviridis

APPENDIX B: DISTRIBUTION OF UNDERSTOREY SPECIES ON THE MARANDOO TRANSECTS, 2008
MA08 0-10 10-20 20-30 30-40 40-50*Bidens bipinnata*Cenchrus ciliarisThemeda triandraWaltheria indicaAcacia citrinoviridisChrysopogon fallaxCorchorus walcottiiDicladanthera forrestiiDuperreya commixtaEriachne mucronataEvolvulus alsinoides var. villosicalyxGoodenia forrestiiIndigofera monophyllaPtilotus obovatusSolanum sturtianumAchyranthes asperaRulingia luteifloraAristida contortaEucalyptus victrixEulalia aureaAcacia aneura var. aneuraSporobolus australasicusAmaranthus mitchellii

APPENDIX B: DISTRIBUTION OF UNDERSTOREY SPECIES ON THE MARANDOO TRANSECTS, 2008
MA09 0-10 10-20 20-30 30-40 40-50*Bidens bipinnata*Cenchrus ciliarisChrysopogon fallaxDuperreya commixtaEulalia aureaGoodenia forrestiiThemeda triandraWaltheria indicaAbutilon cryptopetalumAchyranthes asperaEvolvulus alsinoides var. villosicalyxPtilotus obovatusSantalum lanceolatumAcacia citrinoviridisAmaranthus mitchelliiCajanus marmoratusCorchorus walcottiiDicladanthera forrestiiCleome viscosaAristida contortaDysphania kalpariEnteropogon ramosusSolanum sturtianum

APPENDIX B: DISTRIBUTION OF UNDERSTOREY SPECIES ON THE MARANDOO TRANSECTS, 2008
MA10 0-10 10-20 20-30 30-40 40-50 50-60 60-70 70-80 80-90 90-100*Cenchrus ciliarisAristida contortaEulalia aureaAcacia citrinoviridisAristida latifolia*Bidens bipinnataCajanus marmoratusCucumis maderaspatanusWaltheria indicaChrysopogon fallaxCorchorus walcottiiDuperreya commixtaAlternanthera nodifloraBrachyscome iberidifoliaCentipeda minima subsp. macrocephalaHelichrysum luteoalbumHybanthus aurantiacusPaspalidium basicladumStemodia grossaWahlenbergia tumidifructaCyperus hesperiusSenna notabilisSporobolus australasicusCleome viscosaCorchorus lasiocarpusIndigofera monophyllaAmaranthus mitchelliiGossypium robinsoniiSolanum sturtianumThemeda triandraEnteropogon ramosusEvolvulus alsinoides var. villosicalyxAcacia aneura var. aneuraAchyranthes asperaGoodenia forrestiiParaneurachne muelleriPtilotus obovatusSantalum lanceolatum

APPENDIX B: DISTRIBUTION OF UNDERSTOREY SPECIES ON THE MARANDOO TRANSECTS, 2008
MA11 0-10 10-20 20-30 30-40 40-50 50-60 60-70 70-80 80-90 90-100*Cenchrus ciliarisAcacia aneura var. aneuraDuperreya commixta*Bidens bipinnataPtilotus obovatusThemeda triandraAmaranthus mitchelliiCentipeda minima subsp. macrocephalaEulalia aureaSporobolus australasicusStemodia grossaCyperus hesperiusPaspalidium basicladumCleome viscosaEuphorbia myrtoidesAcacia citrinoviridisAcacia pyrifoliaWahlenbergia tumidifructaSantalum lanceolatum

APPENDIX B: DISTRIBUTION OF UNDERSTOREY SPECIES ON THE MARANDOO TRANSECTS, 2008
MA12 0-10 10-20 20-30 30-40 40-50Acacia citrinoviridis*Cenchrus ciliarisWaltheria indicaEnteropogon ramosusAcacia aneura var. aneura*Bidens bipinnataDuperreya commixtaWahlenbergia tumidifructaCucumis maderaspatanusEulalia aureaPaspalidium basicladumThemeda triandraAbutilon cryptopetalumSantalum lanceolatum

APPENDIX B: DISTRIBUTION OF UNDERSTOREY SPECIES ON THE MARANDOO TRANSECTS, 2008
MA13 0-10 10-20 20-30 30-40 40-50*Cenchrus ciliarisEnteropogon ramosusAchyranthes asperaDuperreya commixtaThemeda triandraAcacia aneura var. aneuraWaltheria indicaAcacia citrinoviridis*Bidens bipinnataPaspalidium basicladumPterocaulon sphacelatumWahlenbergia tumidifructaCheilanthes sieberiTribulus occidentalis

APPENDIX B: DISTRIBUTION OF UNDERSTOREY SPECIES ON THE MARANDOO TRANSECTS, 2008
MA14 0-10 10-20 20-30 30-40 40-50Acacia citrinoviridisDicladanthera forrestiiDuperreya commixtaThemeda triandraSolanum sturtianumAcacia aneura var. aneuraSenna symoniiTriodia wiseanaChrysopogon fallaxCentipeda minima subsp. macrocephalaCleome viscosaEriachne mucronataPaspalidium basicladumWaltheria indicaAbutilon cryptopetalumAmaranthus mitchellii*Cenchrus ciliarisCucumis maderaspatanusPtilotus obovatusEnneapogon caerulescensParaneurachne muelleriEulalia aureaEuphorbia australisAristida contortaAristida latifoliaEnneapogon polyphyllusEvolvulus alsinoides var. villosicalyxSclerolaena costata

APPENDIX B: DISTRIBUTION OF UNDERSTOREY SPECIES ON THE MARANDOO TRANSECTS, 2008
MA15 0-10 10-20 20-30 30-40 40-50Duperreya commixtaPtilotus obovatusThemeda triandraAbutilon cryptopetalumAmaranthus mitchelliiCucumis maderaspatanusEulalia aureaDicladanthera forrestiiAcacia aneura var. aneuraAcacia bivenosaCajanus marmoratus*Cenchrus ciliarisRulingia luteifloraWaltheria indicaCheilanthes sieberiEnteropogon ramosusEuphorbia myrtoidesSolanum sturtianumStemodia grossaAcacia citrinoviridisAristida latifolia*Bidens bipinnataPluchea dentexEvolvulus alsinoides var. villosicalyx

APPENDIX B: DISTRIBUTION OF UNDERSTOREY SPECIES ON THE MARANDOO TRANSECTS, 2008
MA16 0-10 10-20 20-30 30-40 40-50*Cenchrus ciliarisAcacia aneura var. aneuraAcacia pruinocarpaEnteropogon ramosusThemeda triandraWaltheria indicaTribulus occidentalisCleome viscosaSolanum sturtianumAcacia citrinoviridisChrysopogon fallaxCajanus marmoratusEnneapogon caerulescensAchyranthes asperaDuperreya commixta

APPENDIX B: DISTRIBUTION OF UNDERSTOREY SPECIES ON THE MARANDOO TRANSECTS, 2008
MA17 0-10 10-20 20-30 30-40 40-50Waltheria indicaAchyranthes asperaDuperreya commixtaEulalia aureaPterocaulon sphacelatumTribulus occidentalisAcacia inaequilateraCajanus marmoratusAmaranthus mitchelliiCucumis maderaspatanusEnteropogon ramosusPaspalidium basicladumEremophila longifoliaThemeda triandraAbutilon cryptopetalumChrysopogon fallaxEriachne mucronataEvolvulus alsinoides var. villosicalyx

APPENDIX B: DISTRIBUTION OF UNDERSTOREY SPECIES ON THE MARANDOO TRANSECTS, 2008
MA18 0-10 10-20 20-30 30-40 40-50 50-60 60-70 70-80 80-90 90-100Eulalia aureaThemeda triandra*Bidens bipinnataDuperreya commixtaPtilotus obovatusWaltheria indicaAcacia aneura var. aneuraAchyranthes asperaAmaranthus mitchellii*Cenchrus ciliarisChrysopogon fallaxSolanum sturtianumAcacia citrinoviridisEnteropogon ramosusAcacia pyrifoliaCentipeda minima subsp. macrocephalaCleome viscosaCymbopogon ambiguusStemodia grossaTephrosia rosea var. clementiiCajanus marmoratusAcacia tetragonophyllaEuphorbia australisWahlenbergia tumidifructaEvolvulus alsinoides var. villosicalyxDicladanthera forrestii

MA07MA07
MA03MA03MA02MA02
MA05MA05MA04MA04 MA01MA01
MA06MA06
MA08MA08MA09MA09
MA10MA10
MA11MA11
MA12MA12 MA13MA13
MA14MA14MA15MA15
MA16MA16MA17MA17
MA18MA18
Figure:
A A3Rev:Date: Aug 2008
Drawn: CAD Resources ~ www.cadresources.com.auTel: (08) 9246 3242 ~ Fax: (08) 9246 3202
Author: E M Mattiske MCPL Ref:
MATTISKE CONSULTING PTY LTD28 Central Road, Kalamunda ACN 063 507 175Phone: 9257 1625 Fax: 9257 1640
Scale: 1: 60,000
RIO TINTO
1CAD Ref: g1662_Trans.dgn
MARANDOO - TOM PRICE PIPELINEVEGETATION TRANSECTS
0 500 1km
MGA94 (Zone 50)
7504000mN7504000mN
7508000mN7508000mN
7512000mN7512000mN
7516000mN7516000mN
7520000mN7520000mN
7500000mN7500000mN
600000mE
600000mE
604000mE
604000mE
608000mE
608000mE
612000mE
612000mE
LEGEND
Borefield
DEC Tenure
Discharge
Pipeline
Riverbed
Transects
Transect IDMA12MA12
��������� � � � �� � � ��� �
��
���� �� �������� � � � ������ ���� �� �� � � � !�� � �" �� #�$ �!� � � �� ���% �� �& �!����� $ ��" � ���'�� '�� � � � ��� ��� � ��� � ��� � � �� � � � � � �� � � �� � �� ��� � � � � � � � �� � � ����(� ��� ) ���
� � � � � � �� � � �� �� � � � � � � �� � �� � � � ���� � ���* �!� ��� � ��� & �� �!� �* �� ��!+ ,�!� � ���� ) �,,�� & � - � �. !� $ ����) � � + �� �� �� �* ��� � � ) � � � " * !�� � � ) �� �,� � ��� �����* ���� ) �,,�� & �!$ �� ��� !� ���� !�) �� � ��* ����� ��� , � � � ) �- ����� , � $ ���* ����� ���� �� �* !� ) � �!�) �- �,,����+ !�) ��� ��� � � ) � � �" * !��� �" � ���� ,+ ��� � �����" ��!�� ��) � ���!��+ , ��� � !� �� �� ) �- ����� & � �� �� �* ��� � � ) � � � � $ � � � ��$ �� ��� � ,� /� $ � � 0���� �� � , � � � ) �!��+ , ��� � !��� ���� #�$ ��� � �� ��- ������ �� ��* ��� � + �* ��� �1 � ���!$ + ��2 � �����,) �/� 1 2 0����* �!���� � ���!+ � ��!�) �!��* �� 3� � � ) � � � % �� + � ) - ���� �� ) �,,�� & � � ) � � � & �� ����� & � (�!�& � � 4 ������ 5� /���� � � � � 0� � �� 1 ���+ �6 �� � � � � ) + �� �� �!+ �!�7 + �� �� ����� ���� �!� �� � �* �� - ����� , � $ ��� ��* ��� #� �� ) �� �,� � ��� �!�!�� $ �� 1 ���+ �6 �� � � � �- ����!� �$ ���$ ��� � ��6 ���� ���� �� �� ��� � ��+ ���,� - � ��!��� ��) �- ����� & ��� �� !��+ $ �+ ��� � ) �� ���� #�$ ��� � ��,� - � ��!��� ��* ��� � + �* ��� �1 � ���!$ + ��2 � �����,) ���� � � � � � �� � � �� � �� � ���* �� $ � � $ �� �+ ,� � $ . & �� + � ) � � ) � $ � � !��+ $ ��� � � � �� �* �� � � � ) � � � % �� + � ) - ���� �� ) �,� ��� � + �,�� �) � �� �8 �7 + �) � � ��* � /� � � �0�� � � + �!�7 + �� �� � ,�) ��� � � � ) � ��$ ,��� ��� � � � �� �* �� �� ) �,� ��� ) �!$ ����) � �� � ����/� � � � �0����* ��� ��!�� � �� ���* ���� ) �,��� �� � � � ��- !�+ !�) ��� ���* ��) �- ����� & �!$ �� ��� !�) �!$ ����) �* �������% �� + � ) - ������ ) �,,�� & ���!+ ,�!��� ��� � � ) � � �) �- ����� & � ���� ��!�� ��) ��� �� � $ ,� !+ ��� ���(�- ����� & �� ���* ��� � � ) � � �� ���- !� !!�!!�) ��� ���* ��� $ � � � ��$ �� ��� � ,���� ��� , � �� �� � �) �) ��6 ���� ���� �� �� � � � !�� � �" �� #�$ �!� �� � 9 $ �� ���� � � � : �� �(�- ����� & � - !� !!+ ��) � �� ���& �� � �� � ; � + �6 � � � '� � �� � �) �� & � � ��� � �* !�,� ) � ) �- ����� & ����� ��� $ � ���� $ ���� �� � ����,� - � - ���� � �,�� /2 ��0���� �� & �� � �� � ��+ �� �,� - � ��� � ��<'� � � � �<=) � /<��8 =) 0� - !� !!+ ��) � � !�) � � � � � ��� �� + !� �� ��� � ���� �� � $ �� �� � � � ) � � �� � �* �!� - !�$ � � !�) ���) � � �� !� � �,�� $ � � !��� ��� �� !!+ �� ��� � '� ,�* � + & * � �* ���� �!� � � ��� �� ,� �� �� * �& * ��� 6 ��,) !'�� ���$ + , �,6 �+ � >) �� ���� $ �� ��� � �(9 � � �� � � $ ,� !+ ��� � - !� ) �!�& � �) � !� � �� ,�!��$ � �!��� ��� � �� � � � � �� ��� � ,� ) �- ����� & �� �� & � ���� ���* ��� $ � � ���� ��� , � ����* ��. �6 ���!+ ,�!�� ��� $ �� ��� � �- ������
• � �� � ,� � �� <� � �� ��!� - ���� �!��� ��) � �� � ��� ��7 + ���) � �� � ����� �* �� ��� �� & � !$ * �) + ,�'� ���� & � � � �� ��� � �� ���� ��!� � ) � � �! $ ����$ � ,�/�� >� ��0��� ��!?�

• @� >� ����� ��!�- ����$ ,+ !����) ��� �� � ���!���* ����� ,+ ��) + ��� & ��* ��!� & �) �� !�- �) � ) � � $ ��� ���* ��� ��?�
• �� � ��+ ���,� - � ���� ��� �'� � � ��<=) �- !� ) � � ��) '��� �$ � � !+ ,� ��� � �- ��* ���� ���� �� '��� �� � & ���* ��- ������ � !������ �� !��+ $ �+ �����7 + ������ �!?�
• �* ���� � ,�) �!$ * �& ��) + ��� & �) �- ����� & �- !��!��� ��) � ���<�� '� � � '� � � ��<�/<�� �% 8 0?�
• �* �� � �� & ��) �!$ * �& ��) + ��� & �) �- ����� & �- !��!��� ��) � ���: '� � � ��<=) ?� � ) �
• � + �� �� & �- !���� �� ,��� ���* �!�� �� & � �� � ) �- � + ,) �,�. �,6 ����!�������7 + ���) � �� + � ) �� � : ���@���!� � ��$ �� ��) ��* ���* ��� ��) ��� ��!+ �� �� & �� ��& �� + � ) - ����$ � + ,) �������� � �) ��6 �� � ����! ��� � �� ���* ���� �����,) � !��* ��+ � ) ��!� � ) �� & �� ���* �� 7 + ������!������ �) �) + ��� & �� � �� ��� � ����� - �� ��'��* ����!+ ,�!�) � ��� ) �$ ����* ��� ��) ��� ��!�& � ���$ � ��) �- ����� & ��� �� !��+ $ �+ ��'� � ) ��* ���* ��) �- ����� & �� � �� ��� � �- �,,���7 + ��������$ ��� ���� �� !��+ $ �+ ���� � & ���� �� � ) �$ � � ��� + ,�) �� �,� � ��� ��� ���* ��* 6 ) �� & �� ,� & �$ ,� � ) �� + ����$ ,��� ) �,!��� ����!+ $ $ �!!�+ ,��� $ �+ ,��� ) �� �) + ,��� ���6 ��,) !� ����� � �$ ��) ��� �� �6 �- �) �,6 ���� ���* � !����� � ���) �) + ���� ��* ��� �� ��,��6 �� ���* ��� �� � � �� � 7 + ������ � �* �� ) �- ����� & � ��!+ ,�!� � � ,6 � � � ,6 � �� � �* �� � �� � � �� � � ���� ) 6 � 7 + ������� ,���� ��� ��) �- ����� & �!�� ��& ��!�� 6 ������7 + ���) ��� ���* ��� � ��,6 �� & �+ � $ � � !� ,�) ��) �!�) ���� �!����* �!� ) �- ����� & � � �� & � �� ��� ��!�� �!� � !�& � ���$ � �� !$ ,�� & � + � � ��� �� �* �� � �� & � �� � ��!�� ��) � �� � �* ��� � � ) � � � 9 �) ��� � ��� & � ��+ ) �� !�+ ) 6 � /���'� � � � � 0�� � �* �� �� $ �� !�� �� � !$ ,�� ��!+ ,�!� ��� �� �* �� ��� �!�) ���� �� � , � �� � ���� /� � � � 0� !!�!!�) � ) �- ����� & � � ) � - ���� � � & ���� �� ��7 + ������ �!� �� �� � � , � ��������) � �� � !� �* �� 3� � � ) � � � 2 ��� 9 � ����� �� & � � $ * �) + ,�5� /" @� 8 � � & >�������� �� " , � � �� & '�(�$ ������� � � �0������* ��� $ � � � ��$ �� ��� � ,�� , � �� , $ �!��+ $ * �& �� ������7 + ������ �!�� � �) �- ����� & ��* � ��* ��� ��� �� + !�� , � ����* ��� $ � � � ��$ �� ��� � ,���� ��� , � ��� $ * �!� ���� ��+ ���,�� ��� � �� ���� �� �('�$ � �� ��) ��� ��A � �� �(��� ���* ��9 � ��� , � ?��* ��� ���� ��� ����$ ,� ) � � $ ���!� � � �� � �� ��,6 � ��������!�� ���6 � �'� & �� !��: ��������!�� ���6 � ���� ���* ��9 � ��� , � ?��* ��� !��� ����� �� & ���� �� !� ���* ��� � ��+ ��) �� �* ��� ����� ��6 � �!�� �* ����* � �� � ,6 � � � �� 6 � �� �� �� �* �� 9 � �� � , � ?� � ) � �* �� �� � ,� � ���� ) � � �� 2 ��� � � �� ��� � � �!� �� 6 � �!� $ � �� ��) � �� � � �6 � �!��� ���* ��9 � ��� , � ���@�� �!� � � ��) � �* �� �* �� � $ � � � ��$ � � ��� � ,� � , � � $ � + ,) � ��� � � ����!�) � �� � !�& � ���$ � �,6 � ��) + $ �� ) �- ����� & ���7 + ������ �!����- ����� � & ���� ��- !�$ � � !�) ���) � �. �6 �$ ������ ��� ����� ��) �� �,� � ��� ������ � � �� � � � �� � � �� � � � ��� �� � ��� � ���* �� $ � � $ �� �+ ,� � $ . & �� + � ) � � ) � $ � � !��+ $ ��� � � � �� �* �� � � + �* ��� � 1 � ���!$ + �� % �� + � ) - ���� �� ) �,� ���� + �,�� �) ��� �����/� � � : 0�����* �� � � + �* 1 � ��� B � � & �� + � ) - ������ ) �,� - !� + !�) � �� � !��+ , ��� �* �� �� #�$ ��� � � � �� - ���� �� �� � �* �� � � + �* ��� �1 � ���!$ + �� 7 + ������ � �* �� !$ �� ��� !� - ���� $ ����) � � + �� ���� ��� �* �� $ � �� ,���� � � � �� �* �� � 1 2 � �� #�$ ��� � � ��� ,�- * �$ * �- !�) �!�& � �) ��� �� ,�) ����* ������$ ��� �� �!!�� ���* ��� � + �* 1 � ���B � ��� ) �,��� ��� ��) �$ ��� � �� ���� #�$ ��� � ���@� #�$ ��� � �!$ �� ��� !� - ���� � �� � �) �) ��6 ���� ���� �� � /���(� ) !� � '� � ��!�� $ � ���'� !�� � �� ������� � � � � 0�� ��* ���� #�$ ��� � � � ���� ) !� - ���� $ � � !�!��� �� - ��* � �* �� � � � ) � � � � $ � � � ��� �� !$ * �) + ,��� � 1 ,� - � - !� ) �!����+ ��) � �� � $ * ��� �� � � �� � �� ��,6 ��� �� � ) �� �* � �� � & �� + � ) - ���� �� �* ���� ) � � �� �* �� � $ � � ���� �� ,����� ��* �� - ���� ,�� �,���!� � � !��- !���!��) ��� �� �� #�$ ��� � � �� �� � �* ���� �!��� & ��� �����,) � � ) � �� �� � �* 6 � � �* ���$ ,��� ��� ) �) ��� �����,) �$ � � � �� �� & � � � ) ) ���� � ,���� ���� ��!�!� $ �) �� . �� � ����� ��* ��� � ��* ����

Table 1: Injection Scenarios Scenario Borefield Flow rate Timing
SFB1 Existing SFB 15000 m3/d 2011 to 2027 SFB2 Existing SFB + five new
bores to north 15000 m3/d 2011 to 2027
SFB3 Existing SFB 30000 m3/d 15000 m3/d
2011 to 2013 2014 to 2027
SFB4 Existing SFB + five new bores to north
30000 m3/d 15000 m3/d
2011 to 2013 2014 to 2027
��* ��. �6 ���� ) �� & !�� ���* ���� #�$ ��� � ��� ) �,,�� & �- ������
• - ����,�� �,!��� ��* ���� �����,) �- � + ,) �,�. �,6 ���!���� ����- ��� ���� � � ) ��- �� �6 ������!�� ��& �� + � ) �!+ �� $ �� ����� � �6 � �!'��� �� ,,��� + ��!$ �� ��� !?��
• �* ���� �����,) ��� ��� !�� � �� 6 ���) + $ ���* ����� ,�- ����,�� �,��� ��* �� �� �� ���* ���� �!��� & ��� �����,) ��6 � � � �� � �� ��,6 ��* ���������!?� � ) �
• �* ����� $ ��� ���� #�$ ��� & � ��<� '� � � �<=) ��� ���* �����!���* ����6 � �!'�� �* ����* � � �'� � � ��<=) '��!��!��� ��) ��� ���� � � �� � �� ��,6 ��- � ������!� ) ) ���� � ,�- ����,�� �,���!���
��* �����!�� � ��� �� ,��� ��� � ����! ��� � �) + ��� & �� � �� ��� � ��� �!� �� ) ��* ��- ����,�� �,���!���� ����� �� ,6 � $ �� !!��* ���� �����,) ����
�* ��� � ��� �� ,��� ��!�� . * � ,���� * � $ ���� ��� ���� �� ��� � � !� ���!+ ,��� ��) �- ����� & � ��� � � ) � � �� ���� #�$ ��� � ��� �� � �* ��� � + �* ��� � 1 � ���!$ + ��2 � �����,) � * !����� �� �!�) � �� � � ��� �� + !����� � ) �8 �7 + �) � � ��* � ��� � ��!��+ ��- !�� � ��$ � � !�) ���) � !�� ���� ���* �!�!�+ ) 6 ����������C � + �!�� ��* �+ ,,6 �� � �� � �� �� �� �� � �� ��
��; �) �C � + � & !�� � �� � �� ��� � � � � � � � �� � � ��!�� � �" �� � ��# � � � � � � ��� ���

# � $� � � � � � ���8 �7 + �) � � ��* '� � � � �'� � � � ) � � � �6 ) �� & �� ,� & �$ ,� @� � �!��& ��� � � ��� � ��'� $ � � !+ ,� � �� ��� � ��� � ��� ��) � �� ��" �,� � �@�� � ������'�� � � � '�� � � ) � � �9 �) ���� ��� & � ��+ ) ��� �+ ) 6 '�$ � � !+ ,� � ����� � ���� ��� ��) ��� ��" �,� � �@�� � �����'�� � � � �'�� � � ) � � ��� ) �,�(�� �,� � ��� �'�$ � � !+ ,� � ����� � ���� ��� ��) ��� ��" �,� � �@�� � �����'�� � � : '�� � + �* ��� �1 � ���!$ + ��2 � �����,) �D + ����$ ,��� ) �,,�� & '�$ � � !+ ,� � ����� � ���� ��� ��) ��� ��" �,� � �@�� � �����'� � � � � '�� � � ) � � � % �� + � ) - ������ ) �,,�� & � � ) � � � & �� ����� & �(�!�& � � 4 ������ '� ,������ ��� � ��� �� ���� ���� �� �� � � � !�� � �" �� #�$ �� ��������� ) ��(� ) !� � �����'�� � � � �'�� � + �* ��� � 1 � ���!$ + ��2 � �����,) ��� ) �,,�� & �E�" ��,���� �6 ���!+ ,�!'� ,��������� � ��� �� ���� ���� �� �� � � � !�� � �" �� #�$ �� ��������� ) ��(� ) !� � ��% � � �� � � � ��� � $ ,� !+ ��� ���� � � ) � � �(�- ����� & ��� ) �,,�� & �� $ �� ��� !��� � $ ,� !+ ���� ���� � + �* ��� �1 � ���!$ + ��@� #�$ ��� � ��

% � � �� � � � �& ���� � � � � � �� � � �� � �� � �� � � � ���� � �� � � � � �� ���� � ��� � ) �!$ �� ��� ��� ) �,,�� & ��6 �4 6 �� ) �� 6 !���!� � ) ������
�� �� � � � � ��� � �
�" ��,���� �6 � � + ����$ ,� �� ) �,,�� & '� �� $ � �� � � ��� & � �* �� & �� ,� & �$ ,� � ) � * 6 ) �� & �� ,� & �$ ,� ��� ) �� & !� � �� �* ��� �� & � ���� �) ���* � ������ �+ � ) ��� . �� ��� ��+ ��* �������� ���* ��) �- ����� & ���7 + ������ �!��� ���* ��� �� � � !�) ��� ��� !�� � �� ����� �� & ���,� - �- ����� �,��/2 ��0� ��� � � ) � � ���� ��� �!�$ � � ) �6 �� �#�$ ��� ���!��� ���� ��- ��* ��,� � & � ����� ,� - ���� & � � �� �* �� ��& �� � ,� - ���� � �,�� �� � !!�!!��* �� � � !!��,���� � ��� � ��� � ,� ��� $ �!� ��!+ ,��� & ���� ��) �- ����� & �� � ��* �� ,,+ � � ,� � ) �$ ,$ ����� 7 + ����������* ���� ) �,,�� & � � ��!�� ��) � �� � �* �!� ��� � ��� * !����� � + � ) ��� . �� � + !�� & � �* ��� � � ) � � � B ��� ) �,'� - * �$ * � �!��* ���� !����$ �� ��$ ,��� ��) �& �� + � ) - ������ ) �,��� ��� � � ) � � ���2 �,� - ��!� �) �!$ ��� ��� � �� ���� �- �) �!��+ , ��� � !�� ��) �- ����� & �+ !�� & ��* ��� $ � � � ��$ �� ��� � ,�/� 4 9 D 0�� ���!$ * �) + ,�'��� ��� ��� + !��� ���$ � � ��& + � ��� � !���
� �� � �� � � �� � �� � ��
�������������
��- � ���� �� & �!$ * �) + ,�!� * � ������ � ) �� �,� � �) ��6 �� �$ * � !!� $ � ��!'� ) �!�& � ��) � � 4 9 D � � ) � 8 � ��� ��* ��!$ * �) + ,�!� ��� ) ������� �� �� � ����!� � �� ) �� �* � � ����� �� & � � ) � �* �� � ��� � ���� $ � ��� � �� ��* �� � 4 9 D �!$ * �) + ,��& � �!��� � ���� ��+ ���,�� ��� � �� ���� ����8 '�� � ��� ���� �� & �� ���� ) ���� ��� � � ��� �� � � : ����* ��8 � ��!$ * �) + ,��* !� ���� ��+ ���,�� ��� � �� ��� � ����8 '�� � ��� ���� �� & �� ���� ) ���� ��� � � ��� �� � � � ���2 !�) �� � ��* �!'�� � ,6 ��* ��� 4 9 D ���� ��!$ * �) + ,��- !��� ) �,,�) '� !�$ � �� ,� � $ ��- ��* ��* �!�!$ * �) + ,����� ,��!�$ � �� ,� � $ ��- ��* ��* ��8 � ��!$ * �) + ,������ � $ � � !�) ��� � �� �,����� �� & � ) � � $ �� � ��!� $ �� !!� �* �� � ��� �* ������ � ��� �� ,� $ ��� � !� - ���� $ * � !�� ���* �6 �- ����) �!�& � ��) �" � '�" �� '� � ) �" �<� � ) �� � & ����� ��- �!���� �� !�� $ �� !!��* ��� �����!� �$ ��� �,6 ���" , � � �) ���� ��) �� �* !� ��" �� � � ) � " �<��� ��� ) � �� � �) �� �* �� ���� �� �(� ����* ��! ����* �� + & * � + �� �* ����� ��,�����" � �,��!��� ��* ��- �!�� � ) ���� �� & ��* �����!�!$ * �) + ,�) ��� ��� $ * �� � �� �(����* ��� 4 9 D ���� ��!$ * �) + ,�� ���* �!��,� $ ��� � !��!�� ��!�� ��) ��� �1 �& + ��� ���
�

Figure 1: ECON Mining Schedule (Summarised)
�

Pit Design Economic Rational
Pit CB02 Pit CB03 Pit CB04 Pit CB05 Pit CB062012 625 7152013 625 6702014 640 6702015 640 670 6702016 - 640 670 6852017 - 595 670 6702018 - 595 670 6702019 - 580 670 670 7002020 - 565 595 670 7002021 - - 565 670 6702022 - - 565 625 6702023 - - - 595 6702024 - - - 580 6702025 - - - 565 6252026 - - - - 565
23456
End of year minimum pit RL (m AHD)Year
Cutback #Maximum Easterly
(m) Local grid
73500
67500690007050072000
�Figure 2: ECON Mining Schedule (Hatch, 2007)
��
���� �����������������
�(�- ����� & � !��+ , ��� � !� !� ���) � �� � ; � + �6 � � � � �� � � �� � �) �� � ��� � �* !� ,� ) >����� �� � ) � � $ �� � �� 2 ������ �� & �� � ,,��� ��!� - ������ ) �,,�) � !�!$ ���� �) � $ �� !!� �* �� � ���� ) 6 � /�� ) �,� , 6 ��� 0� � ) � �* ��� � ��+ �� �!�� $ ��� � � � ��� �� �� � $ * � �� ��� - !� <� � � �<=) 6 �� � � + �� !� - ���� �� $ ,+ ) �) � �� � �� !+ ��� - ���� ,�� �,!� - ����$ � � !�!��� ��- ��* ��* ����� ��!$ * �) + ,����* ��!+ �� !�- ������ ) �,,�) � !�) � �� !'�- * �$ * � $ ���� �) �!$ * �& ��- �����* ���!� ��� �� �� � ���* ���� � �����,�� ��� � �/ !�!� �$ ����) ��6 ��* ����� ��!$ * �) + ,�0�� ���* ��� ������1 � + ��!$ �� ��� !�- ����!��+ , ��) �+ !�� & ��* ��� 4 9 D ���� ��!$ * �) + ,�������������� �� ��� ��� ���� ��� � � � � ��� ����� $ �� ��� � � $ � � !�!��) � � �� � �� �����,) � � �� � � � �� ��!� �!�� $ ��� & � �� � $ � � !� � �� � ��� � �� <'� � � �<=) 6 � � $ * '�& �� �� & � � �� � ,� �!�� $ ��� � � � �� � � '� � � � �<=) 6 �� �* �� �� ��!� - ���� !���) � ) � - � >) �� � � �� �* �� � ��� � � � �* ��� � ��* >� !���� �!�) �� !�!* � - � ��� �1 �& + ���� ��������������� ����� ��� ���� ��� � � ��� ���� ��� � � � � ��� �� $ �� ��� �� � - !��* ��! ��� !�� $ �� ��� � ��� $ �� �� �* �� ,� $ ��� � !�� ���* ���� ��!�- ������ !�) ���* ���� � �� ��� �� � ���* ����� �'� !�!* � - � ��� �1 �& + ���<������������� �� ��� ��� ���� �� ���� ����!���� ��� ���� ���� � � � � ��� �� $ �� ��� �<�- !��* ��! ��� !�� $ �� ��� � �- ��* ��* �� ) ) ���� � �� ��!�� �� �� ) + $ ��� � ��� ��!�- ��* �� ��* ��� �����* �!���� ��!� - ���� $ , !!�) � !� ! $ ����$ � ,� !� �* �6 �� 6 � ������ �) � �* �� + & * '� ,�* � + & * � � ����� �,6 � �* �6 � - � + ,) � ���� �� � �� �) � � ) � $ + ��) � - � � !���� �� & � � �� & ��!!�) ��� @�� - !�$ � � !��� ��� �,6 � !!+ ��) � �� � �* ���� ) �,,�� & � �* ���* �!�� �� ��!� - � + ,) � ��� ,� !�� - * �� ���� �� & � � �� & ��!!�) � ��6 � � ) � � ��>!���� � ,�� �,� �� �* �� �� ��� !���!�� � �* �!���� ��!� - ���� !�,�$ ��� �,6 � !���) � � � �� �� !� � ����� ��+ ����� �� & � �,�� ��� � �� � 2 � ��� � ) � !+ �� � ,� $ ��� � !� �� ��� $ �� ��� �<� ���!* � - � ��� �1 �& + ��� ���1 � �+ ��!�� ��� $ �� ��� �<� �����
• � �! $ ����$ � ,��� ��!��� �" ���4 2 � �/� � ��� �� � 0�
• <�! $ ����$ � ,��� ��!��� �" ���4 2 � ��/� � ��� �� � �0�
• �! $ ����$ � ,��� ����� �" ���4 2 � � �/� � ��� �� � � 0������������" ��� ��� �� �� # ��� ���� ��� ���� �� ���� ����!���� ��� ���� ��� � ���� �� �� � � � � ��� $� $ �� ��� ��(9 � - !� ) �!�& � �) � �� � ��� ��!�� �� � �� ,�!��$ � � � �� ��� � ,� ) �- ����� & � � �� & � �� �� ��� � � ) � � �����!. �- !���� ���!�) ��6 �� �� � �� �� & ��* ��- ����,�� �,���,� - �� !��� ����� �� & '� � ) � !� ���!+ ,���* ����- !�� � �!+ �� �� & � �� � � $ �� ��� � �(9 � + � ��,� , ��� �� � �* ����� �� ,����� � � $ �� ��� � �(9 � - !� �* �� ! ��� !� � $ �� ��� ��(9 <� - ��* � �* �� ) ) ���� � � � �� ��� �� ! $ ����$ � ,� � �� ) + $ ��� � � �� ��!� �� � �* �� � ��� � ) � � � �� �� ��� � � � �* �� � ��� �,� � ����1 + ��* ���� ��'� � + �� �� & � � ��!� �� � �* �� � ��� � �� �� �� ��!� - ���� � � ����!�) � �� �� �* �� ��� �� � , � �� � @�� - !�$ � � !��� ��� �,6 � !!+ ��) � �� � �* �� �� ) �,,�� & � �* �� �� >� ��� �� ��!� - � + ,) � ��� ,� !�� - * �� � ��� �� & � � �� & ��!!�) ���6 � � ) � � ��>!���� � ,�� �,� �� �* ���� ���!���!�� ��* ��� � ��+ �� �!�� $ ��� � � � ���� ��<'� � � �<=) 6 � � ����� ��� - !�� �� � �� �) ��2 � ��� � ) �!+ �� �,� $ ��� � !��� ��� $ �� ��� � � ���!* � - � ��� �1 �& + �������1 � �+ ��!�� ��� $ �� ��� ��(9 � �����
• �! $ ����$ � ,��� ��!��� �" ���4 2 � �/� � ��� �� � 0�
• � �! $ ����$ � ,��� ��!��� �" ���4 2 � ��/� � ��� �� � �0�
• ��� ����� ��* ��� ����,� � ��� ��" ���4 2 � ��/� � � ��� �� � � �0�
• �! $ ����$ � ,��� ����� �" ���4 2 � � �/� � ��� �� � � 0�

• " + �� �� & ��� ��* ��� ��� � �� ���� ��!�- !�) �!����+ ��) ��� ���* � � �,6 ��� ��* ��- �!�� ���* ��!� ���� ��) �- ����� & � � ) ����� ) �� & �� !�- �) �) + ��� & ��* ����� ��,������
����
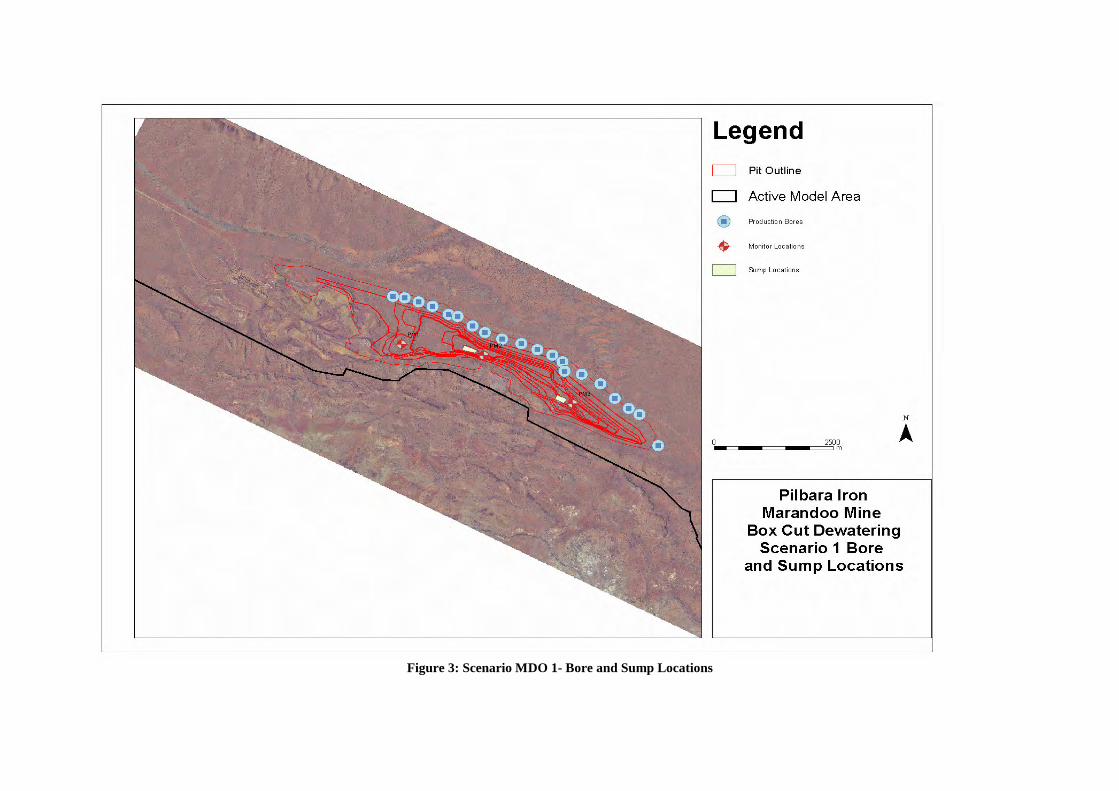
�Figure 3: Scenario MDO 1- Bore and Sump Locations

�Figure 4: Scenario MDO 2- Bore and Sump Locations

�Figure 5: Scenario MDO 3 - Bore and Sump Locations
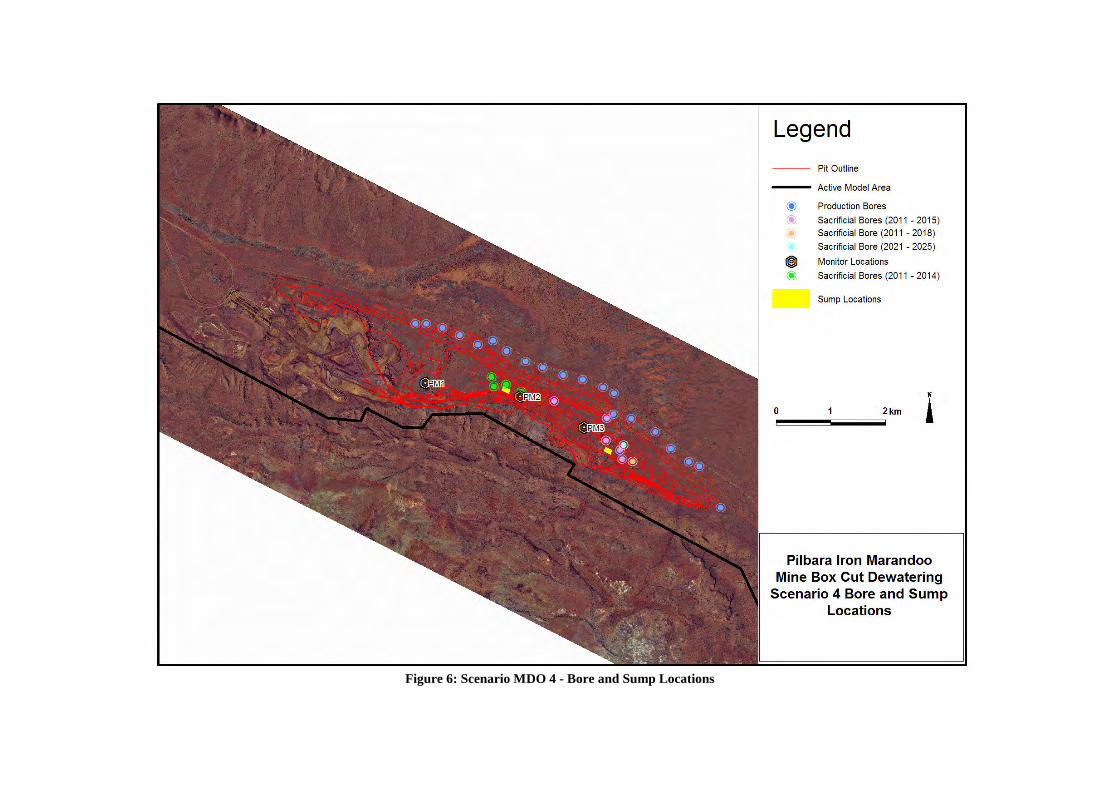
�Figure 6: Scenario MDO 4 - Bore and Sump Locations
�������
�* ����!+ ,�!�� ���* ��) �- ����� & �!$ �� ��� !� ���!+ �� ��!�) ��� �� �,� � � ) �� �,��� ��
Table 1: Summary of Predicted Abstraction Scenario Total Abstraction
from Wells (,000 m3)
Total Abstraction Drains
(,000 m3)
Peak Total Abstraction (,000 m3/d)
Peak Drains (,000 m3/d)
Average Abstraction (,000 m3/d)
MDO1 324000 25000 68 29 53 MDO2 335000 19000 68 20 55 MDO3 347000 14000 65 15 57 MDO4 350000 12000 65 15 57
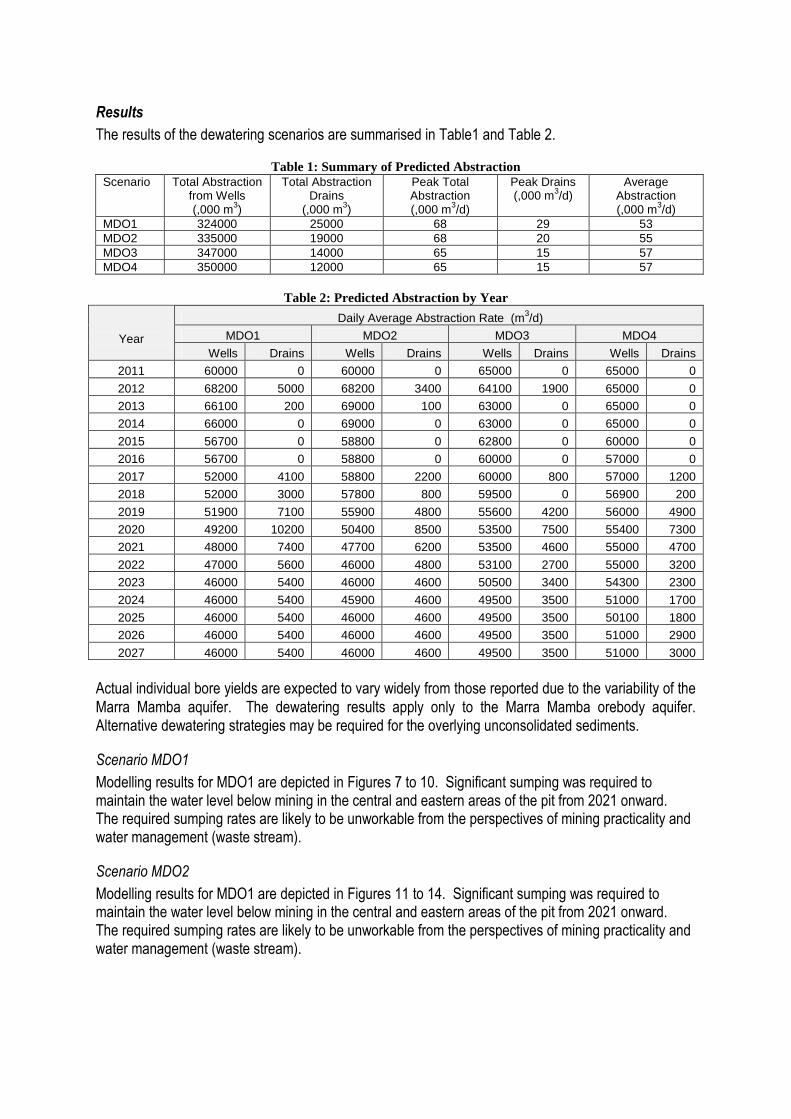
Table 2: Predicted Abstraction by Year
Daily Average Abstraction Rate (m3/d)
MDO1 MDO2 MDO3 MDO4
Year Wells Drains Wells Drains Wells Drains Wells Drains
2011 60000 0 60000 0 65000 0 65000 0
2012 68200 5000 68200 3400 64100 1900 65000 0
2013 66100 200 69000 100 63000 0 65000 0
2014 66000 0 69000 0 63000 0 65000 0
2015 56700 0 58800 0 62800 0 60000 0
2016 56700 0 58800 0 60000 0 57000 0
2017 52000 4100 58800 2200 60000 800 57000 1200
2018 52000 3000 57800 800 59500 0 56900 200
2019 51900 7100 55900 4800 55600 4200 56000 4900
2020 49200 10200 50400 8500 53500 7500 55400 7300
2021 48000 7400 47700 6200 53500 4600 55000 4700
2022 47000 5600 46000 4800 53100 2700 55000 3200
2023 46000 5400 46000 4600 50500 3400 54300 2300
2024 46000 5400 45900 4600 49500 3500 51000 1700
2025 46000 5400 46000 4600 49500 3500 50100 1800
2026 46000 5400 46000 4600 49500 3500 51000 2900
2027 46000 5400 46000 4600 49500 3500 51000 3000
� $ �+ ,��� ) �� �) + ,��� ���6 ��,) !� ����� � �$ ��) ��� �� �6 �- �) �,6 ���� ���* � !����� � ���) �) + ���� ��* ��� �� ��,��6 �� ���* ��� �� � � �� � 7 + ������ � �* �� ) �- ����� & � ��!+ ,�!� � � ,6 � � � ,6 � �� � �* �� � �� � � �� � � ���� ) 6 � 7 + ������� ,���� ��� ��) �- ����� & �!�� ��& ��!�� 6 ������7 + ���) ��� ���* ��� � ��,6 �� & �+ � $ � � !� ,�) ��) �!�) ���� �!��
����������
�� ) �,,�� & ���!+ ,�!��� ���(9 � ���) �� �$ ��) ��� �1 �& + ��!�: ��� � � ���� �& � ���$ � ��!+ �� �� & �- !���7 + ���) ��� �� �� � �� ��* ��- ����,�� �,���,� - ���� �� & ��� ��* ��$ �� �� ,� � ) �� !���� � �� !�� ���* ��� ������ ��� � � �� � - �) ����* ����7 + ���) �!+ �� �� & �� ��!� ���,�. �,6 ��� ����+ � - � �. �,����� ���* ��� ��!� �$ ��� �!�� ����� �� & �� � $ ��$ ,��6 � � ) �- ����� � & ���� ��/- !���!��� �0��
�����������
�� ) �,,�� & ���!+ ,�!��� ���(9 � ���) �� �$ ��) ��� �1 �& + ��!� ��� � ���� �& � ���$ � ��!+ �� �� & �- !���7 + ���) ��� �� �� � �� ��* ��- ����,�� �,���,� - ���� �� & ��� ��* ��$ �� �� ,� � ) �� !���� � �� !�� ���* ��� ������ ��� � � �� � - �) ����* ����7 + ���) �!+ �� �� & �� ��!� ���,�. �,6 ��� ����+ � - � �. �,����� ���* ��� ��!� �$ ��� �!�� ����� �� & �� � $ ��$ ,��6 � � ) �- ����� � & ���� ��/- !���!��� �0���
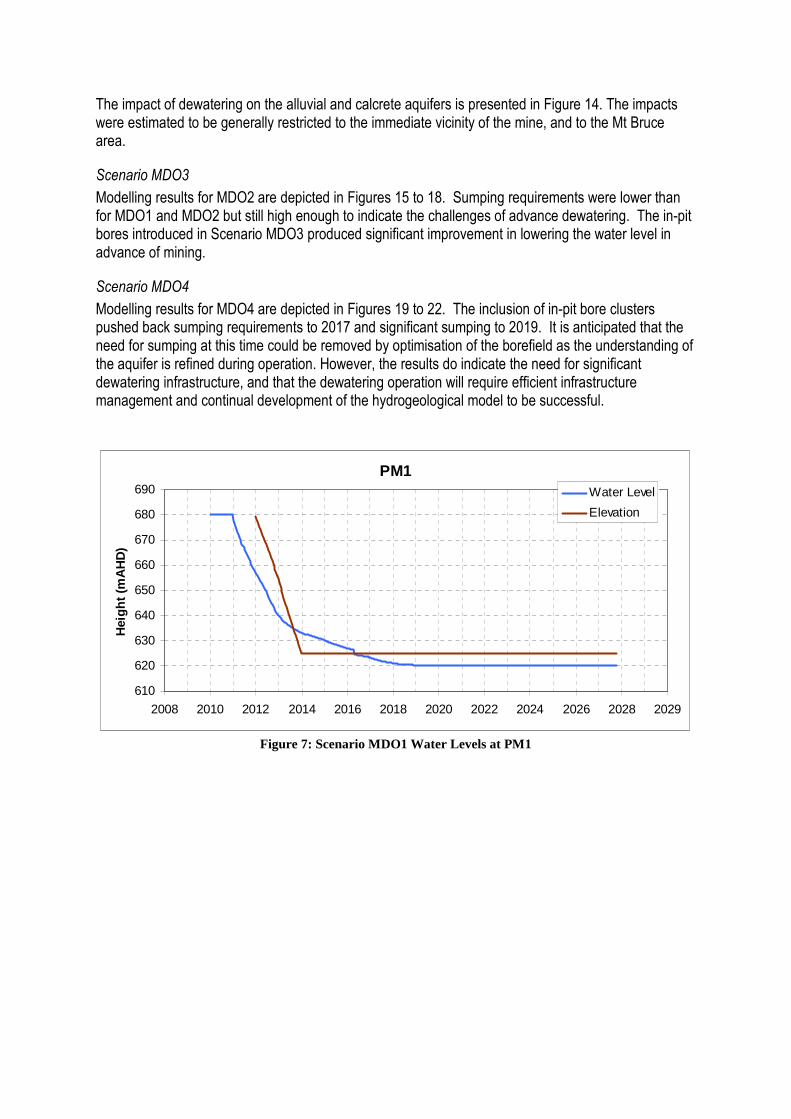
�* ����� $ ��� ��) �- ����� & �� � ��* �� ,,+ � � ,� � ) �$ ,$ ����� 7 + ����!��!�� ��!�� ��) ��� �1 �& + ��� ���* ����� $ �!�- �����!��� ��) ��� ����& �� �� ,,6 ���!���$ ��) ��� ��* ������) � ���� �$ �� ��6 �� ���* ����� �'� � ) ��� ��* �����2 �+ $ �� �� ��
�����������
�� ) �,,�� & ���!+ ,�!��� ���(9 � � ���) �� �$ ��) ��� �1 �& + ��!� ���� � � ���� + �� �� & ���7 + ������ �!�- ����,� - ����* � ��� ���(9 � � ) ��(9 � ��+ ��!��,,�* �& * ��� � + & * ��� ��� ) �$ ����* ��$ * ,,�� & �!�� �� ) � � $ ��) �- ����� & ����* ���� >� ����� ��!��� ��� ) + $ �) ��� �� $ �� ��� ��(9 <�� �� ) + $ �) �!�& � ���$ � ����� �� � ���� ���� �,� - ���� & ��* ��- ����,�� �,��� � ) � � $ ��� ����� �� & ��
����������"
�� ) �,,�� & ���!+ ,�!��� ���(9 � ���) �� �$ ��) ��� �1 �& + ��!� A ��� �� � ����* ���� $ ,+ !�� � �� ���� >� ����� ���$ ,+ !���!�� + !* �) �� $ . �!+ �� �� & ���7 + ������ �!��� �� � : � � ) �!�& � ���$ � ��!+ �� �� & ��� �� � A ���@���!� � ��$ �� ��) ��* ���* ��� ��) ��� ��!+ �� �� & � ���* �!������$ � + ,) �������� � �) ��6 �� � ����! ��� � �� ���* ���� �����,) � !��* ��+ � ) ��!� � ) �� & �� ���* �� 7 + ������!������ �) �) + ��� & �� � �� ��� � ���� - �� ��'��* ����!+ ,�!�) � ��� ) �$ ����* ��� ��) ��� ��!�& � ���$ � ��) �- ����� & ��� �� !��+ $ �+ ��'� � ) ��* ���* ��) �- ����� & �� � �� ��� � �- �,,���7 + ��������$ ��� ���� �� !��+ $ �+ ���� � & ���� �� � ) �$ � � ��� + ,�) �� �,� � ��� ��� ���* ��* 6 ) �� & �� ,� & �$ ,��� ) �,��� ����!+ $ $ �!!�+ ,�����
PM1
610
620
630
640
650
660
670
680
690
2008 2010 2012 2014 2016 2018 2020 2022 2024 2026 2028 2029
Hei
ght (
mA
HD
)
Water Level
Elevation
�Figure 7: Scenario MDO1 Water Levels at PM1
��

PM2
540
560
580
600
620
640
660
680
700
2008 2010 2012 2014 2016 2018 2020 2022 2024 2026 2028 2029
Hei
ght (
mA
HD
)
Water Level
Elevation
�Figure 8: Scenario MDO1, Water Levels at PM2
�
PM3
540
560
580
600
620
640
660
680
700
2008 2010 2012 2014 2016 2018 2020 2022 2024 2026 2028 2029
Hei
ght (
mA
HD
)
Water Level
Elevation
�Figure 9: Scenario MDO1, Water Levels at PM3
�

�
�����
�����
�����
�����
�����
�����
�����
����
���� ���� ���� ���� ��� ���� ���� ���� ���� ���
�����������
��
���
� ����
�Figure 10: Scenario MDO1- Abstraction Rate over Time
�
PM1
610
620
630
640
650
660
670
680
690
2008 2010 2012 2014 2016 2018 2020 2022 2024 2026 2028 2029
Hei
ght (
mA
HD
)
Water Level
Elevation
�Figure 11: Scenario MDO2, Water Levels at PM1
�
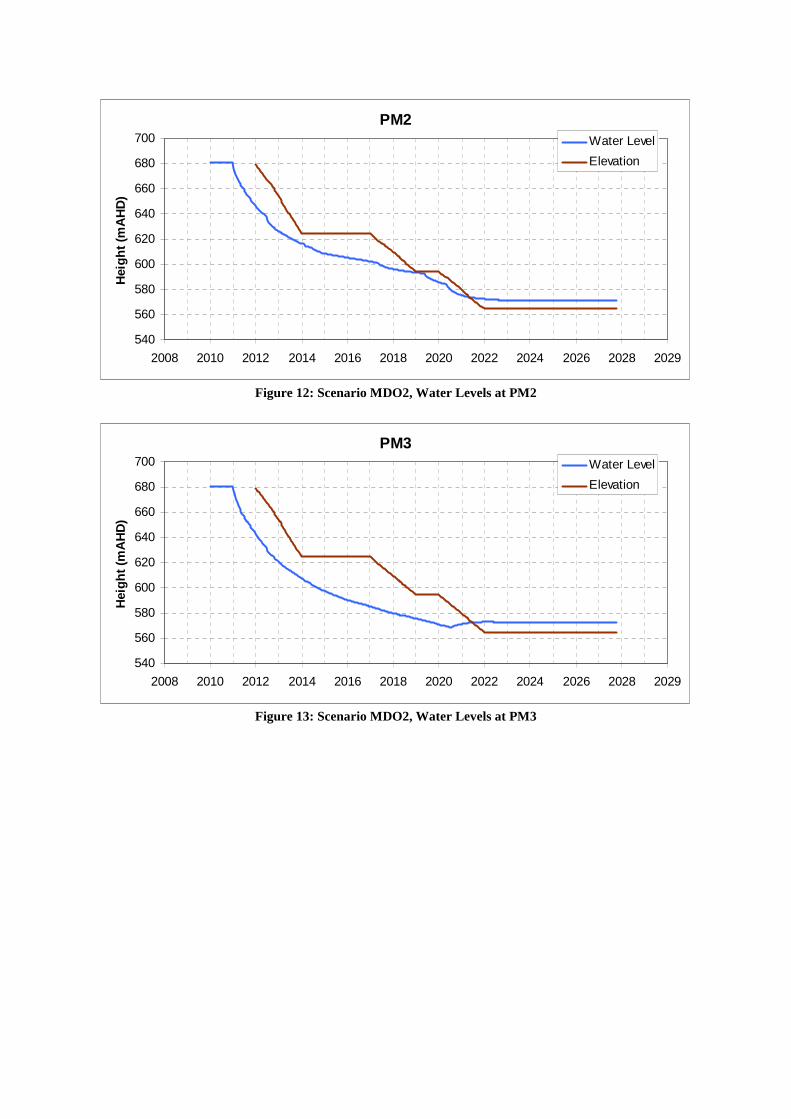
PM2
540
560
580
600
620
640
660
680
700
2008 2010 2012 2014 2016 2018 2020 2022 2024 2026 2028 2029
Hei
ght (
mA
HD
)
Water Level
Elevation
�Figure 12: Scenario MDO2, Water Levels at PM2
�
PM3
540
560
580
600
620
640
660
680
700
2008 2010 2012 2014 2016 2018 2020 2022 2024 2026 2028 2029
Hei
ght (
mA
HD
)
Water Level
Elevation
�Figure 13: Scenario MDO2, Water Levels at PM3
�

�Figure 14: Scenario MDO2 Impacts in Layer 1

�
��
�
�
PM1
610
620
630
640
650
660
670
680
690
2008 2010 2012 2013 2015 2017 2019 2021 2023 2025 2027 2029
Hei
ght (
mA
HD
)Water Level
Elevation
�Figure 15: Scenario MDO3 Water levels at PM1
�
PM2
540
560
580
600
620
640
660
680
700
2008 2010 2012 2013 2015 2017 2019 2021 2023 2025 2027 2029
Hei
ght (
mA
HD
)
Water Level
Elevation
�Figure 16: Scenario MDO3 Water Levels at PM2

% �� ��
�
PM3
540
560
580
600
620
640
660
680
700
2008 2010 2012 2013 2015 2017 2019 2021 2023 2025 2027
Hei
ght (
mA
HD
)Water Level
Elevation
�Figure 17: Scenario MDO3 Water Levels at PM3
�
�
�����
�����
�����
�����
�����
�����
�����
���� ���� ���� ���� ��� ���� ���� ���� ���� ���
�����������
��
���
� ����
�Figure 18: Scenario MDO3- Abstraction Rate over Time
��

% �� �� �
�
PM1
610
620
630
640
650
660
670
680
690
2008 2010 2012 2014 2016 2018 2020 2022 2024 2026 2028 2029
Hei
ght (
mA
HD
)Water Level
Elevation
�Figure 19: Scenario MDO4 Water Levels at PM1
�
PM2
540
560
580
600
620
640
660
680
700
2008 2010 2012 2014 2016 2018 2020 2022 2024 2026 2028 2029
Hei
ght (
mA
HD
)
Water Level
Elevation
�Figure 20: Scenario MDO4 Water Levels at PM2
�
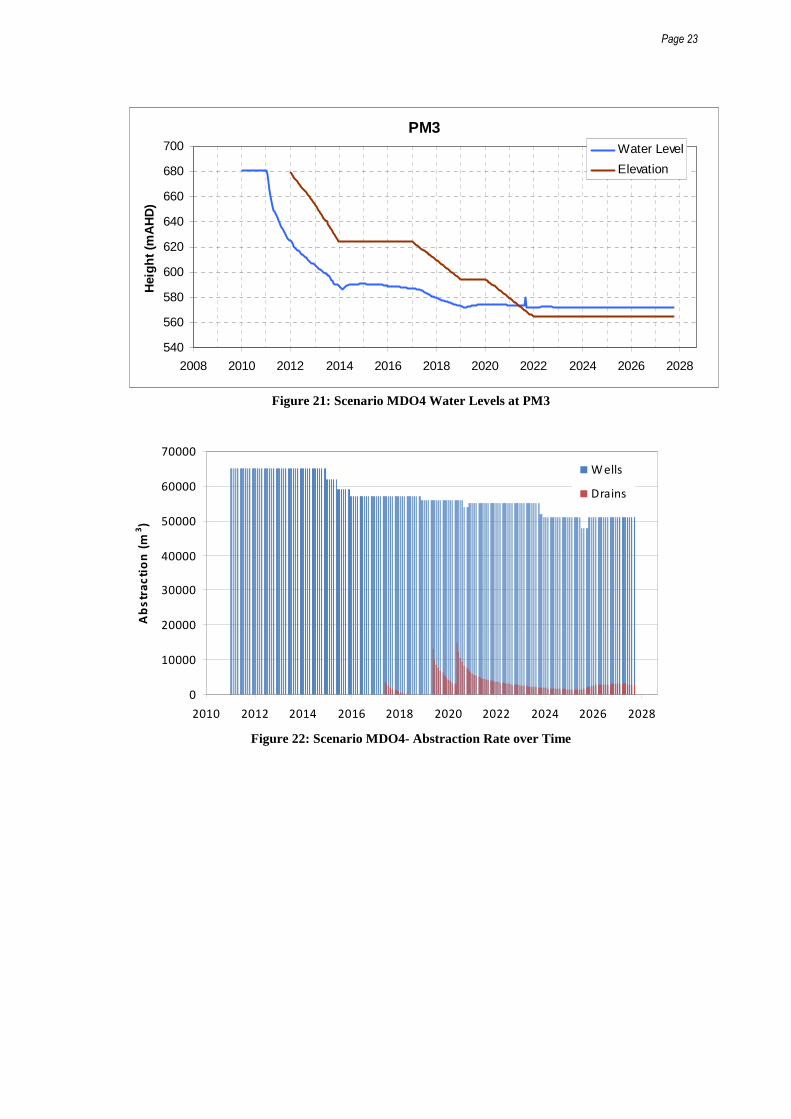
% �� �� �
�
PM3
540
560
580
600
620
640
660
680
700
2008 2010 2012 2014 2016 2018 2020 2022 2024 2026 2028
Hei
ght (
mA
HD
)Water Level
Elevation
�Figure 21: Scenario MDO4 Water Levels at PM3
�
�
�����
�����
�����
�����
�����
�����
�����
���� ���� ���� ���� ��� ���� ���� ���� ���� ���
�����������
��
���
� ����
�Figure 22: Scenario MDO4- Abstraction Rate over Time

% �� �� "
�
% � � �� � � � �� �'�� � � �� � � � �� � � �� � � � ��� �� � ��� � �
��� � ��� � ) �!$ �� ��� ��� ) �,,�� & ��6 ������
�� �� � � � � ��� � � �* �� $ � � $ �� �+ ,�� $ . & �� + � ) � � ) � $ � � !��+ $ ��� � � � �� �* �� � � + �* ��� � 1 � ���!$ + �� % �� + � ) - ������ ) �,� ���� + �,�� �) ��� �����/� � � : 0���* ��� � + �* 1 � ���B � �& �� + � ) - ������ ) �,�- !�+ !�) ��� �!��+ , ����* ���� #�$ ��� � �� �� - ���� �� �� � �* �� � � + �* ��� � 1 � ���!$ + �� 7 + ������ � �* �!�� !$ �� ��� !� - ���� $ ����) � � + �� ���� ��� �* ��$ � �� ,���� � � � �� �* �� � 1 2 � �� #�$ ��� � � ��� ,� - * �$ * � - !� ) �!�& � �) � �� � � ,�) ��� �* �� ����$ ��� �� �!!� � �� �* ��� � + �* 1 � ���B � ��� ) �,��� ��� ��) �$ ��� � �� ���� #�$ ��� � ���
� � ( ��� �� � ��� � �� � � � ���� � �
����������������������
@� #�$ ��� � � !$ �� ��� !� - ���� � �� � �) �) ��6 ���� ���� �� � /���(� ) !� � '� � ��!�� $ � ���'� !�� � �� ������� � � � � 0���* ��- ����,�� �,���!� � � !��- !���!��) ��� ���� #�$ ��� � ��� �� ��* ���� �!��� & ��� �����,) � � ) ��� �� � �* 6 � � �* ���$ ,��� ��� ) �) � �� �����,) � $ � � � �� �� & � � � ) ) ���� � ,� ��� �� �� ��!� !� $ �) � � . �� � ��� �� � �* �� � � ��* �� � � �,�� �!+ �� ��!�!��* ���� #�$ ��� � �!$ �� ��� !��� ) �,,�) ��� ���* �!�!�+ ) 6 � � ) �1 �& + ��� ��,,+ !�� ��!��* ��,� $ ��� � �� ���* ���� �!��� & � � ) ��� ��� ) �) ��� �����,) ����
Table 2: Injection Scenarios Scenario Borefield Flow rate Timing
SFB1 Existing SFB 15000 m3/d 2011 to 2027 SFB2 Existing SFB + five new
bores to north 15000 m3/d 2011 to 2027
SFB3 Existing SFB 30000 m3/d 15000 m3/d
2011 to 2013 2014 to 2027
SFB4 Existing SFB + five new bores to north
30000 m3/d 15000 m3/d
2011 to 2013 2014 to 2027
��* ���� #�$ ��� � �� ���� ) !�- ����$ � � !�!��� ��- ��* ��* ��� � � ) � � �� $ � � ���� ��!$ * �) + ,����1 ,� - �- !�) �!����+ ��) ��� � $ * ��� �� � � �� � �� ��,6 ��� �� �) �� �* ��� �& �� + � ) - ���� ���* ���� ) �� ���* ��� $ � � ���� ��,������� �,��� �& �� �!��* ���� #�$ ��� � �� ����� �� $ * ��� ����
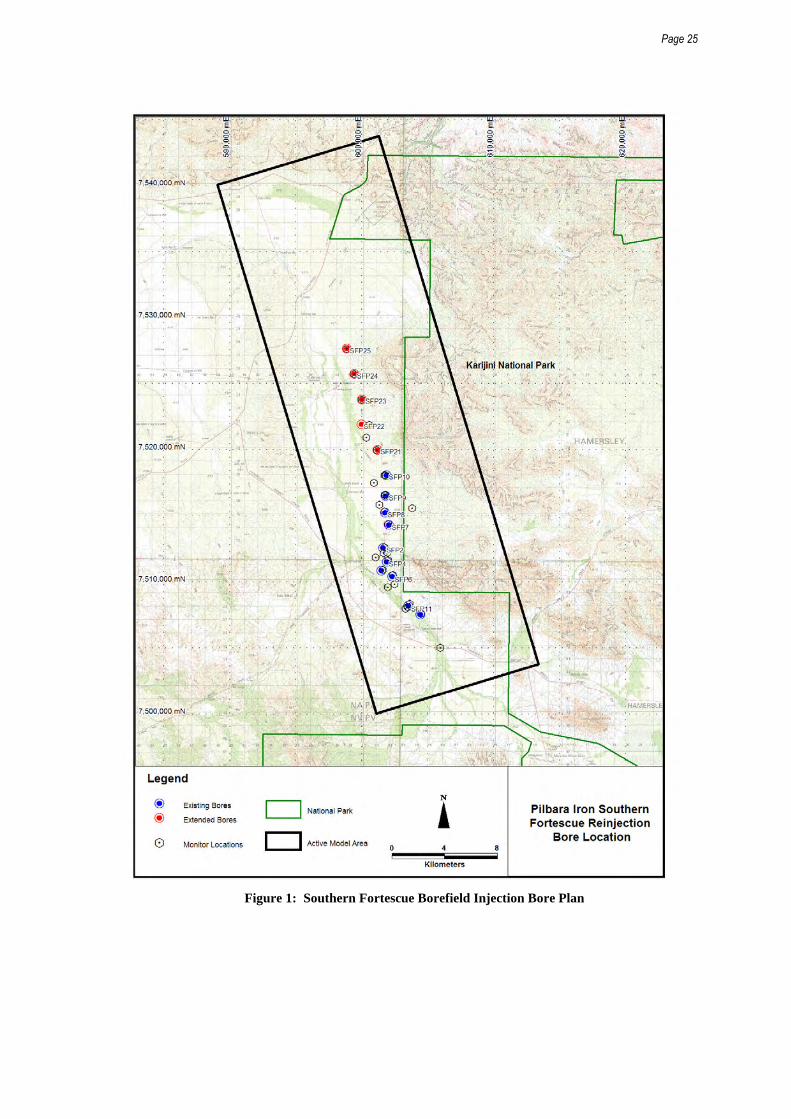
% �� �� &
�
� Figure 1: Southern Fortescue Borefield Injection Bore Plan
��

% �� �� '
�
Table 3: Injection Flow Rate Summary
Bore SFB1 (m3/d)
SFB2 (m3/d)
SFB3 (m3/d) 2011-2013 2014-2027
SFB4 (m3/d) 2011-2013 2014-2027
SFP2 1000 1000 1750 700 1400 600 SFP4 1000 1000 1750 700 1400 600 SFP5 1300 1000 1950 1300 1700 1000 SFP6 1300 1000 1950 1300 1700 1000 SFP7 1500 1800 4800 1500 2000 1800 SFP8 1500 1600 4800 1500 3500 1600 SFP9 3450 1800 5000 3600 3800 1800 SFP10 3450 1000 5000 3600 3800 1800 SFP11 400 400 1500 400 800 400 SFP12 400 400 1500 400 800 400 SFP21 0 1000 0 0 2000 1000 SFP22 0 1200 0 0 3000 1200 SFP23 0 700 0 0 1400 700 SFP24 0 700 0 0 1400 700 SFP25 0 400 0 0 1300 400 Total (m3/d) 15000 15000 30000 15000 30000 15000 �
�������
�� �,��<���,� - �& �� �!��* ���!��� ��) ���� ,�) �� �* ��� �- ������ ��� $ * �!$ �� ��� ����* ���� � ��� ��� & �� � �� �!�,�!��) � ����� �!��� & ��� � ��� ��� & ��� ��!�/� 1 9 � 0� � ) ��* ���� #�$ ��� � ��� ��!�/� 1 9 �!� � � ) �� 1 � 0������ ��+ , ��) �* 6 ) �� & � � * !� ���* ���� � ��� ��� & ��� ���,� $ ��� � !� ���& �� �� ��� ��� $ * �!$ �� ��� ��� �1 �& + ���� ��� �1 �& + ����������* ��. �6 ���� ) �� & !�� ���* ���� #�$ ��� � ��� ) �,,�� & �- ������
• - ����,�� �,!��� ��* ���� �����,) �- � + ,) �,�. �,6 ���!���� ����- ��� ���� � � ) ��- �� �6 ������!�� ��& �� + � ) �!+ �� $ �� ����� � �6 � �!'��� �� ,,��� + ��!$ �� ��� !?��
• �* ���� �����,) ��� ��� !�� � �� 6 ���) + $ ���* ����� ,�- ����,�� �,��� ��* �� �� �� ���* ���� �!��� & ��� �����,) ��6 � � � �� � �� ��,6 ��* ���������!?� � ) �
• �* ����� $ ��� ���� #�$ ��� & � ��<� '� � � �<=) ��� ���* �����!���* ����6 � �!'�� �* ����* � � �'� � � ��<=) '��!� � � ) ) ���� � ,�- ����,�� �,���!��� �� � � �� � �� ��,6 ��- � ������!��
��* �����!�� � ��� �� ,��� ��� � ����! ��� � �) + ��� & �� � �� ��� � ��� �!� �� ) ��* ��- ����,�� �,���!���� ����� �� ,6 � $ �� !!��* ���� �����,) ����* ��� � ��� �� ,��� ��!�� . * � ,���� * � $ ���� ��� ���� �� ��� � � !� ���!+ ,��� ���� #�$ ��� � ��� �� ��* ��� � + �* ��� �1 � ���!$ + ��2 � �����,) �- !�� � ��$ � � !�) ���) � !�� ���� ���* �!�!�+ ) 6 �����

% �� �� (
�
Table 4: Scenario Results –1 �� ,�(�� �* ��� ��ater (mbgl) Depth to Water (mbgl)
Monitoring Point SFB1 SFB2 SFB3 SFB4
SF01 16.5 25.3 14.4 17.0
SF02 15.6 18.6 14.2 17.4
SF04 19.1 22.4 17.0 20.1
SF05 34.2 37.1 32.2 34.8
SF06 14.9 17.8 13.5 16.5
SF07 13.8 16.8 12.4 15.5
SF07D 19.7 23.7 17.5 21.3
SF08 15.2 18.2 13.9 17.0
SF10 22.0 22.2 20.1 19.8
SF011 16.5 19.6 14.4 17.0
SF012 13.4 14.2 12.8 13.7
SF013 15.5 17.7 14.1 16.6
SF015 15.2 17.5 13.8 16.3
SF016 21.1 24.4 19.0 21.6
SFObs10 19.4 23.7 17.2 20.6
SFObs9 17.2 22.3 14.9 19.9
SFObs8 18.0 20.9 16.1 18.7
SFObs7 20.6 23.2 18.7 21.3
SFObs2 12.2 15.1 11.4 14.6
SFObs4 14.1 17.2 13.0 16.3
SFObs5 12.9 16.3 11.4 15.0
SFObs6 16.9 21.1 15.5 19.8
SFObs11 16.0 18.3 14.6 17.1
SFObs12 13.9 15.7 12.7 14.7
SF21 18.4 15.9
SF22 23.5 21.1
SF23 17.8 15.5
SF24 16.4 14.2
SF25 13.0 11.2
Average, existing borefield (mbgl) 17.2 20.4 15.6 18.4
Average, total borefield (mbgl 17.2 19.9 15.6 18.0

% �� �� )
�
0
10
20
30
40
50
60
702008 2010 2012 2014 2016 2018 2020 2022 2024 2026 2028 2029
Wat
er L
evel
(mbg
l)
SF011
SF01
SF02
SF04
SF05
SF06
SF07
SF07D
SF08
SF010
SF012
SF013
SF015
SF016
SFObs10
SFObs9
SFObs8
SFObs7
SFObs2
SFObs4
SFObs5
SFObs6
SFObs11
SFObs12
�Figure 2: Scenario SFB1 Simulated Hydrographs
���
0
10
20
30
40
50
60
70
2010 2012 2014 2016 2018 2020 2022 2024 2026 2028 2029
Wat
er L
evel
(mbg
l)
SF011SF01SF02SF04SF05SF06SF07SF07DSF08SF010SF012SF013SF015SF016SF21SF22SF23SF24SF25SFObs10SFObs9SFObs8SFObs7SFObs2SFObs4SFObs5SFObs6SFObs11SFObs12
�Figure 3: Scenario SFB2 Simulated Hydrographs
�

% �� �� *
�
0
10
20
30
40
50
60
702008 2010 2012 2014 2016 2018 2020 2022 2024 2026 2028 2029
Wat
er L
evel
(mbg
l)
SF011
SF01
SF02
SF04
SF05
SF06
SF07
SF07D
SF010
SF012
SF08
SF013
SF015
SF016
SFObs10
SFObs9
SFObs8
SFObs7
SFObs2
SFObs4
SFObs5
SFObs6
SFObs11
SFObs12
�Figure 4: Scenario SFB3 Simulated Hydrographs
���
0
10
20
30
40
50
60
702010 2012 2014 2016 2018 2020 2022 2024 2026 2028 2029
Wat
er L
evel
(mbg
l)
SF011SF01SF02SF04SF05SF06SF07SF08SF010SF013SF015SF016SF012SF21SF22SF23SF24SF25SFObs10SFObs9SFObs8SFObs7SFObs2SFObs4SFObs5SFObs6SFObs11SFObs12
�Figure 5: Scenario SFB4 Simulated Hydrographs
��# � $� � � � � � ��MWH, 2007, Southern Fortescue Borefield Numerical Modelling, unpublished consultant report prepared for Pilbara Iron
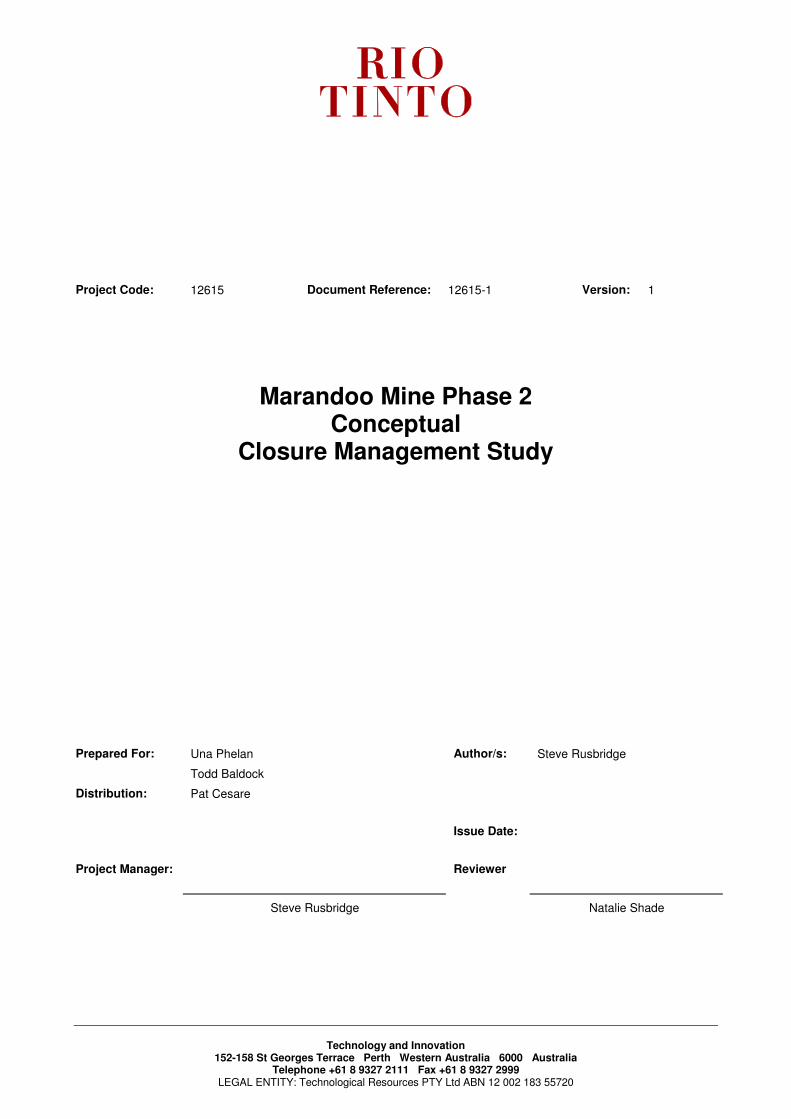
Technology and Innovation
152-158 St Georges Terrace Perth Western Australia 6000 Australia Telephone +61 8 9327 2111 Fax +61 8 9327 2999
LEGAL ENTITY: Technological Resources PTY Ltd ABN 12 002 183 55720
Project Code: 12615 Document Reference: 12615-1 Version: 1
Marandoo Mine Phase 2 Conceptual
Closure Management Study
Prepared For: Una Phelan
Todd Baldock
Author/s:
Distribution:
Steve Rusbridge
Pat Cesare
Issue Date:
Project Manager: Reviewer
Steve Rusbridge Natalie Shade


Technology and Innovation
Report No 12567-1
Date 17 September 2008 ©2008 Technology and Innovation
SECTION 1 - EXECUTIVE SUMMARY
This Closure Management Study presents Pilbara Iron’s strategy for the closure of the proposed
Marandoo Mine Phase 2 (MMP2) project. Pilbara Iron currently owns and operates the existing
Marandoo Iron Ore Mine, which is located approximately 37km east of the town of Tom Price. The
current operation has approval to mine iron ore from above water table only. Based on the results
of a number of technical investigations, Pilbara Iron are now conducting a Pre-Feasibility study into
a proposal to extend the Marandoo mine life by approximately 15-20 years with the extension of
the existing Marandoo pit to extract below water table ore reserves at a production rate of
approximately 16Mtpa.
This study has been developed to describe the conceptual closure management of the MMP2
project to provide input into the Public Environmental Review, the study is also designed to meet
the requirements of the Rio Tinto Closure Standard. This study addresses the closure of the entire
Marandoo Operation as it is proposed to exist at the end of mining of the MMP2 project, and
covers the knowledge base, closure strategy, and closure management plan scope. Detailed
closure costs have not been included as part of this study, however these will be developed at a
later stage of the project to ensure adequate financial provisions for closure are maintained.
As the MMP2 project is still at the Pre-Feasibility stage, final design and configuration of the mine
are yet to be decided; as such, this plan reflects the current status and knowledge of the project.
The plan will be reviewed during the Feasibility stage of the project and again after construction
and commissioning. As required by the Rio Tinto Closure Standard the closure plan will be fully
reviewed every five years during the mines life, a detailed Decommissioning Closure Plan will be
developed five years prior to planned closure and refined annually up to closure. Given the
sensitive location of the MMP2 project feedback from stakeholder consultation will be an important
consideration in the review of the closure plan.
The knowledge base of this report provides primary data related to the existing environment,
stakeholders and community, closure obligations and assumptions. Gaps in the knowledge base
have been identified and actions proposed for future improvements have also been included.
The closure strategy outlines the closure vision and proposed post closure land use for the MMP2
project area at the cessation of mining. As this project is an extension of the existing Marandoo
Operation the current closure vision and post closure land use have been maintained. The
strategy contains a group of closure objectives and performance targets with specific closure
measures developed to meet these targets.
The closure management plan scope provides specific detail on how the closure strategy will be
achieved, with specific management plans related to decommissioning, decontamination,
rehabilitation and monitoring.


Technology and Innovation
Report No 12567-1
Date 17 September 2008 ©2008 Technology and Innovation
CONTENTS
Page
1 INTRODUCTION ................................................................................................................... 9
2 CLOSURE PLANNING PROCESS ..................................................................................... 11
2.1 RIO TINTO CLOSURE STANDARD ...................................................................... 11
2.2 CLOSURE SCHEDULE AND REVIEW .................................................................. 13
2.2.1 CLOSURE PLANNING AND REVIEW ...................................................................................13
2.2.2 CLOSURE PLAN REVIEW .....................................................................................................14
2.2.3 CLOSURE SCHEDULE ..........................................................................................................14
2.2.4 DECOMMISSIONING CLOSURE PLAN ................................................................................14
2.3 CLOSURE SCENARIOS........................................................................................ 15
2.3.1 PLANNED CLOSURE.............................................................................................................15
2.3.2 UNPLANNED CLOSURE .......................................................................................................15
2.3.3 TEMPORARY CLOSURE (CARE AND MAINTENANCE) .....................................................15
3 KNOWLEDGE BASE .......................................................................................................... 16
3.1 OVERVIEW OF OPERATIONS.............................................................................. 16
3.1.1 MMP2 RELATIONSHIP TO OTHER PROJECTS ..................................................................17
3.1.2 PROPOSED SITE LAYOUT ...................................................................................................17
3.1.3 DISTURBANCE AREA ...........................................................................................................20
3.2 LEGAL AND OTHER OBLIGATIONS..................................................................... 21
3.2.1 LEGAL OBLIGATIONS RELEVANT TO CLOSURE ..............................................................21
3.2.2 GENERAL OBLIGATIONS .....................................................................................................21
3.2.3 CORPORATE OBLIGATIONS................................................................................................22
3.3 EXISTING ENVIRONMENT ................................................................................... 23
3.3.1 CLIMATE.................................................................................................................................23
3.3.2 GEOLOGY AND SOILS..........................................................................................................23
3.3.3 HYDROLOGY .........................................................................................................................24
3.3.4 HYDROGEOLOGY .................................................................................................................24
3.3.5 PHYSIOGRAPHIC CONTEXT................................................................................................27
3.3.6 BIOLOGICAL CONTEXT ........................................................................................................27
3.3.7 PROGRESSIVE REHABILITATION .......................................................................................27
3.3.8 STAKEHOLDERS AND COMMUNITY...................................................................................30
3.3.9 ABORIGINAL AND EUROPEAN HERITAGE.........................................................................31
3.4 SURROUNDING LAND USE ................................................................................. 32

Technology and Innovation
Report No 12567-1
©2008 Technology and Innovation Date 17 September 2008
4 CLOSURE STRATEGY....................................................................................................... 33
4.1 CLOSURE VISION................................................................................................. 33
4.2 POST CLOSURE LAND USE OPTION.................................................................. 35
4.3 OBJECTIVES AND PERFORMANCE TARGETS .................................................. 36
5 CLOSURE MANAGEMENT PLAN SCOPE ........................................................................ 39
5.1 DECOMMISSIONING PLAN .................................................................................. 40
5.1.1 DECOMMISSIONING INVENTORY.......................................................................................40
5.1.2 DECOMMISSIONING MEASURES........................................................................................40
5.1.3 DECOMMISSIONING ASSUMPTIONS AND EXCLUSIONS.................................................43
5.2 DECONTAMINATION PLAN.................................................................................. 44
5.2.1 DECONTAMINATION INVENTORY.......................................................................................44
5.2.2 DECONTAMINATION MEASURES........................................................................................45
5.2.3 DECONTAMINATION ASSUMPTIONS AND EXCLUSIONS ................................................46
5.3 REHABILITATION PLAN ....................................................................................... 47
5.3.1 REHABILITATION INVENTORY ............................................................................................48
5.3.2 REHABILITATION MEASURES .............................................................................................48
5.3.3 REHABILITATION SCHEDULE..............................................................................................52
5.3.4 REHABILITATION ASSUMPTIONS AND EXCLUSIONS ......................................................52
5.4 MONITORING PLAN.............................................................................................. 54
5.4.1 MONITORING SCHEDULE ....................................................................................................54
5.4.2 MONITORING MEASURES ...................................................................................................54
5.5 WORKFORCE MANAGEMENT PLAN................................................................... 55
5.5.1 WORKFORCE INVENTORY ..................................................................................................55
5.5.2 WORKFORCE MEASURES ...................................................................................................55
5.6 INFORMATION, COMMUNICATION AND CONSULTATION PROGRAMME........ 57
5.6.1 STAKEHOLDER REGISTER..................................................................................................57
5.6.2 CLOSURE MEASURES .........................................................................................................57
5.6.3 INFORMATION, COMMUNICATION AND CONSULTATION ASSUMPTIONS AND
EXCLUSIONS.........................................................................................................................58
6 CLOSURE RISKS ............................................................................................................... 59
7 CLOSURE PLANNING IMPROVEMENT ............................................................................ 60
8 BIBLIOGRAPHY ................................................................................................................. 61

Technology and Innovation
Report No 12567-1
Date 17 September 2008 ©2008 Technology and Innovation
List of Tables
Table 1: Approximate additional ground disturbance for MMP2 ........................................... 20
Table 2: Species currently being trialled in Rehabilitation at Marandoo................................ 29
Table 3: Conceptual Objectives and Targets for Closure at Marandoo................................. 36
Table 4: Decommissioning Objectives and Targets.............................................................. 40
Table 5: Decommissioning Measures for MMP2 .................................................................. 41
Table 6: Decontamination Objectives and Targets............................................................... 44
Table 7: Decontamination Measures for MMP2 ................................................................... 45
Table 8: Rehabilitation Objectives and Targets .................................................................... 47
Table 9: Rehabilitation Measures......................................................................................... 49
Table 10: Monitoring Measures.............................................................................................. 54
Table 11: Workforce Objectives and Targets ......................................................................... 55
Table 12: Workforce Measures .............................................................................................. 56
Table 13: Community and Stakeholder Objectives and Targets............................................. 57
Table 14: Information, Communication and Consultation Measures....................................... 58
List of Figures
Figure 1: Regional Location of Marandoo Mine ..................................................................... 10
Figure 2: The Stages of Closure Management Plan Development ........................................ 11
Figure 3: Closure Planning Process ...................................................................................... 13
Figure 4: Marandoo Mine and Infrastructure Conceptual Layout ........................................... 18
Figure 5: Marandoo Mine, Camp and Borefield Conceptual Layout....................................... 19
Figure 6: Stylised Conceptual Hydrological Model for Marandoo Pit at Closure .................... 26


Technology and Innovation
Report No 12567-1 Page 9
Date 17 September 2008 ©2008 Technology and Innovation
SECTION 2 – CLOSURE PLAN
1 INTRODUCTION
Pilbara Iron Company (Services) Pty Ltd (Pilbara Iron) is responsible for the operation and
maintenance of iron ore mining, rail and shipping facilities in the Pilbara region of Western
Australia on behalf of Hamersley Iron Pty Ltd (Hamersley) and Robe River Iron Associates (Robe).
Pilbara Iron is a management entity within Rio Tinto Iron Ore (RTIO), a division of Rio Tinto Plc
(Rio Tinto).
Pilbara Iron manages the Marandoo Mine, which is located approximately 37km east of the town of
Tom Price (Figure 1). The Marandoo Mine was approved by the Minister for the Environment in
October 1992 and mining at the site commenced in 1994. Current production from the mine is
approximately 15 million tonnes per annum (Mtpa). The mine operates under the Iron Ore
(Hamersley Range) Agreement Act 1963 within a mining lease (AML 70/272) that was excised
from the Karijini National Park (KNP) in 1991.
The Marra Mamba type iron ore resource found at Marandoo occurs both above and below the
water table; Pilbara Iron currently has approval to mine the above water table (AWT) component of
the ore body. Between 1994 and 2006 a number of technical investigations were conducted to test
the feasibility of mining the below water table (BWT) resource. Based on the results of these
investigations Pilbara Iron is now conducting a Pre-Feasibility Study (PFS) on a proposal to extend
the Marandoo mine life by approximately 15-20 years with the extension of the existing Marandoo
pit to extract AWT and BWT ore reserves at a production rate of approximately 16Mtpa. This
proposal has been termed the Marandoo Mine Phase 2 (MMP2) Project (‘the project’).
Due to the sensitive location of the Marandoo Mine within the KNP, closure management is
particularly important to the long term success of the project. This Closure Planning Study
presents Pilbara Iron’s proposed strategy for the closure of the Marandoo operations (inclusive of
the proposed MMP2 infrastructure/disturbance). The information contained within this plan is the
most current information available at the time of writing and builds on the Closure Planning Study
developed in 2006 for the existing Marandoo Mine.
As the MMP2 project is still in the design phase, decisions are still being made as to the final
design and configuration of the mine and changes will occur as the project progresses. This plan
will be updated during the Feasibility stage of the project to reflect these changes and again after
construction and commissioning. During operation the closure plan will be updated at least every
five years in accordance with the Rio Tinto Closure Standard.

Technology and Innovation
Page 10 Report No 12567-1
©2008 Technology and Innovation Date 17 September 2008
Figure 1: Regional Location of Marandoo Mine

Technology and Innovation
Report No 12567-1 Page 11
Date 17 September 2008 ©2008 Technology and Innovation
2 CLOSURE PLANNING PROCESS
2.1 Rio Tinto Closure Standard
As a member of the Rio Tinto Group, Pilbara Iron operates in accordance with corporate policies
and directives. This Closure Management Study (CMS) presents Pilbara Iron’s conceptual
strategy for the closure of the MMP2 project in accordance with the Rio Tinto Closure Standard
(Rio Tinto, 2004) (the Standard) .
The specific intent of the Standard is:
“To ensure that Rio Tinto managed activities are left in a condition which minimises adverse
impacts on the human and natural environment, and that a legacy remains which makes a positive
contribution to sustainable development” (Rio Tinto, 2004)
Through the implementation of the Standard, Rio Tinto seeks to influence the design,
development, operation and closure of all of its operations to ensure the optimisation of post
closure outcomes in terms of social, environmental and economic development needs and
expectations. Planning for closure should commence from project inception followed by regular
review and update.
As described in the Standard, the closure planning process is an iterative process based on four
consecutive stages1 Knowledge Base, Closure Strategy, Closure Management Plan Scope and
Cost Estimation2 (Figure 2).
Figure 2: The Stages of Closure Management Plan Development
1 A Framework for Developing and Updating Closure Management Plans in Rio Tinto (Draft) – T Davis, M Errington: OTX Bristol 2006
2 Note: closure costs have not been developed as part of this Conceptual Closure Study, however these will be included in future
versions of the study to ensure adequate financial provisions for closure are maintained.

Technology and Innovation
Page 12 Report No 12567-1
©2008 Technology and Innovation Date 17 September 2008
The key features of each of these stages are:
• Knowledge Base – Collection and review of existing information relevant to closure. The
knowledge base must include:
- Characterisation of the socio-economic, cultural, biotic and abiotic environments;
- National, regional and local legal and regulatory requirements for closure;
- All agreements made with stakeholders.
• Closure Strategy – The desired closure and post closure options are evaluated and
documented and the preferred option chosen. The closure strategy includes:
- Establishing an overall vision for closure;
- Defining the post closure land use for the site;
- Objective and performance targets covering rehabilitation, biodiversity, socio-economics,
communications and employee relations; and,
- Identifying the specific closure options for each physical aspect of the site.
• Closure Management Plan Scope – Description of the vision for closure and preferred
closure option as developed through the closure strategy. The closure plan includes:
- Detailed description of closure and post closure mitigation programmes;
- Description of specific technical solutions related to infrastructure and facilities for the
preferred closure option;
- Ongoing consultation process related to the preferred closure option;
- Employee information, communication and consultation framework;
- List and assessment of risks and uncertainties associated with the preferred closure option;
- Detailed communication plan;
- Agreed process and time scale for post closure management and monitoring;
- Socio- economic mitigation programme.
• Cost Estimate
- Full auditable details of direct and indirect closure costs;
- Formal risk assessment to ensure the scope of work on which the cost is based is
comprehensive.

Technology and Innovation
Report No 12567-1 Page 13
Date 17 September 2008 ©2008 Technology and Innovation
2.2 Closure Schedule and Review
2.2.1 Closure Planning and Review
Closure planning is a life of mine process that continually evolves as aspects of the operations
change and understanding of specific closure requirements and constraints improve, closure
planning is initially conceptual and progressively becomes more detailed (ICMM,2008) as the mine
progresses (Figure 3). This CMS is based on the biophysical, socio-economic and mine
development detail available at time of preparation. It does not represent a final detailed mine
closure plan and will evolve through periodic review to reflect changes and improvements in the
various aspects of mine closure, planning and implementation. To assist with the identification of
these required changes and improvements Rio Tinto has adopted a process of closure planning
and review.
Figure 3: Closure Planning Process
(ICMM,2008)
Technology and Innovation
Page 14 Report No 12567-1
©2008 Technology and Innovation Date 17 September 2008
2.2.2 Closure Plan Review
It is a specific requirement of the Rio Tinto Closure Standard (2004) that a Closure Plan is
developed, implemented and reviewed on a regular basis. The Closure Plan must be fully updated
at least every five years. The update must identify the adequacy, performance and areas of risk
and opportunity of the Closure Plan. As shown in figure 3, feedback from stakeholder consultation
is a key component of reviews and will be considered during the update of the plan. In years
when the Closure Plan does not undergo a full review the closure cost estimate must be updated
to reflect known developments, scope changes, inflation, changes to exchange rates, new
regulatory requirements and other material developments.
As the MMP2 project is currently at PFS stage it is expected that the plan should be reviewed
during the Feasibility stage and again after construction and commissioning of the project to enable
the ‘as built’ plan to be developed. A detailed decommissioning closure plan will be developed five
years prior to planned closure.
2.2.3 Closure Schedule
The MMP2 project has a planned life of 15-20 years, where practicable decommissioning and
rehabilitation will be conducted progressively throughout the life of the operations. However, due
to the nature of the operation a large portion of the decommissioning and rehabilitation will not be
able to be conducted until after the completion of mining and processing operations. The bulk of
these post closure activities are expected to take between 3-4 years to complete, although capping
of the surface of the Residue Storage Facility (RSF) will not be possible until the facility is
sufficiently dry to allow machinery to operate safely. Details of the schedule leading up to the
planned closure date will be defined in future closure plans and more specifically in the final
Decommissioning Closure Plan.
2.2.4 Decommissioning Closure Plan
The Rio Tinto Closure Standard (2004) specifies that a detailed Decommissioning Closure Plan
must be prepared five years prior to the planned date of closure. The Decommissioning Closure
Plan will contain specific details of how closure will be achieved and will link to the CMS. The
Decommissioning Closure Plan is in effect a feasibility plan for closure and the level of detail and
cost estimation should reflect this, with an accuracy of ± 15 percent expected. The
Decommissioning Closure Plan should also outline the specific responsibilities for elements of
decommissioning.
Consultation with Regulatory agencies and other key stakeholders is especially important during
this phase of closure planning. It is during this phase that the objectives and targets for closure are
developed into the final agreed ‘completion criteria’ for the site upon which the success of closure
activities will be measured.
Technology and Innovation
Report No 12567-1 Page 15
Date 17 September 2008 ©2008 Technology and Innovation
2.3 Closure Scenarios
Closure may be initiated as a result of a number of scenarios that can be grouped under the
headings of Planned Closure, Unplanned Closure and Temporary Closure (care and
maintenance). The consideration of these scenarios within closure planning activities is a specific
requirement of the Strategic Framework for Mine Closure (ANZMEC/MCA, 2000).
2.3.1 Planned Closure
Planned closure effectively follows the process model described in Sections 2.1 and 2.2 and
shown in Figure 3. That is, the preparation of a Conceptual Closure Plan during the planning phase
of a project followed by regular reviews and updates of the Closure Plan during operations and the
development of a Decommissioning Closure Plan prior to planned closure and the systematic
implementation of this plan.
2.3.2 Unplanned Closure
In the event of sudden or unplanned closure, an accelerated closure process will need to be
implemented. This involves the immediate preparation and implementation of a Decommissioning
Closure Plan (based on the most current closure plan), taking into account the early cessation of
activities at the site.
2.3.3 Temporary Closure (Care and Maintenance)
It is possible that an operation may be temporarily suspended due to adverse economic or
operational circumstances (for example a downturn in commodity prices). A temporary shutdown
of this nature is normally planned and assumes that the operation will recommence. This would
involve the preparation and implementation of a modified Decommissioning Closure Plan that
takes into account the likelihood of future commencement of operations.
Technology and Innovation
Page 16 Report No 12567-1
©2008 Technology and Innovation Date 17 September 2008
3 KNOWLEDGE BASE
A comprehensive knowledge base has been compiled for the existing Marandoo operations as part
of the 2006 Marandoo Closure Study (PI, 2007) and this document has been reviewed in the
preparation of this CMS. In addition, the MMP2 Public Environmental Review (PER) document
provides a detailed description of the operational, environmental and social aspects of the MMP2
project and provides discussion on the numerous studies and surveys that have been conducted.
The PER effectively provides an update of the Knowledge Base for the MMP2 Project. Rather
than repeat the information in this report, reference has been made to the relevant section of the
PER with additional focus on the closure specific implications of the MMP2 project.
The knowledge base information is considered in the identification of a closure vision, post closure
land use option and setting of closure objectives and targets for the MMP2 project. The existing
knowledge base for the Marandoo operation will be comprehensively reviewed after
commissioning of the MMP2 Project and the information about the MMP2 project will be
incorporated at this time.
3.1 Overview of Operations
Marandoo was commissioned and incorporated into the Iron Ore (Hamersley Range) Agreement
Act 1963 in 1994. Mining at the site commenced in 1994 and is confined to extraction of ore AWT.
Pilbara Iron currently produces approximately 15 Mtpa of high grade iron ore from the mine, which
is transported via rail to Dampier and/or Cape Lambert Ports for blending with ore from other RTIO
operations (marketed as the ‘Pilbara Iron Blend’). Based on current production, the remaining
AWT resource at Marandoo will be mined out by 2012.
Pilbara Iron proposes to expand mining operations at Marandoo to maintain current production
from the site for an additional 15 – 20 years. The proposed mining will occur at, and adjacent to,
the existing mining area (within State Agreement Lease AML 70/272) and will include both AWT
and BWT mining. Figures 4 and 5 show the current layout of Marandoo and the proposed MMP2
expansion.
Construction for MMP2 is scheduled to commence in Quarter (Q) 1 2010. Based on this
construction start date, initial throughput of ore is expected to commence in Q1 2012.
MMP2 is planned to operate for approximately 15 – 20 years, although this is dependent on a
number of factors, including production rates being achieved and market conditions. Current mine
plans are based on a production rate of approximately 16Mtpa.
The MMP2 proposal involves:
• Expansion of existing open cut mine pit at Marandoo;
• AWT and BWT mining within the expanded mine pit by conventional drill and blast, load and haul (as currently occurs at Marandoo) and/or in-pit crushing and conveying (IPCC);
• Establishing new waste dumps, topsoil/subsoil stockpiles and haul roads;
• Modifying and/or extending the existing Marandoo dry processing plant to allow for wet processing (de-sliming) of ore;
Technology and Innovation
Report No 12567-1 Page 17
Date 17 September 2008 ©2008 Technology and Innovation
• Constructing a Residue Storage Facility (RSF);
• Constructing a dewatering system (including bores, pipelines, collector tanks and associated infrastructure) and from the mine site to the Southern Fortescue borefield (SFB);
• Piping excess dewatering water to the SFB for active re-injection into the Southern Fortescue mixed aquifer system and/or to service mine operations and the town of Tom Price;
• Surface discharge of excess dewatering water to open flat areas over the SFB during peak flows; and
• Constructing an accommodation camp at Marandoo West.
3.1.1 MMP2 relationship to Other Projects
Marandoo is located in the central Pilbara region of Western Australia, approximately 37 km east of
Tom Price and 77 km north-west of Paraburdoo (Figure 1). Ore from Marandoo is transported by
rail to Dampier and/or Cape Lambert Ports for export. Ore from Marandoo is blended with ores
from other Pilbara Iron operations and marketed as the ‘Pilbara Iron Blend’, the Marra Mamba ore
from Marandoo makes up an important part of Pilbara Iron Blend.
3.1.2 Proposed Site Layout
Figure 4 shows the location of the existing operations at Marandoo along with the proposed pit
outline and waste dump area for the MMP2. Specific design details for the pit and waste dumps
are still in progress.
The accommodation camp is proposed to be located outside of the KNP on Hamersley Station
approximately 6km west of the Marandoo Mine, with the SFB located to the north of the camp
(Figure 5).
A Landscape and Visual Impact Assessment Study (SKM, 2008) has been undertaken for the
MMP2 project to evaluate the landscape and visual effects of the proposed expansion of the
Marandoo operations. The study considered the visual impact of the current proposal from key
vantage points around the Marandoo site. The most significant impacts will be when looking south
from the lookout at the summit of Mount Bruce.
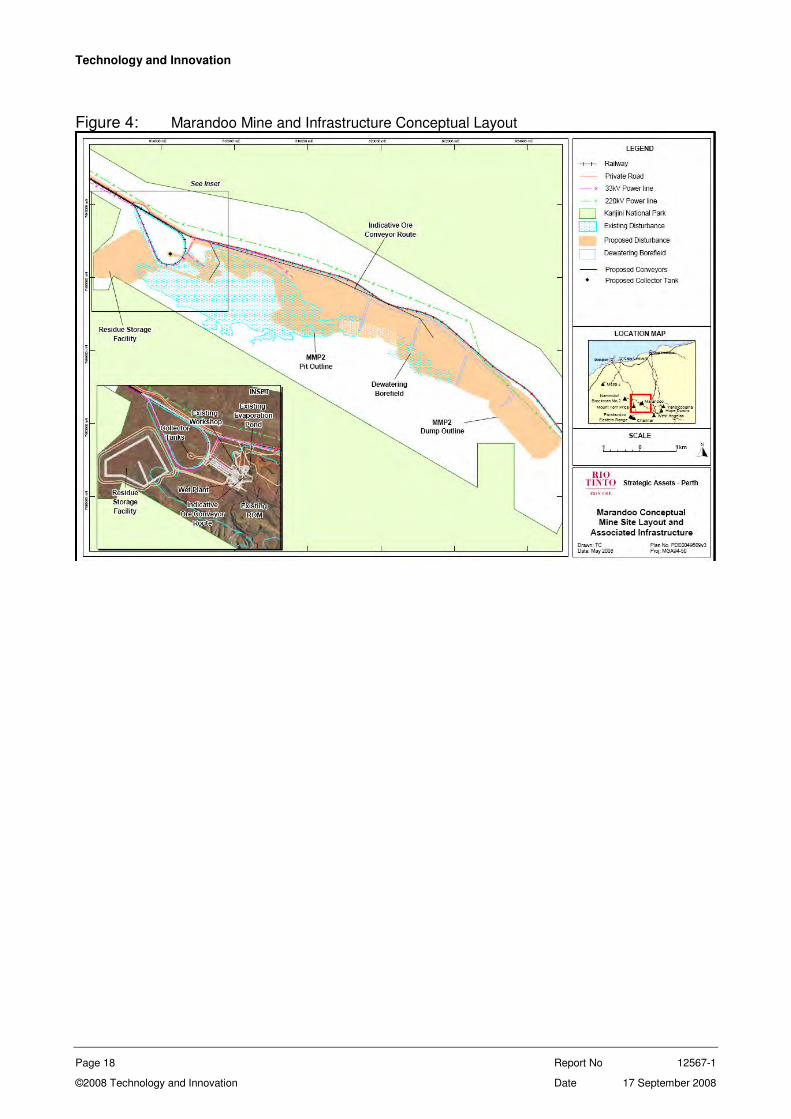
Technology and Innovation
Page 18 Report No 12567-1
©2008 Technology and Innovation Date 17 September 2008
Figure 4: Marandoo Mine and Infrastructure Conceptual Layout
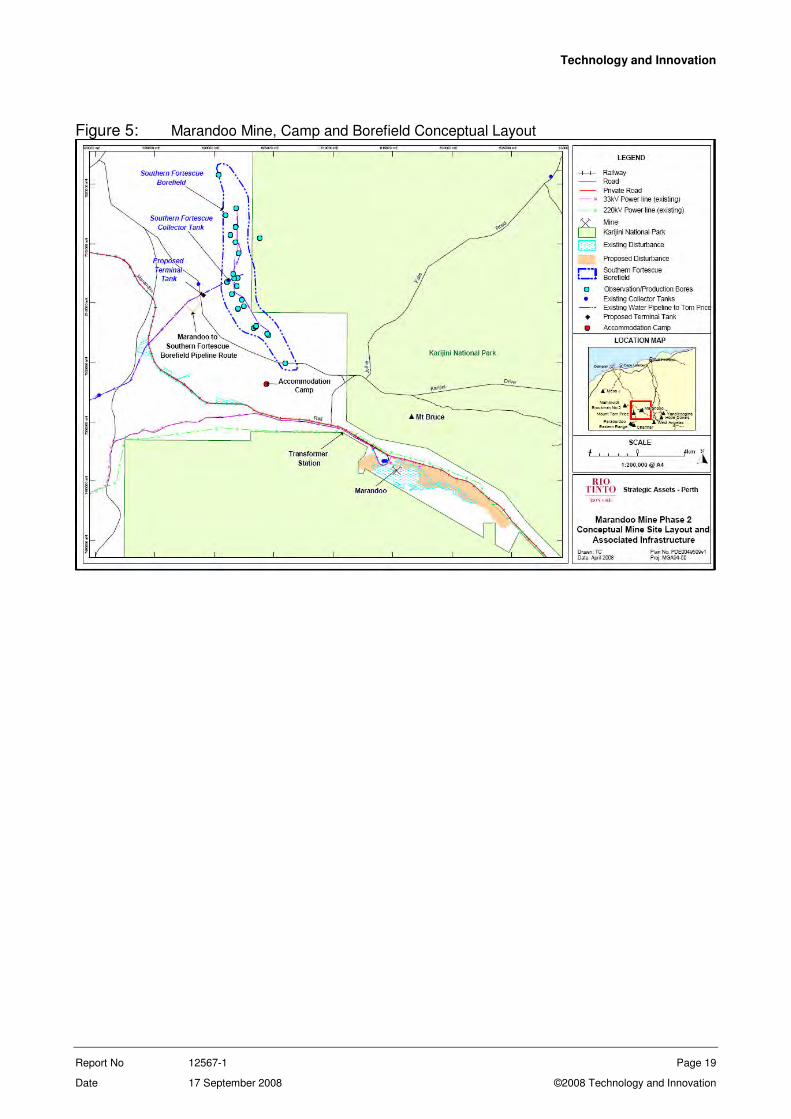
Technology and Innovation
Report No 12567-1 Page 19
Date 17 September 2008 ©2008 Technology and Innovation
Figure 5: Marandoo Mine, Camp and Borefield Conceptual Layout

Technology and Innovation
Page 20 Report No 12567-1
©2008 Technology and Innovation Date 17 September 2008
3.1.3 Disturbance area
Based on the current conceptual mine plan, MMP2 will result in approximately 1150ha of additional
ground disturbance to that currently approved for Marandoo (Table 1). This will result in an
estimated disturbance area at closure of approximately 1800ha (existing operations plus Phase 2
disturbance). Disturbance will be minimised during planning and construction to that required for
safe and efficient operations.
Current mine plans indicate that during the development phase of the pit, waste is likely to be
backfilled directly into mined out sections of the pit, however at times temporary external waste
dumps will be required when there is insufficient room in the pit. These temporary dumps would
then be progressively relocated back into the pit to meet backfill requirements.
Table 1: Approximate additional ground disturbance for MMP2
Project Component Additional
disturbance for
MMP2 (ha)
Pits, haul roads, residue storage facility, waste
dumps and stockpiles 900
Dewatering and water disposal system 200
Construction and operation camp(s) and associated
facilities* 0
East and west minor catchments subject to
inundation as a result of detention structures 50
Total 1150
* clearing for the accommodation camp is being accounted for through a separate Part IV application

Technology and Innovation
Report No 12567-1 Page 21
Date 17 September 2008 ©2008 Technology and Innovation
3.2 Legal and Other Obligations
3.2.1 Legal Obligations relevant to Closure
The existing Marandoo operations maintain a Legal Obligations Register which provides a list and
brief summary of the key documents known to contain specific obligations for the current
Marandoo Operations, including general obligations that arise under legislation and project specific
obligations arising from State Agreements, approvals, licences and other commitments (e.g.
Environmental Management Programme (EMP), AWT approval document commitments).
Key project specific obligations applicable to closure of the existing operation outlined in the
register include the following key requirements:
• A Final Decommissioning Closure Plan will be developed in consultation with key stakeholders
and submitted at least two years prior to decommissioning.
• Rehabilitation will be conducted progressively where possible to re-establish native
vegetation. Any seed used for rehabilitation purposes is to be native to the Pilbara.
• Measures will be undertaken to prevent and restrict the introduction and spread of weeds.
• The post closure landuse and the objectives and targets for closure will be agreed with
government stakeholders and other external stakeholders (where appropriate) and included in
the Closure Strategy and will be periodically reviewed, with revisions made as required.
3.2.2 General Obligations
A closure specific legal review has not yet been conducted for MMP2, however legal reviews for
closure have been conducted at a number of other Pilbara Iron operations and the general
obligations are considered equally applicable to Marandoo. A specific legal review for closure at
Marandoo will be conducted after commissioning of the MMP2 project once all operating licences,
permits and approvals have been obtained.
The following legislation is considered as the main sources of general obligations relating to
closure of sites in Western Australia (Freehills, 2008):
• Environmental licensing and pollution control provisions under Part V of the Environmental
Protection Act 1986 (WA) (EP Act);
• Obligations and approvals under the Environmental Protection (Controlled waste) Regulations
2004 (WA);
• Obligations and offences under the Environmental Protection (Unauthorised Discharges)
Regulations 2004 (WA);
• Obligations and offences under the Environmental Protection and Biodiversity Conservation
Act 1999 (Cth);
• Obligations arising under the Contaminated Sites Act 2003 (WA);

Technology and Innovation
Page 22 Report No 12567-1
©2008 Technology and Innovation Date 17 September 2008
• Potential requirements imposed by the Mining Act 1978 (WA) and the Mining regulations
1981 (WA);
• Obligations imposed by the Mines Safety and Inspection Act 1994 (WA) and Mines Safety and
Inspection Regulations 1995 (WA);
• Offences created under the Criminal Code Act 1913 (WA);
• Procedures and requirements imposed under the Iron Ore (Hamersley) Agreement Act 1963;
• Standards set by ISO 14001:2004;
• Common law liability arising from:
- nuisance;
- negligence;
- breach of statutory duty; and
- Standards of reasonableness and the relevance of guidelines and codes of
practice.
In addition, Ministerial conditions placed on the approval of a proposal under Part IV of the
Environmental Protection Act 1986 (WA) (EP Act) are likely to contain specific requirements
related to closure.
3.2.3 Corporate Obligations
Rio Tinto has established a number of corporate wide requirements which may go beyond
legislative and statutory requirements. These requirements are established through policies,
standards and guidelines. Similarly, Pilbara Iron has an ISO 14001 certified Environmental
Management System (known as IEMS) that establishes environmental policies, standards,
guidelines and procedures for the operations. Many of these requirements have direct or indirect
implications on closure.
A review of the corporate obligations for closure at Marandoo was included in the 2006 Closure
Planning Study (PI, 2006).

Technology and Innovation
Report No 12567-1 Page 23
Date 17 September 2008 ©2008 Technology and Innovation
3.3 Existing Environment
The following sections describe the existing environmental conditions that are present at Marandoo
and a brief discussion on the implication these conditions may have for closure.
3.3.1 Climate
The climate of the Marandoo area is described in section 3.1.1 of the PER.
The climatic factors of the Pilbara are considered in the current designs and methods used for
rehabilitation. High intensity rainfall events associated with cyclonic activity can lead to significant
erosion of landforms if water control measures are not in place or adequately designed and
therefore quality control of earthworks is critical during rehabilitation.
3.3.2 Geology and Soils
MMP2 Project Geology
The geology of the Project area is described in section 3.1.4 of the PER.
There are no significant issues expected at closure as a result of the geology at Marandoo,
however additional work is required to determine the most appropriate placement of certain waste
types (e.g. clays, Banded Iron Formation) and specifically its suitability for use as backfill (i.e.
potential impact/benefit on water quality) and/or waste dump construction (i.e. stability, growth
medium).
Soils
The soils at Marandoo are described in section 3.1.2 of the PER.
It will be important that topsoil recovery is maximised during development and construction to
ensure that there is sufficient topsoil available for rehabilitation at closure. Topsoil is recognised as
an important resource for successful rehabilitation and as such will be stored in accordance with
the Pilbara Iron Soil Resource Management Procedure. This procedure has been developed to
maintain the topsoil and subsoil in the best possible condition by minimising compaction, reducing
the risk of erosion, maintaining active populations of soil microbes and controlling weeds.
Acid Rock Drainage
The proposed mining operations are not expected to encounter any potentially acid forming (PAF)
materials. Should any PAF material be identified during mining it will be managed in accordance
with Pilbara Iron’s existing Spontaneous Combustion and Acid Rock Drainage (SCARD)
management plan. The management plan outlines the accountabilities and responsibilities for the
environmental, health and safety aspects of managing PAF materials and includes a specific
discussion on the management of these materials during rehabilitation and closure. The
implementation of this plan will ensure that the majority of issues are managed during operations
and that specific requirements at closure are minimal.

Technology and Innovation
Page 24 Report No 12567-1
©2008 Technology and Innovation Date 17 September 2008
Fibrous Minerals
There is potential for fibrous (asbestiform) material to be identified during mining operations
(particularly when mining through the Banded Iron Formation (BIF) contact). If identified this
material will be handled as per existing Fibrous Minerals management procedures (e.g. Marandoo
Fibrous Dust Management – Policy and Procedures). The presence of fibrous materials is
primarily a health and safety issue during operations. It is assumed that all fibrous materials will be
adequately managed during operations so that no liability remains at closure.
3.3.3 Hydrology
The surface hydrology at Marandoo is described in section 3.1.5 and 5.3 of the PER.
The proposed MMP2 pit will intercept three ephemeral drainage lines that flow north toward the
Mount Bruce Flats, which contains a priority ecological community (Coolibah open woodland) and
is also the source of the recharge of the upper unconfined aquifer. Alteration of the surface water
flows as a result of the changed landforms will be managed during operations, but has been
identified as a key factor at closure.
An internal assessment of surface water management indicates that a percentage of surface water
flows can be diverted around the pit void to re-join downstream flows, however due to the
topography on the south side of the pit some surface flow will report to the pit void. During
operations this water will be pumped out of the pit via in-pit sumps. Post-closure this water will
form ephemeral pools in the pit and infiltrate into the groundwater via the pit backfill, or evaporate.
3.3.4 Hydrogeology
The hydrogeology at Marandoo is described in sections 3.1.6 and 5.2 of the PER.
Two distinct aquifers have been identified within the Marandoo/Mount Bruce flats area, a shallow
unconfined aquifer and a deeper confined aquifer. Dewatering of approximately 350 GL over the
life of MMP2 will result in a drawdown within the confined aquifer of approximately 125 m at the
mine. Groundwater drawdown within the unconfined aquifer as a result of dewatering is expected
to be negligible (MWH 2006). Where the unconfined aquifer intersects the northern margin of the
proposed mine pit, local dewatering of the unconfined aquifer is predicted to result in a drawdown
of approximately 10 m to less than 0.25 m in the centre of the Mount Bruce Flats (MWH 2006).
Water from dewatering will be used for on-site purposes as far as possible (dust suppression,
ablutions, wet processing of ore); there are a number of options being considered for the disposal
of the excess water, including piping of water to Tom Price and active re-injection into the SFB.
Defining the potential beneficial use of the local and regional groundwater resources is an
important consideration in establishing appropriate management objectives during project
planning. It is critical to assess potential impacts on the water resource in terms of balancing any
reduction in future beneficial use against overall economic and social benefits (Johnson and
Wright, 2003). The beneficial use of the upper aquifer is primarily in the maintenance of ecological
processes and is important in the maintenance of areas such as the Coolibah Woodlands. The

Technology and Innovation
Report No 12567-1 Page 25
Date 17 September 2008 ©2008 Technology and Innovation
impact of groundwater drawdown in the upper aquifer on the Coolibah open woodland is expected
to be negligible due to the small drawdown within the aquifer at this location compared to natural
fluctuations (see Section 3.1.6 and 5.2 of the PER for detailed discussion).
Although it is of potable quality, the deeper confined aquifer has less obvious beneficial uses in the
vicinity of the Marandoo operations. The nearest potential user of the water (other than the current
use for mining purposes at Marandoo) is the water drawn from the SFB for supply of potable water
to Tom Price town and mining operation. At their closest points, the SFB is over 10 km from the
MMP2 project. It is not believed that the deep aquifer plays a significant role in maintenance of
ecological processes within the vicinity of the mine operations (for example supply of water to
gorges or springs).
The development of pit lakes after closure and the impact on groundwater quality is subject to
ongoing numerical modelling by the University of Western Australia (UWA). Finalisation of this
model is expected to take approximately two years, and for purposes of this closure study a
conservative approach has been taken and it is assumed that pits will require backfilling to at least
1m above water table. The decision to backfill the pit to above water table is not solely based on
protection of water quality, but includes aesthetic and stakeholder considerations. The post
closure risk of impacts in regard to water quality issues are currently not considered significant.
A conceptual model of the potential hydrogeological conditions at MMP2 is shown in Figure 6
below. This model reflects the hydrogeological conditions expected at closure. The model
describes the planned closure scenario of backfilling the void to a nominal 1m above the pre-
mining water table.
During dry conditions (i.e. evaporation exceeds rainfall and surface inflows) it is expected the pit
will act as a ‘groundwater sink’. Water levels are expected to slowly recover and stabilise at a level
lower than that of the pre-mining water table. Continued evaporation with no outflow will lead to
progressive salinity increase (Johnson and Wright, 2003). However, this is expected to be off-set
during periods of heavy rain when there will be periods of recharge as surface inflows and direct
precipitation form ephemeral pools in the pit. This will cause a groundwater mound to form, thus
reversing the groundwater flow and potentially lowering salinity levels.
Depending on the size and frequency of rainfall events the ephemeral pools in the pit may remain
for several months. As part of the final closure design, the backfill surface will be designed to
incorporate topographical low points to create areas for the water to pool. These areas will be able
to be revegetated to incorporate species that will cope with periodic inundation.
Disposal of groundwater during operations may result in post closure impacts because as
dewatering ceases the system needs to readapt back to the original hydrological regimes.

Technology and Innovation
Page 26 Report No 12567-1
©2008 Technology and Innovation Date 17 September 2008
Figure 6: Stylised Conceptual Hydrological Model for Marandoo Pit at Closure
Technology and Innovation
Report No 12567-1 Page 27
Date 17 September 2008 ©2008 Technology and Innovation
3.3.5 Physiographic Context
The major physiographic unit and land systems of the Marandoo area are described in section
3.1.3 of the PER.
The MMP2 Project area lies within the Hamersley Plateau as defined by Beard (1975). The
Hamersley Plateau is characterised by rounded hills and ranges, mainly of jaspilite and dolomite
with some shale, siltstone and volcanics.
The Interim Biogeographic Regionalisation for Australia (IBRA) recognises 85 bioregions across
the continent (Environment Australia 2000). The Marandoo site is located within the Hamersley
subregion of the Pilbara bioregion. This region is characterised by mountainous areas of
Proterozoic sedimentary ranges and plateaux, which are often dissected by gorges. This
information will be considered in the determination of suitable post mining landforms and
rehabilitation for the Marandoo site.
3.3.6 Biological Context
The biological context at Marandoo is described in detail in section 3.2 of the PER, potential
environmental impacts and proposed management is described in sections 5.4 - 5.7. The following
sections provide a brief summary of the key information.
The implication of this information in closure planning is expected to be around the following areas:
• Selection of suitable native species for use in site rehabilitation programmes in consultation
with key stakeholders. Where practical this could involve the re-creation of appropriate
vegetation communities depending on structure of the rehabilitated habitat (e.g. flats, rocky
slopes, low lying areas) and/or the inclusion of key species in the seed mixes (e.g. priority
flora)
• Re-creation of a range of suitable habitats for the re-colonisation of fauna species where
practical (e.g. use of variable slopes, inclusion of rock mounds, use of timber mulch, artificial
bat habitats, creation of ephemeral water bodies)
• Importance of the control of weeds and feral animals both during operations and continuing
into post-closure.
3.3.7 Progressive Rehabilitation
Progressive rehabilitation has been conducted at a number of sites in and around the existing
Marandoo operations (Waste Dump 1, Construction Camp, various borrow pits) and these sites
have been regularly monitored to assess their progress and evaluate the successional
development of the rehabilitation. This monitoring provides useful feedback for the improvement of
rehabilitation techniques and aids in the development of long term rehabilitation objectives and
realistic and achievable completion criteria. Rehabilitation monitoring has included the monitoring
Technology and Innovation
Page 28 Report No 12567-1
©2008 Technology and Innovation Date 17 September 2008
of sites after they have been burnt to determine the sustainability of rehabilitation practices and
techniques.
Preliminary rehabilitation monitoring results have indicated that a number of the species used in
seed mixes have not been recorded in monitoring sites. This may indicate an issue with the seed
viability, storage, germination or establishment. The percentage of species that have established
varies between monitoring sites and ages of rehabilitation and further research is needed to
determine the cause (EMRC, 2005).
Table 2 provides a list of the current species being trialled for rehabilitation at Marandoo, these
species are expected to form the basis for the species used during progressive rehabilitation
works. The list of species used will be further refined as a result of rehabilitation monitoring and
consultation with stakeholders. Species may be further targeted to specific rehabilitation
landforms, for example rocky slopes, flat plains, low lying areas.
.
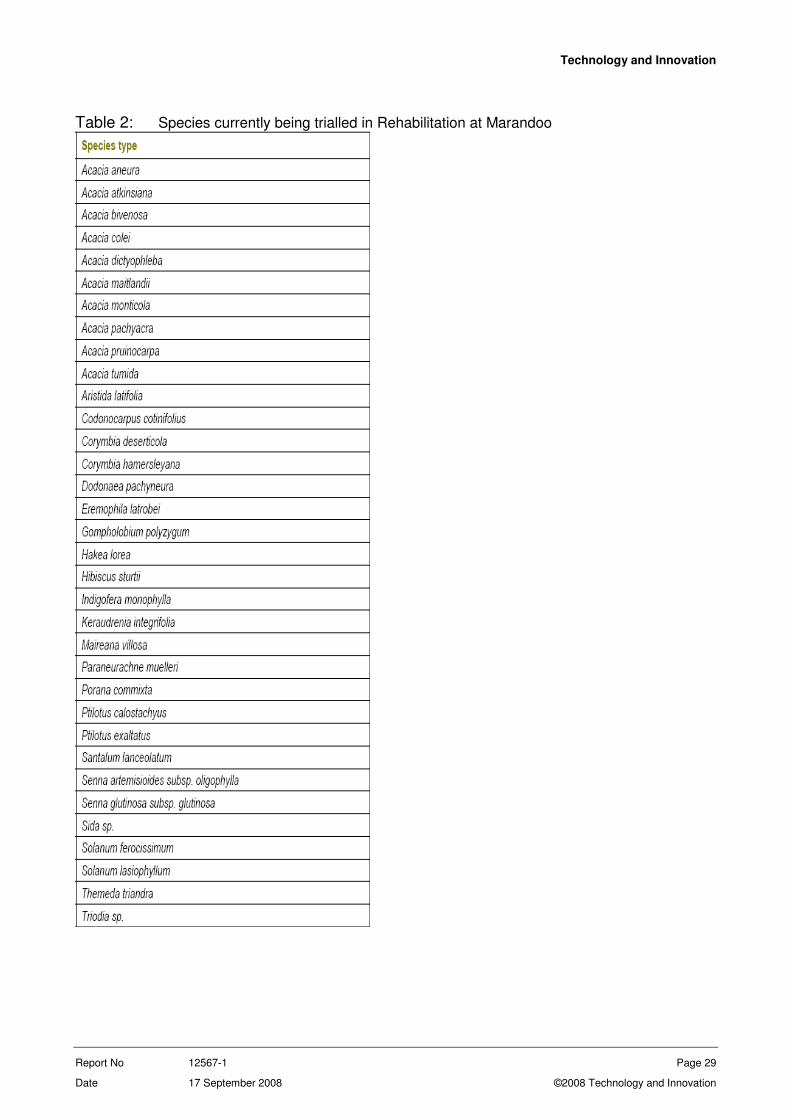
Technology and Innovation
Report No 12567-1 Page 29
Date 17 September 2008 ©2008 Technology and Innovation
Table 2: Species currently being trialled in Rehabilitation at Marandoo

Technology and Innovation
Page 30 Report No 12567-1
©2008 Technology and Innovation Date 17 September 2008
3.3.8 Stakeholders and Community
Socio-Economic Setting
The socio-economic setting for MMP2 is described in sections 3.3.1 of the PER. Development of
the MMP2 project will extend the life of the existing mine and therefore extend the socio-economic
benefits to the Shire of Ashburton. A Socio-Economic Plan will be developed for the MMP2 project
after commissioning of the project.
Stakeholder Consultation
Section 2 of the PER outlines the stakeholder consultation process that has occurred for the MMP2
Project.
The key points for closure are:
• Extensive stakeholder consultation has occurred as part of the existing Marandoo Mine and
key stakeholders that have been identified at this time have been consulted in regard to the
MMP2 Project.
• The main topics raised by stakeholders relate to potential impacts to the Coolibah woodlands
and Mulga communities, visual amenity, impacts to the KNP, closure, Aboriginal heritage,
impacts to fauna (including subterranean fauna and short-range endemic invertebrates) and
disposal of dewatering water.
• Consultation will be an ongoing process throughout the life of the operation, particularly
leading up to and during closure.
Technology and Innovation
Report No 12567-1 Page 31
Date 17 September 2008 ©2008 Technology and Innovation
3.3.9 Aboriginal and European Heritage
Aboriginal Heritage
Sections 3.3.4 and 5.8 of the PER describes the existing Aboriginal heritage and potential
environmental impacts/management of the project.
RTIO has adopted national heritage guidelines to regulate the manner in which all business units
manage cultural heritage issues. All business units are required to comply with internal heritage
policies, as well as comply with both State and Federal legislation.
Since 1975, Pilbara Iron and others have commissioned several archaeological and ethnographic
investigations of the MMP2 area including recent surveys undertaken for the proposal by SCARP
Archaeology (2008). The majority of known Aboriginal heritage sites in AML 70/272 occur along
the ridge line of the escarpment south of the mine or are closely associated with water sources
(SCARP Archaeology, 2008).
Any management commitments for heritage sites or salvaged materials will be reviewed subject to
approval and commissioning of the MMP2 project to determine any post closure requirements, for
example, the storage or return of salvaged materials.
European Heritage
Within the MMP2 area there are no known sites or items of non-Aboriginal heritage significance
listed on the Ashburton heritage municipal listing and therefore no closure implications are
expected.
National Heritage
The Australian Heritage Council has KNP listed on the Register of the National Estate. The area
has been listed for it’s unique, geological, biological and landscape characteristics. The
significance of the KNP has been considered in the establishment of the Closure Vision and the
Post Closure Land Use Objectives for the MMP2 project.

Technology and Innovation
Page 32 Report No 12567-1
©2008 Technology and Innovation Date 17 September 2008
3.4 Surrounding Land Use
MMP2 is located within an excised area of the KNP (Figure 5). The KNP is the second largest
National Park in Western Australia and covers an area of over 600 000 ha. The KNP provides for
the conservation of approximately ten percent of the Hamersley sub-region within the Pilbara and
contains a representative sample of many of the landscapes, geological types and flora and fauna
communities of the area.
The proposed camp and SFBs are located outside of the KNP on Hamersley Pastoral Station
owned by Hamersley Iron. Portions of Hamersley Station have been nominated to be released to
the conservation estate in 2015 or to be set aside for conservation management within the pastoral
leases under conservation agreements.

Technology and Innovation
Report No 12567-1 Page 33
Date 17 September 2008 ©2008 Technology and Innovation
4 CLOSURE STRATEGY
A site specific closure strategy has been developed for the MMP2 project. This strategy has been
developed based on the aspects and impacts of the project as discussed in the knowledge base
section of this study and where appropriate is consistent with the currently approved Marandoo
Closure Strategy.
The Closure Strategy has four key objectives:
1. Establishing an overall vision for closure;
2. Defining the post closure land use for the site;
3. Objective and performance targets covering decommissioning, decontamination,
rehabilitation, biodiversity, socio-economics, communications and employee relations; and,
4. Identifying the specific closure options for each physical aspect of the site.
4.1 Closure Vision
The objective of the closure vision is to establish an overarching concept of how the site will look in
the medium to long term after closure. As such, the vision encompasses both physical elements
(the land and environmental resources) and non-physical aspects (socio-economic).
The Closure Vision developed for the 2006 Marandoo Closure Planning Study (PI, 2006) has been
reviewed by key members of the MMP2 Project team. The team comprises people with
appropriate seniority, skill levels, experience and knowledge of the project area. In reviewing the
vision consideration was given to the following information:
• Main objectives of the Rio Tinto Environment, Health and Safety and Closure Standards;
• Compatibility with local/regional social and economic activities and their future development;
• Compatibility with local/regional environmental settings and land uses;
• Rio Tinto Iron Ore Sustainable Development principles; and
• Key legal/regulatory requirements.

Technology and Innovation
Page 34 Report No 12567-1
©2008 Technology and Innovation Date 17 September 2008
The closure vision will continue to be reviewed during subsequent updates of this CMS to ensure it
remains aligned with the information above and the expectations of key stakeholders. The closure
vision for the Marandoo Operation which encompasses MMP2 states:
Marandoo Closure Vision:
To create a positive legacy by:
� Remediating the effects of mining to:
� Maximise potential productive, community and/or natural land uses; and
� Achieve end states that are safe and stable, and enable effective stewardship for the
future.
and
� Minimising the company’s post-closure impact on the natural environment, return the
land to a state compatible with the agreed land-use and contribute to the biodiversity of
the area.

Technology and Innovation
Report No 12567-1 Page 35
Date 17 September 2008 ©2008 Technology and Innovation
4.2 Post Closure Land Use Option
A post closure land use option has been developed for the existing Marandoo Operation and this
remains applicable for the MMP2 Project. In developing the potential post closure land use options
for Marandoo, consideration was given to the specific values and constraints presented by the
physical environment, as well as consideration of environmental and technical information covered
in the knowledge base section. From this information, viable land use options were defined and a
preferred option identified.
In considering the information contained within the Closure Knowledge Base and the Closure
Vision, the following post-closure land use objective for Marandoo (including MMP2) has been
proposed:
Marandoo Post Closure Land Use Option:
• Rehabilitate for conservation consistent with the Karijini National Park objectives.
Objective:
• To decommission all infrastructure within the Marandoo mining lease area and
rehabilitate the site as close to its original condition as practicable such that it is
suitable for being returned to Karijini National Park.
The post closure land use will be reviewed during updates of this plan and the final land use,
developed in consultation with key stakeholders, will be confirmed as part of the final
Decommissioning Closure Plan to be developed at least five years prior to planned closure.

Technology and Innovation
Page 36 Report No 12567-1
©2008 Technology and Innovation Date 17 September 2008
4.3 Objectives and Performance Targets
To achieve the desired closure vision, post closure land use objective and to drive continual
improvement in closure planning, specific closure objectives have been proposed for the MMP2
project. The key objectives are the same as those proposed in the 2006 Marandoo Mine Closure
Planning Study (PI, 2006). Due to the stage of the MMP2 project, these objectives are conceptual
only and will evolve during the life of the project subject to review by key internal and external
stakeholders.
For each objective, closure targets have been established. These targets establish a standard or
level of performance that can be utilised to demonstrate successful closure. These targets have
been identified from the outcomes of the knowledge base and in particular from specific statutory
requirements or where more appropriate, from best practice, as identified through regulatory and
industry guidelines. The conceptual closure objectives and targets for the MMP2 project are
presented in Table 3.
These conceptual objectives and targets will continue to be revised, made more specific and
measurable targets developed and agreed by key stakeholders. Final objectives and targets,
developed in consultation with key stakeholders, will be developed as part of the final
Decommissioning Closure Plan at least five years prior to planned closure. These agreed
objectives and targets will become the ‘completion criteria’ upon which the success of closure
activities will be measured.
Table 3: Conceptual Objectives and Targets for Closure at Marandoo
Objective Target
Decommissioning
Incident free decommissioning of all infrastructure and
facilities.
Relinquish the site in a condition that
minimises risks to human health or
safety or to the natural environment.
Appropriate management / disposal of all infrastructure and
materials removed from the site.
Prioritise sustainable economic returns
from decommissioning to offset aspects
of closure financial costs
Recycling, reuse, refurbish or on-sell more than 50 percent of
infrastructure on decommissioning.
Decontamination
Compliance with criteria for contamination levels, as agreed
with State regulators under the Contaminated Sites Act (2003)
(WA) and Environmental Protection Act (1986) (WA)
No ongoing contaminated site
management is required beyond five
years post-closure
No ongoing impact on surrounding environment from
contamination
Rehabilitation
Have a positive net impact on
biodiversity
Fully integrate biodiversity issues in the site Land Use
Management Plans.
Relinquishment of a safe, stable and
uncontaminated site, where the majority
Specialist geotechnical sign off of the final landforms stating
they are safe and stable.

Technology and Innovation
Report No 12567-1 Page 37
Date 17 September 2008 ©2008 Technology and Innovation
All post-mining landforms deemed ‘acceptable’ by regulatory
agencies and stakeholders.
The final closure state satisfies the pre-determined post-
closure criteria developed in conjunction with regulatory
agencies (i.e. safe, erosion, biodiversity)
Zero contaminated sites remain, with the exception of landfill
facilities.
Construction of post-mining landforms
that are non-polluting.
Groundwater quality consistent with the predetermined post-
closure water quality criteria developed in conjunction with
regulatory agencies within the defined post-closure monitoring
period.
Establishment of sustainable endemic
vegetation communities consistent with
surrounding undisturbed vegetation and
suitable for the support of the future
land use option.
The final closure state satisfies the predetermined post-closure
criteria developed in conjunction with regulatory agencies (i.e.
species diversity, percentage cover, etc).
Surface water discharges should not result in a loss of the
highest potential beneficial use (based on background water
quality) of downstream receiving water bodies, nor should they
result in adverse impacts to flora and fauna in downstream
natural receiving environments.
The operation should not result in the degradation of
groundwater quality within down gradient aquifers such that the
highest beneficial use (based on background water quality)
within the aquifer is degraded. Groundwater quality
degradation must also not compromise ecological water quality
requirements in any down gradient surface ecosystems that
are dependent upon groundwater.
Water quality is suitable for the
proposed land use.
Water that flows from pit lakes must meet the criteria
developed for surface and groundwater discharges.
Ephemeral, seasonal or permanent water bodies within pits
should not pose an exposure risk to livestock, terrestrial wildlife
or humans that are intermittently exposed to water.
Human Resources
No unacceptable impacts on Rio Tinto
business from closure of Marandoo
Mine.
No adverse industrial relations outcomes associated with
closure (from cessation of operations, through
decommissioning to end of rehabilitation).
Plans for relocation of employees are developed in
consultation with relevant parties prior to closure and
implemented in a timely manner. These plans address
employee expectations and aspirations.
Employees have the opportunity to
choose / elect / determine own quality of
life outcomes resulting from mining
cessation and closure (redeployment,
own business, retirement, etc). Opportunities for Indigenous employees are identified and
pursued.

Technology and Innovation
Page 38 Report No 12567-1
©2008 Technology and Innovation Date 17 September 2008
Transfer appropriate skilled and
experienced personnel within Rio Tinto.
Plans are developed and implemented for retention and
redeployment of employees with specific core skills or subject
expertise for use in other locations in the Rio Tinto Group.
These plans are subject to business requirements, employee
preference and prevailing economic climate.
Retain human resources to implement
closure plans.
Required roles for closure are filled internally (where
appropriate) through the closure process. Critical resources
required during the closure phase are retained.
Maintain a safe and healthy working
environment throughout closure
process.
Goal of zero injuries.
Communication and Consultation
Maintain and document a
comprehensive stakeholder Information,
Communication and Consultation
Programme through closure.
Majority of the stakeholder (community, government authorities
and employees) priorities are recognised and addressed
throughout the closure plan.
Identify and manage Indigenous
concerns.
Members of the local Indigenous community or suitable
representatives are included in the Stakeholder information,
communication and consultation network.
Maintain Indigenous heritage values in
the project area.
Significant heritage sites effectively managed to ensure long
term maintenance of heritage values.
Technology and Innovation
Report No 12567-1 Page 39
Date 17 September 2008 ©2008 Technology and Innovation
5 CLOSURE MANAGEMENT PLAN SCOPE
The Closure Strategy outlined in the previous section is a description of what will be done to
achieve closure of the MMP2 project, the Closure Management Plan (CMP) presented in this
section outlines how this strategy will be achieved.
The CMP has been developed based on the information outlined in the Knowledge Base (Section
3) and the Closure Strategy (Section 4) and defines and quantifies the actions, materials and other
requirements needed to carry out the preferred strategy. The CMP is intended to be a live
document that is regularly updated to reflect operational changes or additional information received
from, for example, monitoring, studies or trials.
The successful integration of closure concepts into the short and long term mine planning activities
is a key factor in achieving cost-effective and acceptable closure outcomes. The MMP2 project
has considered several key aspects of potential closure impacts into the preliminary planning for
the proposed operations. These potential impacts have been identified as part of project risk
assessments and sustainable development assessments conducted for the MMP2 project. The
following examples are some of the considerations that have been included in current planning for
the project:
• Provision for backfilling of the mine void to achieve more acceptable post mining landform and
groundwater quality, subject to outcomes from ongoing groundwater modelling;
• Location and design of infrastructure (e.g. camps, pipelines, process buildings) to minimise
potential impacts (e.g. visual impact)
• Placement and design of temporary spoil heaps during operations (i.e. prior to backfill) to
minimise visual impacts of the operations from public roads and viewing points through KNP;
• Design of water diversion structures to minimise impact on downstream flows.
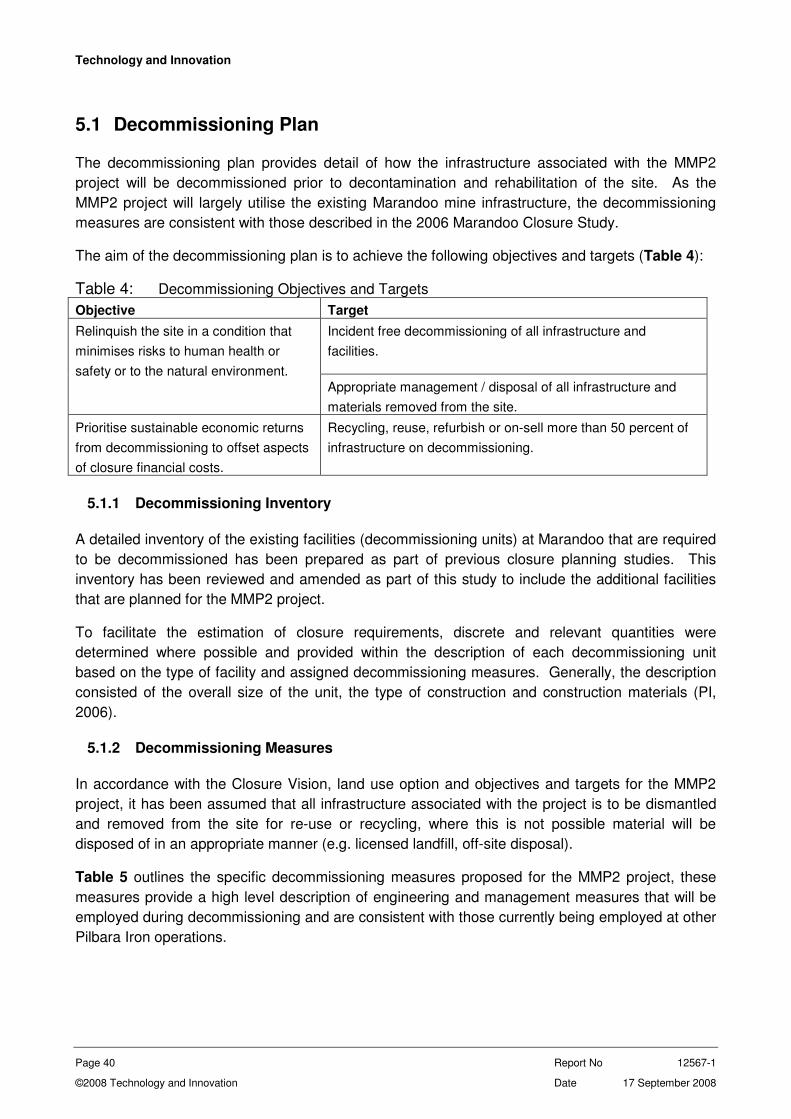
Technology and Innovation
Page 40 Report No 12567-1
©2008 Technology and Innovation Date 17 September 2008
5.1 Decommissioning Plan
The decommissioning plan provides detail of how the infrastructure associated with the MMP2
project will be decommissioned prior to decontamination and rehabilitation of the site. As the
MMP2 project will largely utilise the existing Marandoo mine infrastructure, the decommissioning
measures are consistent with those described in the 2006 Marandoo Closure Study.
The aim of the decommissioning plan is to achieve the following objectives and targets (Table 4):
Table 4: Decommissioning Objectives and Targets
Objective Target
Incident free decommissioning of all infrastructure and
facilities.
Relinquish the site in a condition that
minimises risks to human health or
safety or to the natural environment.
Appropriate management / disposal of all infrastructure and
materials removed from the site.
Prioritise sustainable economic returns
from decommissioning to offset aspects
of closure financial costs.
Recycling, reuse, refurbish or on-sell more than 50 percent of
infrastructure on decommissioning.
5.1.1 Decommissioning Inventory
A detailed inventory of the existing facilities (decommissioning units) at Marandoo that are required
to be decommissioned has been prepared as part of previous closure planning studies. This
inventory has been reviewed and amended as part of this study to include the additional facilities
that are planned for the MMP2 project.
To facilitate the estimation of closure requirements, discrete and relevant quantities were
determined where possible and provided within the description of each decommissioning unit
based on the type of facility and assigned decommissioning measures. Generally, the description
consisted of the overall size of the unit, the type of construction and construction materials (PI,
2006).
5.1.2 Decommissioning Measures
In accordance with the Closure Vision, land use option and objectives and targets for the MMP2
project, it has been assumed that all infrastructure associated with the project is to be dismantled
and removed from the site for re-use or recycling, where this is not possible material will be
disposed of in an appropriate manner (e.g. licensed landfill, off-site disposal).
Table 5 outlines the specific decommissioning measures proposed for the MMP2 project, these
measures provide a high level description of engineering and management measures that will be
employed during decommissioning and are consistent with those currently being employed at other
Pilbara Iron operations.
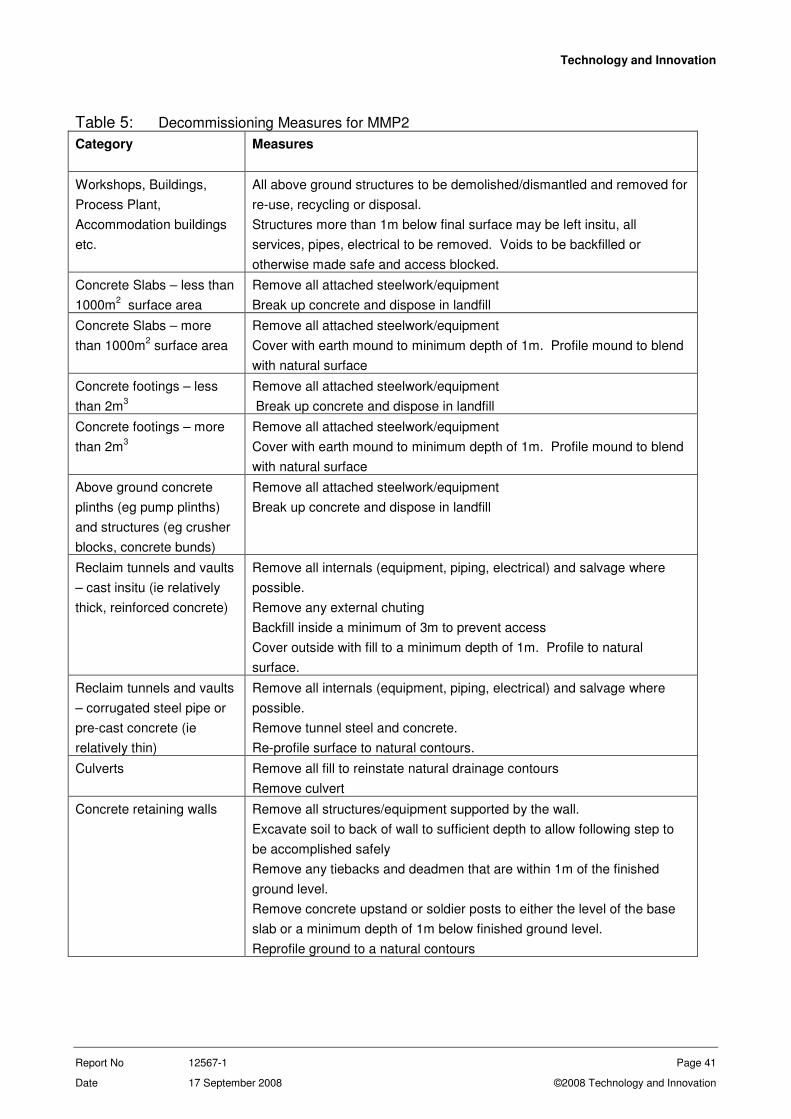
Technology and Innovation
Report No 12567-1 Page 41
Date 17 September 2008 ©2008 Technology and Innovation
Table 5: Decommissioning Measures for MMP2
Category Measures
Workshops, Buildings,
Process Plant,
Accommodation buildings
etc.
All above ground structures to be demolished/dismantled and removed for
re-use, recycling or disposal.
Structures more than 1m below final surface may be left insitu, all
services, pipes, electrical to be removed. Voids to be backfilled or
otherwise made safe and access blocked.
Concrete Slabs – less than
1000m2 surface area
Remove all attached steelwork/equipment
Break up concrete and dispose in landfill
Concrete Slabs – more
than 1000m2 surface area
Remove all attached steelwork/equipment
Cover with earth mound to minimum depth of 1m. Profile mound to blend
with natural surface
Concrete footings – less
than 2m3
Remove all attached steelwork/equipment
Break up concrete and dispose in landfill
Concrete footings – more
than 2m3
Remove all attached steelwork/equipment
Cover with earth mound to minimum depth of 1m. Profile mound to blend
with natural surface
Above ground concrete
plinths (eg pump plinths)
and structures (eg crusher
blocks, concrete bunds)
Remove all attached steelwork/equipment
Break up concrete and dispose in landfill
Reclaim tunnels and vaults
– cast insitu (ie relatively
thick, reinforced concrete)
Remove all internals (equipment, piping, electrical) and salvage where
possible.
Remove any external chuting
Backfill inside a minimum of 3m to prevent access
Cover outside with fill to a minimum depth of 1m. Profile to natural
surface.
Reclaim tunnels and vaults
– corrugated steel pipe or
pre-cast concrete (ie
relatively thin)
Remove all internals (equipment, piping, electrical) and salvage where
possible.
Remove tunnel steel and concrete.
Re-profile surface to natural contours.
Culverts Remove all fill to reinstate natural drainage contours
Remove culvert
Concrete retaining walls Remove all structures/equipment supported by the wall.
Excavate soil to back of wall to sufficient depth to allow following step to
be accomplished safely
Remove any tiebacks and deadmen that are within 1m of the finished
ground level.
Remove concrete upstand or soldier posts to either the level of the base
slab or a minimum depth of 1m below finished ground level.
Reprofile ground to a natural contours

Technology and Innovation
Page 42 Report No 12567-1
©2008 Technology and Innovation Date 17 September 2008
Category Measures
Borefield and water supply
lines
Permanently cap all bores no longer required.
Remove all infrastructure (fencing, pipework, electrics, tanks etc)
Treat concrete as per appropriate category above.
Remove all overland pipe that is above ground or less than 1m below
finished surface. Pipe greater than 1m deep to remain insitu (ends
capped and buried). All pipe supports and other infrastructure to be
removed.
Buried Services (piping,
cabling)
Remove all services less than 1 m below ground level.
Services more than 1m below finished surface services to be remain
insitu. Any piping containing contaminating or hazardous substances to
be flushed.
Powerlines,
communications towers etc
All infrastructure to be removed unless approved for further use and
signed over to custodian
Ponds, reservoirs Drain pond
Remove and dispose of any liners
Re-profile containment walls and breach wall at lowest point to prevent
ponding of rainfall/runoff. Line drainage point with rock where there is
potential for erosion.
Waste Water Treatment
Plants
Removal of all infrastructure and services
Demolition and burial (to minimum of 1m) of remaining structure
Storage Tanks
(hydrocarbon, water tanks)
Drain tanks in safe manner
Tanks shall be appropriately decontaminated to allow safe dismantling or
removal
Modular tanks shall be removed from site
Permanent tanks shall be dismantled
Rail Loop Remove rails, sleepers and signalling equipment for re-use.
Remove ballast and dispose of off-site.
Remove culverts.
Rail formation (other than culvert areas) – re-profile to stable slope by
spreading out to extent of existing service corridor.
Roads Main Access Road – leave intact.
Plant roads (bitumen) – remove bitumen to landfill, re-profile, rip and seed
subgrade.
Plant roads (gravel) – re-profile, rip and seed
Hardstand areas Bitumen sealed - remove bitumen to landfill, re-profile, rip and seed
subgrade.
Gravel – re-profile, rip and seed

Technology and Innovation
Report No 12567-1 Page 43
Date 17 September 2008 ©2008 Technology and Innovation
5.1.3 Decommissioning Assumptions and Exclusions
The following assumptions/exclusions have been made in the establishment of the
decommissioning criteria for the MMP2 project:
• Although re-use, and recycling of infrastructure is a key target for decommissioning, for the
purposes of the future cost estimate decommissioning costs will be estimated based on a
mass demolition, removal and disposal approach. This is in accordance with the requirements
of the Rio Tinto Closure Standard and guidance documentation. The potential economic
return from recycling, reusing, refurbishing or on-selling infrastructure from decommissioning
will be assessed and considered at least 12 months from decommissioning.
• Demolition contractor will comply with all relevant Pilbara Iron HSE requirements.
• Effective emergency response and medical facilities are available.
• Demolition contractor to have suitable demolition licenses and experience.
• All vehicle and other mobile equipment, portable plant and office equipment are excluded from
the decommissioning inventory. It is assumed that these items will have been disposed of
separately prior to facility decommissioning.
• All infrastructure, facilities, services and fixed plant internal to primary mining and processing
operations have been assumed to be owned by Pilbara Iron and as such, unless specifically
stated, will be decommissioned. Such assets will be included in the decommissioning
Inventory.
• All infrastructure, facilities, services and fixed plant will be cleared of all loose fittings prior to
decommissioning and closure requirements have not been considered.
• Anything that is not suitable for salvage or burial in-situ is to be transported to an appropriately
licensed disposal facility (assumed to be 50 km away for the purpose of the cost estimate) and
buried, unless it has the potential to cause contamination or adverse health effects, in which
case it is to be disposed of in accordance with the requirements of the appropriate
government agency.
• No construction material containing asbestos will exist at MMP2.
• All infrastructure that services operations other than the Marandoo Mine (e.g. main rail line,
power lines) have been specifically excluded from the decommissioning inventory. The
closure of the main rail line is covered in a separate closure plan.

Technology and Innovation
Page 44 Report No 12567-1
©2008 Technology and Innovation Date 17 September 2008
5.2 Decontamination Plan
The decontamination plan outlines how any areas contaminated during operations will be treated
following decommissioning. This includes both items of infrastructure as well as contaminated
soils. The decontamination measures are consistent with those described in the 2006 Marandoo
Closure Study.
The aim of the decontamination plan is to achieve the following objectives and targets (Table 6):
Table 6: Decontamination Objectives and Targets
Objective Target
Compliance with criteria for contamination levels, as agreed
with State regulators under the Contaminated Sites Act
(2003)(WA) and Environmental Protection Act (1986)(WA)
No ongoing contaminated site
management is required beyond five
years post-closure
No ongoing impact on surrounding environment from
contamination
5.2.1 Decontamination Inventory
Contaminated Sites Register
The Marandoo Operations maintain a contaminated sites register for the existing operations as
required by the Contaminated Sites Act (2003)(WA). Within the Contaminated Sites Register,
each contaminated site is uniquely numbered, named and described. Each site is categorised
according to the size, nature and priority for cleanup of the contamination. Any sites that may be
contaminated during operations at MMP2 will be included into the existing register. This register
will be maintained throughout the life of the operation and used during the development of the final
decommissioning plan to determine the contaminated sites that remain at the site and cleanup
requirements.
The majority of the sites currently on the contaminated sites register are relatively small, localised
hydrocarbon contaminated areas associated with refuelling areas and workshop facilities. Where
possible, the remediation of these contaminated sites will occur during operations, however this
may not be possible in all cases due to the nature and/or location of the contamination.
PCB Register
Pilbara Iron maintains a PCB register for the Pilbara operations. To date there are no known areas
of PCB contamination at Marandoo.
Asbestos Register
Asbestos surveys conducted for Pilbara Iron in 2006 indicated that no material requiring specialist
removal and disposal exists in any of the buildings or infrastructure at Marandoo (ERM, 2007). As
the use of asbestos containing material has now been phased out in Australia, it is not expected
that this should pose an issue for closure of Marandoo.
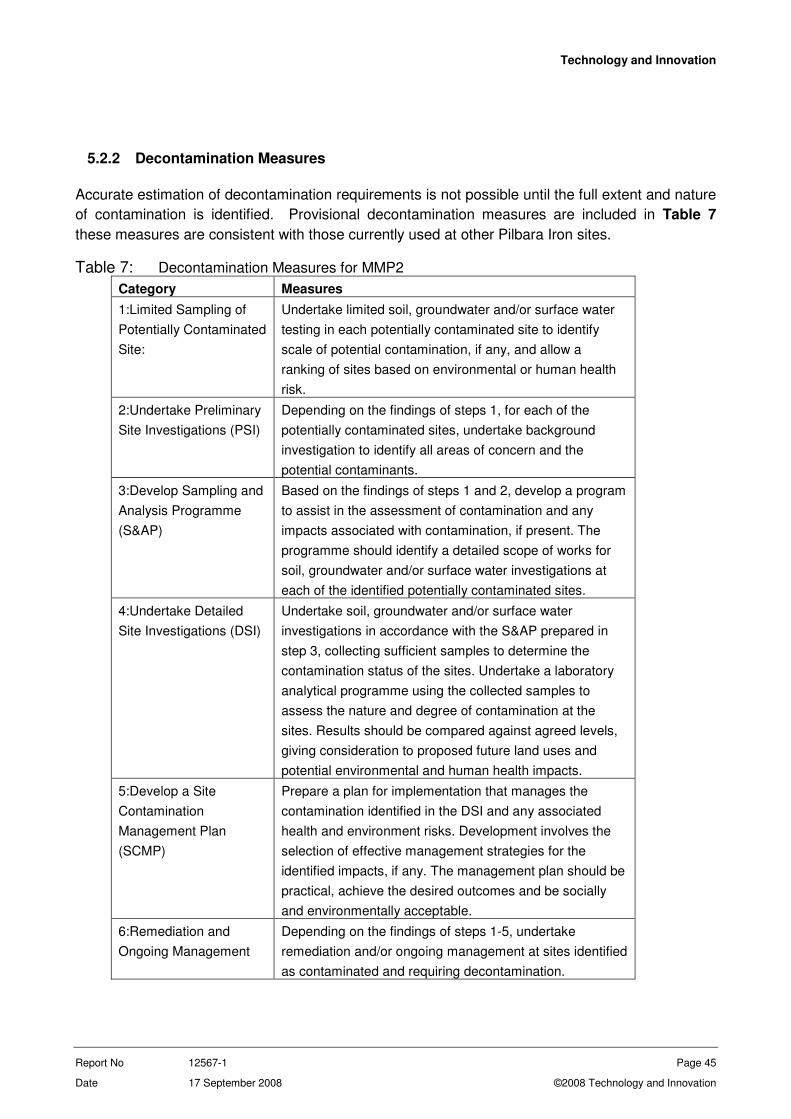
Technology and Innovation
Report No 12567-1 Page 45
Date 17 September 2008 ©2008 Technology and Innovation
5.2.2 Decontamination Measures
Accurate estimation of decontamination requirements is not possible until the full extent and nature
of contamination is identified. Provisional decontamination measures are included in Table 7
these measures are consistent with those currently used at other Pilbara Iron sites.
Table 7: Decontamination Measures for MMP2
Category Measures
1:Limited Sampling of
Potentially Contaminated
Site:
Undertake limited soil, groundwater and/or surface water
testing in each potentially contaminated site to identify
scale of potential contamination, if any, and allow a
ranking of sites based on environmental or human health
risk.
2:Undertake Preliminary
Site Investigations (PSI)
Depending on the findings of steps 1, for each of the
potentially contaminated sites, undertake background
investigation to identify all areas of concern and the
potential contaminants.
3:Develop Sampling and
Analysis Programme
(S&AP)
Based on the findings of steps 1 and 2, develop a program
to assist in the assessment of contamination and any
impacts associated with contamination, if present. The
programme should identify a detailed scope of works for
soil, groundwater and/or surface water investigations at
each of the identified potentially contaminated sites.
4:Undertake Detailed
Site Investigations (DSI)
Undertake soil, groundwater and/or surface water
investigations in accordance with the S&AP prepared in
step 3, collecting sufficient samples to determine the
contamination status of the sites. Undertake a laboratory
analytical programme using the collected samples to
assess the nature and degree of contamination at the
sites. Results should be compared against agreed levels,
giving consideration to proposed future land uses and
potential environmental and human health impacts.
5:Develop a Site
Contamination
Management Plan
(SCMP)
Prepare a plan for implementation that manages the
contamination identified in the DSI and any associated
health and environment risks. Development involves the
selection of effective management strategies for the
identified impacts, if any. The management plan should be
practical, achieve the desired outcomes and be socially
and environmentally acceptable.
6:Remediation and
Ongoing Management
Depending on the findings of steps 1-5, undertake
remediation and/or ongoing management at sites identified
as contaminated and requiring decontamination.

Technology and Innovation
Page 46 Report No 12567-1
©2008 Technology and Innovation Date 17 September 2008
5.2.3 Decontamination assumptions and exclusions
The following assumptions and exclusions have been made in the establishment of the
decontamination criteria for the MMP2 project:
• No pre-mining contamination (of the MMP2 area) of soil or water exists.
• It is assumed that all hazardous stock kept on site during operations will be run down prior to
closure and that remaining stock will be treated and/or disposed of as part of operational
activities.
• Remediation requirements for areas that may be contaminated during operations will be
assessed on a case by case basis and appropriate measures taken to remediate. Where
possible contamination will be treated as soon as practical after the contamination is identified,
however in some instances this may not be possible until closure.
• All controlled waste will be handled, transported and disposed of by contractors appropriately
licensed under the Environmental Protection (Controlled Waste) Regulations 2004.
• All contaminated land resulting from Pilbara Iron’s operations will be identified, remediated
and managed by Pilbara Iron leading up to and following closure (as necessary) to ensure that
the land is in a condition that does not present a risk for the identified future land use.
• Any planned bioremediation facilities (i.e. landfarm) established and used during operational
phase will be capable of receiving all contaminated soil removed during closure.
• Planned waste disposal facilities will be suitable and licensed for the disposal of contaminated
or hazardous materials (e.g. hydrocarbons) during closure operations.
• No ongoing point sources of contamination will remain at the completion of decommissioning
activities.
• Decontamination strategies are undertaken with full access to soil, groundwater or surface
water, where required, to ensure all contamination is identified.
• Contamination identified can be remediated and/or contaminated soil can be removed and
disposed off-site where required.
• Decontamination is achieved when decontamination targets are achieved and any ongoing
monitoring commitments are met.

Technology and Innovation
Report No 12567-1 Page 47
Date 17 September 2008 ©2008 Technology and Innovation
5.3 Rehabilitation Plan
The Rehabilitation Plan for MMP2 outlines the specific measures that will be undertaken to
rehabilitate the areas disturbed by mining. The rehabilitation measures are consistent with those
described in the 2006 Marandoo Closure Study.
The aim of the rehabilitation plan is to achieve the following objectives and targets (Table 8):
Table 8: Rehabilitation Objectives and Targets
Objectives Targets
Have a positive net impact on
biodiversity
Fully integrate biodiversity issues in the site Land Use
Management Plans.
Specialist geotechnical sign off of the final landforms stating
they are safe and stable.
All post-mining landforms deemed ‘acceptable’ by regulatory
agencies and stakeholders.
The final closure state satisfies the pre-determined post-
closure criteria developed in conjunction with regulatory
agencies (i.e. safe, erosion, biodiversity)
Relinquishment of a safe, stable and
uncontaminated site, where the majority
of the site is aesthetically compatible
with the surrounding landscape and is
suitable for the agreed land use.
Zero contaminated sites remain, with the exception of landfill
facilities.
Construction of post-mining landforms
that minimise water ponding and are
non-polluting.
Groundwater quality consistent with the predetermined post-
closure water quality criteria developed in conjunction with
regulatory agencies within the defined post-closure monitoring
period.
Establishment of sustainable endemic
vegetation communities consistent with
surrounding undisturbed vegetation and
suitable for the support of the future
land use option.
The final closure state satisfies the predetermined post-closure
criteria developed in conjunction with regulatory agencies (i.e.
species diversity, percentage cover, etc).
Surface water discharges should not result in a loss of the
highest potential beneficial use (based on background water
quality) of downstream receiving water bodies, nor should they
result in adverse impacts to flora and fauna in downstream
natural receiving environments.
Water quality is suitable for the
proposed land use.
The operations should not result in the degradation of
groundwater quality within down gradient aquifers such that the
highest beneficial use (based on background water quality)
within the aquifer is degraded. Groundwater quality
degradation must also not compromise ecological water quality
requirements in any down gradient surface ecosystems that
are dependent upon groundwater.

Technology and Innovation
Page 48 Report No 12567-1
©2008 Technology and Innovation Date 17 September 2008
Water that flows from pit lakes must meet the criteria
developed for surface and groundwater discharges.
Ephemeral, seasonal or permanent water bodies within pits
should not pose an exposure risk to livestock, terrestrial wildlife
or humans that are intermittently exposed to water.
5.3.1 Rehabilitation Inventory
As part of the 2006 Marandoo Closure Study, the AWT site was divided into four closure domains,
loosely based on surface water drainage lines. The domains are named according to the major
operational/geographical feature. The four domains are:
• West;
• Central;
• Tail; and
• Tail Extension.
Each domain was further divided into a number of closure sub-domains. The sub-domain
represents a discrete operational area, for example West Pit, Main Dump (PI, 2006). As the MMP2
project is an extension to the existing Marandoo operation, the existing closure domains have been
retained, and additional sub-domains will be added once the final site layout has been confirmed.
To assist in the identification and assignment of the rehabilitation measures each closure sub-
domain has been assigned a landform class which describes the nature of the area in terms of
landform shaping requirements.
5.3.2 Rehabilitation Measures
The specific rehabilitation measures to be applied to each rehabilitation class are detailed in Table
9 below. The rehabilitation requirements are largely derived from the Pilbara Iron Rehabilitation
Handbook and RTIO Landform Design Guidelines these documents provide general principles and
guidance for the rehabilitation of post-mining landforms. The rehabilitation measures are regularly
reviewed, based on knowledge gained by trials, monitoring performance of existing rehabilitation
and site specific information on material characterisation and performance. It is expected that the
rehabilitation requirements develop with time and these measures should be regularly reviewed
and updated to take this into consideration. Note that for purposes of this plan, only those
measures applicable to Marandoo have been included in Table 9.
These measures provide the broad requirements for rehabilitation of the site. More specific detail
will be incorporated in future CMS and in particular as part of the final Decommissioning Closure
Plan to enable closure costs to be defined.
Technology and Innovation
Report No 12567-1 Page 49
Date 17 September 2008 ©2008 Technology and Innovation
Table 9: Rehabilitation Measures
Requirement Description Unit
Open Pit AWT - backfill
Backfill Backfill pit to a specific RL or to a level that blends in with pre-mining surface relief.
m³
Construct an abandonment bund around the perimeter of the pit outside of the zone of geotechnical instability. The bund will be constructed of competent waste rock material and be at least 2m in height and 5m width (base) consistent with statutory requirements (DoIR Guidelines for Safety Bund Walls around Abandoned Open Pits, DoIR, 1997).
Abandonment Bund
Safety signage needs to be appropriate for the local community needs (language and design).
m
Topsoil/Mulch Topsoil and mulch will be spread over backfill to a minimum depth of 200mm.
ha
Revegetation
The topsoiled surface will be deep ripped (0.5 – 1.0m), with the spacing of rip lines at no greater than 1.5m apart. Seed will be applied at the same time as ripping at an optimal rate based on current Pilbara Iron prescriptions.
ha
Open Pit BWT - backfill
Backfill Backfill pit to 1m above pre-mining water table level. m³
Construct an abandonment bund around the perimeter of the pit outside of the zone of geotechnical instability. The bund will be constructed of competent waste rock material and be at least 2m in height and 5m width (base) consistent with statutory requirements (DoIR Guidelines for Safety Bund Walls around Abandoned Open Pits, DoIR, 1997).
Abandonment Bund
Safety signage needs to be appropriate for the local community needs (language and design).
m
Topsoil/Mulch Topsoil and mulch will be spread over backfill to a minimum depth of 200mm.
ha
Revegetation
The topsoiled surface will be deep ripped (0.5 – 1.0m), with the spacing of rip lines at no greater than 1.5m apart. Seed will be applied at the same time as ripping at an optimal rate based on current Pilbara Iron prescriptions.
ha
Inert Waste Rock Dumps (topsoil available)
The top surface of the waste dump will only receive incident rainfall. That is, runoff from adjoining landforms will not be able to flow onto the waste dump.
The top surface will be sloped towards the centre (concave). This can be achieved through one single cell draining to a central water collection pool for small dumps or a series of cells and pools for larger dumps. Pools will be a minimum of 20m from the edge of the waste dump.
Waste Dump
Surface
The outer perimeter of the top surface will be bunded as appropriate.
ha
Haul Roads
Steep slopes at either side of the haul road to be pushed down to form maximum gradients of 20 degrees with berms at 10m vertical intervals. Cross bunds will need to be incorporated along the gradient of the haul at approximately 50m intervals assuming that the gradient of the reshaped road corridor is <10º. Slopes to haul road will be deep ripped along the contour and seeded as per the remainder of the waste dump.
ha
Final waste landforms may consist of variable waste rock types in terms of erodibility and therefore would require characterisation to determine the appropriate rehabilitation strategy.
Waste Dump
Slopes
High Erodibility:
ha
Technology and Innovation
Page 50 Report No 12567-1
©2008 Technology and Innovation Date 17 September 2008
Requirement Description Unit Maximum slope gradient 15 degrees, max slope length 50 m for high erodible material in accordance with the Waste Dump Design Guidelines. Berms of 5 – 10m in width to be located at 10m vertical intervals along the dump slope. Berms to be backsloped at 5º into the dump. Berms will have a gradient of ~ 2º to direct water to a predetermined discharge point. Berms to be divided into cells using cross bunds every 100m and cell floors ripped.
Moderate Erodibility:
In accordance with the Waste Dump Design Guidelines:
Maximum slope gradient 18 degrees, max slope length 50 m for medium erodible material.
Berms of 5 – 10m in width to be located at 10m vertical intervals along the dump slope. Berms to be backsloped at 5º into the dump. Berms will have a gradient of ~ 2º to direct water to a predetermined discharge point. Berms to be divided into cells using cross bunds every 100m and cell floors ripped.
Low Erodibility:
In accordance with the Waste Dump Design Guidelines:
Maximum slope gradient 20 degrees, max slope length 100 m for low erodible material.
Berms of 5 – 10m in width to be located at 10m vertical intervals along the dump slope. Berms to be backsloped at 5º into the dump. Berms will have a gradient of ~ 2º to direct water to a predetermined discharge point. Berms to be divided into cells using cross bunds every 100m and cell floors ripped.
Topsoil/Mulch Topsoil and mulch (where available) will be spread over the dump surface and slopes to a minimum depth of 100mm. ha
Revegetation
The topsoiled dump slopes will be deep ripped (1.0 – 2.0m), with the spacing of rip lines at no greater than 1.5m apart. Seed will be applied at the same time as ripping at an optimal rate based on current Pilbara Iron prescriptions.
ha
Landfills
Landfill
Capping Cap with a minimum 2m of competent inert material. m³
Topsoil/Mulch Respread topsoil windrows and stockpiled vegetation onto disturbed area. ha
Revegetation
Disturbed areas will be deep ripped on the contour to a depth of 800mm to key in the topsoil. Seed will be applied at the same time as final contour ripping at an optimal rate based on current Pilbara Iron prescriptions.
ha
Disturbed Area – Low/Moderate (unsealed roads, rail formations, and laydown areas)
If required, undertake earthworks and reshaping of non-waste dump areas to either return the area to natural relief or create a compatible landform consistent with the surrounding natural relief and landforms. Typically, such areas require re-contouring including battering of any steep slopes to less then 20º or rock armoured to prevent erosion. If the area is large with a slight slope, then windrows may be required to be constructed on the contour at approximately 50m intervals to prevent large sheet water flows.
Natural drainage lines to be re-established where practicable or redirected to enter drainage system downstream of obstacle.
Recontouring
If the area is very compacted then it may require a preliminary ripping, prior to topsoiling, to loosen the soil using a dozer and one ripping tine. The ripping depth achieved will be between 0.5 and 1.0m.
ha

Technology and Innovation
Report No 12567-1 Page 51
Date 17 September 2008 ©2008 Technology and Innovation
Requirement Description Unit
Determine whether tracks will require rehabilitation. Those where top soil has not been removed and compaction is limited to two wheel tracks may be best left to rehabilitate naturally. Other tracks will be ripped or scarified, depending on the amount of compaction present. On slopes, rip parallel to contours.
Compacted roadways may require a preliminary ripping, prior to topsoiling, to loosen the soil using a dozer with three tines down the slope. The ripping depth achieved will be between 0.5 and 1.0m.
Topsoil/Mulch Where topsoil has been removed, respread topsoil windrows and stockpiled vegetation onto disturbed area. ha
Revegetation
Moderately disturbed areas will be deep ripped on the contour to a depth of 800mm to key in the topsoil. Seed will be applied at the same time as final contour ripping at an optimal rate based on current Pilbara Iron prescriptions.
ha
Disturbed Area – High (Plant site areas)
Capping Capping concrete areas or filling holes with inert waste rock. m³
Reshaping
All areas will be reshaped and contoured to blend with adjacent relief and drainage. This will include the removal of all windrows and other impediments to run-off. Surface run-off will be diverted around open pits and final voids, where possible. The surfaces of reconstructed landforms will be contoured to prevent ponding. The final profile of the constructed drainage lines will consist of a flat base and sloped banks. Depth will not exceed 0.5m. The channel width will depend on the volume of water that is anticipated to flow down the channel. When constructing the channel all effort will be made to blend the constructed channel in with any natural drainage lines. For areas where friable, easily erodible material exists, or where there is the potential for high volume flows, it may be necessary to cover the base of the constructed channel with BIF rock material or some equivalent.
ha
Topsoil/Mulch Respread topsoil windrows and stockpiled vegetation onto disturbed area. ha
Revegetation
Disturbed areas will be deep ripped on the contour to a depth of 800mm to key in the topsoil. Seed will be applied at the same time as final contour ripping at an optimal rate based on current Pilbara Iron prescriptions.
ha
Ripping
If the area is very compacted then it may require a preliminary ripping, prior to topsoiling, to loosen the soil using a dozer and one ripping tine. The ripping depth achieved will be between 0.5 and 1.0m.
ha
Sealed Roads
Bitumen
removal Break and remove bitumen to appropriate disposal site. m
Recontouring Natural drainage lines to be re-established where practicable or redirected to enter drainage system downstream of obstacle. ha
Ripping
Compacted roadways may require a preliminary ripping, prior to topsoiling, to loosen the soil using a dozer. The ripping depth achieved will be between 0.5 and 1.0m.
ha
Topsoil/Mulch Topsoil and mulch will be spread over all reconstructed landforms (excluding haul roads and access tracks) to a minimum depth of 100mm. ha
Revegetation
Disturbed areas will be deep ripped on the contour to a depth of 800mm to key in the topsoil. Seed will be applied at the same time as final contour ripping at an optimal rate based on current Pilbara Iron prescriptions.
ha

Technology and Innovation
Page 52 Report No 12567-1
©2008 Technology and Innovation Date 17 September 2008
Requirement Description Unit
Residue Storage Facility
Outer slopes battered to a maximum slope gradient 20 degrees, max slope length 100 m for low erodible material.
Reshaping Berms of 5 – 10m in width to be located at 10m vertical intervals along the dump slope. Berms to be backsloped at 5º into the dump. Berms will have a gradient of ~ 2º to direct water to a predetermined discharge point. Berms to be divided into cells using cross bunds every 100m and cell floors ripped.
Surface
Capping Cap surface of facility with a minimum 2m of competent inert material. m³
Topsoil/Mulch Respread topsoil windrows and stockpiled vegetation onto disturbed area. ha
Revegetation
Disturbed areas will be deep ripped on the contour to a depth of 800mm to key in the topsoil. Seed will be applied at the same time as final contour ripping at an optimal rate based on current Pilbara Iron prescriptions.
ha
5.3.3 Rehabilitation Schedule
Where practical, rehabilitation will continue to be conducted progressively throughout the life of
Marandoo this will include areas such as temporary camps, laydown areas and borrow pits that are
no longer required. In addition, pit backfilling is likely to be conducted progressively in accordance
with the mine plan. However, a significant portion of the rehabilitation and pit backfilling will not be
able to be completed until the mining and processing of ore has been completed (e.g. process
plant, final pit void).
A detailed schedule of the post-mining rehabilitation will be developed as part of the final
Decommissioning Closure Plan that will be developed five years prior to planned closure.
5.3.4 Rehabilitation assumptions and exclusions
The following assumptions and exclusions have been made in the establishment of the
rehabilitation criteria for the MMP2 project:
• Rehabilitation will be undertaken after decommissioning and decontamination of the area has
been completed.
• The rehabilitation inventory is based on current plans at time of writing.
• Revegetation will only utilise locally endemic species to establish structural and floristic
composition comparable with original or surrounding native vegetation.
• Seeding and ripping will be undertaken concurrently utilising a dozer mounted seeder.
• Haul roads on final landforms will be contoured and rehabilitated to the same criteria as
applied to waste dump slopes (e.g. slopes either side of haul road battered to <20 degrees
with berms at 10 m vertical intervals).
• All product and low-grade ore stockpiles will be either sold or used as fill in rehabilitation
earthworks, unless otherwise stated.

Technology and Innovation
Report No 12567-1 Page 53
Date 17 September 2008 ©2008 Technology and Innovation
• Surface water runoff from disturbed areas will flow into natural drainage and will not require
post closure modification.

Technology and Innovation
Page 54 Report No 12567-1
©2008 Technology and Innovation Date 17 September 2008
5.4 Monitoring Plan
Upon completion of the decommissioning, decontamination and rehabilitation works, programmes
will be required to be established that monitor the performance of this work against the agreed
closure targets (closure criteria). Monitoring of the closure targets is necessary in order to be able
to clearly demonstrate successful closure or to provide an early indication of when problems may
exist and management intervention is required.
In many cases the monitoring will be a continuation of monitoring programmes established during
the operational life of the mine, in accordance with the requirements of Pilbara Iron’s operational
guidelines. The monitoring requirements will need to be reviewed in future versions of this plan to
ensure post-closure monitoring requirements are defined.
5.4.1 Monitoring Schedule
During operations, monitoring of environmental parameters will be conducted in accordance with
the Marandoo Environmental Monitoring schedule and relevant management plans or operating
strategies. A detailed post-closure monitoring schedule will be developed as part of the
Decommissioning Closure Plan.
5.4.2 Monitoring Measures
Specific monitoring measures for closure will be reviewed as part of the Decommissioning Closure
Plan. Many of the closure monitoring measures are expected to be a continuation of the current
operational monitoring measures, appropriately adjusted to reflect the closure status of the project
(Table 10).
Final monitoring measures will be developed in consultation with key stakeholders to ensure that
they will appropriately record the key indices to track progress against the agreed completion
criteria.
Table 10: Monitoring Measures
Monitoring Measures
Water
Monitoring
Establishment, maintenance, monitoring and reporting of groundwater and surface
water monitoring sites against closure targets as per Water Monitoring procedure and
related procedures.
Erosion
Monitoring
Establishment, maintenance, monitoring and reporting of landform stability and
erosion monitoring sites against closure targets as per Erosion Monitoring procedure.
Rehabilitation
Monitoring
Establishment, maintenance, monitoring and reporting of vegetation monitoring sites
against closure targets as per Rehabilitation Monitoring procedure.

Technology and Innovation
Report No 12567-1 Page 55
Date 17 September 2008 ©2008 Technology and Innovation
5.5 Workforce Management Plan
The following plan outlines the strategies and assumptions made to address the human resources
issues associated with closure of the MMP2 project.
The aim of the Workforce Management Plan is to achieve the following objectives and targets
(Table 11):
Table 11: Workforce Objectives and Targets
Objective Target
No unacceptable impacts on Rio Tinto
business from closure of Marandoo
Mine.
No adverse industrial relations outcomes associated with
closure (from cessation of operations, through
decommissioning to end of rehabilitation).
Plans for relocation of employees are developed in
consultation with relevant parties prior to closure and
implemented in a timely manner. These plans address
employee expectations and aspirations.
Employees have the opportunity to
choose / elect / determine own quality of
life outcomes resulting from mining
cessation and closure (redeployment,
own business, retirement, etc). Opportunities for Indigenous employees are identified and
pursued.
Transfer appropriate skilled and
experienced personnel within Rio Tinto.
Plans are developed and implemented for retention and
redeployment of employees with specific core skills or subject
expertise for use in other locations in the Rio Tinto Group.
These plans are subject to business requirements, employee
preference and prevailing economic climate.
Retain human resources to implement
closure plans.
Required roles for closure are filled internally (where
appropriate) through the closure process. Critical resources
required during the closure phase are retained.
Maintain a safe and healthy working
environment throughout closure
process.
Goal of zero injuries.
5.5.1 Workforce Inventory
During the construction phase of the MMP2 project approximately 250-500 people will be required,
depending on the final design selected and scheduling of works. The expected operational
workforce for the MMP2 project is approximately 250-550 employees (with approximately 200
additional people required during shutdown maintenance periods) the final workforce requirements
will primarily depend on the mining method chosen. For purposes of developing the closure costs
it has been assumed that 550 people are required. Detailed workforce inventories will be
developed and updated during the operations phase of the project and these will be used leading
up to closure to determine accurate cost estimations and tailored Human Resources Programmes.
5.5.2 Workforce Measures
Specific workforce measures have been developed for the existing Marandoo closure plan (Table
12) in order to effectively meet the objectives and targets outlined above. These measures are

Technology and Innovation
Page 56 Report No 12567-1
©2008 Technology and Innovation Date 17 September 2008
equally applicable to the broader MMP2 project. An Employee Relations Strategy (ERS) has also
been developed for the Marandoo Operations. It is envisaged that along with the Information,
Communication and Consultation Programme (ICCP), the ERS will be implemented approximately
five years prior to planned closure.
Table 12: Workforce Measures
Measures
An Information, Communication and Consultation Programme, Employee relations
Strategy and Industrial Relations Plan will be developed five years prior to closure.
Five years before closure, employee management obligations will be reviewed, in the
light of a comprehensive legal closure obligations review that includes industrial and
employee relations obligations.
Five years prior to closure, employee preference to redundancy, redeployment and
retraining will be ascertained through consultative processes.
The labour market (labour cost, availability etc) will be regularly reviewed. The
assumptions used in the Closure Management cost estimate formulation will be
regularly evaluated and updated.
Redeploy all Pilbara Iron employees with required skill and experience to other Pilbara
Iron managed operations.
Pilbara Iron employees not redeployed to other Pilbara Iron operations will be
retrenched at the closure of the operation. Implicit within the assumption is that these
employees will be provided with retraining to assist future employment opportunities.
Retraining and redeployment strategies for Indigenous employees will be developed in
conjunction with the Indigenous Employment team.
Develop contracting strategies and liaise with key contractors as part of
decommissioning study.
Key closure personnel will be identified and appropriate retention strategy will be
developed as part of the decommissioning study.
Specific H&S management strategy will be developed for closure as part of
decommissioning study.
Technology and Innovation
Report No 12567-1 Page 57
Date 17 September 2008 ©2008 Technology and Innovation
5.6 Information, Communication and Consultation Programme
The Information, Communication and Consultation Programme (ICCP) outlines the strategies and
assumptions made to address the Socio-Economic issues associated with closure of the MMP2
project, including the stakeholder communication and consultation processes leading to closure.
The specific objectives of the ICCP are to address the targets of (Table 13):
Table 13: Community and Stakeholder Objectives and Targets
Objective Target
Maintain and document a
comprehensive stakeholder Information,
Communication and Consultation
Programme through closure.
Majority of the stakeholder (community, government authorities
and employees) priorities are recognised and addressed
throughout the closure plan and a stakeholder agreed final
land use plan developed.
Identify and manage Indigenous
concerns.
Members of the local Indigenous community or suitable
representatives are included in the Stakeholder information,
communication and consultation network.
Maintain Indigenous heritage values in
the project area.
Significant heritage sites effectively managed to ensure long
term maintenance of heritage values.
5.6.1 Stakeholder Register
A stakeholder register has been developed for the Marandoo Operations as part of the 2006
closure planning process. Stakeholders were grouped into five broad categories, being:
• Internal stakeholders;
• Local and State government agency representatives;
• Local business representatives;
• Local community service providers; and
• Broader community interest groups.
Stakeholders were ranked according to their influence on, and impact by, closure of the operations
at Marandoo. It is expected that these stakeholder groups and their rankings will be identical for
the MMP2 project.
5.6.2 Closure Measures
Specific measures for communication and consultation with the projects stakeholders have been
developed and presented in Table 14. The process for communicating and consulting with external
stakeholders is an ongoing process and is managed through Pilbara Iron’s Communities and
Approvals team. This coordinated approach is to ensure:
• Key messages are developed in line with business decisions;

Technology and Innovation
Page 58 Report No 12567-1
©2008 Technology and Innovation Date 17 September 2008
• Key messages are approved by the business;
• Key messages and communications are reflective of and part of the broader communication
strategy;
• Expectations of external stakeholders are managed; and
• The correct stakeholders and stakeholder representatives are contacted.
Five years from closure, Pilbara Iron will engage a dedicated team to implement the information,
communication and consultation strategy to manage a focussed, smooth transition into the closure
period.
The process for communicating and consulting with internal stakeholders is managed by Human
Resources through their ‘Closure Planning Employee Communication Pack’. This is developed in
line with Rio Tinto recommended guidelines for Communications and Information to Employees as
required by the EU Works Council Directive: 94/95/EC. The coordinated approach for Internal
Stakeholders will be managed in alignment with the approach for External Stakeholders and the
closure timeframe. A Human Resources dedicated team will be in place five years prior to closure
to manage the process.
Table 14: Information, Communication and Consultation Measures
Measure
Maintain the Marandoo Mine stakeholder register
Develop an ‘Internal Key Stakeholder Communication and Consultation Plan’ based
on Pilbara Iron’s Internal Communication Policy
Develop an ‘External Key Stakeholder Communication and Consultation Plan’ based
on Pilbara Iron’s External Communication Policy
Within five years of closure, develop and deliver through approved mechanisms, very
specific key closure messages and information.
5.6.3 Information, Communication and Consultation Assumptions and Exclusions
For the purposes of this closure plan the following assumptions and exclusions have been made in
relation to the closure costs and conditions associated with the closure of the MMP2 project.
• It is assumed that stakeholder consultation will be an ongoing process throughout the life of
the Marandoo Operation, and this consultation will be conducted through existing channels
and processes. However within five years of closure, consultation will become a specific
closure process.
• Within five years of closure, the business will form dedicated closure implementation teams
that will manage the delivery of approved, specific closure messages and information in
accordance with Pilbara Iron Internal and External communication polices.

Technology and Innovation
Report No 12567-1 Page 59
Date 17 September 2008 ©2008 Technology and Innovation
6 CLOSURE RISKS
A closure specific risk assessment has been conducted for the MMP2 project to identify the key
opportunities and threats for closure of the Marandoo Operations. The risk assessment has been
used to ensure the major threats and opportunities for closure have been identified. These threats
and opportunities are fed back into the mine planning process to ensure that closure is considered
in the design and implementation of the MMP2 project.
The key areas of risk related to closure of the MMP2 operations include:
• Visual impact
• Re-establishment of surface water flows
• Impacts to groundwater
• Future land-use
• Rehabilitation
Where there are no existing controls in place to adequately manage significant risks, additional risk
reduction measures will be developed and implemented as appropriate. Where these risk
reduction measures relate specifically to the closure planning process they will be incorporated as
a future improvement action. The closure risk assessment will be incorporated into the broader
project risk assessment and will be regularly reviewed during the development phase of the
project.
Technology and Innovation
Page 60 Report No 12567-1
©2008 Technology and Innovation Date 17 September 2008
7 CLOSURE PLANNING IMPROVEMENT
Specific improvement opportunities to be considered in future improvements of this closure plan
include:
• Continue to proactively engage with stakeholders and incorporate closure as a specific topic
of discussion to clarify and agree on the closure vision, future land use and closure options.
• Maintain and regularly update the knowledge base to ensure detailed information about
existing environment, stakeholders and community and closure obligations is maintained.
• Review of proposed pit backfilling strategy when results from the long term predictive
modelling is completed.
• Undertake a legal review for the Marandoo operation subject to approvals and commissioning
of the MMP2 project once all operational licences, permits and approvals have been obtained
to determine the implications on closure.
• Further develop the closure planning process with regard to preparation of appropriate
procedures, development of effective tools and assignment of responsibilities.
• Continue to review and validate the closure objectives, targets and measures to ensure they
continue to reflect statutory, corporate and community requirements.
• Where applicable ensure the closure plan is aligned with relevant operational procedures,
tools and measures.
• Regularly review and update the decommissioning, rehabilitation and human resources
inventories for the project and regularly review and update the closure costs.
• Conduct waste characterisation of materials to determine suitability of materials as backfill
and/or use in waste dump construction.