Fiber Bragg Gratings for Strain and Temperature ... · PDF fileFiber Bragg Grating sensors...
5
Abstract— In this paper, preliminary experimental results on strain and temperature distribution of the internal surface of a commercial tire coming from a Fiber Optical sensing system are presented. The measurement setup is based on Fiber Bragg Grating sensors (FBG) bonded in the internal surface of the tire in order to provide strain and temperature distributions during tire operation. Capabilities of the proposed method in terms of tire strain monitoring have been experimentally verified for several static vertical loads. The results have shown a clear correlation between strain, contact patch extension and vertical loads. Further tests have been executed for validating the optical sensing system in the case of thermal load application. The temperature measurement obtained by the FBG system confirmed a good accordance with the expected thermo-dynamic tire behavior. Index Terms— Smart tires; strain monitoring; Fiber bragg gratings; tire temperature measurement. I. INTRODUCTION Tire road interaction strongly affects the vehicle dynamic behaviour because it represents the source of the input forces to the vehicle. As consequence, advances in this field are oriented to maximize the longitudinal and lateral forces between tire and road but, at the same time, to consider the tire through a systemic approach. So, the tire can be seen, from a mechanical point of view, the ―actuator‖ of the vehicle but, at the same time, it can be seen also as a functional device for monitoring the interaction mechanism. Research and technological advances in tire development are focused on the increasing of the vehicle safety, improving vehicle stability and control. Nowadays the vehicle safety relies more on active control systems that employ information about vehicle dynamics to improve the safety by detecting and minimizing skids [1]. G. Breglio is with the Department of Electrical Engineering and Information Technologies, University of Naples Federico II, 80125 ITALY (e-mail: [email protected]). F. Fienga is with the Department of Electrical Engineering and Information Technologies, University of Naples Federico II, 80125 ITALY (e-mail: [email protected]). A. Irace is with the Department of Electrical Engineering and Information Technologies, University of Naples Federico II, 80125 ITALY (e-mail: [email protected]). M. Russo is with the Department of Electrical Engineering and Information Technologies, University of Naples Federico II, 80125 ITALY (e-mail: [email protected]). S. Strano is with the Department of Industrial Engineering, University of Naples Federico II, 80125 ITALY (corresponding author, phone: +390817683277; e-mail: [email protected]). M. Terzo is with the Department of Industrial Engineering, University of Naples Federico II, 80125 ITALY (e-mail: [email protected]). Systems, such as Traction Control, Electronic Stability Program, etc., rely on the indirect estimation of vehicle dynamics variables, such as forces and tire road friction, using on board sensors. The instrumentation of the tire allows to make direct measurements with the fundamental advantage of obtaining information with higher accuracy. The consequence is that the so called ―smart tire‖, that is the tire equipped with a sensor system for monitoring, for example, the tire strain, air pressure, acceleration or temperature is being researched extensively to improve the fuel efficiency, safety, and reliability of the vehicle [2 – 6]. The methods that involve the instrumentation of the tire are several: a tire equipped with a surface acoustic wave sensor has been developed in [7] to measure deformation, MEMS and optical fiber sensors have been employed in [8] and [9], respectively. Optical sensor technology has shown its advantages in terms of resolution, accuracy, power supply and data transmission [10]. Taking into account that the frictional mechanism is deeply linked to the mechanical properties and temperature of the materials, the present paper focuses on the direct measurement of the tire strain and rubber temperature with the aim to acquire direct information concerning the tire- road interaction and to realize an estimation of the friction conditions. The measurement setup is based on Fiber Bragg Grating (FBG) sensors bonded to the internal surface of the tire. Five sensors have been placed along the circumferential direction and four have been placed transversely. Vertical static tests and thermal tests have been executed in order to validate the functionalities of the proposed tire sensing system. The paper is organized as follows. Section 2 presents the intelligent tire prototype system. In Section 3, the signals acquired during the experimental test campaign are presented. Section 4 draws some conclusions and presents some perspectives of the work. II. INTELLIGENT TIRE PROTOTYPE SYSTEM A. Introduction and FBG The aim of the experimental tests has been the measurement of temperature, and strain in several points inside a tire inner liner. Strain has been determined as a function of the vertical load and the inflation pressure. The measurements have been made using FBGs. An FBG is a distributed Bragg grating realized by periodically varying the core‘s refractive index in a short segment (10 mm) of a SM optical fiber, who reflects very narrowband of wavelengths of light and Fiber Bragg Gratings for Strain and Temperature Measurements in a Smart Tire G. Breglio, F. Fienga, A. Irace, M. Russo, S. Strano, M. Terzo Proceedings of the World Congress on Engineering 2017 Vol II WCE 2017, July 5-7, 2017, London, U.K. ISBN: 978-988-14048-3-1 ISSN: 2078-0958 (Print); ISSN: 2078-0966 (Online) WCE 2017
Transcript of Fiber Bragg Gratings for Strain and Temperature ... · PDF fileFiber Bragg Grating sensors...

Abstract— In this paper, preliminary experimental results
on strain and temperature distribution of the internal surface
of a commercial tire coming from a Fiber Optical sensing
system are presented. The measurement setup is based on
Fiber Bragg Grating sensors (FBG) bonded in the internal
surface of the tire in order to provide strain and temperature
distributions during tire operation. Capabilities of the
proposed method in terms of tire strain monitoring have been
experimentally verified for several static vertical loads. The
results have shown a clear correlation between strain, contact
patch extension and vertical loads. Further tests have been
executed for validating the optical sensing system in the case of
thermal load application. The temperature measurement
obtained by the FBG system confirmed a good accordance with
the expected thermo-dynamic tire behavior.
Index Terms— Smart tires; strain monitoring; Fiber bragg
gratings; tire temperature measurement.
I. INTRODUCTION
Tire road interaction strongly affects the vehicle dynamic
behaviour because it represents the source of the input
forces to the vehicle. As consequence, advances in this field
are oriented to maximize the longitudinal and lateral forces
between tire and road but, at the same time, to consider the
tire through a systemic approach. So, the tire can be seen,
from a mechanical point of view, the ―actuator‖ of the
vehicle but, at the same time, it can be seen also as a
functional device for monitoring the interaction mechanism.
Research and technological advances in tire development
are focused on the increasing of the vehicle safety,
improving vehicle stability and control. Nowadays the
vehicle safety relies more on active control systems that
employ information about vehicle dynamics to improve the
safety by detecting and minimizing skids [1].
G. Breglio is with the Department of Electrical Engineering and
Information Technologies, University of Naples Federico II, 80125 ITALY
(e-mail: [email protected]).
F. Fienga is with the Department of Electrical Engineering and
Information Technologies, University of Naples Federico II, 80125 ITALY
(e-mail: [email protected]).
A. Irace is with the Department of Electrical Engineering and
Information Technologies, University of Naples Federico II, 80125 ITALY
(e-mail: [email protected]).
M. Russo is with the Department of Electrical Engineering and
Information Technologies, University of Naples Federico II, 80125 ITALY
(e-mail: [email protected]).
S. Strano is with the Department of Industrial Engineering, University of
Naples Federico II, 80125 ITALY (corresponding author, phone:
+390817683277; e-mail: [email protected]).
M. Terzo is with the Department of Industrial Engineering, University
of Naples Federico II, 80125 ITALY (e-mail: [email protected]).
Systems, such as Traction Control, Electronic Stability
Program, etc., rely on the indirect estimation of vehicle
dynamics variables, such as forces and tire road friction,
using on board sensors. The instrumentation of the tire
allows to make direct measurements with the fundamental
advantage of obtaining information with higher accuracy.
The consequence is that the so called ―smart tire‖, that is the
tire equipped with a sensor system for monitoring, for
example, the tire strain, air pressure, acceleration or
temperature is being researched extensively to improve the
fuel efficiency, safety, and reliability of the vehicle [2 – 6].
The methods that involve the instrumentation of the tire are
several: a tire equipped with a surface acoustic wave sensor
has been developed in [7] to measure deformation, MEMS
and optical fiber sensors have been employed in [8] and [9],
respectively. Optical sensor technology has shown its
advantages in terms of resolution, accuracy, power supply
and data transmission [10].
Taking into account that the frictional mechanism is deeply
linked to the mechanical properties and temperature of the
materials, the present paper focuses on the direct
measurement of the tire strain and rubber temperature with
the aim to acquire direct information concerning the tire-
road interaction and to realize an estimation of the friction
conditions. The measurement setup is based on Fiber Bragg
Grating (FBG) sensors bonded to the internal surface of the
tire. Five sensors have been placed along the circumferential
direction and four have been placed transversely. Vertical
static tests and thermal tests have been executed in order to
validate the functionalities of the proposed tire sensing
system.
The paper is organized as follows. Section 2 presents the
intelligent tire prototype system. In Section 3, the signals
acquired during the experimental test campaign are
presented. Section 4 draws some conclusions and presents
some perspectives of the work.
II. INTELLIGENT TIRE PROTOTYPE SYSTEM
A. Introduction and FBG
The aim of the experimental tests has been the measurement
of temperature, and strain in several points inside a tire
inner liner. Strain has been determined as a function of the
vertical load and the inflation pressure. The measurements
have been made using FBGs. An FBG is a distributed Bragg
grating realized by periodically varying the core‘s refractive
index in a short segment (10 mm) of a SM optical fiber,
who reflects very narrowband of wavelengths of light and
Fiber Bragg Gratings for Strain and
Temperature Measurements in a Smart Tire
G. Breglio, F. Fienga, A. Irace, M. Russo, S. Strano, M. Terzo
Proceedings of the World Congress on Engineering 2017 Vol II WCE 2017, July 5-7, 2017, London, U.K.
ISBN: 978-988-14048-3-1 ISSN: 2078-0958 (Print); ISSN: 2078-0966 (Online)
WCE 2017

transmits all others as depicted in (Fig. 1). A FBG can
therefore be used as an inline optical filter to block certain
wavelengths, or as a wavelength-specific reflector.
Fig. 1. Fiber Bragg Grating, refractive index profile and spectral response.
Light propagates through the grating with negligible
attenuation or signal variation. Only those wavelengths that
satisfy the Bragg condition are affected and strongly back-
reflected. The ability to accurately preset and maintain the
grating wavelength is a fundamental feature and advantage
of fiber Bragg gratings. The central wavelength λB of the
reflected component satisfies the Bragg relation:
effB n2 (1)
where neff is the effective index of refraction and Λ the
period of the index of refraction variation of the FBG. Due
to the temperature and strain dependence of the parameters
neff and Λ, the wavelength of the reflected component will
also change as function of temperature and/or strain. This
dependency is well known and allows to determine the
temperature or strain from the reflected FBG wavelength. Variations of physical properties of the grating sensor
modify the reflected wavelength λB. In particular, strain on
the fiber alters Λ and n through stress optic effect.
Temperature variations modify neff via the thermos-optic
effect and Λ is influenced by thermal expansion variations.
The instantaneous wavelength λi of the i-th FBG sensor is
related to the local strain i by the following formula:
TKi
iii
0
0 (2)
where ΔT is the local temperature variation, α is the
coefficient of thermal sensitivity, Kε is the constant of
proportionality and λ0i is the reference wavelength for the
i-th FBG sensor without any variation (both thermal and
mechanical). In cases of temperature variations, two FBG
sensors are required: one for the strain, which is
mechanically bonded to the structure, and the other FBG,
close to the first one, which is not bonded and consequently
it is able to measure only temperature variations, which is
used to depurate from the first one the wavelength shift due
to the amount of the thermal apparent strain (as described in
Eq. 2). As for instance, typical FBG sensor sensitivity to
strain and temperature, at central wavelength around
1550um, are: wavelength variations due to mechanical
strain about 1 pm/µε and 10 pm/C°, respectively. Being
wavelength encoded, FBG sensors allow distributed sensing
over significant areas by multiplexing a large number of
sensors on a single optical fiber and have compact size;
moreover optical signals are intrinsically immune to
electromagnetic interference. Due to all these advantages,
they have been widely used in many applications for the
structural health monitoring [10].
B. FBG-based intelligent tire
FBG sensors have been utilized to measure the local
deformation and temperature of the tire carcass. The tire
used for the actual setup has the size 245/40/R18. Fig. 2
shows the reference systems adopted for the pneumatic tire
and the area in the inner surface where the FBGs have been
bonded.
Fig. 2. Reference systems.
In this preliminary study, the tire has been deformed only
statically and vertically for different tire-force relative
direction. A practical implementation of the proposed
intelligent tire is under development and an optical rotary
joint or a wireless FBG interrogator should be necessary for
dynamic tests in rolling conditions. An FBG interrogator,
based on the use of tunable laser, has been adopted for
measuring the frequency of the light reflected by FBG
sensors from the various positions along the fiber where
they are inserted. In particular, nine FBGs have been used
for deformations; one has been used for temperature (Fig.
3). The connection between the fiber inside the tire and the
interrogator has been executed through a hole in the tire rim,
applying a sealant (see Fig. 2). The FBG sensors for strain
measurement are schematized with gray rectangles in Fig. 3,
while the FBG sensor for temperature measurement is
depicted with a black rectangle. In particular, five
deformation sensors have been placed in the circumferential
direction (axis x‘) and four deformation sensors have been
placed transversely (axis y‘).
Proceedings of the World Congress on Engineering 2017 Vol II WCE 2017, July 5-7, 2017, London, U.K.
ISBN: 978-988-14048-3-1 ISSN: 2078-0958 (Print); ISSN: 2078-0966 (Online)
WCE 2017
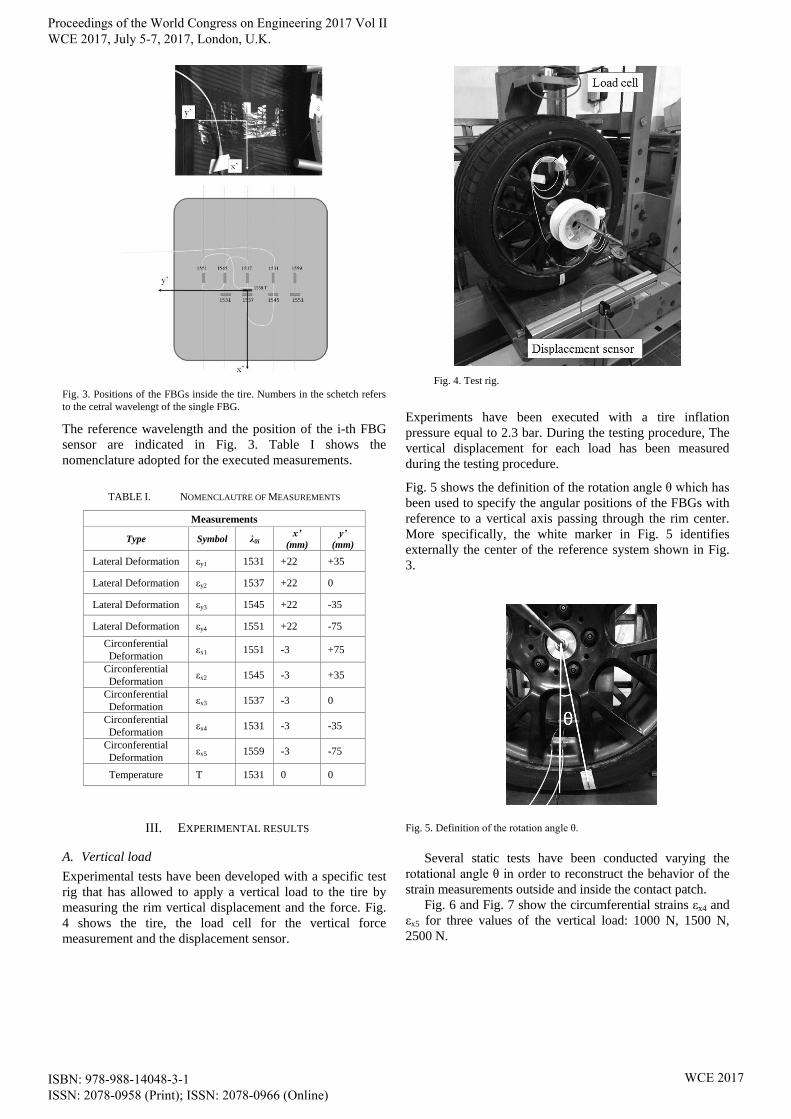
Fig. 3. Positions of the FBGs inside the tire. Numbers in the schetch refers
to the cetral wavelengt of the single FBG.
The reference wavelength and the position of the i-th FBG
sensor are indicated in Fig. 3. Table I shows the
nomenclature adopted for the executed measurements.
TABLE I. NOMENCLAUTRE OF MEASUREMENTS
Measurements
Type Symbol λ0i x’
(mm)
y’
(mm)
Lateral Deformation εy1 1531 +22 +35
Lateral Deformation εy2 1537 +22 0
Lateral Deformation εy3 1545 +22 -35
Lateral Deformation εy4 1551 +22 -75
Circonferential
Deformation εx1 1551 -3 +75
Circonferential
Deformation εx2 1545 -3 +35
Circonferential
Deformation εx3 1537 -3 0
Circonferential
Deformation εx4 1531 -3 -35
Circonferential
Deformation εx5 1559 -3 -75
Temperature T 1531 0 0
III. EXPERIMENTAL RESULTS
A. Vertical load
Experimental tests have been developed with a specific test
rig that has allowed to apply a vertical load to the tire by
measuring the rim vertical displacement and the force. Fig.
4 shows the tire, the load cell for the vertical force
measurement and the displacement sensor.
Fig. 4. Test rig.
Experiments have been executed with a tire inflation
pressure equal to 2.3 bar. During the testing procedure, The
vertical displacement for each load has been measured
during the testing procedure.
Fig. 5 shows the definition of the rotation angle θ which has
been used to specify the angular positions of the FBGs with
reference to a vertical axis passing through the rim center.
More specifically, the white marker in Fig. 5 identifies
externally the center of the reference system shown in Fig.
3.
Fig. 5. Definition of the rotation angle θ.
Several static tests have been conducted varying the
rotational angle θ in order to reconstruct the behavior of the
strain measurements outside and inside the contact patch.
Fig. 6 and Fig. 7 show the circumferential strains εx4 and
εx5 for three values of the vertical load: 1000 N, 1500 N,
2500 N.
Proceedings of the World Congress on Engineering 2017 Vol II WCE 2017, July 5-7, 2017, London, U.K.
ISBN: 978-988-14048-3-1 ISSN: 2078-0958 (Print); ISSN: 2078-0966 (Online)
WCE 2017

Fig. 6. Circumferential strain εx4.
Fig. 7. Circumferential strain εx5.
The strain distributions of Figs. 6 and 7 clearly show that
the maximum strain value for θ = 0° increases by increasing
the vertical load, for both the circumferential strain sensors.
These results can be useful in order to estimate the vertical
load from the maximum value of the strain in the middle of
the contact patch. Furthermore, using the relationship
between the applied vertical load and the vertical
displacement of the rim, the rolling radius can be estimated.
Compressive strains on the periphery of the contact patch
are due to the carcass bending [11]. Therefore, the inner
surface is under compression before entering the contact
patch and after leaving the contact patch, and is stretched
within the contact patch.
Fig. 8 and Fig. 9 show the lateral strains εy2 and εy3 for
three values of the vertical load: 1000 N, 1500 N, 2500 N.
Fig. 8. Lateral strain εy2.
Fig. 9. Lateral strain εy3.
The lateral strains have their maximum values lower
than those circumferential ones. The strain distributions
show tensile stresses for all the values of the rotational
angle. In the prossimity of the contact patch, lateral stains
have a decreasing trend until reaching a minimum value,
and then incresing up to the center of the contact patch.
An estimation of the contact length could be obtained by
numerically differentiating the cricoferential strains with
respect to the rotational angle [11]. Fig. 10 shows the
behavior of the numerical differentation of circunferential
strain εx5 with respect to the rotation angle θ, for two vertical
loads: 1000 N and 2500 N.
Fig. 10. Numerical differentation of circunferential strain εx5 with respect to
the rotation angle θ.
The angular extension of the contact patch is related to the
value of the angle for which the derivative is minimum [11].
Consequently, the abscissa value at the minimum of the two
graphs of Fig. 10 refers to the extension of the contact patch
for the two vertical loads. Therefore, it is possible to note
that the contact length increases by increasing the vertical
load.
B. Temperature measurements
Thermal tests have been conducted heating the tire with a
hot fan and by measuring the external temperature with a IR
thermal camera and the temperature of the inner liner with
the FBG sensor in contact with the rubber, where a
thermally conductive paste has been applied (Fig. 11) to
assure the heat transmission between the rubber and the
fiber.
Proceedings of the World Congress on Engineering 2017 Vol II WCE 2017, July 5-7, 2017, London, U.K.
ISBN: 978-988-14048-3-1 ISSN: 2078-0958 (Print); ISSN: 2078-0966 (Online)
WCE 2017

Fig. 11. Detail fo the thermally conductive paste used between the tire inner
surface and the FBG.
Fig. 12 shows a camera frame acquired during the heating
phase. The image presented in Fig. 12 clearly shows the
external area of the tire invested by the hot air flow.
Fig. 12. Camera frame during the heating phase.
In Fig. 13, the trends of the outer and the inner temperature
are reported. In particular, the test has been carried out by
heating the tire up to 74 °C. Successively, the heat source
has been interrupted.
Fig. 13. External and internal temperature dynamic measured with the
thermal camera and the FBG, respectively.
In Fig. 13, it is possible to note that towards the end of the
test the outer and the inner temperature follow the same
trend, in line with the expected thermal cooling process.
IV. CONCLUSIONS
An extensive experimental activity has been performed in
order to equip a tire with FBG optical sensors to measure
both temperatures and deformations of the tire inner surface.
Vertical static tests have been developed to correlate the
circumferential and the lateral deformation to the applied
vertical load and contact patch. Similarly, thermal tests have
allowed to analyze the thermal behavior of the tire inner
surface. The optical sensors have provided measurements
consistent with the expected physical behavior of the tire.
The results could allow to validate various types of tire
models; i.e. finite element tire models and thermo-dynamic
tire models. The developed sensory system equipped with an
optical rotary joint or a wireless system will allow to test the
proposed smart tire in actual rolling condition.
ACKNOWLEDGMENT
The research activity is a result of partnership between
University of Naples Federico II and OptoSmart s.r.l.
REFERENCES
[1] R. Russo, S. Strano, M. Terzo, ―Enhancement of vehicle dynamics via an innovative magnetorheological fluid limited slip differential,‖ Mechanical Systems and Signal Processing, vol. 70 – 71, pp. 1193 – 1208, 2016.
[2] M. Sergio, N. Manaresi, M. Tartagni, R. Canegallo and R. Guerrieri, ―On a road tire deformation measurement system using a capacitive-resistive sensor,‖ Smart Mater. Struct., vol. 15, no. 6, pp. 1700–1706, 2006.
[3] G. Schimetta, F. Dollinger and R. Weigel, ―A wireless pressure-measurement system using a SAW hybrid sensor,‖ Proc. 2000 IEEE Ultrasonic Symp. pp 445–448, 2000.
[4] X. Zhang, F. Wang, Z. Wang, W. Li and D. He, ―Intelligent tires based on wireless passive surface acoustic wave sensors,‖ Proc. 7th Int. IEEE Conf. Intelligent Transportation Systems, 2004, pp 960–9644.
[5] J. D. Cullen, N. Arvanitis, J. Lucas and A. I. Al-Shamma‘a, ―In-field trials of a tire pressure monitoring system based on segmented capacitance rings,‖ Measurement, vol. 32, pp 181–192, 2002.
[6] C. Halfmann, M. Ayoubi and H. Holzmann, ―Supervision of vehicles‘ tire pressures by measurement of body accelerations,‖ Control Eng. Pract., vol. 5, no. 8, pp. 1151–1159, 1997.
[7] A. Pohl, R. Steindl and L. Reindl, ―The ‗intelligent tire‘ utilizing passive saw sensors—measurement of tire fiction,‖ IEEE Trans. Instrum. Meas., vol. 48, pp. 1041–1046, 1999.
[8] L. Cao, T. S. Kim, S. C. Mantell and D. L. Polla, ―Simulation and fabrication of piezoresistive membrane type MEMS strain sensor,‖ Sens. Actuators, vol. 80, pp. 273–279, 2000.
[9] N. Roveri, G. Pepe, A. Carcaterra, ―OPTYRE – A new technology for tire monitoring: Evidence of contact patch phenomena,‖ Mechanical Systems and Signal Processing, vol. 66–67, pp. 793-810, 2016.
[10] F. Fienga, N. Beni, G. Breglio, S. Buontempo, M. Consales, A. Cusano, A. Gaddi, A. Irace, M. Giordano, S. Szillasi, ―Fibre optic sensors structural health monitoring of the central beam pipe in the CMS experiment at the CERN laboratories,‖ 8th European Workshop on Structural Health Monitoring, EWSHM 2016, vol. 2, pp. 1018-1025, 2016.
[11] M. Ryosuke, H. Naoki, T. Akira, M. Yoshihiro, ―Analysis of Applied Load Estimation Using Strain for Intelligent Tires,‖ Journal of Solid Mechanics and Materials Engineering, vol. 4, no. 10, pp. 1496–1510, 2010.
Proceedings of the World Congress on Engineering 2017 Vol II WCE 2017, July 5-7, 2017, London, U.K.
ISBN: 978-988-14048-3-1 ISSN: 2078-0958 (Print); ISSN: 2078-0966 (Online)
WCE 2017