Agricultural extension policy: the missing link in innovations in extension and advisory services.

Federal Way Link Extension
Central Puget Sound Regional Transit Authority
Final Environmental Impact Statement
November 2016
NOISE AND VIBRATION TECHNICAL REPORTAppendix G3


Federal Way Link Extension Noise and Vibration Technical Report Prepared for: Sound Transit Prepared by: HDR Inc. Michael Minor & Associates, Inc. ATS Consulting CH2M HILL November 2016


Federal Way Link Extension iii Noise and Vibration Technical Report November 2016
Contents
Acronyms and Abbreviations ............................................................................................................ vii
1.0 Introduction and Summary ................................................................................................... 1‐1
1.1 Summary of Transit Noise Impacts and Potential Mitigation ...................................................... 1‐1
1.2 Summary of Traffic Noise Impacts and Potential Mitigation ...................................................... 1‐2
1.3 Summary of Vibration Impacts and Potential Mitigation ............................................................ 1‐3
2.0 Environmental Noise and Vibration Basics ............................................................................ 2‐1
2.1 Noise Fundamentals and Descriptors .......................................................................................... 2‐1
2.2 Vibration Fundamentals and Descriptors .................................................................................... 2‐3
3.0 Affected Environment ........................................................................................................... 3‐1
3.1 Noise and Vibration Sensitive Receivers ...................................................................................... 3‐1
3.1.1 I‐5 Corridor ....................................................................................................................... 3‐1
3.1.2 SR 99 Corridor .................................................................................................................. 3‐3
3.2 Noise Measurements ................................................................................................................... 3‐6
3.2.1 I‐5 Corridor ....................................................................................................................... 3‐9
3.2.2 SR 99 Corridor ................................................................................................................ 3‐12
3.3 Vibration Measurements ........................................................................................................... 3‐14
3.3.1 Vibration Propagation Test Procedure .......................................................................... 3‐14
3.3.2 Vibration Propagation Test Sites ................................................................................... 3‐16
3.3.3 Results of Vibration Propagation Tests .......................................................................... 3‐17
4.0 Noise and Vibration Impact Criteria ...................................................................................... 4‐1
4.1 Noise Impact Criteria ................................................................................................................... 4‐1
4.1.1 Transit Noise Impact Criteria ........................................................................................... 4‐1
4.1.2 Traffic Noise Impact Criteria ............................................................................................ 4‐5
4.1.3 State Regulations and Local Noise Ordinances ................................................................ 4‐6
4.2 Groundborne Noise and Vibration Criteria................................................................................ 4‐10
4.2.1 Transit Vibration and Groundborne Noise Criteria ....................................................... 4‐10
5.0 Noise and Vibration Impact Analysis Assumptions and Methods .......................................... 5‐1
5.1 Noise Assumptions and Methods ................................................................................................ 5‐1
5.1.1 Transit Noise .................................................................................................................... 5‐1
5.1.2 Traffic Noise ..................................................................................................................... 5‐8
5.2 Vibration Assumptions and Methods ........................................................................................ 5‐10
5.2.1 Sources of Light Rail Vibration ....................................................................................... 5‐10
6.0 Impact Assessment ............................................................................................................... 6‐1
6.1 Transit Noise Impacts ................................................................................................................... 6‐1
6.1.1 Noise Impacts from Light Rail .......................................................................................... 6‐1
6.1.2 Noise Impacts from Park‐and‐Rides and Stations ........................................................... 6‐9
6.2 Traffic Noise Impacts ................................................................................................................. 6‐11

Contents
Federal Way Link Extension iv Noise and Vibration Technical Report November 2016
6.2.1 Traffic Noise Analysis Areas ........................................................................................... 6‐11
6.2.2 S 317th Street and 23rd Avenue S Roundabout ............................................................ 6‐12
6.2.3 Traffic Noise Model Validation ...................................................................................... 6‐13
6.2.4 Existing Traffic Noise Levels ........................................................................................... 6‐14
6.2.5 No Build Traffic Noise Levels .......................................................................................... 6‐15
6.2.6 Preferred Alternative Traffic Noise Impacts .................................................................. 6‐16
6.2.7 SR 99 Alternative ............................................................................................................ 6‐20
6.2.8 SR 99 to I‐5 Alternative .................................................................................................. 6‐21
6.2.9 I‐5 to SR 99 Alternative .................................................................................................. 6‐22
6.3 Vibration Impacts ....................................................................................................................... 6‐22
6.3.1 Preferred Alternative ..................................................................................................... 6‐22
6.3.2 SR 99 Alternative ............................................................................................................ 6‐23
6.3.3 SR 99 to I‐5 Alternative .................................................................................................. 6‐26
6.3.4 I‐5 to SR 99 Alternative .................................................................................................. 6‐26
6.4 Groundborne Noise Impacts ...................................................................................................... 6‐27
6.5 Construction ............................................................................................................................... 6‐28
6.5.1 Construction Noise Impact Analysis .............................................................................. 6‐28
6.5.2 Construction Vibration Impacts ..................................................................................... 6‐33
7.0 Potential Noise and Vibration Mitigation Measures ............................................................. 7‐1
7.1 Potential Noise Mitigation ........................................................................................................... 7‐1
7.1.1 Types of Noise Mitigation ................................................................................................ 7‐1
7.1.2 Transit Noise Mitigation .................................................................................................. 7‐3
7.1.3 Traffic Noise Mitigation ................................................................................................... 7‐6
7.2 Potential Vibration Mitigation ................................................................................................... 7‐11
7.2.1 Types of Vibration Mitigation ........................................................................................ 7‐11
7.2.2 Transit Vibration Mitigation ........................................................................................... 7‐13
7.3 Potential Construction Mitigation ............................................................................................. 7‐16
7.3.1 Construction Noise Mitigation ....................................................................................... 7‐16
7.3.2 Construction Vibration Mitigation ................................................................................. 7‐17
8.0 References ............................................................................................................................ 8‐1
Appendices ...................................................................................................................................... 8‐1
Appendices (on CD and website)
A Noise Monitoring Details
B Detailed Noise Impact Assessment Data
C Detailed Noise and Vibration Analysis Maps
D Vibration Propagation Test Sites
E Best Fit Coefficients of Vibration Propagation Data and Propagation Testing Results
F Detailed Vibration Analysis Sheets

Contents
Federal Way Link Extension v Noise and Vibration Technical Report November 2016
Tables
1‐1 Summary of Light Rail Noise Impacts .......................................................................................... 1‐2
1‐2 Summary of Traffic Noise Impacts under the Preferred Alternative .......................................... 1‐3
1‐3 Summary of Vibration and Groundborne Noise Impacts ............................................................ 1‐3
3‐1 I‐5 Noise Measurements .............................................................................................................. 3‐9
3‐2 SR 99 Corridor Noise Measurements ......................................................................................... 3‐13
3‐3 Summary of Vibration Propagation Test Sites ........................................................................... 3‐16
4‐1 FTA Noise Impact Criteria ............................................................................................................ 4‐3
4‐2 FHWA and WSDOT Noise Abatement Criteria (NAC) by Land Use Category .............................. 4‐5
4‐3 Washington State Noise Control Ordinance ................................................................................ 4‐7
4‐4 Washington State Exemptions for Short‐Term Noise Exceedances ............................................ 4‐7
4‐5 FTA Impact Thresholds for Groundborne Vibration, General Impact Assessment ................... 4‐11
4‐6 Interpretation of Vibration Criteria for Detailed Analysis ......................................................... 4‐12
4‐7 Groundborne Noise and Vibration Impact Criteria for Special Buildings .................................. 4‐13
5‐1 System‐wide Light Rail Operational and Maintenance Measures .............................................. 5‐1
5‐2 Light Rail Track‐type and Shielding Adjustments ........................................................................ 5‐5
5‐3 Preferred Alternative Park‐and‐Ride Analysis ............................................................................. 5‐6
5‐4 SR 99 Alternative Park‐and‐Ride Analysis .................................................................................... 5‐6
5‐5 SR 99 to I‐5 Alternative Park‐and‐Ride Analysis .......................................................................... 5‐7
5‐6 I‐5 to SR 99 Alternative Park‐and‐Ride Analysis .......................................................................... 5‐7
5‐7 LSTM Applied by Area ................................................................................................................ 5‐13
6‐1 Summary of Potential Moderate and Severe Noise Impacts from Light Rail .............................. 6‐1
6‐2 Summary of Projected Park‐and‐Ride and Station Noise Impacts .............................................. 6‐9
6‐3 Measured Versus Modeled Noise Levels ................................................................................... 6‐13
6‐4 Receivers where Existing Modeled Traffic Noise Levels Meet or Exceed the WSDOT NAC ...... 6‐14
6‐5 Receivers where No Build Modeled Traffic Noise Levels Meet or Exceed the WSDOT NAC .... 6‐15
6‐6 Summary of Traffic Noise Impacts with and without SR 509 Extension ................................... 6‐17
6‐7 Potential Vibration Impacts for Preferred Alternative .............................................................. 6‐22
6‐8 Preferred Alternative, Potential Vibration Impacts for Kent/Des Moines At‐Grade Station
Option and I‐5 Station Option.................................................................................................... 6‐23
6‐9 SR 99 Alternative, Potential Vibration Impacts for SR 99 Alternative ....................................... 6‐24
6‐10 Potential Vibration Impacts for S 216th East Station Option .................................................... 6‐24
6‐11 Potential Vibration Impacts for Kent/Des Moines HC Campus Station Option ........................ 6‐24
6‐12 Potential Vibration Impacts for Kent/Des Moines HC Campus Station Option from
S 216th West Station Options .................................................................................................... 6‐25
6‐13 Potential Vibration Impacts for S 260th West Station Option .................................................. 6‐25
6‐14 Potential Vibration Impacts for S 260th East Station Option .................................................... 6‐25
6‐15 Potential Vibration Impacts for S 272nd Redondo Trench Station Option ............................... 6‐25
6‐16 Potential Vibration Impacts for SR 99 to I‐5 Alternative ........................................................... 6‐26
6‐17 Potential Vibration Impacts for I‐5 to SR 99 Alternative ........................................................... 6‐27

Contents
Federal Way Link Extension vi Noise and Vibration Technical Report November 2016
6‐18 Potential Groundborne Noise Impacts for SR 99 Alternative and I‐5 to SR 99 Alternative ...... 6‐27
6‐19 Construction Equipment and Reference Noise Levels ............................................................... 6‐28
6‐20 Noise Levels for Typical Construction Phasesa .......................................................................... 6‐29
6‐21 Distance to Construction Vibration Impact Thresholds ............................................................. 6‐34
7‐1 Summary of Potential Noise Impacts and Mitigation Measures – Preferred Alternative and
Options ......................................................................................................................................... 7‐4
7‐2 Summary of Potential Noise Impacts and Mitigation Measures – SR 99 Alternative and
Options ......................................................................................................................................... 7‐4
7‐3 Summary of Potential Noise Impacts and Mitigation Measures – SR 99 to I‐5 Alternative ........ 7‐5
7‐4 Summary of Potential Noise Impacts and Mitigation Measures – I‐5 to SR 99 Alternative ........ 7‐6
7‐5 Summary of Potential Preferred Alternative Traffic Noise Impacts ............................................ 7‐7
7‐6 Summary of Light Rail Mitigation Modifications ......................................................................... 7‐8
7‐7 Summary of Vibration Impacts and Potential Mitigation for Preferred Alternative and
Options ....................................................................................................................................... 7‐14
7‐8 Summary of Vibration Impacts and Recommended Mitigation for SR 99 Alternative and
Options ....................................................................................................................................... 7‐15
7‐9 Summary of Vibration Impacts and Recommended Mitigation for SR 99 to I‐5 Alternative and
Options ....................................................................................................................................... 7‐15
7‐10 Summary of Vibration Impacts and Recommended Mitigation for I‐5 to SR 99 Alternative and
Options ....................................................................................................................................... 7‐16
Exhibits
2‐1 Comparison of Various Noise Levels ............................................................................................ 2‐2
2‐2 Examples of Typical Outdoor Noise Exposure ............................................................................. 2‐3
2‐3 Typical Vibration Levels ............................................................................................................... 2‐5
3‐1 Noise and Vibration Monitoring Locations (North) ..................................................................... 3‐7
3‐2 Noise and Vibration Monitoring Locations (South) ..................................................................... 3‐8
3‐3 Schematic of Surface Vibration Propagation Test Procedure ................................................... 3‐15
3‐4 Schematic of Borehole Vibration Propagation Test Procedure ................................................. 3‐16
4‐1 FTA Project Noise Impact Criteria ................................................................................................ 4‐2
4‐2 Increase in Cumulative Noise Exposure Allowed by FTA Criteria ................................................ 4‐3
4‐3 FTA Criteria for Detailed Vibration Assessment ........................................................................ 4‐11
6‐1 Example of Acoustical Shielding from Structure Parapet and a Retained Cut ............................ 6‐3
6‐2 Maximum Noise Level versus Distance for Typical Construction Phases .................................. 6‐30
6‐3 Pile‐driving Noise Level versus Distance .................................................................................... 6‐31

Federal Way Link Extension vii Noise and Vibration Technical Report November 2016
Acronyms and Abbreviations
ANSI American National Standards Institute
B&T ballast and tie
CFR Code of Federal Regulations
dB Decibel
dBA decibel with A‐weighting
DF direct‐fixation
EDNA Environmental Designation for Noise Abatement
EIS environmental impact statement
FAA Federal Aviation Administration
FDL force density level
ft foot, feet
FHWA Federal Highway Administration
FTA Federal Transit Administration
FWLE Federal Way Link Extension
GBN groundborne noise
HCDF high‐compliance direct‐fixation
HCT high‐capacity transit
HUD U.S. Department of Housing and Urban Development
Hz Hertz
I‐5 Interstate 5
in./sec inches per second
lb/in. pounds per inch
Ldn 24‐hour, time‐averaged, A‐weighted sound level (day‐night) with +10 dB
weighting added to nighttime noise (10 p.m. to 7 a.m.)
Leq equivalent continuous sound level
LIF “low‐impact” frog
Lmax or Lm maximum noise level

Acronyms and Abbreviations
Federal Way Link Extension viii Noise and Vibration Technical Report November 2016
LSTM line source transfer mobility
Lv train vibration velocity level
mph miles per hour
NAC Noise Abatement Criteria
NEPA National Environmental Policy Act
OWL one‐way low‐speed frog
PPV peak particle velocity
RBM rail‐bound manganese frog
RMS root mean square
ROD Record of Decision
Sound Transit Central Puget Sound Regional Transit Authority
SR State Route
SR 509 Extension I‐5 ‐ SR 509 Corridor Completion and Freight Improvement Project
ST2 Sound Transit 2
TDA tire‐derived aggregate
TNM FHWA’s Traffic Noise Model software
VdB vibration velocity decibels using a decibel reference of 1 micro‐inch per second
WAC Washington State Administrative Code
WSDOT Washington State Department of Transportation

Federal Way Link Extension 1-1 Noise and Vibration Technical Report November 2016
1.0 Introduction and Summary
This technical report presents a noise and vibration impact study for the Federal Way Link Extension
(FWLE) proposed by the Central Puget Sound Regional Transit Authority (Sound Transit). The objective
of the study is to assess the potential noise and vibration impacts of the planned light rail transit
project. Section 1 of this report describes the background and results of this assessment. Section 2
discusses environmental noise and vibration basics, and Section 3 describes the existing noise
conditions and noise and vibration measurement results. The criteria and methods used to assess noise
and vibration impacts are presented in Sections 4 and 5, respectively. Section 6 summarizes the noise
and vibration impact assessment results, and Section 7 outlines potential mitigation measures.
Appendix A includes detailed photos of the noise monitoring locations, Appendix B provides detailed
noise impact assessment data, and Appendix C presents noise and vibration impact maps for each
alternative. The vibration propagation test sites are described in Appendix D, and more details of the
vibration test results are presented in Appendix E. The detailed vibration predictions for each sensitive
receiver are provided in Appendix F.
1.1 Summary of Transit Noise Impacts and Potential Mitigation The transit noise analysis evaluated noise impacts from light rail operations for approximately 3,100
properties along the Interstate 5 (I‐5) corridor and over 5,000 noise‐sensitive properties along the
State Route (SR) 99 corridor. Noise analysis was performed using the Federal Transit Administration
(FTA) criteria for all project elements, namely: light rail noise including bells and horns, transit stations,
park‐and‐rides, and other ancillary facilities. In addition, noise analyses based on applicable local noise‐
control ordinances were performed for transit stations, park‐and‐rides, and other ancillary facilities.
The impacts from transit operations are summarized below along with the currently proposed
mitigation measures. During final design, all impacts and potential mitigation measures would be
reevaluated to verify impacts and inform the mitigation design. Mitigation measures may be revised or
eliminated during final design, which will reflect any changes in the alignment design prior to
construction.
The Preferred Alternative would have the lowest number of light rail noise impacts because noise‐
sensitive properties are generally only found on one side of the alignment. There would be greater
light rail noise impacts for alternatives along SR 99 due to the close proximity of the light rail
improvements to multi‐family residences and motels with large numbers of units on both sides of the
alignment. Table 1‐1 summarizes the number of moderate and severe light rail noise impacts by
alternative before and after mitigation. Note that for the noise impacts before mitigation, the number
in parentheses represents the range of impacts with design options for each alternative.

1.0 Introduction and Summary
Federal Way Link Extension 1-2 Noise and Vibration Technical Report November 2016
TABLE 1-1 Summary of Light Rail Noise Impacts
Alternative
Moderate Noise Impacts (Range with Options)
Severe Noise Impacts (Range with Options)
Park-and-Ride Impacts
(Range with Options)
Before Mitigation After
Mitigation Before Mitigation After
Mitigation Before
Mitigation After Mitigation
Preferred 528 (495 – 735) 0 119 (119 – 137) 0 1 (0-1) 0
SR 99 1,463 (674 – 1,525) 0 803 (293 – 987) 0 8 (0-8) 0
SR 99 to I-5 902 (751 – 990) 0 298 (248 – 315) 0 0 0
I-5 to SR 99 1,084 (933 – 1,084) 0 776 (431 – 844) 0 8 (0-8) 0
All noise impacts could be mitigated. Potential mitigation measures could include constructing sound
walls (sound barriers on the light rail guideway and/or freestanding walls), installing special track work
to reduce crossover noise levels, and insulating residential buildings where walls would not be
sufficient to fully mitigate impacts.
Under the Preferred Alternative, there was only one station‐related noise impact identified, which
would be near the Kent/Des Moines Station. There would be no other potential noise impacts at
stations or other ancillary facilities under the Preferred Alternative. Under the SR 99 Alternative, eight
noise impacts were identified with the Kent/Des Moines SR 99 West Station, the Kent/Des Moines
SR 99 Median Station Option, and the Kent/Des Moines SR 99 East Station Option. There would be no
other station or ancillary noise impacts under the SR 99 Alternative. The Kent/Des Moines 30th Avenue
West Station for the I‐5 to SR 99 Alternative would also have eight station noise impacts. All noise
impacts at stations could be mitigated with sound walls and station design.
1.2 Summary of Traffic Noise Impacts and Potential Mitigation Traffic noise levels were evaluated in areas where new project‐related roadways would be
constructed, or where existing roadways would be substantially realigned as part of this project.
Following FTA regulations, FHWA and WSDOT methodology was used to predict traffic noise levels in
these areas. For areas along the future SR 509 and I‐5 where project construction would result in
relocation of sound walls or removal of acoustical shielding (e.g., buildings or topography), the
predicted noise levels were used to identify new traffic noise impacts and locations where the project
results in an increased severity of existing traffic noise impacts. This methodology provides a complete
analysis of project related traffic noise, and identifies locations considered for noise mitigation. The
potential to create or increase exposure to traffic noise was evaluated in the Draft Environmental
Impact Statement (EIS). The Final EIS includes additional modeling of traffic noise for the Preferred
Alternative because of its proximity to existing and planned highway facilities. Table 1‐2 provides a
summary of project‐related traffic noise impacts under the Preferred Alternative without and with the
SR 509 extension. Traffic noise impacts due to the FWLE with the SR 509 extension also include all the
noise abatement measures (sound walls) recommended in the 2003 Final EIS.

1.0 Introduction and Summary
Federal Way Link Extension 1-3 Noise and Vibration Technical Report November 2016
TABLE 1-2 Summary of Traffic Noise Impacts under the Preferred Alternative
Study Area Number of Units
Modeled FWLE Traffic Noise
Impacts without SR 509a FWLE Traffic Noise
Impacts with SR 509b
S 212th Street to Kent-Des Moines Road 340 181 2
Kent/Des Moines Station 281 1 1
S 272nd Star Lake Station 27 5 5
Military Road to S 288th Street 54 16 16
S 288th Street to S 298th Street 244 59 55
Total 946 262 79
a Based on peak-hour modeled noise levels for the FWLE without any SR 509 Extension improvements. b Based on peak-hour modeled noise levels for the FWLE with the SR 509 Extension improvements, including proposed noise abatement in the 2003 FEIS.
Mitigation for traffic noise includes installing sound walls between the roadway or highway and the
affected structures. In most cases where traffic noise mitigation is necessary, the same sound wall
recommended for light rail noise mitigation can also be used or modified to mitigate noise from traffic.
Details on the mitigation measures are provided in Chapter 7.
1.3 Summary of Vibration Impacts and Potential Mitigation The vibration and groundborne noise impact assessment was based on vibration propagation tests
performed at 20 test sites in the study area and the characteristics of the existing Sound Transit trains
operating in the Central Link corridor.
Table 1‐3 shows the predicted impacts for each alternative and a range of impacts when options are
considered. Unlike noise, vibration impacts only occur at structures located within approximately
50 feet (ft) of the alignment. Therefore, alternatives that include at least part of the alignment along
the I‐5 corridor (including the Preferred Alternative) would have a greater number of potential
vibration impacts due to the proximity of the alignment to residences, while the SR 99 Alternative
would have the fewest potential impacts due to the location in the median of SR 99, which would be
farther from sensitive receptors and result in lower vibration levels.
TABLE 1-3 Summary of Vibration and Groundborne Noise Impacts
Alternative
Vibration Impacts (Range with Options) Groundborne Noise
Before Mitigation After Mitigation Before Mitigation After Mitigation
Preferreda 193 (185 – 193) 4 (4-4)b 0 0
SR 99 50 (0 – 271) 0 1 0
SR 99 to I-5 209 (159 – 225) 0 0 0
I-5 to SR 99 45 (45 – 228) 0 1 0
a After identification of the Preferred Alternative, analysis for I-5 was refined for the Final EIS. Results for other alternatives have not been revised since the Draft EIS other than to account for changes in displacements based on current uses of properties. b See Section 7.2.2.1 for additional information on mitigation options.

1.0 Introduction and Summary
Federal Way Link Extension 1-4 Noise and Vibration Technical Report November 2016
Because most of the track would be at‐grade or elevated, where airborne train noise would dominate,
the FTA groundborne noise impact criteria were not applied for the majority of receivers. However,
groundborne noise impact criteria are applied to special buildings as defined in the FTA Guidance
Manual (FTA, 2006). A groundborne noise impact is predicted at the Performing Arts Center at Federal
Way High School for the SR 99 and I‐5 to SR 99 alternatives. This impact is a result of the proximity of
the alignment to the building.
Mitigation for vibration/ groundborne noise impacts could include resilient fasteners, ballast mats, tire‐
derived aggregate, and low‐impact special track work.

Federal Way Link Extension 2-1 Noise and Vibration Technical Report November 2016
2.0 Environmental Noise and Vibration Basics
2.1 Noise Fundamentals and Descriptors What humans perceive as sound is a series of continuous air pressure fluctuations superimposed on
the atmospheric pressure that surrounds us. The amplitude of fluctuation is related to the energy
carried in a sound wave; the greater the amplitude, the greater the energy, and the louder the sound.
The full range of sound pressures encountered in the world is so great that it is more convenient to
compress the range by using a logarithmic scale, resulting in the fundamental descriptor used in
acoustics—the sound pressure level, which is measured in decibels (dB). When sounds are unpleasant,
unwanted, or disturbingly loud, we tend to classify them as noise.
Another aspect of sound is the quality described as its pitch. Pitch of a sound is established by the
frequency, which is a measure of how rapidly a sound wave fluctuates. The unit of measurement is
cycles per second, called hertz (Hz). When a sound is analyzed, its energy content at individual
frequencies is displayed over the frequency range of interest, usually the range of human audibility
from 20 Hz to 20,000 Hz. This display is called a frequency spectrum.
Sound is measured using a sound‐level meter with a microphone designed to respond accurately to all
audible frequencies. However, the human hearing system does not respond equally to all frequencies.
Low‐frequency sounds below about 400 Hz are progressively and severely attenuated, as are high
frequencies above 10,000 Hz. To approximate the way humans interpret sound, a filter circuit with
frequency characteristics similar to the human hearing mechanism is built into sound‐level meters.
Measurements with this filter enacted are called A‐weighted sound levels, expressed in A‐weighted
decibels (dBA). Community noise is usually characterized in terms of the A‐weighted sound level.
The range of human hearing extends from about 0 dBA for young healthy ears (that have not been
exposed to loud noise sources) to about 140 dBA. When sounds exceed 110 dBA, there is a potential
for hearing damage, even with relatively short exposures. In quiet suburban areas far from major
freeways, the noise levels during the late night hours will drop to about 30 dBA. Outdoor noise levels
lower than this only occur in isolated areas where there is a minimum amount of natural noises, such
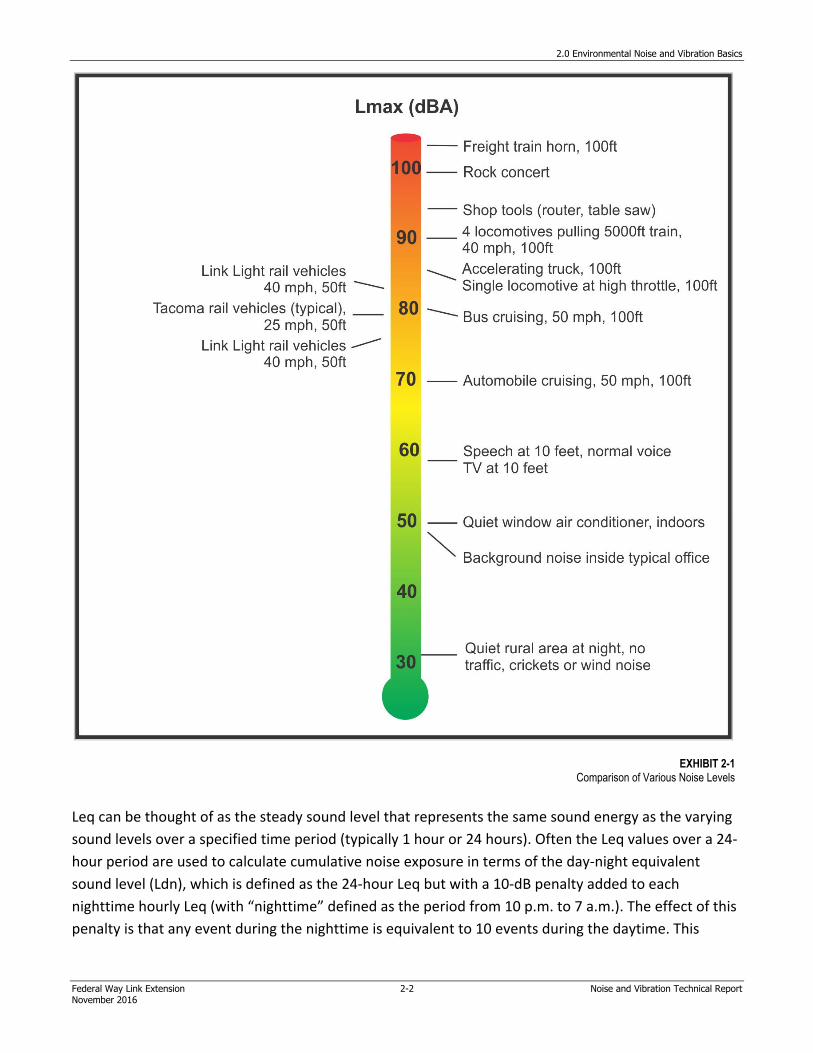
as leaves blowing in the wind, crickets, or flowing water. Exhibit 2‐1 shows a comparison of various
noise levels expressed as the maximum sound level (Lmax) in dBA.
Another characteristic of environmental noise is that it is constantly changing. The noise level increase
when a train passes is an example of a short‐term change. The lower average noise levels occur during
nighttime hours, when activities are at a minimum, and higher noise levels during daytime hours are
caused by daily patterns of noise‐level fluctuation. The instantaneous A‐weighted sound level is
insufficient to describe the overall acoustic “environment.” Thus, it is common practice to condense
the fluctuating noise levels into a single number, called the “equivalent” sound level (Leq).
2.0 Environmental Noise and Vibration Basics
Federal Way Link Extension 2-2 Noise and Vibration Technical Report November 2016
Leq can be thought of as the steady sound level that represents the same sound energy as the varying
sound levels over a specified time period (typically 1 hour or 24 hours). Often the Leq values over a 24‐
hour period are used to calculate cumulative noise exposure in terms of the day‐night equivalent
sound level (Ldn), which is defined as the 24‐hour Leq but with a 10‐dB penalty added to each
nighttime hourly Leq (with “nighttime” defined as the period from 10 p.m. to 7 a.m.). The effect of this
penalty is that any event during the nighttime is equivalent to 10 events during the daytime. This
EXHIBIT 2-1Comparison of Various Noise Levels

2.0 Environmental Noise and Vibration Basics
Federal Way Link Extension 2-3 Noise and Vibration Technical Report November 2016
strongly weights Ldn toward nighttime noise to reflect most people being more easily annoyed by
noise at night, when background noise is lower and most people are resting.
Environmental impact assessments for mass transit projects in the United States typically use Ldn to
describe the community noise environment at residential locations. Studies of community response to
a wide variety of noises indicate that Ldn is a good measure of the noise environment. Exhibit 2‐2
defines typical community noise levels in terms of Ldn. Most urban and suburban neighborhoods are
usually in the range of an Ldn of 50 dBA to 70 dBA. An Ldn of 70 dBA is a relatively noisy environment
that might be found at buildings on a busy surface street, close to a freeway, or near a busy airport,
and would usually be considered unacceptable for residential land use without special measures taken
to enhance outdoor‐indoor sound insulation. Residential neighborhoods that are not near major sound
sources are usually in the range of Ldn 55 dBA to 60 dBA. If there is a freeway or moderately busy
arterial nearby, or any nighttime noise, Ldn is usually in the range of 60 to 65 dBA.
Ldn is the designated noise metric of choice for many federal agencies, including the Department of
Housing and Urban Development (HUD), Federal Aviation Administration (FAA), FTA, and U.S.
Environmental Protection Agency. Most federal and state agency criteria for noise impacts are based
on some measurement of noise energy. For example, the FAA and HUD use Ldn, and the Federal
Highway Administration (FHWA) uses peak‐hour Leq. The noise impact criteria applicable to residential
areas, and included in the 2006 FTA Transit Noise and Vibration Impact Assessment (FTA Guidance
Manual) (FTA, 2006), use both Leq and Ldn to characterize community noise.
2.2 Vibration Fundamentals and Descriptors One potential community impact from the FWLE is vibration that is transmitted from the tracks
through the ground to adjacent buildings. This is referred to as groundborne vibration. When
evaluating human response, groundborne vibration is expressed in terms of decibels using the root
EXHIBIT 2-2Examples of Typical Outdoor Noise Exposure

2.0 Environmental Noise and Vibration Basics
Federal Way Link Extension 2-4 Noise and Vibration Technical Report November 2016
mean square (RMS) vibration velocity. RMS is defined as the square root of the average of the squared
amplitude of the vibration signal. To avoid confusion with sound decibels, the abbreviation VdB is used
for vibration decibels. All vibration decibels in this report use a decibel reference of 1 micro‐inch per
second.
The potential impacts of rail transit groundborne vibration are as follows:
Perceptible building vibration: The vibration of the floor or other building surfaces that the
occupants feel. Experience shows that the threshold of human perception is around 65 VdB and
that vibration that exceeds 75 to 80 VdB is perceived as intrusive and annoying to occupants.
Rattle: The building vibration can cause rattling of items on shelves and hangings on walls, and
various rattle and buzzing noises from windows and doors.
Reradiated noise: The vibration of room surfaces radiates sound waves that are audible to humans
(groundborne noise). Groundborne noise sounds like a low‐frequency rumble. Usually, for a surface
rail system such as the light rail train, the groundborne noise is masked by the normal airborne
noise radiated from the transit vehicle and the rails.
Damage to building structures: Although it is conceivable that vibration from a light rail system can
damage fragile buildings, the vibration from rail transit systems is one to two orders of magnitude
below the most restrictive thresholds for preventing building damage. Hence the vibration impact
criteria focus on human annoyance, which occurs at much lower amplitudes than does building
damage.
Vibration is an oscillatory motion that is described in terms of the displacement, velocity, or
acceleration of the motion. The response of humans to vibration is very complex. However, the general
consensus is that for the vibration frequencies generated by light rail trains, human response is best
approximated by the vibration velocity level. Therefore, this study uses vibration velocity to describe
light rail‐generated vibration levels.
Exhibit 2‐3 shows typical vibration levels from rail and non‐rail sources as well as the human and
structural response to such levels.
Although there is relatively little research into human and building response to groundborne vibration,
there is substantial experience with vibration from rail systems. In general, the collective experience
indicates that:
It is rare that groundborne vibration from transit systems results in building damage (even minor
cosmetic damage). Therefore, the primary consideration is whether or not the vibration is intrusive
to building occupants or interferes with interior activities or machinery.

2.0 Environmental Noise and Vibration Basics
Federal Way Link Extension 2-5 Noise and Vibration Technical Report November 2016
The threshold for human perception is approximately 65 VdB. Vibration levels in the range of 70 to
75 VdB often are noticeable but acceptable. Beyond 80 VdB, vibration levels are considered
unacceptable.
For human annoyance, there is a relationship between the number of daily events and the degree
of annoyance caused by groundborne vibration. The FTA Guidance Manual includes an 8‐VdB
higher impact threshold if there are fewer than 30 events per day and a 3‐VdB higher threshold if
there are fewer than 70 events per day (FTA, 2006).
Often it is necessary to determine the contribution at different frequencies when evaluating vibration
or noise signals. The 1/3‐octave band spectrum is the most common procedure used to evaluate
frequency components of acoustic signals. The term octave is borrowed from music, where it refers to
a span of eight notes. The ratio of the highest frequency to the lowest frequency in an octave is 2:1.
For a 1/3‐octave band spectrum, each octave is divided into three bands, where the ratio of the lowest
frequency to the highest frequency in each 1/3‐octave band is 21/3:1 (1.26:1). An octave consists of
three 1/3 octaves. The 1/3‐octave band spectrum of a signal is obtained by passing the signal through a
bank of filters. Each filter excludes all components except those that are between the upper and lower
range of one 1/3‐octave band (FTA, 2006).
Source: FTA, 2006.
EXHIBIT 2-3Typical Vibration Levels

This page intentionally left blank.

Federal Way Link Extension 3-1 Noise and Vibration Technical Report November 2016
3.0 Affected Environment
Sound Transit examined the FWLE corridor to identify noise‐ and vibration‐sensitive locations and to
select locations where noise monitoring and vibration testing would be performed. The potential area
of effect for the noise study was determined by modeling the worst‐case operational noise levels and
including all noise‐sensitive properties that have a potential for a noise impact. The potential area of
effect for the vibration study was the same as that used for the noise study, for consistency.
The following sections describe the land use along the FWLE corridor, the existing noise‐level
measurements, and the current noise sources in the corridor. While a more detailed presentation of
land use can be found in Section 4.2, Land Use, in Chapter 4 of the FWLE Final EIS, the following land
uses are summarized for their potential sensitivity to noise and vibration. Most identified sensitive land
uses are sensitive to both noise and vibration. The exceptions include outdoor parks, which may be
noise‐sensitive, depending on usage, but are not vibration sensitive, and vibration‐sensitive equipment
(such as an MRI), which is not sensitive to airborne noise.
3.1 Noise and Vibration Sensitive Receivers This section provides an overview of the land uses and noise‐ and vibration‐sensitive receivers along
the two primary corridors being evaluated for FWLE alternatives—the I‐5 corridor and SR 99 corridor.
As discussed in Sections 4.1.1, Transit Noise Impact Criteria; 4.1.2, Traffic Noise Impact Criteria; and
4.2.1, Transit Vibration and Groundborne Noise Criteria, noise and vibration impacts under the FTA
criteria (FTA, 2006) are based on land use type. Details on the FTA land use type categories are
provided in Section 4, Noise and Vibration Impact Criteria.
3.1.1 I-5 Corridor There are approximately 3,100 noise‐sensitive receivers along the I‐5 corridor. Most of these are multi‐
family residential complexes located near the north and south ends of the corridor, while the central
part of the corridor is primarily single‐family residential.
3.1.1.1 200th Street to Kent-Des Moines Road Alternatives that travel in the I‐5 corridor would travel within the SR 99 corridor from the north end of
the FWLE at the Angle Lake Station to S 208th Street. In general, from S 211th Street to S 317th Street,
the alignment would run along the west side of the I‐5 right‐of‐way owned by the Washington State
Department of Transportation (WSDOT), and all of the area between the alignment and I‐5 would
remain public right‐of‐way for transportation uses. South of S 208th Street, there are several vacant
properties that have been purchased by WSDOT as future right‐of‐way for the I‐5 ‐ SR 509 Corridor
Completion and Freight Improvement Project (SR 509 Extension). Some single‐family residences
remain in this area, as well as a group of four‐plexes in the Legacy Place apartment complex and other
multi‐family homes.
Between I‐5 and SR 99, land uses are primarily residential, with a Best Western Hotel and commercial
uses along SR 99. Residential uses become denser between S 211th Street and S 221st Street. Just

3.0 Affected Environment
Federal Way Link Extension 3-2 Noise and Vibration Technical Report November 2016
north of S 216th Street are the Highline Water District water tanks and towers, one of which would be
relocated on the site for the Preferred Alternative and the I‐5 to SR 99 Alternative. Beginning at S 216th
Street, multi‐family homes predominate, and a 64‐unit apartment complex and Pine Terrace mobile
home park are south of S 219th Street. Midway Park and an electrical power substation are to the west
of the corridor at S 221st Street. There are some single‐family homes south of the substation between
I‐5 and SR 99, but multi‐family dwellings predominate all the way south to Kent‐Des Moines Road. The
Kings Arms Motel and a few more single‐family homes are located at the end of the I‐5 southbound
off‐ramp that exits onto Kent‐Des Moines Road.
3.1.1.2 Kent-Des Moines Road to S 272nd Immediately south of Kent‐Des Moines Road, the New Best Inn Motel is located along 30th Avenue S,
and to the south of the motel are several parcels owned by the Park of the Pines conference center. To
the west of I‐5 are a mobile home park, some small businesses, Highline Water District and Midway
Sewer District administrative buildings, and some apartment buildings. There is a large neighborhood
of virtually all single‐family homes to the west of I‐5 from S 252nd Street to S 260th Street. Situated
between S 260th Street and S 272nd Street are the 240‐unit Pembrooke apartment complex, a large
area of undeveloped land that is the McSorley Creek wetland complex, a King County road
maintenance facility (a commercial use), a newer development of single‐family homes, and the Star
Lake Park‐and‐Ride.
3.1.1.3 S 272nd to Federal Way Transit Center South of S 272nd Street, across from the Star Lake Park‐and‐Ride, are a condominium and apartment
complex and the Mark Twain Elementary School. Between the school and Military Road S are a
neighborhood of single‐family homes, a few vacant lots, and the Star Lake Church of God. Between
Military Road and S 288th Street is another group of single‐family residences. The Korean Methodist
Church is located at the intersection of S 288th Street and 30th Avenue S. There is a very large mobile
home park (Camelot Square) that occupies several parcels south of S 288th Street, and south of that
park is a relatively new single‐family residential development. The Church of Christ at Federal Way is
located on Military Road S, at 301st Street. To the north of the church is the Steel Lake Grange and
some single‐family residences. To the west of the church are single‐family residences, and there are
single‐family residences all the way to S 304th Street as well.
The Faith Community Church is located on 28th Avenue S at S 308th Lane near S 309th Street. There
are single‐family residences and several empty lots between S 304th Street and the church. South of
the church are more single‐family residences and a commercial use. South of S 312th Street, there are
three multi‐family complexes, one single‐family residence, and Truman High School. Alternatives along
I‐5 would exit the WSDOT right‐of‐way at S 317th Street. To the south of S 317th Street is the Hampton
Inn and Suites and the Courtyard Federal Way Hotel. The Pacific Medical Center Federal Way south of S
317th Street and the UW Medical Clinic south of S 320th Street are also potentially sensitive to
vibration. Except for the Calvary Lutheran Church located at S 320th Street and 25th Avenue S, the
other uses to the south are commercial. To the north of the alignment are several multi‐family

3.0 Affected Environment
Federal Way Link Extension 3-3 Noise and Vibration Technical Report November 2016
apartment and condominium complexes. Just north of the Federal Way Transit Center is the Senior City
apartment building.
3.1.2 SR 99 Corridor Over 5,000 noise‐sensitive receivers were identified in the SR 99 corridor. Most receivers directly
adjacent to the corridor are multi‐family residential complexes and motels, with some single‐family
residences located farther away.
3.1.2.1 200th to Kent-Des Moines Road The FWLE would begin at the Angle Lake Station at the southern end of the S 200th Street Extension
(Seattle‐Tacoma International Airport [Sea‐Tac Airport] to S 200th Street), just west of SR 99. On the
west side of SR 99, there is a Best Western Hotel at S 208th Street, a residential pocket to the west and
south of the hotel, and then only commercial uses all the way to S 216th Street. From S 216th Street to
Kent‐Des Moines Road, commercial uses are dominant directly on SR 99, with residential uses directly
behind. From S 216th Street to S 222nd Street, there are single‐family homes, a few empty lots zoned
for residential use, and the Majestic Bay Condominium complex. South of S 222nd Street and north of
S 226th Street, there are mostly multi‐family uses, including the Marina Club Apartments, the Seawind
condominiums, the Sea Fox Apartments, the Bay Club Apartments, and the MistyWood Apartments, as
well as the Citadel Church and the Open Door Baptist Church. Both churches are on SR 99 at S 224th
Street. Between S 226th Street and Kent‐Des Moines Road, there are many single‐family homes,
almost all of which are shielded from SR 99 by apartment and condominium buildings.
On the east side of SR 99, there is the Sleep Inn Hotel, the Firs Mobile Home Park, America’s Best Value
Inn, and some commercial uses north of S 208th Street. The Willow Lake Apartments are located
behind those commercial uses. South of S 208th Street are numerous single‐family homes. Along SR 99
are the Falcon Ridge assisted living facility, the Viewpoint Apartments, the Jesus Christ Salt and Light
Church, and the New West Hotel. There are numerous multi‐family buildings from S 216th Street to
S 224th Street that constitute hundreds of residential units. Pine Terrace, a mobile home park that
consists of five parcels, is just south of S 216th Street. The Legend Motel, the Value Inn Motel, and the
Stafford Care assisted living facility are located along SR 99 just north of S 224th Street. Similar land use
continues from S 224th Street to Kent‐Des Moines Road, with commercial uses along SR 99 and single‐
family homes and many multi‐family dwellings located directly east of those commercial uses. The
King’s Arms Motel is located at the intersection of 30th Avenue S and Kent‐Des Moines Road.
3.1.2.2 Kent-Des Moines Road to S 272nd Street South of Kent‐Des Moines Road and north of S 248th Street there are mostly commercial uses along
SR 99, and smaller multi‐family buildings are present directly west of these commercial uses on the
west side of SR 99. These multi‐family residences are mostly two‐story, four‐plex buildings. The
Highline College campus is also in this area, and there is a 30‐unit apartment complex south of S 236th
Street, between the campus and SR 99. The Alaska Trailer Park is immediately to the south of the
campus, and there is a small condominium complex southwest of the park. In addition, there is a new
medical center and low‐income multi‐family housing (Sea Mar Community Health Center’s Des Moines
Medical and Dental Clinic and Des Moines Housing) at the intersection of SR 99 and S 242nd Street.

3.0 Affected Environment
Federal Way Link Extension 3-4 Noise and Vibration Technical Report November 2016
The Iolani Apartments are on SR 99 between S 244th and S 246th Streets, and there are numerous
empty lots behind commercial structures between S 244th and S 248th Streets that are zoned for
residential use.
Continuing along the west side of SR 99 south of S 248th Street, there is a condominium complex along
S 248th Street that is shielded from SR 99 by commercial uses. The other land uses behind the
commercial properties (commonly called second line receivers) are single‐family homes that occupy
neighborhoods all the way south to S 260th Street. Beginning at S 252nd Street, there are undeveloped
parcels along SR 99, all of which are zoned for commercial use. The Saddle Brook apartment complex is
located at S 260th Street, and it includes a green space crossed by McSorley Creek.
There are mostly commercial uses along the east side of SR 99 between Kent‐Des Moines Road and
S 240th Street. Behind these uses are the New Best Inn Motel, four mobile home parks, the Park of the
Pines conference center, and some multi‐family buildings. From S 240th Street to S 252nd Street is the
Midway Mobile Mansions mobile home park, some industrial and commercial uses and undeveloped
parcels zoned for commercial use, the Midway Landfill (closed), and the Sunset and Crossland Motels.
From S 252nd Street to S 260th Street, there are mostly commercial uses and the West Hill Mobile
Manor mobile home park along SR 99. To the east of these are single‐family homes, the Buena Casa
Apartment Complex, and the Cottonwood Apartment Community. Between S 260th Street and
S 272nd Street, there are some commercial uses, several single‐family homes, and several lots zoned
for residential use.
Just south of S 260th Street on the west side of SR 99, there is a lone single‐family home and two
undeveloped parcels, one of which is owned by a sewer district and the other is zoned for residential
use. The Travel Inn Motel is on SR 99 approximately 800 ft south of the S 260th Street intersection.
West of the motel, between S 261st Place and S 263rd Place, there are three large parcels that have
been subdivided and are in the process of being developed into single‐family homes. Immediately west
and south of the motel, between the new subdivision and SR 99, there are three other undeveloped
parcels, two of which are owned by the City of Des Moines and the third is owned by the subdivision
developer; all three are zoned for single‐family use. Farther south along SR 99 is a vacant church, a
single‐family home, undeveloped commercial lots, and an undeveloped residential lot. Single‐family
homes are located west of all of the undeveloped lots between S 260th Street and S 268th Street.
South of 268th Street on the west side of the SR 99 intersection is the Woodmont Library. The
Seacoma Mobile Home and RV Park is located to the west of the library. There are only commercial
uses between these noise‐sensitive uses and S 272nd Street.
The UW Neighborhood Kent/Des Moines Clinic, south of Kent‐Des Moines Road, the Sea Mar
Community Health Center Des Moines, south of S 242nd Street, and the Healthpoint Midway Clinic,
south of S 263rd Street, are also potentially sensitive to vibration.
3.1.2.3 S 272nd to Federal Way Transit Center The Crestwood Senior Mobile Home Park, which is south of S 272nd Street, is partially shielded from
SR 99 by some commercial structures. Farther south, there are only commercial uses directly along

3.0 Affected Environment
Federal Way Link Extension 3-5 Noise and Vibration Technical Report November 2016
SR 99 until just north of S 279th Street. To the west and south of these commercial uses is a
neighborhood of single‐family homes. This neighborhood continues just past S 279th Street, at which
point there is a sizable undeveloped parcel and five smaller parcels along SR 99. All of these properties
are zoned for residential use. From S 284th Street to Dash Point Road there are numerous multi‐family
homes along SR 99, along with some low‐density commercial uses, a place of worship (the Rissho Kosei
Kai of Seattle), and undeveloped lands. The Church of Christ is located at the intersection of S 288th
Street. To the west of these front‐line uses there are single‐family homes and smaller multi‐family
structures.
On the east side of SR 99 between S 272nd Street and S 288th Street there are mostly multi‐family
buildings and some commercial uses. There are some commercial uses and the Redondo Heights Park‐
and‐Ride along SR 99, just south of S 272nd Street. Behind these commercial uses and to the south of
the park‐and‐ride there are mostly large multi‐family complexes. Between S 283rd Street and S 288th
Street, the multi‐family uses become denser, and there are several more large multi‐family complexes
in this area. The Federal Way Kindercare is located at the intersection of S 288th Street and
18th Avenue S.
On the west side of SR 99 south of S 288th Street, there are single‐family homes behind The Church of
Christ and the commercial uses that line SR 99. These homes continue all the way south to Dash Point
Road. There are two empty lots zoned for multi‐family residential use near Redondo Way S. There are
also several other empty lots similarly zoned on either side of The View at Redondo apartment
complex on SR 99 north of Dash Point Road. The Federal Way Motel is on SR 99 just south of Dash
Point Road, and behind the hotel is Sacajawea Middle School and Park, which includes several athletic
fields. South of the school are single‐family homes that are separated from SR 99 by several
undeveloped parcels zoned for commercial use. These homes continue to just north of S 304th Street.
Federal Way High School is located between S 304th Street and S 308th Street and has a new
performing arts center located close to SR 99. There is an apartment building on the southwest corner
of the intersection of SR 99 and S 308th Street. Behind the apartment building is a hair salon, a duplex,
and a 12‐unit apartment building that has west‐facing balconies. Other than the apartment building,
there are only commercial uses along SR 99 all the way down to S 312th Street. Behind the commercial
buildings are the Bellridge Townhomes, the Southridge House apartment building, and the Emeritus
senior care facility.
On the east side of SR 99 south of S 288th Street, there is an apartment building and a condominium
complex that is partially shielded from SR 99 by a strip mall. Behind these uses and farther south are
numerous single‐family homes and some duplexes. South of S 293rd Street, the land use is similar, with
commercial uses lining SR 99, multi‐family homes to the east of the commercial uses, and single‐family
homes behind the multi‐family dwellings. Near Dash Point Road there is a multistory condominium
complex that faces SR 99. Between the intersection of SR 99 and 18th Avenue S and S 304th Street is
the Lamb’s Gate Church, Smart Start Day Care, and a large undeveloped parcel. The area between
S 304th Street and S 308th Street is filled almost exclusively with multi‐family buildings and a few
commercial uses along SR 99. From S 308th Street to S 312th Street, there are mostly commercial uses,

3.0 Affected Environment
Federal Way Link Extension 3-6 Noise and Vibration Technical Report November 2016
with multi‐family homes to the east of those commercial uses. South of S 312th Street is a mix of
commercial uses. Some of the commercial buildings in this area are currently vacant. Other uses in this
area include the Federal Way Running Start Home School, the Clarion Hotel, and the Comfort Inn hotel.
3.2 Noise Measurements Sound Transit characterized the existing noise environment through onsite inspections and onsite
noise monitoring. Monitoring was performed at 97 locations, including 58 long‐term (24‐hour or
longer) sites and 39 short‐term (15‐minute) sites. Exhibits 3‐1 and 3‐2 show the FWLE alternatives,
noise monitoring locations, and vibration testing locations. Results of the existing conditions traffic
noise modeling can be found in Section 6.2.2.2 of this report.
Sound Transit selected monitoring sites based on land use, existing noise sources, light rail alternative
proximity and profile type, the site’s ability to represent nearby noise‐sensitive land uses, and access
allowed by the property owner (when not in public right‐of‐way). Several monitoring locations were
used for more than one of the FWLE alternatives. Long‐term noise monitoring was primarily used to
establish the existing 24‐hour Ldn along the corridor and to support the traffic noise analysis. Short‐
term monitoring was performed at locations where long‐term monitoring was not practical, to
supplement nearby long‐term monitoring sites, and to support the traffic noise analysis. Sound Transit
also performed traffic counts at most of these sites, which are used in the traffic noise analysis.
All noise measurements were taken in accordance with the American National Standards Institute
(ANSI) procedures for community noise measurements and guidelines provided in the FTA Guidance
Manual. Measurement locations were at least 5 ft from any solid structure to minimize acoustical
reflections and at a height of 5 ft off the ground as recommended by FTA and ANSI standards. The
noise measurements and accompanying traffic counts were also taken in accordance with FHWA and
WSDOT standards to ensure their suitability for relevant analyses. The traffic counts are used to
validate the traffic noise models used in this analysis. The equipment used for noise monitoring
included Bruel & Kjaer Type 2238 sound‐level meters. The meters were calibrated before and after
measurement periods using a sound‐level calibrator. Complete system calibration is performed on an
annual basis by an accredited testing laboratory. The laboratory system calibration is traceable to the
National Institute of Standards and Technology. The systems meet or exceed the requirements for an
ANSI Type 1 noise measurement system.
For long‐term monitoring locations, the Ldn was calculated using logarithmic energy averaging for the
24‐hour data with a 10‐dBA penalty for noise measured between 10:00 p.m. and 7:00 a.m. For short‐
term monitoring locations, the projected Ldn levels were calculated using formulas in the FTA
Guidance Manual and comparison with other nearby long‐term noise monitoring sites.
The following sections describe the existing noise environment by FWLE alternative.

V-1
V-2
V-3
V-4
V-5
V-18
V-13
V-17
V-19
M-38
M-31
M-33
M-32
M-34
M-35M-36
M-37
M-39M-40 East
M-41
M-42
M-105
M-44
M-45M-46
M-63M-64
M-65
M-66West
M-1M-2
M-3
M-4
M-5
M-6
M-7 East
M-7 West
M-8M-9
M-10M-10A
M-11
M-12
M-13
M-40 West
M-66East
M-104
M-106
M-107B
M-100
M-101
M-102
M-107A
M-103
HighlineCollege
Angle Lake Station
MidwayLandfill
±
LegendPreferred Alternative
ElevatedAt-Grade
! ! ! TrenchÕS StationOther Alternatives
ElevatedAt-Grade
! ! ! TrenchÕS Station
City BoundaryStreetStreamWaterbody
!?Long-Term NoiseMonitoring Location
!?Short-Term NoiseMonitoring Location
!?VibrationMonitoring Location
0 0.5 10.25 Miles
7/1/2016 | G: ..\FWLE_Ph2_220013\DEIS\C4-Noise\.. FEIS_Ex_3-1-2_Noise_Monitoring_Locations.mxd
Data Sources: King County, Cities of Des Moines, Federal Way, Kent, SeaTac (2015).
!
!
!
!
!
!
!
!
!
!
!
Kent
Tacoma
SeaTacRenton
Seattle
Lakewood
Puyallup
Bellevue
Des Moines
Federal Way
§̈¦5
§̈¦5
Federal Way Link Extension
EXHIBIT 3-1Noise and Vibration Monitoring Locations (North)

V-7
V-8
V-9
V-10
V-11
V-12
V-6
V-15
V-16
V-20
V-14
M-47
M-48
M-49 North
M-49 Central
M-50
M-51
M-52
M-53
M-54M-55
M-56
M-58M-57
M-59
M-61
M-62
M-67
M-68
M-69
M-15
M-16
M-17
M-19
M-22
M-23 North
M-23 South
M-25
M-27M-27A
M-28
M-29M-30
M-60
M-70
M-71
M-72
M-113
M-114
M-116
M-115
M-120M-121M-122
M-123
M-109
M-110
M-111M-112
M-117
M-108
M-119
M-118
±
LegendPreferred Alternative
ElevatedAt-Grade
! ! ! TrenchÕS StationOther Alternatives
ElevatedAt-Grade
! ! ! TrenchÕS Station
City BoundaryStreetStreamWaterbody
!?Long-Term NoiseMonitoring Location
!?Short-Term NoiseMonitoring Location
!?VibrationMonitoring Location
0 0.5 10.25 Miles
7/5/2016 | G: ..\FWLE_Ph2_220013\DEIS\C4-Noise\.. FEIS_Ex_3-1-2_Noise_Monitoring_Locations.mxd
Data Sources: King County, Cities of Des Moines, Federal Way, Kent, SeaTac (2015).
!
!
!
!
!
!
!
!
!
!
!
Kent
Tacoma
SeaTacRenton
Seattle
Lakewood
Puyallup
Bellevue
Des Moines
Federal Way
§̈¦5
§̈¦5
Federal Way Link Extension
EXHIBIT 3-2Noise and Vibration Monitoring Locations (South)

3.0 Affected Environment
Federal Way Link Extension 3-9 Noise and Vibration Technical Report November 2016
3.2.1 I-5 Corridor The analysis of the I‐5 corridor included 30 long‐term and 32 short‐term monitoring locations. Noise
levels along this corridor are dominated by traffic noise from I‐5 and major arterial roadways such as
Kent‐Des Moines Road, S 272nd Street, S 288th Street, and S 320th Street. Aircraft also contribute to
the noise environment in the northern part of the FWLE corridor. Front‐line receivers adjacent to I‐5
had measured Ldn noise levels ranging from 70 dBA to 79 dBA along the entire corridor (sites M‐5, M‐7
East, M‐12, M‐13, M‐17, M‐19, M‐23 North, M‐23 South, M‐27, M‐28, M‐29, and M‐71).
At the Camelot Square Mobile Home Park (M‐23 North), which has some acoustical shielding from a
6‐ft‐tall traffic barrier and an 8‐ to 12‐ft concrete sound wall, the Ldn was 71 dBA, which is at the lower
end of the range. For sites with a clear line of sight to the freeway, which include M‐7 East, M‐12, and
M‐28, the measured Ldn fell within a narrower range of 78 dBA to 79 dBA. Site M‐27, which also has a
clear line of sight to I‐5 but also has 250 ft of intervening soft ground, had an Ldn of 74 dBA. The Best
Western Plus Evergreen Inn & Suites (site M‐71) had an Ldn of 75 dBA, which is a slightly lower noise
level because it is farther away from the highway than the other front‐line receivers.
Peak‐hour measured Leq noise levels at the three front‐line churches and the King’s Arm Motel
represented by receivers M‐9, M‐10A, M‐22, and M‐25 ranged from 70 dBA to 74 dBA. The peak‐hour
Leq for the Mark Twain Elementary School was 64 dBA, with the lower noise level due in part to a berm
shielding the school from I‐5 traffic noise. Truman High School, which is located farther from I‐5, has a
peak‐hour Leq of 61 dBA. The outdoor uses at these schools are not as close to I‐5 as some of the other
measured sites, and in the case of Truman High School, it is shielded from the northbound lanes on I‐5
by a large retaining wall that supports the high‐occupancy vehicle ramps at S 317th Street.
The measured Ldn noise levels at second‐line homes in the north end of the I‐5 corridor ranged from
68 dBA to 72 dBA (sites M‐3, M‐4, M‐6, and M‐104). In the middle of the corridor, the second‐line
residential Ldn was 64 dBA to 66 dBA (sites M‐10, M‐15, and M‐116), and at the south end it was
68 dBA (site M‐60).
Table 3‐1 summarizes the noise monitoring results for the I‐5 corridor. The table includes the
monitoring location number, address, land use, and type of measurement, with an Ldn for FTA
Category 2 land uses (residences and buildings where people normally sleep) and a daytime Leq for all
other sites. The Leq’s were taken at different times throughout the day, with simultaneous traffic
counts used to verify traffic noise models.
TABLE 3-1 I-5 Noise Measurements
Monitoring Locationa Address Land Use Type
Type of Measurement
Leq
(Daytime-hour Leq in dBA)
Ldn
(24-hour Ldn in dBA)b
M-1 20406 Pacific Hwy S (Sleep Inn) Hotel Short Term 65.6 63.6
M-2 20440 Int'l Blvd (The Firs Mobile Home Park) Multi-family Long Term 71.4
M-3 3002 S 208th St (Willow Lake Apartments) Single-family Long Term 68.8
M-4 WSDOT right-of-way near 3120 S 211th St Single-family Long Term 68.2
M-5 WSDOT ROW near 21211 32nd Ave S Single-family Long Term 71.6

3.0 Affected Environment
Federal Way Link Extension 3-10 Noise and Vibration Technical Report November 2016
TABLE 3-1 I-5 Noise Measurements
Monitoring Locationa Address Land Use Type
Type of Measurement
Leq
(Daytime-hour Leq in dBA)
Ldn
(24-hour Ldn in dBA)b
M-6 21815 31st Ave S Single-family Long Term 68.3
M-7 East 22700 30th Ave S (Newport Village Condominiums)
Multi-family Long Term 77.8
M-7 West 22700 30th Ave S (Newport Village Condominiums)
Multi-family Long Term 65.4
M-8 23215 30th Ave S Single-family Long Term 65.2
M-9 WSDOT right-of-way near King's Arms Motel Hotel Short Term 72.4 70.4
M-10 23634 30th Ave S (Park of the Pines - Homes)
Single-family Long Term 65.5
M-10A 23634 30th Ave S (Park of the Pines - Conference Center)
Conference Center
Short Term 69.5 N/Ac
M-11 23828 30th Ave S Municipal Long Term 60.0 65.4
M-12 3320 S 248th Place Single-family Long Term 77.7
M-13 25338 31st Ave S Single-family Long Term 74.3
M-15 2728 S 268th Pl S Single-family Long Term 66.6
M-16 2450 S Star Lake Rd (Mark Twain Elementary School)
School Short Term 64.0 N/Ac
M-17 2720 S 275th Place Single-family Long Term 70.6
M-19 28118 29th Ave S Single-family Long Term 69.5
M-22 2920 S 288th St (Korean Methodist Church) Church Short Term 69.5 N/Ac
M-23 North 3001 S 288th St (end of Sir Galahad Ct in Camelot Square Mobile Home Park)
Multi-family Long Term 70.8
M-23 South 3001 S 288th St (223 Canterbury Dr in Camelot Square Mobile Home Park)
Multi-family Long Term 72.3
M-25 30012 Military Rd (Church of Christ at Federal Way)
Church Short Term 73.7 N/Ac
M-27 2833 S 308th Lane (Studio) Single-family Long Term 74.3
M-27A 2833 S 308th Lane (Home) Single-family Short Term 66.6 64.6
M-28 31220 28th Ave S (Providence Landing Apartments)
Multi-family Long Term 78.6
M-29 31524 28th Ave S Single-family Long Term 70.1
M-30 31453 28th Ave S (Truman High School) School Short Term 61.3 N/Ac
M-36 22516 30th Ave S Single-family Long Term 64.9
M-37 22323 30th Ave S Single-family Long Term 62.3
M-40 East 22831 30th Ave S Multi-family Long Term 66.2
M-40 West 22831 30th Ave S Multi-family Long Term 74.4
M-60 2502 S 317th St (Chelsea Court Condominiums)
Multi-family Long Term 67.8
M-61 31611 20th Ave S (Clarion Hotel) Hotel Long Term 63.7
M-70 2460 S 320th St (Walkway between Hotels) Hotel Short Term 64.5 62.5
M-71 32124 25th Ave (Best Western Plus Evergreen Inn & Suites)
Hotel Long Term 75.2
M-72 2101 S 324th St (Belmor Park) Multi-family Long Term 68.4

3.0 Affected Environment
Federal Way Link Extension 3-11 Noise and Vibration Technical Report November 2016
TABLE 3-1 I-5 Noise Measurements
Monitoring Locationa Address Land Use Type
Type of Measurement
Leq
(Daytime-hour Leq in dBA)
Ldn
(24-hour Ldn in dBA)b
M-100 Entrance to the Highline Water District Towers at the end of 31st Ave S
Municipal Short Term 60.1 N/Ac
M-101 Right-of-way in front of 21615 31st Ave S Multi-family Short Term 66.9 N/Ac
M-102 Right-of-way in front of 3028 S 224th St Single-family Short Term 65.2 N/Ac
M-103 Right-of-way in front of 3028 S 225th St Multi-family Short Term 66.1 N/Ac
M-104 23030/23032 30th Avenue S Multi-family Long Term 71.8
M-105 South end of Midway Landfill Municipal Short Term 75.8 N/Ac
M-106 25422 31st Avenue S Single-family Short Term 65.6 67.6
M-107A 25907 27th Pl S (Pembrooke Apartments - North End)
Multi-family Short Term 67.5 N/Ac
M-107B 25907 27th Pl S (Pembrooke Apartments - South End)
Multi-family Short Term 65.7 N/Ac
M-108 Right-of-way north of Star Lake Park-and-Ride on the east side of 28th Ave S
Single-family Short Term 68.7 N/Ac
M-109 Right-of-way south of 27606 27th Ave S Single-family Short Term 67.2 N/Ac
M-110 Right-of-way east of 27709 Military Rd S (Star Lake Church of God)
Church Short Term 72.7 N/Ac
M-111 3007 S 284th St Single-family Short Term 70.5 70
M-112 Sidewalk south of 28528 29th Pl S Single-family Short Term 66.7 N/Ac
M-113 48 Sir Lancelot Court in Camelot Square Mobile Home Park]
Multi-family Short Term 67.2 69.2
M-114 204 Sir Galahad Court in Camelot Square Mobile Home Park
Multi-family Short Term 63.8 65.8
M-115 Side of I-5 at gap between existing noise and traffic safety barriers in Camelot Square Mobile Home Park
Multi-family Short Term 87.0 N/Ac
M-116 375 Canterbury Drive in Camelot Square Mobile Home Park
Multi-family Long Term 64.1
M-117 Sidewalk south of 29894 30th Ave S Single-family Short Term 70.0 N/Ac
M-118 Cul-de-sac at east end of S 304th St Single-family Short Term 73.4 N/Ac
M-119 31408 28th Ave S (units 101 and 102 in Building D of the Kandila Townhomes)
Multi-family Short Term 73.6 76
M-120 254 Canterbury Drive (empty lot) in Camelot Square Mobile Home Park
Multi-family Short Term 58.9 N/Ac
M-121 Sidewalk on SW corner of 296th and 30th Ave. S
Single-family Short Term 58.0 N/Ac
M-122 Sidewalk between 29773and 29747 30th Ave. S
Single-family Short Term 57.8 N/Ac
M-123 Empty lot between 382 and 383 Canterbury Drive in Camelot Square Mobile Home Park
Single-family Short Term 62.6 N/Ac
a Sites shown on Exhibits 3-1 and 3-2. Sites M-1 through M-72 are from DEIS and sites M-100 through M-123 were taken for the FEIS. b Projected Ldn levels for short-term monitoring sites have been calculated using formulas and methods in the FTA Transit Noise and Vibration Impact Assessment (FTA, 2006) and by comparison with other nearby long-term noise monitoring sites. c These sites were only measured for peak-hour Leq, and no Ldn measure is required because these sites do not have residential uses. Ldn = 24-hour, time-averaged, A-weighted sound level; Leq = equivalent continuous sound level; N/A = not applicable

3.0 Affected Environment
Federal Way Link Extension 3-12 Noise and Vibration Technical Report November 2016
3.2.2 SR 99 Corridor The SR 99 corridor had 43 long‐term and 11 short‐term monitoring locations. Noise levels along this
corridor are dominated by traffic noise from SR 99 and major arterial roadways such as Kent‐Des
Moines Road, S 272nd Street, S 312th Street, and S 320th Street. Aircraft flight also contributes to the
noise environment in the northern part of the corridor.
The Ldn at first‐line receivers along SR 99 north of Kent‐Des Moines Road ranged from 65 dBA to
74 dBA (sites M‐1, M‐2, M‐31, M‐32, M‐39, and M‐8). The high Ldn noise levels are primarily due to the
proximity of some receivers to SR 99, steady traffic flow along SR 99, and receivers that are elevated
relative to the roadway along the east side of SR 99. The peak‐hour noise level measured at a front‐line
church in the area (site M‐35) was 66 dBA Leq. Second‐line and other receiver noise levels along SR 99
in this area ranged from 63 dBA to 67 dBA (sites M‐33, M‐34, M‐35, M‐36, M‐37, M‐38, M‐63,
and M‐64).
Ldn noise levels at monitoring locations south of Kent‐Des Moines Road and north of 272nd Street
along SR 99 ranged from 63 dBA to 71 dBA (sites M‐41, M‐44, M‐45, M‐46, M‐48, and M‐66 East).
Because many of the monitoring sites in this segment are located farther from SR 99, the Ldn noise
levels are somewhat lower than the first‐line noise levels along SR 99 north of Kent‐Des Moines Road.
Receivers on the east side of SR 99, between S 272nd Street and S 304th Street, are at generally higher
elevations than the roadway. Conversely, receivers on the west side of SR 99 are generally below grade
in this area. The relative noise levels reflect this difference. On the east side of the road, Ldn noise
levels at first‐line monitoring locations ranged from 65 to 73 dBA (sites M‐51, M‐53, and M‐54). On the
west side of the road, Ldn noise levels at both first and second‐line monitoring locations were
consistently between 61 and 63 dBA (sites M‐50, M‐52, M‐56, and M‐67). The peak‐hour noise level
measured at the Federal Way Motel (site M‐55) was 71 dBA Leq.
Residential noise levels between S 304th Street and the Federal Way Transit Center along the SR 99
corridor ranged from 59 to 67 dBA (sites M‐57, M‐59, M‐61, M‐62), with the lowest levels being at the
second‐line Bellridge Condominiums to the west of SR 99.
Table 3‐2 summarizes the noise monitoring results for the SR 99 corridor. Included in the table are the
monitoring location number, address, land use, and type of measurement. The 24‐hour Ldn is
presented for all FTA Category 2 land uses, and the peak‐hour Leq is presented for all other sites. For
locations where short‐term measurements were conducted, the Ldn noise levels were calculated from
the short‐term Leq measurements in accordance with the FTA Guidance Manual; therefore, both types
of measures are provided at these locations. As is defined in Section 4.1.1, the Leq is used for the
evaluation of sites with daytime use, while the Ldn is used for sites with sleeping quarters. For
daytime‐use locations where long‐term measurements were conducted, the Leq noise levels were
calculated as an average of daily peak‐hour Leq measurements. Although the monitoring data are
presented to the tenth of a dB, the FTA recommends presenting the noise analysis data for impact
analysis (later in this report) in whole numbers only.

3.0 Affected Environment
Federal Way Link Extension 3-13 Noise and Vibration Technical Report November 2016
TABLE 3-2 SR 99 Corridor Noise Measurements
Monitoring Locationa Address
Land Use Type
Type of Measurement
Leq (Daytime-hour
Leq in dBA)
Ldn (24-hour Ldn
in dBA)b
M-1 20406 Pacific Hwy S (Sleep Inn) Hotel Short Term 65.6 63.6
M-2 20440 Int'l Blvd (The Firs Mobile Home Park) Multi-family Long Term 71.4
M-7 East 22700 30th Ave S (Newport Village Condominiums)
Multi-family Long Term 77.8
M-7 West 22700 30th Ave S (Newport Village Condominiums)
Multi-family Long Term 65.4
M-8 23215 30th Ave S Single-family Long Term 65.2
M-9 WSDOT right-of-way near King's Arms Motel Hotel Short Term 72.4 70.4
M-10 23634 30th Ave S (Park of the Pines - Homes)
Single-family Long Term 65.5
M-10A 23634 30th Ave S (Park of the Pines - Conference Center)
Conference Center
Short Term 69.5 N/Ac
M-11 23828 30th Ave S Municipal Long Term 60.0 65.4
M-12 3320 S 248th Place Single-family Long Term 77.7
M-31 21428 Pacific Hwy S (Viewpoint Apartments) Multi-family Long Term 74.1
M-32 21814 Pacific Hwy S (Pine Terrace Mobile Home Park)
Multi-family Long Term 69.0
M-33 2459 Pacific Hwy S (Majestic Bay Apartments)
Multi-family Long Term 66.6
M-34 2616 S 224th St (Sea Fox Apartments) Multi-family Long Term 65.0
M-35 22323 Pacific Hwy S (Citadel Church) Church Short Term 65.6 N/Ac
M-36 22516 30th Ave S Single-family Long Term 64.9
M-37 22323 30th Ave S Single-family Long Term 62.3
M-38 22700 28th Ave S (Access Condominiums) Multi-family Long Term 64.4
M-39 22855 Pacific Hwy S Single-family Long Term 65.9
M-40 East 22831 30th Ave S Multi-family Long Term 66.2
M-40 West 22831 30th Ave S Multi-family Long Term 74.4
M-41 2400 S 240th St (Highline College) School Long Term 63.5 64.7
M-42 24415 Pacific Hwy S (Iolani Apartments) Multi-family Short Term 60.9 58.9
M-44 2315 S 254th Ct Single-family Long Term 65.3
M-45 2424 S 260th St (West Hill Mobile Manor) Multi-family Long Term 63.4
M-46 2211 260th St Single-family Long Term 68.5
M-47 26421 Pacific Hwy S Vacant Short Term 75.1 N/Ac
M-48 26636 19th Ave S Single-family Long Term 70.5
M-49 North 2211 S Star Lake Rd (Club Palisades Apartments North End)
Multi-family Short Term 63.6 61.6
M-49 Central 2211 S Star Lake Rd (Club Palisades Apartments Pool Area)
Multi-family Long Term 63.2
M-50 27805 16th Pl S Single-family Long Term 61.9

3.0 Affected Environment
Federal Way Link Extension 3-14 Noise and Vibration Technical Report November 2016
TABLE 3-2 SR 99 Corridor Noise Measurements
Monitoring Locationa Address
Land Use Type
Type of Measurement
Leq (Daytime-hour
Leq in dBA)
Ldn (24-hour Ldn
in dBA)b
M-51 28120 18th Ave S - Mariposa Apartments Multi-family Long Term 73.2
M-52 28723 16th Ave S, Bldg. G Multi-family Long Term 61.2
M-53 29353 18th Ave S Multi-family Long Term 64.8
M-54 29850 18th Ave S Church and Single-family
Long Term 65.5 66.9
M-55 29815 Pacific Hwy S (Federal Way Motel) Hotel Short Term 71.4 69.4
M-56 1472 S 303rd St Single-family Long Term 62.4
M-57 30602 Pacific Hwy S (View at the Lake Apartments)
Multi-family Long Term 66.9
M-58 31031 Pacific Hwy S (Federal Way High School)
School Short Term 60.7 N/Ac
M-59 1816 S 312th St Single-family Long Term 63.3
M-60 2502 S 317th St (Chelsea Court Condominiums)
Multi-family Long Term 67.8
M-61 31611 20th Ave S (Clarion Hotel) Hotel Long Term 63.7
M-62 1444 14th Ave S (Bellridge Condominiums) Multi-family Long Term 58.8
M-63 2670 S 227th Pl Single-family Long Term 62.8
M-64 22902 27th Ave S Single-family Long Term 63.4
M-65 23211 28th Ave S Single-family Long Term 62.8
M-66 East Highline College (east parking lot) School Long Term 62.9 62.2
M-66 West Highline College (north parking lot) School Long Term 63.3 66.2
M-67 29045 15th Pl Single-family Long Term 62.5
M-68 1600 SW Dash Point Rd (Sacajawea Park) Park Long Term 62.6 64.4
M-69 31622 Pacific Hwy (Comfort Inn) Hotel Short Term 58.1 56.1
M-70 2460 S 320th St (walkway between hotels) Hotel Short Term 64.5 62.5
M-71 32124 25th Ave (Best Western Plus Evergreen Inn & Suites)
Hotel Long Term 75.2
M-72 2101 S 324th St (Belmor Park) Multi-family Long Term 68.4
a Sites shown on Exhibits 3-1 and 3-2. b Projected Ldn levels for short-term monitoring sites have been calculated using formulas and methods in the FTA Transit Noise and Vibration Impact Assessment (FTA, 2006) and by comparison with other nearby long-term noise monitoring sites. c These sites were only measured for peak-hour Leq, and no Ldn measure is required because these sites do not represent residential uses. Ldn = 24-hour, time-averaged, A-weighted sound level; Leq = equivalent continuous sound level; N/A = not applicable
3.3 Vibration Measurements
3.3.1 Vibration Propagation Test Procedure A vibration propagation test is used to determine the line source transfer mobility (LSTM), which is a
measure of how efficiently vibration travels through the earth. For at‐grade/surface sites, the field test
procedure for determining the LSTM is shown schematically on Exhibit 3‐3. The test consists of

3.0 Affected Environment
Federal Way Link Extension 3-15 Noise and Vibration Technical Report November 2016
dropping a heavy weight on to the ground surface and
measuring the force imparted into the ground and the vibration
response at sensors at several distances from the weight. As
shown in Exhibit 3‐3, the weight is dropped at a line of discrete
impact points (the “impact line”) to approximate the distributed
line source of the actual train. The sensors for measuring vertical
ground motion (e.g., accelerometers or geophones) are located
along a line perpendicular to the impact line.
The number of accelerometers and their distances from the
impact line vary at each
test site depending on
field conditions.
Accelerometers were
placed outdoors at all
sites and were located at
distances up to 200 ft
from the impact line
(test sites are shown in
Appendix D).
Additionally, at sites
V‐16, V‐17, V‐18, V‐19,
and V‐20, accelerometers were placed at indoor positions to determine the building response to
vibration. The impact line was typically 150 ft to 200 ft long, with the impacts at 11 positions at
intervals of 15 ft.
For subgrade sites, an impact hammer was used to generate vibration at the bottom of a borehole,
which was drilled to the proposed depth of the track (and surrounding depths). Sensors then collected
the surface vibration response at various distances from the source, as shown in Exhibit 3‐4. For both
at‐grade and subgrade tests, the relationship between the force into the ground and the vertical
surface vibration at each of the measurement locations was derived. Typically, data were collected at
three depths: 10 ft above the tunnel or trench depth, at the tunnel or trench depth, and 10 ft below
the tunnel or trench depth.
The borehole tests used the same concept as surface tests to derive the LSTM except that the impact
hammer locations for a borehole measurement were typically only measured at three borehole
depths, rather than 10 to 15 locations along a line as for the surface tests. Therefore, to derive the
LSTM for a borehole measurement, the measured data from the three test depths were extrapolated
to account for the length of the train. Compared to the surface propagation analysis, the borehole
analysis required several additional steps to derive the LSTM.
EXHIBIT 3-3 Schematic of Surface Vibration Propagation Test Procedure
Line Source Transfer Mobility LSTM represents the complex relationship between the vibration source—such as a train that excites the ground—and the resulting vibration of the ground surface. It is a function of vibration frequency and distance of the receiver from the source. In other words, LSTM is an indicator of the efficiency with which vibration energy is transmitted through the ground.

3.0 Affected Environment
Federal Way Link Extension 3-16 Noise and Vibration Technical Report November 2016
EXHIBIT 3-4 Schematic of Borehole Vibration Propagation Test Procedure
3.3.2 Vibration Propagation Test Sites The vibration test sites for the initial assessment were selected based on a review of aerial
photographs and a windshield survey of the land uses; additional sites were selected based on results
of the initial impact assessment. Vibration propagation tests were performed at 20 unique sites in the
study area. All sites were located close to FWLE alternative alignments. A summary of the vibration
propagation test sites and measurement distances is provided in Table 3‐3. Detailed descriptions of
each test site are provided in Appendix D. The detailed vibration test results, including the best‐fit
coefficients for the LSTMs, are provided in Appendix E.
TABLE 3-3 Summary of Vibration Propagation Test Sites
Test Site Location
Vibration Measurement Distances from Impact Line (ft)a
A1 A2 A3 A4 A5 A6 A7 A8
V-1 Firs Mobile Home Park, 20440 International Boulevard, SeaTac 25 38 50 63 75 100 25 50
V-2 32nd Ave. S & S 212th St., SeaTac 25 38 50 75 100 125 150 200
V-3 30th Ave. S & S 225th Pl. Des Moines 25 38 50 75 100 125 160 200
V-4 3012 S 240th St., Kent 25 38 50 63 75 100 -- --
V-5 31st Ave. S & S 254th St., Kent 25 50 75 100 125 150 175 200
V-6 Mark Twain Elementary School, 2450 S Star Lake Road, Federal Way 25 50 75 100 125 150 -- --
V-7 Redondo Heights Park-and-Ride, 27454 Pacific Highway S, Federal Way
25 50 75 100 125 140 -- --
V-8 SR 99 & S 283rd St., Federal Way 25 50 75 100 125 140 -- --
V-9 Camelot Square Mobile Home Park, 3001 S 288th Street, Federal Way 25 50 75 100 125 150 -- --
V-10 View at the Lake Apartments, 30602 Pacific Highway S, Federal Way. 25 50 75 100 125 150 -- --
V-11 Providence Landing Apartments, 31218 28th Ave. S 25 38 50 63 75 100 125 150
V-12 Truman High School, 31455 28th Ave S, Federal Way 25 38 50 63 75 100 -- --
V-13 S 216th St. just west of I-5 overpass (borehole) 35 65 85 110 135 -- -- --
V-14 Mark Twain Elementary School (borehole) 25 50 75 100 150 200
V-15 Truman High School (borehole) 25 50 75 100 150 200

3.0 Affected Environment
Federal Way Link Extension 3-17 Noise and Vibration Technical Report November 2016
TABLE 3-3 Summary of Vibration Propagation Test Sites
Test Site Location
Vibration Measurement Distances from Impact Line (ft)a
A1 A2 A3 A4 A5 A6 A7 A8
V-16 20432 Military Rd., Federal Way 12 30 50 base-ment
Top floor
-- -- --
V-17 King’s Arms Motel, 23226 30th Avenue S, Des Moines 20 38 38 38 60 70 100 base-ment
V-18 America’s Best Value Airport Inn, 20620 International Boulevard, SeaTac
16 26 56 76 1st Floor
2nd Floor
-- --
V-19 3114 S 216th St., SeaTac 25 37 42 1st Floor
2nd Floor
52 -- --
V-20 31524 28th Ave. S, Federal Way 25 45 59 84 109 1st Floor
2nd Floor
--
a The ground is excited using a drop hammer along a line called an impact line that simulates a line source such as a light rail train. The vibration responses are measured at several distances from the impact line. This provides the efficiency in which vibration energy is propagated through the soil.
3.3.3 Results of Vibration Propagation Tests The measured LSTM and spectral coherence for sites V‐1 through V‐20 are shown in Appendix E.
Coherence varies between 0 and 1 and is a measure of the “quality” of the LSTM results. A coherence
close to 1 indicates that the vibration response and the force generated by the dropped weight are
closely related. A coherence less than about 0.2 indicates a relatively weak relationship between the
exciting force and the vibration response. Low coherence indicates that the vibration signal generated
by the dropped weight contains less energy than the ambient vibration at the measurement location.
This may happen when ambient vibration is relatively high, when the distance between the dropped
weight and the accelerometer is relatively high, or when the soil is a poor transmitter of vibration at a
specific frequency.
Higher LSTM levels indicate that vibrations are transmitted more efficiently through the soil. The peak
frequency of the LSTM is important because it indicates the frequency range where vibration is
transmitted most efficiently. If the LSTM peak coincides with the frequency range in which the train
produces the most energy, it will result in higher vibration at sensitive receivers. Following are the
observations from the vibration propagation test results; in the following summary, “good” coherence
is defined as a coherence that is greater than or equal to 0.2.
For surface sites:
The coherences were good between 16 and 315 Hertz (Hz) at all outdoor measurement positions
closer than 100 ft, which indicates good confidence in the data. Coherence is lower at
measurement positions farther away from the line of impacts. At measurement positions greater
than 100 ft from the impact line, coherence levels indicate confidence in the LSTM levels over the
range of 20 to 160 Hz.
Peak transfer mobility levels are between 31.5 and 63 Hz at all vibration sites except sites V‐4 and
V‐9. The LSTM spectra of the 17 surface vibration sites (V1 to V12, V‐16 to V20) showed similar

3.0 Affected Environment
Federal Way Link Extension 3-18 Noise and Vibration Technical Report November 2016
attenuation with distance. The peak LSTM levels at 25 ft were within 10 decibels for all surface
sites.
For site V‐4, the transfer mobility peaked between 40 and 50 Hz for the main accelerometer line,
but the peak in the spectra shifted to 63 and 80 Hz at the accelerometers at the façade of the
apartment building. It is not clear why the LSTM measured in front of the building shows a shift in
the spectral peak.
For site V‐9, the transfer mobility peaked at 40 Hz for the 25‐ and 50‐ft positions. For the remaining
measurement positions, the peak occurred between 25 and 31.5 Hz. The coherences were good
between 20 and 315 Hz at all measurement positions. This indicates the soil at site V‐9 transmits
lower‐frequency vibration more efficiently compared to other measurement sites.
In general, indoor measurements at multi‐family and hotel structures showed amplification of
about 5 to 8 dB between 20 and 50 Hz, relative to outdoor measurements. The indoor
measurements typically show peaks in the LSTM around 40 to 50 Hz. The LSTMs from indoor
measurements are used to make predictions at the specific buildings where they were measured.
An average of the indoor measurements is applied to all sensitive receivers with similar structures
(multi‐family residences and hotels).
The coherence values for indoor measurement positions are generally lower than similar outdoor
measurements. Coherence is acceptable at all indoor measurements between 20 and 200 Hz.
At site V‐20 there is a sharp peak in the LSTM at the first floor measurement position. This peak is
not seen at the response in the same building on the second floor, nor is it seen in any of the other
buildings measured. This is assumed to be an artifact of that particular measurement position
inside that building and not representative of the entire building. Therefore, only the second floor
measurement was used to represent the response of this receiver.
For borehole sites:
At borehole vibration test sites, the LSTMs have generally flatter spectra than the surface sites. The
LSTM levels are lower in the 30‐ to 60‐Hz range, but higher at high frequencies. Surface waves are
induced by surface vibration, while they are not induced by subgrade vibration.
Boreholes also have generally lower coherence, although the coherence is still acceptable between
16 and 315 Hz (down to about 0.2 at the greater distances).
The three borehole vibration propagation sites show similar LSTM levels.

Federal Way Link Extension 4-1 Noise and Vibration Technical Report November 2016
4.0 Noise and Vibration Impact Criteria
4.1 Noise Impact Criteria The operation of a light rail system can cause noise that becomes a major public concern. Noise
impacts can be caused by either transit operations (e.g., light rail operational noise, warning bells,
ancillary facilities, and buses and park‐and‐ride lots at transit centers) or changes in traffic noise
exposure. An increase in traffic noise exposure could result from the development of new or extended
roadways in station areas, or from the removal of buildings, walls, or berms that currently provide
acoustical shielding from traffic noise. Several different noise impact criteria are applicable to the FWLE
project. This section summarizes those criteria and defines the project noise impact, as applicable to
the FWLE.
4.1.1 Transit Noise Impact Criteria Noise impacts for the FWLE are determined based on the criteria defined in the FTA Guidance Manual
(FTA, 2006). The FTA noise impact criteria are founded on well‐documented research on community
reaction to noise and are based on changes in noise exposure rated using a sliding scale. Although
more transit noise is allowed in neighborhoods with high levels of existing noise, as existing noise levels
increase, smaller increases in total noise exposure are allowed before a noise impact is identified. The
FTA noise impact criteria group noise‐sensitive land uses into the following three categories:
Category 1: Tracts of land where quiet is an essential element in their intended purpose. This
category includes lands set aside for serenity and quiet and such land uses as outdoor
amphitheaters and concert pavilions, as well as National Historic Landmarks with significant
outdoor use. Also included in this category are recording studios and concert halls.
Category 2: Residences and buildings where people normally sleep. This category includes homes,
hospitals, and hotels where a nighttime sensitivity to noise is assumed to be of utmost importance.
Category 3: Institutional land uses with primarily daytime and evening use. This category includes
schools, libraries, theaters, and churches where it is important to avoid interference with such
activities as speech, meditation, and concentration on reading material. Places for meditation or
study associated with cemeteries, monuments, museums, campgrounds, and recreational facilities
are also considered to be in this category. Certain historical sites and parks are also included, but
their sensitivity to noise must be related to their defining characteristics, and generally parks with
active recreational facilities are not considered noise‐sensitive.
Ldn is used to characterize noise exposure for residential areas (Category 2). For other noise‐sensitive
land uses, such as outdoor amphitheaters and school buildings (Categories 1 and 3), the maximum
1‐hour Leq during the facility’s operating period is used.

4.0 Noise and Vibration Impact Criteria
Federal Way Link Extension 4-2 Noise and Vibration Technical Report November 2016
The two levels of impact included in the FTA criteria (severe and moderate) are as follows:
Severe Impact: Project‐generated noise in the severe impact range can be expected to cause a
large percentage of people to be highly annoyed by the new noise and represents the most
compelling need for mitigation. Noise mitigation will normally be specified for severe impact areas
unless there are truly extenuating circumstances that prevent mitigation.
Moderate Impact: In this range of noise impact, the change in the cumulative noise level is
noticeable to most people but may not be sufficient to cause strong, adverse reactions from the
community. In this transitional area, other project‐specific factors must be considered to determine
the magnitude of the impact and the need for mitigation. These factors include the existing level,
the projected level of increase over existing noise levels, the types and numbers of noise‐sensitive
land uses affected, the noise sensitivity of the properties, the effectiveness of the mitigation
measures, community views, and the cost of mitigating noise to more acceptable levels.
The FTA noise impact criteria are summarized in graphical form on Exhibit 4‐1, which shows the
existing noise exposure and the noise exposure from a transit project that would cause either
moderate or severe impact. The future noise exposure, which is not shown in the exhibit, would be the
combination of the existing noise exposure and the additional noise exposure caused by the light rail
project.
Source: FTA, 2006.
EXHIBIT 4-1FTA Project Noise Impact Criteria

4.0 Noise and Vibration Impact Criteria
Federal Way Link Extension 4-3 Noise and Vibration Technical Report November 2016
Exhibit 4‐2 expresses the same criteria in terms of the increase in total or cumulative noise that can
occur in the overall noise environment before an impact occurs. As shown on Exhibit 4‐2, as existing
noise exposure increases, an increasingly smaller increase in noise is permitted before an impact
occurs. Table 4‐1 provides the FTA noise impact criteria in tabular format.
TABLE 4-1 FTA Noise Impact Criteria
Existing Noise Exposure Ldn or Leqa
Project Noise Exposure Impact Thresholds, Ldn or Leqa
(all noise levels are in dBA)b
Category 1 or 2 Sites Category 3 Sites
Impact Severe Impact Impact Severe Impact
<43 Ambient + 10 > Ambient + 15 Ambient + 15 > Ambient + 20
43-44 52 – 58 >58 57 – 63 >63
45 52 – 58 >58 57 – 63 >63
46-47 53 – 59 >59 58 – 64 >64
48 53 – 59 >59 58 – 64 >64
49-50 54 – 59 >59 59 – 64 >64
51 54 – 60 >60 59 – 65 >65
52-53 55 – 60 >60 60 – 65 >65
54 55 – 61 >61 60 – 66 >66
55 56 – 61 >61 61 – 66 >66
56 56 – 62 >62 61 – 67 >67
Source: FTA, 2006.
EXHIBIT 4-2Increase in Cumulative Noise Exposure Allowed by FTA Criteria

4.0 Noise and Vibration Impact Criteria
Federal Way Link Extension 4-4 Noise and Vibration Technical Report November 2016
TABLE 4-1 FTA Noise Impact Criteria
Existing Noise Exposure Ldn or Leqa
Project Noise Exposure Impact Thresholds, Ldn or Leqa
(all noise levels are in dBA)b
Category 1 or 2 Sites Category 3 Sites
Impact Severe Impact Impact Severe Impact
57-58 57 – 62 >62 62 – 67 >67
59-60 58 – 63 >63 63 – 68 >68
61-62 59 – 64 >64 64 – 69 >69
63 60 – 65 >65 65 – 70 >70
64 61 – 65 >65 66 – 70 >70
65 61 – 66 >66 66 – 71 >71
66 62 – 67 >67 67 – 72 >72
67 63 – 67 >67 68 – 72 >72
68 63 – 68 >68 68 – 73 >73
69 64 – 69 >69 69 – 74 >74
70 65 – 69 >69 70 – 74 >74
71 66 – 70 >70 71 – 75 >75
72-73 66 – 71 >71 71 – 76 >76
74 66 – 72 >72 71 – 77 >77
75 66 – 73 >73 71 – 78 >78
76-77 66 – 74 >74 71 – 79 >79
>77 66 – 75 >75 71 – 80 >80
Source: FTA, 2006. a Ldn is used for land uses where nighttime sensitivity is a factor; peak-hour Leq is used for land use involving only daytime activities. Severe impacts only occur if the predicted levels exceed (>) the values in the appropriate column. b Category Definitions:
Category 1: Buildings or parks where quiet is an essential element of their purpose. Category 2: Residences and buildings where people normally sleep. This includes residences, hospitals, and hotels where nighttime sensitivity is assumed to be of utmost importance. Category 3: Institutional land uses with primarily daytime and evening use. This category includes schools, libraries, and churches.
The FTA Guidance Manual provides details on how parks are analyzed for noise in Chapter 3, Section 2,
Application of Noise Impact Criteria, of the manual. The FTA assumes that parks are a special case, and
how they are used and where they are located should be considered when considering whether or not
a particular park, or an area in a park, is considered noise‐sensitive. Parks that are used for outdoor
recreation are typically not considered noise‐sensitive. This includes parks with baseball diamonds,
soccer fields, basketball courts, football fields, and other active recreation areas.
Parks that are noise‐sensitive would be those where quiet is an essential element in their intended
purpose or places where it is important to avoid interference with activities such as speech,
meditation, and reading. The existing noise levels at a park can provide some indication of the
sensitivity of its use. All parks along the FWLE corridor were evaluated for consideration under the FTA

4.0 Noise and Vibration Impact Criteria
Federal Way Link Extension 4-5 Noise and Vibration Technical Report November 2016
criteria, and based on the park locations and existing noise levels, none met the requirements for noise
sensitivity under the FTA Category 3 criteria.
4.1.2 Traffic Noise Impact Criteria As required by the FTA, the criteria for determining traffic noise impacts associated with the FWLE are
taken from the FHWA Procedures for Abatement of Highway Traffic Noise and Construction Noise,
Code of Federal Regulations (CFR) Title 23, Part 772 (2010). A traffic noise impact occurs if predicted
traffic noise levels approach the criteria levels for specific FHWA land use activity categories or
substantially exceed existing noise levels (e.g., a 10‐dbA increase). These levels are defined as noise
abatement criteria (NAC), and are based on hourly Leq noise levels during the peak traffic noise hour.
The land use activity categories of greatest concern in the FWLE corridor are Types B and C, which
include residences, playgrounds, active sports areas, parks, schools, churches, libraries, and hospitals.
The noise abatement criterion used to determine impacts on this land use is to approach, or exceed,
67 dBA Leq outside of buildings. Under WSDOT policy, a traffic noise impact occurs if predicted noise
levels approach within 1 dB of the NAC. Therefore, an impact on Type B or C land uses would occur at
66 dBA Leq. Some commercial uses, including hotels and motels, have a criterion of 71 dBA under the
WSDOT policy. Many other commercial uses, such as general offices and retail businesses, are not
normally considered noise‐sensitive. Table 4‐2 shows the traffic noise land use types and the
corresponding FHWA and WSDOT NAC.
TABLE 4-2 FHWA and WSDOT Noise Abatement Criteria (NAC) by Land Use Category
Activity Category
Activity Criteria in hourly Leq (dBA)
Evaluation Location Activity Description FHWA NAC WSDOT NAC
A 57 56 Exterior Lands on which serenity and quiet are of extraordinary significance and serve an important public need and where the preservation of those qualities is essential if the area is to continue to serve its intended purpose
Ba 67 66 Exterior Residential (single-family and multifamily units)
Ca 67 66 Exterior
Active sport areas, amphitheaters, auditoriums, campgrounds, cemeteries, daycare centers, hospitals, libraries, medical facilities, parks, picnic areas, places of worship, playgrounds, public meeting rooms, public or nonprofit institutional structures, radio studios, recording studios, recreation areas, Section 4(f) sites, schools, television studios, trails, and trail crossings
D 52 51 Interior Auditoriums, daycare centers, hospitals, libraries, medical facilities, places of worship, public meeting rooms, public or nonprofit institutional structures, radio studios, recording studios, schools, and television studios
Ea 72 71 Exterior Hotels, motels, offices, restaurants/bars, and other developed lands, properties, or activities not included in A–D or F
F -- -- --
Agriculture, airports, bus yards, emergency services, industrial, logging, maintenance facilities, manufacturing, mining, rail yards, retail facilities, shipyards, utilities (water resources, water treatment, electrical), and warehousing
G -- -- -- Undeveloped lands that are not permitted
Source: FHWA Procedures for Abatement of Highway Traffic Noise and Construction Noise and WSDOT Traffic Noise Policy and Procedures (23 CFR Subchapter H, Section 772). a Includes undeveloped lands permitted for this activity category.

4.0 Noise and Vibration Impact Criteria
Federal Way Link Extension 4-6 Noise and Vibration Technical Report November 2016
The FHWA recently clarified the type of noise analysis needed for transit‐only projects along federal aid
highways and roadways. Specifically, the FHWA stated that transit‐only projects meeting the three
criteria below should use the FTA’s guidance manual procedures to assess noise associated with the
transit project and any highway elements directly affected by the transit project:
1. FTA is the lead agency in the National Environmental Policy Act (NEPA) process. The FHWA's limited
participation is as a cooperating agency.
2. The main transportation purpose of the project, as stated in the purpose and need statement of
the NEPA document, is transit‐related and not highway‐related.
3. No federal‐aid highway funds are being used to fund the project.
Because all three of the FHWA transit‐only project criteria listed above are met by the FWLE, FTA
methods were used to assess traffic noise impacts. Complete information on the FHWA guidance can
be found on the FHWA web site at: http://www.fhwa.dot.gov/environment/noise/
regulations_and_guidance/faq_nois.cfm#A10.
4.1.3 State Regulations and Local Noise Ordinances Project operation and construction would take place in the cities of SeaTac, Des Moines, Kent, and
Federal Way, all of which are in King County. Each of these cities has their own local noise ordinances
that would be applicable to the FWLE.
Other noise codes evaluated for this project include the Washington Administrative Code (WAC) noise
control regulation. WAC Chapter 173‐60, Maximum Environmental Noise Levels, establishes maximum
noise levels permissible in identified environments, including residential, commercial, industrial, and
construction areas. However, WAC 173‐60‐110 provides that:
The department conceives the function of noise abatement and control to be primarily
the role of local government and intends actively to encourage local government to
adopt measures for noise abatement and control. Wherever such measures are made
effective and are being actively enforced, the department does not intend to engage
directly in enforcement activities.
Hence, the rules governing noise levels that are contained in WAC Chapter 173‐60 do not apply when a
local noise ordinance is in effect. Therefore, the various local noise ordinances would be applicable to
the operation of FWLE ancillary facilities and project construction. Since several of the cities in which
project operations and construction would occur have adopted portions of the WAC for purposes of
their own noise ordinances, those WAC regulations are described below.
4.1.3.1 WAC Stationary Land Use Noise Criteria For stationary land uses with noises originating from outside public roadways and rights‐of‐way, WAC
Chapter 173‐60 (Maximum Environmental Noise Levels) establishes three classes of property usage,
called Environmental Designation for Noise Abatement (EDNA), and maximum allowable noise levels
for each, as shown in Table 4‐3.

4.0 Noise and Vibration Impact Criteria
Federal Way Link Extension 4-7 Noise and Vibration Technical Report November 2016
TABLE 4-3 Washington State Noise Control Ordinance
EDNA Source of Noise
EDNA Receiver of Noise (Maximum Allowable Sound Level in dBAa)
Residential (EDNA Class A)
Commercial (EDNA Class B)
Industrial (EDNA Class C)
Residential (EDNA Class A) 55 57 60
Commercial (EDNA Class B) 57 60 65
Industrial (EDNA Class C) 60 65 70
Source: WAC, Chapter 173-60. a Between 10:00 p.m. and 7:00 am, the levels given above are reduced by 10 dBA for residential receiving property.
For example, the noise caused by a commercial property must be less than 57 dBA at the closest
residential property line. From 10:00 p.m. to 7:00 a.m., the allowable maximum sound levels shown in
Table 4‐3 are reduced by 10 dBA at such a residential property line. The WAC contains short‐term
exemptions to the property line noise standards in Table 4‐3 based on the minutes per hour that the
noise limit is exceeded. These exceedances are outlined in Table 4‐4.
TABLE 4-4 Washington State Exemptions for Short-Term Noise Exceedances
Minutes Per Hour Adjustment to Maximum Sound Level
15 +5 dBA
5 +10 dBA
1.5 +15 dBA
Source: WAC, Chapter 173-60.
4.1.3.2 WAC Construction Noise Criteria Generally, construction activities can be performed within the limits of the WAC regulations if the work
is conducted during normal daytime hours (7:00 a.m. to 10:00 p.m.). If construction is performed
during the nighttime, the contractor must still meet the WAC noise‐level requirements presented in
Table 4‐3 or get a noise variance from the governing jurisdiction.
The WAC also contains a set of construction‐specific allowable noise‐level limits. These construction
noise regulations are organized by type of noise and include general construction equipment; impulse
equipment, such as jackhammers and pile‐drivers; haul trucks; and safety alarms, such as back‐up
beepers.
Haul Truck Noise Criteria Maximum permissible sound levels for haul trucks on public roadways are limited to 86 dBA for speeds
of 35 miles per hour (mph) or less, and 90 dBA for speeds over 35 mph when measured at 50 ft (WAC,
Chapter 173‐62). For trucks operating within staging areas, the general construction equipment noise
criteria would be used to determine compliance.
Noise Related to Back-up Alarms Sounds created by back‐up alarms are exempt from the allowable noise‐level limits, except between
10:00 p.m. and 7:00 a.m. when “beep‐beep” back‐up alarms are essentially prohibited by the WAC in

4.0 Noise and Vibration Impact Criteria
Federal Way Link Extension 4-8 Noise and Vibration Technical Report November 2016
urban areas. During nighttime hours, other forms of back‐up safety measures would need to be used
and could include the use of smart back‐up alarms, which automatically adjust the alarm level based
on the background level, or switching off back‐up alarms and replacing them with spotters. This
criterion is included because, just like noise from construction activities, noise from back‐up beepers
would exceed the WAC nighttime criteria, even with the allowable exceedance, at distances up to
800 ft or more from the construction site.
4.1.3.3 City of SeaTac The City of SeaTac Code does not expressly incorporate or refer to the state noise regulations in WAC
Chapter 173‐60; however, unlike the municipal codes of the other three cities in which the FWLE will
be constructed and will operate, the SeaTac Code includes general noise control regulations and
additional regulations that are specific to Sound Transit’s operations.
SeaTac Municipal Code, Chapter 8.05.360 Noise Chapter 8.05.360, the noise chapter of the SeaTac Criminal Code, prohibits public disturbance noises,
such as frequent, repetitive, or continuous sounds in connection with motor vehicles, yelling, sound
systems, and other noise sources that could cause public disturbances. This chapter states that sounds
originating from construction sites are public disturbance noises between the hours of 10:00 p.m. and
7:00 a.m. on weekdays and 10:00 p.m. and 9:00 a.m. on weekends.
SeaTac Municipal Code, Chapter 13.240, Sound Transmission Code This code, adopted in 1993 and updated in 2004, requires that all buildings constructed within the
vicinity of the Sea‐Tac Airport meet required noise reduction characteristics in order to protect the
health and welfare of the public in certain nearby areas or zones. Portions of the FWLE corridor lie
within these zones, but no such buildings will be constructed in connection with the FWLE.
SeaTac Municipal Code, Chapter 15.36 Design Standards for High Capacity Facilities The purpose of Chapter 15.36 of the SeaTac Municipal Code is to provide the following design
considerations when designing and constructing high‐capacity transit (HCT) facilities in the City of
SeaTac:
Facilities and stations that are well designed
Development of distinctive community focal points
Connections between the HCT network, adjacent development, and community vehicular,
pedestrian, and bicycle routes
Adequate buffers between different types of land uses
Use of alternative travel modes to single‐occupant vehicles
Most of this section of the SeaTac Municipal Code has to do with actual design and the look and feel of
any proposed HCT facilities. There are sections describing station design, elevated structures, and
pedestrian crossings along with 26 other design criteria, most of which are not applicable to this noise
study. In fact, the only direct consideration of noise is contained in Section 15.36.220, Buffering of
Track Corridor. The light rail noise suppression section states that light rail vehicles and associated

4.0 Noise and Vibration Impact Criteria
Federal Way Link Extension 4-9 Noise and Vibration Technical Report November 2016
track shall utilize the best available noise suppression technology in order to minimize adverse impacts
on adjacent properties. Sound Transit’s track and fleet of light rail vehicles meets this requirement.
4.1.3.4 City of Des Moines In Section 7.16.010 of its Municipal Code, the City of Des Moines has adopted WAC Chapters
173‐60‐020, 173‐60‐030, 173‐60‐040, 173‐60‐050, and 173‐60‐080, which contain the maximum
permissible environmental noise level requirements discussed in Section 4.1.3.1 of this report. Hence,
those chapters regulate noise that relates to construction of the FWLE in the city of Des Moines, as
well as to ancillary equipment and facilities, such as park‐and‐ride lots and traction‐power substations,
in the same manner as the WAC. Because the daytime exemption for noise from construction activities
found in WAC Section 173‐60‐050 has been specifically adopted by the City of Des Moines, most
project construction can be performed within the limits of the City ordinance if the work is conducted
during normal daytime hours (7:00 a.m. to 10:00 p.m.). If construction is performed during the
nighttime, the contractor must still meet the WAC noise level criteria presented in Table 4‐3 or get a
noise variance from the City of Des Moines. The City has adopted WAC 173‐60‐080, which includes
State criteria for a noise variance.
The City of Des Moines also forbids “Specific public disturbance noises,” the definition of which
includes “frequent, repetitive, or continuous sounds that emanate from a structure that unreasonably
disturbs or interferes with peace and comfort of the owners or possessors of real property…” (City of
Des Moines Municipal Code Chapter 7.36).
Lastly, the City of Des Moines limits the generation of exterior noise levels in residentially zoned areas,
at parks of local significance, and at historic or archaeological properties of local significance, to 55 dBA
Ldn, or existing levels as of April 20, 1995, whichever is greater. For various kinds of sports areas, such
as golf courses and ball fields, the limit is 60 dBA. Proponents of projects that would increase exterior
noise levels beyond these limits must submit a noise mitigation plan to the community development
department of the City for review and approval before required permits are issued to allow the project
to proceed (City of Des Moines Municipal Code Chapter 18.38).
4.1.3.5 City of Kent The City of Kent has maximum permissible environmental noise level requirements that are similar to
those contained in the WAC (Kent Municipal Code Chapter 8.05). The City does not explicitly exempt
noise generated by daytime construction activities from Chapter 8.05, but in Section 9.02.200 of the
City’s criminal code regarding public disturbances, the City exempts noise from construction sites at all
times in commercial areas that are not adjacent to residential areas and from 7:00 a.m. until 8:00 p.m.
in all other areas. In addition, in the answers section of the Kent Code Enforcement Frequently Asked
Questions web page, it states that construction is allowed between 7:00 a.m. and 10:00 p.m. seven
days a week.
Sounds created by warning devices not operating continuously for more than 5 minutes, or by bells,
chimes, and carillons, are entirely exempt from the City of Kent’s environmental noise level
requirements (City of Kent Municipal Code Section 8.05.140(4)).

4.0 Noise and Vibration Impact Criteria
Federal Way Link Extension 4-10 Noise and Vibration Technical Report November 2016
4.1.3.6 City of Federal Way In Section 7.10.050 of its Code, the City of Federal Way adopts by reference the maximum
environmental noise levels set forth in the State rules, including those in WAC Chapter 173‐60. In
addition, in Section 7.10.020, the City exempts sounds originating from construction sites and activities
between 7:00 a.m. and 10:00 p.m. on weekdays and 9:00 a.m. and 8:00 p.m. on weekends. Warning
horns or sirens attached to motor vehicles are also exempt (City of Federal Way Revised Code Section
7.10.020(1)).
4.2 Groundborne Noise and Vibration Criteria Potential effects of rail transit groundborne noise and vibration include perceptible building vibration,
rattle noises, reradiated noise (groundborne noise), and cosmetic or structural damage to buildings.
However, vibration caused by light rail operations is typically well below what would cause even minor
cosmetic damage to buildings. Vibration caused by construction equipment and activities is evaluated
for potential damage to nearby buildings. Therefore, the criteria for building vibration caused by transit
operations are primarily concerned with potential annoyance of building occupants.
4.2.1 Transit Vibration and Groundborne Noise Criteria The FTA vibration impact criteria are based on the maximum indoor vibration level as a train passes.
There are no impact criteria for outdoor spaces such as parks. The FTA Guidance Manual provides two
sets of criteria: one based on the overall vibration velocity level for use in a General Vibration Impact
Assessment and one based on the maximum vibration level in any 1/3‐octave band (the band
maximum level) for use with a Detailed Vibration Assessment, which was used for this analysis. An FTA
vibration impact exists if the vibration levels meet or exceed both criteria.
Table 4‐5 shows the FTA General Assessment criteria for groundborne vibration from rail transit
systems. As with the FTA noise criteria, there are three categories of sensitive land uses. However, the
category definitions are different for noise and for vibration. The primary difference is in Category 1.
For a noise assessment, Category 1 applies to land uses “…where quiet is an essential element of their
intended purpose.” For a vibration assessment, Category 1 applies to “buildings where vibration would
interfere with interior operations...,” which primarily applies to spaces that house sensitive research
and laboratory equipment such as scanning electron microscopes. There are five buildings in the FWLE
corridor that may qualify as a Category 1 vibration‐sensitive land use: UW Neighborhood Kent/Des
Moines Clinic, Sea Mar Community Health Center‐Des Moines, Healthpoint Midway Clinic, Pacific
Medical Center Federal Way, and the UW Neighborhood Federal Way Clinic.
Unlike the FTA noise criteria, the FTA vibration criteria do not incorporate any factor to account for the
number of trains per day, with two exceptions: Under vibration categories 2 and 3, for “occasional
service,” the FTA impact thresholds are 3 VdB higher than for “frequent service,” and for “infrequent
service,” the FTA impact thresholds are 8 VdB higher than for frequent service. Note that since
Category 1 is based on operations of equipment (and not human disturbance), a single threshold
applies regardless of the number of events.

4.0 Noise and Vibration Impact Criteria
Federal Way Link Extension 4-11 Noise and Vibration Technical Report November 2016
TABLE 4-5 FTA Impact Thresholds for Groundborne Vibration, General Impact Assessment
Land Use Category
Groundborne Vibration, VdB re 1 micro inch/sec
Groundborne Noisea, dB re 20 micro Pascals
Frequent Eventsb
Occasional Eventsc
Infrequent Eventsd
Frequent Eventsb
Occasional Eventsc
Infrequent Eventsd
Category 1: Buildings where vibration would interfere with interior operations. Typically land uses include vibration-sensitive research and manufacturing, hospitals with vibration-sensitive equipment, and university research operations.
65 65 65 N/Ae N/Ae N/Ae
Category 2: Residences and buildings where people normally sleep.
72 75 80 35 38 43
Category 3: Institutional land uses with primarily daytime uses.
75 78 83 40 43 48
Source: FTA, 2006. a Groundborne noise criteria are not applied to any of the three categories. However, the groundborne noise criteria are applied to special buildings such as concert halls and performing arts centers. b Frequent events are defined as more than 70 vibration events per day. c Occasional events are defined as between 30 and 70 vibration events per day. d Infrequent events are defined as less than 30 vibration events per day. e Vibration-sensitive equipment is not sensitive to groundborne noise. re = reference; micro-inch/sec = micro-inch per second; N/A = not applicable; VdB = vibration decibels
FTA defines occasional service to be between 30 and 70 trains per day and infrequent service to be less
than 30 trains per day. The frequent criteria are applicable to the FWLE because there would be more
than 70 trains per day passing by any one location.
The FTA vibration thresholds do not specifically account for existing vibration. Although roadways in
the study area, especially SR 99 and I‐5, have substantial volumes of vehicular traffic, including buses
and trucks, it is relatively rare that rubber‐tired vehicles generate perceptible ground vibration unless
there are irregularities in the roadway surface such as potholes or wide expansion joints.
The refined criteria for use with a Detailed Vibration Assessment are shown on Exhibit 4‐3. For the
detailed assessment, the
predicted vibration levels in
terms of the 1/3‐octave band
spectra are compared to the
curves shown on Exhibit 4‐3
to determine whether there
would be impacts and the
frequency range over which
vibration mitigation would
be required. An impact
occurs when any spectral
values exceed the applicable
curve. The FTA interpretation
of how each of the curves
shown on Exhibit 4‐3 should
be applied is given in EXHIBIT 4-3 FTA Criteria for Detailed Vibration Assessment

4.0 Noise and Vibration Impact Criteria
Federal Way Link Extension 4-12 Noise and Vibration Technical Report November 2016
Table 4‐6. The VC‐A through VC‐E curves are used to specify acceptable vibration limits for sensitive
equipment, such as electron microscopes. Which curve to use depends on the sensitivity of the specific
equipment that would be affected. The VC‐C curve is adequate to avoid interfering with the operation
of most sensitive equipment with the exception of a few particularly sensitive pieces of equipment
such as transmission electron microscopes or atomic force microscopes.
TABLE 4-6 Interpretation of Vibration Criteria for Detailed Analysis
Criterion Curves Maximum
Level (VdB)a Description of Uses
Workshop 90 Distinctly feelable vibration. Appropriate to workshops and non-sensitive areas.
Office 84 Feelable vibration. Appropriate to offices and non-sensitive areas.
Residential Day 78 Barely feelable vibration. Adequate for computer equipment and low-power optical microscopes (up to 20X).
Residential Night, Operating Rooms
72 Vibration not feelable, but groundborne noise may be audible inside quiet rooms. Suitable for medium-power optical microscope (100X) and other equipment of low sensitivity.
VC-A 66 Adequate for medium- to high-power optical microscopes (400X), microbalances, optical balances, and similar specialized equipment.
VC-B 60 Adequate for high-power optical microscopes (1,000X), inspection and lithography equipment to 3-micron line widths.
VC-C 54 Appropriate for most lithography and inspection equipment to 1-micron detail size.
VC-D 48 Suitable in most instances for the most demanding equipment, including electron microscopes operating to the limits of their capability.
VC-E 42 The most demanding criterion for extremely vibration-sensitive equipment.
Source: FTA, 2006. a Maximum allowed vibration velocity in any 1/3-octave band over the range of 8 to 80 Hz.
The use of the Detailed Vibration Assessment criteria is illustrated by the example vibration spectrum
(the blue dashed line) shown on Exhibit 4‐3. The maximum level of the vibration spectrum exceeds the
“residential (night)” curve in the 50‐ and 63‐Hz 1/3‐octave bands. For this example, impact would be
predicted for residential land uses and vibration mitigation would need to be evaluated, even though
all of the 1/3‐octave band levels fall below the “residential (day)” curve. Typical sensitive equipment
and their appropriate VC‐curves are listed in Table 4‐6. Note that the FTA Guidance Manual does not
provide a Detailed Vibration Assessment criterion for institutional land uses. However, where the
General Assessment threshold is exceeded and the predicted vibration spectrum is available, it is
reasonable to apply the residential (day) curve of the Detailed Vibration Assessment criteria to assess
impacts. Because institutional land uses are used primarily during the day and the vibration level for
annoyance would not be more stringent than residential land uses, this is a valid approach.
The approach used for the FWLE vibration analysis is that the General Assessment criteria presented in
Table 4‐6 were used to screen for potential vibration impacts. Then the Detailed Assessment criteria
were applied to predict potential impacts and determine whether vibration mitigation would be
warranted. The Detailed Assessment curve for the residential (day) was applied for institutional land
uses and the residential (night) curve was used for residential land uses. The “Office” criterion was
applied to one building close to the alignment, and the “VC‐B” criterion was applied to one medical
laboratory, assuming the use of a high‐power optical microscope.

4.0 Noise and Vibration Impact Criteria
Federal Way Link Extension 4-13 Noise and Vibration Technical Report November 2016
There are some buildings, such as concert halls, recording studios, and theaters, that can be very
sensitive to vibration but do not fit into any of the three categories listed in Table 4‐6 or can be
associated with the curves on Exhibit 4‐3. Because of the sensitivity of these buildings, they usually
warrant special attention during the environmental evaluation of a transit project. Table 4‐7 gives the
FTA criteria for acceptable levels of groundborne vibration and groundborne noise for various
categories of special buildings. The only special building in the FWLE corridor is the new Performing
Arts Center at Federal Way High School.
TABLE 4-7 Groundborne Noise and Vibration Impact Criteria for Special Buildings
Location Groundborne Vibration Impact Levels
(VdB re 1 micro-inch/sec) Groundborne Noise Impact Levels
(VdB re 1 micro-inch/sec)
Concert Halls 65 25
TV Studios 65 25
Recording Studios 65 25
Auditoriums 72 30
Theaters 72 35
Source: FTA, 2006.
4.2.2 Construction Vibration Criteria Groundborne vibration related to human annoyance is generally related to root mean square vibration
levels in VdB. Also, because of the short duration of construction vibration activities, annoyance often
is not a serious issue. However, construction vibration, unlike vibration from train operations, has the
potential to cause damage to structures at very close distances. Construction processes with the
potential of causing structural damage include blasting (which would not be used for the FWLE),
impact hammering, and pile‐driving. Therefore, the primary concern regarding construction vibration
relates to risk of damage. The potential risk of damage from construction vibration generally is
assessed using peak particle velocity (PPV), which is the maximum vibration velocity amplitude
generated by the construction activity. It is considered the appropriate metric for evaluating the
potential for building damage because PPV is related to the stresses that are experienced by buildings.
The vibration damage risk thresholds for different building categories provided in the FTA Guidance
Manual (FTA, 2006) are listed below:
Reinforced concrete, steel, or timber: 0.5 inch per second (in./sec) PPV
Engineered concrete and masonry: 0.3 in./sec PPV
Nonengineered timber and masonry buildings: 0.2 in./sec PPV
Buildings extremely susceptible to vibration damage: 0.12 in./sec PPV
The damage risk criterion of 0.5 in./sec PPV is appropriate for single‐ and multi‐family residences along
the FWLE alignment, and the criterion of 0.12 in./sec PPV is appropriate for extremely fragile buildings.

4.0 Noise and Vibration Impact Criteria
Federal Way Link Extension 4-14 Noise and Vibration Technical Report November 2016
The thresholds for daytime human annoyance due to construction vibration are the same as the
General Assessment criteria applied for vibration from train operations. The following are the criteria
to reduce potential for intrusive vibration at sensitive receivers. These limits are included for reference
only, and they are not intended to be applied to predict impact:
Annoyance to residential buildings during daytime: 0.016 in./sec PPV (72 VdB)
Annoyance to daytime sensitive uses at schools, churches, and other institutional land uses:
0.022 in./sec PPV (75 VdB)

Federal Way Link Extension 5-1 Noise and Vibration Technical Report November 2016
5.0 Noise and Vibration Impact Analysis Assumptions and Methods
This section summarizes the models used to predict future noise and vibration levels for potential
sources of community impacts related to the FWLE. These sources include light rail operation, changes
in traffic related to the project, and construction activities.
5.1 Noise Assumptions and Methods
5.1.1 Transit Noise 5.1.1.1 Light Rail Operational Measures This section describes the assessment approach for noise related to operating the light rail system. This
includes noise from light rail operations, ancillary facilities, and wheel squeal. Sound Transit employs
several operational measures to maintain low noise and vibration levels for its light rail trains.
Table 5‐1 lists operational and maintenance measures that Sound Transit performs on a regular basis
and the benefit that each measure provides.
TABLE 5-1 System-wide Light Rail Operational and Maintenance Measures
Operational Measure System Benefit
Rail grinding, maintenance, and replacement
As rails wear, both noise and vibration levels from light rail operations can increase. By grinding or replacing worn rails or correcting improper track alignment, noise and vibration levels will remain at the projected levels.
Wheel truing and replacement
Wheel truing is a method of grinding down flat spots (commonly called wheel flats) on the vehicle wheels. Flat spots occur primarily because of hard braking. When flat spots occur, they can cause increases in both the noise and vibration levels produced by the light rail vehicles.
Vehicle maintenance Vehicle maintenance includes performing scheduled and general maintenance on items such as air conditioning units, bearings, wheel skirts, and other mechanical units on the light rail vehicles. Keeping the mechanical systems on the light rail vehicles in top condition will also help to maintain the projected levels of noise and vibration.
5.1.1.2 Reference Light Rail Noise Levels Sound Transit modeled noise from light rail operations using the methods described in the FTA
Guidance Manual (FTA, 2006). Input to the model included measured reference noise levels for the
new light rail vehicles that are currently being used on the Central Link light rail system. Reference
measurements for light rail operations were taken along the ballast and tie (B&T) portion of the initial
segment in south Seattle in March 2010. The measured reference noise level is 79 dBA Lmax for a
single‐car train traveling at 40 mph at a distance of 50 ft on B&T track.

5.0 Noise and Vibration Impact Analysis Assumptions and Methods
Federal Way Link Extension 5-2 Noise and Vibration Technical Report November 2016
The speeds used in this analysis are the track design speeds, and
those are generally 55 mph throughout the project corridor,
except on speed‐limited curves and at stations. These speeds
may be higher than actual speeds and assure a conservative
noise impact analysis.
5.1.1.3 Alignment and Special Track Work The plan and profile of the proposed light rail alignment,
including the locations of special track work such as crossovers,
and typical speeds were provided by the FWLE design engineers.
The plan and profile drawings used are included in Appendix F,
Conceptual Design Drawings, of the Final EIS. The design
information provided includes the elevation of the trackway,
type of track (B&T, embedded, and direct‐fixation [DF]) and the
location and design of the station alternatives. The current
design calls for B&T, embedded, and direct‐fixation types of
trackway.
Track crossovers are mechanical devices that enable light rail
cars to be guided from one track to another at a junction point.
Crossovers have a gap in the rails that is necessary for the flange
of the light rail wheels to pass through at the location where the
two tracks cross. As a wheel passes through the gap, there are
increased noise and vibration levels. A frog is a rail‐crossing
structure that allows the train to cross over to another track or
continue moving on the same track. A gap is provided on top of
the frog so that vehicle wheels can pass regardless of which track
is in use. According to the FTA Guidance Manual and
measurements of the Central Link light rail system, standard
frogs can increase noise levels by as much as 8 to 10 dB. Spring‐
rail frogs and movable‐point frogs solve the added noise and
vibration problem by closing the gap on the rails.
Flange‐bearing frogs, another mitigation option,
transfer the vehicle load from the wheel tread to the
wheel flange and raise the light rail car up and over
the gap, reducing noise and vibration levels. Each of
these types of frogs produces noticeably lower noise
levels than standard frogs. Depending on the type of
crossover and angle between the crossover and
mainline track, special frogs can reduce noise levels
between 4 and 8 dBA compared to a standard frog.
Typical Crossover Tracks: Allowing trains to move from one
trackway to another.
Track Types Continuously Welded Rail - Sound Transit uses continuously welded rail on all service tracks, preventing the noise and vibration common to butted rail installations.
Ballasted track - Ballasted track is a track structure consisting of rail, tie plates or fastenings, cross ties, and the ballast/subballast bed supported on a prepared subgrade. The subgrade may be a compacted embankment or fill section, an excavation or cut section, or a bridge structure. Ballasted track is generally the standard for light rail transit routes that are constructed on an exclusive right-of-way.
Direct-fixation track - DF track is a “ballastless” track structure in which the rail is mounted on DF fasteners that in turn are anchored to an underlying concrete slab. DF is generally the standard for light rail transit routes constructed on elevated structure. DF track is also used for construction of at-grade track under unusual circumstances, such as when there is a relatively short segment of at-grade track between two DF track structure decks.
Embedded track - Embedded track can be described as a track structure that is completely encased—except for the tops and gauge sides of the rails—within pavement. Embedded track is generally the standard for light rail transit routes constructed within public streets, pedestrian/ transit malls, or any area where rubber-tired traffic must operate.
(Source: Transportation Research Board, 2012)

5.0 Noise and Vibration Impact Analysis Assumptions and Methods
Federal Way Link Extension 5-3 Noise and Vibration Technical Report November 2016
The type of frogs used for the FWLE would depend on the track type, crossover location, and proximity
of noise‐sensitive properties.
5.1.1.4 Light Rail Warning Bells Sound Transit measured and validated train‐mounted bells on light rail cars in October 2009, with
several supplemental measurements in 2011 and 2012. Consistent with Sound Transit operating rules,
this analysis assumes that train‐mounted bells would be sounded twice as a train enters a station, and
twice when the train leaves the station. The bells produce a maximum noise level of 80 dBA at 50 ft
between 6:00 a.m. and 10:00 p.m. and are reduced to 72 dBA Lmax between 10:00 p.m. and 6:00 a.m.
(although trains would not run between 1:00 a.m. and 5:00 a.m.).
5.1.1.5 Operational Plan The operations plan for this analysis reflects a future build‐out of the regional light rail system
established by the Sound Transit 2 (ST2) Plan (Sound Transit, 2008). It includes all other light rail
expansions funded under ST2 between now and 2035. This assumes light rail service is operating to
Lynnwood Transit Center in the north and Overlake Transit Center in the east when FWLE is
operational. Under this maximized future operational plan, the light rail trains would operate with four
passenger cars during all periods of service.
The operating plan used in the analysis assumes four‐car trains operating between 5:00 a.m. and
1:00 a.m. daily with the following headways:
Peak (6:00 a.m. to 8:30 a.m. and 3:00 p.m. to 6:30 p.m.): 8‐minute headways
Midday and early evening (8:30 a.m. to 3:00 p.m. and 6:30 p.m. to 10:00 p.m.): 10‐minute
headways,
Early morning and late evening (5:00 a.m. to 6:00 a.m. and 10:00 p.m. to 1:00 a.m.): 15‐minute
headways
Vehicle, track, and systems maintenance occurs between approximately 1:00 a.m. and 5:00 a.m. daily,
outside of normal hours of light rail service. Based on preliminary operating plans, about two trains
may be deployed between approximately 4:30 and 5:00 a.m. to stage trains for the beginning of
morning service at FWLE stations. Similarly, about two trains may operate between approximately
1:00 and 1:30 a.m. along the FWLE as they return to the OMFs at the close of service each day.
5.1.1.6 Wheel Squeal and Wheel-Flanging Noise Wheel squeal is caused by the oscillation of the wheel against the rail on curved sections of rail. Sound
Transit measured wheel squeal noise levels at several different locations along the Central Link corridor
and used these measurements as reference data. Based on these measurements, curves with radii of
less than 600 ft can produce maximum wheel squeal noise levels of 80 dBA to 90 dBA at 50 ft.
Research into methods of reducing wheel squeal noise, including using non‐oil‐based lubricants (such
as water) and friction modifiers, has found such methods effectively reduce or eliminate wheel squeal.
The lubricants can be applied by personnel working trackside or by an automated applicator. It is a
general policy of Sound Transit’s light rail design criteria manual (Sound Transit, 2012) to lubricate all

5.0 Noise and Vibration Impact Analysis Assumptions and Methods
Federal Way Link Extension 5-4 Noise and Vibration Technical Report November 2016
curves with a radius of less than 600 ft that are located in noise‐sensitive areas, and preparing all
curves with a radius of less than 1,250 ft for lubrication. This means that if wheel squeal is identified on
these curves that are between 600 and 1,250 ft after system operation begins, it is possible to add
lubricators.
5.1.1.7 Light Rail Noise Projections Noise impacts that would result from the FWLE light rail operations were determined through the
following approach:
Sound Transit performed a land use survey of potential noise‐sensitive receptors near the
proposed light rail alignments. This process involved site visits and use of land‐use maps and
information.
Sound Transit conducted long‐term (multi‐day) and short‐term (15‐ to 20‐minute) noise monitoring
to establish existing noise levels for the potentially affected area. Ambient noise monitoring was
taken at 97 locations along the project corridor, with 72 taken during the Draft EIS phase of the
project. An additional 25 sites were taken prior to completing the Final EIS, with the new data used
to supplement the traffic studies and support the previous 72 sites. The criteria for selecting the
monitoring locations included land use, existing ambient noise, number of sensitive receivers in the
area, and level of expected impact.
Field noise measurements were used to develop a set of existing ambient sound levels for the
noise‐sensitive receptors.
Existing ambient sound levels were used to determine the noise impact criteria. The FTA criteria for
noise impacts are based on the existing noise level and land use.
Projections of light rail noise levels were made based on track type, train speed, number of
passenger cars, and distance of receiver from tracks, with adjustments for shielding and ground
attenuation. Adjustments based on track type, sound walls, elevated acoustical walls, and trench
situations are shown in Table 5‐2. Sound attenuation related to physical shielding from the
elevated structure and other existing and planned structures was included in the analysis using
acoustical formulas from the FTA Guidance Manual (FTA, 2006). Noise related to bells at stations
and special track work was included in the analysis.
Measured noise level reductions from existing noise barriers installed on the elevated guideway in
Tukwila, Washington along the Central Link Light Rail System were used to assist in the final
mitigation predictions.
Sound Transit evaluated noise projections with respect to the FTA impact thresholds to determine
whether a receiver would be affected by light rail operations.
Where noise impacts were identified, mitigation recommendations followed the Sound Transit
Noise Mitigation Policy and the FTA Guidance Manual.

5.0 Noise and Vibration Impact Analysis Assumptions and Methods
Federal Way Link Extension 5-5 Noise and Vibration Technical Report November 2016
TABLE 5-2 Light Rail Track-type and Shielding Adjustments
Track Type Adjustment in Decibels (dB)
At-grade B&T track (ballast exposed) 0
Elevated Structure B&T track (ballast exposed) +1
Elevated structure (direct-fixation track) +4
Embedded track or retained-fill trackway (direct-fixation) +3
Track Crossover (standard) +10 at 35 ft. Based on measured data during normal operations along the Link initial segment
Trench and retained cuts where the trackway is at least 4 to 6 ft below grade.
Typical reduction of 5 decibels or more, as predicted using FTA formulas and verified with measured data during normal operations along the Tukwila segment
Acoustical sound walls on structure between 4 and 6 ft above the top of rail with some going as high as 8 ft. Walls on structure over 8 ft are not normally used because of wind loading and safety concerns.
Typical noise reduction of 8 to 15 decibels or more, as predicted using FTA formulas and verified with measured data during normal operations along the Tukwila segment
Sound wall at-grade with an expected height of at least 6 ft above the grade of the trackway. An at-grade sound wall can go as high as 20 ft or more; however, for an at-grade light rail only mitigation, the typical heights range from 4 to 8 ft.
Typical noise reduction of 8 to 12 decibels or more, as predicted using FTA formulas and verified with measured data during normal operations along the Tukwila segment
5.1.1.8 Park-and-Ride Noise Projections Sound Transit calculated operational noise levels from buses and vehicles accessing newly constructed
parking at stations under the FWLE using the methods outlined in the FTA Guidance Manual (FTA,
2006). Future bus and passenger traffic volumes for the new park‐and‐ride facilities are based on the
predicted maximum number of parking spots, peak‐hour bus operations, and hourly bus operation
throughout the day, evening, and nighttime hours at each facility. Sound Transit used future park‐and‐
ride operations to determine the noise levels at the residential areas near the proposed facilities.
As previously stated in Section 4.1.3, ancillary facilities must not only meet the FTA criteria but also the
applicable state, county, or city criteria for noise. To identify potential impacts, Sound Transit projected
operational noise levels for two different conditions:
Typical 24‐hour average Ldn
Peak hour Leq
Sound Transit’s noise analysis team calculated operational noise levels for the park‐and‐ride facilities at
the nearest representative receivers’ property lines. Sound Transit projected the 24‐hour Ldn and the
peak‐hour Leq using the methods described in the FTA Guidance Manual (FTA, 2006). The noise
analysts obtained future hourly bus volumes and park‐and‐ride lot access times from Sound Transit.
The daily Ldn noise levels were compared to the FTA noise regulations provided in Section 4.1.1. The
peak‐vehicle‐hour Leq was compared to the appropriate city or state ordinance described in
Section 4.1.3.
The proposed park‐and‐ride facility sites are considered commercial uses under local noise control
ordinances. As discussed in Section 4.1.3, the maximum allowable noise level for a commercial use
next to a residential use is 57 dBA at the property line. The noise impact analysis under the local noise
control ordinances is applicable to all passenger vehicles and buses only while they are on park‐and‐

5.0 Noise and Vibration Impact Analysis Assumptions and Methods
Federal Way Link Extension 5-6 Noise and Vibration Technical Report November 2016
ride facility property. Buses on public roadways, or at existing bus stops on public roadways, are
exempt under local noise control ordinances. The contribution of cars accessing the station was
predicted using the number of parking spots and reference noise levels from the FTA (FTA, 2006).
For the local code noise analysis, Sound Transit projected the peak‐hour Leq using the methods in the
FTA Guidance Manual. Sound Transit then compared the projected peak‐hour Leq with the daily
maximum allowable noise level. The maximum allowable noise level for commercial uses is 62 dBA
during daytime (7:00 a.m. to 10:00 p.m.) and 52 dBA during nighttime (10:00 p.m. to 7:00 am).
Tables 5‐3 through 5‐6 summarize the operational features used in this analysis associated with the
stations and station options for each FWLE build alternative.
TABLE 5-3 Preferred Alternative Park-and-Ride Analysis
Station Operational
Analysis Park-and-
Ride Parking Spacesa
Park-and-Ride Bus
Right-of-Way Notes
Kent/Des Moines Required Yes 1,000 Yes 500 structure spaces and 500 surface parking spaces
S 272nd Star Lake Required Yes 1,240 Yes 700 new and 540 existing spaces; all structure parking
Federal Way Transit Center
Required Yes 1,590 Yes 400 new; all structure parking, in addition to 1,190 existing parking spaces at existing transit center
Station Options
Kent/Des Moines I-5 Required Yes 1,000 Yes 500 structure spaces and 500 surface parking spaces
Kent/Des Moines At-Grade Required Yes 1,000 Yes 500 structure and 500 surface parking
Federal Way I-5 Required Yes 1,590 Yes 400 new; all structure parking, in addition to 1,190 existing parking spaces at existing transit center
Federal Way S 320th Park-and-Ride
Required Yes 1,277 Yes 400 new; all structure parking, in addition to 877 existing parking spaces at existing transit center
a Parking spaces based on current conceptual design drawings assuming the maximum (i.e., interim terminus condition) parking supply at any one park-and-ride location.
TABLE 5-4 SR 99 Alternative Park-and-Ride Analysis
Station Operational
Analysis Park-
and-Ride Parking Spacesa
Bus Circulation and layover
area Notes
Kent/Des Moines SR 99 West
Required Yes 1,000 Yes 500 structure spaces and 500 surface parking spaces
S 272nd Redondo Required Yes 1,397 Yes 700 new and 697 existing; all structure parking
Federal Way Transit Center
Required Yes 1,590 Yes 400 new; all structure parking, in addition to 1,190 existing parking spaces at existing transit center
Station Options
S 216th West Not Required No 0 No Park-and-ride with bus stop on SR 99
S 216th East Not Required No 0 No Park-and-ride with bus stop on SR 99
Kent/Des Moines HC Campus
Required Yes 1,000 Yes 500 structure spaces and 500 surface parking spaces (not including 520 Highline College replacement parking spaces)
Kent/Des Moines SR 99 Median
Required Yes 1,000 Yes 500 structure spaces and 500 surface parking spaces
Kent/Des Moines SR 99 East
Required Yes 1,000 Yes 500 structure and 500 surface parking

5.0 Noise and Vibration Impact Analysis Assumptions and Methods
Federal Way Link Extension 5-7 Noise and Vibration Technical Report November 2016
TABLE 5-4 SR 99 Alternative Park-and-Ride Analysis
Station Operational
Analysis Park-
and-Ride Parking Spacesa
Bus Circulation and layover
area Notes
S 260th West Not Required No 0 No Park-and-ride with bus stop on SR 99
S 260th East Not Required No 0 No Park-and-ride with bus stop on SR 99
S 272nd Redondo Trench
Required Yes 1,397 Yes 700 new and 697 existing; all structure parking
Federal Way SR 99 Required Yes 1,590 Yes 400 new; all structure parking, in addition to 1,190 existing parking spaces at existing transit center
a Parking spaces based on current conceptual design drawings assuming the maximum (i.e., interim terminus condition) parking supply at any one park-and-ride location. HC = Highline College
TABLE 5-5 SR 99 to I-5 Alternative Park-and-Ride Analysis
Station Operational
Analysis
Park-and-Ride
Parking Spacesa
Park-and-Ride Bus
Right-of-Way Notes
Kent/Des Moines 30th Avenue East Required Yes 1,000 Yes 500 structure and 500 surface parking
S 272nd Star Lake Required Yes 1,240 Yes 700 new; all structure parking
Federal Way Transit Center Required Yes 1,590 Yes Structure parking
Station Options
S 216th West Not Required No 0 No Park-and-ride with bus stop on SR 99
S 216th East Not Required No 0 No Park-and-ride with bus stop on SR 99
Federal Way I-5 Required Yes 400 Yes Structure parking
Federal Way S 320th Park-and-Ride Required Yes 1,277 Yes 400 new; all structure parking
a Parking spaces based on current conceptual design drawings assuming the maximum (i.e., interim terminus condition) parking supply at any one park-and-ride location.
TABLE 5-6 I-5 to SR 99 Alternative Park-and-Ride Analysis
Station Operational
Analysis Park-
and-Ride Parking Spacesa
Park-and-Ride Bus
Right-of-Way Notes
Kent/Des Moines 30th Avenue West
Required Yes 1,000 Yes 500 structure and 500 surface parking
S 272nd Redondo Required Yes 1,397 Yes 700 new and 697 existing; all structure parking
Federal Way Transit Center
Required Yes 1,590 Yes 400 new; all structure parking, in addition to 1,190 existing parking spaces at existing transit center
Station Options
S 260th West Not Required No 0 No Park-and-ride with bus stop on SR 99
S 260th East Not Required No 0 No Park-and-ride with bus stop on SR 99
S 272nd Redondo Trench Required Yes 1,397 Yes 700 new and 697 existing; all structure parking
Federal Way SR 99 Required Yes 1,590 Yes 400 new; all structure parking, in addition to 1,190 existing parking spaces at existing transit center
a Parking spaces based on current conceptual design drawings assuming the maximum (i.e., interim terminus condition) parking supply at any one park-and-ride location.

5.0 Noise and Vibration Impact Analysis Assumptions and Methods
Federal Way Link Extension 5-8 Noise and Vibration Technical Report November 2016
5.1.2 Traffic Noise Upon completion of the FWLE, traffic noise levels in certain areas of the project corridor could increase
as the result of new roads and the removal of existing buildings, noise barriers, and earthen shielding.
This potential to create or increase exposure to traffic noise as a result of the transit project is
described below.
Detailed traffic noise modeling was performed for certain areas along the Preferred Alternative that
might experience an increase in traffic noise levels. As described in Section 4.1.2, potential traffic noise
impacts associated with the FWLE were identified using FHWA criteria. Because all three of the FHWA
transit‐only project criteria described in Section 4.1.2 are met by the FWLE, potential traffic noise
impact mitigation measures were analyzed in a manner consistent with FTA methods and the Sound
Transit Noise Mitigation Policy. Thus, the traffic noise modeling analysis consisted of the following
steps:
1. Traffic noise levels were predicted using TNM, FHWA’s traffic noise model software.
2. Traffic noise models for each area analyzed were validated using measured noise levels and
actual traffic counts taken during the measuring periods at various locations along the project
corridor.
3. Once each traffic noise model was validated, it was used to model existing and future (year
2035) No Build conditions in each study area at receivers selected to be representative of
homes throughout the study area. Existing and No Build traffic volumes, vehicle percentages
and speeds provided by the Final EIS transportation analysts were used for this purpose.
Existing condition traffic noise levels were modeled for informational purposes and to establish
the baseline traffic noise levels along the study areas. No Build conditions were used to
evaluate traffic noise impacts at locations where existing buildings, noise barriers, berms or
other acoustical shielding are being removed or relocated as part of the FWLE.
4. Future conditions for each study area were also modeled in TNM using future year 2035 build
traffic volumes and vehicle percentages provided by the transportation analysts. Future
conditions modeled include the FWLE Preferred Alternative without the SR 509 Extension and
the FWLE Preferred Alternative with the SR 509 Extension. Cut and fill walls that would be
constructed as part of the project and could have acoustical implications were included in the
noise model.
5. For areas with new and realigned roads as a direct result of the FWLE, potential traffic noise
impacts were determined by applying the criteria set forth in Section 4.1.2. Traffic noise
impacts resulting from FWLE roadway realignments were only determined for roadways where
the realignment is considered substantial. To be considered a substantial realignment, the
realignment must result in an increase of 3 dB. The 3 dB criteria is based on the fact that it
takes a 3 dB change in traffic noise for an average person to discern a change in the overall
noise levels.
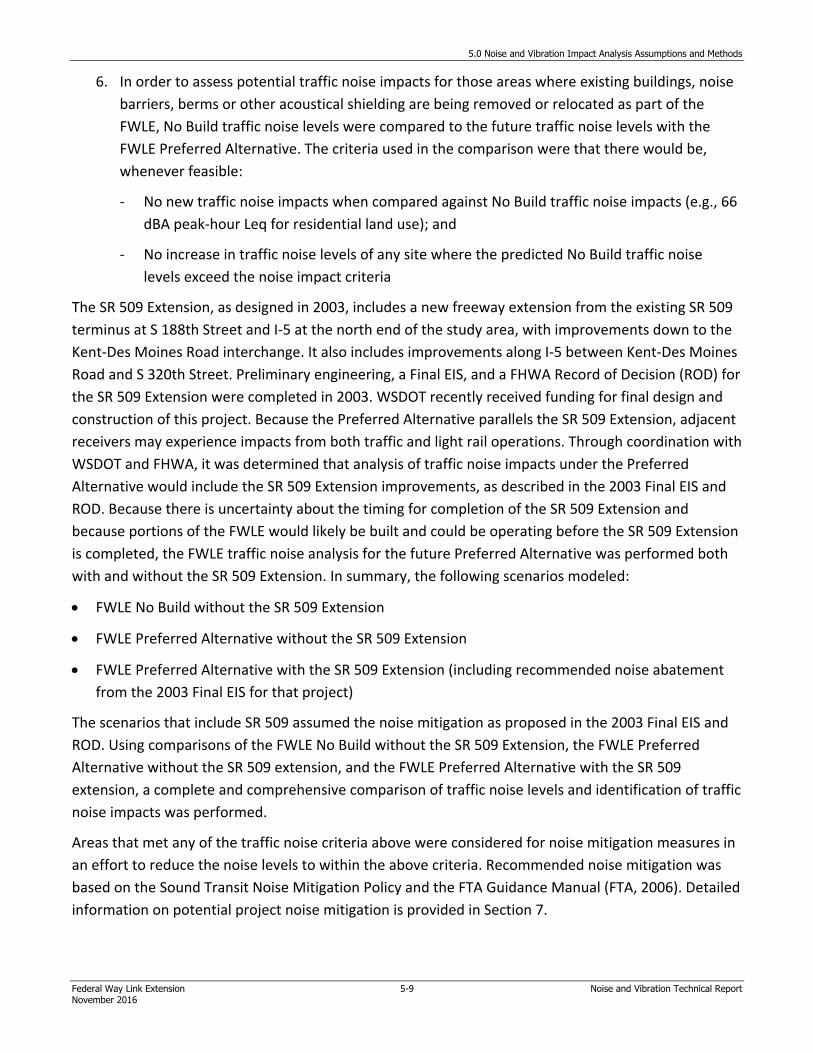
5.0 Noise and Vibration Impact Analysis Assumptions and Methods
Federal Way Link Extension 5-9 Noise and Vibration Technical Report November 2016
6. In order to assess potential traffic noise impacts for those areas where existing buildings, noise
barriers, berms or other acoustical shielding are being removed or relocated as part of the
FWLE, No Build traffic noise levels were compared to the future traffic noise levels with the
FWLE Preferred Alternative. The criteria used in the comparison were that there would be,
whenever feasible:
‐ No new traffic noise impacts when compared against No Build traffic noise impacts (e.g., 66
dBA peak‐hour Leq for residential land use); and
‐ No increase in traffic noise levels of any site where the predicted No Build traffic noise
levels exceed the noise impact criteria
The SR 509 Extension, as designed in 2003, includes a new freeway extension from the existing SR 509
terminus at S 188th Street and I‐5 at the north end of the study area, with improvements down to the
Kent‐Des Moines Road interchange. It also includes improvements along I‐5 between Kent‐Des Moines
Road and S 320th Street. Preliminary engineering, a Final EIS, and a FHWA Record of Decision (ROD) for
the SR 509 Extension were completed in 2003. WSDOT recently received funding for final design and
construction of this project. Because the Preferred Alternative parallels the SR 509 Extension, adjacent
receivers may experience impacts from both traffic and light rail operations. Through coordination with
WSDOT and FHWA, it was determined that analysis of traffic noise impacts under the Preferred
Alternative would include the SR 509 Extension improvements, as described in the 2003 Final EIS and
ROD. Because there is uncertainty about the timing for completion of the SR 509 Extension and
because portions of the FWLE would likely be built and could be operating before the SR 509 Extension
is completed, the FWLE traffic noise analysis for the future Preferred Alternative was performed both
with and without the SR 509 Extension. In summary, the following scenarios modeled:
FWLE No Build without the SR 509 Extension
FWLE Preferred Alternative without the SR 509 Extension
FWLE Preferred Alternative with the SR 509 Extension (including recommended noise abatement
from the 2003 Final EIS for that project)
The scenarios that include SR 509 assumed the noise mitigation as proposed in the 2003 Final EIS and
ROD. Using comparisons of the FWLE No Build without the SR 509 Extension, the FWLE Preferred
Alternative without the SR 509 extension, and the FWLE Preferred Alternative with the SR 509
extension, a complete and comprehensive comparison of traffic noise levels and identification of traffic
noise impacts was performed.
Areas that met any of the traffic noise criteria above were considered for noise mitigation measures in
an effort to reduce the noise levels to within the above criteria. Recommended noise mitigation was
based on the Sound Transit Noise Mitigation Policy and the FTA Guidance Manual (FTA, 2006). Detailed
information on potential project noise mitigation is provided in Section 7.

5.0 Noise and Vibration Impact Analysis Assumptions and Methods
Federal Way Link Extension 5-10 Noise and Vibration Technical Report November 2016
5.2 Vibration Assumptions and Methods
5.2.1 Sources of Light Rail Vibration Both the construction and operation of a light rail system generate vibration that is transmitted
through the ground and into nearby buildings. It is rare for the vibration to be high enough to create a
risk of structural damage to buildings. However, it is possible for construction vibration to approach
risk thresholds for minor cosmetic damage. Construction and light rail operations both have the
potential to generate vibration that may be intrusive to building occupants. The following vibration
sources are associated with light rail systems:
Train operations: Light rail operations can create groundborne vibration that can be intrusive to
occupants of buildings close to the tracks. However, light rail operation vibration levels in general
are well below the thresholds used to protect sensitive and fragile structures from damage. A key
assumption in the vibration predictions is that optimal wheel and rail profiles would be maintained
for the system through periodic truing of the wheels and rail grinding.
Special track work: The wheel impacts at the frogs used at special track work for turnouts and
switches increases vibration levels. A “frog” is a rail‐crossing structure at track crossovers that
allows the train to cross over to another track or continue moving on the same track. Flange‐
bearing frogs can reduce the impact of vibration. However, ramps on typical flange‐bearing frogs
are short enough that the transfer of the load is quite abrupt and generates substantial vibration in
addition to noise. Use of flange‐bearing frogs with longer ramps can reduce the vibration from
special track work. Spring‐rail and movable‐point frogs can also reduce vibration substantially,
although they are more expensive in terms of parts, installation, and maintenance. Monoblock
frogs (milled out of a single block of steel, eliminating all rail joints and creating a smoother running
surface) provide some reduction in vibration levels, and, although not as effective as moveable‐
point frogs, are less expensive and easier to maintain.
5.2.2 Light Rail Vibration Prediction Methods The predictions of groundborne vibration for this study follow the Detailed Vibration Assessment
procedure of the FTA Guidance Manual (FTA, 2006). This is an entirely empirical method based on
testing of the vibration propagation characteristics of the soil in the project corridor and
measurements of the vibration characteristics of a similar light rail vehicle. As discussed in Section 3.0,
vibration propagation tests were performed at 20 locations in the proposed corridor for the FWLE. The
quantity derived from the propagation tests is referred to as the LSTM. The basic relationship used for
the vibration predictions is:
Lv = FDL + LSTM
where:
Lv = Train vibration velocity measured at the ground surface
LSTM = Measured line source transfer mobility

5.0 Noise and Vibration Impact Analysis Assumptions and Methods
Federal Way Link Extension 5-11 Noise and Vibration Technical Report November 2016
FDL = Force density level, a function that characterizes the vibration forces generated
by the train and track
(All quantities are expressed in decibels to use a consistent set of decibel reference values)
FDL is derived by measuring Lv and LSTM at a site where there are light rail vehicle operations. The FDL
used in this analysis is based on measured FDL values of the existing Sound Transit Central Link light rail
system (Rajaram and Wolf, 2014). Measurements were taken on at‐grade ballast‐and‐tie (B&T) track,
DF track in a trench, and DF track on an elevated structure to determine the FDL for different track
types. The FDL depends on speed, and the measured FDLs were available for DF tracks at 20, 25, 30,
35, 40, 45, 50, and 55 mph. The FDLs at all intermediate operational speeds for the FWLE were
estimated by interpolating the measured values. For the B&T track sections, measured FDLs were
available at 20, 25, 30, and 35 mph. The B&T track FDLs at all other speeds were calculated by using
the speed‐vibration relationship from the DF track and applying it to the measured B&T values.
The FDLs used for this analysis are shown on Exhibits 5‐1 and 5‐2. The FDLs show broad peaks at 10 Hz
and 50 Hz for DF track and at 10 Hz and 63 Hz for B&T track. Above 160 Hz, the FDLs on Exhibits 5‐1
and 5‐2 are shown in gray because there was a high level of uncertainty at these frequencies in the
measured data. At these higher frequencies, the FDL would tend to overpredict the vibration levels. A
key assumption of the vibration model is that a low FDL would be maintained over the years through a
program that maintains the desired wheel and rail profiles and proactively eliminates wheel flats.
EXHIBIT 5-1 Force Density of DF Tracks at Different Speeds for Three-car Trains

5.0 Noise and Vibration Impact Analysis Assumptions and Methods
Federal Way Link Extension 5-12 Noise and Vibration Technical Report November 2016
EXHIBIT 5-2 Force Density of B&T Tracks at Different Speeds for Three-car Trains
The LSTM results are discussed in Section 3.3. For the initial analysis, the approach used for predicting
vibration from the operations of the FWLE system was to use a combined LSTM model that is an
average of the measured LSTM from the first 12 vibration test sites (V‐1 through V‐12). Because the
LSTM measurements were fairly consistent across all sites, this is a reasonable approximation of the
actual LSTM over the study area for the initial analysis. For the Preferred Alternative refined analysis,
area‐specific LSTM models were applied as indicated in Table 5‐7; some are based on single‐site
measured LSTM values (both surface and borehole), and some are based on averages of surface LSTM
data collected in the same general area along the alignment. For the Preferred Alternative Analysis, the
LSTM data included data collected in November 2015 and January 2016. The LSTM subsurface data
collected using boreholes was applied in the trench areas along the alignment. The best‐fit coefficients
derived from the LSTM data for each vibration propagation site and used in the prediction model are
shown in Appendix E.
The predictions for the FWLE indoor vibration include an adjustment factor of +5 dB to each 1/3rd
octave band to account for potential uncaptured amplification effects inside buildings and to provide a
safety factor for other sources of uncertainty in the predictions. When vibration is propagated from the
ground to the building foundation, there is loss in vibration energy at the building’s interface with the
ground, which is commonly referred to as coupling loss. For the combined effect of coupling loss and
floor amplification, the FTA Guidance Manual recommends a net adjustment of +1 dB for the vibration
inside a typical residence. A recent Transit Cooperative Research Program study based on 35 outdoor‐
indoor vibration measurements in several cities in North America showed an average outdoor‐indoor
amplification of 0 dB with a standard deviation of approximately 5 dB (Zapfe et al., 2009, and
McKenna, 2011).

5.0 Noise and Vibration Impact Analysis Assumptions and Methods
Federal Way Link Extension 5-13 Noise and Vibration Technical Report November 2016
TABLE 5-7 LSTM Applied by Area
Area of Preferred Alternative LSTM Applied
(refer to Appendix E for coefficient values)
North of S 221st St Average of V1, V2, and V18
S 221st St to Kent-Des Moines Rd Average of V3 and V17
Kent-Des Moines Rd to S 252nd St V4
S 252nd St to S 260th St plus ID 2622 V5
S 260th St to S 272nd St (except ID 2622) and S 272nd St to Military Rd V6
Military Rd to S 288th St and S 288th St to S 304th St V9
30432 Military Rd S V16a
S 304th St to Federal Way Transit Center Average of V11 and V20
In vicinity of S 216th St trench V13 (subsurface)
In vicinity of S 272th St trench V14 (subsurface)
In vicinity of S 317th St trench V15 (subsurface)
a It was determined that data collected at this site should apply to only the one property due to the site characteristics and measurement distance limitations.
With the exception of the Preferred Alternative analysis, it was assumed that the coupling loss and
building amplification was a net 0 dB effect. The adjustment factor of +5 dB is a conservative approach
that ensures that in the majority of cases the predicted vibration levels are higher than what would
occur after the proposed project is operational.
Because additional vibration measurements including indoor locations were performed at several sites
for trench areas along the Preferred Alternative, detailed indoor amplification information was
available for representative buildings along this alternative. Therefore, based on additional
measurement data, the following assumptions were applied to different building types along the
Preferred Alternative:
For single‐family homes, FTA guidance was followed in applying a net adjustment of +1 dB. This was
also applied to the few schools and churches in the area.
Where indoor LSTM data were measured, the measured outdoor‐to‐indoor amplification for each
1/3rd‐octave band was applied. Measurements were available for three multi‐family residences.
For all other multi‐family residences and hotels, a linear average of the three measured building
responses was applied, also on a 1/3rd‐octave band basis. The measured building amplification is
shown in Exhibit 5‐3.
For all alternatives, the vibration predictions for the FWLE assumed that 4‐car trains would be
operated. Because the FDLs on Exhibit 5‐1 and Exhibit 5‐2 are for three‐car trains, a +0.5 dB adjustment
was included in the vibration predictions to account for longer trains. Also, the attenuation due to
elevated structures is applied where appropriate; as shown in Exhibit 5‐4, the elevated structure would
reduce vibration levels by up to 10 dB at peak frequencies (Rajaram and Wolf, 2014).

5.0 Noise and Vibration Impact Analysis Assumptions and Methods
Federal Way Link Extension 5-14 Noise and Vibration Technical Report November 2016
EXHIBIT 5-3 Vibration Amplification Measured at Three Properties (IDs shown in legend) and Average Applied to Other Multi-Family Residences and Hotels
EXHIBIT 5-4 Vibration Reduction Resulting from Elevated Structure
In summary, for the detailed analyses, the following adjustments were applied to estimate vibration
levels in occupied spaces of buildings:
+5 dB safety factor.
+0.5 dB to account for four‐car trains (the FDLs were measured with 3‐car trains).
0.0
2.0
4.0
6.0
8.0
10.0
12.0
14.0
16.0
18.0
20.0
5 6.3 8 10 12.5 16 20 25 31.5 40 50 63 80 100 125 160 200 250 315
Amplification (VdB)
Frequency (Hz)
Building Adjustment Factors
V18 V19 V20 Average

5.0 Noise and Vibration Impact Analysis Assumptions and Methods
Federal Way Link Extension 5-15 Noise and Vibration Technical Report November 2016
Special track work: The additional vibration at special track work was accounted for by assuming a
+10 dB amplification at distances less than 35 ft. At distances greater than 35 ft from the crossover
frogs, the amplification was assumed to attenuate at the rate of 10*log (distance/35), a
conservative decay rate.
Elevated structures: The vibration reduction from the elevated structure was assumed to be 10 dB
at all frequencies except 10 Hz and 12 Hz (Exhibit 5‐4). The curve on Exhibit 5‐4 is based on
measurements from the Central Link aerial structure FDL tests.
Coupling loss/building amplification (only included for the Preferred Alternative):
‐ A net effect of +1 dB for coupling loss/building amplification was applied to all structures except
multi‐family residences and hotels. This includes buildings such as single‐family residences,
schools, and churches.
‐ For the three multi‐family residences where building amplification was measured directly, the
measured value was applied (shown in Exhibit 5‐3).
‐ For all other multi‐family residences and hotels, the average amplification as seen in Exhibit 5‐3
was applied. For the average, there is substantial amplification in the 20‐ to 50‐Hz range, up to
8 dB from 25 to 40 Hz.
For determining vibration impacts at the sensitive receivers, the predicted level in the maximum
1/3rd‐octave band is compared to the appropriate vibration limit as described in Section 4.2.The
relationship between the predicted groundborne vibration, LV, and the predicted groundborne noise,
LA, is:
LA = LV + Ka‐wt + Krad
where Ka‐wt is the A‐weighting adjustment at the 1/3rd‐octave band center frequency and Krad is an
adjustment to account for the conversion from vibration velocity level to sound pressure level such as
any acoustical absorption in the room. The FTA guidance manual recommends a Krad value of zero for
typical residential rooms; however, recent research indicates a Krad value of ‐5 dB may be more
accurate. This analysis assumes a Krad value of ‐5 dB for all sensitive receivers.
As shown in the equation above, the groundborne noise level, LA, represents a maximum noise level
(Lmax, since it was calculated from a maximum vibration level). The groundborne noise is then
converted to Ldn and Leq, the residential metric and institutional metric, respectively, used in the
noise assessment. This conversion was not done for the initial analysis for the special building because
of its high sensitivity to groundborne noise inside the building. The conversion is accomplished by first
converting the Lmax value to the SEL value, then calculating the Ldn and Leq values based on train
operations (as described in Table E‐1 in the FTA Guidance Manual). The resulting Ldn and Leq sound
levels are then compared to the appropriate groundborne noise limit as described in Section 4.2.

This page intentionally left blank.

Federal Way Link Extension 6-1 Noise and Vibration Technical Report November 2016
6.0 Impact Assessment
6.1 Transit Noise Impacts Sound Transit performed a detailed noise impact assessment based on the criteria discussed in
Section 4 using the methods and projections described in Section 5 of this report. For areas with noise
impacts, potential noise mitigation measures are described in Section 7. Assessment details, including
complete tabulated data of the project parcel identification, existing noise levels, project noise levels,
criteria, and other information, are provided in Appendix B, Detailed Noise Impact Assessment Data.
6.1.1 Noise Impacts from Light Rail Table 6‐1 shows the moderate and severe noise impacts for each of the four build alternatives and the
number of additional or fewer impacts that each station option would have when compared to the
alternative. The light rail noise analysis was updated from the Draft EIS for all alternatives to reflect the
proposed operating schedule for the FWLE. In general, the number and severity of noise impacts have
been reduced.
TABLE 6-1 Summary of Potential Moderate and Severe Noise Impacts from Light Rail
Alternative
Light Rail Impacts
Moderate Severe
Preferred Alternative 528 119
Kent/Des Moines Station Options
Kent/Des Moines I-5 Station Option -29 --
Kent/Des Moines At-Grade Station Option +7 +7
Landfill Median Alignment Option +41 --
S 272nd Star Lake Elevated Station Option +54 +10
S 317th Elevated Alignment Option +112 +0
Federal Way City Center Station Options
Federal Way I-5 Station Option +45 --
Federal Way S 320th Park-and-Ride Station Option -4 +1
SR 99 Alternative 1,463 803
S 216th Station Options
S 216th West Station Option -151 -50
S 216th East Station Option -21 +17
Kent/Des Moines Station Options
Kent/Des Moines HC Campus Station Option +62 +99
Kent/Des Moines HC from S 216th West Station Option -487 -115
Kent/Des Moines SR 99 Median Station Option +40 -4
Kent/Des Moines SR 99 East Station Option -22 -18
S 260th Station Options
S 260th West Station Option -56 -32

6.0 Impact Assessment
Federal Way Link Extension 6-2 Noise and Vibration Technical Report November 2016
TABLE 6-1 Summary of Potential Moderate and Severe Noise Impacts from Light Rail
Alternative
Light Rail Impacts
Moderate Severe
S 260th East Station Option -17 -19
S 272nd Redondo Trench Station Option -113 -326
Federal Way SR 99 Station Option -21 +68
SR 99 to I-5 Alternative 902 298
S 216th Station Options
S 216th West Station Option -151 -50
S 216th East Station Option -21 +17
Federal City Center Station Options
Federal Way I-5 Station Option +88 --
Federal Way S 320th Park-and-Ride Station Option +16 --
I-5 to SR 99 Alternative 1,084 776
S 260th Station Options
S 260th West Station Option -44 -3
S 260th East Station Option -17 -19
S 272nd Redondo Trench Station Option -113 -326
Federal Way SR 99 Station Option -21 +68
6.1.1.1 No Build Alternative Without the FWLE, there would be no transit noise impacts in the study area due to operation of light
rail.
6.1.1.2 Preferred Alternative There would be moderate noise impacts on 528 units and severe noise impacts on 119 units with the
Preferred Alternative. The impacts would be distributed throughout the entire length of the
alternative, and many of the properties where impacts would occur are multi‐family complexes or
motels, which increases the number of impacts. The number and severity of noise impacts are reduced
from what was estimated in the Draft EIS due to an updated operational schedule, noise‐reducing
effects of the parapet on the elevated structures, and physical shielding of retaining walls and retained
slopes in areas where the alignment is below grade. Parapet shielding is caused by the base and the
curb along the sides of the elevated structure. Receivers that are located below the structure can be
shielded from the far track train by the structure and the structure’s parapet, or short concrete curb.
Parapet shielding can reduce noise from the far track by up to 6 to 8 dB. Because noise from the near
track is still dominant, the overall reduction from both trains is typically 2 to 3 dB when compared to
an unshielded pair of trains. The noise reduction characteristics from parapet shielding were verified
with measured data of Sound Transit’s fleet of light rail vehicles along the Link light rail in Tukwila.
Placing the train in a retained cut is also an effective method of reducing noise, and depending on the
depth of the cut, can be far more effective at reducing noise then a parapet. Examples of parapet and
retained cut shielding are shown on Exhibit 6‐1.

6.0 Impact Assessment
Federal Way Link Extension 6-3 Noise and Vibration Technical Report November 2016
Angle Lake to Kent/Des Moines Severe noise impacts were identified at the upper floors of the Sleep Inn motel, at single‐family homes
on S 211th Street and 32nd Avenue S north of S 212th Street, and at multi‐family units on 30th
Avenue S, north of Kent‐Des Moines Road. Moderate impacts were identified at the following locations
and areas:
Hotels along SR 99, including the Skyway Inn, the America’s Best Value Inn, and the Sleep Inn
(lower floors)
Multi‐family complexes, including the Newport Village Condominiums, the Heritage Court
Condominiums, and the Silverwood Apartments, all on 30th Avenue S between S 228th Street and
Kent Des Moines Road
Smaller multi‐family buildings on 31st Lane S near S 208th Street, S 224th Place, S 225th Place, and
30th Avenue South near S 227th Street
Firs Mobile Home Park on SR 99 just south of S 204th Street, the Sound Vista Mobile Home Park off
of S 220th Street, and Green Acres Mobile Home Park on 30th Avenue S
EXHIBIT 6-1Example of Acoustical Shielding from Structure Parapet and a Retained Cut

6.0 Impact Assessment
Federal Way Link Extension 6-4 Noise and Vibration Technical Report November 2016
Single‐family residences on S 211th Street, S 208th Street, 31st Avenue S, S 224th Street, 30th
Avenue S, and at Park of the Pines Conference Center
There is a current proposal to close the Firs Mobile Home Park and relocate the tenants. If this occurs
prior to the FWLE, this would reduce impacts by 12.
Kent/Des Moines to S 272nd No severe impacts were identified in this area. Moderate impacts were identified in the following
areas:
Multi‐family units at the Briarwood and Highline Court Apartments, both located between Kent‐
Des Moines Road and S 240th Street and the Pembrooke Apartments on S 259th Place
Midway Mobile Home Mansions (near S 244th Street)
Single‐family residences on S 252nd Street, S 253rd Street, S 259th Court, and 30th Avenue S near
S 260th Street
S 272nd to Federal Way Transit Center In this area, there are severe noise impacts predicted at a single‐family home on Star Lake Road near
Military Road and a single‐family home on Military Road S near S 304th Street. Moderate impacts in
this area were identified at:
Providence Landing Apartments on 28th Avenue S at S 312th Street, the Kandila Townhomes on
28th Avenue S just north of S 317th Street, and the Chelsea Court condominiums on S 317th Street
Camelot Square Mobile Home Park, south of S 288th Street
Single‐family residences on 27th Avenue S and on Star Lake Road, all just north of Military Road,
between Military Road S and S 288th Street, near Military Road S and S 304th Street, and on 28th
Avenue S south of S 304th Street.
Mark Twain Elementary School, located just south of S 272nd Street, is predicted to be well below the
FTA noise impact criteria because the alignment would be in a deep, lidded trench (tunnel) between I‐5
and the school.
There are no FTA Category 3 noise impacts under the Preferred Alternative or any of the options
described below.
Kent/Des Moines Station Options With the Kent/Des Moines I‐5 Station Option, the number of moderate impacts would decrease
slightly, and the number of severe impacts would remain the same. The change in noise impacts would
be a result of the realignment of the guideway away from multi‐family units and more residential
displacements. Under the At‐Grade Station Option, moderate and severe impacts would both increase
slightly. All of the additional severe impacts would occur at the Mar‐A‐Villa Mobile Home Park and
surrounding apartments.

6.0 Impact Assessment
Federal Way Link Extension 6-5 Noise and Vibration Technical Report November 2016
Landfill Median Alignment Option With the Landfill Median Alignment Option, there would be additional moderate impacts. The number
of moderate impacts would increase along the east side of I‐5 where the alignment would be in the I‐5
median. In addition, the number of moderate impacts would increase where the alignment transitions
back to the west side of I‐5 because it would be elevated in a location that would be at‐grade when
compared with the Preferred Alternative.
S 272nd Star Lake Elevated Station Option Under the S 272nd Star Lake Elevated Station Option there are additional moderate and severe
impacts when compared to the Preferred Alternative. The change in noise impacts is due to the added
noise from an elevated alignment when compared to an alignment that was primarily in a retained cut.
The new and changed impacts are along the elevated alignment south of S 268th Place, and occur at
several single‐family and multi‐family residences and the Mark Twain Elementary School.
S 317th Elevated Alignment Option Under the S 317th Elevated Alignment Option, there are additional moderate impacts when compared
to the Preferred Alternative. The change in noise impacts is due to the added noise from an elevated
alignment when compared to an alignment that was primarily in a retained cut, and the close proximity
of several multi‐family units and the Hampton Inn Hotel.
Federal Way City Center Station Options Relative to the Preferred Alternative, the Federal Way I‐5 Station Option would have more moderate
noise impacts due to movement of the alignment closer to the Marriott Courtyard Hotel. The number
and location of severe impacts would remain the same. Under the Federal Way S 320th Park‐and‐Ride
Station Option, there would be an additional severe noise impact at a single‐family home on 28th
Avenue S. The alignment would be farther away from the Chelsea Court Condominiums north of
S 317th Street, but the Belmor Park mobile homes would have moderate noise impacts. The result
would be a slight reduction in the number of moderate noise impacts.
6.1.1.3 SR 99 Alternative There would be 1,463 units with moderate noise impacts and an additional 803 units with severe noise
impacts with the SR 99 Alternative. The impacts would be distributed throughout the length of the
alternative, and many of the properties where impacts would occur are multi‐family complexes or
motels, which contributes to the high number of impacts. Because of the large number of multi‐family
units and hotels in the northern end of the corridor, there would be a large number of noise impacts in
that section of the corridor. The impact numbers presented include schools, churches, and other noise‐
sensitive uses, in addition to residential units.
North of the Kent‐Des Moines Road, Category 2 severe noise impacts were identified at the Best
Western Motel, the Sleep Inn Motel, and the Legend Motel. Severe noise impacts were also identified
at single‐family homes on S 222nd Street, condominiums on 30th Avenue S, and the Stafford Senior
Care Facility. Portions of the Sleep Inn Motel and the Stafford Senior Care Facility would also have
moderate noise impacts. Additional moderate noise impacts were identified north of the Kent‐Des
Moines Road at the Sky Way Inn, the America’s Best Value Inn hotel, the West View Hotel, the New

6.0 Impact Assessment
Federal Way Link Extension 6-6 Noise and Vibration Technical Report November 2016
West hotel, and the America’s Best Value Inn hotel. Large multi‐family complexes, including The Firs
Mobile Home Park, the Majestic Bay Condominiums, the Marina Club Apartments, the Sea Fox
Apartments, the Viewpoint Apartments, the Falcon Ridge Assisted Living Facility, and the Pine Terrace
Mobile Home Park would also have moderate impacts. Moderate noise impacts were also identified at
multiplex units and groups of single‐family homes located along S 226th Street, 28th Avenue S and
30th Avenue S. There are current proposals to close the Firs Mobile Home Park and Pine Terrace
Mobile Home Park and relocate the tenants. If these occur prior to the FWLE, this would reduce
impacts by 22.
South of Kent‐Des Moines Road, and north of S 272nd Street, severe noise impacts were identified at
the Travel Inn Motel, several multi‐family complexes, including three complexes on 30th Avenue S and
one just south of S 244th Street, and a group of homes located along 16th Avenue S. Severe noise
impacts on mobile home parks include impacts at Tip‐Top Mobile Home Park on S 240th Street and
Midway Mobile Home Mansions. The Alaska Trailer Park, the West Hill Mobile Manor, and the Sunset
Motel would have both severe and moderate noise impacts. Moderate noise impacts were identified
at numerous single‐family homes on the west side of SR 99 between S 240th Street and S 268th Street.
South of S 272nd Street, severe noise impacts were identified at several single‐family and multi‐family
residences located along 16th Avenue, 16th Place S, and 15th Avenue S on the west side of the
alignment. This includes severe noise impacts at several multiplex units located in the 28000 block of
16th Avenue S and a large complex in the 29000 block of SR 99. On the east side of SR 99, severe
impacts are expected at multi‐family complexes near S 276th, S 279th, S 296th, and S 306th Streets.
Moderate noise impacts include multi‐ and single‐family homes along the west side of SR 99 between
S 277th and S 288th Streets. There are also moderate noise impacts expected at multi‐family
complexes on the east side of SR 99 between S 272nd and S 288th Streets and at single‐family homes
between S 294th and S 308th Streets.
Category 3 noise impacts include a moderate noise impact at the easternmost part of the Federal Way
High School, with operational noise levels meeting the FTA impact criteria at the exterior of the new
building. In addition, exterior noise levels at the new Federal Way High School Performing Arts Center
would result in a moderate noise impact. It is important to note that the noise impact predicted for
Federal Way High School is an exterior noise impact. The new school building is constructed with walls
and windows that would prevent the noise from light rail operations having a noise impact inside the
school. If this alternative is selected as the project to be built, additional acoustical testing could be
performed to determine the exterior‐to‐interior noise reduction and verify that noise levels in
classrooms, the Performing Arts Center, and other noise‐sensitive parts of the building are within the
applicable standards. Based on a review of the proposed building construction, the interior noise levels
at all noise‐sensitive parts of the school are estimated to be 35 to 45 dB (or more) lower than the
exterior noise levels; therefore, no interior noise impacts are expected.

6.0 Impact Assessment
Federal Way Link Extension 6-7 Noise and Vibration Technical Report November 2016
Other Category 3 land uses (including schools, libraries, and churches) with noise impacts along the
SR 99 corridor include the Citadel Church, the Open Door Baptist Church, and the Seattle Full Gospel
Church.
S 216th Station Options The S 216th West Station Option would reduce the number of moderate and severe noise impacts
because the alignment would be relocated in a trench along the west side of SR 99, farther away from
several multi‐family buildings. Some of the severe impacts, such as those at the Best Western, would
be eliminated because the building would be relocated, and most moderate impacts would be
eliminated because the alignment would be located farther from noise‐sensitive properties, such as
the West View Hotel, with additional shielding from the trench. The result is a net decrease in both
moderate and severe impacts.
With the S 216th East Station Option, there would be slightly less moderate and slightly more severe
impacts. The changes in noise impacts are all located along the east side of the alignment between
S 216th Street and S 224th Street, with new moderate impacts along 28th S. Finally, several homes
with moderate noise impacts with the SR 99 Alternative would be displaced for the S 216th Street East
Station Option.
Kent/Des Moines Station Options With the Kent/Des Moines HC Campus Station Option, the number of moderate and severe impacts
would increase as a result of moving the alignment off SR 99. Moderate noise impacts would become
severe at multi‐family buildings located just south of S 226th Street along 28th Avenue S. Moderate
noise impacts would increase at single‐family residences along 27th Avenue S and 28th Avenue S,
south of Kent/Des Moines Road. When connecting to the S 216th West Station Option, the profile of
the light rail would be a trench or at‐grade for most of the area along the alignment north of Kent‐Des
Moines Road, resulting in a substantial reduction in both moderate and severe impacts. Because the
alignment is located on the west side of SR 99, noise impacts at several multi‐family residences on the
east side of SR 99 would be eliminated. Impacts on the Citadel Church and Open Door Baptist Church
would not occur with this combination because they would be displaced.
With the Kent/Des Moines SR 99 Median Station Option, there would be slightly fewer severe but
slightly more moderate noise impacts. The change in noise impacts is because the alignment and track
crossover is relocated in the median of the roadway, farther away from noise‐sensitive properties on
the west side of SR 99. Multi‐family complexes on the east side of SR 99 between Kent/Des Moines
Road and S 240th Street would have moderate impacts where none existed under the SR 99
Alternative.
With the Kent/Des Moines SR 99 East Station Option, moderate and severe noise impacts would
decrease. New moderate noise impacts were identified along 30th Avenue S, while noise impacts on
the west side of SR 99 are eliminated because the alignment is relocated on the east side of the
highway.

6.0 Impact Assessment
Federal Way Link Extension 6-8 Noise and Vibration Technical Report November 2016
260th Station Options Under the S 260th West Station Option, severe and moderate noise impacts are reduced because the
alignment is located on the west side of SR 99, farther away from two mobile home parks, the Sunset
Hotel, and the Crossland Economy Studios hotel.
Under the S 260th East Station Option, severe and moderate noise impacts would decrease. The
reduced noise impacts are a result of the alignment being relocated on the east side of SR 99, away
from the noise‐sensitive properties on the west side of the highway.
S 272nd Redondo Trench Station Option With the S 272nd Redondo Trench Station Option, a number of severe impacts would either be
reduced to moderate or would not occur, and the number of moderate noise impacts would be
reduced. This would result in an overall reduction in impacts. The reduction in severe impacts is
because the alignment is moved off Highway 99 and placed in a trench from just south of S 268th
Street to just south of S 279th Street.
Federal Way SR 99 Station Option With the Federal Way SR 99 Station Option, there would be an increase in severe impacts and a
decrease in moderate impacts related to changing displacements near the station. Moderate noise
impacts at the Clarion Hotel would be eliminated, but new severe noise impacts would occur at the
Comfort Inn Hotel, for a net increase in impacts.
6.1.1.4 SR 99 to I-5 Alternative With the SR 99 to I‐5 Alternative, there would be 902 moderate noise impacts and 298 severe noise
impacts. These numbers include impacts at residential units and FTA Category 3 land uses. North of
Kent‐Des Moines Road, the impacts would be the same as with the SR 99 Alternative. As the alignment
transitions from SR 99 to I‐5 in the vicinity of the Kent‐Des Moines Road, there would be 67 severe and
156 moderate impacts. South of S 240th Street, the impacts would be similar to the Preferred
Alternative. The Category 3 noise impacts identified under the SR 99 to I‐5 Alternative are at the
Citadel and Open Door Baptist Churches.
Impacts from station options would be the same as described above under the SR 99 or Preferred
alternatives for applicable station and alignment options.
6.1.1.5 I-5 to SR 99 Alternative With the I‐5 to SR 99 Alternative, there would be 1,084 moderate noise impacts and 776 severe noise
impacts. North of Kent‐Des Moines Road, the impacts would be similar to the Preferred Alternative. As
the alignment transitions from I‐5 to SR 99 in the vicinity of the Kent‐Des Moines Road, there would be
14 severe and 87 moderate impacts. South of S 240th Street, the impacts would be the same as with
the SR 99 Alternative.
Impacts from station options would be the same as described above under the SR 99 or Preferred
alternatives for applicable station and alignment options with the exception of the S 260th West
Station Option. Because the S 260th West Station Option modifies the alignment of the SR 99
Alternative beginning at the Kent‐Des Moines Road, which is south of the start of the I‐5 to SR 99
crossover, there is a slight difference in the total impacts for this station option. With this option, there

6.0 Impact Assessment
Federal Way Link Extension 6-9 Noise and Vibration Technical Report November 2016
would be two more severe but fewer moderate noise impacts because the alignment is located on the
west side of SR 99, farther away from two mobile home parks and the Crossland Economy Studios
hotel.
6.1.2 Noise Impacts from Park-and-Rides and Stations Under the No Build Alternative, there would be no station related noise impacts.
Noise from park‐and‐rides and stations with parking lots or garages was evaluated for noise impacts
under the FTA and applicable local noise control ordinances. Mitigation for these impacts would be
different than mitigation for light rail noise impacts, and both types of impacts would need to be
mitigated. Table 6‐2 shows the impacts for each park‐and‐ride and station by alternative. There would
be no impacts under FTA criteria for any station other than the Preferred Kent/Des Moines Station.
Maps showing the locations of noise impacts by parcel are included in Appendix C.
TABLE 6-2 Summary of Projected Park-and-Ride and Station Noise Impacts
Alternative
FTA Impactsa Local Ordinance Impacts (Leq)b Potential Mitigation Mod Sev
Preferred Alternative Stations
Kent/Des Moines Station 1 -- 1 Sound walls and station design
S 272nd Star Lake Stationc -- -- -- N/A
Federal Way Transit Center Station -- -- -- N/A
Preferred Alternative Station Options
Kent/Des Moines I-5 Station Option -1 -- -1 N/A
Kent/Des Moines At-Grade Station Option -1 -- -1 N/A
Federal Way I-5 Station Option -- -- -- N/A
Federal Way S 320th Park-and-Ride Station Option -- -- -- N/A
SR 99 Alternative Stations
Kent/Des Moines SR 99 West Station -- -- 8 Sound walls and station design
S 272nd Redondo -- -- -- N/A
Federal Way Transit Center -- -- -- N/A
SR 99 Station Options
Kent/Des Moines HC Campus Station Option -- -- -8 N/A
Kent/Des Moines SR 99 Median Station Option -- -- -- Sound walls and station design
Kent/Des Moines SR 99 East Station Option -- -- -- Sound walls and station design
S 272nd Redondo Trench Station Option -- -- -- N/A
Federal Way SR 99 Station Option -- -- -- N/A
SR 99 to I-5 Alternative Stations
Kent/Des Moines 30th Ave East Station -- -- -- N/A
S 272nd Star Lake Station -- -- -- N/A
Federal Way Transit Center Station -- -- -- N/A

6.0 Impact Assessment
Federal Way Link Extension 6-10 Noise and Vibration Technical Report November 2016
TABLE 6-2 Summary of Projected Park-and-Ride and Station Noise Impacts
Alternative
FTA Impactsa Local Ordinance Impacts (Leq)b Potential Mitigation Mod Sev
SR 99 to I-5 Station Options
Federal Way I-5 Station Option -- -- -- N/A
Federal Way S 320th Park-and-Ride Station Option -- -- -- N/A
I-5 to SR 99 Alternative Stations
Kent/Des Moines 30th Ave West Station -- -- 8 Sound walls and station design
S 272nd Redondo Station -- -- -- N/A
Federal Way Transit Center Station -- -- -- N/A
I-5 to SR 99 Station Options
S 272nd Redondo Trench Station -- -- -- N/A
Federal Way SR 99 Station Option -- -- -- N/A
a Station impacts under the FTA criteria. b Station impacts using the local noise code criteria. c No impacts for either the Preferred S 272nd Star Lake Station or the S 272nd Elevated Star Lake Station Option. Mod = moderate; N/A = not applicable; Sev = severe
6.1.2.1 Preferred Alternative Stations There is one station‐related noise impact predicted under both the FTA criteria and the local nighttime
noise ordinance for the Preferred Alternative. The impact is due to cars and buses entering and leaving
the Kent/Des Moines Station bus layover areas, parking garage, and parking lots. This impact occurs at
a single‐family residence on 30th Avenue S. Noise impacts from light rail noise operations are not
predicted at this property. There are no other station‐related noise impacts predicted under the
Preferred Alternative.
None of the Preferred Alternative station options would have any impacts.
6.1.2.2 SR 99 Alternative Stations Under the SR 99 Alternative, eight noise impacts are predicted under the local noise ordinance at the
Green Acres Mobile Home Park near the Kent/Des Moines SR 99 West Station. Noise impacts from light
rail noise operations are not predicted at these homes.
No noise impacts are predicted near the S 272nd Redondo Station or the Federal Way Transit Center
Station.
SR 99 Station Options The Kent/Des Moines HC Campus Station Option is predicted to have no noise impacts from the park‐
and‐ride or station. The Kent/Des Moines SR 99 Median Station Option and the Kent/Des Moines SR 99
East Station Option are both predicted to have the same impacts as the Kent/Des Moines SR 99 West
Station. All impacts are at sites that also have noise impacts under the FTA light rail analysis. There
would be no station noise impacts with either the S 272nd Redondo Trench Station Option or the
Federal Way SR 99 Station Option.

6.0 Impact Assessment
Federal Way Link Extension 6-11 Noise and Vibration Technical Report November 2016
6.1.2.3 SR 99 to I-5 Alternative There are no station‐related noise impacts predicted under the SR 99 to I‐5 Alternative. None of the
station options would have any impacts.
6.1.2.4 I-5 to SR 99 Alternative With the Kent/Des Moines 30th Avenue West Station there would be eight noise impacts to a mobile
home park. These mobile homes were also identified with moderate noise impacts from light rail
operations. There would be no noise impacts at any other stations. None of the station options would
have any impacts.
6.2 Traffic Noise Impacts Traffic noise levels at properties adjacent to I‐5 are currently influenced by physical shielding (e.g.,
from berms and other structures), sound walls, and/or topography. In many areas, existing noise levels
are 66 dBA or greater. Based on measured noise levels and proximity to I‐5 travel lanes, the WSDOT
NAC are currently exceeded at distances up to 400 ft or more from I‐5, and some of the existing
shielding is not effective at reducing noise levels to within the criteria. For example, the average
daytime traffic noise level behind the existing barrier along the north end of the Camelot Square
Mobile Home Park is 67 dBA Leq.
There are a few locations in the project corridor where new roads would be constructed or existing
shielding would be removed (such as buildings and earthen berms) or relocated (such as existing noise
barriers) for the FWLE. Predicted noise impacts from light rail operations, particularly from elevated
alignments, can affect two to three rows of noise‐sensitive receivers. Where the light rail alignment is
within or adjacent to roadways or the highway, it is unlikely that potential increases in exposure to
existing traffic noise would occur at properties not already identified as impacted by light rail noise. In
addition, the light rail guideway (including sound barriers for light rail noise mitigation) and other
project elements (such as garage structures or elevated stations) would provide shielding from traffic
noise in some locations. Each of the areas with potential for increased traffic noise levels within the
Preferred Alternative are described in the section below, and each of these areas was analyzed in
detail for traffic noise impacts. For all other alternatives, similar areas are also described below, and
the potential to create or increase exposure to traffic noise as a result of the transit project was
evaluated based on the approximate distance to roadways. Parcels near the Preferred Alternative with
potential traffic noise impacts as modeled using FHWA’s Traffic Noise Model are shown on maps in
Appendix C. The maps show if the same properties are also impacted by light rail operating noise.
Potential noise mitigation measures for Preferred Alternative areas with traffic noise impacts are
described in Section 7.
6.2.1 Traffic Noise Analysis Areas There are five areas on the west side of I‐5 where property acquisitions (i.e., the removal of existing
buildings that currently shield traffic noise), new roadways, roadway alterations, or the relocation of
existing noise barriers associated with the Preferred Alternative might result in traffic noise levels
exceeding the WSDOT NAC at nearby homes and other noise‐sensitive receptors:

6.0 Impact Assessment
Federal Way Link Extension 6-12 Noise and Vibration Technical Report November 2016
From S 212th Street to Kent‐Des Moines Road, where buildings would be removed and topography
would be changed for the alignment; Receptors between S 220th Street and S 224th Place, and the
homes located on the south side of S 224th Place, were not analyzed because the FWLE would not
alter any roadways or remove or relocate any intervening shielding or barriers that affect the
receptors in this area.
The neighborhood surrounding the new S 236th Street and S 234th and 238th Streets that would
be constructed for access to the Kent/Des Moines Station and/or parking
North of the Star Lake Park‐and‐Ride where buildings would be displaced for the alignment and
28th Avenue S would be realigned for the S 272nd Star Lake Station
North of S 288th Street, where grading would take place and trees would be removed for
construction of the alignment
Camelot Square Mobile Home Park and the neighborhood south of S 288th Street, where existing
noise barriers would need to be relocated for the alignment. Each of these areas was analyzed for
traffic noise impacts under existing conditions, the No Build Alternative, and the Preferred
Alternative.
6.2.2 S 317th Street and 23rd Avenue S Roundabout The intersection at S 317th Street and 23rd Avenue S would be modified from a signalized intersection
to a roundabout for the Preferred Alternative. This change in intersection control was analyzed to
determine whether the project improvements could affect traffic noise levels at nearby receivers. As
described in Section 5.1.2., to be treated as a substantial realignment, a realignment must result in a
traffic noise increase of 3 dB at the receivers.
The proposed roadway location and traffic volume changes were analyzed to determine whether they
would result in a 3 dB change in traffic noise. The homes closest to the nearest lanes of traffic on
S 317th Street are at the Chelsea Court Condominiums, which are approximately 70 ft from the center
of traffic on that roadway lane. With construction of the roundabout, the closest lane would be 86 ft
from the same homes. Similarly, the center of the existing intersection is 176 ft from these homes, and
the center of the roundabout would be 164 ft from the homes. The result would be a change in
distance from the roadway to the receivers of +16 ft and ‐12 ft, respectively. Consequently, there
would be no substantive change in the location of traffic relative to the location of noise‐sensitive
properties that would result in a 3‐dB change in traffic noise.
The expected increase in future traffic volumes from the No Build Alternative to Preferred Alternative
would be 2 percent. In order to achieve a 3‐dB increase in traffic noise levels, either the volumes must
be expected to double or the distances between roadways and receivers must be expected to be
halved. Neither of these would result from this intersection modification. Lastly, the addition of a
roundabout would reduce acceleration noise because the current traffic signals would be removed.
The proposed realignment’s noise impacts would not be substantial due to the combination of these
three factors. Nearby homes would have slight increases of less than 1 to 2 dB, if any, and because it

6.0 Impact Assessment
Federal Way Link Extension 6-13 Noise and Vibration Technical Report November 2016
takes a 3‐dB increase in noise for an average person to discern a change, the roadway realignments do
not meet the criteria for a substantial change. Accordingly, no traffic noise impact or mitigation
analysis was performed in this area.
6.2.3 Traffic Noise Model Validation Prior to performing the traffic noise analysis, the traffic noise levels were modeled to test the
agreement of calculated and measured noise levels. This step is required to verify that the noise levels
projected are accurate and capture the acoustical characteristics of the study area. This task is
performed for each monitoring site by entering the traffic count and speed data taken during the
onsite noise monitoring and verifying that the noise model produces the same noise level (within
+/‐ 2 dBA) measured at that site. A variance between the measured and modeled noise levels of
+/‐ 2 dBA or less is considered acceptable and is in accord with WSDOT criteria; the average person
cannot clearly discern a change in traffic noise levels if the change is less than 3 dBA. This step ensures
that the modeled noise levels are reasonably consistent with measured noise levels. The monitoring
sites located in the five areas of analysis are listed in Table 3‐1. The measured noise levels at each of
the 30 monitoring sites used to validate the traffic noise models and their calculated measured noise
levels are compared in Table 6‐3.
TABLE 6-3 Measured Versus Modeled Noise Levels
Monitoring Locationa Measured (dBA Leq)b
Modeled (dBA Leq)c
Difference (in dBA)d
M-5 67.5 67.9 +0.4
M-6 66.2 65.0 -1.2
M-7 74.9 76.8 +1.9
M-8 60.1 61.3 +1.2
M-9 72.4 72.1 -0.3
M-10 61.6 63.2 +1.6
M-10A 69.5 70.6 +1.1
M-11 62.8 62.1 -0.7
M-41 63.2 62.3 -0.9
M-66 East 57.4 55.8 -1.6
M-15 64.2 65.7 +1.5
M-19 66.5 65.3 -1.2
M-22 69.5 68.5 -1.0
M-23 North 69.1 67.4 -1.7
M-23 South 70.6 71.7 +1.1
M-100 60.1 58.2 -1.9
M-101 66.9 64.9 -2.0
M-102 65.2 67.0 +1.8
M-103 66.1 67.0 +0.9

6.0 Impact Assessment
Federal Way Link Extension 6-14 Noise and Vibration Technical Report November 2016
TABLE 6-3 Measured Versus Modeled Noise Levels
Monitoring Locationa Measured (dBA Leq)b
Modeled (dBA Leq)c
Difference (in dBA)d
M-104 68.7 68.8 +0.1
M-108 68.7 69.7 +1.0
M-111 70.5 69.4 -1.1
M-112 66.7 66.8 +0.1
M-113 67.2 66.8 -0.4
M-114 63.8 64.7 +0.9
M-116 63.8 65.7 +1.9
M-117 70.0 71.5 +1.5
M-121 58.0 58.0 0
M-122 57.8 59.3 +1.5
M-123 62.9 64.9 +2.0
a Monitoring locations are shown on Figures 3-1 and 3-2 in Section 3. b These are the noise levels measured at the monitoring locations; traffic counts were taken during the noise measurements. c Modeled noise levels at the monitoring locations using the TNM with the traffic counts to predict traffic noise levels. d Change in noise levels between the measured and modeled noise levels.
6.2.4 Existing Traffic Noise Levels Existing condition traffic noise levels were modeled using TNM for each of the analyzed areas
described in Section 6.2.1. The modeled traffic noise levels for each analyzed unit are provided in
Appendix B, Detailed Noise Impact Assessment Data. Analyzed locations are shown in maps in
Appendix C, Detailed Noise and Vibration Analysis Maps. Table 6‐4 provides a summary of the number
of noise‐sensitive uses where the existing modeled traffic noise levels meet or exceed the WSDOT NAC
(66 dBA Leq for residences and similar uses) for each of the five areas described in Section 6.2.1.
TABLE 6-4 Receivers where Existing Modeled Traffic Noise Levels Meet or Exceed the WSDOT NAC
Study Area Number of Units Modeled Number of Units that Meet or
Exceed WSDOT NAC
S 212th Street to Kent-Des Moines Road 340 186
Kent/Des Moines Station 281 146
S 272nd Star Lake Station 27 1
Military Road to S 288th Street 54 21
S 288th Street to S 298th Street 244 89
Total 946 443
S 212th Street to Kent-Des Moines Road Modeling was performed for 340 units consisting of single‐ and multi‐family homes in the S 212th
Street area. Modeled traffic noise levels under existing conditions range from 58 to 74 dBA Leq. There
are 186 units with traffic noise levels that meet or exceed the WSDOT NAC under existing conditions.

6.0 Impact Assessment
Federal Way Link Extension 6-15 Noise and Vibration Technical Report November 2016
Kent/Des Moines Station Modeling was performed for 281 units consisting of single‐ and multi‐family homes in the Kent/Des
Moines Station area. Modeled traffic noise levels under existing conditions range from 60 to 73 dBA
Leq. There are 146 units with traffic noise levels that meet or exceed the WSDOT NAC under existing
conditions.
S 272nd Star Lake Station Modeling was performed for 27 units consisting of single‐family homes in the S 272nd Star Lake Station
area. Modeled traffic noise levels under existing conditions range from 59 to 66 dBA Leq. There is one
home with a traffic noise level that exceeds the WSDOT NAC under existing conditions.
Military Road to S 288th Street Modeling was performed for 53 units consisting of single‐ and multi‐family homes in the neighborhood
north of S 288th Street, as well as the Korean Methodist Church. Modeled traffic noise levels under
existing conditions range from 56 to 71 dBA Leq. There are 21 units with traffic noise levels that meet
or exceed the WSDOT NAC under existing conditions.
S 288th Street to S 298th Street Modeling was performed for 244 units consisting of single‐ and multi‐family homes located between
S 288th Street and S 298th Street. Modeled traffic noise levels under existing conditions range from
60 to 74 dBA Leq. There are 89 units with traffic noise levels that meet or exceed the WSDOT NAC
under existing conditions.
6.2.5 No Build Traffic Noise Levels No Build Alternative traffic noise levels were modeled using TNM for the same areas and properties
modeled under the existing conditions. In order to assess the effects of the FWLE on traffic noise levels
and determine traffic noise impacts under the Preferred Alternative without the mitigation measures
included in the SR 509 Extension, future traffic noise levels were modeled without either the FWLE or
the SR 509 Extension improvements. The modeled traffic noise levels for each unit are provided in
Appendix B, Detailed Noise Impact Assessment Data. Analyzed locations are shown in maps in
Appendix C, Detailed Noise and Vibration Analysis Maps. Table 6‐5 shows the number of noise‐
sensitive uses where the No Build modeled traffic noise levels meet or exceed the WSDOT NAC for
each of the five areas described in Section 6.2.1.
TABLE 6-5 Receivers where No Build Modeled Traffic Noise Levels Meet or Exceed the WSDOT NAC
Study Area Number of Units Modeled Number of Units that Meet or
Exceed WSDOT NACa
S 212th Street to Kent/Des Moines Road 340 204
Kent/Des Moines Station 281 173
S 272nd Star Lake Station 27 1
Military Road to S 288th Street 54 23
S 288th Street to S 298th Street 244 119
Total 946 520
a Peak-hour modeled noise levels without any FWLE or SR 509 Extension improvements.

6.0 Impact Assessment
Federal Way Link Extension 6-16 Noise and Vibration Technical Report November 2016
S 212th Street to Kent-Des Moines Road Modeled traffic noise levels under the No Build Alternative are predicted to range from 59 to 75 dBA
Leq. There are 204 units with traffic noise levels that meet or exceed the WSDOT NAC under the No
Build Alternative.
Kent/Des Moines Station Modeled traffic noise levels under the No Build Alternative are predicted to range from 61 to 74 dBA
Leq. There are 173 units with traffic noise levels that meet or exceed the WSDOT NAC under the No
Build Alternative.
S 272nd Star Lake Station Modeled traffic noise levels under the No Build Alternative are predicted to range from 60 to 67 dBA
Leq. The single home with a traffic noise level that exceeds the WSDOT NAC under the existing
conditions also exceeds the WSDOT NAC under the No Build Alternative.
Military Road to S 288th Street Modeled traffic noise levels under the No Build Alternative are predicted to range from 57 to 72 dBA
Leq. There are 23 units with traffic noise levels that meet or exceed the WSDOT NAC under the No
Build Alternative.
S 288th Street to S 298th Street Modeled traffic noise levels under the No Build Alternative are predicted to range from 61 to 75 dBA
Leq. There are 119 units with traffic noise levels that meet or exceed the WSDOT NAC under the No
Build Alternative.
6.2.6 Preferred Alternative Traffic Noise Impacts Future traffic noise levels under the Preferred Alternative were modeled using the FHWA TNM. The
modeling was performed for the same properties and areas modeled under the existing conditions and
No Build Alternative. In order to assess traffic noise impacts, the separate effects of the FWLE and the
SR 509 Extension on traffic noise levels, and the need for mitigation, the modeling was performed both
with and without the SR 509 Extension.
For each of the five study areas, two different comparisons were made:
First, the No Build Alternative was compared to the Preferred Alternative without the SR 509
Extension. This was done to determine the traffic noise mitigation measures that would be needed
solely as a result of the FWLE.
Second, the No Build Alternative was compared to the Preferred Alternative with the SR 509
Extension. This was done to determine the traffic noise impact mitigation measures that would be
needed if both projects were built.
The specific criteria used to determine traffic noise impacts for replacement walls or shielding are:
1. No new traffic noise impacts when compared against No Build traffic noise impacts (e.g., 66 dBA
peak‐hour Leq for residential land use)

6.0 Impact Assessment
Federal Way Link Extension 6-17 Noise and Vibration Technical Report November 2016
2. No increase in traffic noise levels of any site where the predicted No Build traffic noise levels
exceed the noise impact criteria
Modeled future traffic noise levels under the Preferred Alternative without the SR 509 Extension were
used to estimate traffic noise impacts associated with the project. Traffic noise impacts were also
estimated under the Preferred Alternative with the SR 509 Extension. However, it should be noted that
the traffic noise abatement measures (sound walls) identified and recommended in the 2003 Final EIS
and ROD for the SR 509 Extension were also included in the modeled improvements associated with
the SR 509 Extension. As a result, the future traffic noise levels modeled with the SR 509 Extension
reflect the traffic noise abatement provided by these walls.
The results are summarized in Table 6‐6 for each of the five areas described in Section 6.2.1. Complete
tables of the modeled traffic noise levels for each analyzed unit are provided in Appendix B, Detailed
Noise Impact Assessment Data. Analyzed locations are shown on maps in Appendix C, Detailed Noise
and Vibration Analysis Maps.
TABLE 6-6 Summary of Traffic Noise Impacts with and without SR 509 Extension
Study Area Number of Units
Modeled Number of Units with Traffic Noise Impactsa
Number of Units with Traffic Noise Impacts that Also Have Light Rail Noise Impactsa
S 212th Street to Kent/Des Moines Road
Preferred Alternative without SR 509 340
181 33
Preferred Alternative with SR 509 2 0
Kent/Des Moines Station
Preferred Alternative without SR 509 281
1 1
Preferred Alternative with SR 509 1 1
S 272nd Star Lake Station
Preferred Alternative without SR 509 27
5 0
Preferred Alternative with SR 509 5 0
Military Road to S 288th Street
Preferred Alternative without SR 509 54
16 7
Preferred Alternative with SR 509 16 7
S 288th Street to S 298th Street
Preferred Alternative without SR 509 244
59 51
Preferred Alternative with SR 509 55 51
Total
Preferred Alternative without SR 509 946 262 92
Preferred Alternative with SR 509 79 59
a Based on peak-hour modeled noise levels for the FWLE without any SR 509 Extension improvements.

6.0 Impact Assessment
Federal Way Link Extension 6-18 Noise and Vibration Technical Report November 2016
6.2.6.1 Preferred Alternative without SR 509 Extension A summary of the traffic noise impacts under the Preferred Alternative without the SR 509 Extension is
provided below for each of the five analysis areas. These are the traffic noise impacts associated with
the project.
S 212th Street to Kent-Des Moines Road The traffic noise modeling took into account that buildings would be removed and topography would
be changed for the alignment in some areas between S 212th and Kent‐Des Moines Road for the FWLE.
Modeled traffic noise levels under the build alternative without the SR 509 Extension are predicted to
range from 58 to 76 dBA Leq. The changes in this area resulting solely from the FWLE would create
new traffic noise impacts, or would increase the severity of traffic noise impacts, at 181 units. This is
compared to 204 units with traffic noise levels that meet or exceed the WSDOT NAC under the No
Build Alternative. This decrease would result from the use of FWLE design features such as cut and fill
slopes and walls, which provide new shielding to homes along I‐5 in this area. The impacts in this area
would begin to occur south of the Highline Water District property just north of S 216th Street and
would extend all the way to S 232nd Place. For multi‐family locations close to I‐5, impacts are expected
at both ground and upper level floors, while more distant locations would only experience impacts at
upper level floors. The majority of units in the high‐density neighborhood east of 30th Avenue S, from
S 227th Street to S 232nd Place, along with approximately half of the units on the west side of 30th
Avenue S that face I‐5 in the same area, are predicted to have traffic noise impacts. All FWLE traffic
noise impacts are due to removal of acoustical shielding (e.g., buildings and topography).
Kent/Des Moines Station Project‐related improvements that could affect the overall noise environment in this area include the
removal of buildings to construct the Kent/Des Moines Station, including bus and parking facilities and
the addition of the new S 236th Street and S 234th and S 238th streets. The modeled traffic noise
levels under the build alternative without the SR 509 Extension are predicted to range from 62 to
74 dBA Leq in this area, compared to 61 to 74 dBA Leq under the No Build Alternative.
All but 27 of the 281 analyzed build alternative units have a traffic noise increase of less than 3 dB, an
increase that is not typically perceptible to an average person, and at 26 of these 27 units, traffic noise
levels do not meet the WSDOT NAC. As a result, the FWLE would result in a traffic noise impact at one
single‐family home. The home is located at the new intersection of S 236th Street and 30th Avenue S
and would be the same home impacted under the park‐and‐ride analysis for the Kent/Des Moines
Station, as described in Section 6.1.2. The impact would be due to increased traffic volumes on 30th
Avenue S and the addition of traffic on the new S 236th Street.
There are 194 units (at 17 different locations) with traffic noise levels that meet or exceed the WSDOT
NAC under the build alternative without the SR 509 Extension, compared to 173 units under the No
Build Alternative. As indicated above, only one of these would have an FWLE traffic noise impact. The
other 193 units would have slight increases in noise levels of less than 1 to 2 dB, and because it takes a
3‐dB increase in noise for an average person to discern an increase, the roadway realignments do not
meet the criteria for a substantial change. The locations include:

6.0 Impact Assessment
Federal Way Link Extension 6-19 Noise and Vibration Technical Report November 2016
The second and third floors of the western apartment building and the third floor of the eastern
apartment building at the Highline Court Apartments, where there would be a 1‐ to 2‐dB increase
in traffic noise levels as a result of the addition of traffic control signals and increased traffic
volumes on 30th Avenue S. Traffic on S 238th Street is not sufficient to account for the increase in
traffic noise levels at these locations, and modeling at other locations in the area demonstrated
that the increase was not due to traffic on I‐5.
Portions of the new Highline Place development, where there would be a 1‐dB increase in traffic
noise levels due to the addition of traffic control signals and increased traffic volumes on SR 99.
Additional modeling for this development demonstrated that the increase was not due to traffic on
S 236th Street.
The second floor of the apartment building located at 23653 Pacific Highway S, where there would
be a 1‐dB increase in traffic noise levels due to the addition of traffic control signals and increased
traffic volumes on SR 99. Additional modeling for this development demonstrated that the increase
was not due to traffic on S 236th Street.
S 272nd Star Lake Station Improvements to the Star Lake Park‐and‐Ride at S 272nd Street, as well as the realignment of 28th
Avenue S north of the park‐and‐ride, would result in traffic noise levels under the Preferred Alternative
without the SR 509 Extension ranging from 60 to 68 dBA Leq in this neighborhood, compared to 60 to
67 dBA Leq under the No Build Alternative. Changes in this area resulting from the FWLE would result
in new traffic noise impacts, or would increase the severity of traffic noise impacts under the No Build
Alternative, at five single‐family homes. Those homes are located at the far north and south ends of
the neighborhood. The homes in the middle are well below grade and have a retaining wall along 28th
Avenue S in their backyards.
Military Road to S 288th Street Grading and the removal of trees to construct the light rail alignment are predicted to result in traffic
noise levels for this area ranging from 59 to 71 dBA Leq under the build alternative without the SR 509
Extension. These changes from construction of the FWLE would result in 16 traffic noise impacts in this
neighborhood. Fifteen of these would be at single‐family homes, and one would be at the Korean
Methodist Church. All but six of the single‐family home impacts would occur south of S 284th Street.
Five front‐line homes north of S 284th Street are expected to experience at least a 3‐dB reduction in
traffic noise levels as a result of grading associated with the light rail construction.
S 288th Street to S 298th Street The Camelot Square Mobile Home Park is located just south of S 288th Street. There are existing noise
barriers between the mobile home park and I‐5, and the northern barrier would be relocated for the
alignment. Traffic noise modeling for the build alternative took into account the removal of this barrier,
and the area was modeled with no replacement barrier in place. Removal of this barrier would result in
traffic noise levels under the build alternative without the SR 509 Extension ranging from 60 to 77 dBA
Leq at the park, compared to 61 to 69 dBA Leq under the No Build Alternative. Grading and the

6.0 Impact Assessment
Federal Way Link Extension 6-20 Noise and Vibration Technical Report November 2016
removal of the existing noise barrier at the north end of the park would result in 59 traffic noise
impacts in the entire area under the build alternative without the SR 509 Extension.
At the north end of the Camelot Square Mobile Home Park, homes would experience an increase in
traffic noise levels of up to 9 dB when compared to the No Build Alternative as a result of removing the
north sound barrier. Traffic noise levels in the middle and at the south end of the park would remain
the same or be reduced by up to 7 dB where the alignment would be on fill. The changes in the area of
the park resulting solely from the FWLE (including removal of the existing northern barrier) would
result in new traffic noise impacts, or would increase the severity of traffic noise impacts under the No
Build Alternative, at 51 units in the Camelot Square Mobile Home Park. All of these impacts would
occur at units shielded by the existing northern barrier.
Traffic noise levels in the neighborhood south of the Camelot Square Mobile Home Park would remain
virtually unchanged when compared to No Build Alternative traffic noise levels and would range from
59 to 75 dBA Leq under the build alternative. The traffic noise levels would increase by 1 dB at eight
homes in this neighborhood, which would result in traffic noise impacts at these homes.
6.2.6.2 Future Traffic Noise Impacts with the FWLE Preferred Alternative Options The Kent/Des Moines I‐5 Station Option would include a new S 236th Street and the removal of
buildings. However, traffic noise modeling demonstrated that there would be no traffic noise increases
of 3 dB or greater at units in this area, and therefore, there would not be any traffic noise impacts as a
result of these changes. The Kent/Des Moines At‐Grade Station Option would have a station access
road at S 242nd Street instead of S 236th Street, but there are no noise‐sensitive land uses in this area.
Traffic noise impacts at the S 272nd Star Lake Elevated Station Option are likely to be the same or less
in number and degree as they are under the Preferred Alternative because the alignment is on fill in a
portion of this area. The Federal Way I‐5 Station Option would not have any new roads or other
modifications that would necessitate a traffic noise analysis. The Federal Way S 320th Park‐and‐Ride
Station Option would have the potential for traffic noise impacts. Shielding provided by an existing
berm on the east side of the Belmor Mobile Home Park could be removed for construction of the light
rail alignment under this option. In addition, front‐line homes on the east side of the park would be
removed as part of this option. In combination, these two changes would likely result in traffic noise
impacts on the currently shielded second‐line homes at the park.
6.2.7 SR 99 Alternative
There are multiple locations along the SR 99 corridor that currently equal or exceed 66 dBA during the
peak hour of traffic noise. Because of the speed of vehicles on SR 99 and spacing between intervening
buildings, traffic noise levels at or above 66 dBA are likely to occur up to 250 to 400 ft from the curb
line of the roadway, depending on existing shielding and topographical conditions in the area. In areas
with cross streets that are also major arterials with high traffic volumes, the area at or above the
WSDOT NAC could increase to over 400 ft from SR 99, as noise from some major arterials also currently
meets or exceeds the WSDOT NAC.

6.0 Impact Assessment
Federal Way Link Extension 6-21 Noise and Vibration Technical Report November 2016
There are six areas where property acquisitions and/or roadway alterations associated with the SR 99
Alternative might result in traffic noise levels exceeding the WSDOT NAC at nearby homes. These
locations are:
The new S 236th Street that would be constructed for access to the Kent/Des Moines Station
and/or parking associated with the SR 99 Alternative and its options
The S 272nd Redondo Station (including the trench option for this station), where a new road
would be constructed for access to S 272nd Street
S 224th Street where buildings would be removed for a traction power substation on the east side
of SR 99
Kent‐Des Moines Road and S 240th Street, where buildings would be removed on the west side of
the road for the alignment to the Kent/Des Moines Station
South of S 240th Street, where buildings would be removed on the west side of the road for the
alignment to the Kent/Des Moines Station
S 304th Street, where a building would be removed on the east side of SR 99 for road widening
Properties that could have increased exposure to traffic noise in these areas would already be subject
to light rail noise impacts and/or park‐and‐ride noise impacts (if located near a station). The design of
the station and parking structures may provide new shielding and reduce the potential for traffic noise
impacts.
6.2.7.1 SR 99 Station Options For the SR 99 station options, exposure to traffic noise could occur at the following locations where
buildings that currently provide shielding would be removed:
S 216th Street, for both potential station options in this area
West side of SR 99 between S 216th Street and Kent‐Des Moines Road, where additional buildings
would be removed with the HC Campus Station Option from S 216th West Station Option
East side of SR 99 between Kent‐Des Moines Road and S 240th Street, where buildings would be
removed on the west side of the road for the alignment to the Kent/Des Moines Station
Near S 246th Street for the S 260th West Station Option, where additional buildings would be
removed for the alignment to this potential additional station
Near S 260th Street for the S 260th East Station Option, where additional buildings would be
removed for the alignment to this potential additional station
6.2.8 SR 99 to I-5 Alternative
Potential for traffic noise impacts from the SR 99 to I‐5 Alternative would be the same as both the
SR 99 Alternative north of Kent/Des Moines Road and the Preferred Alternative south of S 240th
Street. The Kent/Des Moines 30th Avenue East Station would also include the S 236th Street extension
and therefore would have potential for traffic noise impacts. As with the SR 99 and Preferred

6.0 Impact Assessment
Federal Way Link Extension 6-22 Noise and Vibration Technical Report November 2016
alternatives, mitigation for park‐and‐ride noise may mitigate any traffic noise impacts as well. Potential
for traffic noise impacts from station options would be the same as for the potential additional stations
at S 216th Street and the Federal Way S 320th Park‐and‐Ride Station Option.
6.2.9 I-5 to SR 99 Alternative
Potential for traffic noise impacts from the I‐5 to SR 99 Alternative would be the same as both the
Preferred Alternative north of Kent/Des Moines Road and the SR 99 Alternative south of S 240th
Street. The Kent/Des Moines 30th Avenue West Station would also include the S 236th Street
extension and therefore would have potential for traffic noise impacts. As with the SR 99 and Preferred
alternatives, mitigation for park‐and‐ride noise may mitigate any traffic noise impacts as well. Potential
for traffic noise impacts from station options would be the same as for the potential additional stations
at S 260th Street.
6.3 Vibration Impacts This section presents the results of the detailed assessment of vibration impacts from train operations.
The assessment was based on the FTA methodology discussed in Section 4, Noise and Vibration Impact
Criteria. The inputs for the assessment include distance from the receivers to the tracks, train speeds,
track type, and other relevant information such as proximity to special track work.
6.3.1 Preferred Alternative The predicted vibration impacts for the Preferred Alternative are shown in Table 6‐7. Vibration impacts
are predicted at four single‐family residences, four multi‐family residences, a mobile home park, and
two motels. The predicted impacts at the sensitive receivers are a result of proximity to tracks. Of
these, there are four multi‐family residences within approximately 15 ft of the light rail guideway, and
standard vibration mitigation may not be effective at reducing the vibration level to below FTA criteria.
TABLE 6-7 Potential Vibration Impacts for Preferred Alternative
Address Distance to
Near Track (ft) Speed (mph)
Maximum 1/3rd-Octave Vibration
Level (VdB) 1/3rd-Octave
Band (Hz) Vibration Impact Criterion (VdB)
No. of Impacted Dwelling Units
20620 International Blvda 67 55 73 40 72 15
3121 S 211th St 32 55 77 63 72 1
21149 32nd Ave S 33 55 76 63 72 1
3048 S 225th Pl 32 55 75 63 72 1
22810 30th Ave S 33 55 75 40 72 26
22834 30th Ave S 30 55 76 40 72 57
23030 30th Ave S 14 55 82 50 72 4
23110 30th Ave S 10 55 85 50 72 4
23214 30th Ave S 10 55 84 63 72 1
23408 30th Ave Sb 24 55 90 50 72 27
3001/3006 S 288th St 40 55 72 25 72 56
Total 193
a Americas Best Value Inn, front half b New Best Inn Motel

6.0 Impact Assessment
Federal Way Link Extension 6-23 Noise and Vibration Technical Report November 2016
The Pacific Medical Center Federal Way and UW Neighborhood Federal Way Clinic would be over
100 ft from the Preferred Alternative and no impacts would occur if vibration‐sensitive equipment is
present.
The Kent/Des Moines At‐Grade Station Option and I‐5 Station Option would impact 20 units at the
King’s Arms Motel (Table 6‐8). Both options also remove the impacts at the single‐family home at
23214 30th Avenue S and the New Best Inn at 23408 30th Avenue S.
TABLE 6-8 Preferred Alternative, Potential Vibration Impacts for Kent/Des Moines At-Grade Station Option and I-5 Station Option
Address
Distance to Near Track
(ft) Speed (mph)
Maximum 1/3-Octave Vibration
Level (VdB)
1/3-Octave Band (Hz)
Vibration Impact
Criterion (VdB) No. of Impacted Dwelling Units
23226 30th Avenue S 18 55 81 50 72 20
Total 20
6.3.1.1 Landfill Median Alignment Option There would be no additional vibration impacts with this option.
6.3.1.2 S 272nd Star Lake Elevated Station Option There would be no additional vibration impacts with this option.
6.3.1.3 S 317th Elevated Alignment Option There would be no additional vibration impacts with this option.
6.3.1.4 Federal Way City Center Station Options There would be no additional vibration impacts with the Federal Way I‐5 Station Option or the Federal
Way S 320th Park‐and‐Ride Station Option.
6.3.2 SR 99 Alternative The projected vibration impacts for the SR 99 Alternative are shown in Table 6‐9. Vibration impacts are
predicted on the south and east sides of the Best Western Hotel because the edge of the nearest track
for this alternative would be 10 ft from the facade of the building. Vibration impacts are predicted at
50 units of the hotel. The predicted maximum vibration level is 82 VdB at the 50‐Hz 1/3‐octave band.
Impacts could potentially occur at the Sea Mar Community Health Center and Healthpoint Midway due
to the proximity of the light rail (less than 50 ft) to these facilities. If this alternative were selected as
the project to be built, Sound Transit would coordinate with these facilities to determine if any
sensitive equipment is present and if impacts could be avoided. The UW Neighborhood Kent/Des
Moines Clinic would be over 100 ft from the SR 99 Alternative and no impacts would occur if vibration‐
sensitive equipment is present.

6.0 Impact Assessment
Federal Way Link Extension 6-24 Noise and Vibration Technical Report November 2016
TABLE 6-9 SR 99 Alternative, Potential Vibration Impacts for SR 99 Alternative
Address
Distance to Nearest
Track (ft) Speed (mph)
Maximum 1/3-Octave Vibration
Level (VdB) 1/3-Octave Band (Hz)
Vibration Impact
Criterion (VdB) No. of Impacted Dwelling Units
20717 International Blvd 10 55 82 50 72 50
Total 50
6.3.2.1 S 216th Station Options The S 216th West Station Option would reduce impacts by 50 because the Best Western Hotel would
be displaced for this option.
With the S 216th East Station Option, there would be an additional 16 units with impacts at the New
West Hotel on International Blvd, as shown in Table 6‐10. These would be in addition to vibration
impacts at the Best Western Hotel with the SR 99 Alternative.
TABLE 6-10 Potential Vibration Impacts for S 216th East Station Option
Address
Distance to Nearest
Track (ft.) Speed (mph)
Maximum 1/3-Octave Vibration
Level (VdB) 1/3-Octave Band (Hz)
Vibration Impact
Criterion (VdB) No. of Impacted Dwelling Units
21450 International Blvd 15 45 80 50 72 16
Total 16
6.3.2.2 Kent/Des Moines Station Options The Kent/Des Moines HC Campus Station Option would have additional vibration impacts on three
floors of the Sea Mar Des Moines Housing, as shown in Table 6‐11. The impacts are due to proximity of
the tracks to the future residential units. The vibration levels are predicted to exceed the FTA impact
criteria at 12 residences.
TABLE 6-11 Potential Vibration Impacts for Kent/Des Moines HC Campus Station Option
Address
Distance to Nearest
Track (ft) Speed (mph)
Maximum 1/3-Octave Vibration
Level (VdB) 1/3-Octave Band
(Hz) Vibration Impact Criterion (VdB)
No. of Impacted Dwelling Units
24215 Pacific Hwy 10 55 81 63 72 12
Total 12
The Kent/Des Moines HC Campus Station Option would also have additional vibration impacts when
connecting to the S 216th West Station Option, as shown in Table 6‐12. This is because of a lower
profile north of Kent‐Des Moines Road. Additional vibration impacts would occur at three single‐family
residences, a multi‐family residence, and at multi‐family residential units at the Sea Mar Des Moines
Housing. The vibration levels are predicted to exceed the FTA impact thresholds at a total of 28
dwelling units at residences. There would be a net decrease in impacts with this combination of
options because the Best Western Hotel impacted by the SR 99 Alternative would be displaced, and

6.0 Impact Assessment
Federal Way Link Extension 6-25 Noise and Vibration Technical Report November 2016
those 50 impacts would no longer occur. No other change in vibration impacts is predicted for any of
the other Kent/Des Moines station options.
TABLE 6-12 Potential Vibration Impacts for Kent/Des Moines HC Campus Station Option from S 216th West Station Options
Address
Distance to Nearest
Track (ft) Speed (mph)
Maximum 1/3-Octave Vibration
Level (VdB) 1/3-Octave Band
(Hz) Vibration Impact Criterion (VdB)
No. of Impacted Dwelling Units
2628 222nd St 10 55 81 63 72 1
22620 28th Ave S 45 55 72 63 72 13
2809 S 240th St 10 55 81 63 72 1
2803 S 240th St 25 55 78 63 72 1
24215 Pacific Hwy 10 55 81 63 72 12
Total 28
6.3.2.3 S 260th Station Options There would be 12 additional vibration impacts at the Sea Mar Des Moines Housing for the S 260th
West Station Option compared to the SR 99 Alternative as shown in Table 6‐13. The S 260th East
Station Option would have two additional impacts at single‐family residences, as shown in Table 6‐14.
TABLE 6-13 Potential Vibration Impacts for S 260th West Station Option
Address
Distance to Near Track
(ft) Speed (mph)
Maximum 1/3-Octave Vibration
Level (VdB) 1/3-Octave Band
(Hz) Vibration Impact Criterion (VdB)
No. of Impacted Dwelling Units
24215 Pacific Hwy 15 55 80 50 72 12
Total 12
TABLE 6-14 Potential Vibration Impacts for S 260th East Station Option
Address
Distance to Near Track
(ft) Speed (mph)
Maximum 1/3-Octave Vibration
Level (VdB) 1/3-Octave Band
(Hz) Vibration Impact Criterion (VdB)
No. of Impacted Dwelling Units
26430 Pacific Hwy 10 55 82 50 72 1
26448 Pacific Hwy 35 55 82 50 72 1
Total 2
6.3.2.4 S 272nd Redondo Trench Station Option A summary of the vibration impact analysis is shown in Table 6‐15. Vibration impacts are predicted at
two single‐family residences, two multi‐family residences, and the Federal Way Motel for a total of
181 additional dwelling units.
TABLE 6-15 Potential Vibration Impacts for S 272nd Redondo Trench Station Option
Address
Distance to Near Track
(ft) Speed (mph)
Maximum 1/3-Octave Vibration
Level (VdB) 11/3-Octave Band
(Hz) Vibration Impact Criterion (VdB)
No. of Impacted Dwelling Units
1560 S 284th St 30 55 73 63 72 1
28418 16th Ave S 20 55 78 63 72 18
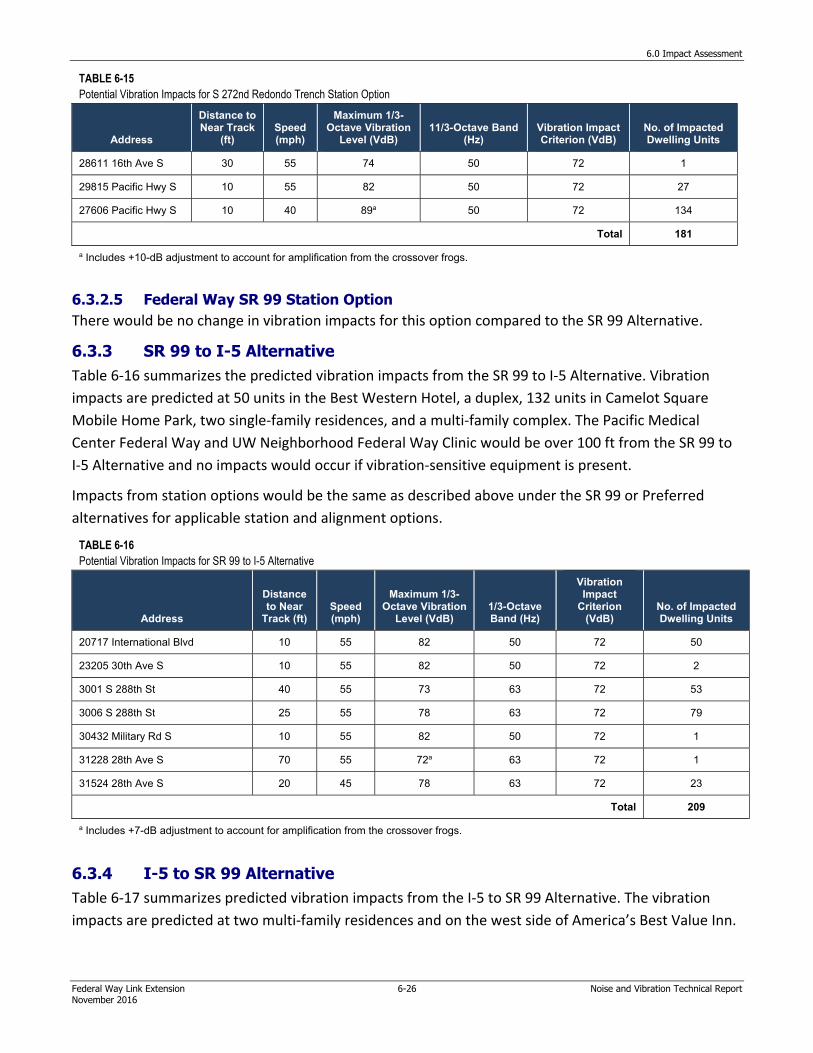
6.0 Impact Assessment
Federal Way Link Extension 6-26 Noise and Vibration Technical Report November 2016
TABLE 6-15 Potential Vibration Impacts for S 272nd Redondo Trench Station Option
Address
Distance to Near Track
(ft) Speed (mph)
Maximum 1/3-Octave Vibration
Level (VdB) 11/3-Octave Band
(Hz) Vibration Impact Criterion (VdB)
No. of Impacted Dwelling Units
28611 16th Ave S 30 55 74 50 72 1
29815 Pacific Hwy S 10 55 82 50 72 27
27606 Pacific Hwy S 10 40 89a 50 72 134
Total 181
a Includes +10-dB adjustment to account for amplification from the crossover frogs.
6.3.2.5 Federal Way SR 99 Station Option There would be no change in vibration impacts for this option compared to the SR 99 Alternative.
6.3.3 SR 99 to I-5 Alternative Table 6‐16 summarizes the predicted vibration impacts from the SR 99 to I‐5 Alternative. Vibration
impacts are predicted at 50 units in the Best Western Hotel, a duplex, 132 units in Camelot Square
Mobile Home Park, two single‐family residences, and a multi‐family complex. The Pacific Medical
Center Federal Way and UW Neighborhood Federal Way Clinic would be over 100 ft from the SR 99 to
I‐5 Alternative and no impacts would occur if vibration‐sensitive equipment is present.
Impacts from station options would be the same as described above under the SR 99 or Preferred
alternatives for applicable station and alignment options.
TABLE 6-16 Potential Vibration Impacts for SR 99 to I-5 Alternative
Address
Distance to Near
Track (ft) Speed (mph)
Maximum 1/3-Octave Vibration
Level (VdB) 1/3-Octave Band (Hz)
Vibration Impact
Criterion (VdB)
No. of Impacted Dwelling Units
20717 International Blvd 10 55 82 50 72 50
23205 30th Ave S 10 55 82 50 72 2
3001 S 288th St 40 55 73 63 72 53
3006 S 288th St 25 55 78 63 72 79
30432 Military Rd S 10 55 82 50 72 1
31228 28th Ave S 70 55 72a 63 72 1
31524 28th Ave S 20 45 78 63 72 23
Total 209
a Includes +7-dB adjustment to account for amplification from the crossover frogs.
6.3.4 I-5 to SR 99 Alternative Table 6‐17 summarizes predicted vibration impacts from the I‐5 to SR 99 Alternative. The vibration
impacts are predicted at two multi‐family residences and on the west side of America’s Best Value Inn.

6.0 Impact Assessment
Federal Way Link Extension 6-27 Noise and Vibration Technical Report November 2016
TABLE 6-17 Potential Vibration Impacts for I-5 to SR 99 Alternative
Address
Distance to Near
Track (ft) Speed (mph)
Maximum 1/3-Octave Vibration
Level (VdB) 1/3-Octave Band (Hz)
Vibration Impact
Criterion (VdB)
No. of Impacted Dwelling Units
20620 International Blvd 25 45 75 50 72 34
3118 S 216th St 40 55 73 63 72 4
22700 30th Ave S 25 55 77 63 72 7
Total 45
Impacts could potentially occur at the Healthpoint Midway Clinic due to the proximity of the light rail
(less than 50 ft) to this facility. If this alternative were selected as the project to be built, Sound Transit
would coordinate with this clinic to determine if any sensitive equipment is present and if impacts
could be avoided.
Impacts from station options would be the same as described above under the SR 99 or Preferred
alternatives for applicable station and alignment options, except for the S 260th West Station Option.
For this option, there would be no additional predicted impacts because it would be located farther
from the sensitive receivers on the west side of SR 99 where there are predicted impacts with this
option when it connects to the SR 99 Alternative.
6.4 Groundborne Noise Impacts This section presents the results of the groundborne noise impacts from train operations. As discussed
in Section 4, the FTA groundborne noise impact criteria were not applied for the majority of the
sensitive receivers since most of the track would be at‐grade or elevated, where airborne train noise
would dominate. However, groundborne noise impact criteria were applied to special buildings such as
concert halls or recording studios, as defined in the FTA manual. The Performing Arts Center at Federal
Way High School qualifies as a special building and would be located within 80 ft of the proposed
tracks for the SR 99 Alternative and the I‐5 to SR 99 Alternative. The predicted groundborne noise level
at this location is 35 dBA, which is 10 dBA above the FTA criteria of 25 dBA for a theater, resulting in a
predicted groundborne noise impact on this facility from these alternatives (Table 6‐18).
TABLE 6-18 Potential Groundborne Noise Impacts for SR 99 Alternative and I-5 to SR 99 Alternative
Address Distance to
Nearest Track (ft) Speed (mph) Predicted GBN
Levelsa GBN Impact
Criterion (dBA) No. of Potential
Impacts
31031 Pacific Hwyb 80 55 35 25 1
Total 1
a The predictions are based on conservative assumptions and should be verified during final design. b The Federal Way High School Performing Arts Center.
There are no special buildings near the Preferred Alternative and the SR 99 to I‐5 Alternative.

6.0 Impact Assessment
Federal Way Link Extension 6-28 Noise and Vibration Technical Report November 2016
6.5 Construction
6.5.1 Construction Noise Impact Analysis The construction noise analysis considers the temporary noise impacts that construction would cause
in the project vicinity. These impacts would end when project construction was completed.
Noise related to construction would result from the operation of heavy equipment needed to construct
various project components, including elevated structures, retaining walls, park‐and‐ride facilities, and
stations. The contractor would be required to adhere to local ordinances regulating noise, as discussed
in Section 4.1. Construction activities outside normal weekday daytime hours would require a noise
variance from the city where the work is being performed if regulatory noise levels would be exceeded.
Equipment required to complete the FWLE would include construction equipment typically used for
transportation construction projects. Table 6‐19 lists the typical equipment used for this type of
project, the activities it would be used for, and the corresponding maximum noise levels that would be
produced when measured at 50 ft from the sources under normal use.
TABLE 6-19 Construction Equipment and Reference Noise Levels
Equipment Expected Project Use Lmaxa, b (dBA)
Air compressors Pneumatic tools and general maintenance (all phases) 70 to 76
Backhoe General construction and yard work 78 to 82
Concrete pump Pumping concrete 78 to 82
Concrete saws Concrete removal and utilities access 75 to 80
Crane Materials handling: removal and replacement 78 to 84
Excavator General construction and materials handling 82 to 88
Forklifts Staging area work and hauling materials 72
Haul trucks Materials handling: general hauling 86
Jackhammers Pavement removal 74 to 82
Loader General construction and materials handling 86
Pavers Roadway paving 88
Pile-drivers Support for structures and hillsides 99 to 105
Power plants General construction use: nighttime work 72
Pumps General construction use: water removal 62
Pneumatic tools Miscellaneous construction work 78 to 86
Tractor trailers Material removal and delivery 86
Utility trucks General project work 72
Vibratory equipment Soil compaction and shoring up hillsides to prevent slides 82 to 88
Welders General project work 76
a Typical maximum noise level under normal operation as measured at 50 ft from the noise source. b Noise levels presented are based on measured data from the Portland Light Rail and I-5 Preservation and Hawthorne Bridge construction projects and other measured data, as well as U.S. Department of Transportation construction noise documentation and other construction noise sources.

6.0 Impact Assessment
Federal Way Link Extension 6-29 Noise and Vibration Technical Report November 2016
6.5.1.1 Construction Noise Several construction phases would be required to complete the FWLE. The FHWA Roadway
Construction Noise Model User’s Guide (FHWA, 2006) and associated computer model were used to
estimate project construction noise levels, as well as to predict the maximum noise levels for several
different construction phases. The analysis assumes the worst‐case average and maximum noise levels
based on three major types of construction described below and shown in Table 6‐20. The actual noise
levels experienced during construction would generally be lower than those described in Table 6‐19
because these are the maximum noise levels for each activity. The noise levels presented here are for
short periods of maximum construction activity and would occur for limited periods of time.
TABLE 6-20 Noise Levels for Typical Construction Phasesa
Scenariob Equipmentc Lmaxd Leqe
Demolition, site preparation, and utilities relocation
Air compressors, backhoes, concrete pumps, cranes, excavators, forklifts, haul trucks, loaders, pumps, power plants, service trucks, tractor trailers, utility trucks, and vibratory equipment
88 87
Structures construction, track installation, and paving activities
Air compressors, backhoes, cement mixers, concrete pumps, cranes, forklifts, haul trucks, loaders, pavers, pumps, power plants, service trucks, tractor trailers, utility trucks, vibratory equipment, and welders
88 82
Miscellaneous activities Air compressors, backhoes, cranes, forklifts, haul trucks, loaders, pumps, service trucks, tractor trailers, utility trucks, and welders
86 83
a Combined worst-case noise levels for all equipment at a distance of 50 ft from work site. b Operational conditions under which the noise levels are projected. c Normal equipment in operation under the given scenario. d Lmax (dBA) is the highest maximum noise level for the construction equipment listed under the given scenario. e Leq (dBA) is a 1-hour energy average noise emission for construction equipment operating under the given scenario.
Demolition, Site Preparation, and Utilities Relocation Major noise‐producing equipment in use during the site preparation stage of light rail construction
would include saw cutters, concrete pumps, cranes, excavators, haul trucks, loaders, tractor‐trailers,
and vibratory equipment. Maximum noise levels could reach 82 dBA to 88 dBA at the nearest
residences (i.e., within 50 to 100 ft) for normal construction activities during this phase. Other less‐
notable noise‐producing equipment expected during this phase would include backhoes, air
compressors, forklifts, pumps, power plants, service trucks, and utility trucks.
Structures Construction, Track Installation, and Paving Activities The loudest noise sources in use during construction of elevated structures would include cement
mixers, concrete pumps, cranes, pavers, haul trucks, and tractor‐trailers. The cement mixers, cranes,
and concrete pumps would be required for construction of the light rail superstructure. The pavers and
haul trucks would be used to provide the final surface on the trackway during other phases of
construction. Maximum noise levels would range from 82 dBA to 88 dBA at the closest receiver
locations.
Miscellaneous Activities Following heavy construction, general construction would still be required, such as installation of
guideway railing, signage, and communication and power systems, as well as other miscellaneous
activities. These less‐intensive activities are not expected to produce noise levels above 80 dBA at 50 ft
except during rare occasions, and even then only for short periods of time when combined maximum

6.0 Impact Assessment
Federal Way Link Extension 6-30 Noise and Vibration Technical Report November 2016
noise levels could reach 86 dBA Lmax at 50 ft. Using the information in Table 6‐20, typical construction
noise levels were projected for several distances from the project work area. Exhibit 6‐2 is a graph of
general construction noise level versus distance for phases of construction.
Pile Driving Pile driving would likely be required to support permanent structures such as piers for elevated
structures and retaining tunnel walls. Pile driving can produce maximum short‐term noise levels of
99 dBA to 105 dBA at 50 ft. Actual levels vary and depend on the distance and topographical conditions
between the pile‐driving location and the receiver location. Exhibit 6‐3 is a graph of maximum pile‐
driving noise levels versus distance.
Nighttime Construction Activities Some construction activities might be required during nighttime hours because of the nature of the
construction or to avoid daytime traffic impacts or impacts on some adjacent land uses. In order to
perform construction at night, a noise variance from the local governing agency would be required. If
nighttime construction is deemed necessary, Sound Transit would work with each governing agency to
obtain any necessary noise variance specific to project construction.
50
55
60
65
70
75
80
85
90
0 100 200 300 400 500 600 700 800 900 1000
Distance from Site in Feet
Ma
xim
um
So
un
d L
evel
in d
BA
Le
q
Construction Preparation Structure Demolition & Construction Miscellaneous Activities
EXHIBIT 6-2 Maximum Noise Level versus Distance for Typical Construction Phases

6.0 Impact Assessment
Federal Way Link Extension 6-31 Noise and Vibration Technical Report November 2016
6.5.1.2 Construction Activities Specific to the Preferred Alternative Under the Preferred Alternative, major noise‐producing equipment in use during the initial phases of
light rail construction would include demolition, site preparation, and utilities relocation. Along the
Preferred Alternative near SR 99 in SeaTac, noise‐sensitive receivers are mainly hotels. Where the
alignment transitions to I‐5, there is a large number of single‐family residences nearby. Maximum noise
levels at adjacent residences, hotels, and businesses would occasionally exceed 80 dBA Lmax for short
periods. Major construction noise would occur during demolition of existing structures, relocation of
utilities, installation of retaining walls (where required), repaving of local access and arterial roadways,
and construction of the at‐grade, retained cut‐and‐fill, and elevated guideway structures.
As the alignment proceeds along the west side of I‐5, construction of the retained cut and fill areas,
local roadway improvements, and demolition of structures could also result in elevated noise levels of
up to 80 dBA Lmax at the residences closest to the construction.
Construction of the elevated alignment and station south of the Kent‐Des Moines Road would require
the use of drill rigs, cement mixers, concrete pumps, cranes, pavers, haul trucks, and tractor‐trailers.
The drill rigs, cement mixers, cranes, and concrete pumps would be required for construction of the
light rail superstructure, parking garage, and station. The pavers and haul trucks would be used to build
the final surface on the trackway, new roadways, and parking areas. As with other areas, during
periods of high levels of construction, noise levels could reach 82 to 88 dBA Lmax for short periods.
South of the Kent/Des Moines Station area, the alignment would remain elevated and would require
the same equipment as used for the construction near the station; however, there are limited noise‐
sensitive properties in this area. The closest residences are located in the Midway Mobile Mansions,
75
80
85
90
95
100
105
110
0 100 200 300 400 500 600 700 800 900 1000
Distance in feet
Sound L
eve
l in L
max
EXHIBIT 6-3 Pile-driving Noise Level versus Distance

6.0 Impact Assessment
Federal Way Link Extension 6-32 Noise and Vibration Technical Report November 2016
where noise levels could reach 80 dBA Lmax during periods of high construction. South of these
residences is the Midway Landfill area, where the alignment is entirely elevated.
South of the landfill, the alignment would return to a retained cut and retained fill, with an elevated
segment over S 259th Place near the Pembrooke Apartments. Construction would require retaining
walls for retained cut and fill sections, and equipment necessary for construction of the elevated light
rail structure. Once the retaining walls are in place for the areas with the alignment at‐grade,
construction noise levels could be reduced due to the physical shielding provided by the retained cut
and walls.
South of the Pembrooke Apartments, the alignment would transition to a deep (20 ft or more) trench,
Construction of the trench would require excavators, cement mixers, concrete pumps, cranes, and haul
trucks. In addition to construction of the trench, 28th Avenue S would be relocated to the west,
requiring the installation of a new retaining wall and fill to support the new roadway location. The
Preferred S 272nd Star Lake Station and park‐and‐ride are also in this area; but the residences located
to the north of the station area are partly shielded from these construction activities by steep
topography.
The deep trench would transition to a cut‐and‐cover tunnel under S 272nd Street and the Mark Twain
Elementary School playfield. Construction of the tunnel would require extensive construction activities
on school grounds. The loudest noise sources in use during construction of the tunnel would include
excavators, cement mixers, concrete pumps, cranes, pavers, haul trucks, and tractor‐trailers.
Excavators and haul trucks would be used to dig out and haul away the deep cut sections. The cement
mixers, cranes, and concrete pumps would be required for construction of retaining walls and the
tunnel cover. Maximum noise levels would range from 82 to 94 dBA at distances of approximately
50 ft.
Under the S 272nd Star Lake Elevated Station Option, construction of the light rail superstructure,
parking garage, and station would require the use of the same types of equipment used for
construction south of the Kent‐Des Moines Road, including drill rigs, cement mixers, cranes, and
concrete pumps. Major construction activities at the Mark Twain Elementary School under this option
would include construction of the retaining wall and installation of the fill for the trackway. Equipment
likely for this construction phase includes cement mixers, concrete pumps, haul trucks, pavers, and
dozers or graders. During periods of intense construction activity, noise levels could reach 82 to 88 dBA
Lmax for short periods at approximately 50 ft from the activity. For trench and elevated profiles,
construction activities would be approximately 175 ft from the nearest classroom at Mark Twain
Elementary.
The alignment would remain in a deep cut to just north of Military Road, where it would transition to
elevated, cross Military Road and transition again to a retained cut. Although most noise‐sensitive
residences are shielded from much of the construction by the cut, noise from excavation and
construction of the retaining wall could produce noise levels up to 80 dBA Lmax at many residences
near the alignment.

6.0 Impact Assessment
Federal Way Link Extension 6-33 Noise and Vibration Technical Report November 2016
South of S 288th Street, along the Camelot Square Mobile Home Park, the removal and reconstruction
of a noise barrier and the grading of an existing berm would require the use of concrete saws,
excavators, cement mixers, concrete pumps, cranes, and haul trucks. Every attempt would be made to
replace the sound walls early in the construction process, if possible, to allow the walls to assist with
mitigating construction noise. Without the sound walls, there would be short periods of time with
maximum noise levels exceeding 80 dBA Lmax; when the walls are replaced, the maximum levels
should be 10 dBA to 12 dBA lower than without the walls in place.
South of Camelot Square, the alignment would be in a retained cut and fill section. Construction noise
in this area would include the excavation of the cut segments, construction of retaining walls, and
placement of fill from S 288th Street south along Camelot Square and again near Military Road. The
proximity of the construction to the residences in this area would be expected to result in construction
noise levels of 82 to 84 dBA Lmax. Once the second crossing of Military Road is completed with an
elevated structure, the alignment would be in a retained cut to the cut‐and‐cover tunnel under the
S 317th Street roundabout. Although much of the construction along I‐5 can be accomplished using
access roads west of I‐5, some activities would require access from 28th Avenue S, and construction
noise would still meet or exceed 80 dBA Lmax during periods of heavy construction. Additional noise
would also occur near the S 317th Street roundabout due to repaving the area once the cut‐and‐cover
tunnel is completed. Because of the distance between the alternative and the Truman High School
buildings (over 400 ft) and existing noise levels, construction noise is not expected to disrupt interior
school activities and would have a minimal effect on exterior activities.
After the cut‐and‐cover tunnel under the S 317th Street roundabout, the alignment would transition to
an elevated structure and continue to the Federal Way Transit Center Station. Construction of the
elevated alignment and station would require the use of drill rigs, cement mixers, concrete pumps,
cranes, pavers, haul trucks, and tractor‐trailers. The drill rigs, cement mixers, cranes, and concrete
pumps would be required for construction of the light rail guideway, parking garage, and station area.
The pavers and haul trucks would be used to provide the final surface on the trackway, new roadways,
and parking areas. As with other areas, noise levels could reach 82 to 88 dBA Lmax for short periods.
6.5.2 Construction Vibration Impacts Some of the high‐vibration activities during construction would involve demolition of buildings,
construction of elevated structures, excavation of trenches, pavement breaking, ground compaction,
and other related construction activities. Construction of elevated structures would require deep pile
foundations. A pile‐driver is used to drive the piles into soil to provide support to columns of elevated
structures. Traditional construction practices employ impact pile‐drivers to build pile foundations. Pile‐
drivers that are driven by hydraulics have better control on the impact forces and can provide better
efficiency in overcoming soil resistance.
The primary concern from construction activities is potential for damage to buildings. Because
construction vibration is temporary, it is usually not a major concern for annoyance. The details of the
construction means and methods for building this project are not available at this time. The major
pieces of high‐vibration construction equipment likely to be used in this project are listed in Table 6‐21.

6.0 Impact Assessment
Federal Way Link Extension 6-34 Noise and Vibration Technical Report November 2016
Because there are several alternatives and options, the construction vibration analysis focused on
determining the distance beyond which the damage risk criteria and annoyance criteria would not be
exceeded for the major vibration‐generating pieces of equipment that are likely to be used for the
FWLE. The analysis is based on reference peak particle velocity (PPV) levels for the construction
equipment from the D to M Street Rail project in Tacoma, Washington, and the FTA Guidance Manual
(FTA, 2006), and results of the analysis are summarized in Table 6‐21.
TABLE 6-21 Distance to Construction Vibration Impact Thresholds
Equipment PPV Ref Level at
100 ft (in./sec)
Distance to Impact Thresholds (ft)
Damage Criteria 0.5 in./sec PPVa
Damage Criteria 0.2 in./sec PPVa
Annoyance Criteria 0.016 in./sec PPVb
Annoyance Criteria 0.022 in./sec PPVb
Vibratory pile-driver 0.140 45 80 450 350
Impact pile-driver 0.200 55 100 550 425
Sonic pile-driver 0.213 14 23 120 100
Auger drill rig 0.011 8 15 80 65
Cranes 0.001 2 3 16 13
Dozer 0.011 8 15 80 65
Dump truck 0.010 8 15 80 65
Front-end loader 0.011 8 15 80 65
Jackhammer 0.003 4 7 32 26
Mounted hammer hoe ram 0.190 53 97 525 400
a The impact threshold for reinforced concrete, timber, or steel buildings is 0.5 in./sec PPV and the impact threshold for nonengineered timber and masonry buildings is 0.2 in./sec PPV. b The impact threshold for annoyance is 0.016 in./sec for residential nighttime use (72 VdB) and 0.022 in./sec for institutional land use (75 VdB).
The key results of the analysis are:
Most of the equipment can be operated without risk of damage at distances of 15 ft or greater
from nonengineered timber and masonry buildings or at distances of 8 ft or greater from
reinforced concrete buildings. The exceptions are the mounted hammer hoe ram and impact pile‐
drivers, which should generally only be operated at an approximate distance of 55 ft or greater
from reinforced concrete buildings or a distance of 100 ft from nonengineered timber and masonry
buildings.
Use of alternate pile‐driving methods can reduce construction vibration substantially. For example,
sonic pile‐drivers at lower settings can be operated at distances of 25 ft or greater from historic
buildings. Annoyance thresholds at residential land uses can be exceeded from operations of
impact pile‐drivers and mounted hammer hoe rams at distances greater than 500 ft.
Most construction equipment can be operated without exceeding the annoyance impact thresholds at
distances greater than 80 ft from residential land uses. Exceeding annoyance limits does not require a

6.0 Impact Assessment
Federal Way Link Extension 6-35 Noise and Vibration Technical Report November 2016
commitment to mitigate the vibration. Annoyance levels may be considered by Sound Transit at a later
date.
Major construction of deep cuts and cut and cover tunnels will occur at S 216th Street north of the
S 272nd Star Lake Station, with a cut‐and‐cover tunnel from S 272nd Street past the Mark Twain School
and at the S 317th Street roundabout. Vibration‐producing activities in these areas could include the
installation of supporting sheet piles, typically installed using vibratory sheet pile driving systems. The
sheet piles would be used to prevent the retained cuts from collapsing while the retaining walls are
constructed. Although the vibration from these activities can be annoying, the vibration levels are not
expected to be sufficient to cause any structural damage. Other vibration sources could include
compacting rollers and general construction activities, none of which is predicted to be of sufficient
magnitude to result in vibration impacts at distance of 50 ft or more from the site. Because of the
distances of the Preferred Alternative, the SR 99 to I‐5 Alternative, the S 272nd Star Lake Elevated
Station Option, and the S 317th Elevated Alignment Option from Mark Twain Elementary School and
Truman High School, there would be no construction vibration impacts on these facilities. As specific
information on the construction methods are developed, additional analysis would be conducted to
minimize construction vibration.

This page intentionally left blank.

Federal Way Link Extension 7-1 Noise and Vibration Technical Report November 2016
7.0 Potential Noise and Vibration Mitigation Measures
For locations where Sound Transit has identified potential noise impacts, mitigation measures would
be considered and reviewed using Sound Transit’s Light Rail Noise Mitigation Policy (Sound Transit,
2004) and the FTA Guidance Manual (2006). Under this Noise Mitigation Policy, potential mitigation
measures would be considered for all noise impacts.
Sound Transit’s noise mitigation policy is to mitigate first with source treatment, followed by
treatments in the noise path. If source and path treatments are not sufficient to mitigate the impact,
Sound Transit would evaluate the need for sound insulation at affected properties where the existing
building does not already achieve sufficient exterior‐to‐interior reduction of noise levels.
Where potential vibration impacts are identified, vibration mitigation measures will be considered.
Vibration mitigation measures focus on reducing the source of vibration, with path and building
treatment being considered as secondary measures.
The following sections provide an introduction to the mitigation strategies normally used for light rail
projects. Following this introduction are the mitigation strategies and measures proposed for the
FWLE.
During final design, all impacts and potential mitigation measures would be reevaluated to verify
impact levels and inform the mitigation design. If it is discovered that the mitigation can be achieved
by less costly means, or if refined detailed analysis shows reduced or no impact, the mitigation
measure may be changed or eliminated. Conversely, if any additional noise impacts were identified
during final design, then Sound Transit would provide reasonable and feasible mitigation consistent
with the Sound Transit Noise Mitigation Policy (Sound Transit, 2004).
7.1 Potential Noise Mitigation This section discusses mitigation for noise generated by the operation of the FWLE. Potential
mitigation measures for construction noise are discussed in Section 7.3.
7.1.1 Types of Noise Mitigation There are several types of noise mitigation measures that can be used to reduce noise levels and
mitigate noise impacts. Even before considering mitigation, Sound Transit has incorporated several
noise‐reducing project design elements into the FWLE. These include parapet noise reduction from
elevated structures and retained‐cut segments where project‐related design reduces noise from light
rail operations. For areas where these types of design options were not available, other forms of
mitigation are considered and are discussed below.

7.0 Potential Noise and Vibration Mitigation Measures
Federal Way Link Extension 7-2 Noise and Vibration Technical Report November 2016
7.1.1.1 Noise Source Mitigation One of the most effective forms of noise mitigation is to reduce noise at the source. One form of
source noise reduction is using light rail vehicles with low noise levels. Sound Transit has purchased
state‐of‐the‐art, lower‐noise vehicles equipped with noise‐reducing wheel skirts covering the wheel‐
rail interface. Several additional operational measures can also be used to reduce noise levels at the
source. Table 5‐1 (in Section 5) lists operational and maintenance measures that Sound Transit
performs on a regular basis and the benefits that these measures provide. Source treatments that
Sound Transit is currently using to minimize noise impacts include requiring wheel skirts, maintaining
smooth tracks, performing vehicle maintenance and wheel truing, and conducting operator training.
Research into methods of reducing wheel squeal noise, including using non‐oil‐based lubricants (such
as water) and friction modifiers, has found such methods effectively reduce or eliminate wheel squeal.
The lubricants can be applied by personnel working trackside or by an automated applicator. Sound
Transit’s light rail design criteria (Sound Transit, 2016) calls for lubricating all curves with a radius of
less than 600 ft that are located in noise‐sensitive areas, and to prepare all curves with a radius of less
than 1,250 ft for lubrication. This means that if wheel squeal is identified on these curves that are
between 600 and 1,250 ft after system operation begins, it is possible to more easily add lubricators.
When a light rail train travels over special trackwork for crossovers or turnouts, there is a loud clicking
noise as the steel wheels go over the gap between the tracks. This can increase noise levels from the
train by as much as 10 dBA compared with a smooth track with no gaps. Mitigation for noise impacts
from special trackwork can include relocating the crossover or turnout away from noise‐sensitive
properties, or using special frogs that include gap‐closing mechanisms or movable‐point frogs, as
described in Section 5.1.3. With standard rigid frogs, noise and vibration occurs when the wheels pass
over the gap, but a movable‐point frog eliminates the gap and one end of the frog moves in the
direction of train travel. Other similar options for reducing noise from special trackwork include spring‐
rail or flange‐bearing frogs. Relocation of special trackwork to more than 500 ft from noise‐sensitive
sites also could be used to eliminate the noise impact from the frogs.
7.1.1.2 Noise Path Mitigation The next type of mitigation considered would be applied between the noise source and receiver.
Typical noise path mitigation includes earth berms, sound walls, and buffer zones. Constructing
barriers between the light rail tracks and the affected receivers would reduce noise levels by physically
blocking the transmission of noise generated by light rail. Barriers can be constructed as walls or earth
berms. Berms require more right‐of‐way than walls and are usually constructed with a 3‐to‐1 slope. For
the FWLE, berms would not generally be feasible because of topographical conditions and limited
right‐of‐way.
Two types of sound walls are typically used for transit projects. For at‐grade segments, the noise
barrier type is a standard concrete wall. On the elevated guideway, lightweight acoustical walls that
place less load on the structure are used. Sound walls should be high enough to break the line of sight
between the noise source and the receiver. The typical height for sound walls is 6 to 8 ft when at‐grade
and 4 to 6 ft when on elevated structures. Sound walls must also be long enough to prevent flanking of

7.0 Potential Noise and Vibration Mitigation Measures
Federal Way Link Extension 7-3 Noise and Vibration Technical Report November 2016
noise around the ends of the walls. Openings in sound walls for driveway connections or intersecting
streets greatly reduce the effectiveness of these walls.
Buffer zones are undeveloped open spaces between the noise source and receiver. Buffer zones are
created when an agency purchases land or development rights in addition to the normal right‐of‐way,
so that future dwellings cannot be constructed close to the noise source. The FWLE corridor is an urban
area where land is at a premium, so creating buffer zones is not a feasible form of noise mitigation
because it would require substantially more project‐related displacements.
7.1.1.3 Noise Receiver Mitigation For situations where noise path mitigation would be either unfeasible or ineffective, Sound Transit
would consider adding sound insulation to buildings. Sound insulation programs are developed to
reduce the interior noise levels in sleeping and living quarters in residential land uses or in noise‐
sensitive areas such as schools and other institutional uses to within the guidelines set by the U.S.
Department of Housing and Urban Development. Under these guidelines, interior noise levels for
residential land uses should not exceed 45 dBA Ldn, and a form of fresh air exchange must be
maintained. The air exchange can be achieved by opening a window or using a ventilation system.
Sound insulation is normally only used on older dwellings with single‐paned windows, or in buildings
with double‐paned windows that are no longer effective because of leakage. Sound insulation would
not reduce exterior noise levels.
7.1.2 Transit Noise Mitigation This section generally describes the potential noise mitigation measures that would be used for the
light rail alternatives. The mitigation design is based on the current alignments as provided by the
Sound Transit design team and are implemented to meet the requirements of the Sound Transit Light
Rail Noise Mitigation Policy and the FTA Guidance Manual.
Sound walls would be the primary form of noise mitigation for transit noise impacts. Appendix B,
Detailed Noise Impact Assessment Data, provides complete details on mitigation, including projected
noise levels with the proposed noise mitigation measures for each receiver. A summary of the
alternative‐specific mitigation measures is presented in the tables in each subsection below.
7.1.2.1 Preferred Alternative Light Rail Noise Mitigation The primary noise mitigation measure for the Preferred Alternative and options is sound walls,
summarized in Table 7‐1. Sound walls ranging from 4 to 18 ft high may be required. The taller walls,
higher than 6 to 8 ft, are used to mitigate impacts on the upper floors in multi‐family units. With these
sound walls, all light rail transit related noise impacts would be mitigated.
7.1.2.2 SR 99 Alternative Light Rail Noise Mitigation The primary noise mitigation measure for the SR 99 Alternative and options is sound walls, which are
summarized in Table 7‐2. Locations of sound walls are provided on the maps in Appendix C. Depending
on the option, sound walls from 4 to 8 ft high may be required. With these sound walls, the majority of
noise impacts would be mitigated. Any residual noise impacts would be mitigated with sound
insulation if necessary.

7.0 Potential Noise and Vibration Mitigation Measures
Federal Way Link Extension 7-4 Noise and Vibration Technical Report November 2016
TABLE 7-1 Summary of Potential Noise Impacts and Mitigation Measures – Preferred Alternative and Options
Alternative
Proposed Noise Mitigation Measures for Impacts
Type Total Length
(not continuous) Height Number of Units
for Insulation
Preferred Alternative – West Side Sound wall
21,700 ft 4 - 18 ft 0
Preferred Alternative – East Side 5,000 ft 4 - 6 ft
Kent/Des Moines Station Options
Kent/Des Moines I 5 Station Option Grade – West Side Sound wall
19,900 ft 4 - 18 ft 0
Kent/Des Moines I-5 Station Option Grade – East Side 4,700 ft 4 - 6 ft
Kent/Des Moines At-Grade – West Side Sound wall
19,900 ft 4 - 18 ft 0
Kent/Des Moines At-Grade – East Side 6,500 ft 4 - 6 ft
Landfill Median Alignment Option – West side Sound wall
20,300 ft 4 - 18 ft 0
Landfill Median Alignment Option – East Side 7,900 ft 4 - 6 ft
S 272nd Star Lake Elevated Station Option – West side Sound wall
23,700 ft 4 – 18 ft 0
S 272nd Star Lake Elevated Station Option – East side 5,000 ft 4 - 6 ft
S 317th Elevated Alignment Option – West side Sound wall
21,700 ft 4 - 18 ft 0
S 317th Elevated Alignment Option – East side 5,400 ft 4 - 6 ft
Federal Way City Center Station Options
Federal Way I-5 Station Option – West Side Sound wall
19,700 ft 4 - 18 ft 0
Federal Way I-5 Station Option – East Side 6,000 ft 4 - 7 ft
Federal Way S 320th Park-and-Ride Station Option – West Side Sound wall
19,700 ft 9 - 12 ft 0
Federal Way S 320th Park-and-Ride Station Option – East Side 6,100 ft 4 - 12 ft
TABLE 7-2 Summary of Potential Noise Impacts and Mitigation Measures – SR 99 Alternative and Options
Alternative
Proposed Noise Mitigation Measures for Impacts
Type Total Length
(not continuous) Height Number of Units
for Insulation
SR 99 Alternative – West Side Sound wall and insulation
22,100 ft 4 - 8 ft 71
SR 99 Alternative– East Side 22,600 ft 4 - 8 ft
S 216th Station Options
S 216 West Station Option – West Side Sound wall and insulation
21,700 ft 4 - 8 ft 71
S 216 West Station Option – East Side 21,900 ft 4 - 8 ft
S 216 East Station Option – West Side Sound wall and insulation
21,500 ft 4 - 8 ft 71
S 216 East Station Option – East Side 23,800 ft 4 - 8 ft
Kent/Des Moines Station Options
Kent/Des Moines HC Campus Station Option – West Side Sound wall and insulation
28,100 ft 4 - 8 ft 75
Kent/Des Moines HC Campus Station Option – East Side 19,600 ft 4 - 8 ft
Kent/Des Moines HC Campus Station Option to S 216th West Station Option – West Side Sound wall and
insulation
18,800 ft 4 - 9 ft
71 Kent/Des Moines HC Campus Station Option to S 216th West Station Option – East Side
15,100 ft 4 - 8 ft
Kent/Des Moines SR 99 Median Station Option – West Side
Sound wall and insulation
20,900 ft 4 - 8 ft 67

7.0 Potential Noise and Vibration Mitigation Measures
Federal Way Link Extension 7-5 Noise and Vibration Technical Report November 2016
TABLE 7-2 Summary of Potential Noise Impacts and Mitigation Measures – SR 99 Alternative and Options
Alternative
Proposed Noise Mitigation Measures for Impacts
Type Total Length
(not continuous) Height Number of Units
for Insulation
Kent/Des Moines SR 99 Median Station Option – East Side
21,000 ft 4 - 8 ft
Kent/Des Moines SR 99 East Station Option - West Side Sound wall and insulation
21,000 ft 4 - 8 ft 67
Kent/Des Moines SR 99 East Station Option - East Side 16,100 ft 4 - 8 ft
S 260th Station Options
S 260th West Station Option – West Side Sound wall and insulation
18,500 ft 4 - 8 ft 80
S 260th West Station Option – East Side 16,500 ft 4 - 8 ft
S 260th East Station Option – West Side Sound wall and insulation
21,500 ft 4 - 8 ft 71
S 260th East Station Option – East Side 22,000 ft 4 - 8 ft
S 272nd Redondo Trench Station Option – West Side Sound wall and insulation
16,800 ft 4 - 8 ft 138
S 272nd Redondo Trench Station Option – East Side 12,600 ft 4 - 12 ft
Federal Way SR 99 Station Option – West Side Sound wall and insulation
22,100 ft 4 - 8 ft 71
Federal Way SR 99 Station Option – East Side 22,400 ft 4 - 8 ft
7.1.2.3 SR 99 to I-5 Alternative Light Rail Noise Mitigation The primary noise mitigation measure for the SR 99 to I‐5 Alternative and options is sound walls. Sound
walls for the SR 99 to I‐5 Alternative are listed in Table 7‐3. With these sound walls, the majority of
noise impacts would be mitigated. Any residual noise impacts would be mitigated with sound
insulation if necessary.
TABLE 7-3 Summary of Potential Noise Impacts and Mitigation Measures – SR 99 to I-5 Alternative
Alternative
Proposed Noise Mitigation Measures for Impacts Number of Units for
Insulation Type Total Length
(not continuous) Height
SR 99 to I-5 Alternative – West Side Sound wall and insulation
23,000 ft 4 - 15 ft 23
SR 99 to I-5 Alternative – East Side 9,400 ft 4 - 8 ft
S 216th Station Options
S 216 West Station Option – West Side Sound wall and insulation
22,600 4 - 15 ft 23
S 216 West Station Option – East Side 8,700 4 - 8 ft
S 216 East Station Option – West Side Sound wall and insulation
22,400 4 - 15 ft 23
S 216 East Station Option – East Side 10,600 4 - 8 ft
Landfill Median Alignment Option – West side Sound wall and insulation
28,600 4 - 8 ft 23
Landfill Median Alignment Option – East Side 17,300 4 - 15 ft
Federal Way City Center Station Options
Federal Way I-5 Station Option – West Side Sound wall and insulation
26,600 4 - 15 ft 23
Federal Way I-5 Station Option – East Side 5,100 4 - 8 ft
Federal Way S 320th Park-and-Ride Station Option – West Side Sound wall and
insulation
26,300 4 - 15 ft
23 Federal Way S 320th Park-and-Ride Station Option – East Side
5,100 4 - 8 ft

7.0 Potential Noise and Vibration Mitigation Measures
Federal Way Link Extension 7-6 Noise and Vibration Technical Report November 2016
7.1.2.4 I-5 to SR 99 Alternative Light Rail Noise Mitigation The primary noise mitigation measure for the I‐5 to SR 99 Alternative and options is sound walls,
summarized in Table 7‐4. With these sound walls, the majority of noise impacts would be mitigated.
Any residual noise impacts would be mitigated with sound insulation if necessary.
TABLE 7-4 Summary of Potential Noise Impacts and Mitigation Measures – I-5 to SR 99 Alternative
Alternative
Proposed Noise Mitigation Measures for Impacts Number of Units for
Insulation Type Total Length
(not continuous) Height
I-5 to SR 99 Alternative – West Side Sound wall and insulation
25,640 ft 4 - 11 ft 67
I-5 to SR 99 Alternative – East Side 23,200 ft 4 - 8 ft
S 260th Station Options
S 260th West Station Option – West Side Sound wall and insulation
25,300 ft 4 - 11 ft 67
S 260th West Station Option – East Side 21,100 ft 4 - 8 ft
S 260th East Station Option – West Side Sound wall and insulation
25,040 ft 4 - 11 ft 67
S 260th East Station Option – East Side 22,800 ft 4 - 8 ft
S 272nd Redondo Trench Station Option – West Side Sound wall and insulation
20,340 ft 4 - 11 ft 138
S 272nd Redondo Trench Station Option – East Side 15,580 ft 4 - 12 ft
Federal Way SR 99 Station Option – West Side Sound wall 25,640 ft 4 - 11 ft 67
Federal Way SR 99 Station Option – East Side 23,000 ft 4 - 8 ft
7.1.2.5 Park-and-Ride Noise Mitigation Noise impacts related to bus and automobile noise at stations with parking lots or garages would be
mitigated with station design and sound walls. Station design would include incorporating noise
barriers inside the station to block noise from the light rail, bells, and PA systems emanating from the
station. In addition, whenever possible, stations and parking areas would be designed to minimize the
generation and transmission of noise. Sound walls would also be used around the station bus layover
areas and parking areas where necessary. Finally, sound insulation could be used to mitigate any
residual noise impacts on nearby receivers.
The only station noise impact under the Preferred Alternative is to a single‐family residence on the
Park of the Pines property. Mitigation for this impact could be sound insulation. Eight manufactured
homes in the Green Acres Mobile Home Park are predicted to have station‐related noise impacts under
the SR 99 Alternative with the Kent/Des Moines SR 99 West Station, the Kent/Des Moines SR 99
Median Station Option, and the Kent/Des Moines SR 99 East Station Option, as well as under the I‐5 to
SR 99 with the Kent/Des Moines 30th Avenue West Station. A sound wall located along the east side of
the parking garage would be sufficient to mitigate the impacts from all the station options in this area.
7.1.3 Traffic Noise Mitigation Potential traffic noise impacts could be mitigated either alone or in conjunction with the proposed light
rail mitigation. In order to assess potential mitigation measures, receivers in the five project areas
described in Section 6.2.1 were analyzed by comparing the No Build and Build alternative traffic noise

7.0 Potential Noise and Vibration Mitigation Measures
Federal Way Link Extension 7-7 Noise and Vibration Technical Report November 2016
levels from TNM for each receiver. The results of the modeling efforts provided comprehensive traffic
noise levels and allowed identification of areas where traffic noise mitigation should be considered,
regardless of whether or not the SR 509 project, as described in the 2003 FEIS and ROD, is constructed.
Noise mitigation is designed to ensure that, whenever possible, there would be no additional
residences in the study areas with traffic noise levels above the WSDOT NAC of 66 dBA as a result of
the project. Additionally, any residence with a predicted No Build hourly traffic noise Leq of 66 dBA or
more would, whenever possible, receive noise mitigation under the build alternative designed to
maintain future noise levels at or below the No Build noise levels. Sound walls would mitigate all traffic
noise impacts to within the project traffic noise impacts criteria (Table 7‐5). The FWLE without the SR
509 Extension is expected to require approximately 15,050 linear feet of sound wall, with heights
ranging from 4 to 22 ft. With the SR 509 Extension, and including the SR 509 noise walls as presented in
the 2003 FEIS and ROD, the length would increase slightly to 15,750 ft, with the heights remaining the
same. Table 7‐6 provides a summary of light rail mitigation modifications to sound walls.
TABLE 7-5 Summary of Potential Preferred Alternative Traffic Noise Impacts
Study Area and Comparison Being Made Number of Units
Modeled Number of Impacted
Unitsa Number of Impacts
after Mitigationb
S 212th Street to Kent-Des Moines Road
Build without SR 509 340 181 0
Build with SR 509 2 0
Kent/Des Moines Station
Build without SR 509 281 1 0
Build with SR 509 1 0
S 272nd Star Lake Station
Build without SR 509 27 5 0
Build with SR 509 5 0
Military Rd to S 288th Street
Build without SR 509 54 16 0
Build with SR 509 16 0
S 288th Street to S 298th Street
Build without SR 509 244 59 0
Build with SR 509 55 0
Total
Build without SR 509 946 262 0
Build with SR 509 79 0
a Indicates the number of units where the Preferred Alternative is predicted to cause a new impact (without SR 509 improvements or with SR 509 improvements). b Mitigation that includes the sound walls recommended for inclusion under the 2003 FHWA ROD for the SR 509 Extension (without SR 509 improvements or with SR 509 improvements).

7.0 Potential Noise and Vibration Mitigation Measures
Federal Way Link Extension 7-8 Noise and Vibration Technical Report November 2016
TABLE 7-6 Summary of Light Rail Mitigation Modifications
Study Area
Light Rail Sound Wall
Modified Light Rail or New Sound Wallb
Build without SR 509 Build with SR 509
Length (ft)a Height (ft) Length (ft)a Height (ft) Length (ft)a Height (ft)
S 212th Street to Kent-Des Moines Road 6,200 4 – 18 9,100 4 – 21 9,100 6 - 21
Kent/Des Moines Station None None None None None None
S 272nd Star Lake Station None None 1,000 6 – 8 1,100 8 - 10
Military Road to S 288th Street 1,900 4 – 8 2,000 4 – 8 2,400 4 - 14
S 288th Street to S 298th Street 2,500 6 2,950 6 – 22c 3,150 6 – 22d
Total 10,600 4 - 18 15,050 4 – 21 15,750 4 – 21
a The length given is the sum of all segments that have a height greater than zero. Some areas do not require sound walls, and the total includes all segments where a wall is required. b Where no light rail sound wall is proposed for an area, the length and height given are for a sound wall that is necessary only to mitigate traffic noise. c Includes replacement sound wall for sound wall removed south of S 288th Street. d Includes replacement sound wall for sound wall removed south of S 288th Street and potential wall on north side of Camelot Square Mobile Home Park.
The modeled traffic noise levels for each analyzed unit are provided in Appendix B, Detailed Noise
Impact Assessment Data. Analyzed locations and recommended sound wall locations are shown on
maps in Appendix C, Detailed Noise and Vibration Analysis Maps. Appendix B also contains detailed
location information for the recommended sound walls.
The ability of the light rail sound walls to mitigate traffic noise, either alone or in combination with the
sound walls included in the SR 509 Extension, and either with or without any modifications in length
and/or height, varies by analysis area. For instance, the proposed light rail wall in the area between
S 212th Street and S 220th Street would need to be modified under the FWLE Preferred Alternative
without the SR 509 Extension but would not need to be changed at all for the FWLE Preferred
Alternative with the SR 509 Extension. Similarly, the light rail wall proposed between S 225th Street
and Kent‐Des Moines Road would need to be increased in height to provide mitigation for traffic noise.
Regardless of the combination of abatement measures required, as indicated previously, all of the
traffic noise impacts associated with the Preferred Alternative can be mitigated with sound walls. In
Table 7‐6, the length and height of the light rail mitigation for each study area, if any, is given along
with that of the modified or new sound walls that are necessary to mitigate traffic noise impacts.
Identification of the mitigation is made for the FWLE both with and without the SR 509 Extension. A
more detailed explanation of the modifications required by analysis area follows the table.
7.1.3.1 S 212th Street to Kent-Des Moines Road Buildings would be removed and topography would be changed for the alignment between S 212th
and Kent‐Des Moines Road. This would result in 181 traffic noise impacts in this area if the SR 509
Extension is not built. After mitigation, there would be no traffic noise impacts. The light rail sound
walls in this area range from 4 ft near S 212th Street to 18 ft at the south end. Under the build
alternative without the SR 509 Extension, the light rail sound walls would eliminate all traffic noise
impacts between S 212th Street and S 225th Street other than in the middle of this area, where no

7.0 Potential Noise and Vibration Mitigation Measures
Federal Way Link Extension 7-9 Noise and Vibration Technical Report November 2016
light rail walls are required for a stretch of approximately 2,000 ft. As a result, approximately 1,300 ft
of this stretch would need to have a new sound wall ranging from 6 to 9 ft high. From S 227th Street to
S 230th Street, the light rail sound walls would need to be increased by up to 13 ft, or up to a
maximum height of 21 ft, in order to mitigate all of the traffic noise impacts.
The build alternative with the SR 509 Extension would result in two traffic noise impacts. This reduction
in impacts when compared to the results without SR 509 are due to including SR 509 Extension sound
walls that would run along both I‐5 and the redesigned off‐ramp at Kent‐Des Moines Road. The
remaining two traffic noise impacts would be mitigated by modifying the light rail sound walls from S
227th Street to S 231st Street. However, the modified light rail walls would be up to 6 ft shorter in
portions of this area than they would be without the SR 509 Extension because of the traffic noise
mitigation provided by the two SR 509 Extension sound walls. For the same reason, the light rail sound
walls north of S 225th Street would not need to be modified under the build alternative with the SR
509 Extension. With all of the proposed mitigation, there would be no traffic noise impacts.
7.1.3.2 Kent/Des Moines Station The removal of buildings to construct the Kent/Des Moines Station, along with the addition of the new
S 236th Street and S 234th and S 238th Streets, would result in one traffic noise impact in this area if
the SR 509 Extension is not built. However, because there was no abatement proposed in this area as
part of the SR 509 Extension, that impact would exist regardless of whether or not the SR 509
Extension is built. Because this single residence would also have park‐and‐ride impacts, sound
insulation is proposed for mitigation of all noise at this home.
7.1.3.3 S 272nd Star Lake Station Improvements to the Star Lake Park‐and‐Ride at S 272nd Street and construction of a new station, as
well as the realignment of 28th Avenue S north of the park‐and‐ride, would result in five traffic noise
impacts in this area regardless of whether or not the SR 509 Extension is built. Because there is neither
a light rail sound wall nor an SR 509 Extension sound wall proposed for this area, the traffic noise
impacts would be abated in both cases by constructing a sound wall along the west side of the light rail
alignment. Under the build alternative without the SR 509 Extension, that wall would be approximately
100 ft long and 6 to 8 ft high and would be located between the residences and I‐5. The height of the
wall would need to be increased by 2 to 4 ft along its entire length and the length extended 100 ft on
the south end in order to mitigate the higher traffic noise levels associated with the SR 509 Extension.
There would be no traffic noise impacts from the realignment of 28th Avenue S.
7.1.3.4 Military Road to S 288th Street Grading and the removal of trees to construct the light rail alignment between I‐5 and the nearby
homes in the neighborhood north of S 288th Street would result in 16 additional traffic noise impacts
in this area regardless of whether or not the SR 509 Extension is built. After mitigation, there would be
no traffic noise impacts. The light rail sound walls in this area include a 4‐ft wall on structure over
Military Road S and a 1,200‐ft sound wall 6 to 8 ft high running from S 284th Street to S 288th Street.
Without the SR 509 Extension, all traffic noise impacts would be abated by the light rail sound wall
planned for this area, as described above, plus an additional sound wall approximately 100 ft long

7.0 Potential Noise and Vibration Mitigation Measures
Federal Way Link Extension 7-10 Noise and Vibration Technical Report November 2016
constructed along the west side of the light rail alignment at the north end of 29th Avenue S. The
additional sound wall would be 6 ft high.
The SR 509 Extension includes a sound wall running from approximately S 284th Street to S 286th
Street. Noise modeling for the build alternative with the SR 509 Extension did not include this wall
because the light rail alignment is planned for the same area where the wall was to be located. Impacts
under the build alternative with the SR 509 Extension would be abated by the combination of a
modified version of the light rail sound wall planned for this area and an additional sound wall
approximately 500 ft long constructed along the west side of the light rail alignment starting where the
light rail alignment transitions from an elevated to at‐grade guideway near Military Road S. The
additional sound wall would vary in height from 12 to 14 ft.
7.1.3.5 S 288th Street to S 298th Street The removal of an existing noise barrier at the north end of the Camelot Square Mobile Home Park and
topographical changes associated with construction of the FWLE would result in 59 traffic noise
impacts in the area from S 288th Street to S 298th Street. Fifty‐one of these impacted homes would
also be impacted by light rail operations. If the SR 509 Extension is built, there would be 55 traffic noise
impacts, 26 of which would be a result of light operations. After mitigation, there would be no traffic
noise impacts under either build alternative scenario.
Traffic noise modeling for the build alternative took into account removal of the existing traffic noise
barrier at the north end of the Camelot Square Mobile Home Park. No replacement barrier was
included in any of the traffic noise models because a significant portion of the existing barrier is located
where the light rail alignment is planned. The Preferred Alternative would be on an elevated structure
for approximately 450 ft after it crosses S 288th Street. After that point, it would be on fill for the
remainder of the length adjacent to the mobile home park. As a result, all 51 traffic noise impacts
predicted under the build alternative would be in the north end, regardless of whether the build
alternative includes the SR 509 Extension or not.
Under the build alternative, both without and with the SR 509 Extension, there is a 6‐ft‐high light rail
sound wall proposed for this area starting at S 288th Street and extending approximately 2,500 ft to
the south along the western edge of the light rail alignment. However, where the proposed light rail
wall would be on structure for several hundred feet south of 288th, a traffic sound wall would also be
needed to block traffic noise from I‐5 that would pass or reflect under the structure. Traffic noise could
be mitigated for the build alternative without SR 509 by either a 16‐ to 22‐ft‐tall traffic sound wall
along the east side of the light rail alignment or a traffic sound wall approximately 14 to 18 ft high
running along the eastern edge of Camelot Square Mobile Home Park. A wall on the eastern edge of
the mobile home park could limit options for relocating Bingaman Creek south of S 288th Street. In
conjunction with the transit sound wall, a traffic sound wall in this area would mitigate all traffic noise
impacts under the build alternative without SR 509.
The SR 509 Project would add one southbound travel lane to I‐5, bringing travel lanes closer to the
mobile home park. Under this scenario, two traffic sound walls would be needed: a 16‐ to 22‐ft‐tall
traffic sound wall along the east side of the light rail alignment as described above and an additional

7.0 Potential Noise and Vibration Mitigation Measures
Federal Way Link Extension 7-11 Noise and Vibration Technical Report November 2016
sound wall along the north and east sides of the mobile home park (i.e., along the western edge of the
WSDOT right‐of‐way and along the south side of S 288th Street). Sound Transit would coordinate with
WSDOT to determine the height and length of a second sound wall in this area. It should be noted that
given the existence of Bingaman Creek in this area, it is unclear whether construction of this traffic
sound wall would be feasible, and additional analysis would be performed during final design.
Mitigation of the remaining traffic noise impacts in the area south of the mobile home park under the
build alternative without SR 509 would be achieved by raising the height of the light rail sound wall at
its south end. The light rail sound wall would end south of Camelot Square in the vicinity of the Steel
Lake Grange property. There is an elevation increase of approximately 40 ft from the homes in the
south end of Camelot Square to the backyards of the homes along S 296th Street. The latter have a
clear line of sight to I‐5 from their backyards overlooking Camelot Square, and traffic noise impacts
extend over 500 ft into this neighborhood from the western edge of I‐5 southbound pavement. In
order to mitigate all impacts between S 288th Street and S 298th Street under the build alternative
without SR 509, the light rail sound wall would be modified by increasing its height by 6 to 8 ft for
approximately the last 100 ft of the wall.
The SR 509 Extension improvements consider replacing the current noise barrier that extends along
the western edge of I‐5 in the southern half of the Camelot Square Mobile Home Park with a sound
wall that extends farther north and is 16 ft high. This wall was included in the build alternative with SR
509 traffic noise model. In order to mitigate all traffic noise impacts in this area under the build
alternative with SR 509, the light rail sound wall would be modified by extending it to the south for an
additional 200 ft. This modified version of the light rail wall would still have a uniform height of 6 ft.
Consequently, this modified wall would be 200 ft longer than it would be under the build alternative
without SR 509, but the increase in height from 6 to 8 ft for a small portion of the wall under the build
alternative without SR 509 would be unnecessary.
7.2 Potential Vibration Mitigation
7.2.1 Types of Vibration Mitigation A number of different approaches have been used by rail transit systems to reduce groundborne
vibration. The most common vibration mitigation measures used on light rail systems consist of placing
a resilient layer between the track and the soil. Some standard approaches for vibration mitigation
measures with DF and B&T tracks are:
High‐compliance direct‐fixation (HCDF) fasteners: Direct‐fixation track fasteners are used to attach
rails directly to a concrete slab. They are standard on the subways and elevated structures of most
modern rail transit systems. The stiffness of a standard DF track fastener is around 150,000 pounds
per inch (lb/in.). Reducing the stiffness to around 110k lb/in. would marginally increase the cost.
Going to a HCDF fastener (stiffness less than 60k lb/in.) would cost approximately twice as much as
a standard DF fastener. The HCDF fasteners provide about 5 to 7 dB of vibration reduction at peak
train vibration frequencies including 50‐ and 63‐Hz 1/3rd‐octave bands. HCDF fasteners have also
been used on B&T track on the Massachusetts Bay Transportation Authority Red Line subway in

7.0 Potential Noise and Vibration Mitigation Measures
Federal Way Link Extension 7-12 Noise and Vibration Technical Report November 2016
Boston. Measurements showed that the fasteners provided vibration reduction similar to that
found on DF tracks.
Ballast mat: Ballast mats are designed to be placed under B&T track. They are resilient rubber mats
that are placed between the subgrade and the ballast. Typical ballast mats can have a stiffness of
2,500 lb/in. The subgrade is a stiffer layer that could be thick concrete or asphalt. Concrete
subgrades are expensive. Sometimes compacted soil is sufficient to serve as a stiff subgrade. Ballast
mats provide about 10 dB of vibration reduction above 30 Hz.
Tire‐derived aggregate (TDA): TDA is recycled automobile tires that are shredded to pieces that are
about 1 inch thick and 4 to 6 inches long. This mitigation measure consists of building the track on
top of a layer of TDA. It is an innovative approach for recycling old automobile tires that has been
successfully used as a vibration mitigation system on the Santa Clara Valley Transportation
Authority and Denver Regional Transportation District light rail systems. A 12‐inch layer of TDA was
used for both the Santa Clara Valley and Denver installations. TDA provides a similar level of
vibration reduction as ballast mat.
Floating‐slab track: A floating slab consists of a concrete slab supported by elastomer or steel‐coil
springs. The frequency range at which a floating slab is effective depends on the thickness of the
slab and the stiffness of the springs. Most North American floating‐slab systems use rubber pads
that are 12 to 18 inches in diameter supporting a concrete slab that is 12 to 24 inches thick.
Floating slabs are very effective at reducing vibration levels; however, they are also expensive.
Alternative approaches: A number of alternative approaches have been proposed that may have
applicability under specific circumstances. One example is underground barriers, something that
several different Japanese rail systems have investigated recently. The basic concept is to use
variations of an open trench or, when the propagation is through soft soils, a solid wall. Other
examples include increasing the thickness of the concrete under the track, specifying straighter
rails, and, when the track would traverse sections of very soft soil, building the track on top of pile
foundation systems. In addition, the weight and placement of a sound wall could be considered to
reduce surface vibration.
The vibration amplification from the banging that occurs when light rail vehicle wheels pass through
switches generally results in a 10‐dB increase at locations less than about 35 ft from the switch. Almost
all of the increase in groundborne vibration and airborne noise occurs as the wheels pass through
frogs. There are several alternatives to typical rail‐bound manganese (RBM) frogs that would result in
lower vibration and noise levels:
Higher‐number RBM frogs: The common RBM frog is designed for mainline freight track but is often
used on transit systems. Wheel impacts as wheels cross the gap in the rail and when wheels hit the
frog point typically increase vibration levels by approximately 10 VdB. The actual increase depends
on the condition of the frog, how smoothly the wheel load is transferred from one side of the rail
gap to the other, whether the movement over the frog is a straight‐through or diverting move, the
frog number, and the distance from the frog. Conceptually, higher‐number frogs have a smaller

7.0 Potential Noise and Vibration Mitigation Measures
Federal Way Link Extension 7-13 Noise and Vibration Technical Report November 2016
angle between the rails, and the transition over the gap is distributed over a greater distance, so
the additional noise and vibration levels should be lower. However, there are no measurement
results available that confirm that higher‐number frogs generate less noise and vibration than
lower‐number frogs.
Monoblock frogs: Monoblock frogs are basically milled out of a single block of steel. Because they
are machined rather than cast, the tolerances can be tighter. Monoblock frogs are generally
thought to create less noise and vibration than RBM frogs. Based on informal measurements
performed at the Port Authority Trans‐Hudson commuter rail system in New Jersey, it appears that
the increase in noise and vibration levels with a good‐condition monoblock frog is about half of
that with a standard RBM frog.
Flange‐bearing frogs: Well designed and maintained flange‐bearing frogs can generate much less
noise and vibration than standard RBM frogs. If the ramps in the frogs are too short and/or the
frogs are not properly maintained, the noise and vibration benefits may be marginal. In addition,
the length of the ramp in flange‐bearing frogs should be carefully designed to accommodate the
train speed.
One‐way low‐speed (OWL) frogs: OWL frogs are designed for use when traffic in the diverting
direction is infrequent and low‐speed. Most OWL designs are flange‐bearing in the diverting
direction and have no break in the rail in the mainline direction. These are often referred to as
“jump frogs” because in the diverting direction the wheels are lifted up and over the rail with some
form of flange‐bearing ramps. A Vossloh representative said that the cost of their OWL is about
$3,000 more than a standard RBM frog and about the same as a monoblock frog. Because the rail is
solid in the main line direction, there would be little or no increase in noise and vibration. Vossloh,
Progress Rail, and Nortrak all have variants of OWL frogs.
Spring‐rail and movable‐point frogs: A movable‐point frog eliminates the gap in the rail crossing by
moving the point of crossing from side to side in sync with the direction of the turnout. In a spring‐rail
frog, the point is moved by the wheel flange of an approaching train, and a loaded spring returns the
point to its normal position after the train has passed. When properly designed, installed, and
maintained, spring‐rail and movable‐point frogs produce up to 6 VdB less than standard frogs. These
frogs can be substantially more expensive in terms of parts, installation, and maintenance.
7.2.2 Transit Vibration Mitigation Potential vibration mitigation for all alternatives and options is summarized below. The key points of
mitigation are:
HCDF fasteners are recommended for DF tracks.
Ballast mats or tire‐derived aggregate are recommended for B&T tracks.
“Low‐impact” frogs (LIFs) such as spring‐rail or movable‐point frogs are recommended in addition
to ballast mats at locations where the impacts are a result of amplification at switches.

7.0 Potential Noise and Vibration Mitigation Measures
Federal Way Link Extension 7-14 Noise and Vibration Technical Report November 2016
In addition, it is recommended that site‐specific vibration tests be performed during final design at the
locations where vibration impacts are predicted. When feasible, the tests should include outdoor‐to‐
indoor vibration measurements to verify the results presented in this report.
7.2.2.1 Preferred Alternative The Preferred Alternative would likely use ballast mats and TDA to mitigate impacts (Table 7‐7). At four
multi‐family residences, these measures might not effectively reduce the vibration levels to below FTA
criteria due to proximity of the buildings to the light rail guideway. At these locations, project design
modifications and additional information on affected buildings could eliminate or reduce these
impacts. For instance, the type of building foundation might reduce vibration levels. Additional analysis
during final design will evaluate the specific buildings, and alternative mitigation measures may be
warranted. Final mitigation would be confirmed during final design.
TABLE 7-7 Summary of Vibration Impacts and Potential Mitigation for Preferred Alternative and Options
Alternative Receiver Address Potential Mitigation Total Length of Mitigation (ft)
Preferred Alternative 20620 International Blvd HCDF fasteners 400
3121 S 211th St Ballast mat or tire-derived aggregate 300
21149 32nd Ave S Ballast mat or tire-derived aggregate 300
3048 S 225th Pl Ballast mat or tire-derived aggregate 300
22810 30th Ave S Ballast mat or tire-derived aggregate
1,400 combined 22834 30th Ave S Ballast mat or tire-derived aggregate
23030 30th Ave S Ballast mat or tire-derived aggregatea
23110 30th Ave S Ballast mat or tire-derived aggregatea
23214 30th Ave S Ballast mat or tire-derived aggregatea 300
23408 30th Ave S HCDF fasteners + LIFa 300
3001 S 288th St Ballast mat or tire-derived aggregate 2,600 combined
3006 S 288th St Ballast mat or tire-derived aggregate
Kent/Des Moines At-Grade and I-5 Station Options
23226 30th Ave S Ballast mat or tire-derived aggregate 400
a The mitigation listed for this property might not reduce vibration levels below the impact threshold. Please refer to Appendix F, which lists the potential residual impacts with the listed mitigation applied. Alternative mitigation solutions might be needed.
7.2.2.2 SR 99, SR 99 to I-5, and I-5 to SR 99 Alternatives The vibration mitigation summary from the initial analysis of other alternatives and options is
presented in Tables 7‐8 through 7‐10. Sound Transit would coordinate with Sea Mar Community Health
Center Des Moines and Healthpoint Midway to determine if vibration‐sensitive equipment is present at
these facilities for the SR 99 and I‐5 to SR 99 alternatives.

7.0 Potential Noise and Vibration Mitigation Measures
Federal Way Link Extension 7-15 Noise and Vibration Technical Report November 2016
TABLE 7-8 Summary of Vibration Impacts and Recommended Mitigation for SR 99 Alternative and Options
Alternative Receiver Address Recommended
Mitigation Total Length of Mitigation (ft)
SR 99 Alternative 20717 International Blvd HCDF 500
31031 Pacific Hwy S HCDFa 400
S 216 West Station Option Same as SR 99 Alternative (except for 20717 International Blvd, which would be displaced with this option)
S 216 East Station Option 21450 International Blvd HCDF 400
Kent/Des Moines HC Campus Station from S 216th West Station Option
2628 22nd St Ballast mat 300
22620 28th Ave S Ballast mat 400
2809 S 240th St
2803 S 240th St Ballast mat 400
24215 Pacific Hwy S Ballast mat 500
Kent/Des Moines HC Campus Station Option 24215 Pacific Hwy S Ballast mat 500
Kent/Des Moines SR 99 Median Station Option Same as SR 99 Alternative
Kent/Des Moines SR 99 East Station Option Same as SR 99 Alternative
S 260th West Station Option 24201 27th Ave S HCDF 500
S 260th East Station Option
26430 Pacific Hwy S
26448 Pacific Hwy S HCDF 500
26550 Pacific Hwy S HCDF 400
S 272nd Redondo Trench Station Option
1560 S 284th St
28418 16th Ave S
28611 16th Ave S
HCDF 900
29815 Pacific Hwy S HCDF 400
27606 Pacific Hwy S Ballast mat and LIF 400b
Federal Way SR 99 Station Option Same as SR 99 Alternative
a Mitigation for groundborne noise at the Federal Way High School Performing Arts Center. b Length of ballast mat.
TABLE 7-9 Summary of Vibration Impacts and Recommended Mitigation for SR 99 to I-5 Alternative and Options
Alternative Receiver Address Recommended
Mitigation Total Length of Mitigation (ft)
SR 99 to I-5 Alternative
20717 International Blvd HCDF 500
23205 30th Ave S HCDF 400
3001 S 288th St Ballast mat 400
3006 S 288th St Ballast mat 400
30432 Military Rd S HCDF 400
31228 28th Ave S Ballast mat and LIF 400a
31524 28th Ave S Ballast mat 400
S 216th West Station Option Same as SR 99 to I-5 Alternative (except for 20717 International Blvd, which would be displaced with this option)
S 216th East Station Option 21450 International Blvd HCDF 400
Landfill Median Alignment Option Same as SR 99 to I-5 Alternative
Federal Way I-5 Station Option Same as SR 99 to I-5 Alternative
Federal Way S 320th Park-and Ride Station Option Same as SR 99 to I-5 Alternative
a Length of ballast mat.

7.0 Potential Noise and Vibration Mitigation Measures
Federal Way Link Extension 7-16 Noise and Vibration Technical Report November 2016
TABLE 7-10 Summary of Vibration Impacts and Recommended Mitigation for I-5 to SR 99 Alternative and Options
Alternative Start Recommended
Mitigation Total Length of Mitigation (ft)
I-5 to SR 99 Alternative
3118 S 216th St Ballast mat 400
23030 30th Ave S HCDF 400
23110 30th Ave S HCDF 400
20620 International Blvd HCDF 400
31031 Pacific Hwy S HCDFa 400
S 260th West Station Option None
S 260th East Station Option Same as SR 99 Alternative
S 272nd Redondo Trench Station Option Same as SR 99 Alternative
Federal Way SR 99 Station Option Same as SR 99 Alternative
a Mitigation for groundborne noise at the Federal Way High School Performing Arts Center.
7.3 Potential Construction Mitigation
7.3.1 Construction Noise Mitigation Construction noise impacts can be reduced with operational methods and scheduling, equipment
choice, and acoustical treatments. In locations where existing noise barriers would require relocation,
the relocation would be completed as early in the construction process as practical so that the
relocated walls would reduce noise from the ongoing construction activities. When required, Sound
Transit or its contractor would seek the appropriate noise variance from the local jurisdiction. Noise
control mitigation to meet local regulatory requirements, noise ordinances, and permit or variance
conditions would be required. These measures could include:
Install construction site noise barrier or wall by noise‐sensitive receivers where appropriate.
Use smart backup alarms during nighttime work that automatically adjust (lower) the alarm level or
tone based on the background noise level, or switch off back‐up alarms and replace with spotters.
Use low‐noise‐emission equipment.
Implement noise‐deadening measures for truck loading and operations.
Monitor and maintain equipment to meet noise limits.
Use lined or covered storage bins, conveyors, and chutes with sound‐deadening material.
Use acoustic enclosures, shields, or shrouds for equipment and facilities.
Install high‐grade engine exhaust silencers and engine‐casing sound insulation.
Prohibit aboveground jack hammering and impact pile driving during nighttime hours.
Minimize the use of generators or use whisper‐quiet generators to power equipment.
Limit use of public address systems.
Use movable noise barriers at the source of the construction activity.
Limit or avoid certain noisy activities during nighttime hours.

7.0 Potential Noise and Vibration Mitigation Measures
Federal Way Link Extension 7-17 Noise and Vibration Technical Report November 2016
7.3.2 Construction Vibration Mitigation Although no fragile structures have been identified in the project corridor, the following precautionary
vibration mitigation strategies could be used to minimize the potential for damage to any structures in
the corridor:
Preconstruction survey: Prior to beginning construction, a survey of the first row of buildings
adjacent to the alignment should be completed. The survey should include inspection of building
foundations and photographs of existing conditions and should be expanded if an important and
potentially fragile structure is located within approximately 200 ft of the construction site, which
should be included in the survey.
Vibration limits: Construction vibration should be limited to a maximum of 0.5 in./sec at the façade
of all buildings in the corridor. Should the preconstruction survey identify any buildings that are
particularly fragile or sensitive to vibration, the vibration limit at these structures should be limited
to 0.12 in./sec. In addition, to reduce annoyance, use of high‐vibration construction equipment
should be limited near sensitive receivers such as residences, schools, and hospitals.
Vibration monitoring: Vibration monitoring should occur at any buildings that the preconstruction
survey identified as very fragile and where the lowest construction vibration limit is applicable.
Vibration monitoring should also be considered at locations where complaints about vibration are
received from building occupants. Vibration monitoring should consist of measurements of
vibration at the closest potentially sensitive structure during periods of construction when
equipment that generates a substantial amount of groundborne vibration (such as mounted
hammer hoe rams or pile‐drivers) are in use. Vibration monitors should be equipped with an
“alarm” feature to provide notification that vibration impact criteria have been approached or
exceeded. Where pile‐driving is employed near fragile structures, several hits should be monitored
prior to starting the pile‐driving to make sure that the levels are below the limits. If vibration from
the test hits approaches or exceeds the limits, the force of the pile‐driver should be reduced until
the vibration amplitudes at all sensitive buildings are below the applicable limit.
Alternative construction procedures: If high‐vibration construction activities must be performed
close to structures, it may be necessary to use an alternative procedure that produces lower
vibration levels. Examples of high‐vibration construction activities include vibratory compaction
and using hoe rams for demolition. Alternative procedures could include use of non‐vibratory
compaction and using a concrete saw in place of a hoe ram to break up pavement. Use of pile‐
driving should be avoided close to sensitive receivers, and alternate construction procedures
employed, such as using a hydraulic pile‐driver at lower settings.

This page intentionally left blank.

Federal Way Link Extension 8-1 Noise and Vibration Technical Report November 2016
8.0 References
Federal Highway Administration (FHWA). 2010. Procedures for Abatement of Highway Traffic Noise and
Construction Noise. July.
Federal Highway Administration (FHWA). 2006. FHWA Roadway Construction Noise Model User’s
Guide. January.
Federal Transit Administration (FTA). 2006. Transit Noise and Vibration Impact Assessment (FTA
Guidance Manual). FTA‐VA‐90‐1003‐06. Office of Planning and Environment. May.
McKenna, S. 2011. A Study of Building Amplification from Groundborne Vibration. Noise‐Con 2011,
Portland, Oregon. July 25–27.
Rajaram, S., and S. Wolf. 2014. Final Vibration Measurements of Existing Sound Transit Trains. Report
prepared for Parsons Brinckerhoff and HJH. May 22.
Sound Transit. 2016. Design Criteria Manual. Revision 4. March 2016.
Sound Transit. 2008. Sound Transit 2: A Mass Transit Guide, the Regional Transit System Plan for
Central Puget Sound (ST2). http://www.soundtransit.org/About‐Sound‐Transit/News‐and‐
events/Reports/ST2‐project‐details. July 2008.
Sound Transit. 2004. Sound Transit Light Rail Noise Mitigation Policy. Motion 2004‐08. Seattle, WA.
Transportation Research Board. 2012. Transit Cooperative Research Program Report 155: Track Design
Handbook for Light Rail Transit. Second Edition.
http://onlinepubs.trb.org/onlinepubs/tcrp/tcrp_rpt_155.pdf.
Zapfe, J., H. Saurenman, and S. Fidell. 2009. Groundborne Noise and Vibration in Buildings Caused by
Rail Transit. Prepared for Transit Cooperative Research Program, Transportation Research Board of the
National Academies. Project D‐12. November.
GIS
City of Des Moines. 2015. GIS data for city boundaries, zoning, comprehensive plan, impervious
surface, storm sewer, and related infrastructure. Data obtained from the City GIS department.
http://www.desmoineswa.gov/index.aspx?nid=142. September 2015.
City of Federal Way. 2015. GIS data for city boundaries, zoning, comprehensive plan, impervious
surface, storm sewer, and related infrastructure. Data obtained from the City GIS department.
http://gis.cityoffederalway.com/disclaimer/GIS_DATA_DISCLAIMER.htm. September 2015.
City of Kent. 2015. GIS data for city boundaries, zoning, comprehensive plan, impervious surface, storm
sewer and related infrastructure, sanitary sewer and related infrastructure. Data obtained from the
City GIS department. http://kentwa.gov/maps/. GIS Coordinator: Hayley Bonsteel
[email protected]. September 2015.

8.0 References
Federal Way Link Extension 8-2 Noise and Vibration Technical Report November 2016
City of SeaTac. 2015. Zoning, comprehensive plan, and impervious surface.
Data obtained from the City GIS department.
http://www.ci.seatac.wa.us/index.aspx?recordid=203&page=182. September 2015.
King County. 2015. GIS data for streets, tax parcels, building footprint, zoning, census data, city
boundaries, parks and open spaces, transit facilities, 2002 Lidar bare earth data, slopes, wetlands,
wellhead protection areas, and streams. Data obtained from the County GIS data portal.
http://www5.kingcounty.gov/gisdataportal/.