February 8 Feasibility Study 2013 - Sounds of Encouragement Education Feasibility Study...
148
Feasibility Study February 8 2013 A report on the feasibility of establishing an extension of the jointly- owned Northern Caribbean University in New Providence to serve the constituency of the South Bahamas Conference. Prepared by Annick M. Brennen, M.A., Action Consultant, for the Office of the Director of Education
Transcript of February 8 Feasibility Study 2013 - Sounds of Encouragement Education Feasibility Study...

Feasibility Study
February 8
2013 A report on the feasibility of establishing an extension of the jointly- owned Northern Caribbean University in New Providence to serve the constituency of the South Bahamas Conference.
Prepared by Annick M. Brennen, M.A., Action Consultant, for the Office of the Director of Education

2:
Prepared by Annick M. Brennen, M.A., Action Consultant
Fe
br
ua
ry
8,
20
13
Table of Contents Executive Summary, Recommendations, and Conclusion .............................................................. 5
Introduction .................................................................................................................................... 8
Membership Support for the Proposal ......................................................................................... 10
Membership Survey .................................................................................................................. 10
Demographics ....................................................................................................................... 10
Support for the Proposal ...................................................................................................... 11
Challenges ............................................................................................................................. 14
Student Survey .......................................................................................................................... 15
Demographics ....................................................................................................................... 15
Students’ College Preferences .............................................................................................. 15
Future Demand for Higher Education ........................................................................................... 19
Methodology ............................................................................................................................. 19
Population Growth .................................................................................................................... 20
All Bahamas Population Projections ..................................................................................... 21
Seventh-day Adventist Membership Projections ................................................................. 25
Historical Participation in Higher Education ......................................................................... 29
Future Demand for Higher Education ................................................................................... 34
The Curriculum .............................................................................................................................. 40
Methodology ............................................................................................................................. 40
Survey Responses...................................................................................................................... 40
Membership Survey .............................................................................................................. 40
Student Survey ...................................................................................................................... 43
Curriculum Analysis ................................................................................................................... 46
Undergraduate Curriculum Analysis ..................................................................................... 46
Tables A: Allied Health and Nursing ...................................................................................... 50
Tables B: Business ................................................................................................................. 51
Tables C: Hospitality and Tourism ........................................................................................ 54
Tables D: Education............................................................................................................... 55
Tables E: Behavioral, Environmental, and Social Sciences ................................................... 58
Tables F: English, Art, and Communication Studies ............................................................. 60
Tables G: Biology and Chemistry, Computer and Information Sciences .............................. 61
3:
Prepared by Annick M. Brennen, M.A., Action Consultant
Fe
br
ua
ry
8,
20
13
Tables H: Mathematics and Engineering .............................................................................. 63
Table I: Technology ............................................................................................................... 64
Table J: Religion and Theology .............................................................................................. 64
Graduate Curriculum Analysis .............................................................................................. 65
Table A: Allied Health & Nursing........................................................................................... 68
Table B: Business & Library and Information Science .......................................................... 68
Tables C: Education ............................................................................................................... 69
Table D: Natural and Applied Sciences ................................................................................. 71
Table E: Humanities, Behavioural & Social Sciences ............................................................ 71
Table F: Religion .................................................................................................................... 72
Labor Market......................................................................................................................... 73
Bahamian Students’ Preferred Programs of Study ............................................................... 75
Tuition Cost ................................................................................................................................... 77
Determining Tuition Cost for The Bahamas .............................................................................. 80
Admission Requirements and College Readiness ......................................................................... 87
Undergraduate Admission Requirements ................................................................................ 87
Baccalaureate Programs ....................................................................................................... 87
Associate Programs ............................................................................................................... 87
Diploma and Certificate Programs ........................................................................................ 88
College Readiness ..................................................................................................................... 88
Performance in Five or More Subjects ................................................................................. 91
Human Resource ........................................................................................................................... 93
Membership Survey .................................................................................................................. 93
Students Records’ Storage and Hiram S. Walters Resource Centre Access ................................. 95
Students’ Records ..................................................................................................................... 95
Access to Hiram S. Walters Resource Centre ........................................................................... 95
Educational Facilities..................................................................................................................... 96
Instructional and Student Services Facilities ............................................................................ 96
Instructional Areas ................................................................................................................ 96
Student Service Areas ........................................................................................................... 96
Access to Administrative Offices .............................................................................................. 96
Branding and Enrolment Management ........................................................................................ 97
4:
Prepared by Annick M. Brennen, M.A., Action Consultant
Fe
br
ua
ry
8,
20
13
Branding .................................................................................................................................... 97
Enrollment Management ........................................................................................................ 102
Recruitment/Marketing .......................................................................................................... 103
Undergraduate Recruitment ............................................................................................... 103
Graduate Recruitment ........................................................................................................ 105
Organizational Requirements ..................................................................................................... 108
Authorization to Establish and Operate a University Extension ............................................ 108
Seventh-day Adventist Working Policy ............................................................................... 108
Ministry of Education .......................................................................................................... 108
Department of Public Personnel ......................................................................................... 108
Business License .................................................................................................................. 108
Recommended Academic Personnel ...................................................................................... 109
Optimizing Revenue .................................................................................................................... 111
Tuition ..................................................................................................................................... 111
Suggested Curriculum ......................................................................................................... 111
Denominational Appropriations ............................................................................................. 113
Revenue from Services ........................................................................................................... 113
Grants and Endowments ........................................................................................................ 113
Endowment Funds .............................................................................................................. 114
Grants .................................................................................................................................. 114
Capital Requirements and Financial Projections ........................................................................ 116
Start-up Requirements ........................................................................................................... 117
Pro-Forma Cash Flow .............................................................................................................. 118
Break-Even Analysis ................................................................................................................ 143
Sources Cited .............................................................................................................................. 144
Supporting Documents ............................................................................................................... 148

5:
Prepared by Annick M. Brennen, M.A., Action Consultant
Fe
br
ua
ry
8,
20
13
Executive Summary, Recommendations, and Conclusion
The Bahamas is in the process of recovering from the 2008 recession. Economists say that its economic future is uncertain as central government debt is predicted to hit 60 percent of GDP by 2015, tourism generates just 11.2 percent of revenues, and the Government is yet to credibly commit to fiscal tightening
The median household income has declined steadily from 2008, moving from $35,550 to $30,000 in 2011. The unemployment rate has climbed steadily since 2006 from 7.6 percent to 14.7 percent in 2012.
The prospect of the realization of the Baha Mar project presents an economic opportunity for thousands of Bahamians, yet a threat to education as Bahamians tend to abandon educational pursuits for the prospect of earning lucrative incomes in the tourism industry. The proposal for establishing a Northern Caribbean University has not met ideal economic conditions.
The educational market of Bahamas is well-established, with the College of The Bahamas capturing about 40 percent of the market. It will take focused, sustained action, and substantial financial investment to penetrate the market and establish a niche for the proposed Northern Caribbean University extension. A successful marketing program including but not limited to social media and mobile telecommunications technologies must be planned and implemented to secure the level of enrolment required to operate profitably.
The study shows that:
1. Sixty-seven percent of adult survey respondents support the proposal to establish an NCU extension in New Providence; yet there is not a strong demand for it as 56 percent of adults and only 9.4 percent of high school students say they would definitely attend the extension.
2. The youth population (20 to 24 age group, especially) of the Seventh-day Adventist Church is not sufficient to support the growth of the extension. Marketing strategies will need to include the non-Seventh-day Adventist population to boost enrolment.
3. Ministry of Education BGCSE results data confirm that most Bahamian students are not academically ready for college. A strong college readiness program that includes English and mathematics must be implemented to prepare them for college work.
4. If the South Bahamas Conference decides to operate the extension, courses at the undergraduate and graduate levels could be offered. The cost of NCU graduate degrees is more competitive than undergraduate ones in The Bahamas. An entry strategy could be to begin with graduate programs, and then introduce undergraduate degrees later.
6:
Prepared by Annick M. Brennen, M.A., Action Consultant
Fe
br
ua
ry
8,
20
13
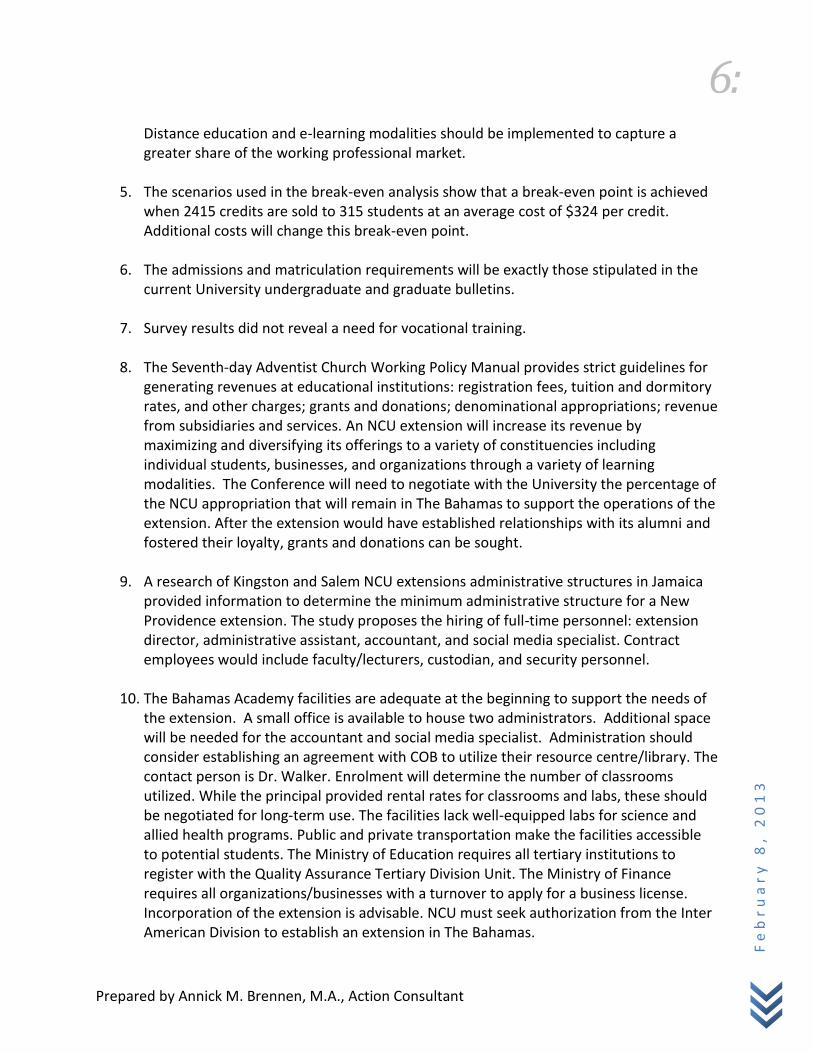
Distance education and e-learning modalities should be implemented to capture a greater share of the working professional market.
5. The scenarios used in the break-even analysis show that a break-even point is achieved when 2415 credits are sold to 315 students at an average cost of $324 per credit. Additional costs will change this break-even point.
6. The admissions and matriculation requirements will be exactly those stipulated in the current University undergraduate and graduate bulletins.
7. Survey results did not reveal a need for vocational training.
8. The Seventh-day Adventist Church Working Policy Manual provides strict guidelines for generating revenues at educational institutions: registration fees, tuition and dormitory rates, and other charges; grants and donations; denominational appropriations; revenue from subsidiaries and services. An NCU extension will increase its revenue by maximizing and diversifying its offerings to a variety of constituencies including individual students, businesses, and organizations through a variety of learning modalities. The Conference will need to negotiate with the University the percentage of the NCU appropriation that will remain in The Bahamas to support the operations of the extension. After the extension would have established relationships with its alumni and fostered their loyalty, grants and donations can be sought.
9. A research of Kingston and Salem NCU extensions administrative structures in Jamaica provided information to determine the minimum administrative structure for a New Providence extension. The study proposes the hiring of full-time personnel: extension director, administrative assistant, accountant, and social media specialist. Contract employees would include faculty/lecturers, custodian, and security personnel.
10. The Bahamas Academy facilities are adequate at the beginning to support the needs of the extension. A small office is available to house two administrators. Additional space will be needed for the accountant and social media specialist. Administration should consider establishing an agreement with COB to utilize their resource centre/library. The contact person is Dr. Walker. Enrolment will determine the number of classrooms utilized. While the principal provided rental rates for classrooms and labs, these should be negotiated for long-term use. The facilities lack well-equipped labs for science and allied health programs. Public and private transportation make the facilities accessible to potential students. The Ministry of Education requires all tertiary institutions to register with the Quality Assurance Tertiary Division Unit. The Ministry of Finance requires all organizations/businesses with a turnover to apply for a business license. Incorporation of the extension is advisable. NCU must seek authorization from the Inter American Division to establish an extension in The Bahamas.

7:
Prepared by Annick M. Brennen, M.A., Action Consultant
Fe
br
ua
ry
8,
20
13
11. Northern Caribbean University AErion student management system will be available to
the extension to store students’ academic and administrative records. Computers with Internet access are required to access AErion. Procedures and protocols are in place to access AErion. Accounting, productivity, and desktop publishing software will be needed to post financial transactions, process documents, design and produce promotional material. A wireless, Internet ready color copier will be extremely useful to produce certain promotional material. Cable Bahamas offers very competitive telephone, cable, and Internet services.
12. Survey results show that 34 (or 7.3 percent) of the 448 respondents hold masters’ degrees, while 7 (or 1.5 percent) have doctoral degrees. Of those 41 persons 29 would consider lecturing at the extension. Nineteen of those persons hold degree specialties in education.
13. Branding, marketing, and enrolment management are crucial for the success of the extension. This proposal recommends (with the advice of Dwayne Wallace) an initial investment of $25,000 before the first semester to promote the university and secure enrolment.
14. Start-up costs are estimated to be $232,000; but sound business principle dictates that the South Bahamas Conference should prepare to invest in excess of that estimated amount to cover unexpected expenses. Also, the Conference should make a decision about borrowing funds for operating capital.
Conclusion
Establishing a university extension requires not only political will, but substantial financial investment, qualified personnel, physical resources, and excellent planning and execution. The South Bahamas should not undertake this venture unless it is prepared to make the required financial investment and execute an aggressive but sustained marketing and enrollment strategy that will capture a share of the market that will guarantee profitable operation.
8:
Prepared by Annick M. Brennen, M.A., Action Consultant
Fe
br
ua
ry
8,
20
13
Introduction
October 2012, The South Bahamas Conference of Seventh-day Adventists (SBC) commissioned a feasibility study for establishing in New Providence an extension of the Northern Caribbean University (NCU) jointly-owned by the Jamaica Conference Union and the Atlantic Caribbean Union Mission of Seventh-day Adventists.
The feasibility study answers these questions listed in the proposal approved by the Executive Committee of the South Bahamas Conference of Seventh-day Adventists:
15. Is there a genuine need and demand for an NCU extension in the South Bahamas Conference?
16. Is the youth population of the Seventh-day Adventist Church large enough to feed the NCU extension?
17. If there is a demand for the university extension, what programs should be offered and at what levels to meet the labour market needs of the South Bahamas Conference territory in the private and public sectors, and the academic and career preparation needs of potential students?
18. Is there a need for pre-college education to help qualify students who do not meet college matriculation requirements? Is there a need for professional/vocational education and training?
19. What is the enrolment figure required to generate the revenue level to pay regular operational expenditures or break even?
20. What will the fee structure (tuition and others) be for the proposed programs in The Bahamas?
21. What will be the admissions and matriculation requirements?
22. What are other potential sources of funds to sustain and grow a vibrant university extension?
23. Does the SBC territory possess the teaching and administrative human resources required to support the programs offered and the governance structure of the university extension?
24. What minimum administrative/managerial and legal structures are required to begin operating the university extension?

9:
Prepared by Annick M. Brennen, M.A., Action Consultant
Fe
br
ua
ry
8,
20
13
25. Are classrooms, administrative offices, equipment, and furnishings in the proposed
facility on Marshal Road suitable and adequate for such a project? Is there a resource center or library? What physical and academic resources will be needed to ready the resource center for students’ use?
26. Is the proposed site readily accessible to potential students?
27. What technology and equipment will be required to store students’ academic records, accounting and administrative records?
28. How will the programs be marketed, branded, and differentiated from other programs offered locally to secure the projected enrolment required to be financially viable?
29. What are the estimated working capital and operational costs required to establish and sustain the extension campus until full revenue is achieved?
To answer these questions surveys and research were conducted over a period of five months. The analyses derived from the surveys and research include: (1) analysis of demographic data of The Bahamas and Seventh-day Adventist populations; (2) comparative curriculum and tuition analyses of seven local colleges and two universities recognized by the Tertiary Quality Assurance Division of the Ministry of Education with NCU; (3) analysis of the Seventh-day Adventist membership survey regarding their support for the proposal, their opinion concerning the challenges that may be confronted in establishing the extension, their personal educational plan, and their views on the programs of study the extension should offer; (4) analysis of the survey of Seventh-day Adventist youth and Bahamas Academy students regarding their potential enrolment into the NCU extension; (5) analysis of enrolment in tertiary education in The Bahamas with emphasis on the 20 to 24 age group, disaggregated by gender with a view to predicting future enrolment; (6) analysis of the job market to determine the most needed programs of study; (7) brief description of the proposed site to house the NCU extension to determine its suitability; (8) analysis of the Bahamas General Certificate of Secondary Education results in English and mathematics; (9) description of the technological and organizational structure required to support the NCU extension.

10:
Prepared by Annick M. Brennen, M.A., Action Consultant
Fe
br
ua
ry
8,
20
13
Chapter 1
Membership Support for the Proposal
A membership and student surveys were conducted to answer the question: “Is there a genuine need and demand for an NCU extension in the South Bahamas Conference?”
Membership Survey
A survey for adults aged 18 years of age and older was conducted. The consultant met with pastors during a weekly pastoral meeting to explain survey procedures and obtain their feedback. An administrator was to be designated to provide instruction and supervise the administration of the survey. Two thousand three hundred and twenty-eight surveys were distributed among 25 churches to be administered and completed in the churches after the Sabbath School session, but before worship. Eleven churches returned 468 completed surveys, which represents a 20 % rate of return.
Demographics
Of the 455 respondents or 97.2 % who indicated their gender, 311 or 68.3 % were female and 144 or 31.6 % were male. Of the 445 or 95 % who indicated their age range, the age distribution is as follows:
Chart 1: Age Distribution of Respondents
Forty-four percent of those who responded fall in the 35-54 age group category. Four hundred and forty-eight persons or 95.7 % disclosed their employment status. Of the 448 persons, 338
0
50
100
150
200
250
18-24 25-34 35-54 55+
80 66
207
92
Age Distribution of Respondents

11:
Prepared by Annick M. Brennen, M.A., Action Consultant
Fe
br
ua
ry
8,
20
13
are employed and 110 are unemployed. When the employment figures are disaggregated by gender, of those who indicated their gender, 219 females and 115 males are employed.
That women are the majority of the respondents is significant in this study as they represent those who have a higher rate of employment, help shape their children’s educational plans, provide financial support to children enroled in tertiary education, and have a greater participation rate in tertiary education. Of the 468 respondents, only 180 or 38.5 % stated they had school-aged children under 18.
Support for the Proposal
There was strong membership support for the proposal to establish an NCU extension in New Providence. As Chart 2 below indicates, of the 468 who completed the questionnaire, 316 or 67.5 % had a very positive opinion of the proposal; 85 or 18.2 % had a somewhat positive opinion of this proposal; 10 or 2.1 % had somewhat a negative opinion of this proposal; 8 or 1.7 % had a very negative opinion of this proposal; 32 or 6.8 % had no opinion of this proposal. Seventeen or 3.6 % provided no answer to the question.
Chart 2: Membership Opinion of the Proposal
Two other questions were asked to cross-check the level of commitment of members to support the extension. Answers to these questions confirm their support for the proposal to establish an NCU extension in New Providence.
Question 1: “If you have school-aged children, would you encourage them to consider attending NCU extension in New Providence?”
0
50
100
150
200
250
300
350
Very positive
Somewhat positive
Had no opinion
Very negative
Somewhat negative
No answer
316
85
32 8 10 17
Membership Opinion of the Proposal

12:
Prepared by Annick M. Brennen, M.A., Action Consultant
Fe
br
ua
ry
8,
20
13
Of the 180 persons who have school-aged children less than 18 years, 159 or 88 % would encourage them to attend Northern Caribbean University, while 21 or 12 % would not encourage them to attend it.
Question 2: “If you plan to pursue further education, would you consider attending the Northern Caribbean University extension?”
One hundred and eighty-six respondents would like to pursue further education. Of the 186 respondents, positive responses on the continuum exceed negative responses by 151 points as shown in Chart 3.
Chart 3: Potential NCU Attendance
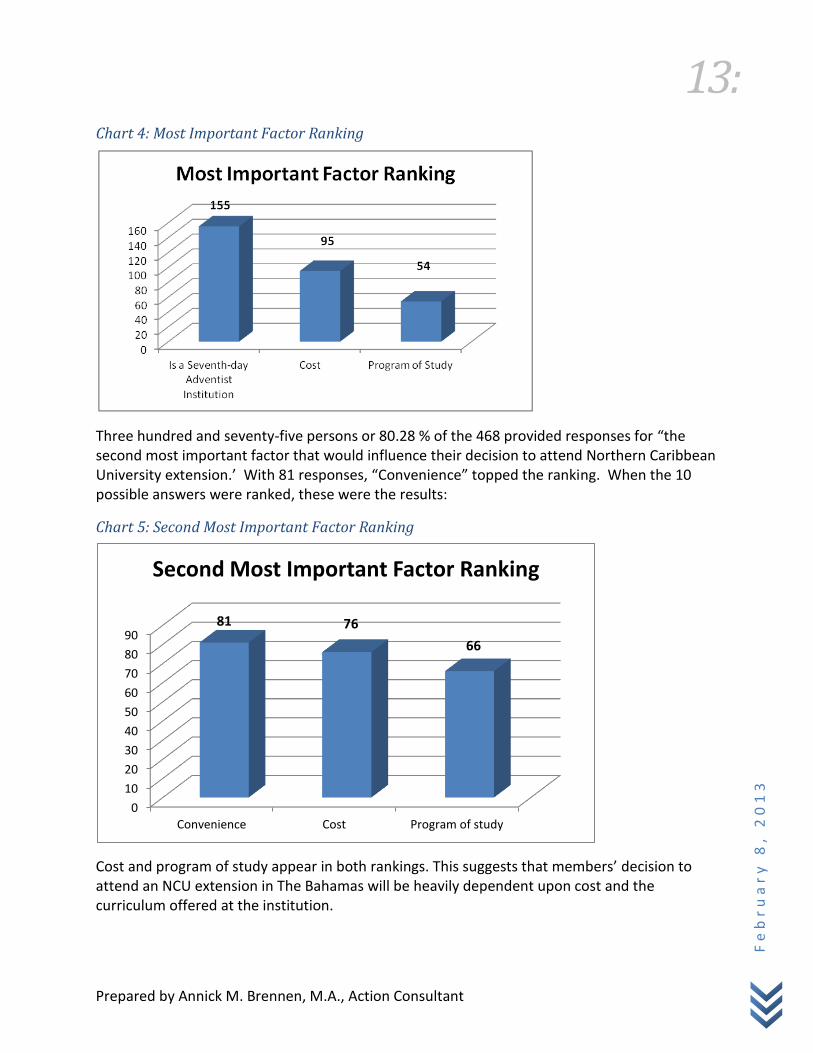
Four hundred persons or 85.5 % of the 468 respondents provided answers for the “first most important factor that would influence their decision to attend the NCU extension.” With 155 responses, the most important factor that would influence members to attend an NCU extension in The Bahamas is “It is a Seventh-Adventist Institution.” This shows great loyalty for the Seventh-day Adventist brand. When the 10 possible answers were ranked for the first most important factor, these were the results:
0
10
20
30
40
50
60
Definitely would not
attend
Would not likely
attend
50 % chance might attend
Would likely
attend
Would definitely
attend
No answer
8 9
59 53 56
1
Potential NCU Attendance
13:
Prepared by Annick M. Brennen, M.A., Action Consultant
Fe
br
ua
ry
8,
20
13
Chart 4: Most Important Factor Ranking
Three hundred and seventy-five persons or 80.28 % of the 468 provided responses for “the second most important factor that would influence their decision to attend Northern Caribbean University extension.’ With 81 responses, “Convenience” topped the ranking. When the 10 possible answers were ranked, these were the results:
Chart 5: Second Most Important Factor Ranking
Cost and program of study appear in both rankings. This suggests that members’ decision to attend an NCU extension in The Bahamas will be heavily dependent upon cost and the curriculum offered at the institution.
0
10
20
30
40
50
60
70
80
90
Convenience Cost Program of study
81 76
66
Second Most Important Factor Ranking

14:
Prepared by Annick M. Brennen, M.A., Action Consultant
Fe
br
ua
ry
8,
20
13
Challenges
Respondents provided 213 responses to the question: “What do you feel is the biggest challenge to the success of the Northern Caribbean University extension in New Providence?” Table 1 ranks all the responses provided. Members feel that funding/finance, cost of tuition, qualified lecturers, enrolment, membership support, and location are the top challenges the SBC will face in establishing an NCU extension in The Bahamas.
Table 1: Challenges
Challenge # of Responses
Funding/finance 41
Cost of tuition 38
Qualified lecturers 28
Enrolment 22
Membership support 16
Location 12
Accreditation/Academic Standards/Quality 8
COB/other tertiary education competition 7
Programs of Study Offered 6
Leadership/qualified, progressive administrators 4
Marketing 2
Getting established/initial acceptance 2
Accommodation for family island students 1
Bahamian support 1
Cost to establish and maintain 1
Lack of membership unity 1
Holding fast to the message 1
The school is geared towards SDA only 1
Interference with BA 2
Using BA restricts enrolment to part-time 1
Too new to begin at university level 1
Variety of instructional methods and media 1
Serious implementation of the university program 1
Research facility 1
Recreational space 1
Local lecturers and administrators 1
Proper organization 1
Parental interest 1
NCU leadership supporting and promoting their own
1
Support from NCU administration 1

15:
Prepared by Annick M. Brennen, M.A., Action Consultant
Fe
br
ua
ry
8,
20
13
Non-SDA enrolment 1
Non-communication 1
Commitment 1
Facilities 1
Financial aid 2
Lack of faith 1
Public and government cooperation 1
Student Survey
Demographics
The second survey was conducted among Grades 11 and 12 students at Bahamas Academy
during a class period. A total of 96 students completed the questionnaire. Seventy-six students
or 79.2 % reported being in Grade 11, while 10 or 10.4 % reported being in Grade 12. The age
of the respondents at their last birthday varied from 15 to 22 years as shown in Chart 6.
Chart 6: Age of Respondents (Students)
Students’ College Preferences
The first question asked was: “What do you plan to do after you graduate from high school?”
Chart 7 shows the answers. Only four students plan to attend NCU in Jamaica and 30 to attend
COB. This may indicate that (1) students are not familiar with the quality of education NCU
provides, (2) they do not value Seventh-day Adventist Education, (3) Seventh-day Adventist
Education seems too costly, or (4) NCU may not offer their chosen program.
0 5
10 15 20 25 30 35 40
15 16 17 18 19 20 22 No answer
37 39
9
1 3 2 3 2
Age
Age of Respondents

16:
Prepared by Annick M. Brennen, M.A., Action Consultant
Fe
br
ua
ry
8,
20
13
Chart 7: Post High School Plans
Students’ preference for not attending NCU was not final as shown in responses to Questions 1
and 2.
Question 1: “If you do not plan to attend college, would that decision change if a NCU extension was located in New Providence?”
Of the 13 students who do not plan to go college or are undecided, six (46 %) said their decision would change if an NCU extension was located in New Providence. The decision of four students (30 %) would not change. Three students did not answer this question.
Question 2: “If there were a Northern Caribbean University extension in New Providence, how likely would you attend?”
Although 96 students answered this question, only 9 or 9.4 % would definitely attend NCU. The number of negative responses totaled 28, while the number of positive responses totaled 68. This shows that, perhaps, with an aggressive marketing strategy students may be persuaded to attend NCU.
0
5
10
15
20
25
30
Post High School Plans

17:
Prepared by Annick M. Brennen, M.A., Action Consultant
Fe
br
ua
ry
8,
20
13
Chart 8: Potential NCU Attendance
Of the 93 students who plan to attend college, 65 (70 %) want to attend part-time, while 15 (16 %) want to attend full-time. Three students did not answer the question. The plan to offer evening classes at the extension coincides with the majority of the students’ plan to attend part-time.
One hundred percent of the respondents provided answers for the first and second most important factors that would influence their decision to attend the NCU extension. With a total responses of 52, receiving scholarship opportunities is the most important factor that would influence students to attend an NCU extension in The Bahamas. When the 10 possible answers were combined and ranked for the first and second most important factors, these were the results:
0
5
10
15
20
25
30
35
40
Definitely would not
attend
Would not likely attend
50 % chance might attend
Would likely attend
Would definitely
attend
13 15
37
22
9
Potential NCU Attendance

18:
Prepared by Annick M. Brennen, M.A., Action Consultant
Fe
br
ua
ry
8,
20
13
Table 2: Most Important Factors for Attending NCU
Factor Frequency %
Scholarship opportunities 52 26.53%
Cost 35 17.86%
Program of study 30 15.31%
Is SDA Institution 17 8.67%
Location 16 8.16%
Music 12 6.12%
University reputation 10 5.10%
Sports team 9 4.59%
No answer 8 4.08%
Convenience 7 3.57%
Total 196 100.0%
As part of its aggressive marketing strategy, providing scholarship may be the most effective means of attracting high school graduates to the NCU extension. However, it is worth noting that 48 or 50 % of respondents are unsure whether they will live and work in The Bahamas; 26 students or 27 % plan to live and work in The Bahamas, while 21 students do not plan to do so.

19:
Prepared by Annick M. Brennen, M.A., Action Consultant
Fe
br
ua
ry
8,
20
13
Chapter 2
Future Demand for Higher Education
Methodology
In planning for the establishment for a university extension in The Bahamas, it is important to explore the future size of the potential tertiary education market both in the Seventh-day Adventist Church and in the Bahamian population. This analysis uses population projections and participation rate information to estimate levels of future demand for higher education. “Higher education” refers to study of qualifications at the college- and university-levels. In The Bahamas, these are facilitated by several private colleges and universities and the government-funded The College of The Bahamas. The participation rates used in this analysis are the two best known indicators for higher education, namely the gross enrolment rate (GER) and the net enrolment rate (NER).
The NER compares the number of higher education students in a specific age group with the population number in the same age. The GER, usually calculated when student age profiles are not available or accurate, compares all enroled students in higher education with the population number in the 5-year age group following on the secondary school-leaving age.
Formally the definitions of GER and NER in terms of a logical 5-year age interval are:
GER = Total number of enrolments in higher education x 100% Population size in (logical) 5-year age interval NER = Total number of enrolments in higher education in logical 5-year age interval x 100% Population size in (logical) 5-year age interval1
The analysis relies on census and school attendance data obtained from the Department of Statistics for the years 1990, 2000, and 2010; population projections and time series from All Bahamas Medium Projection Tables 2000-2030; Seventh-day Adventist Population Age & Sex Distribution for the years 1990, 2000, and 2010, also from the Department of Statistics.
The population projections provide the base population numbers for the demand for higher education analysis. Projections for the Seventh-day Adventist Church membership were calculated using the observed percentage increase trends in the Seventh-day Adventist membership.
1 Measuring Student Participation in the Higher Education Sector in South Africa, A G W Steyn , Institutional Research and Planning Division Stellenbosch University
20:
Prepared by Annick M. Brennen, M.A., Action Consultant
Fe
br
ua
ry
8,
20
13
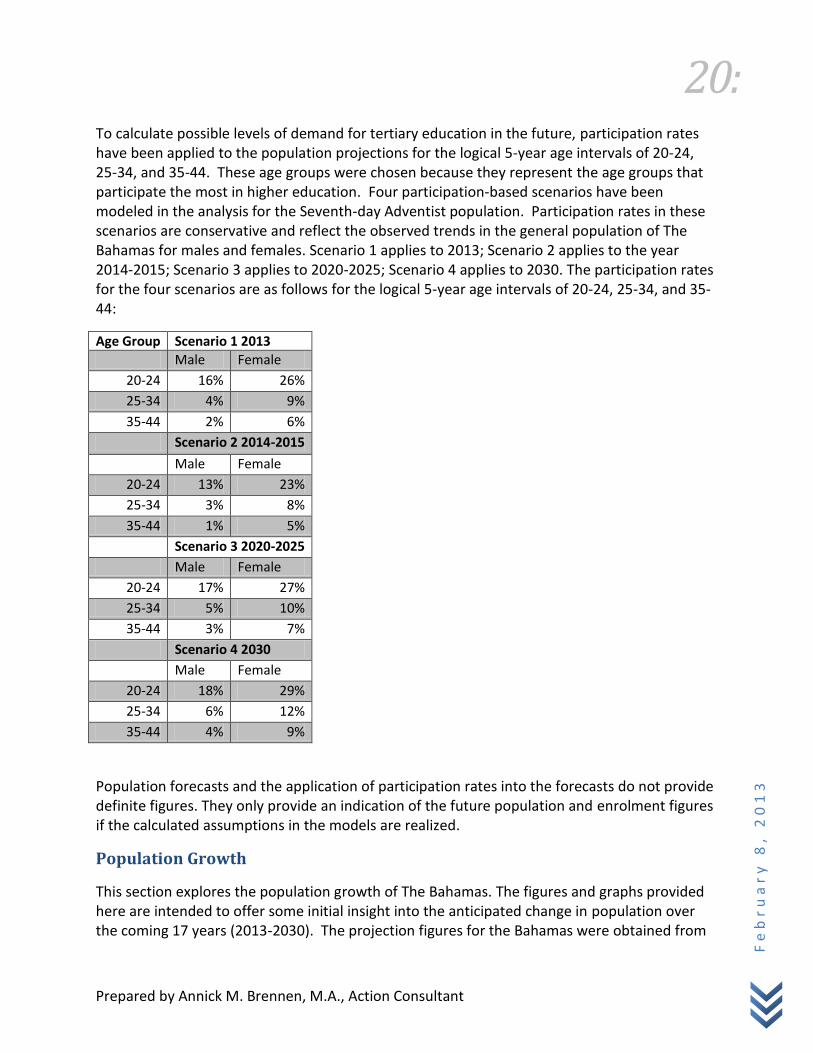
To calculate possible levels of demand for tertiary education in the future, participation rates have been applied to the population projections for the logical 5-year age intervals of 20-24, 25-34, and 35-44. These age groups were chosen because they represent the age groups that participate the most in higher education. Four participation-based scenarios have been modeled in the analysis for the Seventh-day Adventist population. Participation rates in these scenarios are conservative and reflect the observed trends in the general population of The Bahamas for males and females. Scenario 1 applies to 2013; Scenario 2 applies to the year 2014-2015; Scenario 3 applies to 2020-2025; Scenario 4 applies to 2030. The participation rates for the four scenarios are as follows for the logical 5-year age intervals of 20-24, 25-34, and 35-44:
Age Group Scenario 1 2013
Male Female
20-24 16% 26%
25-34 4% 9%
35-44 2% 6%
Scenario 2 2014-2015
Male Female
20-24 13% 23%
25-34 3% 8%
35-44 1% 5%
Scenario 3 2020-2025
Male Female
20-24 17% 27%
25-34 5% 10%
35-44 3% 7%
Scenario 4 2030
Male Female
20-24 18% 29%
25-34 6% 12%
35-44 4% 9%
Population forecasts and the application of participation rates into the forecasts do not provide definite figures. They only provide an indication of the future population and enrolment figures if the calculated assumptions in the models are realized.
Population Growth
This section explores the population growth of The Bahamas. The figures and graphs provided here are intended to offer some initial insight into the anticipated change in population over the coming 17 years (2013-2030). The projection figures for the Bahamas were obtained from

21:
Prepared by Annick M. Brennen, M.A., Action Consultant
Fe
br
ua
ry
8,
20
13
the All Bahamas Medium Projection Tables supplied by the Department of Statistics. The reader should focus on the 20 to 24 year age group, which is the documented core market for tertiary education in The Bahamas.
The figures are presented by gender because The National Report of Higher Education in the Commonwealth of The Bahamas, prepared for UNESCO IESALC2 has documented that females’ participation in higher education exceeds males’ participation.
All Bahamas Population Projections
The Department of Statistics projects that the median age for All the Bahamas will increase by one or two points in the next decades.
Table 3: Median Age: All Bahamas
2000 2005 2010 2015 2020 2025 2030
27 29 30 32 33 34 36
Source: Key Demographic Indicators Population Projections (Medium Series): 2000-2030
Chart 9: Median Age 2000-2030 All Bahamas
The U.S. Census Bureau, International Data Base provides two population pyramids that illustrate the predicted age and sex distribution of the Bahamian population for 2020 and 2050. The pyramids were retrieved from http://www.nationmaster.com/country/bf-bahamas-the/Age-_distribution. It is predicted that the 20-24 and 25-29 age groups will be the largest in 2020. In 2050, the 20-24 to 40-44 age groups are predicted to be roughly the same.
2 William J. Fielding & Jeannie Gibson et al. National Report on Higher Education in The Commonwealth of The
Bahamas, May 2005, Revised November 2005.
0
5
10
15
20
25
30
35
40
2000 2005 2010 2015 2020 2025 2030
Median Age 2000-2030

22:
Prepared by Annick M. Brennen, M.A., Action Consultant
Fe
br
ua
ry
8,
20
13
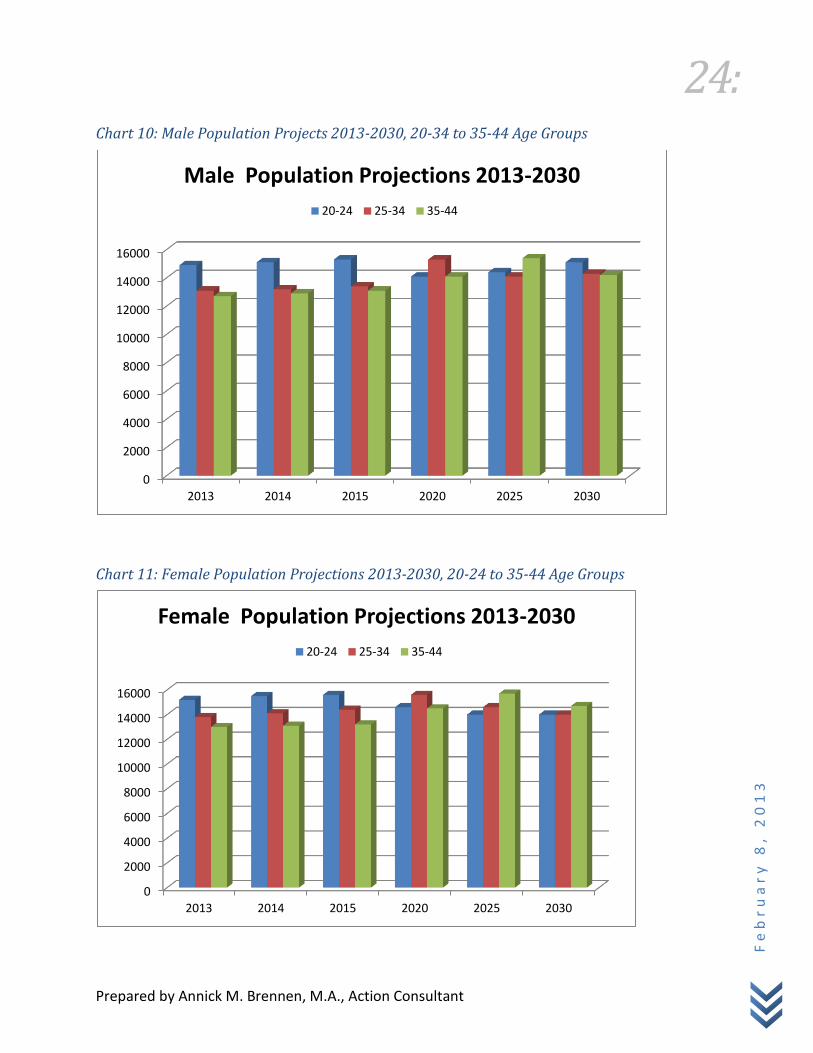
The population projections for The Bahamas for the 5-year logical age groups of 20-24, 25-34, and 35-44 for males and females are shown in Table 4. For the male projections, observe the insignificant increase of 1 % in the 20-24 age group and a very modest increase of 9 % in the 25-34 age group. For the female projections, observe the 8 % decrease in the 20-24 age group and an insignificant increase of 1 % in the 25-34 age group. The negative change in the 20-24

23:
Prepared by Annick M. Brennen, M.A., Action Consultant
Fe
br
ua
ry
8,
20
13
female population going to 2030 is significant and has implications when planning for the provision of higher education. The changes in the male and female populations will also be reflected in the Seventh-day Adventist membership.
Table 4: Population Projections for All Bahamas, 2013 to 2030—Five-Year Logical Age Groups
Male Projections Change 2013 to 2030
2013 2014 2015 2020 2025 2030 Number Percent
20-24 14899 15100 15300 14100 14400 15100 201 1%
25-34 13100 13200 13400 15300 14100 14300 1200 9%
35-44 12700 12900 13100 14100 15400 14200 1500 12%
Female Projections Change 2013 to 2030
2013 2014 2015 2020 2025 2030 Number Percent
20-24 15200 15500 15600 14600 14000 14000 -1200 -8%
25-34 13800 14100 14400 15600 14600 14000 200 1%
35-44 13000 13100 13200 14500 15700 14700 1700 13%
Source: All Bahamas Medium Projection Tables 2013-2030, Department of Statistics
Charts 10 and 11 highlight the changes in the male and female populations for the 20-24 to 35-44 age groups.
24:
Prepared by Annick M. Brennen, M.A., Action Consultant
Fe
br
ua
ry
8,
20
13
Chart 10: Male Population Projects 2013-2030, 20-34 to 35-44 Age Groups
Chart 11: Female Population Projections 2013-2030, 20-24 to 35-44 Age Groups
0
2000
4000
6000
8000
10000
12000
14000
16000
2013 2014 2015 2020 2025 2030
Male Population Projections 2013-2030
20-24 25-34 35-44
0
2000
4000
6000
8000
10000
12000
14000
16000
2013 2014 2015 2020 2025 2030
Female Population Projections 2013-2030
20-24 25-34 35-44

25:
Prepared by Annick M. Brennen, M.A., Action Consultant
Fe
br
ua
ry
8,
20
13
Seventh-day Adventist Membership Projections
Note how the membership has changed for the male and female populations from 1990 to 2010 as shown in Table 5. Data used in calculating the Seventh-day Adventist Membership historical changes in the male and female populations were taken from the 1990, 2000, and 2010 Censuses of Population and Housing Tables All Bahamas broken down by gender by the Department of Statistics. Observe that the greatest percent changes occurred in the 35-44 age groups for both males and females.
Table 5: Changes in the Population of the Seventh-day Adventist Church 1990-2010
Male Historical Membership Changes Change 1990 to 2010
Age Group 1990 2000 2010 Number Percent
15-24 786 905 1149 363 46%
25-34 717 1005 1197 480 67%
35-44 379 869 1123 744 196%
Total 1882 2779 3469 1587 84%
Female Historical Membership Changes Change 1990 to 2010
Age Group 1990 2000 2010 Number Percent
15-24 828 956 1280 452 55%
25-34 815 1042 1327 512 63%
35-44 412 892 1306 894 217%
Total 2055 2890 3913 1858 90%
Source: 1990, 2000, and 2010 Population and Religion All Bahamas

26:
Prepared by Annick M. Brennen, M.A., Action Consultant
Fe
br
ua
ry
8,
20
13
Chart 12: Seventh-day Adventist Population 1990, 2000, 2010 by Gender, 15-24 to 35-44 Age Groups
Source: 1990, 2000, and 2010 Population and Religion Tables, Department of Statistics
Secondly, let us compare the Seventh-day Adventist membership figures to the historical figures for the entire Bahamas for males and females and for the same age groups. Note the percentages of the Seventh-day Adventist membership to the population of The Bahamas for those age groups and gender. They are roughly the same for both genders and the increase was roughly 1 % over the decades.
Table 6: Seventh-day Adventist Membership vs Bahamas Population
Male Population 1990 All Bahamas 1990 SDA % of Male Population
15-24 24099 786 3%
25-34 21373 717 3%
35-44 12789 379 3%
Total 58261 1882 3%
0
200
400
600
800
1000
1200
1400
90 Male 90 Female 00 Male 00 Female 10 Male 10 Female
Seventh-Day Adventist Population 1990, 2000, 2010 by Gender
15-24 25-34 35-44

27:
Prepared by Annick M. Brennen, M.A., Action Consultant
Fe
br
ua
ry
8,
20
13
Female Population 1990 All Bahamas 1990 SDA % of Female Population
15-24 24308 828 3%
25-34 22508 815 4%
35-44 13705 412 3%
Total 60521 2055 3%
Male Population 2000 All Bahamas 2000 SDA % of Male Population
15-24 27495 905 3%
25-34 25711 1005 4%
35-44 22409 869 4%
Total 75615 2779 4%
Female Population 2000 All Bahamas 2000 SDA % of Female Population
15-24 25716 956 4%
25-34 27310 1042 4%
35-44 24492 892 4%
Total 77518 2890 4%
Male Population 2010 All Bahamas 2010 SDA % of Male Population
15-24 28796 1149 4%
25-34 25729 1197 5%
35-44 26564 1123 4%
Total 81089 3469 4%
Female Population 2010 All Bahamas 2010 SDA % of Female Population
15-24 28855 1280 4%
25-34 27920 1327 5%
35-44 28729 1306 5%
Total 85504 3913 5%
Source: 1990, 2000, and 2010 Total Population by Sex and Age in Years Last Birthday All Bahamas
To calculate the projections for the Seventh-day Adventist membership for 2013 to 2030, I utilized the projected population figures for males and females for the entire Bahamas (Table 5) and applied the same percentage trends observed in the analysis in Table 6. The results are shown in Table 7.

28:
Prepared by Annick M. Brennen, M.A., Action Consultant
Fe
br
ua
ry
8,
20
13
Table 7 Projected Male and Female Seventh-day Adventist Memberships
Projected Male SDA Membership
2013 2014 2015 2020 2025 2030
20-24 596 604 765 846 1008 1208
25-34 655 660 804 1071 1128 1287
35-44 508 516 655 987 1232 1278
Total 1759 1780 2224 2904 3368 3773
Projected Female SDA Membership
2013 2014 2015 2020 2025 2030
20-24 608 620 780 876 980 1120
25-34 690 705 864 1092 1168 1260
35-44 650 655 792 1160 1413 1470
Total 1948 1980 2436 3128 3561 3850
Chart 13: Projected SDA Male Membership 2013-2030, 20-24 to 35-44 Age Groups
0
200
400
600
800
1000
1200
1400
2013 2014 2015 2020 2025 2030
Projected SDA Male Membership 2013-2030
20-24 25-34 35-44

29:
Prepared by Annick M. Brennen, M.A., Action Consultant
Fe
br
ua
ry
8,
20
13
Chart 14: Projected SDA Female Membership 2013-2030, 20-24 to 35-44 Age Groups
Historical Participation in Higher Education
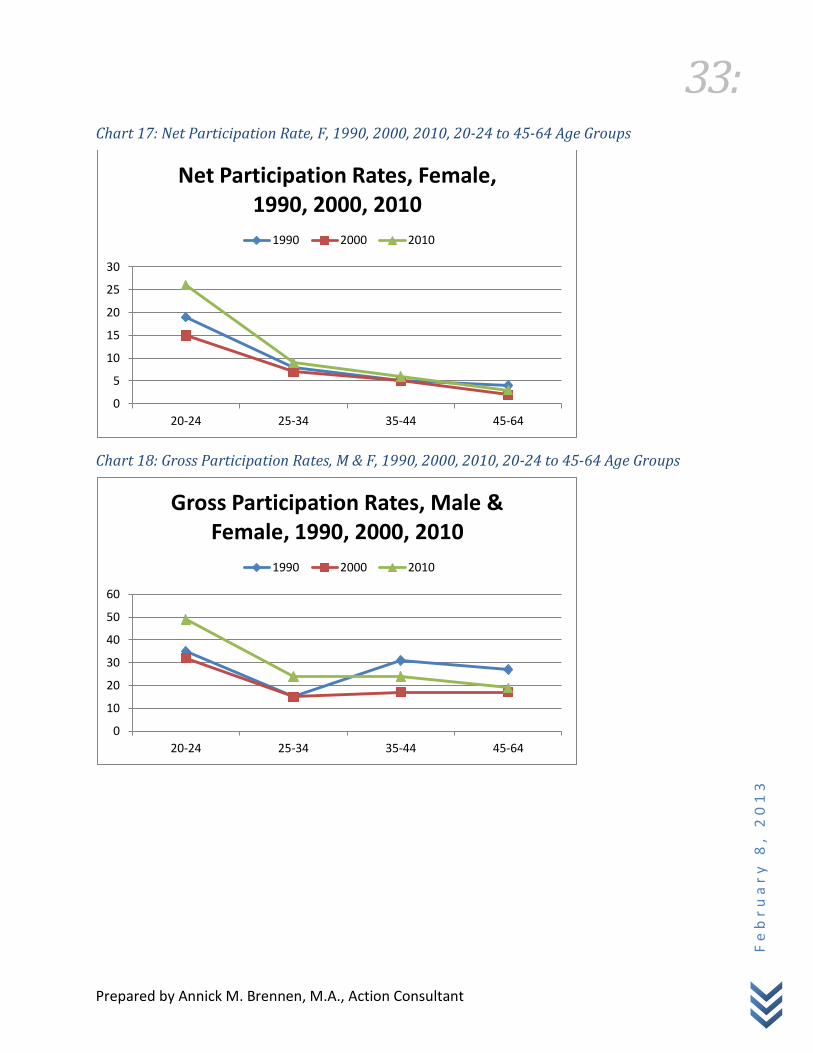
The analysis of the historical participation in higher education in The Bahamas used data from the School Attendance All Bahamas 1990, 2000, and 2010 by Sex 15-64 provided by the Department of Statistics. The analysis uses the 20-24, 25-34, and 45-64 age groups for both genders in calculating the GER and the NER. The results are shown in Table 8.
The data shows:
1. Females participate in greater numbers in higher education. 2. The 20-24 age group has the highest rate of participation in higher education. 3. Participation in higher education steadily decreases as people get older. 4. Participation in higher education dipped drastically in 2000 but increased by a few
percentage points in 2010. Review of economic data suggests that The Bahamas was experiencing an economic boom in the Tourism industry. Does financial prosperity ushered by Tourism have a negative impact on participation in higher education? Some have strongly suggested over the years that this may be the case.
Abbreviations Used in the Tables
M = Male
F = Female
GER = Gross Enrolment Rate
NER = Net Enrolment Rate
0
500
1000
1500
2000
2013 2014 2015 2020 2025 2030
Projected SDA Female Membership 2013-2030
20-24 25-34 35-44

30:
Prepared by Annick M. Brennen, M.A., Action Consultant
Fe
br
ua
ry
8,
20
13
Table 8: Calculation of Gross and Net Enrolment Rates Using 20-24, 25-34, 35-44, and 45-64 Age Intervals for 1990, 2000, and 2010 According to Gender
Year Gender Headcount Enrolments In Education
Headcount Enrolments in Education
in Age Group 20-24
Population Size in Age Group 20-
24
GER %
NER % % Increase in GER 2000-2010
% Increase in NER 2000-2010
1990 M & F 8037 3648 23156 35% 16%
M 3034 1457 11667 26% 12%
F 5003 2191 11845 42% 18%
2000 M & F 8041 2890 24772 32% 12%
M 2527 1030 12140 21% 8%
F 5514 1860 12632 44% 15%
2010 M & F 13013 5457 26499 49% 21% 53.13% 75.00%
M 4256 2049 13140 32% 16% 34.38% 100.00%
F 8757 3408 13359 66% 26% 50.00% 73.33%
Year Gender Headcount Enrolments In Education
Headcount Enrolments in Education
in Age Group 25-34
Population Size in Age
Group 25-34
GER %
NER % % Increase in GER 2000-2010
% Increase in NER 2000-2010
1990 M & F 8037 2874 53021 15% 5%
M 3034 1017 20576 15% 5%
F 5003 1857 22451 22% 8%
2000 M & F 8041 2806 53021 15% 5%
M 2527 808 25711 10% 3%
F 5514 1998 27310 20% 7%
2010 M & F 13013 3859 53649 24% 7% 60.00% 40.00%
M 4256 1028 25729 17% 4% 70.00% 33.33%
F 8757 2561 27920 31% 9% 55.00% 28.57%

31:
Prepared by Annick M. Brennen, M.A., Action Consultant
Fe
br
ua
ry
8,
20
13
Year Gender Headcount Enrolments In Education
Headcount Enrolments in Education
in Age Group 35-44
Population Size in Age
Group 35-44
GER %
NER % % Increase in GER 2000-2010
% Increase in NER 2000-2010
1990 M & F 8037 1078 26242 31% 4%
M 3034 370 12565 24% 3%
F 5003 708 13677 37% 5%
2000 M & F 8041 1673 46901 17% 4%
M 2527 462 22409 11% 2%
F 5514 1211 24492 23% 5%
2010 M & F 13013 2384 55293 24% 4% 41.18% 0.00%
M 4256 640 26564 16% 2% 45.45% 0.00%
F 8757 1744 28729 30% 6% 30.43% 20.00%
Year Gender Headcount Enrolments In Education
Headcount Enrolments in Education
in Age Group 45-64
Population Size in Age
Group 45-64
GER % NER % % Increase in GER 2000-2010
% Increase in NER 2000-2010
1990 M & F 8037 437 29558 27% 1%
M 3034 190 4524 67% 4%
F 5003 247 6450 78% 4%
2000 M & F 8041 672 45958 17% 1%
M 2527 227 21884 12% 1%
F 5514 445 24074 23% 2%
2010 M & F 13013 1583 68121 19% 2% 11.76% 100.00%
M 4256 539 32312 13% 2% 8.33% 100.00%
F 8757 1044 35809 24% 3% 4.34% 50.00%
Charts 15 to 17 highlight the net participation in higher education of the 20-44 to 45-64 age groups for both genders for The Bahamas; while Charts 18 to 20 highlight the gross participation in higher education of the 20-44 to 45-64 age groups for both genders.

32:
Prepared by Annick M. Brennen, M.A., Action Consultant
Fe
br
ua
ry
8,
20
13
Chart 15: Net Participation Rate M and F, 1990, 2000, 2010, 20-24 to 45-64 Age Groups
Chart 16: Net Participation Rate, M, 1990, 2000, 2010, 20-24 to 45-64 Age Groups
33:
Prepared by Annick M. Brennen, M.A., Action Consultant
Fe
br
ua
ry
8,
20
13
Chart 17: Net Participation Rate, F, 1990, 2000, 2010, 20-24 to 45-64 Age Groups
Chart 18: Gross Participation Rates, M & F, 1990, 2000, 2010, 20-24 to 45-64 Age Groups
0
5
10
15
20
25
30
20-24 25-34 35-44 45-64
Net Participation Rates, Female, 1990, 2000, 2010
1990 2000 2010
0
10
20
30
40
50
60
20-24 25-34 35-44 45-64
Gross Participation Rates, Male & Female, 1990, 2000, 2010
1990 2000 2010

34:
Prepared by Annick M. Brennen, M.A., Action Consultant
Fe
br
ua
ry
8,
20
13
Chart 19: Gross Participation Rates, M, 1990, 2000, 2010, 20-24 to 45-64 Age Groups
Chart 20: Gross Participation Rates, F, 1990, 2000, 2010, 20-24 to 45-64 Age Groups
Future Demand for Higher Education
Future demand for higher education was calculated for both the Bahamian and Seventh-day Adventist populations using the four scenarios shown on page 14.
All Bahamas Projected Enrolment in Higher Education
Table 9 shows the projected enrolments levels for the years 2013 to 2030 for All the Bahamas for the 5-year logical age groups under examination for both sexes. F enrolment is expected to almost double M enrolment. The 20-24 age group is expected to have the highest levels of

35:
Prepared by Annick M. Brennen, M.A., Action Consultant
Fe
br
ua
ry
8,
20
13
participation in higher education. Levels of participation will increase modestly from 2013 to 2030, especially for the M population.
Table 9: Projected Enrolment All Bahamas 2013-2030, 20-34 to 35-44 Age Groups by Gender
Projected M Enrolments in Higher Education
Age groups 2013 2014 2015 2020 2025 2030
20-24 2384 1963 1989 2397 2448 2718
25-34 524 396 402 765 705 858
35-44 254 129 131 423 462 568
Total M Enrolment 3162 2488 2522 3585 3615 4144
Projected F Enrollments in Higher Education
Age groups 2013 2014 2015 2020 2025 2030
20-24 3952 3565 3588 3942 3780 4060
25-34 1242 1128 1152 1560 1460 1680
35-44 780 655 660 1015 1099 1323
F Enrolment 5974 5348 5400 6517 6339 7063
Total M & F Enrolment 9136 7836 7922 10102 9954 11207
Chart 21: Projected M Enrolment 2013 to 2030, 20-24 to 35-44 Age Groups

36:
Prepared by Annick M. Brennen, M.A., Action Consultant
Fe
br
ua
ry
8,
20
13
Chart 22: Projected F Enrolment 2013-2030, 20-24 to 35-44 Age Groups
Chart 23: Projected M and F Enrolment 2013-2030, 20-24 to 35-44 Age Groups
Projected Seventh-day Adventist Enrolment in Higher Education
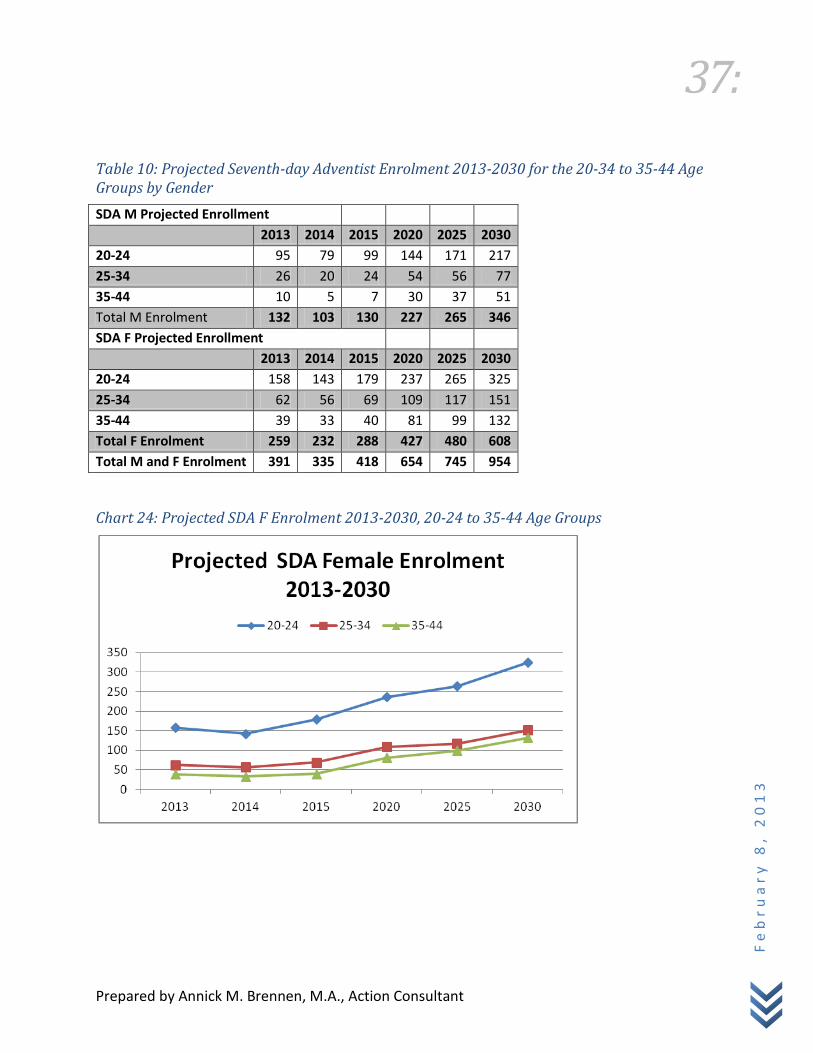
The projected membership figures and Scenarios 1 to 4 percentages were used to calculate the projected M and F enrolments shown in Table 10. The projected enrolment is in three-digit figures. These enrolment figures do not provide an ideal pool for sustaining a university extension, especially when one considers that some will opt to enroll in other tertiary institutions. A marketing strategy including Seventh-day and non-Seventh-day Adventists will be required to secure greater enrolment.
0
2000
4000
6000
8000
2013 2014 2015 2020 2025 2030
Projected Male and Female Enrolment 2013-2030
20-24 25-34 35-44
37:
Prepared by Annick M. Brennen, M.A., Action Consultant
Fe
br
ua
ry
8,
20
13
Table 10: Projected Seventh-day Adventist Enrolment 2013-2030 for the 20-34 to 35-44 Age Groups by Gender
SDA M Projected Enrollment
2013 2014 2015 2020 2025 2030
20-24 95 79 99 144 171 217
25-34 26 20 24 54 56 77
35-44 10 5 7 30 37 51
Total M Enrolment 132 103 130 227 265 346
SDA F Projected Enrollment
2013 2014 2015 2020 2025 2030
20-24 158 143 179 237 265 325
25-34 62 56 69 109 117 151
35-44 39 33 40 81 99 132
Total F Enrolment 259 232 288 427 480 608
Total M and F Enrolment 391 335 418 654 745 954
Chart 24: Projected SDA F Enrolment 2013-2030, 20-24 to 35-44 Age Groups

38:
Prepared by Annick M. Brennen, M.A., Action Consultant
Fe
br
ua
ry
8,
20
13
Chart 25: Projected SDA M Enrolment 2013-2030, 20-24 to 35-44 Age Groups
This analysis would be incomplete unless data of students enroled in the United States were
included. The Institute of International Education has the responsibility for tracking all
international students enroled in colleges and universities in the United States. Their Open
Doors Data provided the enrolment figures (shown in Table 11) for Bahamian students enroled
in colleges and universities in the United States.
Table 11: Enrollment of Bahamian Students in the United States, 2000 to 2011
School Years 2000/01 2001-02 2002/03 2003/04 2004/05 2005/06
Number of students enroled 1762 1973 2012 2030 1638 1631
School Years 2006/07 2007/08 2008/09 2009/10 2010/11
Number of students enroled 1681 1542 1773 1828 1720
Source: http://www.iie.org/Research-and-Publications/Open-Doors/Data/International-
Students/All-Places-of-Origin/Institute of International Education.
Market Share Captured by the College of The Bahamas
In 2000 and 2010 the total headcount enrolment in education for both Ms and Fs was 8041 and
13,283 respectively. With 3,178 and 5,0003 enroled in 2000 and 2010, The College of The
Bahamas captured 40 % and 38 % of the education market. The sizable market share The
33 Retrieved from http://www.cob.edu.bs/About/History.php, January 18, 2013.

39:
Prepared by Annick M. Brennen, M.A., Action Consultant
Fe
br
ua
ry
8,
20
13
College of The Bahamas enjoys is due to the affordable tuition cost it is able to extend to
Bahamian students (see Chapter 4). The success of a Northern Caribbean University extension
in New Providence will depend in great part to the market share it is able to capture through
effective branding, an aggressive marketing strategy, and a sustained management thrust.

40:
Prepared by Annick M. Brennen, M.A., Action Consultant
Fe
br
ua
ry
8,
20
13
Chapter 3
The Curriculum
Methodology
To determine what programs of study an NCU extension should offer in The Bahamas, four sources of data were reviewed and the data was analyzed:
1. Survey responses 2. The undergraduate and graduate curricula of eight tertiary education institutions
registered with the Tertiary Quality Assurance Unit of the Ministry of Education and Technology
3. Labor market job postings from the Nassau Guardian, the Tribune and employment web sites for the period 3/17 2012 to 10/26/2012.
4. The preferred programs of study of Bahamian students enroled in colleges in The Bahamas and the United States.
Survey Responses
Membership Survey
The Membership Survey yielded 355 responses to the question: “If there was a Northern Caribbean University, what fields of study would you wanting it to provide.” These responses although important, should not be used blindly to determine the curriculum an NCU extension in The Bahamas should offer. This is because of the 468 respondents who provided these responses, 132 or 28.2 % have completed their education and do not plan to pursue further education; 47 or 10 % are enroled at the College of The Bahamas; 15 or 3.2 % are enroled at The Bahamas Technical and Vocational Institute; 14 or 3.0 are enroled in a local college; 3 or .6 % are enroled in a Seventh-day Adventist college overseas; 6 or 1.3 % are enroled at Northern Caribbean University in Jamaica; 9 or 1.9 % are enroled in non-Seventh-day Adventist colleges overseas. However, 58 or 12.4 % would like to pursue an undergraduate degree, while 128 or 27.4 % would like to pursue a graduate or post-graduate degree.
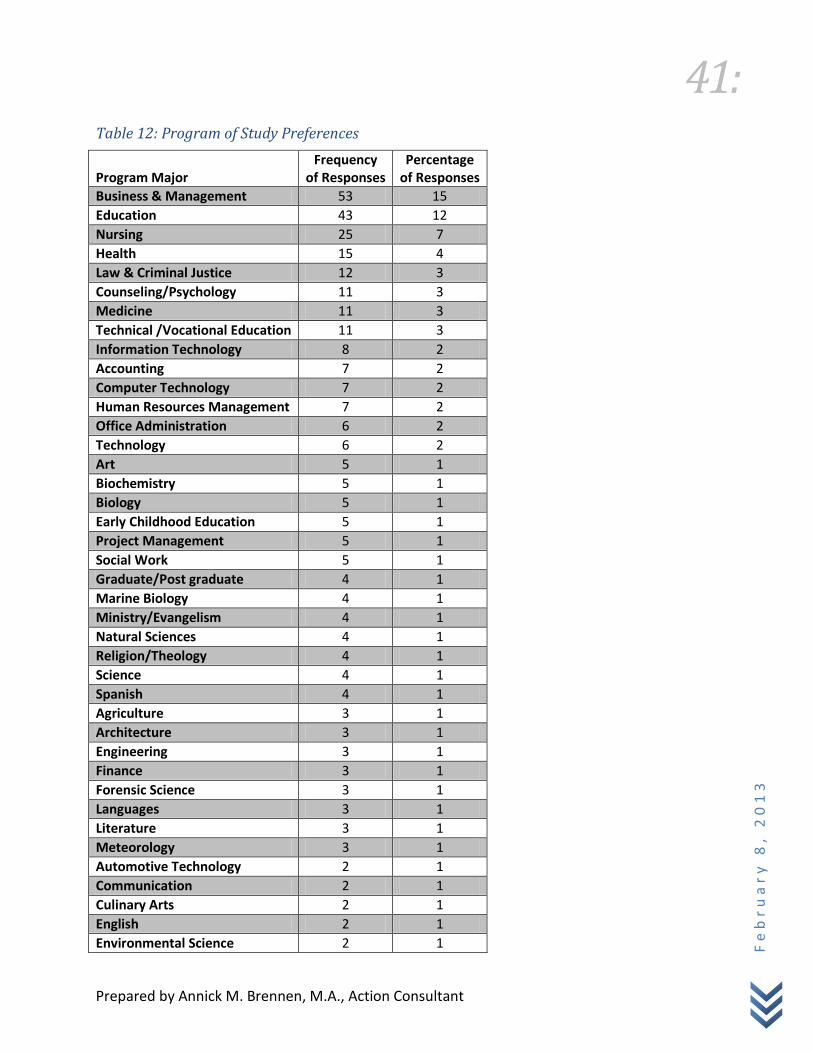
Although the list of preferred programs of study is long, it is provided in Table 12 in ranking order to show the diversity of responses. Business and management tops the list, followed by education, nursing, health, law and criminal justice.
41:
Prepared by Annick M. Brennen, M.A., Action Consultant
Fe
br
ua
ry
8,
20
13
Table 12: Program of Study Preferences
Program Major
Frequency of Responses
Percentage of Responses
Business & Management 53 15
Education 43 12
Nursing 25 7
Health 15 4
Law & Criminal Justice 12 3
Counseling/Psychology 11 3
Medicine 11 3
Technical /Vocational Education 11 3
Information Technology 8 2
Accounting 7 2
Computer Technology 7 2
Human Resources Management 7 2
Office Administration 6 2
Technology 6 2
Art 5 1
Biochemistry 5 1
Biology 5 1
Early Childhood Education 5 1
Project Management 5 1
Social Work 5 1
Graduate/Post graduate 4 1
Marine Biology 4 1
Ministry/Evangelism 4 1
Natural Sciences 4 1
Religion/Theology 4 1
Science 4 1
Spanish 4 1
Agriculture 3 1
Architecture 3 1
Engineering 3 1
Finance 3 1
Forensic Science 3 1
Languages 3 1
Literature 3 1
Meteorology 3 1
Automotive Technology 2 1
Communication 2 1
Culinary Arts 2 1
English 2 1
Environmental Science 2 1

42:
Prepared by Annick M. Brennen, M.A., Action Consultant
Fe
br
ua
ry
8,
20
13
Program Major
Frequency of Responses
Percentage of Responses
Natural Medicine 2 1
Nutrition 2 1
Pre-dentistry 2 1
Pre-medicine 2 1
Adult Education 1 0.28
Air Conditioning 1 0.28
Alternate Energy 1 0.28
Archeology 1 0.28
Aviation 1 0.28
Biological Research 1 0.28
Broadcasting 1 0.28
Building Construction 1 0.28
Chemistry 1 0.28
Church Administration 1 0.28
Criminology 1 0.28
Deaf Reading 1 0.28
Ecology 1 0.28
Economics 1 0.28
Educational Psychology 1 0.28
Electrical Engineering 1 0.28
Electronics 1 0.28
Elementary Education 1 0.28
Farming 1 0.28
Fishing 1 0.28
Graphic Design 1 0.28
Home Economics 1 0.28
Lay Preaching/Bible Work 1 0.28
Light manufacturing 1 0.28
Marine Studies 1 0.28
Mathematics 1 0.28
Midwifery/Homecare 1 0.28
Music 1 0.28
Sociology 1 0.28
Special Education 1 0.28
Speech Therapy 1 0.28
Sports 1 0.28
Systems Analysis/Computing 1 0.28
Total 355 100

43:
Prepared by Annick M. Brennen, M.A., Action Consultant
Fe
br
ua
ry
8,
20
13
Student Survey
About 97 percent of the 96 students provided answers to the three-part question: “If there was a Northern Caribbean University in New Providence, what degree majors would you most like to see offered? Using the list below, please rank your top three choices in the order in which you would most like to see offered.”
Responses to their top three choices are listed in ranking order in Tables 13 to 15. Note that business administration ranks first in Choices 1 and 3, while management ranks third in Choice 2.
Table 13: Choice 1 Preferred Programs of Study
Major Frequency of Responses
Percentage of Responses
Business Administration 14 14.6
Biochemistry 8 8.3
Criminal justice 5 5.2
Nursing 5 5.2
Computer Science 5 5.2
Music 4 4.2
Accounting 4 4.2
Dental hygiene 3 3.1
Engineering 3 3.1
Biology 3 3.1
Hospitality and Tourism 3 3.1
Medical Technology 3 3.1
Psychology 3 3.1
Early Childhood Teacher Education 2 2.1
English 2 2.1
Geography 2 2.1
History 2 2.1
Biology Education 2 2.1
Primary Teacher Education 2 2.1
No answer 2 2.1
Dietetics 1 1.0
Management 1 1.0
Mechanical Engineering 1 1.0
Office Technology & Administration 1 1.0
Piano performance 1 1.0
Religion 1 1.0
School counseling 1 1.0
Spanish 1 1.0
Visual Studies 1 1.0

44:
Prepared by Annick M. Brennen, M.A., Action Consultant
Fe
br
ua
ry
8,
20
13
Major Frequency of Responses
Percentage of Responses
Optometry 1 1.0
Aero-engineering 1 1.0
Physics 1 1.0
Pediatric Cardiology 1 1.0
Medicine 1 1.0
Aviation 1 1.0
Corporate law 1 1.0
Clothing and textiles 1 1.0
Computer Systems Engineering 1 1.0
Counselling 1 1.0
Total 96 100.0
Table 14: Choice 2 Preferred Programs of Study
Major Frequency of Responses
Percentage of Responses
Engineering 7 7.3
Biochemistry 5 5.2
Management 5 5.2
Math 5 5.2
Nursing 5 5.2
Criminal Justice 4 4.2
Environmental Science 4 4.2
Biology 4 4.2
Guidance Counseling 4 4.2
Psychology 4 4.2
Business Administration 4 4.2
Computer Science 4 4.2
Electrical engineering 3 3.1
Hospitality Management 3 3.1
Piano performance 3 3.1
Computer systems Engineering 3 3.1
Counselling 3 3.1
No answer 3 3.1
Family Life Education 2 2.1
Medical Technology 2 2.1
Social work 2 2.1
Chemistry 2 2.1
Clothing and Textiles 2 2.1
Dental Hygiene 1 1.0

45:
Prepared by Annick M. Brennen, M.A., Action Consultant
Fe
br
ua
ry
8,
20
13
Major Frequency of Responses
Percentage of Responses
Dietetics 1 1.0
English 1 1.0
Geography 1 1.0
Industrial and Organizational Counseling 1 1.0
Mass communication 1 1.0
Mechanical Engineering 1 1.0
Office Systems and Administration 1 1.0
Office Technology & Administration 1 1.0
Primary teacher education 1 1.0
Spanish 1 1.0
Visual Art 1 1.0
Banking and Finance 1 1.0
Total 96 100.0
Table 15: Choice 3 Preferred Programs of Study
Major Frequency of Responses
Percentage of Responses
Business Administration 6 6.3
Office Technology & Administration 5 5.2
Engineering 4 4.2
Mechanical Engineering 4 4.2
Office Systems and Administration 4 4.2
Spanish 4 4.2
Computer Systems Engineering 4 4.2
Early Childhood Teacher Education 3 3.1
Guidance Counseling 3 3.1
History 3 3.1
Math 3 3.1
Primary Teacher Education 3 3.1
Computer Science 3 3.1
Dental Hygiene 2 2.1
Electrical Engineering 2 2.1
English 2 2.1
Medical Technology 2 2.1
Music 2 2.1
Piano Performance 2 2.1
Religion 2 2.1
Accounting 2 2.1
Clothing and Textiles 2 2.1
46:
Prepared by Annick M. Brennen, M.A., Action Consultant
Fe
br
ua
ry
8,
20
13
Major Frequency of Responses
Percentage of Responses
Biochemistry 1 1.0
Criminal Justice 1 1.0
Environmental Science 1 1.0
Family Life Education 1 1.0
General Studies 1 1.0
Geography 1 1.0
Hospitality and Tourism 1 1.0
Hospitality Management 1 1.0
Information Science 1 1.0
Management 1 1.0
Mass Communication 1 1.0
Biology Education 1 1.0
Psychology 1 1.0
Secondary Education 1 1.0
Secondary Teacher Education 1 1.0
Social Work 1 1.0
Visual Studies 1 1.0
Optometry 1 1.0
Chemistry 2 2.1
Therapist 1 1.0
Aviation 1 1.0
Counselling 1 1.0
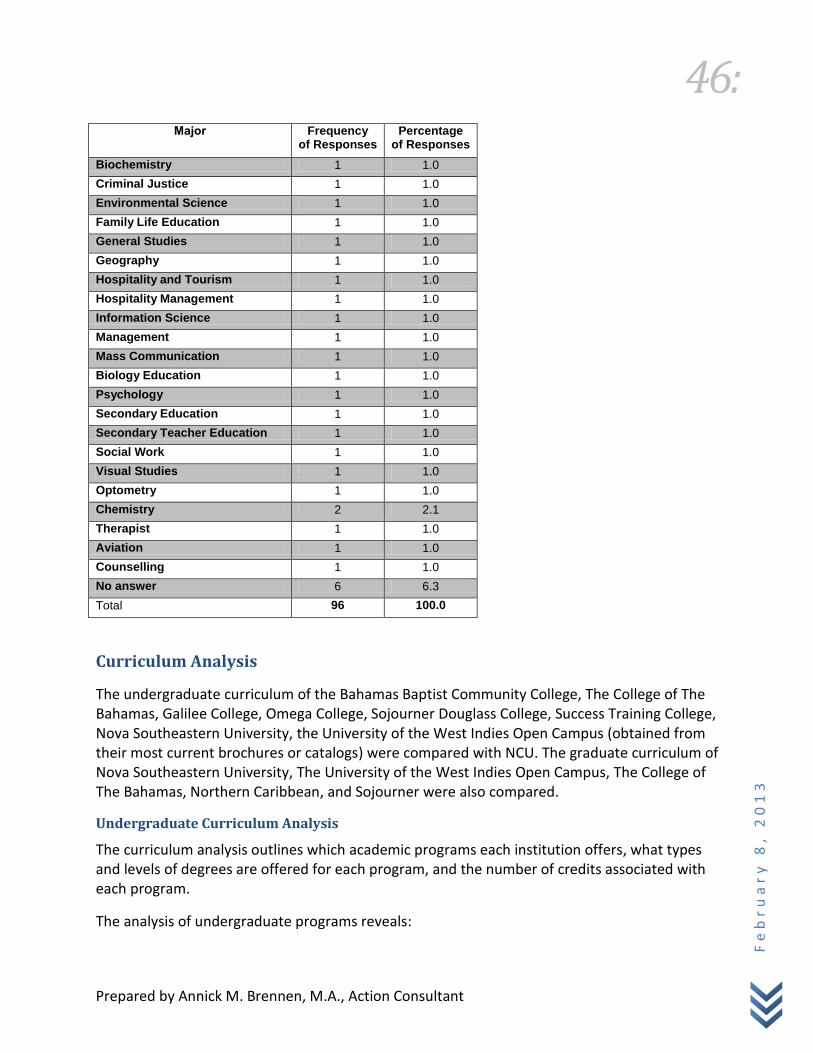
No answer 6 6.3
Total 96 100.0
Curriculum Analysis
The undergraduate curriculum of the Bahamas Baptist Community College, The College of The Bahamas, Galilee College, Omega College, Sojourner Douglass College, Success Training College, Nova Southeastern University, the University of the West Indies Open Campus (obtained from their most current brochures or catalogs) were compared with NCU. The graduate curriculum of Nova Southeastern University, The University of the West Indies Open Campus, The College of The Bahamas, Northern Caribbean, and Sojourner were also compared.
Undergraduate Curriculum Analysis
The curriculum analysis outlines which academic programs each institution offers, what types and levels of degrees are offered for each program, and the number of credits associated with each program.
The analysis of undergraduate programs reveals:

47:
Prepared by Annick M. Brennen, M.A., Action Consultant
Fe
br
ua
ry
8,
20
13
1. NCU offers mostly Bachelor of Science degrees with a heavier credit load, while Bahamian tertiary institutions offer mostly Bachelor of Art degrees with lighter credit loads.
2. NCU academic offerings are as varied as those of COB. 3. NCU offers fewer Associate degrees than all of the tertiary institutions combined. 4. COB offers more Education degrees; however, within its fewer degrees NCU offers
approximately the same number of Education emphases as COB. 5. The Bahamas Baptist Community College offers associate degrees in natural, applied,
and social sciences; a plethora of certificates, diplomas, and college preparatory programmes.
6. The curriculum of Galilee College includes associate and bachelor degrees in social and applied sciences.
7. Sojourner Douglass College offers mostly bachelor degrees in allied health, social, formal, and applied sciences.
8. Omega’s curriculum focuses on associate and bachelor degrees in applied sciences. 9. Success Training College offers only associate degrees and has found a niche in allied
health and applied sciences. 10. The College of The Bahamas and Northern Caribbean University offer degrees in all
academic disciplines. 11. Nova Southeastern University offers bachelors and masters in allied health and nursing
and applied sciences. 12. The University of the West Indies Open Campus offers both face-to-face and blended-
online programs. They offer bachelor of education degrees in education, bachelor of science degrees in banking and management studies.
Programs unique to Northern Caribbean University are:
Allied Health
AS and BS Dental Hygiene
BS Medical Technology
AS and BS Dietetics
Certificate Phlebotomy Technician
Business
BS Management Studies Entrepreneurship
BS Management Tourism and Hospitality
Hospitality and Tourism
BS Hospitality Management Golfing and Golf Facilities Management
BS Hospitality Management Resort & Spa Management
BS Hospitality Management Food and Beverage and Tourism

48:
Prepared by Annick M. Brennen, M.A., Action Consultant
Fe
br
ua
ry
8,
20
13
Behavioural, Environmental, and Social Sciences
BS Counseling
BS Guidance Counseling
BS Industrial & Organizational Counseling
BS Psychology
BS Applied Environmental Geography
AS and BS Criminal Justice
BS Environmental Science
AS Conflict Management and Resolution
Certificate Telephone Hotline Counseling
Diploma Crime and Security
English, Art, and Communication Studies
BA English Literature
BA English Writing
AS & BA Mass Communications (Options: TV, Radio, Journalism, Advertising, Public Relations)
BA Music
BA Music Education
BM Music Performance
BS Music
Mathematics and Engineering
AS Computer Systems Engineering
AS Electrical Engineering
BS Mathematics Actuarial Science
Religion and Theology
BA Religion with minor
BA Religion Pastoral Concentration
Certificate and AA Christian Stewardship
Certificate Bible Workers
A detail undergraduate academic program analysis by discipline is shown in the tables that follow.

49:
Prepared by Annick M. Brennen, M.A., Action Consultant
Fe
br
ua
ry
8,
20
13
Abbreviations used in the analysis include:
Degrees
AA Associate of Arts AAS Applied Associate of Science ABA Associate of Business Administration AS Associate of Science BA Bachelor of Arts
BBA Bachelor of Business Administration BE Bachelor of Education BIS Bachelor of Information System BM Bachelor of Music BS Bachelor of Science
Institutions
BBCC Bahamas Baptist Community College COB The College of The Bahamas Galilee Galilee College NCU Northern Caribbean University Nova Nova Southeastern University Omega Omega College Sojourner Sojourner Douglass College Success Success Training College UWI University of the West Indies Open Campus
50:
Prepared by Annick M. Brennen, M.A., Action Consultant
Fe
br
ua
ry
8,
20
13
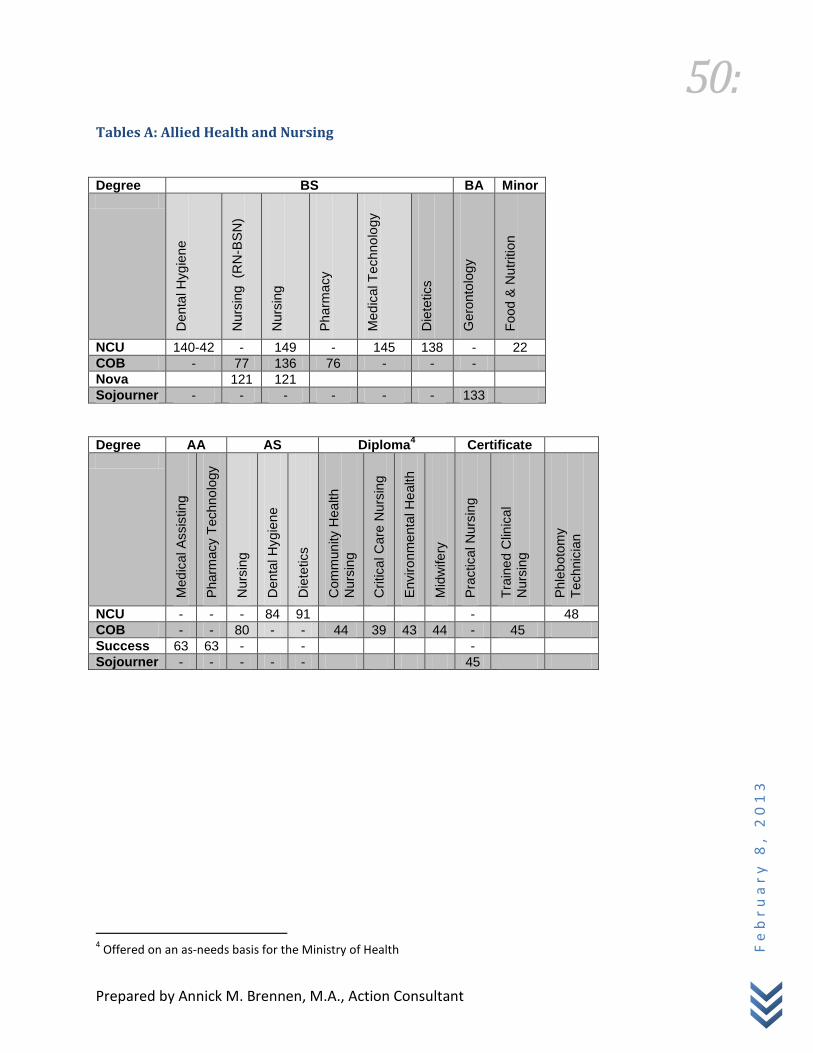
Tables A: Allied Health and Nursing
Degree BS BA Minor
Denta
l H
yg
ien
e
Nurs
ing
(RN
-BS
N)
Nurs
ing
Pharm
acy
Med
ical T
echno
logy
Die
tetics
Gero
nto
logy
Food &
Nu
tritio
n
NCU 140-42 - 149 - 145 138 - 22
COB - 77 136 76 - - -
Nova 121 121
Sojourner - - - - - - 133
Degree AA AS Diploma4 Certificate
Med
ical A
ssis
tin
g
Pharm
acy T
echno
logy
Nurs
ing
Denta
l H
yg
ien
e
Die
tetics
Com
mun
ity H
ea
lth
Nurs
ing
Critica
l C
are
Nurs
ing
Enviro
nm
enta
l H
ealth
Mid
wifery
Pra
ctica
l N
urs
ing
Tra
ine
d C
linic
al
Nurs
ing
Phle
boto
my
Technic
ian
NCU - - - 84 91 - 48
COB - - 80 - - 44 39 43 44 - 45
Success 63 63 - - -
Sojourner - - - - - 45
4 Offered on an as-needs basis for the Ministry of Health

51:
Prepared by Annick M. Brennen, M.A., Action Consultant
Fe
br
ua
ry
8,
20
13
Tables B: Business
Degree BA/BBA
Accounting
Adm
in O
ffic
e M
gt
Bankin
g &
Fin
ance
Bankin
g &
Fin
ance
Com
merc
ial B
ankin
g
Bankin
g &
Fin
ance
Private
Ba
nkin
g
Bankin
g &
Fin
ance
With a
Fore
ign L
ang
ua
ge
Busin
ess A
dm
in
Busin
ess In
fo S
\syste
m
Busin
ess M
gt
Busin
ess P
sycholo
gy
Econo
mic
s
Fin
ance
Mark
eting
NCU - - - - - - - - - - - -
COB 139 131 138 138 132 - - - - 139 139 136
Nova 120
Galilee - - 132 - - - 132 132 - 132 132 - -
Omega 120 - - - - - - - 120 - 120 120 -
Sojourner 150 - - - - - 133 - - - - - -
Degree BA/BBA
Mark
eting M
gt
OH
RM
/HR
Offic
e A
dm
in
Com
pute
r In
fo S
ys
Mgt In
fo S
yste
ms
Com
pute
r In
fo S
ys
App
licatio
n
Pro
gra
mm
ing
Com
pute
r In
fo S
ys
Netw
ork
Syste
ms
Econo
mic
s &
Fin
ance
Mana
ge
ment
Healthcare
Ad
min
NCU - - - - - - - - -
COB 133 - 136 127 130 139 136 -
Galilee 132 132 132 - - - - - -
Omega - 120 - - - - - - -
Sojourner - - - 133 - - - 133 133

52:
Prepared by Annick M. Brennen, M.A., Action Consultant
Fe
br
ua
ry
8,
20
13
Tables B: Business
Degree BS
Accounting
Busin
ess A
dm
in
Accounting
Busin
ess A
dm
in
Fin
ance
Mana
ge
ment
Mgt
Stu
die
s
Busin
ess E
d
Mgt
Stu
die
s
Entr
epre
ne
urs
hip
Mgt
Stu
die
s H
R
Mgt
Mgt
Stu
die
s
Mark
eting
Mgt
Stu
die
s
Tourism
&
Hospitalit
y
NCU - 144 154 147 141 144 114 150
COB - - - - - - -
Nova 120
Galilee 132 - - - - - - -
Omega - - - - - - - -
Degree AA/ABA AS
Accounting
Bankin
g
Bankin
g &
Fin
ance
Busin
ess
Busin
ess A
dm
in
Busin
ess Info
Syste
m
E-c
om
merc
e
Econo
mic
s
Health I
nfo
rmation M
gt
Mana
ge
ment
Mark
eting
Offic
e (S
ys )
Adm
in
OH
RM
/HR
Busin
ess A
dm
in
Offic
e T
ech &
Adm
in
Secre
tari
al S
cie
nce
NCU - - - - - - - - - - - - 77 82 -
COB 63 - - - 61 - - - - - - - - - -
BBCC 66 - - 66 - 66 - - - -
Galilee 66 66 - 66 - 66 66 66 66 66 66 - - 66
Omega 60 - - - - - - - 60 - - 60 - - -
Success 63 - 66 - 66 - - - 63 - - - 63 - - -

53:
Prepared by Annick M. Brennen, M.A., Action Consultant
Fe
br
ua
ry
8,
20
13
Tables B: Business
Degree BS Diploma
On
lin
e/B
len
ded
Bankin
g &
Fin
ance C
om
plia
nce
7 C
orp
ora
te G
overn
ance M
inor
Bankin
g &
Fin
ance L
aw
for
Bankin
g &
Fin
ance M
inor
Bankin
g &
Fin
ance L
end
ing
&
Mort
ga
ge U
nderw
riting M
inor
Bankin
g &
Fin
ance S
pecia
l
Accounting
Mana
ge
ment
Stu
die
s M
ajo
r
Mana
ge
ment
Stu
die
s
Econo
mic
s M
inor
Mana
ge
ment
Accou
nting
UWI 90 90 90 90 90 90 90 33
Degree Diploma Certificate Minor
Accounting
Busin
ess A
dm
inis
tration
Busin
ess A
dm
inis
tration
NCU 40
COB 36 31 24

54:
Prepared by Annick M. Brennen, M.A., Action Consultant
Fe
br
ua
ry
8,
20
13
Tables C: Hospitality and Tourism
Degree BS Minor
Hospitalit
y M
gt
Hospitalit
y M
gt
Golfin
g &
Go
lf F
acili
ties M
gt
Hospitalit
y M
gt
Resort
& S
pa M
gt
Hospitalit
y M
gt
Tra
vel &
Tourism
Mgt
Hospitalit
y M
g
Food &
Bevera
ge &
Tourism
Tourism
Mgt
Ecoto
uri
sm
Hospitalit
y M
gt
Tourism
Mgt
NCU - 168 168 155 155 -
COB 126 - - - - 127 18 21 21
Degree AS AAS AA Certificate
Hospitalit
y M
gt
Culin
ary
Art
s
Hospitalit
y O
pera
tio
ns
Nationa
l A
ppre
ntice
Cook
Tra
vel &
Tourism
Mgt
Culin
ary
Art
s
Food &
Bevera
ge M
gt
Hospitalit
y &
Tourism
Skill
s
Hospitalit
y M
gt: A
ccou
nting
Hospitalit
y M
gt: S
uperv
isio
n
Hospitalit
y M
gt T
ravel &
Tourism
NCU 116 - - - - - - - - -
COB - 70 74 78 - 9 33 8 30 30 30
Galilee - - - -
Omega - - - -
Success - - - 66

55:
Prepared by Annick M. Brennen, M.A., Action Consultant
Fe
br
ua
ry
8,
20
13
Tables D: Education
Degree BA BA/BS BE SECONDARY CERTIFICATION
Hum
an G
row
th &
Dev: E
arl
y C
hild
ho
od
Early C
hild
hood
Teacher
Educatio
n
Ele
me
nta
ry
Educatio
n
Prim
ary
Teacher
Educatio
n
Secon
dary
Teach
er
Educatio
n
Adm
in O
ffic
e M
gt
Art
-Mix
ed M
edia
Bio
logy/G
rl S
cie
nce
Busin
ess S
tudie
s
Chem
istr
y G
rl
Scie
nce
Cptr
Stu
die
s:
App
licatio
ns
Pro
gra
mm
ing
Cptr
Stu
die
s N
etw
ork
Syste
ms
NCU - 1355 - 144
6 148
7 - - 142 - - - -
COB - - - - - 131 131 136 133 130 133 133
Omega - - 124 - - - - - - - - -
Sojourner 135
Degree BE SECONDARY CERTIFICATION BE K-12 CERTIFICATION
Fam
ily &
Consu
mer
Scie
nces G
rl S
tud
ies
Fam
ily &
Consu
mer
Scie
nces T
ourism
&
Hospitalit
y
Fre
nch
His
tory
/Geogra
phy
Math
em
atics
Physic
s/G
rl S
cie
nce
Relig
ion
Spa
nis
h
Music
: C
om
positio
n
and T
ech
no
logy
Physic
al E
ducation
NCU - - - 109 - - - - 138 -
COB 124 125 130 130 129 133 130 130 137 130
Omega - - - - - - - - - -
Sojourner - - - - - - - - - -
5 Areas of Emphasis: Minimum 21 credits in Art, Computer Studies, English Language, French, Geography,
Guidance Counselling, History, Home Economics, Literacy Education, Mathematics, Music, Religious Education, Science (Biology), Social Studies, Social Work, Spanish 6 Same as above.
7 Students must choose two subject areas or disciplines in which to prepare for teaching: Accounting (double
option only), Art (minor only), Biology, Business Education (double option only), Business Studies, Chemistry Minor only) , Computer Studies, Counselling (minor only), English Language, French (minor only), Geography, History, Home Economics, Literacy Education (minor only), Literature, Mathematics, Music, Natural Science (double option), Office Mgt & Technology (major only) Religious Education, Social Studies, Social Work (minor only), Spanish

56:
Prepared by Annick M. Brennen, M.A., Action Consultant
Fe
br
ua
ry
8,
20
13
Tables D: Education
Degree BE BS
Early C
hild
hood
K-3
Prim
ary
Cert
ific
ation
Genera
l
Prim
ary
Cert
ific
ation
Early C
hild
hood
Prim
ary
Cert
ific
ation
Specia
l
Educatio
n
Child
Develo
pm
ent
NCU - - - -
COB 130 130 130 130
Nova 120
Degree Minor Certification AA Diploma Certificate
Secon
dary
Teach
er
Ed
ucation
Teacher
Cert
ific
ation
Early C
hild
hood E
ducation
Prim
ary
Education
Early C
hild
hood T
eacher
Educatio
n
Teachin
g b
y A
dvance
d
Pla
ce
me
nt w
ith J
BT
E
Secon
dary
Education
Adu
lt &
Work
forc
e E
d &
Tra
inin
g
Early C
hild
hood T
eacher
Educatio
n
Adu
lt &
Work
forc
e E
d &
Tra
inin
g
Pre
-school T
eachers
Auxili
ary
Cert
NCU
8 26 25 - - 102 98 - - 55 - -
COB - - - - 39 31 - 13 6
Nova 60
BBCC 70 73
Galilee 66 33 - - - 18 - -
Omega - -
Sojourner - -
Success 66 -
8 Holders of Diplomas/Certificates in Teacher Education may advance to the BA or BS. degree in accordance with
Advancement Programme for Primary Education Graduates (49 credits) or Advancement Programme for Secondary Education Diploma Graduates (37 credits).
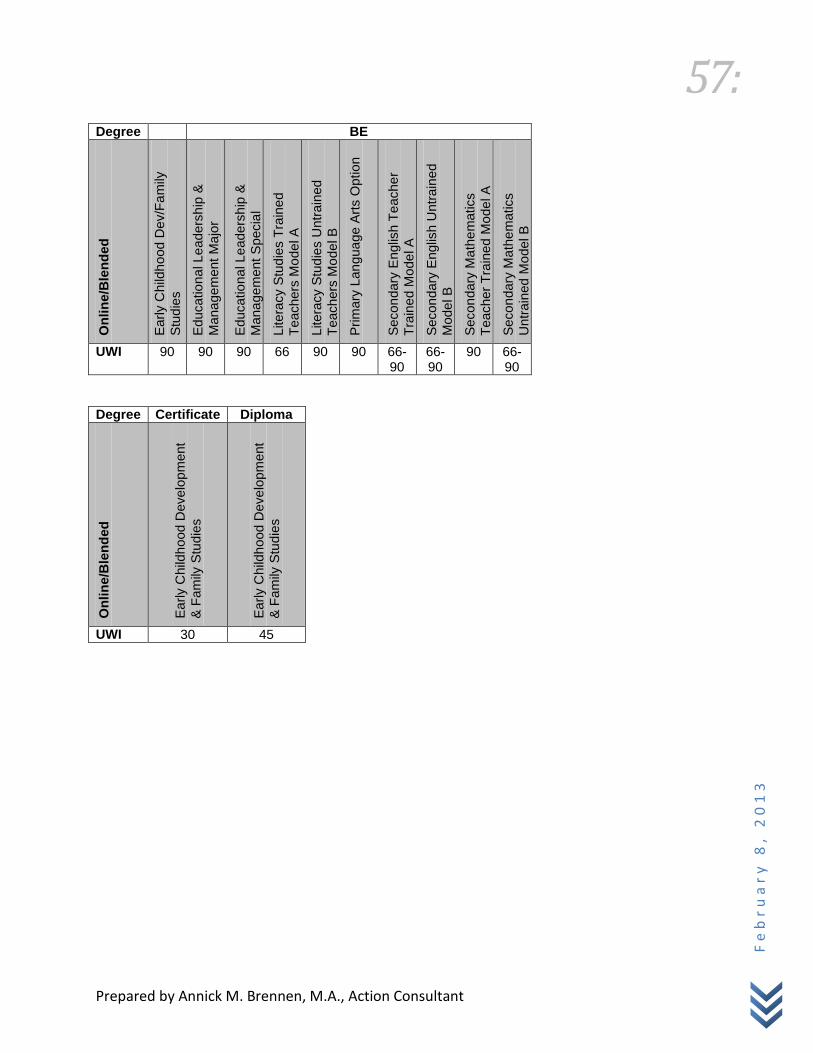
57:
Prepared by Annick M. Brennen, M.A., Action Consultant
Fe
br
ua
ry
8,
20
13
Degree BE
On
lin
e/B
len
ded
Early C
hild
hood D
ev/F
am
ily
Stu
die
s
Educatio
na
l Le
aders
hip
&
Mana
ge
ment
Ma
jor
Educatio
na
l Le
aders
hip
&
Mana
ge
ment
Specia
l
Litera
cy S
tud
ies T
rain
ed
Teachers
Mo
de
l A
Litera
cy S
tud
ies U
ntr
ain
ed
Teachers
Mo
de
l B
Prim
ary
Lan
gua
ge A
rts O
ption
Seco
ndary
Englis
h T
eache
r
Tra
ine
d M
ode
l A
Secon
dary
Englis
h U
ntr
ain
ed
Mode
l B
Secon
dary
Ma
the
matics
Teacher
Tra
ined
Mo
de
l A
Secon
dary
Ma
the
matics
Untr
ain
ed
Mo
del B
UWI 90 90 90 66 90 90 66-90
66-90
90 66-90
Degree Certificate Diploma
On
lin
e/B
len
ded
Early C
hild
hood D
eve
lop
ment
& F
am
ily S
tudie
s
Early C
hild
hood D
eve
lop
ment
& F
am
ily S
tudie
s
UWI 30 45

58:
Prepared by Annick M. Brennen, M.A., Action Consultant
Fe
br
ua
ry
8,
20
13
Tables E: Behavioral, Environmental, and Social Sciences
Degree BS BA
Counse
ling
Guid
ance C
ounse
ling
Industr
ial &
Org
aniz
atio
nal
Counse
ling
Psycholo
gy
Socia
l W
ork
Add
ictio
ns &
Su
bsta
nce
Abuse C
ou
nselli
ng
Hum
an G
row
th &
Dev
Psycholo
gy &
Counse
ling
Psycholo
gy
Socia
l W
ork
Socio
logy
Pub
lic A
dm
inis
tration
NCU 138 143 142 1419 138 - - - - - -
COB 121 125 133
Sojourner - - - - - 133 133 133 133 133
Degree BS BA
App
lied E
nviro
nm
enta
l G
eo
gra
phy
Crim
ina
l Justice
10
Enviro
nm
enta
l S
cie
nce
Sm
all
Isla
nd S
usta
ina
bili
ty:
Enviro
nm
enta
l &
Ecosyste
ms M
gt
Crim
ina
l Justice
Com
mun
ity D
eve
lop
men
t
His
tory
Geogra
phy E
ducation
11
Polit
ical C
am
paig
n M
gt
Sm
all
I &
Susta
inab
ility
Ecoto
uri
sm
& S
usta
inab
le D
evelo
pm
ent
Sm
all
Isla
nd S
usta
ina
bili
ty:
Polic
y
Stu
die
s
Urb
an P
lann
ing &
Com
mun
ity
Develo
pm
ent
NCU 132 128 135 - - 142 109 - - - -
COB - - 126 - - 124 - - 127 124 -
Sojourner - - 133 133 - - 133 133
9 Minor required.
10 Choice of concentrations: Corrections and Rehabilitation, Law Enforcement, Forensic Science, Law, Psychology,
Social Work, Sociology/Criminology, Media and Communication, Guidance Counselling, Information Technology, Teacher Education 11
Minor required.

59:
Prepared by Annick M. Brennen, M.A., Action Consultant
Fe
br
ua
ry
8,
20
13
Tables E: Behavioral, Environmental, and Social Sciences
Degree AS AA
Conflic
t M
gt
&
Resolu
tio
n
Crim
ina
l Justice
Fam
ily L
ife E
duca
tio
n
Geogra
phy
Socia
l W
ork
Counse
lling
Psycholo
gy
Psycholo
gy/S
ocio
logy
Law
& C
rim
inal Justice
Pub
lic A
dm
inis
tration
Socio
logy
Relig
ious S
tud
ies
NCU 79 72 70 65 78 - - - - - - -
COB - - 61 - - - - - 66 - 61 61
BBCC - - - - - - 63 65 62 65 - -
Galilee - - - - - 66 66 - - 66 - -
Degree AS Minor
Agri
busin
ess
Agricu
lture
Div
ers
ity S
tud
ies
His
tory
Conflic
t A
na
lysis
, M
gt
& R
eso
lutio
n
Fam
ily L
ife E
duca
tio
n
Guid
ance C
ounse
ling
Psycholo
gy
Socia
l W
ork
Geogra
phy
Law
Law
& P
olit
ica
l S
c
Socio
logy
Polit
ical S
c &
Gvt
NCU - - 24 26 26 29 25 28 22 24 21 30 21
COB 66 68 24 18
Degree Certificate Diploma
Fam
ily L
ife E
duca
tio
n
Tele
pho
ne H
otlin
e
Counse
ling
Counse
lling
Psycholo
gy
Pub
lic A
dm
inis
tration
Polit
ical C
am
paig
n
Mgt
Crim
e &
Securi
ty
Counse
lling
Psycholo
gy
Pub
ic A
dm
inis
tratio
n
NCU 41 32 - - - - 40 -
COB - - - - - - - --
Galilee - - 18 18
18 - 33 33 33
Sojourner 18

60:
Prepared by Annick M. Brennen, M.A., Action Consultant
Fe
br
ua
ry
8,
20
13
Tables F: English, Art, and Communication Studies
Degree BA BM BS
Eng
lish
Eng
lish:
Litera
ture
Eng
lish:
Wri
ting
Eng
lish:
Education
Mass C
om
mun
ication
12
Music
Music
Education
Med
ia J
ourn
alis
m
Spa
nis
h/S
panis
h
Stu
die
s
Spa
nis
h E
ducation
Music
in P
erf
orm
ance
Music
NCU 121 134 130 141 149-151 131 138 149 106 131 135 128
COB 121 - - - - - - 120 121 130 - -
Degree AS AA Minor
Mass C
om
mun
ication
Art
Com
mun
ications
Fre
nch
Journ
alis
m
Music
Spa
nis
h
Vis
ua
l A
rt
Bah
am
ian &
Carib
bea
n
Litera
ture
Film
& D
ram
a S
tudie
s
Fre
nch
Music
Spa
nis
h
E-M
inis
trie
s
Ste
el P
an
Churc
h M
usic
Art
NCU13
75 63 69 72 28 22 22 30
COB 66 61 66 - 21 21 24 24 24
Galilee 66 66
Certificate Proficiency Regular Diploma
Advance
d F
rench
Advance
d S
pan
ish
Inte
rmedia
te F
rench
Inte
rmedia
te S
pan
ish
Art
Com
mun
ications
Music
Journ
alis
m
Com
mun
ications
Journ
alis
m
NCU - - - - - - - 18 - 33
COB 12 12 18 18 14 14 - - -
Galilee - - - - - 18 - - 33 -
12
Options: TV, Radio, Journalism, Advertising, Public Relations 13
NCU offers English as a Second-Language in six levels (Beginning I to Advanced II) to foreign students

61:
Prepared by Annick M. Brennen, M.A., Action Consultant
Fe
br
ua
ry
8,
20
13
Tables G: Biology and Chemistry, Computer and Information Sciences
Degree BS. BIS Minor
Bio
logy
Bio
logy E
ducation
Bio
ch
em
istr
y
Chem
istr
y
Bio
logy M
inor
Chem
istr
y
Com
pute
r S
cie
nce:
Pro
gra
mm
ing
Com
pute
r S
cie
nce:
Com
mun
ications
Com
pute
r S
cie
nce:
Security
Com
pute
r In
form
ation
Scie
nce
with M
inor
Com
pute
r In
form
ation
Scie
nce
Busin
ess
Com
pute
r In
form
ation
Scie
nce
: S
ecurity
Info
rmation S
yste
ms
Adm
inis
tration
Bio
logy
Chem
istr
y
NCU 130 142 138 131 128 132 131 132 138 138 138 36 32
COB 12814
Sojourner 133
Degree AS AA Certificate
Bio
logy
Chem
istr
y
Com
pute
r In
form
ation S
cie
nce
Bio
logy
Bio
logy w
ith C
hem
istr
y
Com
pute
r O
pera
tions
Com
pute
r P
rogra
mm
ing
Com
pute
r In
form
ation S
yste
ms
Netw
ork
Syste
ms A
dm
inis
tratio
n
Netw
ork
Syste
m S
ecurity
Com
pute
r G
rap
hic
s T
echn
olo
gy
Com
pute
r S
cie
nce
Com
pute
r In
form
ation S
yste
m
Com
pute
r O
pera
tions
Com
pute
r P
rogra
mm
ing
NCU 72 74 71 - - - - - - - - 5 - - -
COB - 64 67 - - - - - - - - - - - -
BBCC - - - 70 68 - - - - - - - - - -
Galilee - - - - - 66 66 - - - - - 18 18 18
Success - - - - - - - 66 69 72 66 - - - -
14
Minor: Chemistry

62:
Prepared by Annick M. Brennen, M.A., Action Consultant
Fe
br
ua
ry
8,
20
13
Tables G: Biology and Chemistry, Computer and Information Sciences
Degree Diploma
Com
pute
r In
form
ation S
yste
m
Com
pute
r O
pera
tions
Com
pute
r P
rogra
mm
ing
NCU - - -
COB - - -
Galilee 33 33 33
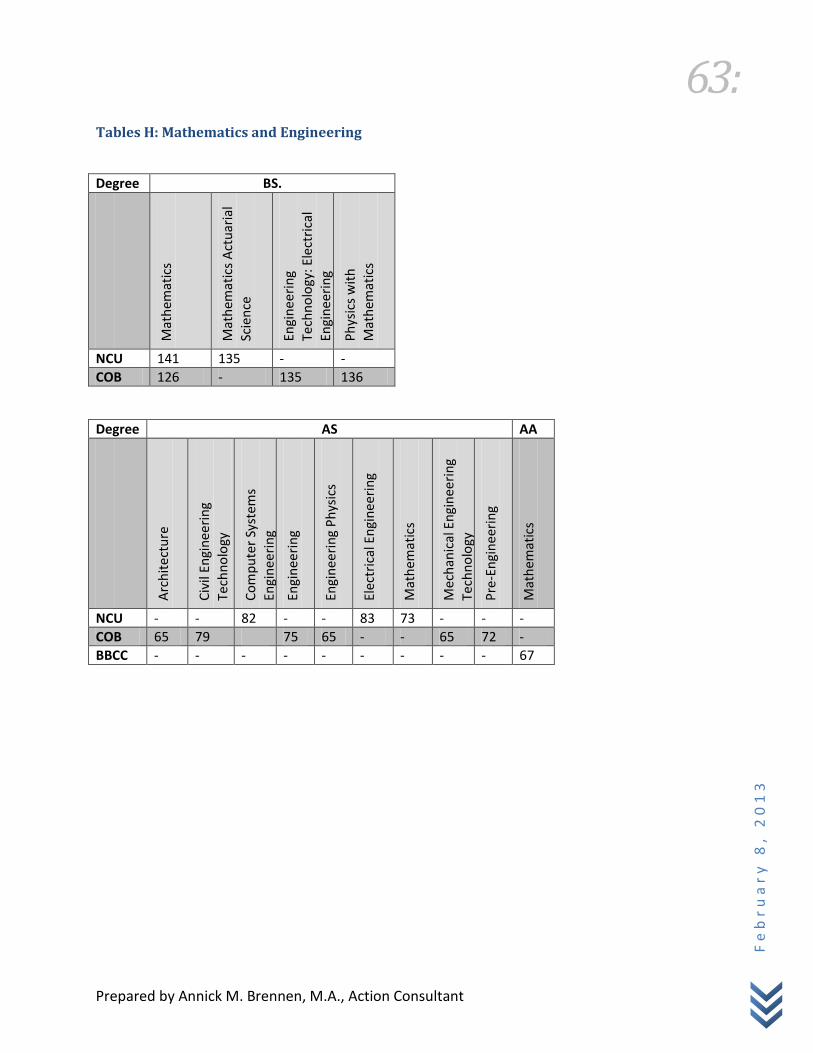
63:
Prepared by Annick M. Brennen, M.A., Action Consultant
Fe
br
ua
ry
8,
20
13
Tables H: Mathematics and Engineering
Degree BS.
Mat
hem
atic
s
Mat
hem
atic
s A
ctu
aria
l Sc
ien
ce
Engi
nee
rin
g
Tech
no
logy
: Ele
ctri
cal
Engi
nee
rin
g Te
chn
olo
gy
Ph
ysic
s w
ith
M
ath
emat
ics
NCU 141 135 - -
COB 126 - 135 136
Degree AS AA
Arc
hit
ect
ure
Civ
il En
gin
eeri
ng
Tech
no
logy
Co
mp
ute
r Sy
stem
s
Engi
nee
rin
g
Engi
nee
rin
g
Engi
nee
rin
g P
hys
ics
Elec
tric
al E
ngi
nee
rin
g
Mat
hem
atic
s
Mec
han
ical
En
gin
eeri
ng
Tech
no
logy
Pre
-En
gin
eeri
ng
Mat
hem
atic
s
NCU - - 82 - - 83 73 - - -
COB 65 79 75 65 - - 65 72 -
BBCC - - - - - - - - - 67

64:
Prepared by Annick M. Brennen, M.A., Action Consultant
Fe
br
ua
ry
8,
20
13
Table I: Technology
Degree BS Certificates
Bio
tech
no
logy
Pre
-Tec
hn
olo
gy
Sin
gle
-Ph
ase
Elec
tric
al
Thre
e-P
has
e El
ectr
ical
NCU - - - -
COB 1 Yes Yes
Sojourner 133 - - -
Table J: Religion and Theology
Degree BA AA Certificate
Rel
igio
n w
ith
Min
or
Rel
igio
n P
asto
ral
Co
nce
ntr
atio
n
Rel
igio
n
Ch
rist
ian
Sal
esm
ansh
ip
Bib
le W
ork
er
Ch
rist
ian
Sal
esm
ansh
ip
NCU 135 128 75 64 32 31
COB - - 61 - - -
Sources:
Bahamas Baptist Community College brochures collected from their office September 20, 2012.
College of The Bahamas Academic Catalogue 2011-2012 retrieved from http://www.cob.edu.bs/DOCS/Catalogue1112.pdf.
Galilee College academic programs retrieved September 9, 2012 from http://galilee.0catch.com/gc/academic.html

65:
Prepared by Annick M. Brennen, M.A., Action Consultant
Fe
br
ua
ry
8,
20
13
Northern Caribbean University Undergraduate Bulletin 2010-2012 retrieved September 9, 2012 from http://www.ncu.edu.jm/Portals/0/Documents/Academics/docs/Undergraduate_Bulletin_2010-2012.pdf
Nova Southeastern academic programs retrieved September 19, 2012 from http://www.fischlerschool.nova.edu/prospective-students/the-bahamas
Omega College 2010 brochures retrieved September 9, 2012 from http://www.omegacollegebahamas.com/
Sojourner College academic programs retrieved September 20, 2012 from http://www.sdc.edu/admissions/undergraduate/degree-programs-ugrad.asp
Success Training College brochures collected from their Office September 20, 2012
University of the West Indies Open Campus programs retrieved February 1, 2013 from http://www.open.uwi.edu/undergraduate/programmes
Graduate Curriculum Analysis
The graduate curriculum analysis focuses on the academic programs of Northern Caribbean
University, Nova Southeastern University, The College of The Bahamas, and Sojourner Douglass
College, and the University of the West Indies Open Campus. Northern Caribbean University
and Nova Southeastern University are strong competitors offering graduate programs in
Education. While Nova Southeastern University offers Doctors of Education, Northern
Caribbean University offers Doctor of Philosophy degrees in Education. However, a potential
weakness for Northern Caribbean University could be the unavailability of Doctors in Education
degrees. Northern Caribbean University offers a wider of array of graduate programs in several
disciplines. The College of The Bahamas offers graduate degrees in conjunction with other
universities. The University of the West Indies has recently begun graduate programs online in
what they call an Open Campus. Their programs are unique.
The graduate programs unique to Northern Caribbean University are:
Allied Health
MPH Medical Epidemiology
MPH Research Epidemiology
MPH Public Health Nutrition
Business
MBA Entrepreneurship & Marketing
MBA General Management

66:
Prepared by Annick M. Brennen, M.A., Action Consultant
Fe
br
ua
ry
8,
20
13
Education
MA & PhD Curriculum and Instruction
MA Reading and Language Arts Instruction
MA Instructional Systems Technology
MAT Teaching: Elementary
MAT Teaching: Secondary
PDE Education
PhD Educational Administration
PhD Leadership
Natural and Applied Sciences
MSc Microbiology
MSc Molecular Biology
MSES Non-Thesis Option and Thesis Option
Behavioural & Social Sciences
MSc Educational Psychology
MSc Marriage & Family Therapy
MA School Counseling
Religion
MA New Testament
MA Old Testament
MA Theological Studies
MMin Ministry
MMin Evangelism & Church Growth
DMin Global Mission Leadership
DMin Leadership
DMin Pastoral Ministry
DMin Youth Ministry
A detail graduate academic program analysis by discipline is shown in the tables that follow. Abbreviations used in the analysis include:
Degrees
DMin Doctor of Ministry Ed.D. Doctor of Education MA Master of Arts MAT Master of Arts in Teaching

67:
Prepared by Annick M. Brennen, M.A., Action Consultant
Fe
br
ua
ry
8,
20
13
MBA Master of Business Administration M.Ed. Master of Education MLIS Master of Science in Library and Information Sciences MMin Master of Ministry MPH Master of Public Health MSc Master o Science MSES Master of Science in Environmental Science MSIS Master of Science in Information Systems PDE Postgraduate Diploma in Education PhD Doctor of Philosophy
Institutions
COB The College of The Bahamas NCU Northern Caribbean University Nova Nova Southeastern University Sojourner Sojourner Douglass College UWI University of the West Indies Open Campus
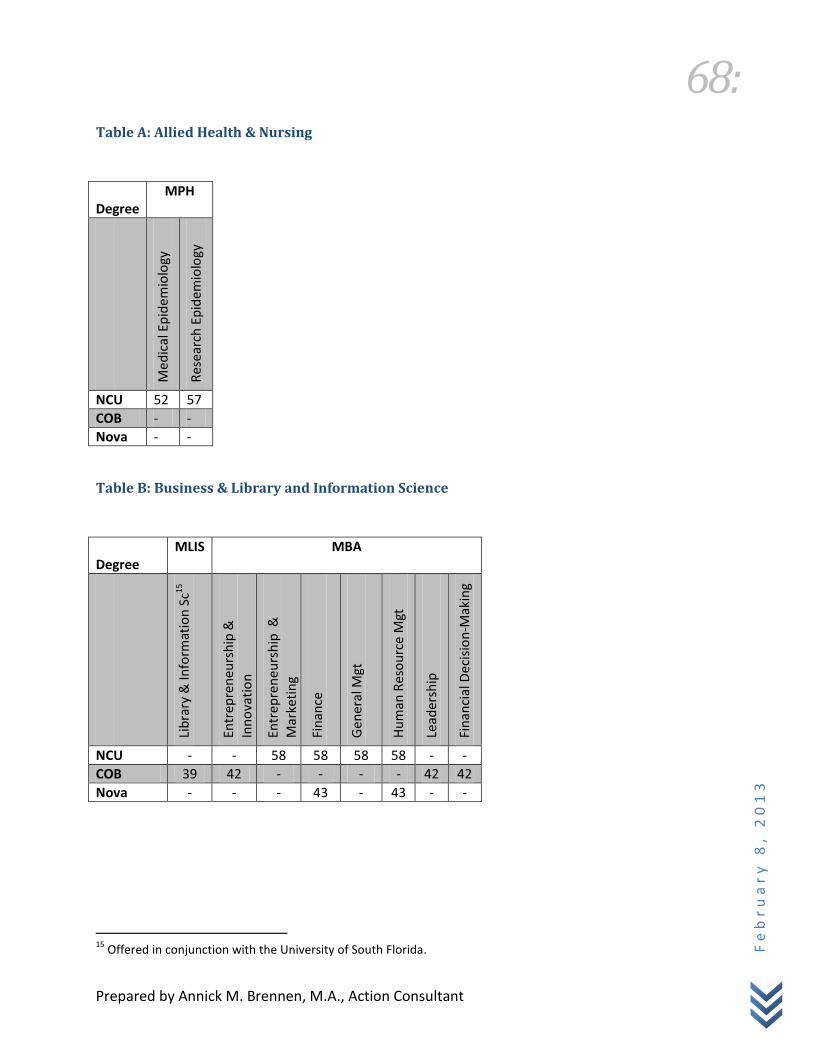
68:
Prepared by Annick M. Brennen, M.A., Action Consultant
Fe
br
ua
ry
8,
20
13
Table A: Allied Health & Nursing
Degree
MPH
Med
ical
Ep
idem
iolo
gy
Res
ear
ch E
pid
emio
logy
NCU 52 57
COB - -
Nova - -
Table B: Business & Library and Information Science
Degree
MLIS MBA
Lib
rary
& In
form
atio
n S
c15
Entr
epre
neu
rsh
ip &
Inn
ova
tio
n
Entr
epre
neu
rsh
ip &
M
arke
tin
g
Fin
ance
Gen
eral
Mgt
Hu
man
Re
sou
rce
Mgt
Lead
ersh
ip
Fin
anci
al D
ecis
ion
-Mak
ing
NCU - - 58 58 58 58 - -
COB 39 42 - - - - 42 42
Nova - - - 43 - 43 - -
15
Offered in conjunction with the University of South Florida.

69:
Prepared by Annick M. Brennen, M.A., Action Consultant
Fe
br
ua
ry
8,
20
13
Tables C: Education
Degree
M.Ed. MA MAT MSc. PDE PhD
Spec
ial E
du
cati
on
Sch
oo
l Co
un
selin
g
Cu
rric
ulu
m &
Inst
ruct
ion
Edu
cati
on
al A
dm
inis
trat
ion
Rea
din
g &
Lan
guag
e A
rts
Inst
ruct
ion
Inst
ruct
ion
al S
yste
ms
Tec
hn
olo
gy
Teac
hin
g &
Lea
rnin
g w
ith
Tec
hn
olo
gy
Teac
hin
g: E
lem
enta
ry
Teac
hin
g: S
eco
nd
ary
Elem
enta
ry E
du
cati
on
Earl
y C
hild
ho
od
& E
lem
enta
ry T
each
ing
Edu
cati
on
Cu
rric
ulu
m &
Inst
ruct
ion
Edu
cati
on
al A
dm
inis
trat
ion
Lead
ersh
ip
NCU - - 36 36 38 38 - 38 38 - - 22 96 96 96
COB16 32 49 - - - - 30 - 38-47
30-34
- - - -
Nova - - - - - - 36 - - - - - - - -
Degree
MS. Ed.D Ed.S.
Inte
rdis
cip
linar
y A
rts
Edu
cati
on
al L
ead
ersh
ip
Hea
lth
Car
e Ed
uca
tio
n
Hig
her
Ed
uca
tio
n
Lead
ersh
ip
Hu
man
Ser
vice
s A
dm
inis
trat
ion
Inst
ruct
ion
al L
ead
ersh
ip
Inst
ruct
ion
al T
ech
no
logy
&
Dis
tan
ce E
du
cati
on
Nu
rsin
g Ed
uca
tio
n
Org
aniz
atio
nal
Lea
der
ship
Rea
din
g Ed
uca
tio
n
Spec
ial E
du
cati
on
Spee
ch-L
angu
age
Pat
ho
logy
Edu
cati
on
al S
pec
ialis
t17
NCU - - - - - - - - - - - - -
COB - - - - - - - - - - - - -
Nova 36 69 69 69 69 69 69 69 69 69 69 69 36
16
COB master’s degrees are offered in conjunction with these Universities: Ashford, Kent State, Wheelock, and South Florida. 17
Areas of specializations: 14 areas.
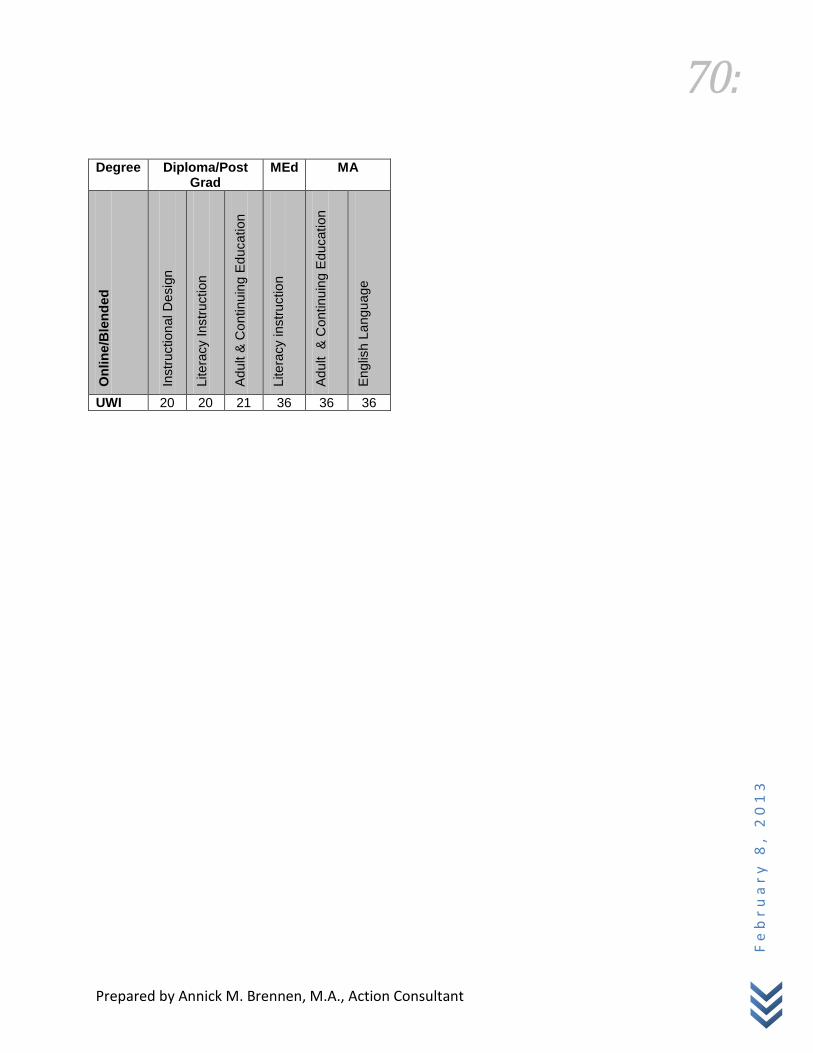
70:
Prepared by Annick M. Brennen, M.A., Action Consultant
Fe
br
ua
ry
8,
20
13
Degree Diploma/Post Grad
MEd MA
On
lin
e/B
len
ded
Instr
uction
al D
esig
n
Litera
cy Instr
uction
Adu
lt &
Co
ntinu
ing E
ducation
Litera
cy instr
uctio
n
Adu
lt
& C
ontinu
ing
Education
Eng
lish L
angu
age
UWI 20 20 21 36 36 36

71:
Prepared by Annick M. Brennen, M.A., Action Consultant
Fe
br
ua
ry
8,
20
13
Table D: Natural and Applied Sciences
Table E: Humanities, Behavioural & Social Sciences
Degree
MSc MA
Edu
cati
on
al P
sych
olo
gy
Mar
riag
e &
Fam
ily T
her
apy
Sch
oo
l C
ou
nse
llin
g
Po
litic
al C
amp
aign
Mgt
NCU 48-51 48-51 48-51 -
COB
Nova - - - -
Sojourner - - - 39
18
Areas of research: Environmental Chemistry, Sustainable Development and Management, Environmental Management System, Natural Resource Management, Environmental Policies
Degree
MSc MSES
Mic
rob
iolo
gy
Mo
lecu
lar
Bio
logy
No
n-T
hes
is O
pti
on
Thes
is O
pti
on
18
NCU 36 36 43 36
COB - - - -
Nova - - - -
Sojourner - - - -

72:
Prepared by Annick M. Brennen, M.A., Action Consultant
Fe
br
ua
ry
8,
20
13
Table F: Religion
Degree
MA MMin DMin
New
Te
stam
ent
Old
Tes
tam
ent
Theo
logi
cal S
tud
ies
Min
istr
y
Evan
gelis
m &
Ch
urc
h
Gro
wth
Glo
bal
Mis
sio
n L
ead
ersh
ip
Lead
ersh
ip
Pas
tora
l Min
istr
y
You
th M
inis
try
NCU 36 36 36 48 36 36 36 36 36
COB - - - - - - - - -
Nova - - - - - - - - -
Sojourner - - - - - - - - -

73:
Prepared by Annick M. Brennen, M.A., Action Consultant
Fe
br
ua
ry
8,
20
13
Labor Market
The third source of information for a potential curriculum was gathered from the labor market. One hundred and sixty-eight (168) job postings from the Nassau Guardian, the Tribune and employment web sites for the period 3/17 2012 to 10/26/2012 were analyzed. They show that (1) the business field is the most advertised, and (2) qualifications in business, business administration, and business management rank first as qualifications wanted in business fields, followed by accounting and finance. Thirty percent of the job postings advertised stipulates that potential candidates should possess bachelor degrees to fill vacant positions.
The summary of the job analysis is shown in Table 16.
Table 16: Job Analysis Summary
Degree/Qualifications Required Frequency %
No stipulation 78 42%
Bachelor 55 30%
Master 9 5%
Bachelor & Certification 8 4%
Associate or Bachelor 8 4%
Associate 7 4%
Certificate 6 3%
Certification 3 2%
Bachelor or Master 3 2%
Master or Higher 2 1%
Diploma 1 1%
International Diploma 1 1%
Certificate or Bachelor 1 1%
Bachelor or equivalent vocational training
1 1%
Doctorate 1 1%
Total 184
Field Frequency %
Business Adm/Business/Business Mgt
27 16%
Accounting 24 14%
Finance 10 6%
Culinary 9 5%
Hospitality Food & Beverage, Restaurant
7 4%
Information Technology 7 4%
Law/Law Enforcement 6 4%
Computer Information Systems/Science
6 4%
Hotel Mgt 5 3%
Engineering 5 3%

74:
Prepared by Annick M. Brennen, M.A., Action Consultant
Fe
br
ua
ry
8,
20
13
Degree/Qualifications Required Frequency %
Banking 4 2%
Educational Administration 3 2%
Marketing 3 2%
Human Resources Management 3 2%
Computer Literacy 3 2%
Journalism/newspaper publication
3 2%
Air Conditioning 2 1%
Biology 2 1%
Project Management 2 1%
Economics 2 1%
Bookkeeping 2 1%
Graphic Design 2 1%
Trust/Fiduciary 2 1%
Office Administration 2 1%
Insurance 2 1%
Aquaculture 1 1%
Marine Science 1 1%
Zoology 1 1%
Communication/English 1 1%
Database Management 1 1%
Early Childhood Education 1 1%
Phlebotomy 1 1%
Electrical Engineering 1 1%
Environmental Science 1 1%
Event Planning 1 1%
Massage Therapist/Spa 1 1%
Marine biology 1 1%
Medicine 1 1%
Library Science 1 1%
Pharmacy 1 1%
Quantity Surveying 1 1%
Public Health Administration 1 1%
Electronics 1 1%
Youth Development 1 1%
Special Education 1 1%
Family Therapy 1 1%
Nursing 1 1%
Automotive Engineering 1 1%
Diving 1 1%
International Policy 1 1%

75:
Prepared by Annick M. Brennen, M.A., Action Consultant
Fe
br
ua
ry
8,
20
13
Degree/Qualifications Required Frequency %
Total 168
Source: The Nassau Guardian, The Tribune, Atlantis Employment Web Site
Bahamian Students’ Preferred Programs of Study
Table 17 shows the programs from which students of the College of The Bahamas, The Bahamas Baptist Community College, and Success Training College graduated from 2009 to 2011. Education, business, culinary and hospitality management are the top three programs from which Bahamian students graduate locally.
Table 17: Graduates by Programme New Providence
Disciplines COB 2010/11
COB 2011/12
Success 2009/10
BBCC 2010/11
Education 140 145 8
Business 120 88 47 20
Natural sciences and technology 54 36 6 5
Culinary and hospitality management
40 67
Social sciences 38 62 4
Chemistry, environmental and life sciences 38
Nursing and allied health professions
27 50
Communication and creative arts 22 22
English studies 1 4
Professions and applied sciences 13
Arts and science 7
Source: The Department of Statistics and The College of the Bahamas Fact Sheet
Table 18 shows the preferred fields of study of Bahamian students enroled in colleges and universities in the United States for the school year 2010-11. Business management and engineering rank first and second, respectively.

76:
Prepared by Annick M. Brennen, M.A., Action Consultant
Fe
br
ua
ry
8,
20
13
Table 18: Preferred Fields of Study of International Students 2010-11
Field of Study Frequency % of Total
Business Management 370 21.5%
Engineering 322 18.7%
Other Fields of Study 181 10.5%
Math and Computer Science 153 8.9%
Physical Life and Sciences 151 8.8%
Social Sciences 151 8.8%
Fine and Applied Arts 88 5.1%
Health Professions 77 4.5%
Intensive English Language 77 4.5%
Undeclared 48 2.8%
Education 40 2.3%
Humanities 38 2.2%
Agriculture 24 1.4%
Source: http://www.iie.org/Research-and-Publications/Open-Doors/Data/International-Students/All-Places-of-Origin/Institute of International Education
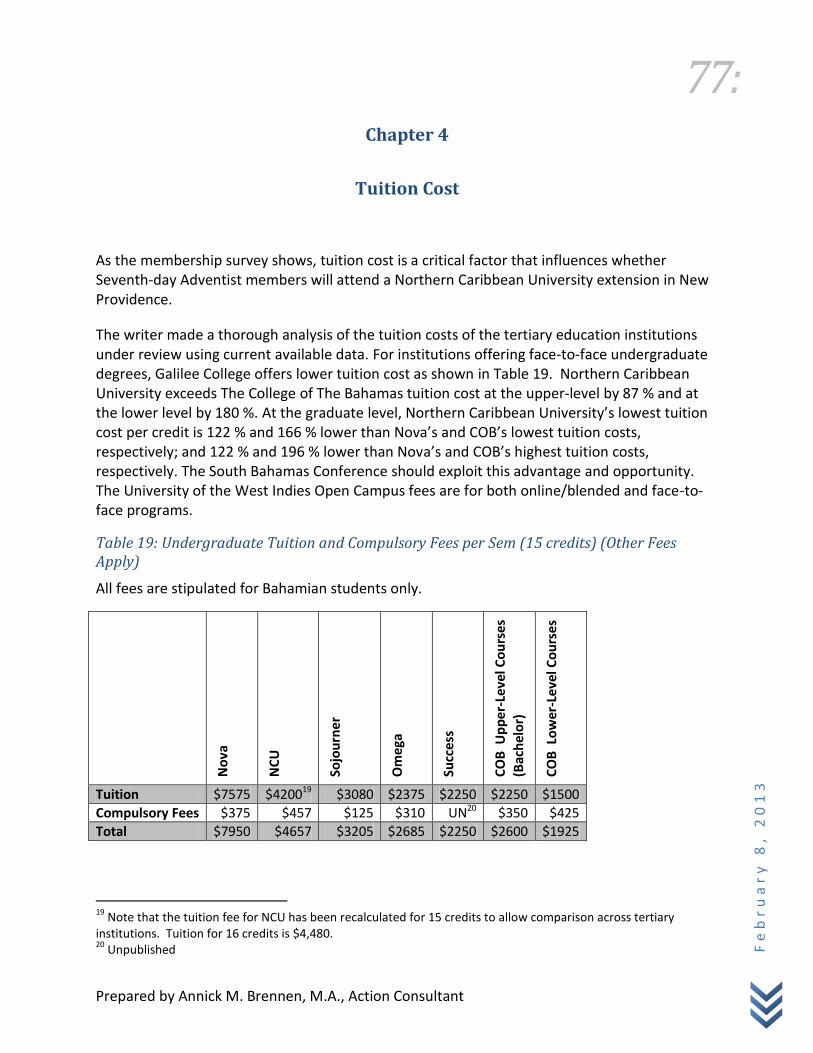
77:
Prepared by Annick M. Brennen, M.A., Action Consultant
Fe
br
ua
ry
8,
20
13
Chapter 4
Tuition Cost
As the membership survey shows, tuition cost is a critical factor that influences whether Seventh-day Adventist members will attend a Northern Caribbean University extension in New Providence.
The writer made a thorough analysis of the tuition costs of the tertiary education institutions under review using current available data. For institutions offering face-to-face undergraduate degrees, Galilee College offers lower tuition cost as shown in Table 19. Northern Caribbean University exceeds The College of The Bahamas tuition cost at the upper-level by 87 % and at the lower level by 180 %. At the graduate level, Northern Caribbean University’s lowest tuition cost per credit is 122 % and 166 % lower than Nova’s and COB’s lowest tuition costs, respectively; and 122 % and 196 % lower than Nova’s and COB’s highest tuition costs, respectively. The South Bahamas Conference should exploit this advantage and opportunity. The University of the West Indies Open Campus fees are for both online/blended and face-to-face programs.
Table 19: Undergraduate Tuition and Compulsory Fees per Sem (15 credits) (Other Fees Apply)
All fees are stipulated for Bahamian students only.
No
va
NC
U
Sojo
urn
er
Om
ega
Succ
ess
CO
B U
pp
er-L
eve
l Co
urs
es
(Bac
hel
or)
CO
B L
ow
er-L
eve
l Co
urs
es
Tuition $7575 $420019 $3080 $2375 $2250 $2250 $1500
Compulsory Fees $375 $457 $125 $310 UN20 $350 $425
Total $7950 $4657 $3205 $2685 $2250 $2600 $1925
19
Note that the tuition fee for NCU has been recalculated for 15 credits to allow comparison across tertiary institutions. Tuition for 16 credits is $4,480. 20
Unpublished

78:
Prepared by Annick M. Brennen, M.A., Action Consultant
Fe
br
ua
ry
8,
20
13
BB
CC
UW
I (O
nlin
e/B
len
ded
&
Face
-to
-Fac
e
UW
I (B
E Li
tera
cy &
Seco
nd
ary)
Gal
ilee
-BA
-Le
vel C
ou
rses
Gal
ilee
AA
–Le
vel C
ou
rses
Tuition $1800 $1,500 $1,530 $1725 $1275
Compulsory Fees $240 $25 $25 $165 $150
Total $2040 $1,525 $1,555 $1890 $1425
Sources:
Bahamas Baptist Community College fee structure retrieved September 20, 2012 from htpp://www.bbccbahamas-edu.com/new fee structure1
Galilee College fee downloaded from http://galilee.0catch.com/gc/academic.html, retrieved September 20, 2012.
Northern Caribbean University Fee Schedule August 2012 to July 2013, retrieved October 3, 2012 from http://www.ncu.edu.jm/Portals/0/Documents/Admissions/fsheet2012-2013.pdf
Nova Southeastern University fees retrieved from http://fischlerschool.nov.edu/current-students/academic-calendar, October 3, 2012
Omega program brochures retrieved from http://www.omegacollegebahamas.com, September 20, 2012.
Sojourner Douglass College fees retrieved from http://sdc.edu/admissions/ tuition.asp#Bahamas, September 20, 2012
Success Training College fees retrieved from http://www.successtrainingcollege.net/ Accreditation.html, September 20, 2012.
The College of The Bahamas fees retrieved from http://www.cob.edu.bs/Admission/ Financial.php, October 3, 2012.
University of the West Indies Open Campus fees retrieved from http://www.open.uwi.edu/undergraduate/tuition-fees, February 1, 2013.

79:
Prepared by Annick M. Brennen, M.A., Action Consultant
Fe
br
ua
ry
8,
20
13
Table 20: Graduate Programmes (Cost per credit)
Sources:
Northern Caribbean University Graduate Bulletin 2008-2010, retrieved October 3, 2012 from http://www.ncu.edu.jm/Portals/0/Documents/Academics/docs/Grad_Bulletin_2008-2010.pdf.
Sojourner Douglass College data retrieved September 20, 2012 from http://www.sdc.edu/admissionss/tuition.asp#Bahamas.
The Abraham S. Fischler School of Education Catalog and Student Handbook 2012-2013, retrieved October 3, 2012 from http://www.fischlerschool.nova.edu/current-students/academic-calendar and http://www.huizenga.nova.edu/FutureStudents/Masters/Admissions.cfm#Tuition.
21
Tuition for degrees offered in conjunction with the USA is set by the contracted schools. 22
Calculated for one credit from 3-credit course: $550 and 6-credit course: $1,100
Degrees NCU Nova Sojourner COB21 UWI
DMin $330 - - -
Ed.D. (all) - $955 - -
M.Ed. Educational Admin - - - $1037
M.Ed. School Counseling - - - $1037
M.Ed. Special Education - - - $1037
MA Education $360 - - -
MA Political Campaign Mgt - - $450 -
MA Religion $305 - - -
MA Teaching $360 $500 - -
MBA $400 $682-$777 - $600
MLIS $898
Master of Ministry $305 - - -
Master of Public Health (New students) $300 - - -
Master of Public Health (Returning students) $265
Master of Science Biology $285 - - -
Master of Science Molecular Biology $285
MSc Counselling Psychology $365 - - -
MS Early Childhood - - - $685
MS Elementary Ed - - $685
MS Environmental Science $285 - - -
Ph.D. Education $435 - - -
Doctor of Ministry $365 - - -
Post Graduate Diploma $355 - - -
PhD Counseling Psychology $500 - - -
Doctor of Philosophy Biology $505 - - -
Online/Blended22 $183.33

80:
Prepared by Annick M. Brennen, M.A., Action Consultant
Fe
br
ua
ry
8,
20
13
The College of The Bahamas MBA Programme Tuition retrieved October 3, 2012 from http://www.cob.edu.bs/DOCS/MBA_Fees.pdf.
Wheelock College Graduate Tuition and Fees 2012-2013, retrieved October 3, 2012 from http://www.wheelock.edu/admissions/graduate/tuition-and-fees.
Kent State University Tuition 2012-2013 retrieved October 5, 2012 from http://www.kent.edu/admissions/cost/tuition.cfm.
South Florida University Tuition and Fees: Fall 2012 to summer 2013 retrieved October 5, 2012 from http://usfweb2.usf.edu/uco/cashaccounting/Current_Tuition.asp.
University of the West Indies fees retrieved from http://www.open.uwi.edu/graduate/financial-information, February 1, 2013.
Determining Tuition Cost for The Bahamas
Several factors should be considered when determining the tuition cost of a Northern Caribbean University extension in New Providence:
1. The median household income of the Bahamian population shown in Table 21. 2. The mean income of the Seventh-day Adventist membership calculated as an average of
the tithe using 20 % of the membership (since no data is available to calculate the median)
3. The tuition costs of competitors 4. The perceived value of the education provided by the institution 5. The current and projected future economic environment
Table 21: All Bahamas Median Household Income
Median Household Income
2011 2009 2008 2003
30,000 30,318 35,550 31,792
Change -318 -5,232 3,758
% Change -3% -16% 16%
Source: Department of Statistics
Number of Households and Household Income: All Bahamas, NP and GB 2011 Number of Households and Household Income: All Bahamas, NP and GB 2009 Number of Households and Household Income: All Bahamas, NP and GB 2008 Number of Households and Household Income: All Bahamas, NP and GB 2003

81:
Prepared by Annick M. Brennen, M.A., Action Consultant
Fe
br
ua
ry
8,
20
13
Chart 27: Median Household Income All Bahamas
There was a peak in the median household income in 2008 then a sharp decline in 2009 and 2011. Note the negative percentage change (-16 % and – 3 %) from 2008 to 2009 and 2011.
The median household income is not expected to improve if the economic forecast holds true. It is generally accepted that the Bahamian economy relies heavily on the tourism industry. Neil Hartnell, Tribune business editor in his article, “Bahamas Loses Stopover Tourist Market Share to Caribbean Rivals,” describes the economic fallout of the 2008 recession:
The Bahamas has been “losing stopover market share” to rival Caribbean destinations ever since the recession hit in 2008, its share of the region’s land-based tourists having fallen by more than one percentage point over a four-year period. And Moody’s, the Wall Street credit rating agency, warned that the Bahamian hotel/tourism industry’s market share loss was “more pronounced” if Mexico and Central America were factored into the mix. When ranked alongside other Caribbean nations, Moody’s and Caribbean Tourism Organization (CTO) data showed that the Bahamas’ share of total stopover visitors to the Caribbean had fallen from 8.8 per cent in 2008 to 8.1 per cent in 2010, then slid further in 2011.23
The caption of the article contained these significant statistics:
Moody’s Bahamas tourism competitiveness being eroded, with over 1 % pt share lost
Stopover visitors down 12 % from 2007 peak
Bahamians’ spending fell by 7.7 % of GDP in 2009.
23
The Tribune, Business, Section B, Monday, December 31, 2012, page B1.

82:
Prepared by Annick M. Brennen, M.A., Action Consultant
Fe
br
ua
ry
8,
20
13
Another headline of the December 31, 2012 Tribune edition was: “Bahamas Suffers ‘Largest’ Debt Growth in Caribbean.”
Central Government debt to hit 60 % of GDP by 2015
Tourism generates just 11.2 % of revenues
Government yet to credibly commit to fiscal tightening.24
In December 2012, Moody’s Investors Service downgraded again the credit rating of The Bahamas. This was the second downgrade in less than two years.
New York, December 13, 2012 — Moody’s Investors Service has downgraded the rating of the government of the Bahamas to Baa1 from A3. The rating outlook remains negative. Key drivers of this rating action are:
1. Limited growth prospects following a protracted recession and weak recovery in tourism and construction
2. Significant and rapid deterioration of the government’s balance sheet, exacerbated by a low revenue base
3. High and rising levels of debt and a weakening of debt sustainability metrics relative to peers. 25
The unemployment rate of The Bahamas reflects the national economic condition. Observe the worsening of unemployment from 2009 (after the recession hit in 2008 when massive layoffs occurred) to 2012. There was a 7.1 percentage point increase in unemployment between 2006 and 2012. In 2012, the M unemployment rate was 2.6 percentage points higher than the F unemployment; and in 2011, it was only .1 point lower than the F unemployment rate.
24
Ibid, p. B1. 25
The Truth According to Me, http://www.thereal242.com/?page_id=868, retrieved January 18, 2013.

83:
Prepared by Annick M. Brennen, M.A., Action Consultant
Fe
br
ua
ry
8,
20
13
Chart 28: Bahamas Unemployment Rate 1998-2012
Sources:
CIA World Factbook - Unless otherwise noted, information in this page is accurate as of January 1, 2011 http://www.indexmundi.com/g/g.aspx?c=bf&v=74
Department of Statistics, Labour Force and Its Components 2011 and 2012.
The economic situation is further reflected in the tithe intake of the South Bahamas Conference of Seventh-day Adventists from 2008 to 2012.26
According to figures obtained from the Department of Statistics, there was an increase of 118 % in the Seventh-day Adventist membership in the 25 to 65+ age group that is usually employed as Chart 29 illustrates.
26
Figures provided by the Treasury of the South Bahamas Conference of Seventh-day Adventists.
9
6.9
10.2 10.2
7.6
14.2 13.7 14.7
0
2
4
6
8
10
12
14
16
Year 1998
Year 2001
Year 2004
Year 2005
Year 2006
Year 2009
Year 2011
Year 2012
Bahamas Unemployment Rate 1998-2012
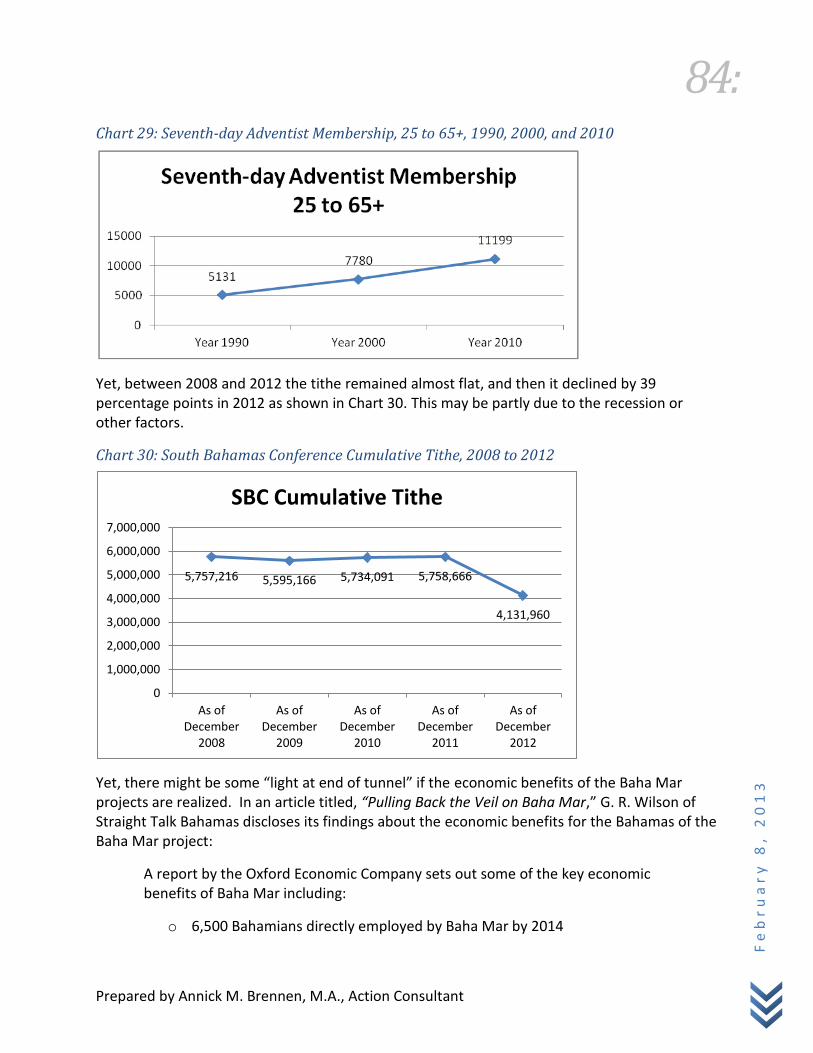
84:
Prepared by Annick M. Brennen, M.A., Action Consultant
Fe
br
ua
ry
8,
20
13
Chart 29: Seventh-day Adventist Membership, 25 to 65+, 1990, 2000, and 2010
Yet, between 2008 and 2012 the tithe remained almost flat, and then it declined by 39 percentage points in 2012 as shown in Chart 30. This may be partly due to the recession or other factors.
Chart 30: South Bahamas Conference Cumulative Tithe, 2008 to 2012
Yet, there might be some “light at end of tunnel” if the economic benefits of the Baha Mar projects are realized. In an article titled, “Pulling Back the Veil on Baha Mar,” G. R. Wilson of Straight Talk Bahamas discloses its findings about the economic benefits for the Bahamas of the Baha Mar project:
A report by the Oxford Economic Company sets out some of the key economic benefits of Baha Mar including:
o 6,500 Bahamians directly employed by Baha Mar by 2014
5,757,216 5,595,166 5,734,091 5,758,666
4,131,960
0
1,000,000
2,000,000
3,000,000
4,000,000
5,000,000
6,000,000
7,000,000
As of December
2008
As of December
2009
As of December
2010
As of December
2011
As of December
2012
SBC Cumulative Tithe

85:
Prepared by Annick M. Brennen, M.A., Action Consultant
Fe
br
ua
ry
8,
20
13
o A further 2,000 jobs indirectly created by the project, totaling 8,500
o $5.5 billion in direct wages going straight into the pockets of Bahamian families
o A further$1.5 billion in salaries for those indirectly employed
o A$14.8 billion contribution to The Bahamas gross domestic product GDP-a massive boost to the national economy.
o $24.5 billion extra in visitor spending over a 20-year period, though spending and direct taxes, taking the total contribution for the resort to $33.6 billion over the next two decades
o An extra$6.2 billion in government revenues over a 25-year horizon.
o Visits to the property jumping from 250,000 this year to 644,000 by 2016, generating a predicted 2.3 million visitor nights.
o Figures have also predicted that the development will inject $880 million into The Bahamas in its first year of operation through direct taxes and spending.
o Baha Mar is projected to generate almost $15 billion in GDP, with more than 8,100 direct and indirect jobs, totaling in excess of $7 billion in wages over a 20-year period.27
So, an NCU undergraduate tuition cost extended to Bahamian students should follow these guidelines:
1. It cannot be on par with the tuition offered by COB because it is partly funded by The Bahamas Government.
2. It cannot be equivalent to the tuition cost offered by Galilee College or UWI Open Campus because of the perceived value of education associated with a low tuition cost. and the cost of utilizing e-learning modality is usually lower.
3. It cannot be on par with the tuition cost offered by Nova because it is the highest, and the educational market in the current economic condition may not be able to bear such a high cost.
27
G. R. Wilson, Pulling Back the Veil on Baha Mar, http://www.straighttalkbahamas.com/2010/09/pulling-back-the-veil-on-baha-mar/ retrieved October 2012.

86:
Prepared by Annick M. Brennen, M.A., Action Consultant
Fe
br
ua
ry
8,
20
13
4. It should be competitive with the tuition cost extended by Sojourner Douglass College or
Omega College.

87:
Prepared by Annick M. Brennen, M.A., Action Consultant
Fe
br
ua
ry
8,
20
13
Chapter 5
Admission Requirements and College Readiness
Undergraduate Admission Requirements
As an institution whose programs are accredited by several accreditation bodies, Northern Caribbean University must maintain the required admission requirements for its first-year students. According to information retrieved from its Web site28 on January 20, 2013, its undergraduate admission requirements are as follows:
Baccalaureate Programs
Students seeking admission into the baccalaureate programs must comply with at least one of the following requirements:
Five General Certificate of Education (GCE) or Caribbean Examinations Council (CXC) passes (at a minimum of level III or Grade C) or equivalent, including English Language.
Four General Certificate of Education (GCE) or Caribbean Examinations Council (CXC) passes (at a minimum level of level III or Grade C) and one Secondary School Certificate (SSC) pass in the National Assessment, Range 5, including English Language.
Transfer from a recognized tertiary institution with at least sophomore standing, (minimum of 32 transferable Semester credits), and must have satisfied matriculation requirements at that institution. Students transferring with less than 32 credits will be classified as freshmen and all NCU matriculation requirements will apply.
A minimum score of 1170 on the Scholastic Aptitude Test (SAT I) for students outside the English Speaking Caribbean, where 1, 2 and 3 above do not apply.
A minimum Scholastic Aptitude Test (SAT II) of 650 for individual subjects is required for science programs.
A three year diploma or associate degree from an approved tertiary institution.
ACT composite score of 26.
Associate Programs
Five General Certificate of Education (GCE) or Caribbean Examinations Council (CXC) passes (at a minimum of level III or Grade C) or equivalent including English Language.
28 Retrieved from http://www.ncu.edu.jm/Admissions.aspx, January 20, 2013.

88:
Prepared by Annick M. Brennen, M.A., Action Consultant
Fe
br
ua
ry
8,
20
13
Four General Certificate of Education (GCE) or Caribbean Examinations Council (CXC) passes (at a minimum level of level III or Grade C) and one Secondary School Certificate (SSC) pass in the National Assessment, Range 5, including English Language.
Transfer from a recognized tertiary institution with at least sophomore standing (minimum of 32 transferable Semester credits) and must have satisfied matriculation requirements at that institution. Students transferring with less than 32 credits will be classified as freshmen and all NCU matriculation requirements will apply.
A minimum score of 1170 on the Scholastic Aptitude Test (SAT I) for students outside the English Speaking Caribbean, where 1, 2 and 3 above do not apply.
A minimum Scholastic Aptitude Test (SAT II) of 650 for individual subjects is required for science programs.
ACT composite score of 26.
Diploma and Certificate Programs
Students seeking admission into diploma and certificate courses must meet such criteria as may be outlined by the various departments offering these programs.
An NCU extension will be required to follow the admissions and program-specific requirements outlined in the University Bulletin.
College Readiness
How do Bahamian students measure up to these requirements, particularly in English? The national examinations are graded on a seven-point scale A to G. Letters A, B, and C are above average; D is average while E, F, and G are below average. The “U” grade indicates that the candidate has failed to show positive achievement in the subject.29
Taneka Thompson, The Nassau Guardian Senior Reporter, in an article published August 8, 2012 titled,
“Dismal exam scores continue, “reveals:
Students sitting the 2012 Bahamas General Certificate of Secondary Education (BGCSE) exams received an average letter grade of D in English Language and E+ in Mathematics, according to data from the Ministry of Education.30
According to statistics obtained from the Ministry of Education by the Labor Market Information
Newsletter, Volume 26, No. 37 December 2011, in 2011 only 34.2 % of the 5,373 students who took
29
Ministry of Education Examination and Assessment Division: The Commonwealth of The Bahamas, National Examination Press Report, BJC & BGCSE, 2010., released 5
th August, 2010, p. 2.
30 Article retrieved from http://www.thenassauguardian.com/index.php?option=com_content&view
=article&id=33208&Itemid=27, January 20, 2013.

89:
Prepared by Annick M. Brennen, M.A., Action Consultant
Fe
br
ua
ry
8,
20
13
the English language BGCSE examination received a grade of C or above, while 24.6 % of the 5,200 students who took the mathematics BGCSE examination received a C grade or above. This means that 65.8 % of the candidates who sat the English language examination received a D grade or below and 75.4 % of students taking the mathematics examination received a D grade or below. Table 22 shows these results.
Tables 22 to 25 show the trends for the BGCSE English Language and mathematics examinations.
Table 22: Results of Standard Examination BGCSE: All Bahamas 2011, English and Mathematics
English: Grades Attained
Sex Number Sat
Grade A
Grade B
Grade C
Grade D
Grade E
Grade F
Grade G
Grade U
M 2226 77 84 462 685 493 269 126 30
F 3147 210 165 838 988 599 247 83 17
Total 5373 287 249 1300 1673 1092 516 209 47
C+ 34.2%
D+ 65.8%
Mathematics: Grades Attained
Sex Number Sat
Grade A
Grade B
Grade C
Grade D
Grade E
Grade F
Grade G
Grade U
M 2176 67 79 393 311 296 302 393 335
F 3024 101 100 538 436 437 485 524 403
Total 5200 168 179 931 747 733 787 917 738
C+ 24.6%
D+ 75.4%
Source:
Labor Market Information Newsletter, Volume 26 No. 37 December 2011, Results of Standard Examination, Bahamas General Certificate of Secondary Education (B.G.C.S.E.), By Subject and Sex: All Bahamas – 2011.

90:
Prepared by Annick M. Brennen, M.A., Action Consultant
Fe
br
ua
ry
8,
20
13
Table 23: Mean Grade by Subject BGCSE 2004-2010
Subject 2004 2005 2006 2007 2008 2009 2010
English Language D- D D- D- D D D
Mathematics E E E E E E- E-
Source:
Ministry of Education Examination and Assessment Division: The Commonwealth of The Bahamas National Examination Press Report BJC & BGCSE, 2010, released 5th August, 2010, p. 26.
Table 24: Data trends for the BGCSE English Language Examinations for the period 2000 to 2010
Grade 2000 2001 2002 2003 2004 2005 2006 2007 2008 2009 2010
A # %
157 3.40
154 3.80
187 4.50
147 3.40
130 3.04
131 3.10
104 2.23
109 2.00
184 3.90
248 5.00
334 6.50
B # %
177 4.70
249 6.14
212 5.20
189 4.40
194 4.53
149 3.60
148 3.17
142 3.00
268 6.00
285 6.00
263 5.10
C # %
487 12.90
652 16.09
785 19.00
1085 25.05
995 23.30
1058 25.40
1199 25.70
1018 22.00
955 20.00
1210 24.00
1370 25.50
Cumulative% 21.80 26.03 28.70 32.80 30.80 32.10 31.10 28.00 29.90 35.00 26.50
D # %
1,199 31.80
1,189 29.34
1,178 26.2
1,151 26.6
1,247 29.1
1,462 35.03
1,387 29.73
1,372 30.00
1,629 34.00
1,435 29.00
1563 30.20
E # %
912 24.20
1,031 25.44
1,080 26.30
922 21.30
849 19.80
785 18.80
936 20.06
926 20.00
980 21.00
1,004 20.00
947 18.30
F # %
506 13.40
461 11.37
464 11.30
457 10.55
513 12.00
371 8.90
461 9.88
552 12.00
466 10.00
490 10.00
459 8.90
G # %
209 5.50
211 5.21
208 5.10
261 6.03
241 5.60
150 3.60
241 5.17
303 7.00
180 4.00
191 4.00
174 3.40
U # %
119 3.20
106 2.62
101 2.50
119 2.75
111 2.60
67 1.60
190 4.07
120 3.00
61 1.00
97 2.00
64 1.20
Total Examined
3766 4053 4113 4331 4280 4173 4666 4538 4724 4906 5615
Source:
2000-2010 Examinations Results adapted from BGCSE: English Language General Report on the Examination June 2010, p. 2 and Subject Trend Analysis Report, Table 2.7.

91:
Prepared by Annick M. Brennen, M.A., Action Consultant
Fe
br
ua
ry
8,
20
13
Table 25: Data trends for the BGCSE Mathematics Examinations for the period 2000 to 2010
Grade 2000 2001 2002 2003 2004 2005 2006 2007 2008 2009 2010
A # %
158 4.00
159 3.80
154 3.50
104 2.30
141 3.20
94 2.20
116 2.60
115 2.60
104 2.30
166 3.00
165 3.30
B # %
141 3.60
141 3.50
145 3.40
130 2.90
131 3.00
125 2.90
129 2.90
137 3.10
114 2.50
174 4.00
145 2.90
C # %
805 20.60
892 21.70
907 20.90
908 20.10
896 20.50
870 20.40
888 19.80
883 20.10
953 20.70
783 16.00
834 16.80
Cumulative% 28.20 29.00 27.80 25.30 26.70 25.50 25.30 25.80 25.50 24.00 23.00
D # %
657 16.80
712 17.30
591 13.60
620 13.80
673 15.50
646 15.10
714 15.90
694 15.80
687 14.90
677 14.00
721 14.50
E # %
654 16.70
628 15.20
781 17.90
657 15.00
657 15.00
711 16.60
726 16.20
698 15.90
746 16.20
706 15.00
810 16.30
F # %
610 15.60
630 16.80
720 16.70
599 13.70
599 13.70
650 15.20
704 15.70
788 18.00
717 15.50
766 16.00
863 17.40
G # %
525 13.40
550 13.20
670 15.30
656 15.00
656 15.00
642 15.00
741 16.50
742 16.90
760 16.50
853 18.20
793 16.00
U # %
365 9.30
349 8.50
376 8.70
614 14.10
614 14.10
539 12.60
467 10.40
331 7.30
531 11.50
629 13.00
638 12.80
Total Examined
3915 4061 4344 4508 4367 4277 4485 4423 4612 4754 4969
Source:
2000-2010 Examinations Results adapted from BGCSE: Mathematics General Report on the Examination June 2010, p. 23 and Subject Trend Analysis Report, Table 2.8.
Performance in Five or More Subjects
A total of nine hundred and thirty seven (937) candidates (or 17 % of 5,373 who sat the subject) received at least grade ‘C’ in five or more subjects in 2011 compared to nine hundred and twenty-one (921) candidates (or 18 % of 5,199 who sat the subject) in 2010.31
In 2011 a total of one thousand five hundred and fifty-four (1,554) candidates (or 30 % of 5,200 who sat the subject) obtained a minimum of grade D which is a 1.77% decrease from 2010 with a total one thousand five hundred and eighty-two (1,582) (or 31.77 % of 4,993 who sat the subject) in 2010 . . .32
All of these statistics show that a college preparatory program is crucial for any higher education seeking to offer education to Bahamian students. This is consistent with the Seventh-day Adventist philosophy that education and redemption are one. In fact, most of the tertiary
31 Ministry of Education Examination and Assessment Division: The Commonwealth of The Bahamas National
Examination Press Report BJC & BGCSE, 2011, released 3rd August, 2011, p. 19.
32 Ibid, p. 19.

92:
Prepared by Annick M. Brennen, M.A., Action Consultant
Fe
br
ua
ry
8,
20
13
institutions in New Providence offer college preparatory classes. A Seventh-day Adventist institution can do no less.

93:
Prepared by Annick M. Brennen, M.A., Action Consultant
Fe
br
ua
ry
8,
20
13
Chapter 6
Human Resource
Survey respondents identify as one of the challenges to establishing an NCU extension the availability of qualified lecturers and administrative support personnel.
Membership Survey
One of the questions of the membership survey was: “What is the highest level of education that you have currently attained?’
Of the 448 persons who answered this question, 34 or 7.3 % obtained a master’s degree, while 7 or 1.5 % obtained a doctorate degree.
Of the 34 persons who attained a master’s degree, 33 declared their disciplines as shown in Table 26. A total of 18 persons or 55.4 % possess a degree in the field of education.
Table 26: Declared Disciplines of Master’s Degree Holders
Disciplines Frequency %
Education 12 35%
Business Administration 2 6%
Health Science 2 6%
Education/Reading 2 6%
Educational Administration & Supervision of Instruction 1 3%
Linguistics 1 3%
Computer Science 1 3%
Divinity 1 3%
Performing Arts 1 3%
Library/Information Science & Adult Education 1 3%
Public Administration 1 3%
Public Health 1 3%
Nursing 1 3%
Music Education 1 3%
Curriculum & Instruction 1 3%
Educational Technology 1 3%
Accounting 1 3%
Curriculum & Administration 1 3%
Arts 1 3%
No answer 1 3%
Total 34

94:
Prepared by Annick M. Brennen, M.A., Action Consultant
Fe
br
ua
ry
8,
20
13
The disciplines of the seven doctorate holders are: Sociology, Mathematics, Education, Curriculum and Instruction, Pharmacology, Education Supervision, and Ministry.
Of the 41 persons who hold masters’ and doctorate degrees, 29 or 70.28 % would consider lecturing at the University extension, while 8 or 19.5% would not. Four persons or 9.7 % did not disclose whether they would consider lecturing at the University extension.
Of the 41 persons who hold masters’ and doctorate degrees ,26 or 63.4 % said they would consider being part of the University administrative support structure; 12 or 29.3 % said they would not; 3 or 7.3 % did not provide an answer.
Based on the result of the survey, additional qualified lecturers in multiple fields will need to be recruited to deliver education at an NCU extension in New Providence. An adequate human resource pool exists to select persons to be part of the governance structure of the University extension.
95:
Prepared by Annick M. Brennen, M.A., Action Consultant
Fe
br
ua
ry
8,
20
13
Chapter 7
Students Records’ Storage and Hiram S. Walters Resource Centre Access
Students’ Records
Mrs. Avery Thompson, registrar of Northern Caribbean University provided useful information concerning students’ registration and the storage of their academic records. She says:
In response to your inquiry, I can certify that any worker with the rights of registering a student will have a username and password for the AEorion. This is facilitated through UNISS and thus would need to be sought via Mr. Rhoden. UNISS means University Information Systems Services (i.e our IT Department).
The only cost would be the Internet provider. The securities on the lecturers’ end would mean that these passwords and any other access information would not be given to students. They would have their own portal for entry.
The faculty also has the privilege of grade entry from anywhere in the world. However, approval for grades is gotten through the Department Chair for the subject offering before entering them on the system.
This would be the protocol for the registration and grade entry for any additional off-campus site. Authorities for security will still need to be done through University Records as well as verifications, grade slips, transcripts, and updating of student records.
Apart from the procedures mentioned above, to access students’ academic and administrative records, all that is required is a computer with Internet access.
Access to Hiram S. Walters Resource Centre
All students of Northern Caribbean University have access to the Hiram S. Walters Resource Centre after registration. The Resource Centre boasts of E-resources comprised of a catalog, databases, other online resources, and guidelines for doing research. Now with the addition of e-library services at Bahamas Academy, all students should be able to access the Hiram S. Walters Resource Centre using the standard operating procedures of the Centre.
96:
Prepared by Annick M. Brennen, M.A., Action Consultant
Fe
br
ua
ry
8,
20
13
Chapter 8
Educational Facilities
The South Bahamas Conference proposes to house the Northern Caribbean University extension in the educational facilities of Bahamas Academy on Marshall Road. The school facilities were ready for occupancy in September 2011. Bahamas Academy complex houses the primary and secondary schools.
Instructional and Student Services Facilities
Instructional Areas
Thirty-three thousand three hundred (33,300) square feet are allocated to classrooms with a capacity to seat 1,110 students. This square footage translates into 37 classrooms of 900 square feet seating 30 students each.
Students have access to a chemistry/biology laboratory, biology and general science laboratory, two woodwork workshops, two computer laboratories with a total of 32 computers, and a home economics laboratory.
Two e-libraries, equipped with i-Pads and the Internet, enhance students ‘educational experience. Nevertheless, it will be necessary to make arrangements with The College of The Bahamas for students to use their resource center/library.
Student Service Areas
Indisposed students may access a sick bay and a nurse’s room. Meals are provided in a 1,200 square foot cafeteria with a two hundred seating capacity. Guidance counseling takes place in two guidance counseling rooms and a teaching room.
Other facilities include a conference room, a PTA room, and a teacher’s room, and restrooms designated for students, administrators and teachers; a small exercise room,
Access to Administrative Offices
The principal stated that one office will be made available for University extension personnel. The office can accommodate only two persons.

97:
Prepared by Annick M. Brennen, M.A., Action Consultant
Fe
br
ua
ry
8,
20
13
Chapter 9
Branding and Enrolment Management
Branding
Although this section is not intended to provide instruction in branding, it is important to include it because competition for prospective students is strong. The College of The Bahamas having already gained 38 to 40% of the educational market share, it will be important for an NCU extension to position itself successfully in the educational “market” and differentiate itself from its competitors to attract students and qualified lecturers.
Branding means to “make known the attributes of the organization’s identity in the form of a clearly defined branding proposition” (Balmer 2001, p. 281). To do so, the organization must first define for itself the essence of “what” and “who” it is, and what it stands for” in terms of values and characteristics. It is believed that this definition should be as precise and consistent as possible, and communicated very consistently. Branding is easily observable, for example, through the use of vision statements, visual designs, and core values.33
The external communication of the NCU brand is the focus of this discussion since The South Bahamas Conference is seeking to establish an NCU extension in The Bahamas. NCU is an established brand in Jamaica and to a great extent internationally as it attracts students and academic staff, notably Seventh-day Adventist ones from over 34 countries. It already possesses these recognizable values and characteristics.
Mission Statement Northern Caribbean University, a Seventh-day Adventist institution, has as its mission quality Christ-centered education, achieved through academic excellence, social interaction, physical and spiritual development and a strong work ethic, thereby fitting each student for committed professional service to country and to God. Vision Statement Strategically located, Northern Caribbean University aspires to be the centre of holistic higher education, upholding Christian values in an intellectually stimulating environment.
33
Arild Waeraas and Marianne N. Solbakk, Defining the essence of a university: lessons from higher education branding, p. 450, published online: 13 June 2008. Retrieved from http://203.217.177.120/portal/images/utama/ doc/artikel/2012/02-29/defining%20the%20essense%20of%20a%20university.pdf, January 23, 2013.

98:
Prepared by Annick M. Brennen, M.A., Action Consultant
Fe
br
ua
ry
8,
20
13
Value Statement Ubi Semper Discimus – Where Learning Never Ends Core Values NCU C.A.R.E.S. (Christ-centeredness, Affirmation, Respect, Excellence, Stewardship)
Logo
In their discussion on branding academia, Waeraas and Solbakk quoted Melewar and Akel (2006, p. 41):
In a market where students are recognized as customers, universities have to implement strategies to maintain and enhance their competitiveness. They need to develop a competitive advantage based on a set of unique characteristics. Furthermore, universities need to communicate these characteristics in an effective and consistent way to all of the relevant stakeholders. . . Under these circumstances, universities have finally realized the role of corporate identity (CI) as a powerful source of competitive advantage.34
However, the whole point of their discussion was that universities, unlike corporate identities, were too complex to be reduced to a single profile or identity. They concluded that “higher education institutions have better chances of becoming strong brands if they are allowed to express their unique strengths and virtues, however, inconsistent. If the goal is to gain advantages over competitors by having a unique identity, universities will be perceived as even more unique by displaying multiple identities (cf. Pratt and Foreman 2000).35
Northern Caribbean University has many and unique strengths and multiple identities on the national and international scenes that should be exploited to communicate the brand externally to potential students and academic staff in The Bahamas:
It is a mature 106 year-old higher education institution, having been founded in 1907 in Jamaica. It achieved senior college status in the late 1950's when it began to offer the Bachelor's Degree in Theology. The college was granted university status in 1999 by the
34
Ibid, p. 452. 35
Ibid, p. 460.

99:
Prepared by Annick M. Brennen, M.A., Action Consultant
Fe
br
ua
ry
8,
20
13
Jamaican Government. Presently the University offers several graduate programs in the sciences, business and education.
The University is a private, co-educational, liberal-arts institution, offering a number of
professional, pre-professional and vocational programmes and is the only multi-disciplinary tertiary institution serving rural Jamaica. Its enrolment averages over 5000 students from over 34 countries.
The University has a track record of academic excellence and competitiveness in both the
national and international arenas:
The College of Allied Health and Nursing obtains between 83.5% and 98.6% pass rate in national and regional exams
The College of Natural and Applied Sciences: Team Xormis placed first in the world in the Microsoft Imagine Cup Competition, Poland 2010; in 2011, Mathberry App Developers placed first in the Inaugural Blackberry Developers Competition for their mathematics application developed to help high school students; Dr. Paul Gyles, Dean of College of Natural and Applied Sciences, Researcher on the effects of sorrel and garlic on cancer cells, has gained national and international recognition and acceptance
The College of Humanities, Behavioral and Social Sciences produces mass communication graduates who are the employees of choice for the top media houses in Jamaica.
School of Graduate Studies: Masters’ degrees being offered by all five colleges and one school Four doctorate programs on stream:
Doctor of Philosophy in Education
Doctor of Philosophy in Counseling Psychology
Doctor of Ministry (DMin.)
Doctor of Philosophy in Biology
The University has added a service component to all of its programs. Students must apply what they have learned either on campus or in the wider community.
The University is nationally and internationally accredited and recognized: Institutional Accreditations: Northern Caribbean University is accredited by the
Adventist Accrediting Association in Washington D.C., and is recognized by the United States Office of Education as an approved centre of higher education, for the

100:
Prepared by Annick M. Brennen, M.A., Action Consultant
Fe
br
ua
ry
8,
20
13
purpose of loans and grants. The University is also recognized by the Canada Student Loan and the Alberta Student Assistance Programme. The University Council of Jamaica (UCJ) has certified that Northern Caribbean University is a legitimate tertiary degree-granting institution. The Joint Board of Teacher Education of Jamaica accredits the Primary and Secondary Education diploma programmes. The Nursing Council of Jamaica certifies the Nursing Degree programmes. The Medical Technology and Dietetics programmes are approved by the Council of Professions Supplementary to Medicine.
Program Accreditation. The University Council of Jamaica has approved and accredited the following programs: Bachelor of Science in Biological Sciences
Associate of Science in Biology
Bachelor of Science in Biology Education
Master of Science in Biology
Bachelor of Science in Medical Technology
Master of Public Health
Bachelor of Science in Business Administration
Associate of Science in Business Administration
Bachelor of Science in Management Studies
Master of Business Administration
Bachelor of Arts in Primary Teacher Education
Bachelor of Arts in Secondary Teacher Education
Bachelor of Science in Secondary Teacher Education
Diploma in Early Childhood Teacher Education
B.A. in Early Childhood Teacher Education
Master of Arts in Education
Ph.D. in Education
Bachelor of Science in Psychology
Bachelor of Science in Guidance and Counselling (formerly Bachelor of Science in Counselling)
Associate of Science in School Counselling
Master of Science in Counselling Psychology
Associate of Science in Computer Information Science (formerly Associate of Science in Information Science)
Bachelor of Science in Computer Information Science (with minor)(formerly Bachelor of Science in Information Science)
Bachelor of Science in Computer Information Science (Business Emphasis) (formerly Bachelor of Science in Information Science, Business Emphasis)
Bachelor of Science in Computer Science (Communications Emphasis)
Bachelor of Science in Computer Science (Programming Emphasis)
Associate of Arts in English

101:
Prepared by Annick M. Brennen, M.A., Action Consultant
Fe
br
ua
ry
8,
20
13
Bachelor of Arts in English
Associate of Science in Mathematics
Bachelor of Science in Mathematics
Associate of Arts in Mass Communication
Bachelor of Arts in Mass Communication
Bachelor of Arts in History
Bachelor of Social Work
Associate of Science in Social Work
Associate of Science in Family Life Education36
Affiliations: La Sierra University in California and Southern University in Tennessee,
etc. accept Northern Caribbean University baccalaureate degrees at face value as minimum requirement for entry into its master's programmes, (as do many other Universities). Loma Linda University in Loma Linda, California, accepts Northern Caribbean University biology graduates into its School of Dentistry and graduate science programmes. Students who have taken the bachelor's degree in nursing at the university and who are certified registered nurses are accepted into its master's programmes. Loma Linda also conducts advance graduate labs on their California campus for NCU's graduate science students. By formal agreement, Walla Walla College, in the state of Washington, accepts into its accredited baccalaureate programmes in Engineering, students who have completed the Associate of Science in Engineering at Northern Caribbean University. These students are required to do at least one year and a half at Walla Walla College before qualifying for the bachelor's degree. The University of the West Indies (UWI), Mona accepts NCU Biology graduates into its medical school and St. Augustine Campus of UWI accepts A.Sc. Engineering students from NCU into its B.Sc. in Engineering Programme. Northern Caribbean University is a member of the Joint Committee for Tertiary Education (JCTE), and the Association of Caribbean Tertiary Institutions (ACTI). The president of the university is a member of the Board of the University Council of Jamaica (UCJ), and has served as chairman of the Joint Committee for Tertiary Education (JCTE).
No local college, not even The College of The Bahamas, can boast of such accomplishments. The marketing expert must exploit these facts to market an NCU extension in The Bahamas.
36
Retrieved from http://www.ucj.org.jm/content/accredited-programmes-and-ucj-approved-degrees, January 25, 2013.
102:
Prepared by Annick M. Brennen, M.A., Action Consultant
Fe
br
ua
ry
8,
20
13
Enrollment Management
Adopting a solid enrolment management philosophy and creating a plan that includes effective strategies are crucial for attracting students to and retaining them at the University extension. Enrollment management should be a holistic process to ensure students’ academic success and lifelong learning. It should be an integrated systems approach that focuses on student enrolment from the time of their inquiry through graduation and post-graduation.
Don Hossler, John P. Bean, and colleagues defined enrolment management as "an organizational concept and a systematic set of activities designed to enable educational institutions to exert more influence over their student enrolments. Organized by strategic planning and supported by institutional research, enrolment management activities concern student college choice, transition to college, student attrition and retention, and student outcomes. These processes are studied to guide institutional practices in the areas of new student recruitment and financial aid, student support services, curriculum development, and other academic areas that affect enrolments, student persistence, and student outcomes from college" (p. 5). Enrollment management is an open-systems and synergistic organizational approach that fosters an organizational atmosphere that makes reporting relationships among student-service units more transparent. It also fosters an environment where offices and divisions work collaboratively to enhance the quality of the student experience, thus facilitating the strategic management of enrolments. An effective management system alters and improves the institution’s frame of reference about itself and its prospective students, community members, and business partners”37
This means essentially, that students’ success cannot be facilitated by just one aspect of the University—but by all departments and service centers working cohesively and collaboratively to provide students with the needed tools to stimulate lifelong learning.
Some of the factors that affect enrolment management planning include:
Hiring qualified lecturers and administrators with a caring, collaborative, partnership approach to higher education and teaching.
Ensuring adequate classroom, lab space, and technology to support teaching and the learning needs of students.
Exploring alternative methods for course delivery such as online and distance learning and other technological advancements.
37
Enrollment Management in Higher Education - Defining Enrollment Management, Key Offices and Tasks in Enrollment Management, Organizational Models retrieved from http://education.stateuniversity.com/pages/1959 /Enrollment-Management-in-Higher-Education.html, January 25, 2013.
103:
Prepared by Annick M. Brennen, M.A., Action Consultant
Fe
br
ua
ry
8,
20
13
Providing need-based scholarships or financial aid by partnering with business entities and the Seventh-day Adventist constituency.
Implementing a strong recruitment program which includes strategies for reaching Seventh-day Adventists and non-Seventh-day Adventists.
Monitoring students’ graduation and retention rates.
Measuring students’ satisfaction using the Student Satisfaction Inventory (SSI) and the
National Survey of Student Engagement (NSSE). (Samples provided as appendices.)
Quantitative or measurable goals of a good enrolment plan should include increasing student enrolment, retention, and graduation rates, and student satisfaction. The plan should outline strategies to increase all of the above.
Recruitment/Marketing
Undergraduate Recruitment
According to Gary Fretwel of Nowel-Levitz38 and other literature reviewed, successful recruitment is based upon these undergirding principles:
1. All marketing and recruitment strategies should have the best interest of prospective students in mind.
2. Marketing should be relationship-focused. Activities that encourage more extensive relationships with staff of the institution and students as well as those that encourage students to take action are viewed as the most effective practices for institutions to utilize.
3. Marketing should be personalized and integrated across print and digital media channels. Messages should be consistent and relevant to the individual recipient in content, presentation, timeliness, and channel.
4. Criteria that students apply when selecting a college include: reputation of the institutions, number of applicants keen to enroll in a course, past success rate of placement, faculty expertise, width of specialization offered, infrastructural facilities, and fees.
5. Recruiting is a year-round task.
38
A company that for the past 20-plus years has conducted surveys to determine the best practices in the field of enrolment management for four-year private and public institutions, as well as for two-year public institutions.

104:
Prepared by Annick M. Brennen, M.A., Action Consultant
Fe
br
ua
ry
8,
20
13
Best Recruitment Practices for the 21st Century
Nowel-Levitz, through scientific research, has identified these three most effective practices across institution types (four-year and two-year, public and private):
Offering opportunities for students to visit campus.
Using current students in the recruitment process.
Encouraging students to use the Web to apply.39
The Direct Development recruitment experts recommend40:
Utilizing social networking sites: Facebook, Twitter, Google+, etc. (Millennial students were born with a computer mouse in their hand and expect institutions of learning to have state of the art technology. They expect institutions to instant message them, text them, and respond to their inquiries within 48 hours.)
Incorporating the use of mobile devices in recruitment strategies. About 58.8% of 18-34 year-olds access Social Networking sites.
Investing in tools for integrating marketing such as:
o Variable-Data Printing. (A form of on-demand printing in which elements such as text, graphics, and images may be changed from one printed piece to the next, without stopping or slowing down the printing process and using information from a database.)
o Personalized URL (PURL) Microsites. (Personalized URLs deliver the right content in the right format to the right person at the right time to increase brand awareness, increase lead retrieval, and increase response rates—three to five times higher, in some cases—all without the need for expensive Web programmers or IT support.)
o Quick Response (QR) Codes. (A two-dimensional matrix barcode used for direct response marketing purposes.)
39
Retrieved from http://blog.noellevitz.com/2011/06/07/survey-ranks-top-practices-marketing-student-recruitment-2011/, January 24, 2013. 40
Personalized Marketing Across Multiple Channels—201, Recruiting Students in the 21st
Century, 2nd
Edition, retrieved January 24, 2013 from http://www.slideshare.net/DirectDevelopment/personalized-marketing-across-multiple-channels-201, Presentation from the 2012 NAGAP Conference in Austin, TX. Focused on how to recruit prospective students using an integrated marketing strategy approach.

105:
Prepared by Annick M. Brennen, M.A., Action Consultant
Fe
br
ua
ry
8,
20
13
o Mobile-optimized Landing Sites. (Ensure web content is available and visible for
mobile devices.)
Ineffective Recruitment Practices
According to Nowel-Levitz’s survey, practices that were judged to be very ineffective, regardless of institution type, include:
Telephone directory ads
Listings in commercially published directories
Podcasting
RSS/XML feeds
Ads in school yearbooks/newspapers
Ads in college magazines
Graduate Recruitment
Craig Engle, in his article titled, “Ten Enrollment Roadblocks for Graduate and Professional Programs,41” addresses ten issues responsible for the failure of educational institutions to optimize their graduate recruitment strategies. A summary of his recommendations are outlined below:
Active involvement and strong support of executive leaders in graduate recruitment to secure the level of resources needed to build a strong graduate recruitment program.
Centralize graduate recruitment. The use of faculty members whose primary purpose is to teach, conduct scholarly research, and advise students tend to have no training or experience in the fundamentals of recruitment. As a result, follow-up and faculty comments are inconsistent, communications and Web content are uneven, and database management virtually non-existent. This leads to a process that lacks focus and dilutes your recruitment resources.
Emphasize both shaping and growing the graduate class. Growth can bring significant benefits to graduate programs such as more qualified students, increased revenue, and a wider diversity of students.
Pay attention to the top end of the recruitment funnel. Graduate and professional programs need to take a lesson from undergraduate admissions and proactively build their inquiry pools through travel, solicitation, referral, and self-initiated avenues.
41
http://blog.noellevitz.com/2011/10/25/ten-enrollment-roadblocks-graduate-professional-programs-part/ retrieved January 24, 2013.

106:
Prepared by Annick M. Brennen, M.A., Action Consultant
Fe
br
ua
ry
8,
20
13
Have a robust, organized data process. This encompasses four key points:
o Have a centralized database to track all funnel activities. The database should be available to all relevant parties and capable of handling the data those parties need to track.
o Train the staff on proper data entry and tracking and establish a commitment to strong data management.
o The system should have the ability to account for different program start dates,
data fields, and other items that may vary from program to program.
o Create management reports that all the program directors to compare and project new student enrolment.
Develop a graduate recruitment plan with these elements:
o A situation analysis—an annual review of the mission, historical data, driving and restraining forces, and environment.
o Goal setting-cumulatively, by the individual program, and by market segment within the program.
o Strategies for goal achievement—every goal must have at least one key strategy and every stage of the funnel should have at least one strategy.
o Action plans—the implementation schedule for the initiatives that support the
goals. There should be one master plan that is in synch with the plans for individual programs.
Build personal relationships with prospective students. Let them know they are wanted. Keep making connections as they move through the funnel until their enrolment is

107:
Prepared by Annick M. Brennen, M.A., Action Consultant
Fe
br
ua
ry
8,
20
13
secured (e-mails, phone calls, social media contacts, personal notes to key inquiries and admitted students, on-campus visits for inquiries and admits, interviews and meetings with faculty).
Have a communication plan that is coordinated with various programs and departments and touches students at each key stage in their enrolment decision process.
Scholarships and financial aid are not crucial for graduate students. They are usually willing to pay for their graduate education.
Promote coordination among faculty/graduate directors. Graduate directors and faculty need to come to together to:
o Develop individual and a master graduate/professional recruitment plan.
o Identify the responsibilities of the graduate admissions office and the individual departments/programs.
o Create the print and online communication flows and also establish standards for communication, content, and follow-up efforts.
o Commit to the use of data so that efforts can be managed, tracked, and evaluated.
o Support and coordinate campus visit efforts.
108:
Prepared by Annick M. Brennen, M.A., Action Consultant
Fe
br
ua
ry
8,
20
13
Chapter 10
Organizational Requirements
Authorization to Establish and Operate a University Extension
Seventh-day Adventist Working Policy
The Working Policy 2005-2006 of Inter-American Division of the General Conference states, p. 239:
The recommendation of the General Conference Department of Education and the approval of the Division and General Conference Committees through their respective boards of Education shall be required for locating and establishing new educational institutions or raising to a higher educational level all denominationally-operated junior colleges, colleges or universities.
When it is desired to establish a college or university, or to upgrade an existing school to advanced status, the Division Committee shall appoint a survey committee to make an on-site study of the proposal. . .
It seems that the South Bahamas Conference, through the Northern Caribbean University, will need to obtain approval for operating an extension campus in New Providence.
Ministry of Education
The Education Act of The Bahamas requires all tertiary institutions to register with the Tertiary/Quality Assurance Division of the Ministry of Education. This is accomplished by answering all questions found in “Schedule Return to Be Made for the Purpose of Registration under Section 32A of the Education Act, and the Institution of Further Education (Registration) Regulations 1970.
Department of Public Personnel
Most tertiary education institutions seek recognition of their programs from the Department of Public Personnel. This is advantageous for public servants employed in the Public Service.
Business License
All businesses are required to be licensed under the Business License Bill 2010. The process is as follows:
Process
1. Collect the application form from any of Business License Unit (BLU) Offices or online.

109:
Prepared by Annick M. Brennen, M.A., Action Consultant
Fe
br
ua
ry
8,
20
13
2. The first part of the form is to register a business name, complete the entire application form and return to any of The Business License Division offices. Note: if any identified names are rejected the applicant will be notified that the name choice was rejected and would be advised to select from the remaining choices previously given on the form.
3. The following must also be submitted along with the application:
a. Proof of citizenship
b. Appropriate Registration Fee
c. Approvals related to your selected business
4. Once all document requirements are met and the name is approved, the application is then processed within 7 working days. The BLU office will contact the applicant to inform them that they can collect their license.
Recommended Academic Personnel
A minimum structure is required to support the educational services provided to students. The following positions are recommended:
Full-Time Positions
An extension director whose responsibilities will include, but not limited to:
o Be responsible for the general management of the campus resources & the overall administration of staff, contract personnel and clients; act as a liaison between the main campus and the extension site for flow of information, supplies and equipment.
o Develop and promote plans for the recruitment of students.
o Be responsible for the documents that students submit to the extension site.
o Develop and communicate class schedules.
o Act as a registrar, handle students’ requests, and supervise the registration process.
o Develop budgets for the extension site in collaboration with the accountant.
o Ensure faculty are contracted to teach all scheduled courses and remunerated.

110:
Prepared by Annick M. Brennen, M.A., Action Consultant
Fe
br
ua
ry
8,
20
13
An administrative assistant whose responsibility will be to provide administrative support to the extension director, accept students’ requests, and act as a cashier.
An accountant to record all extension site financial transactions, prepare annual budgets in collaboration with the extension director, and produce financial reports as required.
A social network specialist whose job will be to focus on implementing plans for recruiting students using all social networks and mobile telecommunications technology.
Contractual Positions
Persons hired under a contract agreement should be paid by the hour.
Two security officers for monitoring the extension site in the evening.
Faculty who will be responsible for teaching and academic advising of students, promote and maintain in the institution, through Christian modeling, a spiritual environment, and be a faithful supporter of the activities designed to achieve this objective.
Proposed Organizational Chart
Extension Director
Faculty
Security Officers
Custodian
Administrative Assistant
Accountant
Social Network Specialist

111:
Prepared by Annick M. Brennen, M.A., Action Consultant
Fe
br
ua
ry
8,
20
13
Chapter 11
Optimizing Revenue
Article XIII of the Inter American Education Operating Policies stipulates:
The income of the University shall be:
30. Registration fees, tuition and dormitory rates, and other charges 31. Grants and donations 32. Denominational appropriations 33. Revenue from subsidiaries and services.42
An NCU extension in The Bahamas will derive its “regular” revenue from registration fees, tuition rate, and other charges and denominational appropriations.
Tuition
Suggested Curriculum
Program Rationale
BA/BS Education/Teacher Training
The Seventh-day Adventist Church needs to cultivate a cadre of professional educators with a strong Christian Education philosophy.
Has strong membership support.
Ministry of Education authorities cited need for English and Mathematics teachers.
BS Management Studies Entrepreneurship
Unique to NCU
Supports growth of small business in The Bahamas
Management Tourism and Hospitality Golfing and Golf Facilities Management Food and Beverage and Tourism
Bread and butter for The Bahamas
Baha Mar on track to open in December 2014
Unique to NCU
BS Counseling, Guidance Counseling, Industrial & Organizational Counseling
Other tertiary institutions offer associate degree in these areas
Social Services, private and public schools need qualified persons
Unique to NCU
Increasingly large corporations require the services of
42
Working Policy 2005-2006 Inter-American Division of the General Conference, p. 258.
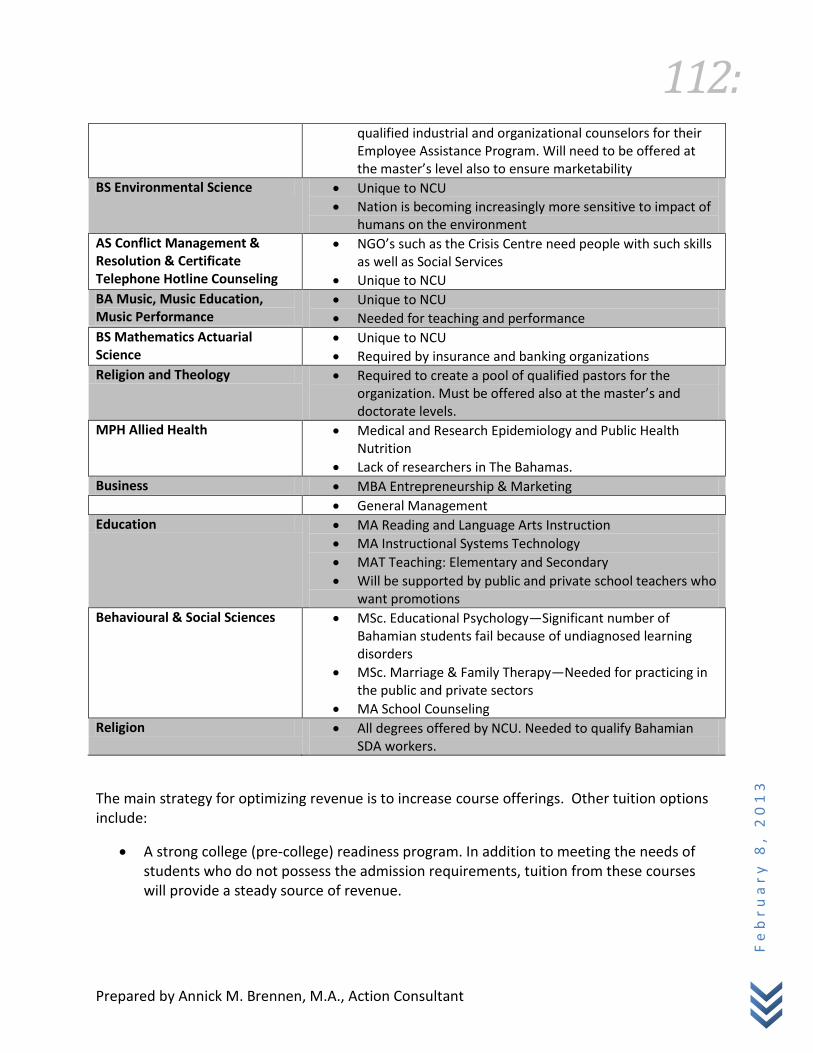
112:
Prepared by Annick M. Brennen, M.A., Action Consultant
Fe
br
ua
ry
8,
20
13
qualified industrial and organizational counselors for their Employee Assistance Program. Will need to be offered at the master’s level also to ensure marketability
BS Environmental Science Unique to NCU
Nation is becoming increasingly more sensitive to impact of humans on the environment
AS Conflict Management & Resolution & Certificate Telephone Hotline Counseling
NGO’s such as the Crisis Centre need people with such skills as well as Social Services
Unique to NCU
BA Music, Music Education, Music Performance
Unique to NCU
Needed for teaching and performance
BS Mathematics Actuarial Science
Unique to NCU
Required by insurance and banking organizations
Religion and Theology Required to create a pool of qualified pastors for the organization. Must be offered also at the master’s and doctorate levels.
MPH Allied Health Medical and Research Epidemiology and Public Health Nutrition
Lack of researchers in The Bahamas.
Business MBA Entrepreneurship & Marketing
General Management
Education MA Reading and Language Arts Instruction
MA Instructional Systems Technology
MAT Teaching: Elementary and Secondary
Will be supported by public and private school teachers who want promotions
Behavioural & Social Sciences MSc. Educational Psychology—Significant number of Bahamian students fail because of undiagnosed learning disorders
MSc. Marriage & Family Therapy—Needed for practicing in the public and private sectors
MA School Counseling
Religion All degrees offered by NCU. Needed to qualify Bahamian SDA workers.
The main strategy for optimizing revenue is to increase course offerings. Other tuition options include:
A strong college (pre-college) readiness program. In addition to meeting the needs of students who do not possess the admission requirements, tuition from these courses will provide a steady source of revenue.
113:
Prepared by Annick M. Brennen, M.A., Action Consultant
Fe
br
ua
ry
8,
20
13
An Advanced Placement (AP) program. This AP program should not be offered to Bahamas Academy students only, but also to students in high schools that meet specific criteria. An AP program gives high school students an opportunity to pursue college-level studies while still in Grade 12. These courses can lead to advanced placement (skipping entry-level courses) or even receiving college credit for the coursework completed under the program. Students accepted in the AP program should maintain at least a 3.5 GPA and have passed at least 5 BGCSE examinations in Grade 11.
Seventh-day Adventist Teacher Certification program. This program would meet the needs of teachers who need the number of credits to satisfy denominational teacher certification requirements.
Distance education/e-learning modality. UWI Open Campus has already entered the market, soon to be followed by COB. Offers more affordable options for professionals who do not have the time to sit down in classrooms.
Denominational Appropriations
Under Schedule – 14 Tithe Percentages of the South Bahamas Conference 2013, 6 percent ($324,057.87) of the tithe is turned over to Northern Caribbean University annually. The administrators of the South Bahamas Conference may need to negotiate with NCU to keep a percentage of this amount to fund an NCU extension site in The Bahamas.
Revenue from Services
Education is a service that can be extended to the community, businesses, and other institutions. Options from increasing revenue include:
A strong continuing education program that would focus on providing professional courses that meet the researched needs of the labor market.
Workforce development: Partnering with businesses to educate/train their employees onsite or offsite. This can be a very lucrative source of revenue for the extension as many entities, especially hotels, sign agreements with universities to upgrade their employees. The extension, the faculty, and the businesses involved benefit from this partnership.
Grants and Endowments
A new institution must develop relationships and build trust with its constituents before it can engage in fund raising activities such as grants and endowments. Educational endowments are usually sought from loyal alumni and philanthropic donors. It would be premature for a newly establish university extension to solicit funds. Nevertheless, a fund raising master plan can be

114:
Prepared by Annick M. Brennen, M.A., Action Consultant
Fe
br
ua
ry
8,
20
13
written and executed when the time is right. Suggestion on how to develop a fund raising master plan is given in the appendices.
Endowment Funds
An endowment fund is an investment fund set up by an institution in which regular withdrawals from the invested capital are used for ongoing operations or other specified purposes. Endowment funds are often used by nonprofits, universities, hospitals and churches. They are funded by donations, which are tax deductible for donors.
There are three main components to the typical endowment fund:
Investment Policy: This policy dictates the types of investments the manager can make and how aggressive he or she can be in meeting return targets.
Withdrawal Policy: This policy determines the amount that the institution can take from the endowment fund at each period and is usually based on the institution's needs as well as the amount remaining in the fund.
Fund Usage Policy: This policy ensures that the money from the endowment fund is being used properly and for the purposes set out by the fund.43
Usually, colleges and universities offer incentives, such as matching funds and challenge funds, to encourage large gifts. Traditional incentives include the ability of donors to spread their gift commitment over several years to fully fund a pledge to a named endowment fund.
Grants
Private foundations, public corporations, and governments offer funding to individuals and organizations to be used for specific projects. This funding, which is called a grant, requires no repayment as long as it is used to fund the project for which it was allocated. Grants can be given to individuals, non-profit or not-for-profit companies, charitable organizations, or educational facilities. In order to receive a grant, however, the prospective recipient must submit a formal request to the organization. This request is called a grant proposal.
Grant proposals can be submitted in a variety of ways. Some organizations provide an application form, while others require the requestor to submit a written document, called a full grant proposal. The requirements for completing the grant proposal are normally spelled out in a Request for Proposal (RFP) which serves as a guideline for preparing the grant proposal.
Preparing a successful grant proposal generally involves following a standard process. Once the interested parties (often referred to as stakeholders) have determined that the grant will suit the agency's or organization’s needs, the grant writer or administrator should review the RFP. Specific attention should be paid to formatting, page count, and all necessary components for
43
Retrieved from http://www.investopedia.com/terms/e/endowment-fund.asp#axzz2JP3n5XeP, January 29, 2013.

115:
Prepared by Annick M. Brennen, M.A., Action Consultant
Fe
br
ua
ry
8,
20
13
qualification. The person responsible for writing the grant proposal should then prepare an outline or standard format sheet to be followed by everyone involved in the writing process.44
Maximizing funding from endowments and grants requires hiring professionals experienced at developing and executing written plans.
44
Retrieved from http://www.wisegeek.com/what-is-a-grant-proposal.htm, January 29, 2013.

116:
Prepared by Annick M. Brennen, M.A., Action Consultant
Fe
br
ua
ry
8,
20
13
Chapter 12
Capital Requirements and Financial Projections
The Chinese philosopher Lao Tse, who lived some 2,600 years ago said: ““People in their handlings of affairs often fail when they are about to succeed. If one remains as careful at the end as he was at the beginning, there will be no failure.”
If the South Bahamas Conference decides to establish an NCU extension in The Bahamas, it will need to do due diligence from beginning to end and follow sound business principles:
1. Do not rush to open business without producing a well though-out written business plan. A well thought-out business plan forces business owners to think about the future and the challenges they will face. It also forces them to consider their financial needs, their marketing and management plans, their competition, and their overall strategy.
2. Be willing and prepared to put into the venture the capital required for launching it, for meeting unexpected increases in overhead costs, and for keeping the extension afloat until there is a positive cash flow. Make sure there is enough reserve cash to carry the venture through tough times and slowdowns.
3. Be prepared to invest in marketing the university extension and execute an effective entry strategy. Students can't enroll in an NCU extension if they don't know it is there.
4. Do not underestimate the competition (and there is plenty of it) because of misplaced faith. Customer loyalty does not just happen—the extension will have to earn it. Watch your competitors and stay one step ahead of them. If NCU does not take care of its customers, its competitors will.
5. Enrolment management is an ongoing activity. Invest in an enrolment management professional for the long haul. This will ensure a return on your investment.
6. Execute the business plan like a professional. Poor customer service and overall employee incompetence will quickly sink the extension. Make sure all academic teaching and administrative support personnel place a premium on customer service. Develop systems and processes for how tasks should be accomplished, create and implement internal controls to monitor them.
7. Apart from using the facilities, water, and electricity, there should be no comingling with Bahamas Academy operations and resources.

117:
Prepared by Annick M. Brennen, M.A., Action Consultant
Fe
br
ua
ry
8,
20
13
Start-up Requirements
Undercapitalization is one of the primary reasons for business failure. Plan to account for all start-up costs—opening and initial operating expenses. Figures quoted are not arbitrary as quotes were obtained from product and service suppliers. (See quotes in Supporting Documents.) According to calculations made in the worksheet that follows, the SBC will need approximately $232,000 to begin operations.
Northern Caribbean University Estimated Start-Up Costs
Category Initial Cost
First Sem Total Facilities Rental 600 per room/month with application fee 100 25,500 25,600 Office Furniture, including fireproof cabinet 4,532 4,532 Three computers 2,097 2,097 Copier/fax/printer--Lease option from Micronet 6,450 6,450 Office Supplies and stationery 616 2,400 3,016 Marketing budget (services of professional, plan, & activities) 25,000 25,000 Telecommunication (Cable, Fax, Internet, 2 lines) 150 3,238 3,388 Business License 1,000 1,000 Name Registration 50 50 Promotional brochures (printing) 10,000 12,000 22,000 Promotional billboards (printing) 5,000 5,000 NCU signage for site 500 500 Software: Enrolment management, accounting, desktop publishing, productivity
30,000 30,000 Utilities 4,000 4,000 Professional Services
Lawyer (Incorporate NCU) 5,000 5,000 Consultant (Creates business plan) 3,000 3,000 Pre-opening payroll
Extenstion Director (2070*110%) 13,662 13,662 Accountant (2070) 12,420 12,420 Administrative Assistant (2070*85%) 10,560 10,560 Social Media Specialist Social Network Specialist (2070)
12,420 12,420 Security officers 2,400 2,400 Custodian 2,400 2,400 Faculty @ 60 per hour 14,175 14,175 Payroll Expenses 22,500 22,500 Total 77,045 131,625 231,170

118:
Prepared by Annick M. Brennen, M.A., Action Consultant
Fe
br
ua
ry
8,
20
13
Pro-Forma Cash Flow
Three scenarios were utilized to forecast revenues and expenditures for a four-year period in the pro-forma cash flow. Revenues are generated from undergraduate, graduate, college readiness, and continuing education tuition and fees. The plan assumes that the SBC will not borrow money to fund for capital and operating expenditures.
The first scenario utilizes the current NCU tuition undergraduate tuition of $280 per credit and an average graduate tuition of $353 per credit. Fees are those listed in the NCU Bulletin.
The second scenario incorporates undergraduate tuition of $205 per credit and an average graduate tuition of $450 per credit. Fees remain the same.
The third scenario includes undergraduate tuition of $159 per credit and an average graduate tuition of $600 per credit. Fees remain the same.

Assumptions for Scenario 1
Sem 1
Sem 2
Sum 1
Sem 3
Sem 4
Sum 2
Sem 5
Sem 6
Sum Sem
7 Sem
8 Sum
3
Undergraduate Tuition 280
Undergraduate Enrollment 50 50 30 150 150 40 250 250 50 300 300 60
Number of undergraduate credits 150 150 90 450 450 120 750 750 150 900 900 180
Graduate Tuition (Average) 353
Graduate Enrollment 20 20 40 100 100 60 150 150 60 200 200 80
Number of graduate credits 60 60 120 300 300 180 450 450 180 600 600 240
Continuing Education Enrolment 20 20 30 40 40 45 50 50 45 60 60 50
Continuing Education Credits 60 60 90 120 120 135 150 150 135 180 180 150
College Readiness Enrolment 15 15 20 25 25 30 35 35 35 40 40 45
College Readiness Credits 45 45 60 75 75 90 105 105 105 120 120 135
Total Enrolment 105 105 120 315 315 175 485 485 190 600 600 235
New Applications
15 195
170
115
Application Fees 30
General Fees (E-library, computer lab, and
general usage) 352
Health Insurance per Sem 65
Accident Insurance per year 6
Copyright Fee 12
Continuing Education Fee 280
Number of Faculty Undergraduate and
Graduate 5 5 6 16 16 9 24 24 10 30 30 12
Hours Worked per Semester 236 236 270 709 709 394 109
1 1091 428 1350 1350 529
Hourly wage 60
Director's Monthly Salary 2277
Accountant monthly salary 2070
Social network specialist's monthly salary 2070
Administrative assistant monthly salary 1760

120:
Prepared by Annick M. Brennen, M.A., Action Consultant
Fe
br
ua
ry
8,
20
13
Assumptions for Scenario 1
Sem 1
Sem
2
Sum
1
Sem
3
Sem
4
Sum
2
Sem
5
Sem
6 Sum
Sem
7
Sem
8
Sum
3
Number of months in semester 5
Number of months in summer 3
NIB per employee 162
Bahama Health per employee 330
Depreciation (for Director & Social Network
Specialist) 1248
Travel (for Director & Social Network
Specialist) 1208
Auto License (for Director & Social Network
Specialist) 390
Number of employees 4
Security Officers' Wages per hour 5
Custodian's Wages per hour 5
Number of hours worked per week 20
Custodial Supplies per month 200
Office rental per month 600
Classrooms Rental per month 600
Number of Rooms Used 4 4 4 11 11 6 16 16 6 20 20 8
Computer Lab/E-libraries per month 2400
Electricity and water per month 800
Telecommunication services per month 270
Copier rental per month 1075
Copier consumables 850
Program allocation 10%
Marketing budget allocation (except sem 1) 5%

121:
Prepared by Annick M. Brennen, M.A., Action Consultant
Fe
br
ua
ry
8,
20
13
Pro Forma Cash Flow Scenario 1
Sem 1 Sem 2 Sum 1 Sem 3 Sem 4 Sum 2
Cash Received
Tuition--Undergraduate 42,000 42,000 25,200 126,000 126,000 33,600
Tuition--Graduate 7,060 21,180 42,360 105,900 105,900 63,540
Continuing Education 16,800 16,800 25,200 33,600 33,600 37,800
College Readiness 12,600 12,600 16,800 21,000 21,000 25,200
Application Fees 3,150 - 450 5,850 - -
General Fees 36,960 - - - - -
Health Insurance 6,825 6,825 7,800 20,475 20,475 11,375
Accident Insurance 630 - - 1,890 - -
Copyright Fee 1,260 - - 6,180 - -
Total Cash Received 127,285 99,405 117,810 320,895 306,975 171,515
Expenditures Sem 1 Sem 2 Sum 1 Sem 3 Sem 4 Sum 2
Salaries/Wages
Administrator 11,385 11,385 6,831 11,385 11,385 6,831
Accountant 10,350 10,350 6,210 10,350 10,350 6,210
Social Network Specialist 10,350 10,350 6,210 10,350 10,350 6,210
Administrative Assistant 8,800 8,800 8,800 8,800 8,800 8,800
Faculty Contracts 14,175 14,175 16,200 42,525 42,525 23,625
Security Wages 2,000 2,000 1,200 2,000 2,000 1,200
Custodian 2,000 2,000 1,200 2,000 2,000 1,200
Subtotal Spent on Salaries & Wages 59,060 59,060 46,651 87,410 87,410 54,076
Payroll Expenses
National Insurance Contributions 3,230 3,230 1,938 3,230 3,230 1,938
Health Insurance 6,600 6,600 3,960 6,600 6,600 3,960
Depreciation 6,240 6,240 3,744 6,240 6,240 3,744
Travel 6,040 6,040 3,624 6,040 6,040 3,624
Auto License 390
390
Subtotal Spent on Payroll Expenses 22,500 22,110 13,266 22,500 22,110 13,266
Utilities and Facilities
Classrooms Rental 10,500 10,500 7,200 31,500 31,500 10,500

122:
Prepared by Annick M. Brennen, M.A., Action Consultant
Fe
br
ua
ry
8,
20
13
Pro Forma Cash Flow Scenario 1
Sem 1 Sem 2 Sum 1 Sem 3 Sem 4 Sum 2
Computer Lab and e-Library 12,000 12,000 12,000 12,000 12,000 7,200
Office 3,000 3,000 1,800 3,000 3,000 1,800
Light and Water 4,000 4,000 2,400 4,000 4,000 2,400
Custodial Supplies 1,000 1,000 600 1,000 1,000 600
Telecommunication Services 1,350 1,350 810 1,350 1,350 810
Copier Rental 5,375 5,375 3,225 5,375 5,375 3,225
Copier Consumables 1,700 1,700 850 1,700 1,700 850
Total Spent on Utilities and Facilities 38,925 38,925 28,885 59,925 59,925 27,385
Marketing and Program Allocations
- - - - -
Marketing Budget 25,000 4,970 5,891 16,045 15,349 8,576
Program Allocations 12,729 9,941 11,781 32,090 30,698 17,152
Total Spent on Marketing & Program Allocations 37,729 14,911 17,672 48,134 46,046 25,727
Students' Insurance Expense 7,455 6,825 7,800 22,365 20,475 11,375
Total Expenditures 165,668 141,830 114,273 240,334 235,966 131,829
Net Cash Flow (38,383) (42,425) 3,537 80,561 71,009 39,686
Cash Balance (38,383) (80,808 (77,272) 3,280 74,299 113,985

123:
Prepared by Annick M. Brennen, M.A., Action Consultant
Fe
br
ua
ry
8,
20
13
Pro Forma Cash Flow Scenario 1
Sem 5 Sem 6 Sum 3 Sem 7 Sem 8 Sum 4
Cash Received
Tuition--Undergraduate 210,000 210,000 42,000 252,000 252,000 50,400
Tuition--Graduate 158,850 158,850 63,540 211,800 211,800 84,720
Continuing Education 42,000 42,000 37,800 50,400 50,400 42,000
College Readiness 29,400 29,400 29,400 33,600 33,600 37,800
Application Fees 5,100 - - 3,450 - -
General Fees 170,720 - - 211,200 - -
Health Insurance 31,525 31,525 6,825 39,000 39,000 -
Accident Insurance 2,910 - - 3,600 - -
Copyright Fee 5,820 - - 7,200 - -
Total Cash Received 656,325 471,775 179,565 812,250 586,800 214,920
Expenditures Sem 5 Sem 6 Sum 3 Sem 7 Sem 8 Sum 4
Salaries/Wages
Administrator 11,385 11,385 6,831 11,385 11,385 6,831
Accountant 10,350 10,350 6,210 10,350 10,350 6,210
Social Network Specialist 10,350 10,350 6,210 10,350 10,350 6,210
Administrative Assistant 8,800 8,800 8,800 8,800 8,800 8,800
Faculty Contracts 65,475 65,475 25,650 81,000 81,000 31,725
Security Wages 2,000 2,000 1,200 2,000 2,000 1,200
Custodian 2,000 2,000 1,200 2,000 2,000 1,200
Subtotal Spent on Salaries & Wages 110,360 110,360 56,101 125,885 125,885 62,176
Payroll Expenses
National Insurance Contributions 3,230 3,230 1,938 3,230 3,230 1,938
Health Insurance 6,600 6,600 3,960 6,600 6,600 3,960
Depreciation 6,240 6,240 3,744 6,240 6,240 3,744
Travel 6,040 6,040 3,624 6,040 6,040 3,624
Auto License 390
390
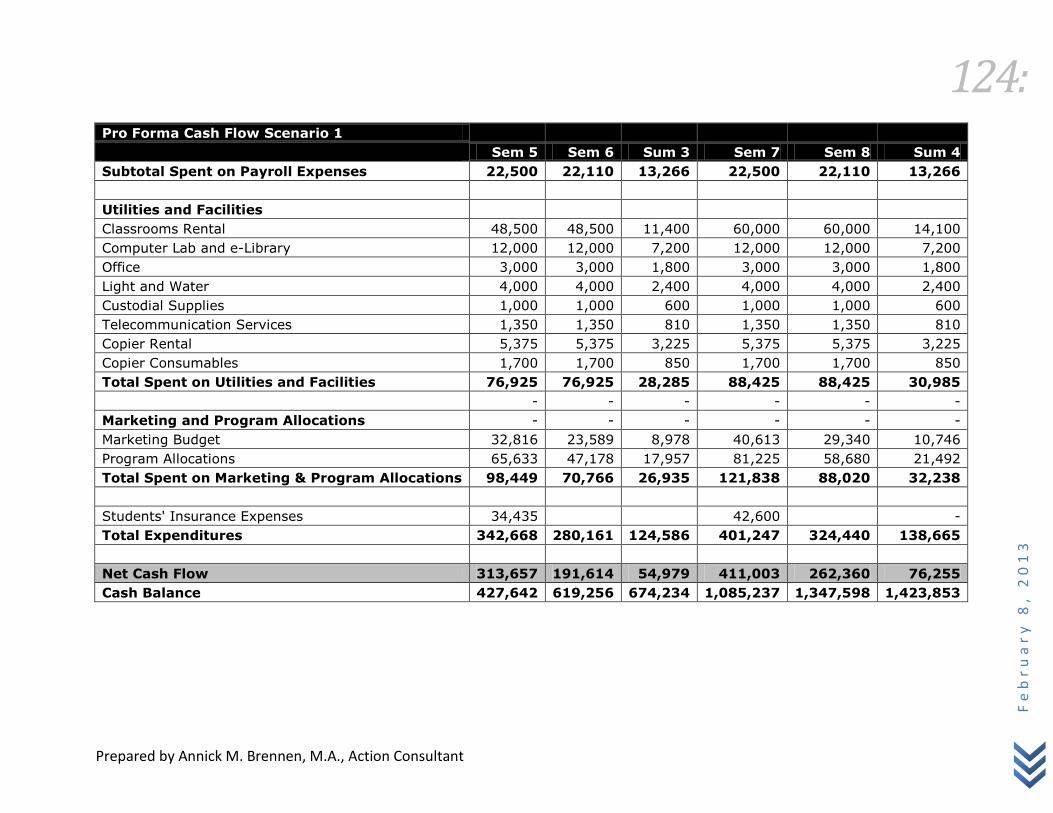
124:
Prepared by Annick M. Brennen, M.A., Action Consultant
Fe
br
ua
ry
8,
20
13
Pro Forma Cash Flow Scenario 1
Sem 5 Sem 6 Sum 3 Sem 7 Sem 8 Sum 4
Subtotal Spent on Payroll Expenses 22,500 22,110 13,266 22,500 22,110 13,266
Utilities and Facilities
Classrooms Rental 48,500 48,500 11,400 60,000 60,000 14,100
Computer Lab and e-Library 12,000 12,000 7,200 12,000 12,000 7,200
Office 3,000 3,000 1,800 3,000 3,000 1,800
Light and Water 4,000 4,000 2,400 4,000 4,000 2,400
Custodial Supplies 1,000 1,000 600 1,000 1,000 600
Telecommunication Services 1,350 1,350 810 1,350 1,350 810
Copier Rental 5,375 5,375 3,225 5,375 5,375 3,225
Copier Consumables 1,700 1,700 850 1,700 1,700 850
Total Spent on Utilities and Facilities 76,925 76,925 28,285 88,425 88,425 30,985
- - - - - -
Marketing and Program Allocations - - - - - -
Marketing Budget 32,816 23,589 8,978 40,613 29,340 10,746
Program Allocations 65,633 47,178 17,957 81,225 58,680 21,492
Total Spent on Marketing & Program Allocations 98,449 70,766 26,935 121,838 88,020 32,238
Students' Insurance Expenses 34,435
42,600
-
Total Expenditures 342,668 280,161 124,586 401,247 324,440 138,665
Net Cash Flow 313,657 191,614 54,979 411,003 262,360 76,255
Cash Balance 427,642 619,256 674,234 1,085,237 1,347,598 1,423,853

125:
Prepared by Annick M. Brennen, M.A., Action Consultant
Fe
br
ua
ry
8,
20
13
Pro Forma Cash Flow Scenario 1
Cash Received FY1 FY2 FY3 FY 4
Tuition—Undergraduate 109,200 285,600 462,000 554,400
Tuition—Graduate 70,600 275,340 381,240 508,320
Continuing Education 58,800 105,000 121,800 142,800
College Readiness 42,000 67,200 88,200 105,000
Application Fees 3,600 5,850 5,100 3,450
General Fees 36,960 - 170,720 211,200
Health Insurance 21,450 52,325 69,875 78,000
Accident Insurance 630 1,890 2,910 3,600
Copyright Fee 1,260 6,180 5,820 7,200
Total Cash Received 344,500 799,385 1,307,665 1,613,970
Expenditures
Salaries/Wages FY1 FY2 FY3 FY 4
Administrator 29,601 29,601 29,601 29,601
Accountant 26,910 26,910 26,910 26,910
Social Network Specialist 26,910 26,910 26,910 26,910
Administrative Assistant 26,400 26,400 26,400 26,400
Faculty Contracts 44,550 108,675 156,600 193,725
Security Wages 5,200 5,200 5,200 5,200
Custodian 5,200 5,200 5,200 5,200
Subtotal Spent on Salaries & Wages 164,771 228,896 276,821 313,946
Payroll Expenses
National Insurance Contributions 8,398 8,398 8,398
Health Insurance 17,160 17,160 17,160 17,160
Depreciation 16,224 16,224 16,224 16,224
Travel 15,704 15,704 15,704 15,704
Auto License 390 390 390 390
Subtotal Spent on Payroll Expenses 57,876 57,876 57,876 49,478
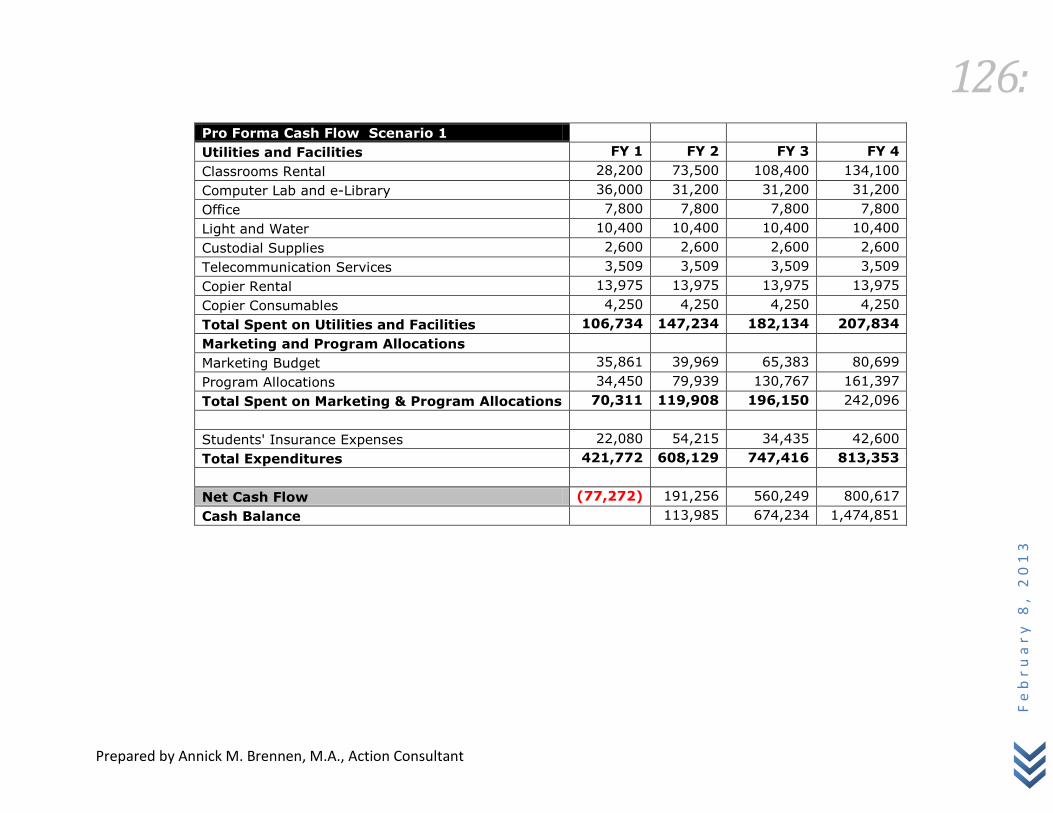
126:
Prepared by Annick M. Brennen, M.A., Action Consultant
Fe
br
ua
ry
8,
20
13
Pro Forma Cash Flow Scenario 1
Utilities and Facilities FY 1 FY 2 FY 3 FY 4
Classrooms Rental 28,200 73,500 108,400 134,100
Computer Lab and e-Library 36,000 31,200 31,200 31,200
Office 7,800 7,800 7,800 7,800
Light and Water 10,400 10,400 10,400 10,400
Custodial Supplies 2,600 2,600 2,600 2,600
Telecommunication Services 3,509 3,509 3,509 3,509
Copier Rental 13,975 13,975 13,975 13,975
Copier Consumables 4,250 4,250 4,250 4,250
Total Spent on Utilities and Facilities 106,734 147,234 182,134 207,834
Marketing and Program Allocations
Marketing Budget 35,861 39,969 65,383 80,699
Program Allocations 34,450 79,939 130,767 161,397
Total Spent on Marketing & Program Allocations 70,311 119,908 196,150 242,096
Students' Insurance Expenses 22,080 54,215 34,435 42,600
Total Expenditures 421,772 608,129 747,416 813,353
Net Cash Flow (77,272) 191,256 560,249 800,617
Cash Balance 113,985 674,234 1,474,851

127:
Prepared by Annick M. Brennen, M.A., Action Consultant
Fe
br
ua
ry
8,
20
13
Assumptions for Scenario 2
Sem
1
Sem
2
Sum
1
Sem
3
Sem
4
Sum
2
Sem
5
Sem
6
Sum
3
Sem
7
Sem
8
Sum
4
Undergraduate tuition 205
Undergraduate enrollment 50 50 30 150 150 40 250 250 50 300 300 60
Number of undergraduate credits 150 150 90 450 450 120 750 750 150 900 900 180
Graduate tuition (average) 450
Graduate enrollment 20 20 40 100 100 60 150 150 60 200 200 80
Number of graduate credits 60 60 120 300 300 180 450 450 180 600 600 240
Continuing education enrolment 20 20 30 40 40 45 50 50 45 60 60 50
Continuing education credits 60 60 90 120 120 135 150 150 135 180 180 150
College readiness enrolment 15 15 20 25 25 30 35 35 35 40 40 45
College readiness credits 45 45 60 75 75 90 105 105 105 120 120 135
Total enrolment 105 105 120 315 315 175 485 485 190 600 600 235
New applications 15 195 170 115
Application fees 30
General fees (e-library, computer lab, and
general usage) 352
Health insurance per semester 65
Accident insurance per year 6
Copyright fee 12
Continuing education fee 205
Number of faculty undergraduate and
graduate 5 5 6 16 16 9 24 24 10 30 30 12
Hours worked per semester 236 236 270 709 709 394 1091 1091 428 1350 1350 529
Hourly wage 60
Director's monthly salary 2277
Accountant monthly salary 2070
Social network specialist's monthly salary 2070

128:
Prepared by Annick M. Brennen, M.A., Action Consultant
Fe
br
ua
ry
8,
20
13
Assumptions for Scenario 2
Sem
1
Sem
2
Sum
1
Sem
3
Sem
4
Sum
2
Sem
5
Sem
6
Sum
3
Sem
7
Sem
8
Sum
4
Administrative assistant monthly salary 1760
Number of months in semester 5
Number of months in summer 3
Nib per employee 162
Bahama health per employee 330
Depreciation (for director & social network
specialist) 1248
Travel (for director & social network
specialist) 1208
Auto license (for director & social network
specialist) 390
Number of employees 4
Security officers' wages per hour 5
Custodian's wages per hour 5
Number of hours worked per week 20
Custodial supplies per month 200
Office rental per month 600
Classrooms rental per month 600
Number of rooms used 4 4 4 11 11 6 16 16 6 20 20 8
Computer lab/e-libraries per month 2400
Electricity and water per month 800
Telecommunication services per month 270
Copier rental per month 1075
Copier consumables 850
Program allocation 10%
Marketing budget allocation (except sem 1) 5%

129:
Prepared by Annick M. Brennen, M.A., Action Consultant
Fe
br
ua
ry
8,
20
13
Pro Forma Cash Flow Scenario 2
Sem 1 Sem 2 Sum 1 Sem 3 Sem 4 Sum 2
Cash Received
Tuition—Undergraduate 30,750 30,750 18,450 92,250 92,250 24,600
Tuition—Graduate 9,000 27,000 54,000 135,000 135,000 81,000
Continuing Education 12,300 12,300 18,450 24,600 24,600 27,675
College Readiness 9,225 9,225 12,300 15,375 15,375 18,450
Application Fees 3,150 0 450 5,850 0 0
General Fees 36,960 0 0 0 0 0
Health Insurance 6,825 6,825 7,800 20,475 20,475 11,375
Accident Insurance 630 0 0 1,890 0 0
Copyright Fee 1,260 0 0 6,180 0 0
Total Cash Received 110,100 86,100 111,450 301,620 287,700 163,100
Expenditures Sem 1 Sem 2 Sum 1 Sem 3 Sem 4 Sum 2
Salaries/Wages
Administrator 11,385 11,385 6,831 11,385 11,385 6,831
Accountant 10,350 10,350 6,210 10,350 10,350 6,210
Social Network Specialist 10,350 10,350 6,210 10,350 10,350 6,210
Administrative Assistant 8,800 8,800 8,800 8,800 8,800 8,800
Faculty Contracts 14,175 14,175 16,200 42,525 42,525 23,625
Security Wages 2,000 2,000 1,200 2,000 2,000 1,200
Custodian 2,000 2,000 1,200 2,000 2,000 1,200
Subtotal Spent on Salaries & Wages 59,060 59,060 46,651 87,410 87,410 54,076
Payroll Expenses
National Insurance Contributions 3,230 3,230 1,938 3,230 3,230 1,938
Health Insurance 6,600 6,600 3,960 6,600 6,600 3,960
Depreciation 6,240 6,240 3,744 6,240 6,240 3,744
Travel 6,040 6,040 3,624 6,040 6,040 3,624
Auto License 390 390
Subtotal Spent on Payroll Expenses 22,500 22,110 13,266 22,500 22,110 13,266
Utilities and Facilities
Classrooms Rental 10,500 10,500 7,200 31,500 31,500 10,500

130:
Prepared by Annick M. Brennen, M.A., Action Consultant
Fe
br
ua
ry
8,
20
13
Pro Forma Cash Flow Scenario 2
Sem 1 Sem 2 Sum 1 Sem 3 Sem 4 Sum 2
Computer Lab and e-Library 12,000 12,000 12,000 12,000 12,000 7,200
Office 3,000 3,000 1,800 3,000 3,000 1,800
Light and Water 4,000 4,000 2,400 4,000 4,000 2,400
Custodial Supplies 1,000 1,000 600 1,000 1,000 600
Telecommunication Services 1,350 1,350 810 1,350 1,350 810
Copier Rental 5,375 5,375 3,225 5,375 5,375 3,225
Copier Consumables 1,700 1,700 850 1,700 1,700 850
Total Spent on Utilities and Facilities 38,925 38,925 28,885 59,925 59,925 27,385
Marketing and Program Allocations 0 0 0 0 0
Marketing Budget 25,000 4,305 5,573 15,081 14,385 8,155
Program Allocations 11,010 8,610 11,145 30,162 28,770 16,310
Total Spent on Marketing & Program Allocations 36,010 12,915 16,718 45,243 43,155 24,465
Students' Insurance Expenses 7,455 6,825 7,800 22,365 20,475 11,375
Total Expenditures 163,950 139,835 113,319 237,443 233,075 130,567
Net Cash Flow (53,850) (53,735) (1,869) 64,177 54,625 32,533
Cash Balance (53,850) (107,584) (109,453) (45,276) 9,350 41,883

131:
Prepared by Annick M. Brennen, M.A., Action Consultant
Fe
br
ua
ry
8,
20
13
Pro Forma Cash Flow Scenario 2
Sem 5 Sem 6 Sum 3 Sem 7 Sem 8 Sum 4
Cash Received
Tuition—Undergraduate 153,750 153,750 30,750 184,500 184,500 36,900
Tuition—Graduate 202,500 202,500 81,000 270,000 270,000 108,000
Continuing Education 30,750 30,750 27,675 36,900 36,900 30,750
College Readiness 21,525 21,525 21,525 24,600 24,600 27,675
Application Fees 5,100 0 0 3,450 0 0
General Fees 170,720 0 0 211,200 0 0
Health Insurance 31,525 31,525 6,825 39,000 39,000 0
Accident Insurance 2,910 0 0 3,600 0 0
Copyright Fee 5,820 0 0 7,200 0 0
Total Cash Received 624,600 440,050 167,775 780,450 555,000 203,325
Expenditures Sem 5 Sem 6 Sum 3 Sem 7 Sem 8 Sum 4
Salaries/Wages
Administrator 11,385 11,385 6,831 11,385 11,385 6,831
Accountant 10,350 10,350 6,210 10,350 10,350 6,210
Social Network Specialist 10,350 10,350 6,210 10,350 10,350 6,210
Administrative Assistant 8,800 8,800 8,800 8,800 8,800 8,800
Faculty Contracts 65,475 65,475 25,650 81,000 81,000 31,725
Security Wages 2,000 2,000 1,200 2,000 2,000 1,200
Custodian 2,000 2,000 1,200 2,000 2,000 1,200
Subtotal Spent on Salaries & Wages 110,360 110,360 56,101 125,885 125,885 62,176
Payroll Expenses
National Insurance Contributions 3,230 3,230 1,938 3,230 3,230 1,938
Health Insurance 6,600 6,600 3,960 6,600 6,600 3,960
Depreciation 6,240 6,240 3,744 6,240 6,240 3,744
Travel 6,040 6,040 3,624 6,040 6,040 3,624
Auto License 390 390
Subtotal Spent on Payroll Expenses 22,500 22,110 13,266 22,500 22,110 13,266
Utilities and Facilities
Classrooms Rental 48,500 48,500 11,400 60,000 60,000 14,100

132:
Prepared by Annick M. Brennen, M.A., Action Consultant
Fe
br
ua
ry
8,
20
13
Pro Forma Cash Flow Scenario 2
Sem 5 Sem 6 Sum 3 Sem 7 Sem 8 Sum 4
Computer Lab and e-Library 12,000 12,000 7,200 12,000 12,000 7,200
Office 3,000 3,000 1,800 3,000 3,000 1,800
Light and Water 4,000 4,000 2,400 4,000 4,000 2,400
Custodial Supplies 1,000 1,000 600 1,000 1,000 600
Telecommunication Services 1,350 1,350 810 1,350 1,350 810
Copier Rental 5,375 5,375 3,225 5,375 5,375 3,225
Copier Consumables 1,700 1,700 850 1,700 1,700 850
Total Spent on Utilities and Facilities 76,925 76,925 28,285 88,425 88,425 30,985
Marketing and Program Allocations
Marketing Budget 31,230 22,003 8,389 39,023 27,750 10,166
Program Allocations 62,460 44,005 16,778 78,045 55,500 20,333
Total Spent on Marketing & Program Allocations 93,690 66,008 25,166 117,068 83,250 30,499
Students' Insurance Expenses 34,435 42,600 0
Total Expenditures 337,910 275,402 122,818 396,477 319,670 136,925
Net Cash Flow 286,690 164,648 44,957 383,973 235,330 66,400
Cash Balance 328,573 493,221 538,178 922,151 1,157,482 1,223,881

133:
Prepared by Annick M. Brennen, M.A., Action Consultant
Fe
br
ua
ry
8,
20
13
Pro Forma Cash Flow Scenario 2
FY 1 FY 2 FY 3 FY 4
Cash Received
Tuition—Undergraduate 79,950 209,100 338,250 405,900
Tuition—Graduate 90,000 351,000 486,000 648,000
Continuing Education 43,050 76,875 89,175 104,550
College Readiness 30,750 49,200 64,575 76,875
Application Fees 3,600 5,850 5,100 3,450
General Fees 36,960 0 170,720 211,200
Health Insurance 21,450 52,325 69,875 78,000
Accident Insurance 630 1,890 2,910 3,600
Copyright Fee 1,260 6,180 5,820 7,200
Total Cash Received 307,650 752,420 1,232,425 1,538,775
Expenditures FY1 FY2 FY3 FY 4
Salaries/Wages
Administrator 29,601 29,601 29,601 29,601
Accountant 26,910 26,910 26,910 26,910
Social Network Specialist 26,910 26,910 26,910 26,910
Administrative Assistant 26,400 26,400 26,400 26,400
Faculty Contracts 44,550 108,675 156,600 193,725
Security Wages 5,200 5,200 5,200 5,200
Custodian 5,200 5,200 5,200 5,200
Subtotal Spent on Salaries & Wages 164,771 228,896 276,821 313,946
Payroll Expenses
National Insurance Contributions 8,398 8,398 8,398
Health Insurance 17,160 17,160 17,160 17,160
Depreciation 16,224 16,224 16,224 16,224
Travel 15,704 15,704 15,704 15,704
Auto License 390 390 390 390
Subtotal Spent on Payroll Expenses 57,876 57,876 57,876 49,478
Utilities and Facilities
Classrooms Rental 28,200 73,500 108,400 134,100

134:
Prepared by Annick M. Brennen, M.A., Action Consultant
Fe
br
ua
ry
8,
20
13
Pro Forma Cash Flow Scenario 2
FY 1 FY 2 FY 3 FY 4
Computer Lab and e-Library 36,000 31,200 31,200 31,200
Office 7,800 7,800 7,800 7,800
Light and Water 10,400 10,400 10,400 10,400
Custodial Supplies 2,600 2,600 2,600 2,600
Telecommunication Services 3,509 3,509 3,509 3,509
Copier Rental 13,975 13,975 13,975 13,975
Copier Consumables 4,250 4,250 4,250 4,250
Total Spent on Utilities and Facilities 106,734 147,234 182,134 207,834
Marketing and Program Allocations
Marketing Budget 34,878 37,621 61,621 76,939
Program Allocations 30,765 75,242 123,243 153,878
Total Spent on Marketing & Program
Allocations 65,643 112,863 184,864 230,816
Students' Insurance Expenses 22,080 54,215 34,435 42,600
Total Expenditures 417,103 601,084 736,130 802,074
Net Cash Flow (109,4530 151,336 496,295 736,701
Cash Balance 41,883 538,178 1,274,879
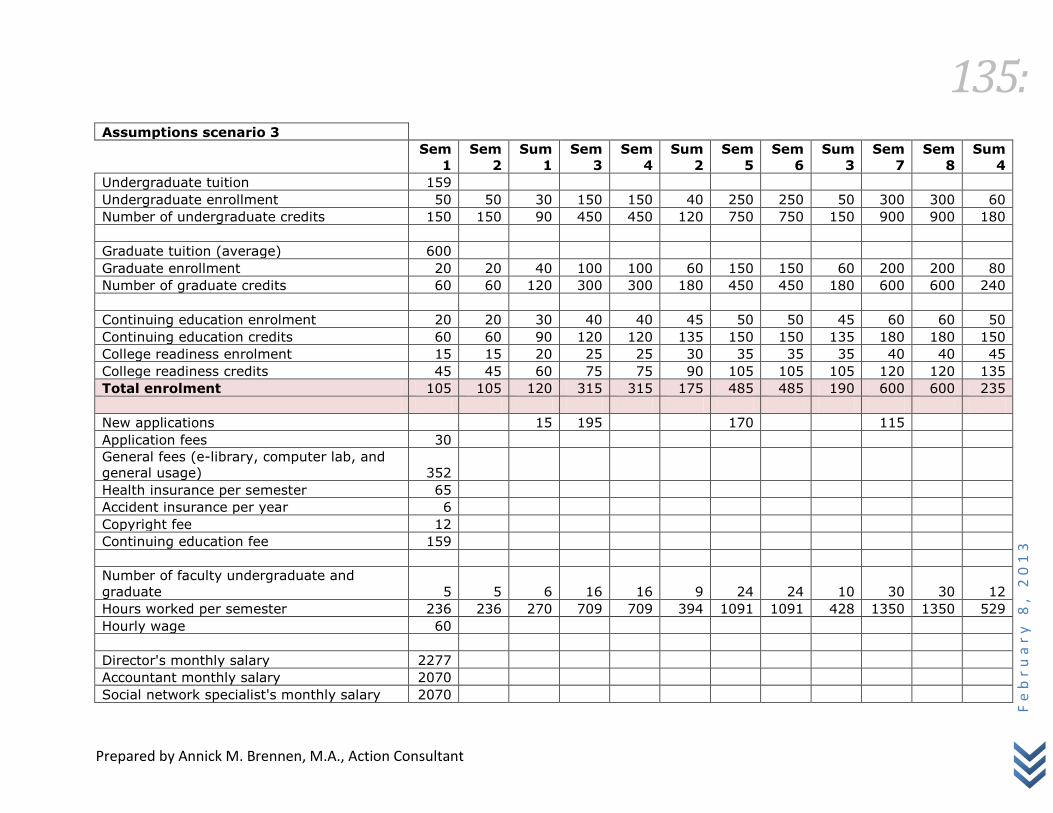
135:
Prepared by Annick M. Brennen, M.A., Action Consultant
Fe
br
ua
ry
8,
20
13
Assumptions scenario 3
Sem
1
Sem
2
Sum
1
Sem
3
Sem
4
Sum
2
Sem
5
Sem
6
Sum
3
Sem
7
Sem
8
Sum
4
Undergraduate tuition 159
Undergraduate enrollment 50 50 30 150 150 40 250 250 50 300 300 60
Number of undergraduate credits 150 150 90 450 450 120 750 750 150 900 900 180
Graduate tuition (average) 600
Graduate enrollment 20 20 40 100 100 60 150 150 60 200 200 80
Number of graduate credits 60 60 120 300 300 180 450 450 180 600 600 240
Continuing education enrolment 20 20 30 40 40 45 50 50 45 60 60 50
Continuing education credits 60 60 90 120 120 135 150 150 135 180 180 150
College readiness enrolment 15 15 20 25 25 30 35 35 35 40 40 45
College readiness credits 45 45 60 75 75 90 105 105 105 120 120 135
Total enrolment 105 105 120 315 315 175 485 485 190 600 600 235
New applications 15 195 170 115
Application fees 30
General fees (e-library, computer lab, and
general usage) 352
Health insurance per semester 65
Accident insurance per year 6
Copyright fee 12
Continuing education fee 159
Number of faculty undergraduate and
graduate 5 5 6 16 16 9 24 24 10 30 30 12
Hours worked per semester 236 236 270 709 709 394 1091 1091 428 1350 1350 529
Hourly wage 60
Director's monthly salary 2277
Accountant monthly salary 2070
Social network specialist's monthly salary 2070
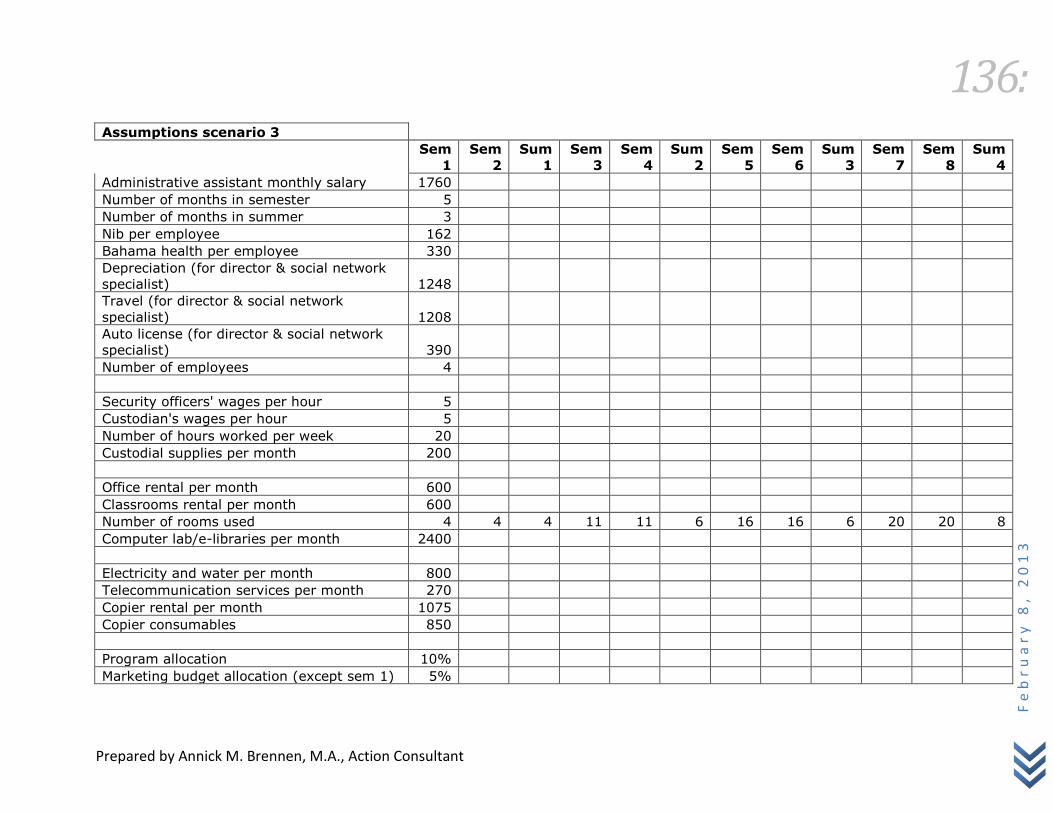
136:
Prepared by Annick M. Brennen, M.A., Action Consultant
Fe
br
ua
ry
8,
20
13
Assumptions scenario 3
Sem
1
Sem
2
Sum
1
Sem
3
Sem
4
Sum
2
Sem
5
Sem
6
Sum
3
Sem
7
Sem
8
Sum
4
Administrative assistant monthly salary 1760
Number of months in semester 5
Number of months in summer 3
Nib per employee 162
Bahama health per employee 330
Depreciation (for director & social network
specialist) 1248
Travel (for director & social network
specialist) 1208
Auto license (for director & social network
specialist) 390
Number of employees 4
Security officers' wages per hour 5
Custodian's wages per hour 5
Number of hours worked per week 20
Custodial supplies per month 200
Office rental per month 600
Classrooms rental per month 600
Number of rooms used 4 4 4 11 11 6 16 16 6 20 20 8
Computer lab/e-libraries per month 2400
Electricity and water per month 800
Telecommunication services per month 270
Copier rental per month 1075
Copier consumables 850
Program allocation 10%
Marketing budget allocation (except sem 1) 5%

137:
Prepared by Annick M. Brennen, M.A., Action Consultant
Fe
br
ua
ry
8,
20
13
Pro Forma Cash Flow Scenario 3
Sem 1 Sem 2 Sum 1 Sem 3 Sem 4 Sum 2
Cash Received
Tuition--Undergraduate 23,850 23,850 14,310 71,550 71,550 19,080
Tuition--Graduate 12,000 36,000 72,000 180,000 180,000 108,000
Continuing Education 9,540 9,540 14,310 19,080 19,080 21,465
College Readiness 7,155 7,155 9,540 11,925 11,925 14,310
Application Fees 3,150 0 450 5,850 0 0
General Fees 36,960 0 0 0 0 0
Health Insurance 6,825 6,825 7,800 20,475 20,475 11,375
Accident Insurance 630 0 0 1,890 0 0
Copyright Fee 1,260 0 0 6,180 0 0
Total Cash Received 101,370 83,370 118,410 316,950 303,030 174,230
Expenditures Sem 1 Sem 2 Sum 1 Sem 3 Sem 4 Sum 2
Salaries/Wages
Administrator 11,385 11,385 6,831 11,385 11,385 6,831
Accountant 10,350 10,350 6,210 10,350 10,350 6,210
Social Network Specialist 10,350 10,350 6,210 10,350 10,350 6,210
Administrative Assistant 8,800 8,800 8,800 8,800 8,800 8,800
Faculty Contracts 14,175 14,175 16,200 42,525 42,525 23,625
Security Wages 2,000 2,000 1,200 2,000 2,000 1,200
Custodian 2,000 2,000 1,200 2,000 2,000 1,200
Subtotal Spent on Salaries & Wages 59,060 59,060 46,651 87,410 87,410 54,076
Payroll Expenses
National Insurance Contributions 3,230 3,230 1,938 3,230 3,230 1,938
Health Insurance 6,600 6,600 3,960 6,600 6,600 3,960
Depreciation 6,240 6,240 3,744 6,240 6,240 3,744
Travel 6,040 6,040 3,624 6,040 6,040 3,624
Auto License 390 390
Subtotal Spent on Payroll Expenses 22,500 22,110 13,266 22,500 22,110 13,266
Utilities and Facilities
Classrooms Rental 10,500 10,500 7,200 31,500 31,500 10,500

138:
Prepared by Annick M. Brennen, M.A., Action Consultant
Fe
br
ua
ry
8,
20
13
Pro Forma Cash Flow Scenario 3
Sem 1 Sem 2 Sum 1 Sem 3 Sem 4 Sum 2
Computer Lab and e-Library 12,000 12,000 12,000 12,000 12,000 7,200
Office 3,000 3,000 1,800 3,000 3,000 1,800
Light and Water 4,000 4,000 2,400 4,000 4,000 2,400
Custodial Supplies 1,000 1,000 600 1,000 1,000 600
Telecommunication Services 1,350 1,350 810 1,350 1,350 810
Copier Rental 5,375 5,375 3,225 5,375 5,375 3,225
Copier Consumables 1,700 1,700 850 1,700 1,700 850
Total Spent on Utilities and Facilities 38,925 38,925 28,885 59,925 59,925 27,385
Marketing and Program Allocations 0 0 0 0 0
Marketing Budget 25,000 4,169 5,921 15,848 15,152 8,712
Program Allocations 10,137 8,337 11,841 31,695 30,303 17,423
Total Spent on Marketing & Program Allocations 35,137 12,506 17,762 47,543 45,455 26,135
Students' Insurance Expenses 7,455 6,825 7,800 22,365 20,475 11,375
Total Expenditures 143,145 139,425 114,363 239,742 235,374 132,236
Net Cash Flow (41,775) (56,055) 4,047 77,208 67,656 41,994
Cash Balance (41,775) (97,830) (93,783) (16,575) 51,081 93,074
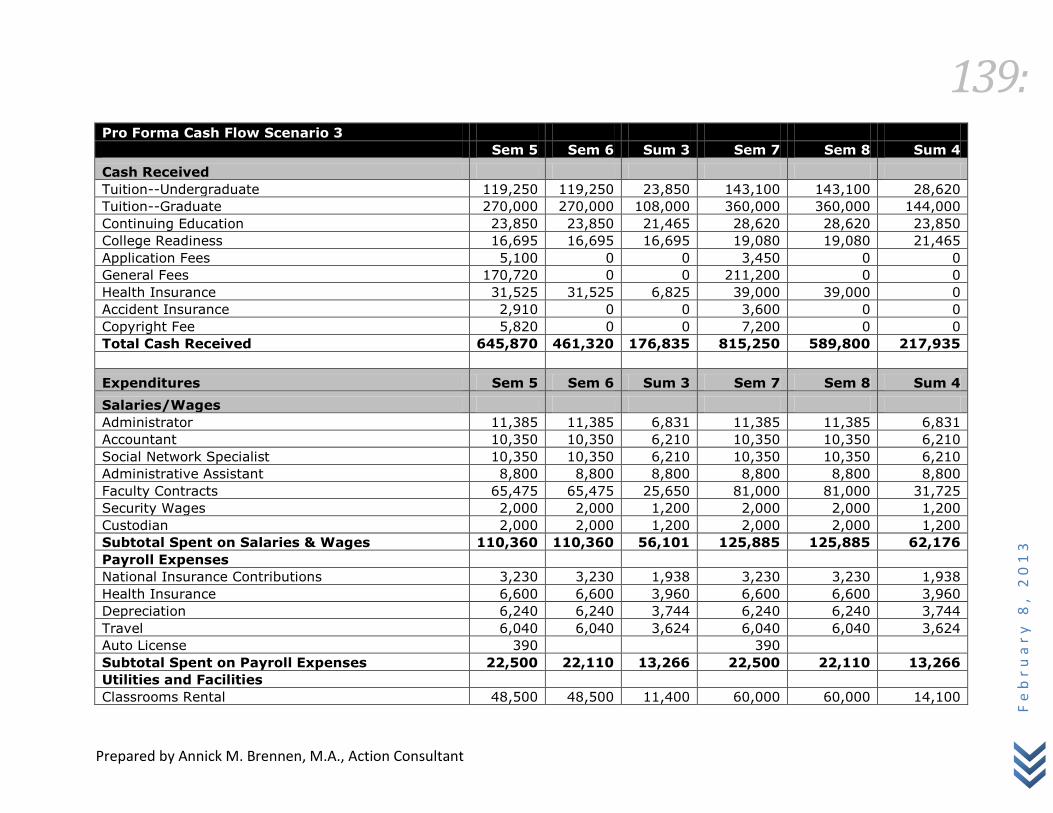
139:
Prepared by Annick M. Brennen, M.A., Action Consultant
Fe
br
ua
ry
8,
20
13
Pro Forma Cash Flow Scenario 3
Sem 5 Sem 6 Sum 3 Sem 7 Sem 8 Sum 4
Cash Received
Tuition--Undergraduate 119,250 119,250 23,850 143,100 143,100 28,620
Tuition--Graduate 270,000 270,000 108,000 360,000 360,000 144,000
Continuing Education 23,850 23,850 21,465 28,620 28,620 23,850
College Readiness 16,695 16,695 16,695 19,080 19,080 21,465
Application Fees 5,100 0 0 3,450 0 0
General Fees 170,720 0 0 211,200 0 0
Health Insurance 31,525 31,525 6,825 39,000 39,000 0
Accident Insurance 2,910 0 0 3,600 0 0
Copyright Fee 5,820 0 0 7,200 0 0
Total Cash Received 645,870 461,320 176,835 815,250 589,800 217,935
Expenditures Sem 5 Sem 6 Sum 3 Sem 7 Sem 8 Sum 4
Salaries/Wages
Administrator 11,385 11,385 6,831 11,385 11,385 6,831
Accountant 10,350 10,350 6,210 10,350 10,350 6,210
Social Network Specialist 10,350 10,350 6,210 10,350 10,350 6,210
Administrative Assistant 8,800 8,800 8,800 8,800 8,800 8,800
Faculty Contracts 65,475 65,475 25,650 81,000 81,000 31,725
Security Wages 2,000 2,000 1,200 2,000 2,000 1,200
Custodian 2,000 2,000 1,200 2,000 2,000 1,200
Subtotal Spent on Salaries & Wages 110,360 110,360 56,101 125,885 125,885 62,176
Payroll Expenses
National Insurance Contributions 3,230 3,230 1,938 3,230 3,230 1,938
Health Insurance 6,600 6,600 3,960 6,600 6,600 3,960
Depreciation 6,240 6,240 3,744 6,240 6,240 3,744
Travel 6,040 6,040 3,624 6,040 6,040 3,624
Auto License 390 390
Subtotal Spent on Payroll Expenses 22,500 22,110 13,266 22,500 22,110 13,266
Utilities and Facilities
Classrooms Rental 48,500 48,500 11,400 60,000 60,000 14,100

140:
Prepared by Annick M. Brennen, M.A., Action Consultant
Fe
br
ua
ry
8,
20
13
Pro Forma Cash Flow Scenario 3
Sem 5 Sem 6 Sum 3 Sem 7 Sem 8 Sum 4
Computer Lab and e-Library 12,000 12,000 7,200 12,000 12,000 7,200
Office 3,000 3,000 1,800 3,000 3,000 1,800
Light and Water 4,000 4,000 2,400 4,000 4,000 2,400
Custodial Supplies 1,000 1,000 600 1,000 1,000 600
Telecommunication Services 1,350 1,350 810 1,350 1,350 810
Copier Rental 5,375 5,375 3,225 5,375 5,375 3,225
Copier Consumables 1,700 1,700 850 1,700 1,700 850
Total Spent on Utilities and Facilities 76,925 76,925 28,285 88,425 88,425 30,985
Marketing and Program Allocations
Marketing Budget 32,294 23,066 8,842 40,763 29,490 10,897
Program Allocations 64,587 46,132 17,684 81,525 58,980 21,794
Total Spent on Marketing & Program Allocations 96,881 69,198 26,525 122,288 88,470 32,690
Students' Insurance Expenses 34,435 42,600 0
Total Expenditures 341,100 278,593 124,177 401,697 324,890 139,117
Net Cash Flow 304,770 182,727 52,658 413,553 264,910 78,818
Cash Balance 397,844 580,572 633,230 1,046,783 1,311,693 1,390,511

Pro Forma Cash Flow Scenario 3
FY 1 FY 2 FY 3 FY 4
Cash Received
Tuition--Undergraduate 62,010 162,180 262,350 314,820
Tuition--Graduate 120,000 468,000 648,000 864,000
Continuing Education 33,390 59,625 69,165 81,090
College Readiness 23,850 38,160 50,085 59,625
Application Fees 3,600 5,850 5,100 3,450
General Fees 36,960 0 170,720 211,200
Health Insurance 21,450 52,325 69,875 78,000
Accident Insurance 630 1,890 2,910 3,600
Copyright Fee 1,260 6,180 5,820 7,200
Total Cash Received 303,150 794,210 1,284,025 1,622,985
Expenditures FY1 FY2 FY3 FY 4
Salaries/Wages
Administrator 29,601 29,601 29,601 29,601
Accountant 26,910 26,910 26,910 26,910
Social Network Specialist 26,910 26,910 26,910 26,910
Administrative Assistant 26,400 26,400 26,400 26,400
Faculty Contracts 44,550 108,675 156,600 193,725
Security Wages 5,200 5,200 5,200 5,200
Custodian 5,200 5,200 5,200 5,200
Subtotal Spent on Salaries & Wages 164,771 228,896 276,821 313,946
Payroll Expenses
National Insurance Contributions 8,398 8,398 8,398
Health Insurance 17,160 17,160 17,160 17,160
Depreciation 16,224 16,224 16,224 16,224
Travel 15,704 15,704 15,704 15,704
Auto License 390 390 390 390
Subtotal Spent on Payroll Expenses 57,876 57,876 57,876 49,478
Utilities and Facilities
Classrooms Rental 28,200 73,500 108,400 134,100
Computer Lab and e-Library 36,000 31,200 31,200 31,200
Office 7,800 7,800 7,800 7,800

142:
Prepared by Annick M. Brennen, M.A., Action Consultant
Fe
br
ua
ry
8,
20
13
Pro Forma Cash Flow Scenario 3
FY 1 FY 2 FY 3 FY 4
Light and Water 10,400 10,400 10,400 10,400
Custodial Supplies 2,600 2,600 2,600 2,600
Telecommunication Services 3,509 3,509 3,509 3,509
Copier Rental 13,975 13,975 13,975 13,975
Copier Consumables 4,250 4,250 4,250 4,250
Total Spent on Utilities and Facilities 106,734 147,234 182,134 207,834
Marketing and Program Allocations
Marketing Budget 35,089 39,711 64,201 81,149
Program Allocations 30,315 79,421 128,403 162,299
Total Spent on Marketing & Program Allocations 65,404 119,132 192,604 243,448
Students' Insurance Expenses 22,080 54,215 34,435 42,600
Total Expenditures 396,933 607,352 743,870 814,706
Net Cash Flow (93,783) 186,858 540,155 808,279
Cash Balance 93,074 633,230 1,441,509

Break-Even Analysis
The break-even analysis is an important tool to analyze the feasibility of a business using different price and cost scenarios to pinpoint the sales volume necessary to operate at a profit. It can also be a valuable instrument later at the business develops to measure the advisability of expansion or growth.
The break-even point is the level of sales (tuition and other fees) is covered resulting in no profit or loss. Sales higher than breakeven will generate a profit; while sales lower than breakeven will generate a loss. To determine the break-even point, the cost must be divided into (1) variable costs which are costs that vary in direct proportion to a change in sales volume (in the scenarios that follow the variable costs are classroom rentals and students’ insurance expense); (2) fixed costs which are costs that are constant regardless of sales volume (salaries and wages, payroll expenses, office and computer and e-library rentals, utilities, and marketing and program allocations).
The formula to determine break-even point is:
X = FC/P-V where
X = annual sales (dollars or units)
FC = annual fixed operating expenses
P = selling price per unit or credit
V = variable cost per unit or credit
The second year of each pro-forma cash flow scenario was utilized to calculate the breakeven point for an NCU extension.
Scenario 1 Year 2 Scenario 2 Year 2 Scenario 3 Year 2
FC 370,963 364,694 370,963
P 331 312 329
V 67 67 67
Break-even Point (Annual Sales) 465,899 465,461 466,677
Below these sales levels, the NCU extension will incur a loss; beyond them, it will make a profit. Two thousand four hundred and fifteen (2415) credits were sold to 315 students to break even.

144:
Prepared by Annick M. Brennen, M.A., Action Consultant
Fe
br
ua
ry
8,
20
13
Sources Cited
2000-2010 Examinations Results adapted from BGCSE: English Language General Report on the Examination June 2010, p. 2 and Subject Trend Analysis Report, Table 2.7.
2000-2010 Examinations Results adapted from BGCSE: Mathematics General Report on the Examination June 2010, p. 23 and Subject Trend Analysis Report, Table 2.8.
Article retrieved from http://www.thenassauguardian.com/index.php?option=com_content&view
Bahamas Baptist Community College brochures collected from their office September 20, 2012.
Bahamas Baptist Community College fee structure retrieved September 20, 2012 from htpp://www.bbccbahamas-edu.com/new fee structure1
Bahamian Students’ Enrolment in the United States. http://www.iie.org/Research-and-Publications/Open-Doors/Data/International-Students/All-Places-of-Origin/Institute of International Education.
CIA World Factbook, 2011 retrieved from http://www.indexmundi.com/g/g.aspx?c=bf&v=74
College of The Bahamas Academic Catalogue 2011-2012 retrieved from http://www.cob.edu.bs/DOCS/ Catalogue1112.pdf.
Department of Statistics, 1990, 2000, and 2010 Population and Religion Tables.
Department of Statistics, Number of Households and Household Income: All Bahamas, NP and GB 2003
Department of Statistics, 1990, 2000, and 2010 Total Population by Sex and Age in Years Last Birthday All Bahamas.
Department of Statistics, All Bahamas Medium Projection Tables 2013-2030.
Department of Statistics, Labour Force and Its Components 2011 and 2012.
Department of Statistics, Number of Households and Household Income: All Bahamas, NP and GB 2011
Department of Statistics, Number of Households and Household Income: All Bahamas, NP and GB 2009
Department of Statistics, Number of Households and Household Income: All Bahamas, NP and GB 2008
145:
Prepared by Annick M. Brennen, M.A., Action Consultant
Fe
br
ua
ry
8,
20
13
Department of Statistics., Labor Market Information Newsletter, Volume 26 No. 37 December 2011, Results of Standard Examination, Bahamas General Certificate of Secondary Education (B.G.C.S.E.), By Subject and Sex: All Bahamas – 2011.
Endowment Funds retrieved from http://www.investopedia.com/terms/e/endowment-fund.asp#axzz2JP3n5XeP, January 29, 2013.
Enrollment Management in Higher Education - Defining Enrollment Management, Key Offices and Tasks in Enrollment Management, Organizational Models retrieved from http://education.stateuniversity.com/pages/1959
Enrollment-Management-in-Higher-Education.html, January 25, 2013.
Enrolment Management retrieved from http://blog.noellevitz.com/2011/06/07/survey-ranks-top-practices-marketing-student-recruitment-2011/, January 24, 2013.
Fielding, William J. & Jeannie Gibson et al. National Report on Higher Education in The Commonwealth of The Bahamas, May 2005, Revised November 2005.
Galilee College academic programs retrieved September 9, 2012 from http://galilee.0catch.com/gc/ academic.html
Galilee College fee downloaded from http://galilee.0catch.com/gc/academic.html, retrieved September 20, 2012.
http://www.cob.edu.bs/About/History.php, January 18, 2013.
Kent State University Tuition 2012-2013 retrieved October 5, 2012 from http://www.kent.edu/admissions/cost/tuition.cfm.
Ministry of Education Examination and Assessment Division. The Commonwealth of The Bahamas, National Examination Press Report, BJC & BGCSE, 2010, released 5th August, 2010, p. 2.
Ministry of Education Examination and Assessment Division. The Commonwealth of The Bahamas National Examination Press Report BJC & BGCSE, 2010, released 5th August, 2010, p. 26.
Ministry of Education Examination and Assessment Division: The Commonwealth of The Bahamas National Examination Press Report BJC & BGCSE, 2011, released 3rd August, 2011, p. 19.
Northern Caribbean University admissions requirements retrieved from http://www.ncu.edu.jm/Admissions.aspx, January 20, 2013.
Northern Caribbean University Graduate Bulletin 2008-2010, retrieved October 3, 2012 from http://www.ncu.edu.jm/Portals/0/Documents/Academics/docs/Grad_Bulletin_2008-2010.pdf.

146:
Prepared by Annick M. Brennen, M.A., Action Consultant
Fe
br
ua
ry
8,
20
13
Northern Caribbean University accredited programs retrieved from http://www.ucj.org.jm/content/accredited-programmes-and-ucj-approved-degrees, January 25, 2013.
Northern Caribbean University Fee Schedule August 2012 to July 2013, retrieved October 3, 2012 from http://www.ncu.edu.jm/Portals/0/Documents/Admissions/fsheet2012-2013.pdf
Northern Caribbean University Undergraduate Bulletin 2010-2012 retrieved September 9, 2012 from http://www.ncu.edu.jm/Portals/0/Documents/Academics/docs/ Undergraduate_Bulletin_2010-2012.pdf
Jackson-Hinds, Northern Caribbean University, Salem Runaway Bay Campus, Information for Feasibility Study, January 30, 2013.
Nova Southeastern academic programs retrieved September 19, 2012 from http://www.fischlerschool.nova.edu /prospective-students/the-bahamas
Nova Southeastern University fees retrieved from http://fischlerschool.nov.edu/current-students/academic-calendar, October 3, 2012
Omega College program brochures retrieved from http://www.omegacollegebahamas.com, September 20, 2012.
Personalized Marketing Across Multiple Channels—201, Recruiting Students in the 21st Century, 2nd Edition, retrieved January 24, 2013 from http://www.slideshare.net/DirectDevelopment/personalized-marketing-across-multiple-channels-201, Presentation from the 2012 NAGAP Conference in Austin, TX. Focused on how to recruit prospective students using an integrated marketing strategy approach.
Sojourner College academic programs retrieved September 20, 2012 from http://www.sdc.edu/admissions/undergraduate/degree-programs-ugrad.asp
Sojourner Douglass College admission data retrieved September 20, 2012 from http://www.sdc.edu/admissionss/tuition.asp#Bahamas.
Sojourner Douglass College fees retrieved from http://sdc.edu/admissions/ tuition.asp#Bahamas, September 20, 2012
South Florida University Tuition and Fees: Fall 2012 to summer 2013 retrieved October 5, 2012 from http://usfweb2.usf.edu/uco/cashaccounting/Current_Tuition.asp.
Steyn , A G W . Measuring Student Participation in the Higher Education Sector in South Africa, Institutional Research and Planning Division Stellenbosch University.
Success Training College brochures collected from their Office September 20, 2012
Success Training College fees retrieved from http://www.successtrainingcollege.net/ Accreditation.html, September 20, 2012.

147:
Prepared by Annick M. Brennen, M.A., Action Consultant
Fe
br
ua
ry
8,
20
13
The Abraham S. Fischler School of Education Catalog and Student Handbook 2012-2013, retrieved October 3, 2012 from http://www.fischlerschool.nova.edu/current-students/academic-calendar and http://www.huizenga.nova.edu/FutureStudents/Masters/Admissions.cfm#Tuition.
The College of The Bahamas fees retrieved from http://www.cob.edu.bs/Admission/ Financial.php, October 3, 2012.
The College of The Bahamas MBA programme tuition retrieved October 3, 2012 from http://www.cob.edu.bs/DOCS/MBA_Fees.pdf.
The Tribune, Business, Section B, Monday, December 31, 2012, page B1.
The Truth According to Me, http://www.thereal242.com/?page_id=868, retrieved January 18, 2013.
University of the West Indies fees retrieved from http://www.open.uwi.edu/graduate/financial-information, February 1, 2013.
University of the West Indies Open Campus fees retrieved from http://www.open.uwi.edu/undergraduate/tuition-fees, February 1, 2013.
University of the West Indies Open Campus programs retrieved February 1, 2013 from http://www.open.uwi.edu/undergraduate/programmes
Waeraas, Arild and Marianne N. Solbakk, Defining the essence of a university: lessons from higher education branding, published online: 13 June 2008. Retrieved from http://203.217.177.120/portal/images/utama/ doc/artikel/2012/02-29/defining%20the%20essense%20of%20a%20university.pdf, January 23, 2013.
Wheelock College Graduate Tuition and Fees 2012-2013, retrieved October 3, 2012 from http://www.wheelock.edu/admissions/graduate/tuition-and-fees.
Wilson, G. R. Pulling Back the Veil on Baha Mar, http://www.straighttalkbahamas.com/2010/09/pulling-back-the-veil-on-baha-mar/ retrieved October 2012.
Inter-American Division of the General Conference, Working Policy 2005-2006 edition, Miami, Florida.
Writing a Grand Proposal retrieved from http://www.wisegeek.com/what-is-a-grant-proposal.htm, January 29, 2013.