FEASIBILITY OF USING RECYCLED CONCRETE AGGREGATE IN...
219
FEASIBILITY OF USING RECYCLED CONCRETE AGGREGATE IN DENSE-GRADED AND GAP-GRADED HOT MIX ASPHALTS MOHAMMAD SAEED POURTAHMASB FACULTY OF ENGINEERING UNIVERSITY OF MALAYA KUALA LUMPUR 2016
Transcript of FEASIBILITY OF USING RECYCLED CONCRETE AGGREGATE IN...

FEASIBILITY OF USING RECYCLED CONCRETE
AGGREGATE IN DENSE-GRADED AND GAP-GRADED
HOT MIX ASPHALTS
MOHAMMAD SAEED POURTAHMASB
FACULTY OF ENGINEERING
UNIVERSITY OF MALAYA
KUALA LUMPUR
2016

ii
UNIVESRITY OF MALAYA
ORIGINAL LITERARY WORK DECLARATION
Name of Candidate: Mohammad Saeed Pourtahmasb (Passport No: I 95755701)
Registration/Matric No: KHA 090037
Name of Degree: Doctor of Philosophy
Title of Project Paper/Research Report/Dissertation/Thesis:
Feasibility of Using Recycled Concrete Aggregate in Dense-Graded and Gap-
Graded Hot Mix Asphalts
Field of Study: Highway and Transportation Engineering
I do solemnly and sincerely declare that:
(1) I am the sole author/writer of this Work;
(2) This Work is original;
(3) Any use of any work in which copyright exists was done by way of fair dealing and
for permitted purposes and any excerpt or extract from, or reference to or reproduction
of any copyright work has been disclosed expressly and sufficiently and the title of the
Work and its authorship have been acknowledged in this Work;
(4) I do not have any actual knowledge nor do I ought reasonably to know that the
making of this work constitutes an infringement of any copyright work;
(5) I hereby assign all and every rights in the copyright to this Work to the University of
Malaya (“UM”), who henceforth shall be owner of the copyright in this Work and that
any reproduction or use in any form or by any means whatsoever is prohibited without
the written consent of UM having been first had and obtained;
(6) I am fully aware that if in the course of making this Work I have infringed any
copyright whether intentionally or otherwise, I may be subject to legal action or any
other action as may be determined by UM.
Candidate’s Signature Date:
Subscribed and solemnly declared before,
Witness’s Signature Date:
Name:
Designation:

iii
ABSTRACT
In recent years, several studies have been carried out on the utilization of Construction
and Demolition (C&D) wastes in developed countries, particularly the reuse of waste
materials in new construction sectors. Both scientists and policy-makers have sought to
explore the environmental and economic advantages of waste material recycling.
Recycled Concrete Aggregate (RCA), produced from the demolition of concrete
structures such as buildings, bridges and dams, is one of the largest wastes in the world
in terms of volume. RCAs have different physical, chemical and mechanical properties
to natural aggregates. In particular, the porous structure of the concrete and cement
paste often attached to the surface of the recycled aggregates can lead to lower abrasion
resistance, lower density and higher absorption than virgin aggregates. At the same
time, there have been some recent studies showing the successful use of RCA materials
in new concrete constructions. Several studies have also been carried out on the
possibility of using RCA in base and sub-base either as unbound materials or bitumen-
treated or cement-treated granular materials.
The present study presents experimental research on the feasibility of utilizing RCAs in
stone mastic asphalt (SMA) and hot mix asphalt (HMA) mixtures for pavements. The
RCA materials under study were divided into three categories: Fine RCA (F-RCA)
containing aggregate particle sizes of 2.36 mm and smaller; Coarse RCA (C-RCA)
containing aggregate particle sizes larger than 2.36 mm; and mixtures of F-RCA and C-
RCA, called M-RCA. The Marshall mix design method was used to produce HMA and
SMA specimens containing various percentages (0%, 20%, 40%, 60% and 80% by the
weight of total mix) and sizes (coarse, fine and mix) of RCA. The volumetric and
mechanical properties of these various HMA and SMA specimens were then subjected
to a series of tests: Marshall Stability (MS), Flow, Density, Voids in Total Mix (VTM),

iv
Voids Filled with Asphalt (VFA), Voids in Mineral Aggregates (VMA), Resilient
Modulus, Loaded Wheel Tracking (Rutting), Indirect Tensile (IDT) Strength, Moisture
Susceptibility and finally Flexural Beam Fatigue tests. The outcomes were statistically
analyzed using an analysis of variances (ANOVA).
The test results indicated that, regardless of the size of the RCA particles, using RCA to
replace virgin aggregates increases the binder content needed in both HMA and SMA
mixtures. However, they also showed that, despite the significant impact of the RCA
content on the volumetric and mechanical properties of the asphalt mixtures, utilizing
up to 40% coarse, 80% fine and 40% mixed RCA in SMA, and up to 60% coarse, 50%
fine and 60% mixed RCA in HMA, can comfortably satisfy the standard requirements,
for pavements in terms of project and traffic volumes. At the same time, as SMA
mixtures are highly influenced by their aggregate characteristics, particular care needs
to be taken with regard to the properties of SMA mixtures containing RCA to ensure
these meet the desired performance criteria.

v
ABSTRAK
Kebelakangan ini, beberapa kajian telah dijalankan ke atas penggunaan terhadap
Perobohan Pembinaan (C&D) bahan buangan di negara-negara maju. Kemungkinannya
adalah, untuk menggunakan semula bahan-bahan buangan dalam sektor pembinaan
baru. Adalah menjadi tanggugjawab ahli-ahli sains dan penyelidik, serta orang-orang
yang berkuasa, untuk meneroka sisa kitar semula bahan untuk kebaikan alam sekitar
dan ekonomi. Agregat Konkrit (RCA) yang dikitar semula dianggap sebagai salah satu
daripada bahan-bahan buangan yang terbesar di seluruh dunia yang dihasilkan dengan
merobohkan struktur konkrit seperti bangunan, jambatan dan empangan. RCAs
mempunyai sifat fizikal, kimia dan sifat-sifat mekanik yang berbeza berbanding agregat
semulajadi. Struktur berliang konkrit dan pes simen yang melekat pada permukaan
agregat yang dikitar semula menyebabkan rintangan lelasan yang lebih rendah,
ketumpatan yang lebih rendah dan penyerapan yang lebih tinggi berbanding dengan
agregat virgin. Kajian baru-baru ini menunjukkan bahawa, bahan RCA telah berjaya
digunakan dalam pembinaan konkrit baru. Tambahan pula, beberapa kajian telah
dijalankan mengenai kemungkinan menggunakan RCA dalam asas dan sub-asas sama
ada bahan-bahan yang tak terbatas atau bitumen dirawat atau bahan berbutir simen
dirawat. Kajian semasa membentangkan satu kajian eksperimen mengenai kemungkinan
menggunakan agregat konkrit kitar semula (RCA) di batu asfalt warna kuning muda
(SMA) dan campuran asfalt panas (HMA). Bahan-bahan RCA telah dibahagikan kepada
tiga kategori; RCA Halus (F-RCA) yang mengandungi saiz zarah agregat 2.36 mm dan
lebih kecil, RCA Kasar (C-RCA) yang mengandungi saiz zarah agregat lebih besar
daripada 2.36 mm dan campuran F-RCA dan C-RCA bernama M-RCA. Kaedah
rekabentuk campuran Marshall digunakan untuk fabrikasi HMA dan SMA spesimen
dan isipadu dan sifat-sifat mekanik spesimen yang mengandungi pelbagai peratusan
(0%, 20%, 40%, 60% dan 80%) dan saiz (kasar, halus dan campuran) RCA telah dinilai.
vi
Hasil telah dianalisis menggunakan analisis varians (ANOVA). Hasil ujian
menunjukkan bahawa, tanpa mengira saiz tertentu RCA, menggunakan RCA untuk
menggantikan agregat virgin meningkat kandungan pengikat yang diperlukan dalam
kedua-dua HMA dan campuran SMA. Namun begitu, keputusan ujian menunjukkan
bahawa walaupun kandungan RCA member impak yang ketara ke atas sifat-sifat
volumetric dan mekanikal campuran asphalt, penggunnan sehingga 40% kasar, 80%
halus dan 40% campuran RCA dalam SMA, dan penggunaan sehingga 60% kasar, 50%
halus dan 60% campuran RCA dalam HMA, depat memenuhi keperluan standard
dengan selesa, bagi pavements dari segi projek dan jumlah trafik. Tambahan lagi,
kerana campuran SMA adalah sangat dipengaruhi oleh ciri-ciri agregat, untuk mencapai
prestasi wajar, lebih berhati-hati perlu dibuat ke atas hartanah campuran SMA
mengandungi RCA.

vii
ACKNOWLEDGMENTS
In the name of GOD, the compassionate, the merciful. This thesis becomes a reality
with the kind support and help of many individuals. I would like to extend my sincere
thanks to all those who helped me with their kindness and support during my research to
accomplish my PhD thesis.
Foremost, I want to offer this endeavor to our almighty God for the wisdom he
bestowed upon me, the strength, peace of my mind and good health in order to finish
this research.
I would like to express my gratitude towards my supervisor, Prof. Dr. Mohamed Rehan
Bin Karim for giving me the opportunity to work under his supervision which increased
my knowledge of pavement engineering considerably and without his advices and
supports this study would not have been possible. His friendship and good advices have
been invaluable to me during the hard times. His patience, flexibility, genuine caring,
concern and faith in me during the research process enabled me to attend to life while
also doing my research. He has been motivating, encouraging, and enlightening.
I would also like to acknowledge the center of research grant management, institute of
research management and monitoring of University of Malaya (UM) for providing grant
and financial support of this research.
Last but not least, I would like to express my gratitude to Neda Naderali, my wife, for
her support, encouragement, quiet patience and unwavering love. I appreciate my
family, which I owe a big debt of gratitude to them for their endless love,
encouragement and supporting me in all my pursuits.
viii
TABLE OF CONTENTS
ORIGINAL LITERARY WORK DECLARATION…………..………………………..ii
ABSTRACT…………………….………………………………………………………iii
ABSTRAK….…………………………………………………………………………...v
ACKNOWLEDGMENTS……………………………………………………………...vii
1 INTRODUCTION ................................................................................................... 1
1.1 Background .............................................................................................................. 1
1.2 Research problem statement .................................................................................... 4
1.3 Objectives of the study ............................................................................................ 5
1.4 Hypothesis ............................................................................................................... 5
1.5 Scopes of the study .................................................................................................. 6
1.6 Outlines of the thesis ............................................................................................... 7
2 LITERATURE REVIEW ....................................................................................... 9
2.1 Flexible pavements .................................................................................................. 9
2.1.1 Dense-Graded asphalt ..................................................................................... 10
2.1.2 Open-Graded Friction Course (OGFC) .......................................................... 11
2.1.3 Stone Mastic Asphalt (SMA) .......................................................................... 13
2.2 Mix design methods .............................................................................................. 15
2.2.1 Hveem mix design .......................................................................................... 17
2.2.2 Marshall mix design........................................................................................ 18
2.2.3 Superpave mix design ..................................................................................... 19
2.3 Aggregate in asphalt mixtures ............................................................................... 21
2.4 Bitumen in asphalt mixtures .................................................................................. 23

ix
2.5 Recycled Concrete Aggregate (RCA) ................................................................... 25
2.5.1 Utilization of RCA in base and sub base layers.............................................. 27
2.5.2 Utilization of RCA in hot mix asphalt mixtures ............................................. 29
2.6 Performance tests of asphalt mixtures ................................................................... 35
2.6.1 Bulk density and air voids .............................................................................. 35
2.6.2 Marshall stability and flow ............................................................................. 36
2.6.3 Resilient modulus ........................................................................................... 37
2.6.4 Permanent deformation (Rutting) ................................................................... 38
2.6.5 Indirect tensile (IDT) strength ........................................................................ 40
2.6.6 Fatigue cracking .............................................................................................. 42
3 METHODOLOGY ................................................................................................ 45
3.1 Engineering properties of the utilized materials .................................................... 45
3.1.1 Los Angeles (LA) abrasion ............................................................................. 45
3.1.2 Aggregate Impact Value (AIV) ...................................................................... 46
3.1.3 Aggregate Crushing Value (ACV) ................................................................. 46
3.1.4 Polished Stone Value (PSV) ........................................................................... 47
3.1.5 Soundness ....................................................................................................... 47
3.1.6 Flakiness and elongation index ....................................................................... 48
3.1.7 Specific gravity and absorption of aggregates ................................................ 49
3.1.8 Angularity number .......................................................................................... 50
3.1.9 Aggregate particle size distribution (Gradation) ............................................ 50
3.2 Asphalt binder tests................................................................................................ 53
x
3.3 Marshall mix design method and sample preparation ........................................... 54
3.3.1 Theoretical Maximum Density (TMD) .......................................................... 56
3.3.2 Determination of Optimum Asphalt Content (OAC) ..................................... 57
3.4 Hot Mix Asphalt (HMA) and Stone Mastic Asphalt (SMA) slab preparation ...... 58
3.5 Performance tests ................................................................................................... 59
3.5.1 Bulk density and air void ................................................................................ 59
3.5.2 Marshall stability (MS) and flow.................................................................... 60
3.5.3 Voids in Mineral Aggregates (VMA) and Voids Filled with Asphalt
(VFA)…..………………………………………………………………………….60
3.5.4 Resilient modulus (MR) .................................................................................. 61
3.5.5 Loaded Wheel Tracking (LWT) ..................................................................... 63
3.5.6 Indirect tensile (IDT) strength ........................................................................ 65
3.5.7 Moisture susceptibility .................................................................................... 66
3.5.8 Flexural beam fatigue ..................................................................................... 68
3.6 Analysis of variance (ANOVA) ............................................................................ 70
4 RESULTS AND DISCUSSION ............................................................................ 73
4.1 Introduction............................................................................................................ 73
4.2 Aggregate test results and analysis ........................................................................ 74
4.2.1 Los Angeles abrasion ...................................................................................... 74
4.2.2 Aggregate Impact Value ................................................................................. 75
4.2.3 Aggregate Crushing Value.............................................................................. 75
4.2.4 Polished Stone Value ...................................................................................... 76
4.2.5 Soundness ....................................................................................................... 77

xi
4.2.6 Flakiness and elongation index ....................................................................... 78
4.2.7 Aggregate specific gravity and water absorption ........................................... 79
4.2.8 Angularity number .......................................................................................... 80
4.3 Summary of aggregate test results ......................................................................... 81
4.4 Aggregate gradation .............................................................................................. 81
4.5 Binder test results .................................................................................................. 82
4.5.1 Penetration ...................................................................................................... 82
4.5.2 Softening point ................................................................................................ 83
4.5.3 Flash and fire point ......................................................................................... 83
4.5.4 Viscosity ......................................................................................................... 84
4.6 Summary of asphalt test results ............................................................................. 84
4.7 OAC determination of HMA and SMA mixtures.................................................. 84
4.7.1 OAC of HMA mixtures containing F-RCA ................................................... 85
4.7.2 OAC of HMA mixtures containing C-RCA ................................................... 87
4.7.3 OAC of HMA mixtures containing M-RCA .................................................. 88
4.7.4 OAC of SMA mixtures containing F-RCA .................................................... 90
4.7.5 OAC of SMA mixtures containing C-RCA .................................................... 91
4.7.6 OAC of SMA mixtures containing M-RCA ................................................... 93
4.8 Performance test results ......................................................................................... 94
4.8.1 Bulk density and air void ............................................................................... 95
4.8.2 Marshall stability (MS) and flow ................................................................... 96
4.8.3 Voids in Mineral Aggregates (VMA) and Voids Filled with Asphalt (VFA)
…………………………………………….…………………………………...…..98
xii
4.8.4 Resilient modulus (MR) ................................................................................ 100
4.8.5 Loaded Wheel Tracking (LWT) ................................................................... 101
4.8.5.1 Wheel tracking depth………………………………………..…………...101
4.8.5.2 Wheel tracking rate……………………………………………………....104
4.8.6 Indirect tensile (IDT) strength ...................................................................... 104
4.8.6.1 Indirect tensile strength of HMA mixtures……………………………....105
4.8.6.2 Indirect tensile strength of SMA mixtures…………………………….....108
4.8.7 Moisture susceptibility ................................................................................. 111
4.8.7.1 Tensile Strength Ratio of SMA and HMA mixtures containing F-
RCA...................................................................................................................112
4.8.7.2 Tensile Strength Ratio of SMA and HMA mixtures containing C-
RCA…………………………………………………………………..……….113
4.8.7.3 Tensile Strength Ratio of SMA and HMA mixtures containing M-
RCA…………………………………………………………………………...115
4.8.8 Flexural beam fatigue ................................................................................... 115
4.8.8.1 HMA flexural beam fatigue…...……………………...……………….116
4.8.8.2 SMA flexural beam fatigue…..……………………………………….119
4.9 Summary of performance tests ............................................................................ 122
4.10 Analysis of variance (ANOVA) ........................................................................ 123
5 CONCLUSIONS AND RECOMMENDATIONS ............................................ 126
5.1 Conclusions…………………………………………………………………….126
5.2 Recommendations……………………………………………………………...129

xiii
List of Figures
Figure 2.1: Dense Graded Asphalt (DGA), Open-Graded Friction Course and Stone
Mastic Asphalt (SMA) .................................................................................................... 13
Figure 2.2: Aggregate Gradation for Different Types of Flexible Pavements ................ 14
Figure 2.3: Schematic rutting in pavement layers under the vehicle wheel load. ........... 40
Figure 2.4: Schematic section of Indirect Tensile (IDT) strength (Moisture
susceptibility) .................................................................................................................. 41
Figure 2.5: Fatigue cracks in asphalt pavement .............................................................. 43
Figure 3.1: HMA aggregate gradation based on ASTM D3515 ..................................... 52
Figure 3.2: SMA aggregate gradation based on Asphalt Institute (2007)....................... 52
Figure 3.3: RCA production from concrete reinforced beams……………………….. 55
Figure 3.4: Resilient modulus test setup………………………………………………. 62
Figure 3.5: Loaded wheel tracking test setup…………………………………………. 63
Figure 3.6: Indirect tensile strength test setup………………………………………… 65
Figure 4.1: Density (a), Stability (b) and VTM (c) of the HMA mixtures containing F-
RCA versus binder content ............................................................................................. 86
Figure 4.2: Density (a), Stability (b) and VTM (c) of the HMA mixtures containing C-
RCA versus binder content ............................................................................................. 88
Figure 4.3: Density (a), Stability (b) and VTM (c) of the HMA mixtures containing M-
RCA versus binder content ............................................................................................. 89
Figure 4.4: Density (a), Stability (b) and VTM (c) of the SMA mixtures containing F-
RCA versus binder content ............................................................................................. 91

xiv
Figure 4.5: Density (a), Stability (b) and VTM (c) of the SMA mixtures containing C-
RCA versus binder content ............................................................................................. 92
Figure 4.6: Density (a), Stability (b) and VTM (c) of the SMA mixtures containing M-
RCA versus binder content ............................................................................................. 94
Figure 4.7: Average of Bulk Density (a) and VTM (b) of the HMA specimens
containing RCA ............................................................................................................... 95
Figure 4.8: Average of Bulk Density (a) and VTM (b) of the SMA specimens
containing RCA ............................................................................................................... 96
Figure 4.9: Average of Marshal Stability (a) and Flow (b) of the HMA specimens
containing RCA ............................................................................................................... 97
Figure 4.10: Average of Marshal Stability (a) and Flow (b) of the SMA specimens
containing RCA ............................................................................................................... 97
Figure 4.11: Average of VMA (a) and VFA (b) of the HMA specimens containing RCA
......................................................................................................................................... 98
Figure 4.12: Average of VMA (a) and VFA (b) of the SMA specimens containing RCA
......................................................................................................................................... 99
Figure 4.13: Average of Resilient Modulus at 25°C (a) and 40°C (b) for the HMA
specimens containing RCA ........................................................................................... 100
Figure 4.14: Average of Resilient Modulus at 25°C (a) and 40°C (b) for the SMA
specimens containing RCA ........................................................................................... 100
Figure 4.15: Effect of C-RCA on rut depth of HMA (a) and SMA (b) specimens ....... 102
Figure 4.16: Effect of F-RCA on rut depth of HMA (a) and SMA (b) specimens ....... 103
Figure 4.17: Effect of M-RCA on rut depth of HMA (a) and SMA (b) specimens ...... 103
Figure 4.18: Rut rate values of HMA (a) and SMA (b) mixtures containing RCA ...... 104

xv
Figure 4.19: Indirect Tensile Strength of HMA Specimens containing F- RCA .......... 106
Figure 4.20: Indirect Tensile Strength of HMA Specimens containing C- RCA ......... 107
Figure 4.21: Indirect Tensile Strength of HMA Specimens containing M- RCA ........ 108
Figure 4.22: Indirect Tensile Strength of SMA Specimens containing F- RCA .......... 109
Figure 4.23: Indirect Tensile Strength of SMA Specimens containing C- RCA .......... 110
Figure 4.24: Indirect Tensile Strength of SMA Specimens containing M- RCA ......... 111
Figure 4.25: Tensile Strength Ratio of SMA and HMA Specimens containing F- RCA
..................................................................................................................................... ..112
Figure 4.26: Tensile Strength Ratio of SMA and HMA Specimens containing C- RCA
....................................................................................................................................... 114
Figure 4.27: Tensile Strength Ratio of SMA and HMA Specimens containing M- RCA
....................................................................................................................................... 115
Figure 4.28: Average of flexural stiffness of HMA specimens containing RCA versus
fatigue life ..................................................................................................................... 117
Figure 4.29: Average of flexural stiffness of SMA specimens containing RCA versus
fatigue life ..................................................................................................................... 120

xvi
List of Tables
Table 3.1: British Standard requirements (BS 598-110) ................................................. 64
Table 4.1: HMA/SMA Mixtures Abbreviations ............................................................. 74
Table 4.2: Los Angeles Abrasion Values of Granite and RCA ...................................... 74
Table 4.3: Aggregate Impact Values of Granite and RCA ............................................. 75
Table 4.4: Aggregate Crushing Values of Granite and RCA .......................................... 75
Table 4.5: PSV values of Granite and RCA .................................................................... 76
Table 4.6: PSV Control Samples of Granite and RCA ................................................... 76
Table 4.7: Soundness Test .............................................................................................. 77
Table 4.8: Flakiness Index of Granite and RCA ............................................................. 78
Table 4.9: Elongation Index of Granite and RCA .......................................................... 78
Table 4.10: Aggregate Specific Gravity ......................................................................... 79
Table 4.11: Angularity Number ...................................................................................... 80
Table 4.12: Summary of Engineering Properties of Granite and RCA........................... 81
Table 4.13: HMA Aggregate Gradation Based on ASTM D3515 .................................. 82
Table 4.14: SMA Aggregate Gradation Based on Asphalt Institute (2007) ................... 82
Table 4.15: Penetration ................................................................................................... 83
Table 4.16: Softening Point ............................................................................................ 83
Table 4.17: Flash and Fire Point ..................................................................................... 83
Table 4.18: Asphalt Viscosity ......................................................................................... 84
Table 4.19: Summary of Asphalt Test Results ............................................................... 84
Table 4.20: OAC of HMA mixtures containing F-RCA ................................................. 87
Table 4.21: OAC of HMA mixtures containing C-RCA ................................................ 88
Table 4.22: OAC of HMA mixtures containing M-RCA ............................................... 89
Table 4.23: OAC of SMA mixtures containing F-RCA ................................................. 91
Table 4.24: OAC of SMA mixtures containing C-RCA ................................................. 93
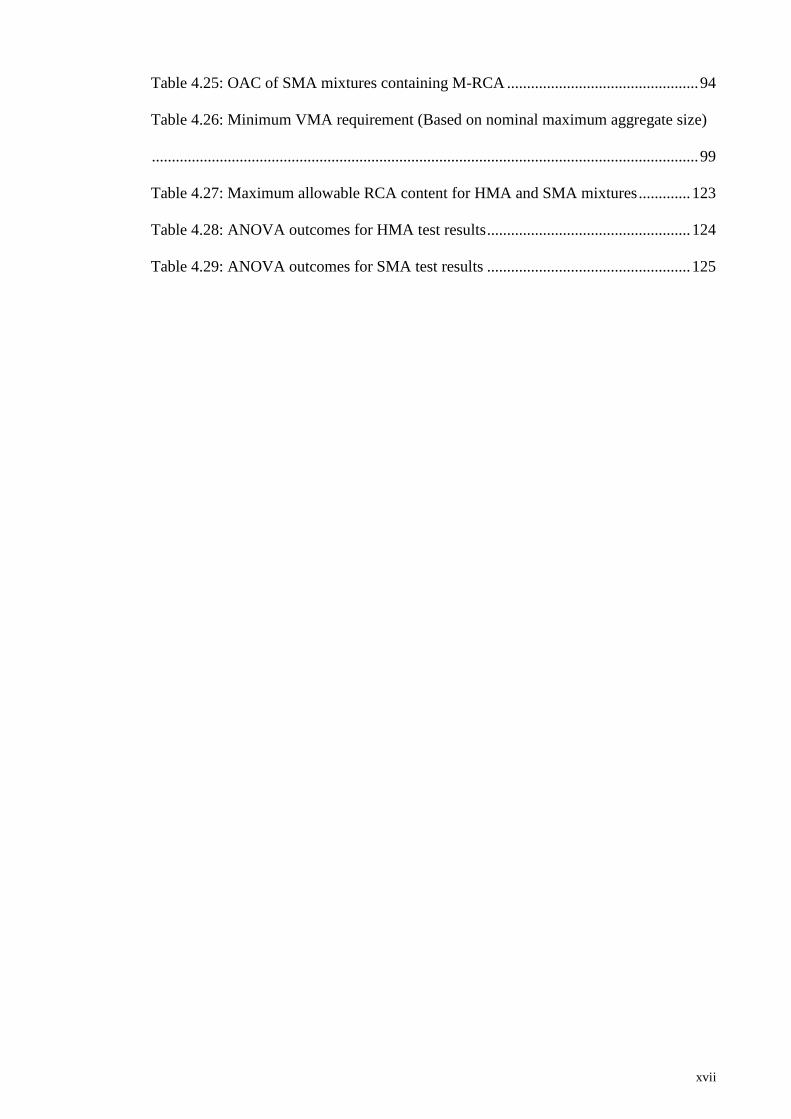
xvii
Table 4.25: OAC of SMA mixtures containing M-RCA ................................................ 94
Table 4.26: Minimum VMA requirement (Based on nominal maximum aggregate size)
......................................................................................................................................... 99
Table 4.27: Maximum allowable RCA content for HMA and SMA mixtures ............. 123
Table 4.28: ANOVA outcomes for HMA test results ................................................... 124
Table 4.29: ANOVA outcomes for SMA test results ................................................... 125
xviii
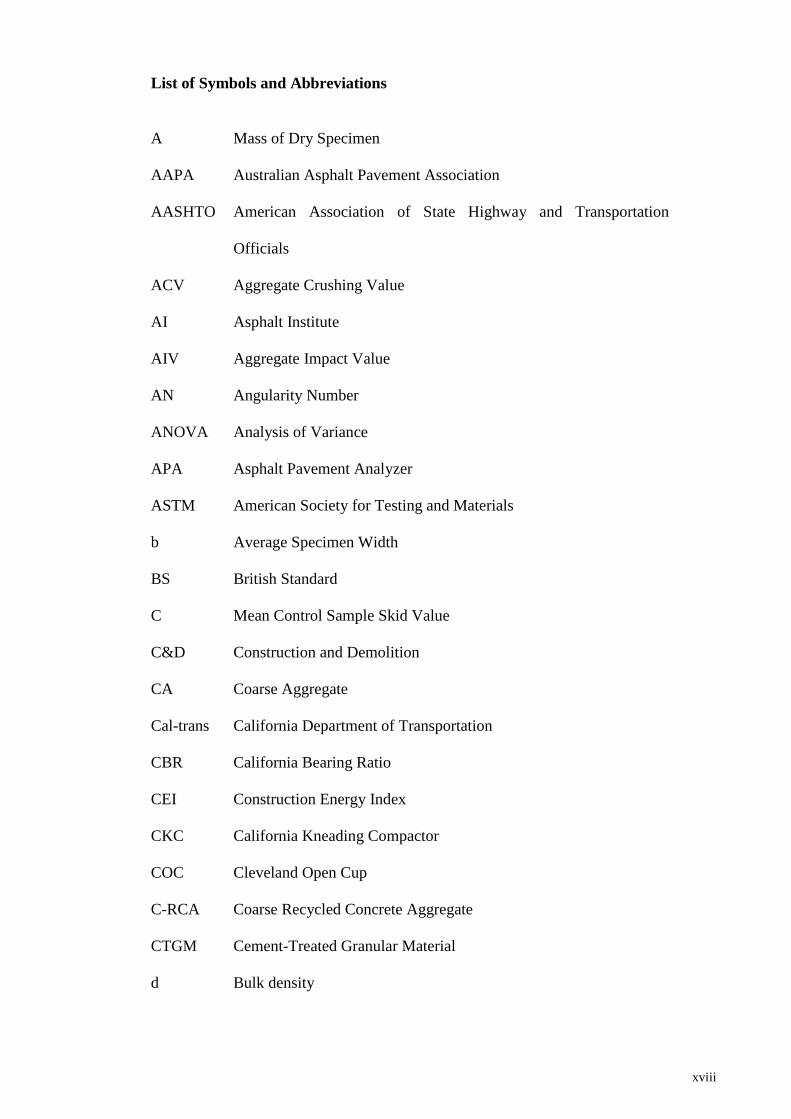
List of Symbols and Abbreviations
A Mass of Dry Specimen
AAPA Australian Asphalt Pavement Association
AASHTO American Association of State Highway and Transportation
Officials
ACV Aggregate Crushing Value
AI Asphalt Institute
AIV Aggregate Impact Value
AN Angularity Number
ANOVA Analysis of Variance
APA Asphalt Pavement Analyzer
ASTM American Society for Testing and Materials
b Average Specimen Width
BS British Standard
C Mean Control Sample Skid Value
C&D Construction and Demolition
CA Coarse Aggregate
Cal-trans California Department of Transportation
CBR California Bearing Ratio
CEI Construction Energy Index
CKC California Kneading Compactor
COC Cleveland Open Cup
C-RCA Coarse Recycled Concrete Aggregate
CTGM Cement-Treated Granular Material
d Bulk density
xix
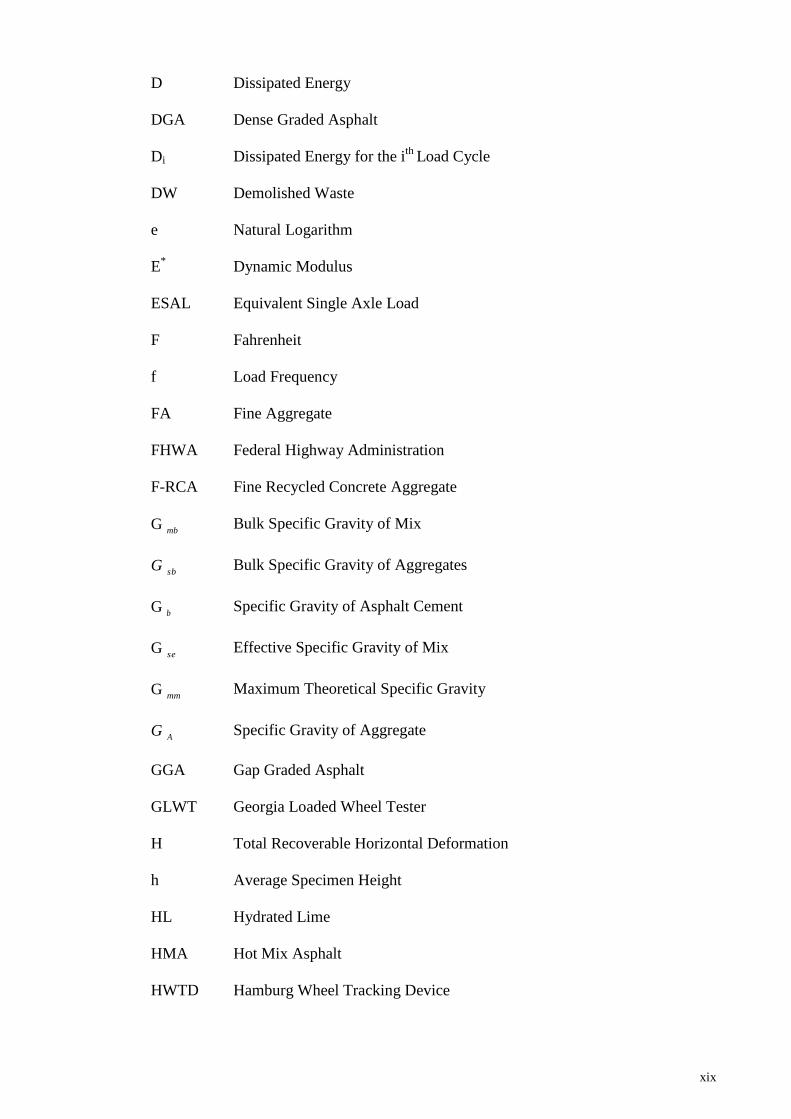
D Dissipated Energy
DGA Dense Graded Asphalt
Di Dissipated Energy for the ith
Load Cycle
DW Demolished Waste
e Natural Logarithm
E* Dynamic Modulus
ESAL Equivalent Single Axle Load
F Fahrenheit
f Load Frequency
FA Fine Aggregate
FHWA Federal Highway Administration
F-RCA Fine Recycled Concrete Aggregate
G Bulk Specific Gravity of Mix
G Bulk Specific Gravity of Aggregates
G Specific Gravity of Asphalt Cement
G Effective Specific Gravity of Mix
G Maximum Theoretical Specific Gravity
G Specific Gravity of Aggregate
GGA Gap Graded Asphalt
GLWT Georgia Loaded Wheel Tester
H Total Recoverable Horizontal Deformation
h Average Specimen Height
HL Hydrated Lime
HMA Hot Mix Asphalt
HWTD Hamburg Wheel Tracking Device
mb
sb
b
se
mm
A

xx
Hz Hertz
IDT Indirect Tensile Strength
in Inch
JKR Jabatan Kerja Raya
KN Kilo Newton
kPa Kilo Pascal
l Interior Length of Mold
LA Los Angeles Abrasion
lb Pound
LCPC French Wheel Tracker
LVDT Linear Variable Displacement Transducer
LWT Loaded Wheel Tracking
M Mass of slab
MATTA Material Testing Apparatus
MF Mineral Filler
mm Millimeter
MPa Mega Pascal
MR Resilient modulus
M-RCA Mixed Recycled Concrete Aggregate
MS Marshall Stability
n Load Cycles
NAPA National Asphalt Pavement Association
OAC Optimum Asphalt Content
OGA Open Graded Asphalt
OGFC Open-Graded Friction Courses
P Maximum Vertical Load

xxi
P Asphalt Content
PCCP Portland Cement Concrete Pavements
PCRCA Pre-Coated RCA
PG Performance Graded
PSV Polished Stone Value
R&B Ring and Ball
RAP Recycled Asphalt Pavements
RBM Reclaimed Building Materials
RCA Recycled Concrete Aggregate
RCP Recycled Concrete Pavements
RFA Recycled Fine Aggregate
rn Depth measurement at n reading
S Flexure Stiffness
s Time Lag between Pmax and max
SGS Superpave Gyratory Compactor
SHRP Strategic Highway Research Program
SLTA Singapore Land Transport Authority
SMA Stone Mastic Asphalt
SSD Saturated Surface Dry
t Thickness of Specimen
TMD Theoretical Maximum Density
TR Tracking Rate
TRM Mean Value of TR
TSR Tensile Strength Ratio
USCOE U.S. Army Corps of Engineers
v Air voids
b
th

xxii
VA Virgin Aggregate
VFA Void Filled with Asphalt
VMA Void in Mineral Aggregate
W Weight of Aggregates in Cylinder.
W Mass of Specimen in Air
W Saturated Surface Dry Mass
W Mass of Specimen in Water
WAPA Washington Asphalt Pavement Association
WES Waterways Experiment Station
WTR Wheel Tracking Rate
α Significance Level
Maximum Deflection at Center of Beam
Phase Angle
t Maximum Tensile Strain
t Maximum Tensile Stress
Density of water
Poisson’s ratio
Width of wheel’s contact area
D
SSD
SUB
w

xxiii
List of Appendices
Appendix A: Optimum Asphalt Content (OAC) of HMA mixtures containing RCA
Appendix B: Optimum Asphalt Content (OAC) of SMA mixtures containing RCA
Appendix C: Marshall Stability correlation ratio (ASTM D1559-82)
Appendix D: Flexural beam fatigue test of HMA specimens
Appendix E: Flexural beam fatigue test of SMA specimens
Appendix F: Statistical analysis and NOVA outputs of HMA Specimens
Appendix G: Statistical analysis and NOVA outputs of SMA Specimens

1
CHAPTER I
1 INTRODUCTION
1.1 Background
The major role of pavements (road surfaces) is to support a wheel load on the pavement
surface and to transfer and spread that load to the sub-grade without exceeding either
the strength of the sub-grade or the internal strength of the pavement itself. Aggregate
constitutes the main structural skeleton of asphalt mixtures, designed to absorb and
control different stresses on the pavement. It is essential to design an asphalt mixture
carefully in laboratory conditions to ensure optimal performance during its service life.
In the laboratory phase, it is important to select the most suitable materials for the
asphalt mixture. In order to prevent any failure in the pavement, one of the key design
elements are the aggregate and binder qualities, which provide the mix with cohesion
and also with the necessary tensile and shear strength to resist traffic loading and
environmental damage (Bardesi, 2010).
Aggregates used in asphalt mixtures may be either crushed stone or crushed gravel. In
both cases, the material must be thoroughly crushed, and the resulting particles should
be cubical in shape rather than flat or elongated. Aggregates also need to be free of dust,
dirt, clay and other deleterious materials. In addition, because aggregate particles carry
most of the load in hot mix asphalt pavements, aggregates need to be tough and abrasion
resistant (Topal and Sengoz, 2008).
In recent years, many studies have been carried out on the use of construction and
demolition (C&D) wastes in new civil construction sectors. A number of scientists,
researchers, and policy-makers have endeavored to explore the potential environmental
and economic advantages of recycling waste materials, and specifically the possibility

2
of re-using solid waste in pavement (i.e. road) construction (Xue et al., 2009). Waste
materials used in pavement construction can come from different sources, such as the
demolition of civil engineering structures or industrial wastes. Some studies indicate
that, utilizing industrial wastes such as marble dust, granite dust and fly ash as filler can
improve the performance of asphalt mixtures in terms of moisture susceptibility, rutting
and fatigue (Satish and Rajan, 2013).
Industrial waste materials are generally classified according to their sources: for
example, industrial by-products (steel slag and coal fly ash), demolition by-products
(concrete, tiles and bricks) and road by-products such as Recycled Asphalt Pavements
(RAP) or Recycled Concrete Pavements (RCP) (Pihl and Milvang-Jensen, 2001;
Tapkin, 2008).
Concrete, one of the most basic and common construction materials around the world,
essentially consists of aggregates (sand, crushed stone or gravel), cement and water.
When a concrete structure is demolished, repaired or renewed, it is increasingly
common to try to recycle and re-use the resulting concrete rubble. This is unsurprising,
since waste material from demolished concrete structures is one of the largest sources of
waste in the entire world, and has therefore become a global concern that requires a
sustainable solution (CSIR, 2000).
Europe alone produces around 180 million tons of concrete waste, or 480 kg per capita,
per year (Aggregates Advisory Service, 1999) – ranging from over 700 kg per person in
Germany and the Netherlands, to 500 kg in the UK, to just under 200 kg in Greece,
Sweden and Ireland. Meanwhile, according to the US Federal Highway Administration
(FHWA), approximately 2 billion tons of natural aggregate are produced each year in

3
the US; a figure that is expected to increase to over 2.5 billion tons per year by 2020.
This huge demand for aggregate has raised concerns about whether sufficient natural
aggregate will be available in the future (FHWA, 2004). This is where Recycled
Concrete Aggregate (RCA) from concrete structures such as buildings, bridges, dams or
Recycled Concrete Pavements (RCP) may have a role to play. RCAs were initially used
as filler materials and, according to previous research, could be used as road sub-base
materials or for non-structural concrete applications such as kerbs, canal linings,
driveways and footpaths (Arm, 2001; Huang et al., 2002; McGrath, 2001; Mroueh and
Wahlstram, 2002).
Recent studies on RCAs have shown that they have the potential to produce strong and
durable materials for HMA pavements. However, the amount of fine RCA must not
exceed more than 30% of the fine aggregate portion of the pavement mixture. This is
because, as the ratio of fine RCA increases, the density of the mixture decreases due to
the higher mortar content in the fines, which causes higher water absorption (Wong et
al., 2007). In 2003, the US Federal Highway Administration (FHWA) demonstrated that
RCA in base and sub-base materials in roads could produce an acceptable level of
performance, not only significantly reducing costs but also entailing significant
environmental benefits (FHWA, 2003). Subsequently, in 2004, the California
Department of Transportation (Cal-trans) ascertained that, while RCA collection startup
costs may be high, the use of RCAs could significantly reduce overhead costs overall
(Focus, 2004).
RCAs differ from virgin aggregates due to the amount of cement pastes remaining on
their surface after going through the recycling process (Schutzbach, 1992;
Paranavithana and Mohajerani, 2006). The presence of cement paste increases the

4
porosity of the aggregates, reduces their particle density, and thus affects their quality
and water absorption capacity. Utilizing RCA in hot mix asphalt mixtures thus affects
the volumetric properties and performance of HMA mixtures (Topal et al., 2006). In
this research, we investigate the feasibility of utilizing RCA in Dense-Graded and Gap-
Graded hot mix asphalt mixtures, through some experimental tests.
1.2 Research problem statement
In recent years, the demand for natural aggregates has increased significantly due to
rapid development and urbanization around the world. However, producing these
aggregates from mines and natural resources can be very damaging to the environment
(Surya et al., 2013). This depletion of quality primary aggregates, together with growing
awareness of the need for environmental protection, have led to questioning, including
at the international level, of the need for the continued wholesale extraction and use of
aggregates from natural resources. Moreover, the availability of natural resources for
future generations has also become an important issue (Poon et al., 2004).
Recycled Concrete Aggregate (RCA) is a kind of recycled material obtained from C &
D wastes. There is increasing global demand to reuse RCA in new civil constructions
due to its economic advantages, environmental benefits and energy saving (Moghadas
Nejad et al., 2013). Reusing waste material is moreover one of the many ways of
addressing the problem of excess solid waste materials in industrial and urban areas.
Reducing the overuse of natural resources and saving them from exhaustion, reducing
the environmental pollution from waste materials generated in urban and industrial
areas, and contributing to savings in energy and money are some of the benefits of
reusing waste materials in new engineering and industrial applications (Fontes et al.,
2010).

5
In recent years, there have been some limited studies on the utilization of RCA in dense-
graded hot mix asphalt mixtures. However, there has been no systematic study of the
performance of RCA in gap-graded stone mastic asphalt. This research aims to fill that
gap by evaluating the volumetric and mechanical properties of Gap-Graded Stone
Mastic Asphalt (SMA) and Dense-Graded Hot Mix Asphalt (HMA) mixtures containing
various percentages and sizes of Recycled Concrete Aggregates (RCA), based on
experimental tests. The results are then tabulated, discussed and statistically analyzed.
1.3 Objectives of the study
The main objectives of this study are as follows:
1. To evaluate the engineering properties of the utilized materials in Dense-Graded
and Gap-Graded hot mix asphalt mixtures.
2. To determine the Optimum Asphalt Content (OAC) of Dense-Graded and Gap-
Graded hot mix asphalt mixtures containing RCA, based on the Marshall mix
design method.
3. To evaluate the performance of Dense-Graded and Gap-Graded asphalt mixtures
containing RCA and determine the optimum RCA content, based on
experimental tests.
1.4 Hypothesis
RCA materials have higher porosity, absorption, abrasion, impact and crushing
values and a lower specific gravity than granite aggregates, all of which
influences the performance of asphalt mixtures containing RCA.
Regardless of the size of the RCA particles, as the RCA content increases in
HMA and SMA mixtures, the optimum asphalt content (OAC) will increase as
well.

6
Due to the differing aggregate gradations of the HMA and SMA specimens, the
HMA mixtures are more sensitive in fines and less in coarse aggregates.
Therefore, any replacement of fine granites with F-RCA will impact
significantly on the performance of the HMA specimens; while any replacement
of course granites with C-RCA will impact significantly on the performance of
the SMA specimens.
While the replacement of granite aggregates with RCA will improve only the
fatigue performance of the HMA and SMA specimens but will weaken other
specifications such as Resilient Modulus, Rutting, Indirect Tensile Strength and
Moisture Susceptibility, the right amount of RCA content will be able to satisfy
comfortably the standard requirements for all these criteria.
1.5 Scope of the study
This research evaluates the feasibility of utilizing Recycled Concrete Aggregates (RCA)
with different particle sizes in Dense-Graded (HMA) and Gap-Graded (SMA) hot mix
asphalt mixtures. The aggregate gradations for the HMA and SMA mixtures were
selected in accordance with ASTM D3515 and the Asphalt Institute (AI).
First of all, to verify the quality of the materials used and meet the first objective of the
study, the engineering properties of the granite aggregates, RCA and 80-100 penetration
grade binder were evaluated. The RCA materials were divided into three categories of
fine (F-RCA), with an aggregate particle size of 2.36 mm and smaller; coarse (C-RCA),
with an aggregate particle size larger than 2.36 mm; and a mixture of fine and coarse
called mix (M-RCA). Five different percentages of RCA (0%, 20%, 40%, 60% and 80%
by the weight of total mix) were mixed with HMA and SMA mixtures. The Marshall
mix design method was then used to determine the Optimum Asphalt Content (OAC)
for each percentage of RCA in order to achieve the second objective of the research.

7
The HMA and SMA slabs were fabricated based on the calculated OAC values, and
compacted using a roller compactor. The required numbers of specimens with 100 mm
or 200 mm diameters were cored out from the compacted slabs and subjected to
Density, VTM, Stability, Flow, VMA, VFA, Resilient Modulus, Loaded Wheel
Tracking (Rutting), Indirect Tensile (IDT) Strength, Moisture Susceptibility and
Flexural Beam Fatigue tests to evaluate the performance of each specimen in order to
fulfill the third and fourth objectives. All the performance tests were carried out on core
specimens with a 100 mm diameter, except for the wheel tracking and flexural beam
fatigue tests, for which 200 mm diameter cores and 380 mm × 63.5 mm × 50 mm beams
were required and prepared from the compacted HMA and SMA slabs. Finally, the test
results were explained, tabulated and statistically analyzed using ANOVA to show the
significance between the data.
1.6 Outlines of the thesis
This thesis is organized into five chapters, as follows:
Chapter 1 contains an introduction to the research topic, including the background, the
research problem statement, the main objectives of this research, the hypothesis, and the
scope of the study.
Chapter 2 presents a literature review covering the history of different kinds of flexible
pavements, aggregate gradations, mix design methods, Recycled Concrete Aggregates
and their usage in new civil constructions such as concrete structures, and base and sub
base layers of roads, as well as some new studies regarding the utilization of RCA
materials in pavement top layers by a range of individuals and institutes from around the
world.
Chapter 3 explains the methodologies used in this research, including the test
procedures based on international standards.

8
Chapter 4 contains the test results and a discussion about the research findings. A
statistical analysis of the test results is also provided in this chapter.
Chapter 5 presents the conclusions from this research, together with some
recommendations for further research in the future.
9
CHAPTER II
2 LITERATURE REVIEW
2.1 Flexible pavements
Hot Mix Asphalt (HMA) is one of the oldest materials which human have been used to
make the more durable and smoother roads since long time ago. The major role of
pavement is to support a wheel load on the pavement surface, transfer and spread that
load to the sub-grade without exceeding either the strength of the sub-grade or the
internal strength of the pavement itself. Flexible pavements and asphalt paving mixtures
consist of a well-graded, high quality aggregates and asphalt cement. Based on project
requirements the aggregate gradation of asphalt mixtures should be changed by
pavement designer engineers. Aggregates and binder should be mixed while hot to
ensure a good coating of the aggregates and consistency of the mixture. The aggregates
which are being used in the mixtures should follow the particular gradation to meet the
requirements of local specifications. The basic ideas of road pavements are as follows:
- To prepare a suitable sub-grade or foundation.
- Provide the necessary drainage and construct high quality pavements which have
enough thickness and internal strength to carry traffic loads.
- Be sufficiently impermeable to provide a penetration or internal accumulation of
water and moistures.
- Have smooth and skid resistant surface which can resistant deterioration cause
by weather and chemicals.
Typically the asphalt mixtures are heated to 121º C to 163º C (250º-325º F). Asphalt
mixtures should be kept hot during transit to the site, where it is spread on the roadway
and compacted by compactors to the proper density before the asphalt is cool. Most
commonly hot mix asphalt is divided into three different types of dense-graded, open-

10
graded, and gap-graded asphalt mixtures according to the gradation of the aggregate
used in the mix (Asphalt Institute, 2007).
2.1.1 Dense-Graded asphalt
Dense-graded mixtures are the most common HMA mix type. The term dense-graded
refers to the dense aggregate gradation used in these types of mixtures, which means
that there is relatively little space between the aggregate particles in such mixtures.
Historically, dense-graded mixtures were popular because they required relatively low
asphalt binder contents, which kept their cost down. However, experience has shown
that HMA with binder contents that are too low can be difficult to place and compact
and may be prone to surface cracking and other durability problems. Dense-graded
asphalt mixtures can be used in any layer of the pavement structure for any traffic level.
Traffic level is a direct consideration in the design of dense-graded mixtures. Aggregate
angularity, clay content, binder grade, compactive effort, and some volumetric
properties vary with traffic levels in the dense-graded mixture design procedure.
Conventional HMA consists of mixes with a nominal maximum aggregate size in the
range of 12.5 mm to 19 mm. Dense-graded hot mix asphalt mixture contains of high
quality asphalt binder and aggregates which thoroughly compacted into a uniform and a
dense mass. Different sizes of aggregates (from fine to coarse) are being used in each
dense-graded mix to fulfill the qualification of the pavement. Dense-graded mixtures
also provide the mixture designer with the greatest flexibility to tailor the mixture for
the specific application. The dense-graded mixture design procedure provides the
flexibility to increase the design VMA (Voids in Mineral Aggregates) requirements up
to 1.0% to produce mixtures with improved fatigue resistance and durability. Increasing
the VMA requirement increases the effective binder content of these mixtures over that
for normal dense-graded mixtures. The use of higher effective binder content dense-

11
graded mixtures should be considered for surface and base layers when the traffic level
exceeds 10,000,000 ESALs. Some of the advantages of well designed dense-graded
asphalt mixtures are; good interlock of aggregates, low permeability, good strength and
cheaper price due to lower binder content (Pedersen et al. 2011).
2.1.2 Open-Graded Friction Course (OGFC)
An open-graded hot mix asphalt pavements have a high percentage of air voids to let the
water drain down through the pavement layers. These types of pavements provide a skid
resistant surface and as a porous base layer can be used for drainage under either HMA
or Portland Cement Concrete Pavements (PCCP). Open-Graded Friction Courses
(OGFC) provides an open mix with permeable voids that provide drainage on the
surface of HMA pavements under wet conditions. The water drains vertically through
the OGFC to an impermeable, underlying layer and then lateral to the day-lighted edge
of the OGFC. In addition, OGFC minimizing hydroplaning and providing high friction
resistance on wet pavements. Reducing splash and spray, reducing the potential for
hydroplaning, enhance visibility of pavement markings, reducing night time surface
glare in wet weather and reducing tire noises are some of the advantages of OGFC
layer.
There are some limitations in using this type of pavement, such as; snow and ice-control
procedures may need adjustment while using OGFC, raveling and shoving mostly in
intersections, locations with heavy turning movements and airfield ramp, special
patching and rehabilitation techniques are needed to maintain adequate drainage
(Asphalt Institute, 2007). OGFC is mostly used to improve the frictional properties of
roadways. These mix types were first developed in Oregon (United States) in the 1930’s
and evolved through experimentation with plant mix seal coats. OGFCs were identified
as an alternative to improve skid resistance by the Federal Highway Administration

12
(FHWA) in the 1970’s after initiating a program to improve the frictional characteristics
of our nation’s highways. In 1980, the FHWA published a formalized mix design
method for OGFCs. During the 1980’s, many state agencies placed OGFCs as wearing
layers. However, a number of agencies noted that the OGFC layers were susceptible to
sudden and catastrophic failures.
These failures were caused by material specification, mix design and construction
problems. These problems were primarily related to mix temperature during
construction. Gradations associated with OGFCs are much coarser than typical dense-
graded HMA. Because of the open nature of OGFCs, there were problems with drain-
down during transportation. To combat the drain-down problems, most owners would
allow the lower production temperatures. Allowing the reduced production temperatures
increased the stiffness of the asphalt binder, thus reducing the potential for drain-down,
but also led to other issues that increased the potential of raveling and delamination (the
primary distresses leading to failure in OGFCs).
First, when the production temperatures were reduced, sufficient heat was not
developed to adequately dry the aggregates during production. This led to moisture
remaining in the aggregates and the increased potential for stripping. Additionally,
reducing the mix production temperature resulted in the OGFC arriving at the project
site cooler than the desired compaction temperature. When this occurred, the OGFC did
not always bond with the underlying layer through the tack coat and resulted in an
increased potential for raveling and delamination. During the 1980’s the catastrophic
raveling and delamination problems were of such magnitude that a number of agencies
placed a moratorium on the use of OGFC (Cooley, 2009).

13
2.1.3 Stone Mastic Asphalt (SMA)
Stone Mastic Asphalt (SMA) is a type of gap-graded hot mix asphalt which consists of a
coarse aggregates skeleton and a high binder content mortar. This type of mixture has
been used in Europe since 1960’s to provide better rutting resistance and resist the
abrasive nature of studded tires in snowy regions. Because of its success in Europe, the
United States government started to use SMA mixture in cooperation with the Federal
Highway Administration (FHWA) since 1991 (Bukowski, 1993).
SMA is a mixture, with crushed coarse and fine aggregates, mineral filler, bitumen and
fiber. Fiber is used to prevent binder drain-down during transportation and construction
procedures. The technical basis of SMA is a stone skeleton with stone-on-stone contact
unlike traditional dense graded mixes where aggregates tend to float in the mix with
little contact between the large aggregate particles. The coarse aggregates must be hard,
durable, and roughly cubical in shape when crushed. The stone-on-stone contact within
the high quality aggregate resists the shear forces created by applied loads creating a
very rut resistant pavement. High percentages of mineral filler and binder create a glue
(called mastic) to hold the stones together and fill in the spaces between the coarse
aggregate’s skeleton. This mastic filled skeleton prevents water intrusion and provides
excellent durability. A typical Dense-Graded Asphalt, Open-Graded Friction Course
and Stone Mastic Asphalt mixtures are shown in Figure 2.1.
DGA OGFC SMA
Figure 2.1: Dense Graded Asphalt (DGA), Open-Graded Friction Course and
Stone Mastic Asphalt (SMA)
14
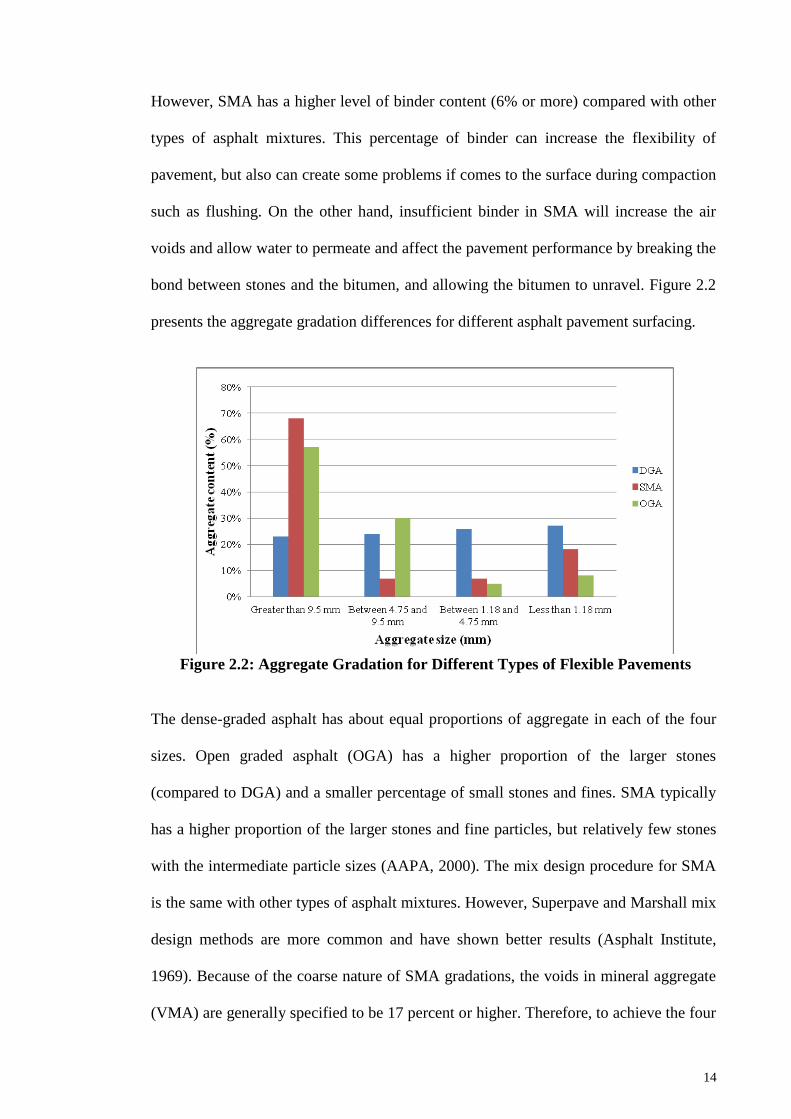
However, SMA has a higher level of binder content (6% or more) compared with other
types of asphalt mixtures. This percentage of binder can increase the flexibility of
pavement, but also can create some problems if comes to the surface during compaction
such as flushing. On the other hand, insufficient binder in SMA will increase the air
voids and allow water to permeate and affect the pavement performance by breaking the
bond between stones and the bitumen, and allowing the bitumen to unravel. Figure 2.2
presents the aggregate gradation differences for different asphalt pavement surfacing.
Figure 2.2: Aggregate Gradation for Different Types of Flexible Pavements
The dense-graded asphalt has about equal proportions of aggregate in each of the four
sizes. Open graded asphalt (OGA) has a higher proportion of the larger stones
(compared to DGA) and a smaller percentage of small stones and fines. SMA typically
has a higher proportion of the larger stones and fine particles, but relatively few stones
with the intermediate particle sizes (AAPA, 2000). The mix design procedure for SMA
is the same with other types of asphalt mixtures. However, Superpave and Marshall mix
design methods are more common and have shown better results (Asphalt Institute,
1969). Because of the coarse nature of SMA gradations, the voids in mineral aggregate
(VMA) are generally specified to be 17 percent or higher. Therefore, to achieve the four
15
percent air void content requirements in SMA mixtures, the volume of asphalt binder
content has to be relatively high.
Because of the relatively high asphalt binder contents, one potential problem
encountered with SMA that is not generally observed with dense-graded mixes is drain-
down problem. Drain-down is a term that refers to an occurrence where the asphalt
binder drains from the coarse aggregate structure during storage, transportation and/or
lay-down. In essence, drain-down is a form of segregation; however, it is the asphalt
binder and fines separating from the coarser particles. Drain-down can lead to flushed
spots on the finished pavement surface which is undesirable (Brown and Cooley, 1998).
Two approaches are typically used to prevent drain-down. The first approach is, to use
higher filler content (aggregate passing No. 200 sieve) which stiffens the asphalt binder
and preventing the asphalt binder from draining off the asphalt mixtures. The second
approach is to use the stabilizing additives such as fibers or modified binders. Both
cellulose and mineral fibers have been used with success in SMA mixtures. Similar to
the effect of the high fines content, utilization of asphalt binder modifiers and/or fibers
tend to stiffen the asphalt binders and preventing drain-down.
2.2 Mix design methods
Pavement mix development is carried out to produce a cost- effective blend and
gradation of aggregates and asphalt that yields a mix that has enough asphalt to ensure
that the pavement is durable, the mix is adequately stable to satisfy the demands of
traffic without distortion or displacement and there are enough voids in the total
compacted mix to allow for a slight amount of additional compaction under traffic
loading and a slight amount of asphalt expansion due to temperature increases without
flushing, bleeding, and loss of stability.
16
The other objectives of asphalt mix design is to achieve a maximum void content to
limit the permeability of harmful air and moisture into the mix and sufficient
workability to permit efficient placement of the mix without segregation and without
sacrificing stability and performance. Also, for surface mixes, proper aggregate texture
and hardness to provide sufficient skid resistance in unfavorable weather conditions is
an important parameter. The final goal of mix design is to select a uniquely designed
asphalt content that will achieve a balance among all of the desired properties.
When the asphalt samples are prepared in laboratories, it can be analyzed to determine
the mixture performance of the pavement. The main focus of this analysis is on density,
Voids in Total Mix (VTM), Voids in Mineral Aggregates (VMA), Voids Filled with
Asphalt (VFA) and Optimum Asphalt Content (OAC) defines the character of the
mixtures and determines the mix performance and behavior. By analyzing the
compacted asphalt mixture for the mentioned characteristics, some indication of its
probable durability and in-service performance can be predicted. The first mix design
procedure was developed by Clifford Richardson.
He established the concept that material selection was important, especially the
attributes of fine aggregates and the presence of air voids and voids in mineral
aggregates. His findings were published in “The Modern Asphalt Pavement” in 1905.
The procedure that he developed was called the pat test, which comprised of
compacting samples of sheet asphalt (a hot-sand asphalt mixture) against the brown
Manila paper and visually evaluating the residual stains. A heavy stain indicated the
high binder, a light stain showed the low amount of binder and medium stain showed
the optimum asphalt content in the mixture.

17
Other researchers have continued to develop the mix design method since his procedure
has been published. The most popular asphalt mix design method was developed by
Hubbard-Field in the Second World War. In Hubbard-Field method, which was
developed in the mid-1920s, the stability test was used to determine the maximum
asphalt specimen load capacity. The specimen’s dimension which was used for stability
test in this method was 2 inches (50 mm) in diameter and 1 inch (25 mm) in height.
Study on flexible pavements and hot mix asphalt mixtures have been continued and
developed to Hveem mix design, Marshall mix design and Superpave mix design
methods. Superpave Mix Design was introduced between 1987 and 1993 by Strategic
Highway Research Program (SHRP) and since today this method has been considered
as a more developed procedure for asphalt mixture design. However, the most asphalt
mixtures produced during the 50 years between the 1940s and 1990s used the Hveem
and Marshall mix design methods (Khosla and Sadasivam, 2002).
2.2.1 Hveem mix design
The original Hveem mix design method was the brainchild of Francis Hveem when he
was a Resident Engineer for the California Division of Highways in the late 1920s and
1930s. In the Hveem mix design method multiple initial specimens with different
percentages of binder content must be prepared and tested to determine the optimum
asphalt content value and a California Kneading Compactor (CKC) is used to compact
the specimens. CKC is able to fabricate cylindrical specimen with approximately 64
mm (2.5 inches) height and 102 mm (4-inch) diameter. The Compaction pressure can be
adjusted from 2.4 to 3.4 MPa (350 to 500 psi). CKC applies forces through a roughly
triangular shaped foot that covers only a portion of the specimen face.

18
Compacted forces by tamps are applied uniformly on the free face of the specimen to
achieve compaction. The CKC has a real advantage as being thought by most engineers
to simulate the densification characteristics of pavement in the field (Khan et al., 1998;
Masad et al., 1999). There are also some disadvantages of these types of compactors,
such as: compaction devices are very expensive, bulky size and not portable. California
kneading compacted specimens has shown differentiated density and air voids because
of large variations in sizes and shapes. Also over the years, mix design methods have
been developed, and new mix design methods require new equipment and methods of
compactions. Therefore, new compactors should be developed to make a better
simulation of field compaction in laboratories (Roberts et al., 1996; Asphalt Institute,
1997).
2.2.2 Marshall mix design
During World War II, the U.S. Army Corps of Engineers (USCOE) began evaluating
various HMA mix design methods for use in airfield pavement design. The motivation
for this search came from the ever-increasing wheel loads and tire pressures produced
by larger and larger military aircraft. The most promising method eventually proved to
be the Marshall stability method developed by Bruce G. Marshall at the Mississippi
Highway Department in 1939. The Waterways Experiment Station (WES) took the
original Marshall stability test and added a deformation measurement (flow meter) that
was thought to assist in detecting excessively high asphalt contents. This appended test
was eventually recommended for adoption by the U.S. army because it was designed to
stress the entire sample (rather than just a portion of it) and the produced specimen’s
densities were close to field densities. Also, it was light and portable and facilitated
rapid testing with minimal effort.

19
WES continued to refine the Marshall method through the 1950s with various tests on
materials, traffic loading and weather variables. Today the Marshall method (despite its
shortcomings) is probably the most widely used mix design methods in the world. Some
of The Marshall impact compactor is capable of producing cylindrical specimens with
102 mm (4-inch) diameter and 64 mm (2.5 inches) height (corrections can be made for
different sample heights). The tamper foot is flat and circular shape with a diameter of
98.4 mm (3.875 inches) corresponding to an area of 76 cm2 (11.8 in
2). The compaction
pressure is specified as a 457.2 mm (18 inches) free fall drop distance of a hammer
assembly with a 4536 g (10 lb.) sliding weight. The numbers of blows are highly
dependent on the anticipated traffic loading and can be adjusted to 35, 50 or 75 blows
for each side of the sample.
The Marshall impact compactor is being used for SMA mixtures, but according to the
NAPA, it is recommended to decrease the number of blows from 75 per each side (in
HMA) to 50 blows in SMA to prevent aggregate breakage. However, recent studies
have shown that, the expected density and air voids cannot be reached with 50 blows.
Also, as the thickness of the specimens cannot be controlled while using the Marshall
impact compactors, the density and air voids level are varied. Therefore, it is preferred
not to use the Marshall compactor for fabrication of SMA specimens. Because, the
result will be the same materials with variation in density and air voids due to different
thicknesses of the specimens (NAPA, 1982).
2.2.3 Superpave mix design
Superpave is an acronym for Superior Performing Asphalt Pavements. It is the product
of the Strategic Highway Research Program. Superpave includes a new mixture design
and analysis system based on performance characteristics of the pavement. It is a multi-
faceted system with a tiered approach to designing asphalt mixtures based on desired

20
performance. Superpave includes some old rules of thumb and some new and
mechanistic-based features. The Superpave mix design system is quickly becoming the
standard system used in the United States (US). The US was looking for a new system
to overcome pavement problems such as rutting and low temperature cracking that had
become common with the use of design systems such as Marshall and Hveem.
The Superpave system offers solutions to these problems through a rational approach.
The Superpave Gyratory Compactor (SGC) is not the perfect compactor for producing
specimens that manifest all the properties of field-compacted pavement layers.
However, it might be the best available compactor for conveniently producing
laboratory scale specimens. It is convenient, versatile, and provides important
information related to the engineering properties of asphalt mixture. Further, it is
becoming the most widely accepted and used hot mix asphalt compaction device in the
world. Many engineers believe that N initial (The initial number of gyrations) provides
useful information regarding the compact ability of the asphalt mixtures (Asphalt
Institute, 2007).
Excessive density at N initial indicates a potential tender mix and conversely, inadequate
density indicates the contractor may have difficulty achieving the required density. It
was concluded that the precision of the SGC was better than the mechanical Marshall
hammer (Buchanan and Brown, 2001). The original Superpave N design (N design is used
to vary the compactive effort of the design mixture and it is a function of climate and
traffic level) compaction matrix, contained 28 levels (four temperatures seven traffic
levels). Brown et al., (1996) found that the recommended gyration levels may be
excessive for lower levels of traffic. Brown and Buchanan (1999) recommended
reducing the number of N design compaction levels from 28 to four (50, 70, 100, and 130
gyrations) to address all traffic levels. They advised that the requirement for 11 percent

21
air voids at N initial for low-volume roads was too stringent. They further recommended
designing mixtures to N design gyrations and not N Maximum (maximum number of
gyrations to achieve the laboratory density, which should never be exceeded in the field)
and suggested that the slope of the compaction curve may not be a good indication of
the strength of the HMA aggregate structure.
This compactor was produced to make comparable laboratory samples with tire load
pressure of in-service compacted mixture after traffic compaction, but still it is not
possible to achieve the field density with gyratory compactors in laboratory samples
(Kumar and Goetz, 1997). SGC is capable of producing cylindrical specimens with 150
mm (6-inch) diameter and approximately 115 mm (4.5 inches) height (corrections can
be made for different sample heights). The common compaction pressure is 600 kPa (87
psi) and number of gyrations are varies. The load is applied to the sample top and
covers almost the entire sample top area.
The sample is inclined at 1.25° and rotates at 30 revolutions per minute as the load is
continuously applied. This helps achieve a sample particle orientation that is somewhat
like that achieved in the field after roller compaction. The gyratory testing machine is a
combination of a kneading compactor and a shear testing machine. According to recent
changes in the number and angle of gyration for SMA mixtures, Gyratory compactor
specimens have shown better results in comparison with Marshall Impact Compactor
specimens.
2.3 Aggregate in asphalt mixtures
Aggregate is the major structural skeleton of asphalt mixture to absorb and control
different stresses on the pavement. The laboratory design of an asphalt mixture is
essential to ensure optimal performance during the service life of the mix. In the
laboratory phase, it is important to select the most suitable materials for the asphalt

22
mixture. In order to prevent any failure in the pavement, one of the main design factors
to be considered is aggregate and binder qualities which provide the mix with cohesion
and also with the necessary tensile and shear strength to resist traffic loading and
environmental damages (Bardesi, 2010). For this reason, the right selection of
aggregate, bitumen, filler, and fines is crucial for optimal mix performance (Mo et al.,
2009).
Another important factor in the prevention of cracking is the coarse aggregate used in
the asphalt mixture. The gradation and shape of the coarse aggregates provide the
internal friction and bearing capacity, which resists the stresses caused by traffic loads
(Bardesi, 2010). Asphalt concrete is composed primarily of aggregate and asphalt
binder. Aggregate typically makes up about 95% of asphalt mixture by weight, whereas
asphalt binder makes up the remaining 5%. By volume, a typical hot mix asphalt
mixture is about 85% aggregate, 10% asphalt binder, and 5% air voids. Small amounts
of additives and admixtures are added to many asphalt mixtures to enhance their
performance or workability (Peattie, 1979). Many studies indicated that physical
characteristics and Chemical compositions of aggregate affect the workability and
optimum bitumen content of the mixture, as well as the asphalt mixture properties
(Topal and Sengoz, 2005; Topal and Sengoz, 2008).
The nature of the aggregate directly affects its adhesion to the bitumen and its resistance
to fragmentation. In this sense, if the adhesion between aggregate and bitumen is poor,
this produces many weak points where the cracking process will eventually develop and
propagate throughout the asphalt mixture. Furthermore, if the resistance to
fragmentation is not sufficiently high, the coarse aggregate could also crack, thus
facilitating the cracking process (Petersen et al., 1982). Gradation, quality and shape

23
(angularity and texture) of the aggregates play an important role in performance of
asphalt mixtures.
The higher quantity of crushed and angular aggregates causes the better interlock
between the materials and improve the performance of the asphalt mixtures (Abo-
Qudais and Al-Shweily, 2007; Miller et al., 2011; Massad et al., 2005). Aggregates
used in asphalt mixtures must be of good quality to ensure the resulting pavement will
perform as expected. Aggregates used in HMA mixtures may be either crushed stone or
crushed gravel. In either case, the material must be thoroughly crushed, and the
resulting particles should be cubical rather than flat or elongated. Aggregates should be
free of dust, dirt, clay, and other deleterious materials. Because aggregate particles carry
most of the load in hot mix asphalt pavements, aggregates should be tough and abrasion
resistant (Topal and Sengoz, 2008).
2.4 Bitumen in asphalt mixtures
Asphalt binders, sometimes referred to as asphalt cement binders or simply asphalt
cement, are an essential component of asphalt concrete. They are the cement that holds
the aggregate together. Asphalt binders are a co-product of refining crude petroleum to
produce gasoline, diesel fuel, lubricating oils, and many other petroleum products.
Asphalt binder is produced from the thick, heavy residue that remains after fuels and
lubricants are removed from crude oil. This heavy residue can be further processed in
various ways, such as steam reduction and oxidation, until it meets the desired set of
specifications for asphalt binders. For demanding, high-performance applications, small
amounts of polymers are sometimes blended into the asphalt binder, producing a
polymer-modified binder (Pedersen et al., 2011).

24
Binder content is one of the most important characteristics of asphalt concrete. Use of
the proper amount of binder is essential to good performance in asphalt concrete
mixtures. Too little binder will result in a stiff mix that is difficult to place and compact
and will be prone to fatigue cracking and other durability problems. Too much binder
will be uneconomical, since binder is the most expensive component of the mixture and
will make the mixture prone to rutting and shoving. Therefore, type, quality and
characteristics of asphalt binder play the significant role on the mechanical response of
asphalt mixtures (Kumar and Veeraragavan, 2011).
Typical asphalt binder contents range from 3.0% or less (for lean base course mixtures)
to over 6.0% (for surface course mixtures and rich bottom layers), which are designed
for exceptional durability and fatigue resistance (Asphalt Institute, 2007). Performance
grading of asphalt binders was developed during SHRP. The main purpose of this way
of classifying and selecting asphalt binders is to make certain that the binder has the
correct properties for the given environment.
Performance grading was also meant to be based more soundly on basic engineering
principles earlier methods of grading binders often used empirical tests, which were
useful but did not provide any information on the fundamental engineering properties of
the binder. Five penetration grades (PG) are specified for asphalt binders in ASTM D
946, 40-50, 60-70, 85-100, 120-150, and 200-300 (the lower the penetration, the harder
the asphalt). Also six viscosity graded asphalt cements found in ASTM D3381 are: AC-
2.5, AC-5, AC-10, AC-20, AC-30, and AC-40 (The lower the number of poises, the less
viscous the asphalt cements). Properties of asphalt binders can be measured by
penetration, softening point, viscosity, flash and fire, thin film oven, and specific gravity
tests (Roberts et al., 1996).

25
2.5 Recycled Concrete Aggregate (RCA)
The Federal Highway Administration (FHWA) indicates that approximately 2 billion
tons of natural aggregate are produced each year in the US. Also, aggregates production
is expected to be increased to over 2.5 billion tons per year by 2020. This needed
volume of aggregate has raised concerns about the availability of natural aggregates in
the coming years (FHWA, 2004). Recycled Concrete Aggregate (RCA) is produced by
crushing demolished concrete
structures such as buildings, bridges and dams. RCAs were initially used as filler
materials and based on previous researches; it could be used as road sub-base materials
and in nonstructural concrete applications such as curbs, canal lining, driveways and
footpaths (Arm, 2001; Huang et al., 2002; McGrath, 2001; Mroueh and Wahlstram,
2002).
Waste materials to be used in pavement constructions can come from different sources,
including demolition of civil engineering structures and industrial wastes. These
materials are mostly classified based on their resources like industrial by-products (steel
slag and coal fly ash), demolition by-products (concrete, tiles and bricks) and road by-
products such as RAP (Recycled Asphalt Pavements) or RCP (Recycled Concrete
Pavements) (Pihl and Milvang-Jensen, 2001). Concrete is the most basic construction
material all around the world, which essentially consists of aggregates (sand, crushed
stone or gravel), cement and water. Environmental and economic considerations have
encouraged governments to find a ways to use recycled materials in new productions.
When the concrete structure is demolished, repaired or renewed, recycling is an
increasingly common method of re-using the rubble concretes. On the other hand, in
recent years the knowledge of continued wholesale extraction and use of aggregates
from natural resources has been questioned at the international level. This is the result

26
of the depletion of quality primary aggregates and greater awareness on environmental
protection. Moreover, the availability of natural resources for future generations has
also been considered as an important issue (Poon et al., 2004). Waste material from
demolished concrete structures is one of the largest wastes in the entire world. For
example, this amount of waste in Europe is around 180 million tons per year or 480 kg
per capita per year (Aggregates advisory, 1999). These ranges are from over 700 kg per
person in a year in Germany and the Netherlands, 500 in UK to almost 200 in Greece,
Sweden and Ireland. Therefore, concrete waste has become a global concern that
requires a sustainable solution (CSIR, 2000).
Recent studies on RCAs have shown the acceptable potential to produce strong and
durable materials for HMA pavements. However, the amount of fine RCA shouldn’t
exceed more than 30 percent of the fine aggregate portion of the pavement mixtures.
This is because as the fine RCA increases, the density will be decreased due to higher
mortar in fines which causes higher water absorption in the mixture (Wong et al., 2007).
In 2003 the Federal Highway Administration (FHWA) proved the acceptable
performance of RCA in base and sub-base materials of roads which not only
significantly reduce the costs, but also have many environmental benefits (FHWA,
2003). In latter investigation, in 2004, California Department of Transportation (Cal-
trans) discovered that even though the RCA collection startups costs are high, but in
general overhead costs are significantly reduced (Focus, 2004).
Recycled concrete aggregates are different from virgin aggregates due to the amount of
cement pastes remaining on the surface of the recycled aggregates after undergoing the
recycling process (Schutzbach, 1992; Paranavithana and Mohajerani, 2006). The
presence of cement paste increases the porosity of the aggregates, reduces the particle

27
density, and thus affects the quality and water absorption capacity of the RCA.
Therefore, utilizing RCA in Hot Mix Asphalt (HMA) mixtures affected the volumetric
properties and performance of HMA mixtures (Topal et al., 2006).
2.5.1 Utilization of RCA in base and sub base layers
Many previous studies have shown that the engineering properties of recycled concrete
aggregates from construction and demolition waste (C&D) make them suitable for use
as granular material in embankments and sub-bases for paved roads (Roussat et al.,
2008; Vegas et al., 2008; Perez and Pasandin, 2014). Petrarca (1984) investigated the
use of RCA on some local projects in New York between 1977 and 1982. Concrete used
for recycling in Petrarca’s study was crushed from sidewalks, driveways, curbs, and
pavements.
More than 100 tests were conducted and it was determined that crushed concrete,
consistently met all requirements for excellent long term performance as dense-graded
aggregate base or subbase. However, the quality of aggregates with sources used to
produce RCA will depend on the original intended use of the PCC (NCHRP, 2001).
Snyder and Bruinsma (1996) reported on five field studies and five laboratory studies to
evaluate the use of RCA materials in unbound layers underneath pavements. Field
studies included evaluations of existing pavement drainage systems for pavements
utilizing RCA base materials and monitoring of various test sections containing RCA
materials and natural aggregates. Based on the field studies, RCA materials within
drainage base layers have the potential to precipitate calcium carbonate materials (called
calcite).
The laboratory studies indicated that the amount of calcium carbonate precipitate was
proportional to the amount of RCA materials passing the No. 4 (4.75mm) sieve.
28
However, washing RCA during processing practically eliminates the formation of the
calcium carbonate precipitates. The test results reported by Poon and Chan (2006)
indicated that the use of 100% recycled concrete aggregate increased the optimum
moisture content and decreased the maximum dry density of the sub-base materials
compared to those of natural sub-base materials.
The California bearing ratio (CBR) values (unsoaked and soaked) of the sub-base
materials prepared with 100% recycled concrete aggregate were lower than those of
natural sub-base materials. Nevertheless, the soaked CBR values for the recycled sub-
base were greater than 30%, which is the minimum strength requirement in Hong Kong.
Using the same methods, Khaled and Krizek (1996) found that RCA can be used as a
base course in highway pavements if the recycled concrete aggregate is stabilized with
as little as 4% cement and 4% fly ash by dry weight of the mix.
Unfortunately, using RCA for base and sub-base materials is associated with
complications related to the high water solubility of RCA components, which can cause
an increase of PH in nearby groundwater systems as well as possibly affecting the
vegetation within the vicinity of the roads (Gilpin et al., 2004). Arulrajah et al., (2012a)
investigated the recycled crushed brick when blended with recycled concrete aggregate
and crushed rock for pavement sub-base applications. The research indicates that up to
25%, crushed brick could be safely added to recycled concrete aggregate and crushed
rock blends in pavement sub-base applications. The repeated load triaxial test results on
the blends indicate that the effects of crushed brick content on the mechanical properties
in terms of permanent deformation and resilient modulus of both the recycled concrete
aggregate and the crushed rock blends were marginal compared to the effects on dry
density and moisture content. Arulrajah et al., (2012b) achieved a laboratory
29
investigation into the geotechnical properties of recycled concrete aggregate (RCA).
The Los Angeles abrasion loss tests indicated that the RCA is durable. CBR values were
found to satisfy the local state road authority requirements for sub-base material.
Repeated load triaxial tests established that the RCA would perform satisfactorily as a
pavement sub-base material in the field. The results of the laboratory testing undertaken
in this research indicated that RCA satisfied the criteria for use in pavement sub-base
applications.
The possibility of using crushed concrete and demolition debris as sub-base coarse
aggregate was investigated by Fabiana et al., (2011). CBR experiments were conducted,
and the behavior of the recycled materials was compared with the behavior of
limestone. The results showed that CBR of crushed concrete was similar to that of
natural aggregate. Conversely, demolition debris presented a fairly decrease in its CBR.
Perez et al., (2013), investigated the application of cement-treated granular material
(CTGM) made by RCA, in the construction of actual road base in Spain. It was found
that, the sections built utilizing CTGM showed similar performance compared to natural
aggregates and the cement treated RCA is a real alternative in the construction of road
bases and sub-bases.
2.5.2 Utilization of RCA in hot mix asphalt mixtures
Paranavithana and Mohajerani (2006) performed experiments on the effects of recycled
concrete aggregates on the properties of HMA, in which 50% RCA by dry weight of
total aggregates was used as coarse aggregate in the asphalt mixtures. The performance
tests carried out on these mixes showed that, using RCA in HMA mixtures lowered the
resilient modulus and creep resistance of the mix and increased the stripping potential of
them. In addition, the mixes containing RCA showed large variations in strength under
dry and wet conditions. Wong et al., (2007), studied on the utilization of RCA as a

30
partial aggregate substitution in HMA. Three HMA mixes were included in the study by
substituting granite filler/fines with 6% untreated, 45% untreated, and 45% heat-treated
recycled concrete, respectively. All three mixes passed the wearing course criteria
specified by the Singapore Land Transport Authority (SLTA), based on the Marshall
mix design method. The performance tests on the mix with 6% RCA showed
comparable resilient modulus and creep resistance to those of the traditional HMA mix.
The mixes with the higher percentage of RCA showed higher resilient modulus and
resistance to creep.
Another research was conducted by Topal et al., (2006), who studied on use of recycled
concrete aggregates in hot-mix asphalt. They found that, RCA can substitute HMA
aggregates and achieve the required Marshall Stability (MS) and Indirect Tensile
Strength (IDT) of the mixtures. The test results indicated that, the Marshall Stability
values increased with the increase of RCA in the mix. However, the voids in mineral
aggregate (VMA) and the voids filled with asphalt (VFA) decreased with the increase in
RCA content. This was believed to be due to crushing of RCA by the Marshall
compactor during compaction. The tensile strength of the mix containing RCA was
found to be higher than that of the control mix as the internal friction of RCA was
higher than that of natural limestone aggregates. Eventually, RCA was not
recommended to be used in the wearing course due to RCA’s susceptibility to abrasion
by vehicles.
Bhusal et al., (2011) investigated the volumetric properties of hot mix asphalt
containing 5% recycled concrete aggregates. Test results revealed that the asphalt
mixtures absorption increased by increasing the RCA content in the asphalt mixtures
and based on the statistical analysis the influence of RCA in volumetric properties of

31
hot mix asphalt was significant. Gul and Guler (2014) investigated the rutting
performance of asphalt mixtures containing recycled concrete aggregates. They revised
the Marshall mix design method to prepare the asphalt specimens to fulfill the minimum
requirement in terms of uniaxial testing. The test results indicated that utilization of
recycled concrete aggregate in asphalt mixtures improve the rutting performance of the
asphalt mixtures.
Hassanied et al., (2016) assessed a case study on performance of recycled construction
demolition wastes in asphalt mixtures. In this study various percentages of fine
aggregates in hot mix asphalt mixtures were replaced by fine RCA. Test results
indicated the feasibility of up to 30% fine RCA in hot mix asphalt mixtures in terms of
Marshall stability and indirect tensile strength tests. Marques et al., (2014) investigated
the comparative study between asphalt mixtures containing natural and recycled
concrete aggregates. In this study, 25, 50 and 100% of virgin aggregates were replaced
by recycled concrete aggregates. Test results showed that the values of air voids and
voids filled with asphalt in mixtures containing 50% and 100% RCA did not meet the
relevant standard requirement. Therefore, it was concluded that replacing the virgin
aggregates with 25% of RCA not only have environmental and economic benefits, but
also can satisfy the standard requirements for pavement surface.
Another research was carried out by Moghadas Nejad et al., (2013) on fatigue
performance of hot mix asphalt mixtures containing recycled concrete aggregates. The
indirect tensile fatigue test was used to measure the behavior of hot mix asphalt
mixtures containing 0%, 35%, 70% and 100% RCA. It was found that, utilization of
RCA in asphalt mixtures, reduce the production costs and prevent much fullness of the
recycled materials in the environment. It was found that using up to 100% RCA instead

32
of virgin limestone in the asphalt mixtures improved the fatigue performance of the
asphalt specimens.
Beale and You (2010) investigated the feasibility of using RCA for a low-volume traffic
road in Michigan, with 25%, 35%, 50%, and 75% of virgin aggregates by the weight of
total aggregates substituted with RCA. It was found that, increasing the RCA’s content
decreased the VMA and VFA of the mixes. The laboratory test results indicated that all
the 4 mixes containing RCA passed the minimum rutting specification of 0.32 inch rut
depth. Dynamic modulus test results showed that the stiffness of the mixtures
containing RCA was less than control mix, but using RCA in HMA mixtures reduced
the energy needed for compaction. In terms of moisture susceptibility, all the mixes
(except 75% RCA mix) passed the Tensile Strength Ratio (TSR) of 80%.
In a study conducted by Shen and Du (2004), the permanent deformation of Hot Mix
Asphalt (HMA) mixtures containing Reclaimed Building Materials (RBM) has been
investigated. The HMA specimens were produced by using four types of aggregates
(100% river crushed stone, 100% RBM, the mixture of 50% crushed stone and 50%
RBM and the mixture of coarse RBM and fine crushed stone) and two types of binders
(AC-10 and AC-20). It was found that, regardless of the binder types, different types of
aggregate mixtures had a significant effect on the permanent deformation of HMA
specimens.
Lee et al., (2012) assessed the evaluation of pre-coated recycled concrete aggregates for
hot mix asphalt. The RCA materials were pre-coated by coating thickness of 0.25, 0.45
and 0.65 mm slag cement before being used in the HMA mixtures. The rutting, moisture
susceptibility and indirect tensile strength tests of the HMA mixtures containing pre-

33
coated RCA (PCRCA) have shown satisfactory results based on the Transportation and
Communications criteria of Taiwan.
Pasandin et al., (2015) investigated the influence of aging on binder extracted from
asphalt mixtures containing recycled concrete aggregates. Virgin aggregates were
replaced by 0% and 30% RCA in the asphalt mixtures and the extracted binder was later
tested in terms of dynamic viscosity, dynamic shear rheometer, penetration and
softening point tests. Test results indicated that, the aging caused by heat treatment
increased the stiffness of the asphalt mixtures and RCA has a small influence. However,
when there is no curing time for the asphalt mixtures, the RCA protects the binder in
terms of aging.
Arabani and Azarnoosh (2012) evaluated the dynamic properties of hot mix asphalt
mixtures containing recycled concrete aggregate and still slags. The Marshall mix
design method was used for fabrication of six different HMA mixtures, containing three
different types of aggregates (dacite, recycled concrete and steel slag) and tested in
terms of fatigue, stability, indirect tensile resilient modulus and dynamic creep tests.
Test results revealed that, the HMA specimens containing coarse steel slags and fine
RCA could perform better than the other mixtures.
In the other experiment conducted by Arabani et al., (2012), the effect of recycled waste
concrete in asphalt mixtures has been evaluated. The RCA materials were used as a
partial or total replacement with dacite including replacement of coarse aggregate (CA),
fine aggregate (FA) and fillers in the HMA mixtures. Based on the performance tests,
the mixture containing coarse dacite and fine RCA was the optimal mixtures in terms of
fatigue, rutting, resilient modulus and Marshall stability test results.
34
In another join experiment by Pasandin and Perez (2013), the feasibility of using
construction and demolition wastes in HMA mixtures was evaluated. The Marshall mix
design method was used for the fabrication of HMA mixtures containing 0%, 5%, 10%,
20% and 30% RCA. Based on their previous researches (Perez et al., 2010a; Perez et
al., 2010b and Perez et al., 2010c), it was found that, conditioning the asphalt mixtures
for 4 hours in an oven (at the mixing temperature) before compaction could
considerably improve the moisture susceptibility of the mixtures. It was believed that,
during the conditioning, the surface of the RCA will be properly coated by the binder,
which reduces the porosity of the RCA and results in lower moisture sensitivity.
Moreover, resilient modulus, fatigue, moisture sensitivity, stiffness and rutting test
results of the mixtures containing various percentages of RCA showed the acceptable
results to that of the conventional mixtures.
The effect of demolition waste as recycled aggregate in HMA mixture was evaluated by
Wu et al., (2013). The demolished waste (DW) materials were divided into two groups
called recycled coarse aggregate (RCA) and recycled fine aggregate (RFA). Three types
of asphalt mixtures were produced containing RFA and coarse lime stones, RCA and
fine limestone and the mixture of coarse and fine limestone as a control mix. The freeze
and thaw (for moisture susceptibility), scan electron microscope, immersion Marshall
and rutting at high temperature tests were carried out to evaluate the performance of the
recycled materials in the specimens. Test results showed that, the specimens made by
RCA and fine limestone performed better resistance to rutting and low temperature
cracking compared to the other two mixtures while the moisture resistance of the RFA
was higher than the RCA and control specimens. However, based on the performance
test results, all the specimens could satisfy the China’s technical asphalt pavement
construction specifications.

35
The investigation on mechanical properties of HMA mixtures containing RCA was
carried out by Mills-Beale and You (2010). The dynamic modulus (E*), rutting, resilient
modulus, Construction Energy Index (CEI) and tensile strength ratio (TSR) of the HMA
mixtures containing various percentages of the RCA were determined to evaluate the
performance of the HMA specimens. Test results revealed that, the dynamic stiffness of
the hybrid mixtures were less than control mix. However, in terms of rutting, all the
specimens could fulfill the minimum standard requirements and in terms of TSR
(moisture susceptibility), all the specimens could meet the specification criterion except
the mixtures containing 75% RCA. Moreover, it was found that, using RCA in HMA
mixtures could save some amounts of compaction energy.
2.6 Performance tests of asphalt mixtures
There are some asphalt mixture performance tests to ensure pavement engineers about
the reliable mixture performance over a wide range of materials, traffic and climatic
conditions. These tests are divided to volumetric and mechanical tests. Measuring
density, Voids in Total Mix (VTM), Voids in Mineral Aggregate (VMA) and Voids
Filled with Asphalt (VFA) are some of the volumetric tests for asphalt specimens.
Moreover, Marshall Stability, Flow and other advanced tests such as Resilient Modulus,
Fatigue, Moisture Induced Damage, Loaded Wheel Tracking (rutting) and Indirect
Tensile Strength are considered as mechanical performance tests.
2.6.1 Bulk density and air voids
Density is one of the most important parameters in future performance of pavement.
Well designed and compacted asphalt mixtures may contain enough air voids to prevent
rutting due to plastic flow. The percentage of air voids must be sufficient and low
enough to prevent permeability of air and water to the body of pavement and high
enough to prevent plastic flow after a few years of opening to traffic (Brown, 1990).

36
The percentage of air voids in asphalt mixtures are directly related to density, and a high
level of density can be achieved by increasing the compaction, binder content and/or
filler content. It is clear that with decreasing the air voids in asphalt mixture, the density
will be increased, but reducing the air void level by adding extra amounts of binder or
filler content to the mix does not necessarily have a positive effect on asphalt mixture
performance (Roberts et al., 1996).
2.6.2 Marshall stability and flow
The purpose of the Marshall stability test is to measure the strength of the compacted
asphalt mixtures. Brown and Mallick (1994) found that, the variability of Marshall
stability results in Stone Mastic Asphalt (SMA) and dense-graded mixtures are
significantly different and the results of dense-graded mixtures are considerably higher.
The average of stability for the dense-graded mixtures is 2500 pounds, which is
approximately 50 percent higher than the gap-grade mixtures (SMA). The stability test
results are used as one of the most important factors in Marshall mix design procedure
to measure the Optimum Asphalt Content (OAC) for asphalt mixtures with different
percentages of binder content.
The highest temperature of pavement during the summer is 60ºC, so all the specimens
must be kept and conditioned in 60ºC before testing. Viscosity of binder has a
significant effect on stability of asphalt mixes and anything that increases the viscosity
of the binder increases the Marshall stability. Also, using more crushed angular
aggregates instead of rounded or sub-rounded aggregates in asphalt mixture are the
other effective factor for increasing the stability. Flow is a vertical deformation of the
asphalt specimen and is measured at the same time as the Marshall stability. The high
flow value of an asphalt mix sample will result in permanent deformation in the
pavement under traffic, and low flow value might result from insufficient binder or high

37
voids, which will result premature cracks due to the brittleness of pavement during
service life (Roberts et al., 1996).
2.6.3 Resilient modulus
The repeated load indirect tension test, or resilient modulus test (M R ), is used to
measure the elastic properties of asphalt mixtures by calculating the stress-strain
behavior of asphalt specimens (Baladi and Harichandran, 1989). The standard specimen
dimension, used for the resilient modulus test is a 2.5 inch (62.5mm) by 4 inches
(100mm) specimen, and for Hot Mix Asphalt (HMA) specimens, the applied load to
stress level is between 5 to 20 percent of indirect tensile strength (Asphalt Institute,
2007). This test has become popular with many asphalt laboratories, due to simplicity
and applicability to test field cores. According to Michael et al., (2002), there is no
significant relation between M R and rutting, but the results at low temperatures are
somewhat related to cracking, as stiffer mixes (higher MR) at low temperatures tend to
crack earlier than more flexible mixtures (lower MR).
The resilient modulus is highly dependent on temperature due to the softening point of
the asphalt binder and as the temperature increases the resilient modulus of the asphalt
mixture decreases. Also finding the relationship between resilient modulus and
temperature can be used to prove the acceptability of asphalt concrete over the nominal
range of the temperature that the pavement will be faced in the field and the
susceptibility of compacted asphalt mixture to cracking (Gartner, 1987). Comparative
study of dense-graded and open-graded asphalt mixtures show the value of resilient
modulus in open-graded mixture is lower than dense-graded mixture at the same
temperatures. The higher level of air voids in open-graded mixtures would result in a

38
higher recovered strain and the measured resilient modulus would be higher and
increasing density of aggregate results in a higher resilient modulus.
The resilient modulus test results provide a basic constitutive relationship between
stiffness and stress state of pavement materials for use in pavement design procedures
and the structural analysis of layered pavement systems. The resilient modulus test
simulates the conditions in pavement due to application of moving wheel loadings. As a
result, the test provides an excellent means for comparing the behavior of pavement
construction materials under a variety of conditions and stress states (Witczak, 2004).
2.6.4 Permanent deformation (Rutting)
During the past several years, many states experienced problems with the amount and
severity of permanent deformation in hot mix asphalt pavements. This problem with
permanent deformation, or rutting, was attributed to an increase in truck tire pressures,
axle loads, and volume of traffic (Brown and Cooley, 1999).
The risk of permanent deformation is considerably higher during summer that heavy
vehicles are travelling on a pavement and a considerable distress is being imposed to the
pavement structure. The repetition of heavier axle loads becomes more significant with
higher traffic volume. The loads from the repeated traffic can create pronounced
amounts of permanent deformation or rutting. The mentioned incident can occur even
on straight road sections, bus stops or close to traffic lights due to the slow speed and
heavy loads of the trucks and trailers (Tapkin and Keskin, 2013).
Rutting is the earliest accruing distress and sometimes appears after only a few months
and might be due to some failures in asphalt layers or underlying layers such as the
subgrade soil being overstressed or the required density was not achieved due to

39
inadequate compaction (WAPA, 2011). Particle shape of aggregates is important for
workability and performance of asphalt mixes. Angular particles, rather than flat, thin,
and elongated particles are recommended for use in hot mix asphalt mixtures (Roberts
et al., 1996). Angular particles, a property found in most crushed stone, provide a better
interlocking property than rounded particles and provide better performance and less
rutting under repetitive traffic loads. On the other hand, characteristics of fine
aggregates play an important role in pavement rut performance, as well (Chowdury et
al., 2001). Rutting also can be attributed to improper asphalt mix design such as high
asphalt content, excessive filler and high amounts of rounded aggregates in mix design
or insufficient asphalt layer thickness. Use of excessive asphalt cement in the mix
causes the loss of internal friction between aggregate particles, which results in the
loads being carried by the asphalt cement rather than the aggregate structure.
Mechanical deformation might be one of the mechanisms involved in rut development.
Mechanical deformation can occur when an element under the pavement surface loses
its integrity for one reason or another and is displaced under the load. A rut resulting
from this type of action will generally be accompanied by a substantial pattern cracking,
provided the distress is allowed to progress sufficiently (Kandhal, 1998). Several tests
exist that allow designers to evaluate the rutting potential in a lab environment, but there
is no direct correlation for the magnitude of lab rutting compared to magnitude of field
rutting (Kandhal and Cooley, 2002). Figure 2.3 shows the schematic permanent
deformation (rutting) in asphalt pavement under the wheel load.

40
Figure 2.3: Schematic rutting in pavement layers under the vehicle wheel load.
With the purpose of simulating the effect of actual traffic loads on the rutting
performance of pavements, Load Wheel Tracking machines or other types of
equipments, such as the Georgia Loaded Wheel Tester (GLWT), Asphalt Pavement
Analyzer (APA), Hamburg Wheel Tracking Device (HWTD) and LCPC (French)
Wheel Tracker are being used to evaluate the level of rut resistance of the compacted
asphalt mixtures in the laboratories.
2.6.5 Indirect Tensile (IDT) strength
The Indirect Tensile (IDT) Strength test is applied to measure the tensile properties of
the asphalt specimens which can be used to predict the future performance of the
flexible pavements. According to the experiments, the IDT strength test is a very good
indicator of mixture adhesion and the higher tensile strength results in better resistance
to rutting, fatigue and temperature cracking. However, to estimate the rutting potential
of the flexible pavement, it is necessary to consider its adhesion, internal friction,
volumetric properties, and IDT strength (Anderson et al., 2003; Christensen and
Bonaquist, 2002).
Some parameters such as binder type, asphalt content, sand content, nominal maximum
aggregate size, air voids content and gradation can highly affect the indirect tensile
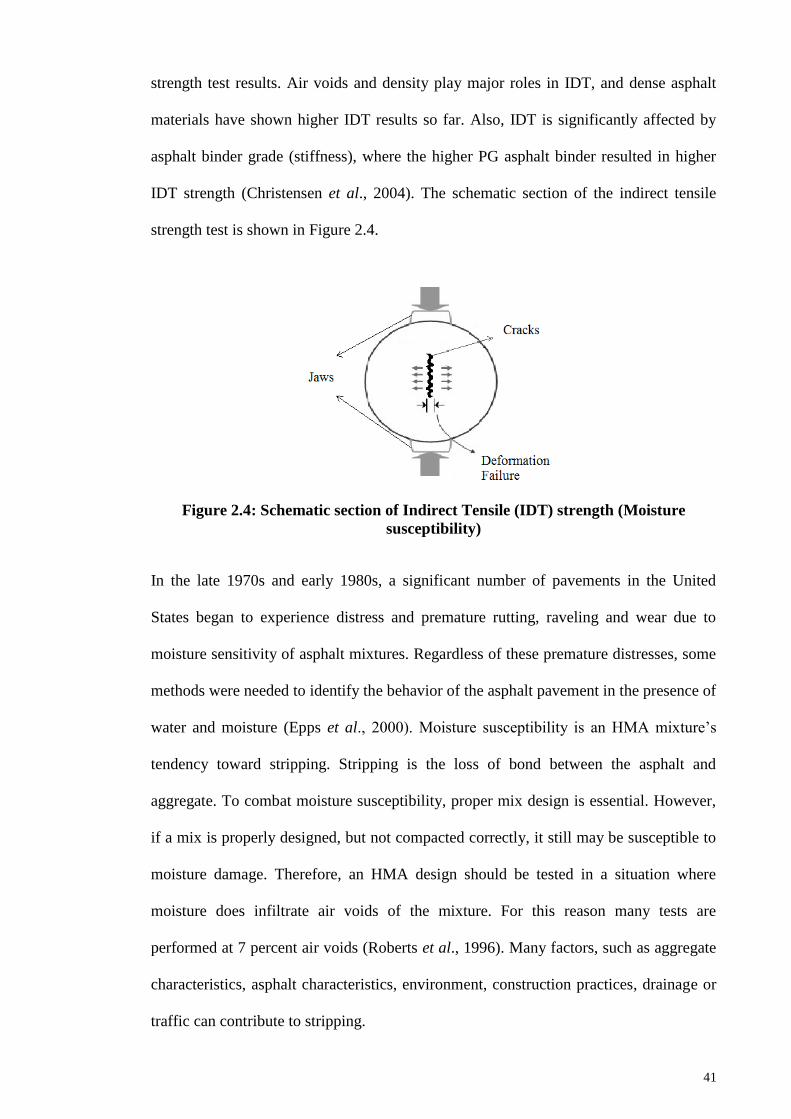
41
strength test results. Air voids and density play major roles in IDT, and dense asphalt
materials have shown higher IDT results so far. Also, IDT is significantly affected by
asphalt binder grade (stiffness), where the higher PG asphalt binder resulted in higher
IDT strength (Christensen et al., 2004). The schematic section of the indirect tensile
strength test is shown in Figure 2.4.
Figure 2.4: Schematic section of Indirect Tensile (IDT) strength (Moisture
susceptibility)
In the late 1970s and early 1980s, a significant number of pavements in the United
States began to experience distress and premature rutting, raveling and wear due to
moisture sensitivity of asphalt mixtures. Regardless of these premature distresses, some
methods were needed to identify the behavior of the asphalt pavement in the presence of
water and moisture (Epps et al., 2000). Moisture susceptibility is an HMA mixture’s
tendency toward stripping. Stripping is the loss of bond between the asphalt and
aggregate. To combat moisture susceptibility, proper mix design is essential. However,
if a mix is properly designed, but not compacted correctly, it still may be susceptible to
moisture damage. Therefore, an HMA design should be tested in a situation where
moisture does infiltrate air voids of the mixture. For this reason many tests are
performed at 7 percent air voids (Roberts et al., 1996). Many factors, such as aggregate
characteristics, asphalt characteristics, environment, construction practices, drainage or
traffic can contribute to stripping.
42
This test is not categorized as a performance-based test for asphalt mixes, but is for two
main purposes. The first is to show the moisture susceptibility of asphalt binder and
aggregate and the second is to measure the effectiveness of anti-stripping additives.
According to the Superpave, this value must be 80 percent or higher to prevent stripping
problems after construction (Asphalt Institute, 2007). Sufficient asphalt binder content
to coat the aggregates and proper compaction to achieve the expected density can
prevent damage due to the intrusion of water. However, in some cases the asphalt
mixtures require an additive to improve the moisture resistance of the mix, such as
hydrated lime and proprietary liquid anti-strip agents.
2.6.6 Fatigue cracking
Premature fatigue cracking seriously reduces the life of many in-service flexible
pavements. Most mechanistic design procedures are to obtain the desired fatigue life for
new pavements by considering the tensile stress (or strain) at the bottom of the bound
asphaltic layers. These design procedures assume that fatigue cracks originate at the
bottom of the bound layers and propagate vertically upwards towards the surface of the
pavement under the influence of the stress field produced by the contact between the tire
and pavement. At a normal contact pressure, the maximum horizontal tensile stress
occurs at the bottom of the bound layers, and the maximum horizontal compressive
stress occurs at the surface of the pavement. Fatigue cracking generally occurs with
loads, which are too heavy for the pavement or repetitive unexpected passes with traffic
or overweight trucks, and these problems become worse by inadequate pavement
drainage or thickness due to poor quality control during the construction (Roberts,
1996). Fatigue testing of asphalt mixtures has been the focus of numerous studies that
have utilized a variety of sample shapes, sizes, and testing apparatus (Matthews et al.,
1993).

43
Using rolling wheel compaction for preparation of fatigue specimens is more
recommended and for the most reliable prediction of field performance based on
laboratory specimens, use of rolling wheel compaction has been shown to produce
specimens with properties closer to actual field-cored samples. This method of sample
preparation has been successfully employed as a performance prediction tool to evaluate
the susceptibility of fatigue to both accelerated pavement testing and in-service
pavements (Harvey et al., 1994). Although fatigue has been generally accepted as
occurring more often in aged, brittle pavements, studies on aged samples indicate this
may be a consequence of accumulated damage and not necessarily related to binder
brittlement (Harvey and Tsai, 1997).
For thin pavements, fatigue cracking starts at the bottom of the HMA due to high tensile
strains and migrated upward toward the surface; whereas for thick pavements, cracks
start on the HMA surface due to tensile strains at the surface and migrated downward,
and if not properly repaired in time, this distress allows moisture to infiltrate and leads
to problems arising from moisture damage (Brown et al., 2001). Figure 2.5 illustrates a
fatigue failure of a pavement in the actual field.
Figure 2.5: Fatigue cracks in asphalt pavement
There are two types of controlled loading that can be applied in fatigue test: controlled-
stress (or force) and controlled-strain (or displacement). In the controlled-stress tests,
44
the stress remains constant and the strain increases with the number of repetitions. On
the other hand, in the controlled-strain tests, the strains are held constant and the stress
decreases with the cyclic strain application (Huang, 2004).
The controlled-stress loading represented the behavior of thick pavements where the
HMA layer was approximately more than six inches thick and the controlled-strain
loading mode was applicable to thin pavements, which the HMA layers are less than
two inches thick. According to Ghuzlan and Carpenter (2000), the fatigue life obtained
using controlled stress testing was shorter than the fatigue life obtained from the
controlled-strain testing.
Damage occurred faster in the controlled-stress testing than controlled-strain testing,
because the same stress was used during the test, whereas it decreased during
controlled-strain testing. increasing the voids content leads to a lower fatigue
performance; changes in aggregate type or grading has a small effect on the fatigue
response; and increasing the stiffness of the mix does not necessarily lead to poorer
fatigue behavior, although sample heating and machine compliance may be affecting the
results. Binder type can have the greatest affect and the rheology alone is insufficient to
predict fatigue performance. Other than asphalt properties, aggregate type, grading, and
mixture properties appear to affect the fatigue resistance of the asphalt mixes. Some
studies have shown that the initial stiffness is very much affected by the angularity of
the aggregate type, in which increased angularity increased the stiffness value up to
about 25% (Carswell et al., 1997).

45
CHAPTER III
3 METHODOLOGY
3.1 Engineering properties of the utilized materials
Aggregate is primarily responsible for the load supporting capacity of pavements, so
good aggregates must have the proper particle size and grading, acceptable toughness,
angular shape and other important specifications to meet the required standards.
Another key component is mastic, which consists of fines, fillers, binder and sometime
fibers (in SMA mixtures) which provide strong binding between the asphalt mixture
materials. The main challenge for pavement engineers is to make sure that the
engineering properties of the utilized materials are within the acceptable ranges based
on the relevant standards.
3.1.1 Los Angeles (LA) abrasion
The Los Angeles abrasion test determines the resistance of coarse aggregates to
abrasion, impact and grinding in a rotating steel drum containing specific numbers of
steel balls. The procedures for the LA abrasion test are fully illustrated in ASTM C 131.
Based on the ASTM standard, the maximum allowable value of LA abrasion for
pavement top layers is 30%.
Aggregates in asphalt pavement top layers near the pavement surface are subject to
abrasion under traffic loads and require more toughness than aggregates in lower layers,
where loads have dissipated or are not as concentrated. Relatively high resistance to
wear, as indicated by a low percentage of abrasion loss, is therefore a desirable
characteristic of aggregates to be used in asphalt pavement surface layers. However, an
aggregate with a higher level of abrasion might be used in lower layers of road
pavement, as vehicle loads have less impact on these.

46
3.1.2 Aggregate Impact Value (AIV)
This test is designed to determine the aggregate impact value of coarse aggregates in
accordance with BS 812 Part 3. The aggregate impact value is a measure of the strength
of an aggregate against impact loading. The initial aggregate sample should pass
through a 12.5 mm sieve but be retained by a 9.5 mm one. Several attempts to develop
an aggregate impact value (AIV) test have been made, but the most successful one is
subjecting the aggregate sample, held in a steel mold, to 15 blows of a metal hammer
weighing 14kg delivered from a height of 38cm. The aggregate sample is then removed
from the mold and the percentages of aggregates passing through a 2.36 mm sieve show
the aggregate impact value. Normally, an aggregate impact value of 15% or lower is
considered as suitable for road surfacing.
3.1.3 Aggregate Crushing Value (ACV)
The aggregate crushing value test is required to ensure that road surfacing aggregates
have a satisfactory resistance to crushing under a roller compactor during road
construction, and adequate resistance to surface abrasion from traffic wheel loads. This
test is designed to measure the resistance of an aggregate to crushing under a gradually
applied compressive load. The lower the value of the ACV test, the better resistance of
that particular aggregate to crushing.
We determined aggregate crushing value in accordance with BS 812: Part 3. A sample
of 14mm size chippings of the aggregate to be tested was placed in a steel mold and a
steel plunger was inserted into the mold on top of the chippings. The chippings were
subjected to a force rising up to 400KN over a period of 10 minutes. Based on the BS,
the aggregate crushing value should not exceed 30% to be suitable for pavement top
layers.

47
3.1.5 Polished Stone Value (PSV)
The PSV of an aggregate is a measure of resistance to the polishing action of vehicle
tires under conditions similar to those occurring on the surface of a road. The value is
established by subjecting the aggregate to a standard polishing process, and then testing
the aggregate with a Portable Skid Resistance Tester. The surface of the aggregates
tends to get polished due to the traffic. The degree of polishing depends on traffic
conditions, such as volume, weight, speed, acceleration, and braking, as well as the
nature of the aggregates. The PSV test procedure is fully described in BS 812, Part 3.
The skid resistance of pavements is an important element in pavement engineering. The
top surface layer of a pavement should be capable of providing adequate skid resistance
with the given mix; and the mix in question should also be capable of providing
sufficient stability to ensure the durability of the skid resistance. The value of PSV for
surface layers should be at least 40 or above to fulfill the minimum requirements laid
down in the relevant standards.
The polished stone value of aggregates can be calculated using Equation 3.1.
PSV= S + 52.5 - C (3.1)
Where
S = Mean sample skid value
C = Mean control sample skid value
3.1.6 Soundness
The soundness test measures the resistance of aggregates to disintegration due to
weathering. The aggregates are subjected to alternate cooling and heating cycles in the
presence of abrasive agents (generally chemical solutions) such as sodium or
magnesium sulfate. The abrasive agent penetrates fine cracks in the aggregates. Due to
repetitive drying and wetting, salts get deposited in the cracks and the cracks grow in
size, causing disintegration of aggregates along the weak shear plane (Kandhal et al.,

48
1997). The soundness test was carried out in accordance with the British Standard (BS
812, Part 3). This test is an empirical screening test of weathering and is useful to
evaluate new (unknown specifications) sources of aggregates. The sulfate soundness
test has been an accepted method of aggregate testing for many years, but despite this
acceptance, it has been widely criticized and several reports have shown its inability to
accurately predict aggregate performance in the field (Roberts et al., 1996).
3.1.6 Flakiness and elongation index
Flaky aggregate has less strength than cubical aggregate, and does not create the dense
matrix that well graded cubical aggregates are able to do, so it provides less texture
when used in surface dressing. Flaky is the term applied to aggregate or chippings that
are flat and thin in length or width. Aggregate particles are said to be flaky when their
thickness is less than 0.6 of their mean size.
The flakiness index is found by expressing the weight of the flaky aggregate as a
percentage of the aggregate tested. This can be done by grading the size fractions
obtained from a normal grading aggregate in special sieves (test plates) to test flakiness.
These sieves have elongated, rather than square, apertures and allow aggregate particles
to pass that have a dimension less than the normal specified size (0.6 of the normal
size). This grading process is normally performed by hand, because flaky chippings tend
to lie on the sieve surface rather than fall through the apertures. The flakiness test is
carried out in accordance with BS 812, part 3. According to the British Standard, the
flakiness index must be below 20 percent to be acceptable for use in asphalt pavements.
The elongation index of aggregates is the percentage by weight of particles whose
longest dimension (length) is greater than 1.8 times the mean dimension. The elongation
of the aggregates is measured in the same manner as flakiness, but using an elongation
gauge.

49
3.1.7 Specific gravity and absorption of aggregates
Specific gravity is one of the characteristics used to measure the volume occupied by
aggregate in various mixtures containing aggregates, such as asphalt mixtures. This
characteristic is also used to estimate the pores and voids in aggregates. According to
ASTM C 127 and ASTM C 128, the specific gravity of an aggregate is the ratio of the
weight of a unit volume of material to the weight of the same volume of water at 73.4°F
(23°C). These standards are used to measure specific gravity and the absorption of
coarse and fine aggregates respectively. The specific gravity of the aggregates used in
asphalt mixtures plays an important role in the longer-term performance of pavements.
White et al., (2001) believed the specific gravity of fine aggregates to be more
important than that of coarse aggregates. Kandhal et al., (1999) meanwhile used these
tests to determine the amount of asphalt binder absorbed by aggregates and the
percentage of voids in mineral aggregates (VMA). According to the ASTM standard,
the specific gravity of granite aggregate (type of aggregate) must be between 2.60 to
2.65, and aggregates within this range are acceptable for use in asphalt mixtures.
Specific gravity is critical information in designing asphalt pavements. It is used in
calculating air voids, voids in mineral aggregate (VMA), and voids filled with asphalt
(VFA). All of these characteristics are critical to a well performing and durable asphalt
mix.
The absorption of aggregates is the ability of aggregate particles to take in a liquid.
Water absorption is closely related to the porosity of aggregates, meaning the ratio of
the volume of the pores to the total volume of the particle. Water absorption can also be
an indicator of binder absorption in asphalt mixtures. A highly absorptive aggregate
could lead to a low durability asphalt mix. The specific gravity test can be used to
determine air voids as well. Bulk specific gravities are used to adjust the relative

50
quantities of the aggregate components used in an asphalt mixture to take account of the
differing specific gravities of various aggregates. There are three generally accepted
types of specific gravities for aggregates, depending on the defined volume of the
particles: apparent, bulk and effective specific gravity.
3.1.8 Angularity number
The shape of the particles forming aggregates can influence the workability and strength
characteristics of asphalt mixtures. Angular particles, such as crushed stone and gravels
and some natural gravels and sands, tend to interlock when compacted and resist
displacement. The best interlocking tends to be obtained when sharp-cornered and cube-
shaped aggregates are used in asphalt mixtures. It is therefore important to measure the
angularity of aggregates before these are used in asphalt mixtures, to prevent future
failures in the pavement. This test is fully described in BS 812, part 3. The angularity
value should be between 6 to 9 to fulfill the minimum requirement for road surfacing
layers laid down in the relevant standards.
The angularity number of aggregates can be measured using Equation 3.2.
Angularity Number (AN) = 67 – 100 [W/ (CG )] (3.2)
Where:
W = Weight (in grams) of aggregates in the cylinder.
C = Weight (in grams) of water required to fill the cylinder.
G = Specific gravity of aggregate
3.1.9 Aggregate particle size distribution (Gradation)
Aggregate particle size distribution is another concern for pavement engineers seeking
to design a durable and high performance pavement. Permanent deformation and fatigue
cracking (rutting) are the major types of distress modes experienced in the service life of
pavements. The gradation of aggregates in hot asphalt mixtures is also an important
A
A

51
aspect in pavement design which can affect fatigue and rutting (Golalipour et al., 2012;
Sousa et al., 1998). Roberts et al., (1996) found that gradation affects almost every
important property of asphalt mixtures, including stiffness, stability, durability,
permeability, workability, fatigue resistance, frictional resistance and resistance to
moisture damage.
To measure the gradation of aggregates, a sample of dry aggregates of known weight is
separated through a series of sieves with progressively smaller openings. Once
separated, the weight of particles retained on each sieve is measured and compared to
the total sample weight. The resulting particle size distribution is a percentage of
retained aggregates (by weight) on each sieve size. The results are usually expressed
either in a table or as figures. A typical graph uses the percentage of aggregate by
weight passing a certain sieve size on the y-axis, and a sieve size raised to the nth
power
(n = 0.45) is typically used as the x-axis units. Power grading curves (0.45) are very
helpful in assessing aggregate gradation characteristics and in making necessary
adjustments in mix designs. This curve was developed in the 1960s by the Federal
Highway Administration (FHWA) and for years has been the most widely accepted
method for plotting gradations for comparison to the maximum density gradation. The
0.45 power is known as a maximum density curve, and is represented by a straight line
from the lower left of the chart to the intersection of the desired maximum particle size,
plus the 100% passing line at the upper right of the chart.
In this study, the gradation of dense-graded hot mix asphalt and gap-graded stone mastic
asphalt specimens was designed in accordance with ASTM D3515 and the Asphalt
Institute (AI) respectively. Figures 3.1 and 3.2 represent the selected aggregate
gradations between the upper and lower boundaries used in this research for HMA and

52
SMA mixtures. Also, these aggregate gradations were used to calculate the Optimum
Asphalt Content (OAC) of each mixture based on the Marshall mix design procedure.
Figure 3.1: HMA aggregate gradation based on ASTM D3515
Figure 3.2: SMA aggregate gradation based on Asphalt Institute (2007)
0
10
20
30
40
50
60
70
80
90
100
0.01 0.1 1 10
Pa
ssin
g (
%)
Sieve size (mm)
Upper limit Lower limit Desired
0
10
20
30
40
50
60
70
80
90
100
0.01 0.1 1 10
Pa
ssin
g (
%)
Sieve size (mm)
Upper limit Lower limit Desired

53
3.2 Asphalt binder tests
Binders are thermoplastic materials that liquefy when heated and solidify when cooled.
Asphalt binders are characterized by their consistency or ability to flow at different
temperatures. It is therefore necessary either to define an equipment temperature or an
equipment consistency when comparing the temperature consistency characteristics of
one asphalt binder with another. The tests and specifications we used incorporated these
characteristics.
The following are the consistency tests we performed on asphalt binders:
- Penetration: This is one of the oldest empirical tests used to measure the
consistency of asphalt cement. The objective of penetration is to classify
bitumen samples into different grades by determining the consistency of the
bitumen. The penetration procedure is fully illustrated in ASTM D5. The test
can be run at the standard temperature (25°C) or at other temperatures such as
0.4 and 46°C. A typical penetration test consists of three measurements made on
the asphalt binder sample, and the results are averaged to provide the single test
value. Penetration is measured in units of 0.1mm, so the penetration value of
80/100 bitumen would be between 8mm and 10mm.
- Softening point: The softening point of a bitumen sample is measured by the
ring and ball (R & B) method in accordance with ASTM D36. The procedure is
fully illustrated. The softening point of bitumen is defined as the temperature at
which bitumen attains a particular degree of softening.
- Flash and Fire Point: Tar and bitumen, especially cutback bitumen, are
flammable liquids at high temperatures, so could catch fire if care is not
exercised during construction. It is therefore important to note the flash and fire
point of the particular bitumen being used so as to control the temperature of the

54
material during mixing and construction. The most common method to
determine the flash point of an asphalt binder is the Cleveland Open Cup (COC)
flash point test (ASTM D92). In this test, a small cup filled with bitumen is
subjected to a rise in temperature at a specified rate. A small flame of 0.16 in
diameter is applied to the surface of the cup containing molten bitumen at
specified intervals until a flash first appears at any point on the surface. That
particular temperature is considered as the flash point.
- Viscosity: The viscosity of a binder is a measure of its flow characteristics, and
the performance of a bituminous mix is greatly affected by its viscosity. This test
is in accordance with ASTM D4402. A Brookfield rotational Viscometer is used
to measure the binder viscosity. The viscosity grading of asphalt cement is based
on a viscosity measurement at 135°C (275°F). This temperature is selected
because it is close to the asphalt compaction temperature. The viscosity of
asphalt binders can also be measured at 60° C (140°F), as the highest actual
pavement temperature in the summer, or 170°C (329°F), which is approximately
the mixing and mixture laying down temperatures. The test results are
sometimes plotted on a viscosity-temperature graph with a line connecting the
two points. The slope of this line is an indication of the temperature
susceptibility of the asphalt binder (the greater the slope of the line, the greater
the temperature susceptibility of the asphalt binder).
3.3 Marshall mix design method and sample preparation
The Optimum Asphalt Content (OAC) of the HMA and SMA mixtures were measured
based on the Marshall mix design method, in accordance with ASTM D 1559. The
Marshall method is generally used for dense-graded Hot Mix Asphalts (HMA) using
Performance Graded (PG) binders, and which contain a maximum aggregate size of one

55
inch or less. However, it has also been successfully used for Stone Mastic Asphalt
(SMA) mix designs with acceptable performance results. Due to its simplicity, the
Marshal mix design method is still the most commonly used method for designing
asphalt mixtures (Tia, 2005).
We obtained granite aggregates, 80/100 penetration grade bitumen, fillers, oil palm
fibers and recycled concrete aggregates (RCA) for use in this research. The crushed
granite aggregates were provided by the Kajang rock quarry (located near Kuala
Lumpur). To obtain the RCA, (figure 3.3) concrete infrastructures were first demolished
and crushed into large chunks. The reinforcing steel bars were subsequently removed
and the concrete debris was transferred to a crusher machine to produce proper sized
aggregates. The RCA was produced from the structural normal weight concrete beams
from concrete laboratory of University of Malaya (UM). The concrete had a density of
2400 kg/cm3 and compressive strength of 40 MPa. Also, 80/100 binder was obtained
from the university materials suppliers. In order to produce better adhesion between the
aggregates and bitumen during the mix procedure and remove excessive dust from the
surface of the aggregates, the crushed concrete and granite aggregates were submerged,
washed and then dried well before being used in the asphalt mixtures.
Figure 3.3: RCA production from concrete reinforced beams
Next, the required amounts of aggregate, fillers and RCA were weighed and placed in
an oven at 200°C for 2 hours. The binder contents used in the asphalt mixtures varied
from 5 to 8.5% by the weight of the aggregates. The required quantity of 80/100 binder

56
was weighed and heated for a period of 1 hour at 150°C. Hot aggregates (including
RCA) were mixed with the binder at 160 ± 5°C until all the aggregates were coated.
However, to prevent binder drain down (in SMA mixtures), the loose form fibers (0.3
percent by the weight of total mix) were blended with the hot aggregates before the
binder was introduced. Finally, the weighed amount of filler was added and mixed
thoroughly. All the mixtures were conditioned for 4 hours at 150°C and then
compacted. Filter paper was fitted at the bottom of the hot mold and the mixture was
poured in three layers. The specimens were compacted with a Marshall compactor,
delivering 75 and 50 blows on each side of the HMA and SMA specimens respectively.
The maximum sizes of the aggregate in the HMA and SMA mixtures were 9.5mm and
12.5mm, in accordance with ASTM D3515 and Asphalt Institute (AI) standards.
Finally, five different percentages of RCA (0%, 20%, 40%, 60% and 80%) were
blended with virgin granite aggregates (by the total weight of the aggregates in the
mixture) to produce the HMA and SMA specimens. These percentages were divided
into three categories: coarse RCA (C-RCA), fine RCA (F-RCA), and a mix of both the
previous two (M-RCA) with the virgin aggregates (VA). In addition, a 0% RCA
mixture (100% VA mix) was used as a control mix. The fine RCA (F-RCA) contained
aggregate particle sizes of 2.36 mm and smaller; Coarse RCA (C-RCA) contained
aggregate particle sizes larger than 2.36 mm; and the mixture of F-RCA and C-RCA
together was called M-RCA.
3.3.1 Theoretical Maximum Density (TMD)
The theoretical maximum density (TMD) of the HMA and SMA mixtures was
measured in accordance with ASTM D2041 and the Rice Method. Three compacted and
one non-compacted (loose mixture) specimens were prepared from each set of Marshall
with equal binder content. The compacted specimens were tested in terms of density,

57
Marshall stability and flow tests, while the loose mixture was used for TMD
measurement. The asphalt mixture prepared for the TMD test was spread and separated
in a tray, weighed and vacuumed in a submerged condition for 25 minutes. Next, the
weight of the loose specimen (submerged in water) was measured. The theoretical
Maximum Density (TMD) was calculated using the following equations:
TMD= G (3.3)
G = {1 / [((1 - P ) / G )+P / G ]} (3.4)
G = (3.5)
Where:
TMD = Theoretical Maximum Density (g/cm3)
G = Maximum theoretical specific gravity
= Density of water (1g/cm3)
P = Asphalt content, percent by the weight of the mix
G = Effective specific gravity of the mix
G = Specific gravity of asphalt cement
A = Mass of dry specimen (g)
C = Mass of specimen in water (g)
3.3.2 Determination of Optimum Asphalt Content (OAC)
The Optimum Asphalt Content (OAC) of the HMA and SMA mixtures containing
different sizes and percentages of RCA was measured based on the Marshall Stability
(MS), density and air void values of the tested specimens. After all the data was
collected, plots were developed to show the relationship between the various properties
of Marshall Stability, Voids in Total Mix (VTM) and Density versus the binder content.
In accordance with the Marshall mix design method, the OAC was determined from the
mm
w
mm b se b b
mmCA
A
mm
w
b
se
b

58
percentage of asphalt content in the Stability, Density and VTM graphs. The stability
and density curves peaked at two different percentages of binder content. In addition,
4% air voids from the VTM curve were also selected as a third percentage of binder.
Finally, the average of these three values produced the OAC of the HMA and SMA
mixtures respectively for each level and size of RCA content.
3.4 Hot Mix Asphalt (HMA) and Stone Mastic Asphalt (SMA) slab preparation
The estimated OAC values obtained above were used to produce the HMA and SMA
slabs, and the required number of specimens were cored out and subjected to
performance tests. The target thickness of 65 mm and 4% air voids were used to
determine the amounts of required materials for each slab, using the same mixing
procedures and material temperatures as explained in Section 3.2 above. Equation 3.6
below was used to measure the mass of bituminous mixtures for the HMA and SMA
slab preparations. The asphalt mixtures were compacted with a target air void of 4%,
except for the moisture susceptibility test, for which the air void level was 6%. Based on
the aggregate gradations of the asphalt mixtures, the total amounts of coarse, fine and
fillers were 30%, 64% and 6% in the HMA and 76%, 14% and 10% in the SMA
mixtures respectively. For slab fabrication, 0%, 20%, 40%, 60% and 80% of virgin
granite aggregates were replaced (by weight of aggregates) with three different grades
of RCA (C-RCA, F-RCA and M-RCA) and mixture containing 100% virgin aggregates
(0% RCA) were used as control specimens.
M = 10-6
× L × l × h × TMD × (3.6)
M = Mass of slab (kg)
L = Interior length of mold (mm)
h = Thickness of slab (mm)
TMD = Theoretical Maximum Density (kg/m3)
100
100 v

59
v = Air voids (%)
3.5 Performance tests
To evaluate the volumetric and mechanical properties of the HMA and SMA mixtures
containing RCA, the asphalt specimens were subjected to a series of performance tests,
namely density and air void, Marshall stability and flow, voids in mineral aggregates
(VMA) and voids filled with asphalt (VFA), resilient modulus (MR), loaded wheel
tracking, indirect tensile (IDT) strength, moisture susceptibility and flexural fatigue
tests. For this purpose, a total of 78 and 156 core specimens of 100mm diameter with
target air voids of 4% (containing mineral filler) and 156 core specimens of 100mm
diameter with target air voids of 6% (containing hydrated lime stone powder as filler)
and 156 core specimens of 200mm diameter and 78 beam cut specimens were taken out
of the slabs and tested.
3.5.1 Bulk density and air void
The ASTM D2726 test method was used to determine the bulk specific gravity and
density of the compacted bituminous mixtures. Specifically, the bulk density was
measured by weighing in air and water using the following equations:
d = G (3.7)
G = (3.8)
Where:
d = Bulk density (g/cm3)
G = Bulk specific gravity of the mix
= Density of water (1 g/cm3)
W = Mass of specimen in air (g)
W = Mass of specimen in water (g)
mb
w
mb
SUBSSD
D
WW
W
mb
w
D
SUB

60
W = Saturated surface dry mass (g)
Second, a void analysis was carried out in accordance with ASTM D3203.
The voids of the specimens were measured using the following equations applying the
value of the measured Theoretical Maximum Density (TMD).
VTM = [1- ( )] 100 (3.9)
Where:
d = Bulk Density (g/cm3)
TMD = Theoretical Maximum Density (g/cm3)
3.5.2 Marshall stability (MS) and flow
Marshal stability and flow tests were carried out in accordance with ASTM D 1559. The
Marshall stability was calculated on the basis of the maximum load carried by the
compacted SMA and HMA specimens at 60° C (140° F), with a loading rate of two
inches per minute (50.8 mm/min). Meanwhile, the flow was determined from the
vertical deformation of the asphalt specimen at the same time during the Marshall
stability test (measured from the start of loading until the stability began to fall). The
Marshall Stability of asphalt specimens with variations in thickness was corrected using
the ASTM correlation ratio table shown in Appendix C. To measure the stability and
flow of the HMA and SMA specimens, each specimen was immersed in a water bath for
30 minutes at 60°C. The specimen was then removed from the bath and placed between
the jaws of the Marshal stability apparatus. The load was applied and the value of the
stability and flow was read and recorded.
3.5.3 Voids in Mineral Aggregates (VMA) and Voids Filled with Asphalt (VFA)
Voids in Mineral Aggregates (VMA) and Voids Filled with Asphalt (VFA) were
determined using the equations below:
SSD
TMD
d
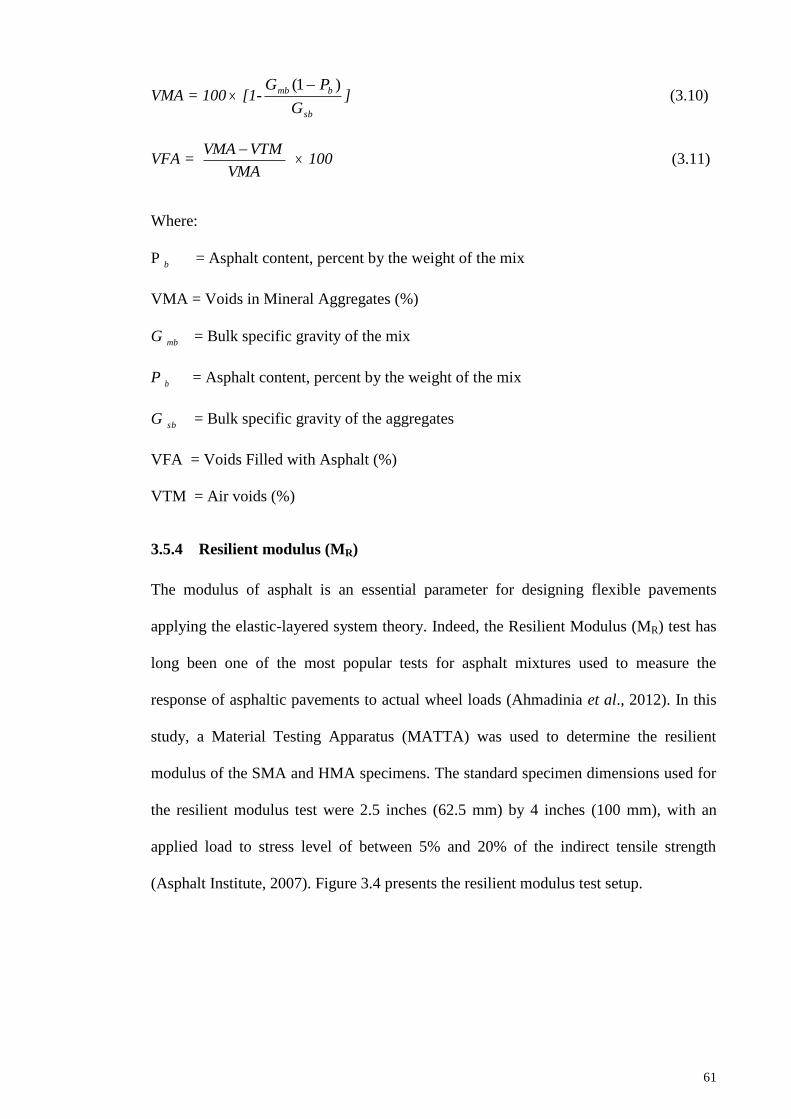
61
VMA = 100 [1- ] (3.10)
VFA = 100 (3.11)
Where:
P = Asphalt content, percent by the weight of the mix
VMA = Voids in Mineral Aggregates (%)
G = Bulk specific gravity of the mix
P = Asphalt content, percent by the weight of the mix
G = Bulk specific gravity of the aggregates
VFA = Voids Filled with Asphalt (%)
VTM = Air voids (%)
3.5.4 Resilient modulus (MR)
The modulus of asphalt is an essential parameter for designing flexible pavements
applying the elastic-layered system theory. Indeed, the Resilient Modulus (MR) test has
long been one of the most popular tests for asphalt mixtures used to measure the
response of asphaltic pavements to actual wheel loads (Ahmadinia et al., 2012). In this
study, a Material Testing Apparatus (MATTA) was used to determine the resilient
modulus of the SMA and HMA specimens. The standard specimen dimensions used for
the resilient modulus test were 2.5 inches (62.5 mm) by 4 inches (100 mm), with an
applied load to stress level of between 5% and 20% of the indirect tensile strength
(Asphalt Institute, 2007). Figure 3.4 presents the resilient modulus test setup.
sb
bmb
G
PG )1(
VMA
VTMVMA
b
mb
b
sb
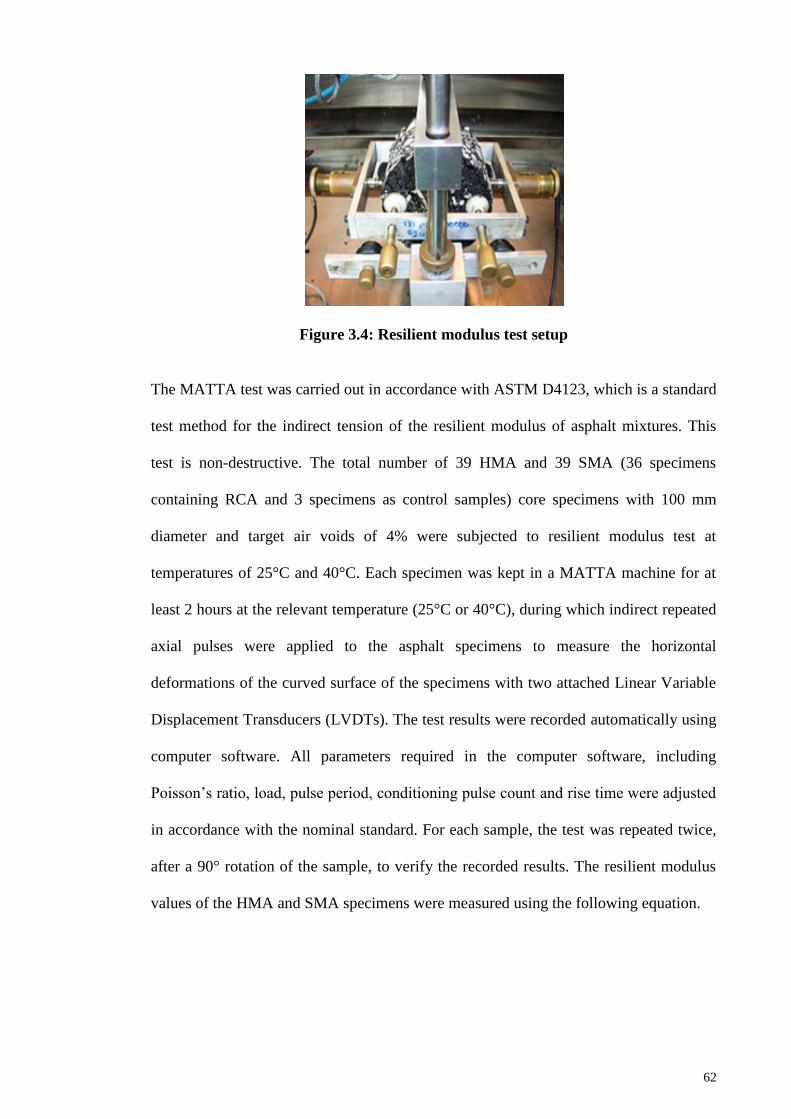
62
Figure 3.4: Resilient modulus test setup
The MATTA test was carried out in accordance with ASTM D4123, which is a standard
test method for the indirect tension of the resilient modulus of asphalt mixtures. This
test is non-destructive. The total number of 39 HMA and 39 SMA (36 specimens
containing RCA and 3 specimens as control samples) core specimens with 100 mm
diameter and target air voids of 4% were subjected to resilient modulus test at
temperatures of 25°C and 40°C. Each specimen was kept in a MATTA machine for at
least 2 hours at the relevant temperature (25°C or 40°C), during which indirect repeated
axial pulses were applied to the asphalt specimens to measure the horizontal
deformations of the curved surface of the specimens with two attached Linear Variable
Displacement Transducers (LVDTs). The test results were recorded automatically using
computer software. All parameters required in the computer software, including
Poisson’s ratio, load, pulse period, conditioning pulse count and rise time were adjusted
in accordance with the nominal standard. For each sample, the test was repeated twice,
after a 90° rotation of the sample, to verify the recorded results. The resilient modulus
values of the HMA and SMA specimens were measured using the following equation.

63
MR = (0.27+ ) (3.12)
Where:
MR = Resilient modulus (Psi)
P = Applied load (Pounds)
H = Total recoverable horizontal deformation (inches)
t = Sample thickness (inches)
= Poisson’s ratio
3.5.5 Loaded Wheel Tracking (LWT)
Rutting resistance is one of the most important and critical performance requirements of
asphalt mixtures, particularly in hot climates. There are several tests used to evaluate
rutting in asphalt mixtures, such as the Marshall test, wheel track test, static and
dynamic creep tests, and indirect tensile tests (Tayfur et al., 2007). The wheel tracking
test is the most commonly recommended of these tests, as it produces a more authentic
field simulation (Lu and Redelius, 2007). A Loaded Wheel Tracking (LWT) test was
accordingly conducted in accordance with BS 598-110 to determine the wheel tracking
rate and depth at 45°C for the moderate to heavily stressed sites. Table 3.1 shows the
maximum allowable rut depth and rut rate values of the asphalt mixtures at 45°C and
60°C respectively. Also, the loaded wheel tracking test setup is presented in figure 3.5.
Figure 3.5: Loaded wheel tracking test setup
Ht
P

64
In the present study, 78 SMA and 78 HMA core specimens (72 specimens containing
RCA and 6 control specimens made of virgin aggregates) of 200mm diameter were
cored out from fabricated slabs. Each core specimen was pre-conditioned at 45°C for 6
hours before starting the actual test. The loading wheel was set in motion to turn over
the specimen at the rate of 21 cycles per minute. A 520 5 N load was applied to the
surface of the specimen through a 50 mm wide moving wheel, and the rut depth value
was recorded every 5 minutes (105 cycles). The test was continued for 45 minutes or
until a 15mm deformation occurred in the specimen (whichever came first). The
Tracking Rate (TR) and Wheel Tracking Rate (WTR) were defined using the equations
below.
TR = 3.6 (rn - r(n-3)) + (r(n-1) – r(n-2)) (3.13)
WTR= 10.4 TRM (3.14)
Where:
rn = Depth measurement at n reading
WTR = Wheel tracking rate
TRM = Mean value of TR
= Width of wheel contact area
L = Total load
Table 3.1: British Standard requirements for rutting test (BS 598-110) Description Test temperature (°C) Max rut rate (mm/hr) Max rut depth (mm)
Moderate to
heavily stressed
sites requiring
high rut resistance
45 2 4
Very heavily
stressed sites
requiring very
high rut resistance
60 5 7
L
th

65
3.5.5 Indirect Tensile (IDT) strength
The Indirect Tensile (IDT) Strength test measures the tensile properties of asphalt
specimens so that these can be used to predict the future performance of flexible
pavements (road surfaces). Previous experiments show that the IDT strength test is a
very good indicator of mixture adhesion, with higher tensile strength resulting in better
resistance to rutting, fatigue and temperature cracking (Anderson et al., 2003;
Christensen et al., 2004; Christensen and Bonaquist, 2002). However, in order to
estimate accurately the rutting potential of a flexible pavement, its adhesion, internal
friction, volumetric properties and IDT strength all need to be taken into account. The
ID test setup is shown in figure 3.6.
Figure 3.6: Indirect tensile strength test setup
In this study, the Indirect Tensile Strength (IDT) of the specimens was evaluated in
accordance with ASTM D6931. The tensile characteristics of the SMA and HMA
mixtures were measured by placing the specimen between the machine jaws (13 mm
wide strip) and applying a compressive load at a constant strain rate of 50.8 mm/min (2
inch/min) at 25°C. The maximum vertical highest load (N) was recorded as a load to
66
failure, and the Indirect Tensile (IDT) Strength of the asphalt specimens was then
determined using the equation below.
S = 2000P/πtD (3.15)
Where:
S = IDT strength (kPa)
P = Maximum vertical load (N)
t = Thickness of the test specimen (mm)
D = specimen diameter (mm).
3.5.6 Moisture susceptibility
Moisture induced damage is the loss of bonding and adhesive failure between asphalt
mixture materials due to the presence of water in the structure of the pavement layers.
Many factors, such as aggregate characteristics, asphalt characteristics, environment,
construction practices, drainage or traffic can contribute to moisture damage and
stripping. However, the moisture susceptibility of asphalt mixtures can be improved by
using anti-stripping agents or specific kinds of fillers (Saad and Mohammad, 2005; Caro
et al., 2008).
The Indirect Tensile (IDT) Strength test is a common test to evaluate the moisture
susceptibility of pavement layers, with or without anti-stripping additives, to water and
moisture in accordance with AASHTO T283. Although conventional cored specimens
actually used in road building tend to have air voids lower than 6%, there is a risk that
air voids lower than 6% might not allow the specimens to become sufficiently damaged
during the laboratory test. Therefore, in this research, a number of HMA and SMA slabs
were fabricated with an air void target of 6% to serve as specimens for this test. The
total numbers of 78 core specimens with 100 mm diameter and 6% air voids (containing
mineral filler) and 78 core specimens with 100 mm diameter and 6% air voids

67
(containing hydrated lime powder) were provided for each type of asphalt mixtures
(HMA and SMA), including 72 specimens containing RCA and 6 specimens as control.
Previous research (Tomas et al., 2006; Sangsefidi et al., 2014; Xiao and Amirkhanian,
2009; Kim et al., 2012) further suggests that hydrated limestone can have a significant
impact on the performance of asphalt mixtures in terms of moisture susceptibility.
Accordingly, in this test two types of mineral filler and hydrated lime stone powder
were used to produce the asphalt specimens, and the effect of hydrated limestone
powder (as a total replacement for mineral fillers) on the moisture sensitivity of the
HMA and SMA mixtures was also evaluated. As the thicknesses of the asphalt
specimens varied due to different percentages of RCA content, all the asphalt specimens
were trimmed (from top and bottom) into the desired uniform thickness of 55 mm.
Finally, the selected HMA and SMA core specimens need to have approximately the
same average bulk density in each group. The specimens were divided into two groups:
conditioned specimens and unconditioned specimens. The purpose of this division was
to determine first the indirect tensile strength of the unconditioned specimens, and then
compare this with the conditioned group to ascertain the effect of moisture susceptibility
on the asphalt mixtures. The conditioned specimens were subjected to vacuum
saturation for 5 minutes; placed in a water bath for 24 hours at 60°C; and then, before
actual testing, all the specimens were submerged in the bath at 25°C for two hours. The
unconditioned specimens were meanwhile kept at room temperature. Subsequently, the
Tensile Strength Ratio (TSR) was measured for both the conditioned and dry specimens
using the following equation.
TSR =100 (3.16)
nedUnconditio
dConditione
S
S

68
The TSR value above represents the loss of strength caused by moisture conditioning,
and hence shows the performance of the asphalt mixture in terms of moisture
susceptibility. The TSR is usually expressed as a percentage, with a higher TSR value
indicating better resistance to moisture damage. Based on the relevant standards and on
previous experiments, the desired value for TSR should be higher than 80% in the
surface layer of pavements (Kenedy and Anagnos, 1984; Aksoy et al., 2005; Kok and
Yilmaz, 2009; Khodaii et al., 2012; Kim et al., 2012; Moghadas Nejad et al., 2012).
3.5.7 Flexural beam fatigue
A repeated flexure test was conducted to evaluate the fatigue properties of the asphalt
mixtures and to estimate the likely pavement life of different types of asphalt mixture
containing RCA. Repeated haversine loads were applied at the third points of a beam
specimen. The load rate was variable, but generally around 1 to 2 cycles per second.
This produces a constant bending movement over the center portions of the beam as it
seeks to return to its original position and to maintain the zero position during the rest
period. The deflection caused by the load is measured at the center of the beam.
In this study, the flexural fatigue beam test was carried out in accordance with
AASHTO TP8. For this purpose the compacted HMA and SMA slabs containing
various percentages of RCA were cut and trimmed into 380mm × 63.5mm × 50mm
beam samples. The total numbers of 39 HMA and 39 SMA (36 of them containing RCA
and 3 control specimens made of virgin granite aggregates) beams were cut out of the
fabricated slabs. Based on the AASHTO standard, the strain testing range should be
between 200 and 700 micro strains. Since fatigue is prominent within a temperature
range of 10C and 30C, a mean temperature of 20C is recommended for the test, and
this is the test temperature currently found in the AASHTO TP 8 standard.

69
The computer attached to the machine in our test was capable of measuring stiffness,
stress, dissipated energy and number of cycles (fatigue life). The beam specimens were
placed in the jig and held in place by a clamping device. The machine was then set to
induce an actuated cyclic constant strain of 500 micro strains. The higher end of the
testing range was selected for critical beam testing. A frequency of 10Hz was used to
provide cyclic intensity. The test temperature was set to 20C. The software
automatically captured the deflection of the beam and the changing stresses after each
application of strain rate, and saved these for future retrieval. The specimens were
strained to a maximum deflection of 500 micro strains. Some of the characteristics and
equations used to determine the beam fatigue properties are shown below:
t = (0.357)/ (bh2) (3.17)
where:
t = Maximum Tensile Stress
P= load applied by actuator (N)
b= average specimen width (m)
h= average specimen height (m)
and:
t = (12h)/3L2 – 4a
2) (3.18)
where:
t = Maximum Tensile Strain
= maximum deflection at center of beam (m)
a = Space between inside clamps, 0.357/3 (m) (0.119m)
L = length of beam between outside clamps, 0.357m
and:
S= t / t (3.19)
where:

70
S= Flexure Stiffness
t = Tensile Stress
t = Tensile Strain
and:
= 360fs (3.20)
where:
= Phase Angle
f= load frequency
s= time lag between Pmax and max (seconds)
and:
D= t t sin () (3.21)
D= Dissipated Energy (J/m3)
Cumulative Dissipated Energy = Di
where:
Di = D for the ith
load cycle
S= A ebn
(3.22)
where:
S= Initial Stiffness
e = natural logarithm
A = constant
b = constant
n = load cycles
3.6 Analysis of variance (ANOVA)
The main objective of this research is to evaluate the feasibility of utilizing RCA in
HMA and SMA mixtures. To achieve this objective and provide a deeper understanding
of the research, the analysis of variance (ANOVA) technique was applied to different

71
SMA samples, and the results were statistically contrasted and compared. In addition, a
single-factor and two-factor variance analysis (without replication) were also applied to
assess the significance of each of the factors involved in determining the performance of
the HMA and SMA specimens containing RCA.
ANOVA is not only a statistical method used to evaluate differences and relationships
between the means of two or more data sets, but also a guide to assist researchers to
determine the most likely differences to be expected from random variations in a given
set of measurements. In other words, ANOVA helps us to determine which factors are
more likely to have contributed to a given event. ANOVA is a robust and suitable
means to determine whether differences are statistically significant.
In this study, ANOVA was applied using SPSS software and Microsoft Excel – the
latter actually contains three different ANOVA functions, available through the
Analysis ToolPak, applicable to basic variance analyses. These are detailed below:
- Single Factor carries out a simple analysis of variance between two data sets.
- Two Factors without Replication performs a variance analysis between two or
more data sets. If there is only one sample from each data set, two factor without
replication is recommended.
- Two Factors with Replication is employed for a variance analysis shared by two
or more sets of data, in particular when the number of the samples is more than
one from each data set.
The main problem with using one factor is that this factor may mask a second factor.
This can be overcome by applying a single two-way ANOVA, which simultaneously
tests the effects of the two factors. The F-ratio refers to the probability of the

72
information generated by ANOVA: it compares the level of variation between groups
with the variation within the same groups. Generally speaking, when the F-ratio is
larger, the variation between the groups is more significant. The level of significance of
data sets can be evaluated using the F-ratio and by comparing it with the value of the F-
critical for each sample. When the F-ratio (F-statistic) is larger, the variation between
the groups is statistically significant. If, on the other hand, the F-ratio is smaller, the
differences between the scores may simply be the result of chance. The observed P-
value indicates the probability of the F-ratio being observed when the results of the
mean test are equal. When the P-value is smaller than the preferred significance level
(α), the corresponding variant is more significant. The significance level (α) applied to
this study is 0.05, representing a 5% probability of the hypothesis represented by the
model.

73
CHAPTER IV
4 RESULTS AND DISCUSSION
4.1 Introduction
This chapter discusses the results of the tests detailed in Chapter 3. High quality asphalt
mixtures need high quality materials, including acceptable ranges for aggregate
durability, angularity and other criteria for aggregates. Binder also plays a significant
role in asphalt mixtures. We therefore began the process by analyzing the test results of
the asphalt mixture materials: granite aggregates, Recycled Concrete Aggregates (RCA)
and asphalt binder. The results for all of these were compared with the minimum
requirements laid down in the relevant standards, to gauge the validity of the selected
materials. The Determination of Optimum Asphalt Content (OAC) was carried out in
accordance with the Marshall mix design procedure, using the optimum amount of 0.3
percent fiber by weight of total mix in all the Marshall sets for the Stone Mastic Asphalt
(SMA) preparation. The performance of the Marshall sets in terms of stability, density
and air voids (VTM) was plotted against the percentage of the binder so as to determine
the Optimum Asphalt Content.
This chapter also presents the performance test results of the SMA and HMA
compacted specimens containing five different percentages of RCA (0%, 20%, 40%,
60% and 80%). Each percentage was further divided into three parts, called Fine-RCA
(F-RCA), coarse-RCA (C-RCA) and a combination of fine and coarse RCA (M-RCA).
Table 4.1 lists the abbreviations of the various HMA and SMA mixtures. All the
specimens were subjected to density, stability, flow, resilient modulus, loaded wheel
tracking, indirect tensile strength (IDT), moisture susceptibility and flexural fatigue
tests, and the results were tabulated and compared.

74
Table 4.1: HMA/SMA Mixture Abbreviations
Mix Name Abbreviation
Virgin Aggregate VA
Coarse RCA + Fine VA C-RCA+F-VA
Fine RCA + Coarse VA F-RCA+C-VA
Coarse & Fine RCA + Coarse & Fine VA M-RCA+M-VA
4.2 Aggregate test results and analysis
Aggregate quality is a key determinant of the performance of asphalt mixtures; and the
performance of asphalt concrete mixtures is in turn greatly influenced by the properties
of the aggregate blend. The aggregate properties that significantly influence the
performance of asphalt mixtures are size, shape, strength and gradation, so these are the
properties of coarse and fine aggregates used in asphalt mixtures that must be checked
and tested.
4.2.1 Los Angeles abrasion
This test was carried out in accordance with the ASTM C131 standard, which states that
the value of the aggregates should not exceed 30 percent. Table 4.2 shows, the
measured values of Los Angeles abrasion for the granite aggregate and Recycled
Concrete Aggregate (RCA) were 18.3% and 24.5% respectively – which are acceptable
values based on ASTM C131 requirement.
Table 4.2: Los Angeles Abrasion Values of Granite and RCA
Aggregate size
(mm)
Aggregate weight
before test (g)
Aggregate weight
after test (g)
Weight loss
(g)
Wearing
(%)
Granite
9.5-12.5 2500 2093.1 406.9 16.2
12.5-19.0 2500 1989.5 510.5 20.4
Total 5000 4082.6 917.4 18.3
RCA
9.5-12.5 2500 1872.5 627.5 25.1
12.5-19.0 2500 1902.1 597.9 23.9
Total 5000 3774.6 1225.4 24.5

75
4.2.2 Aggregate Impact Value
This test was carried out in accordance with the British Standard (BS 812: Part 3),
according to which the aggregate Impact Value should not exceed 15 percent. The AIV
test results of granite and RCA are presented in Table 4.3 below.
Table 4.3: Aggregate Impact Values of Granite and RCA
Sample
No.
Aggregate
Size (mm)
Aggregate weight
before test (g)
Aggregate
weight
after test (g)
Weight
passing 2.36
mm sieve (g)
Wearing
(%)
Granite
1 10-14 620 583 37 5.97
2 10-14 620 580 40 6.45
Average 10-14 620 581.5 38.5 6.21
RCA
1 10-14 620 551 69 11.13
2 10-14 620 548.5 71..5 11.53
Average 10-14 620 549.75 70.25 11.33
As these results show, the impact value of the granite aggregates is considerably lower
than that of the RCA. However, both the granite and RCA materials are within the 15%
AIV threshold for use in asphalt mixtures.
4.2.3 Aggregate Crushing Value
The same standard was used for the Aggregate Crushing Value (ACV) test as for the
AIV test. However, in this case the ACV must not exceed 30 percent. The test results
are shown in Table 4.4 below. As was to be expected, the RCA showed lower resistance
to crushing than the granite aggregates. But again, both types of materials were within
the maximum acceptable range of 30% laid down in the British Standard.
Table 4.4: Aggregate Crushing Values of Granite and RCA Sample No. Aggregate
size (mm)
Aggregate weight
before test (g)
Aggregate weight
after test (g)
Weight passing
2.36 mm sieve (g)
ACV
(%)
Granite
1 10-14 1400 1143 257 18.36
2 10-14 1400 1074 326 23.28
Average 10-14 1400 1108.5 291.5 20.82
RCA
1 10-14 1400 1021 379 27.07
2 10-14 1400 986 414 29.57
Average 10-14 1400 1003.5 396.5 28.32
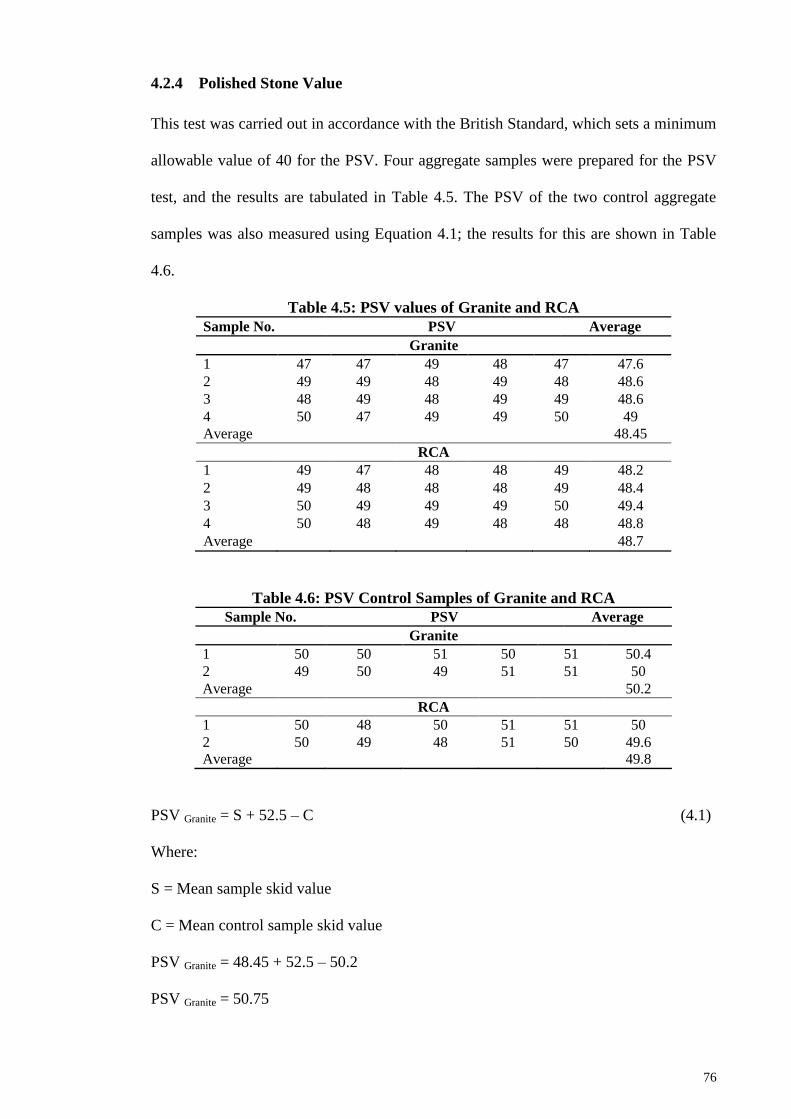
76
4.2.4 Polished Stone Value
This test was carried out in accordance with the British Standard, which sets a minimum
allowable value of 40 for the PSV. Four aggregate samples were prepared for the PSV
test, and the results are tabulated in Table 4.5. The PSV of the two control aggregate
samples was also measured using Equation 4.1; the results for this are shown in Table
4.6.
Table 4.5: PSV values of Granite and RCA
Sample No. PSV Average
Granite
1 47 47 49 48 47 47.6
2 49 49 48 49 48 48.6
3 48 49 48 49 49 48.6
4 50 47 49 49 50 49
Average 48.45
RCA
1 49 47 48 48 49 48.2
2 49 48 48 48 49 48.4
3 50 49 49 49 50 49.4
4 50 48 49 48 48 48.8
Average 48.7
Table 4.6: PSV Control Samples of Granite and RCA
Sample No. PSV Average
Granite
1 50 50 51 50 51 50.4
2 49 50 49 51 51 50
Average 50.2
RCA
1 50 48 50 51 51 50
2 50 49 48 51 50 49.6
Average 49.8
PSV Granite = S + 52.5 – C (4.1)
Where:
S = Mean sample skid value
C = Mean control sample skid value
PSV Granite = 48.45 + 52.5 – 50.2
PSV Granite = 50.75

77
and;
PSVRCA = S + 52.5 – C
PSVRCA = 48.70 +52.5 - 49.8
PSVRCA = 51.4
As can be seen, the Polished Stone Values of both the granite and RCA materials were
well within the limits set by the BS standard. Hence, both types of aggregates are
suitable for use in asphalt mixtures in terms of skid resistance and PSV values.
4.2.5 Soundness
According to the British Standard (BS 812: Part 3), the maximum allowable value of the
soundness test is 12 percent. The percentage of loss was calculated from Equation 4.2
below. The soundness values of the granite and RCA were measured according to this
equation, and the results are shown in Table 4.7.
Percentage of loss = {[(Aggregate weight before test) – (Aggregate weight after test)] /
(Aggregate weight before test)} 100 (4. 2)
Table 4.7: Soundness Test
Aggregate size
(mm)
Aggregate weight
before test (g)
Aggregate weight
after test (g)
Percentage of
loss (%)
Granite
19-38 1500 .0 1483.9 1.07
9.5-19 1500.2 1472.4 1.85
4.75-9.5 1500.4 1465.5 2.33
Total Loss 5.25
RCA
19-38 1500 .0 1479.7 1.35
9.5-19 1500.2 1463.9 2.42
4.75-9.5 1500.4 1459.2 2.75
Total Loss 6.52
As can be seen from the table, the soundness test for the granite and RCA materials
produced values of 5.25% and 6.52% respectively, both of which are well below the
maximum limit of 12% set by the relevant standard.

78
4.2.6 Flakiness and elongation index
This test was also carried out in accordance with BS 812: Part 3. The results for the
flakiness and elongation of the granite and RCA materials are shown in Tables 4.8 and
4.9 below. Equation 4.3, also below, was used to measure the percentage of the
flakiness index in the granite and RCA materials.
Table 4.8: Flakiness Index of Granite and RCA
Table 4.9: Elongation Index of Granite and RCA
Passing sieve
(mm)
Retained
sieve (mm)
Number of
aggregates
Number of
passing
Flakiness
index (%)
Granite
28 20 194 14 7.22
20 14 433 22 5.08
14 10 521 37 7.10
10 6.3 359 47 13.09
Average 8.12
RCA
28 20 183 5 2.73
20 14 419 17 4.06
14 10 532 24 4.51
10 6.3 348 35 10.05
Average 5.35
Aggregate Flakiness Index (%) = [(Number of aggregate passing) / (Total number of
aggregates)] 100 (4.3)
According to the BS standard, the maximum allowable value for the flakiness of
aggregate is 20 percent. The calculated values for both the granite and RCA materials
met this standard.
Passing sieve
(mm)
Retained
sieve (mm)
Number of
aggregates
Number of
passing
Flakiness
index (%)
Granite
28 20 194 8 4.12
20 14 433 37 8.54
14 10 521 39 7.48
10 6.3 359 41 11.42
Average 7.89
RCA
28 20 183 8 4.37
20 14 419 47 11.21
14 10 532 55 10.34
10 6.3 348 46 13.22
Average 9.79

79
4.2.7 Aggregate specific gravity and water absorption
The normal specific gravity of granite aggregates is between 2.6 and 2.65. However, as
might be expected, the specific gravity of RCA is lower than that of virgin granite
aggregates because of increased water absorption due to its more porous structure and
the presence of some attached mortars on the surface of the RCA. In order to ascertain
the actual specific gravity and water absorption of the RCA, the crushed concretes were
submerged in water, washed well, and then dried before being tested. The results are
shown in Table 4.10 below.
Table 4.10: Aggregate Specific Gravity
Specimen
No.
Weight of
sample in
air (g)
Weight of
sample in
water (g)
Saturated
weight (g)
Water
Absorption
Specific
gravity
Coarse Granite
1 1000 621.4 1004.6 0.46 2.609
2 1000 621.5 1004.2 0.42 2.613
Average 0.44 2.611
Fine Granite
1 1000 632.8 1009.7 0.97 2.653
2 1000 633.1 1012.5 1.15 2.636
Average 1.11 2.644
Coarse RCA
1 1000 569.2 1026.7 2.67 2.186
2 1000 569.5 1027.1 2.71 2.185
Average 2.69 2.185
Fine RCA
1 1000 630.5 1042.6 4.26 2.427
2 1000 629.8 1043 4.30 2.420
Average 4.28 2.423
Based on the laboratory experiments, the process of submerging the crushed concretes,
washing and drying them has a significant positive effect on the performance of the
RCA materials, considerably reducing their water absorption and increasing their
specific gravity. Fine recycled concrete aggregates are the most absorptive materials
with the absorption of almost 8%. Therefore the RCA materials were submerged,
washed and dried before being used in the asphalt mixtures to removed the excessive
cement and dust which was produced during crushing procedure an reduced the
absorption of fine RCA to 4.28 %.

80
4.2.8 Angularity number
This test was carried out in accordance with the same British Standard as earlier (BS
812: Part 3). Equation 4.4 was used to measure the angularity number of the granite and
RCA. The angularity number test results for the granite and RCA materials are
presented in Table 4.11.
Table 4.11: Angularity Number of granite and RCA
Sieve size (mm) Weight of aggregates (g)
A B C
Granite
5-6.3 409.5 408.5 411
6.3-9.5 791 799.5 793
9.5-14 1336.5 1334 1337.5
14-19 1786 1791 1788.5
Total 4323 4333 4330
RCA
5-6.3 439.5 439 438
6.3-9.5 762 765 763
9.5-14 1364 1366 1362.5
14-19 1721.5 1721 1724.5
Total 4287 4291 4288
Angularity Number (AN) = 67 – 100 [W/ (CG )] (4.4)
where:
W = Weight (in grams) of aggregates in the cylinder.
C = Weight (in grams) of water required to fill the cylinder.
G = Specific gravity of aggregate
W Granite = (4323 + 4333 + 4330) / 3
W Granite = 4328.7 g
C = 2733 g
G = 2.610
AN Granite = 67 – 100 [4328.7 / (2733 2.610)] = 6.31
and:
W RCA = (4287 + 4291 +4288) / 3
W RCA = 4288.7 g
A
A
A
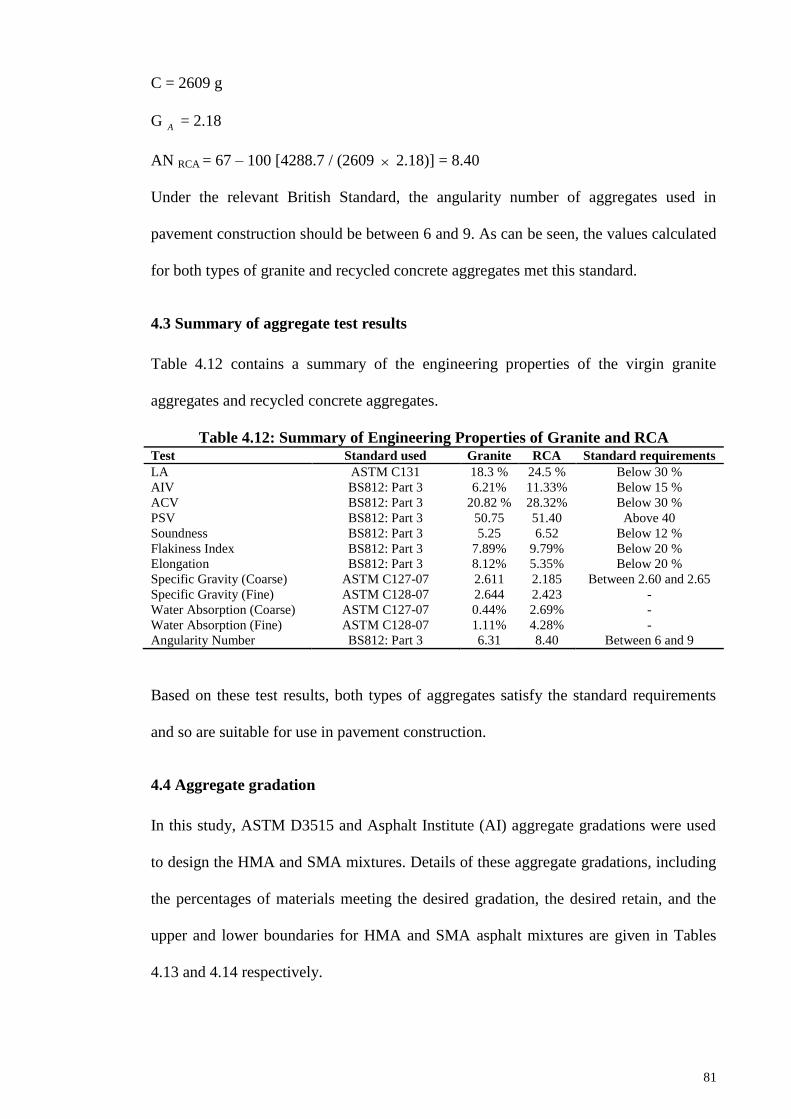
81
C = 2609 g
G = 2.18
AN RCA = 67 – 100 [4288.7 / (2609 2.18)] = 8.40
Under the relevant British Standard, the angularity number of aggregates used in
pavement construction should be between 6 and 9. As can be seen, the values calculated
for both types of granite and recycled concrete aggregates met this standard.
4.3 Summary of aggregate test results
Table 4.12 contains a summary of the engineering properties of the virgin granite
aggregates and recycled concrete aggregates.
Table 4.12: Summary of Engineering Properties of Granite and RCA Test Standard used Granite RCA Standard requirements
LA ASTM C131 18.3 % 24.5 % Below 30 %
AIV BS812: Part 3 6.21% 11.33% Below 15 %
ACV BS812: Part 3 20.82 % 28.32% Below 30 %
PSV BS812: Part 3 50.75 51.40 Above 40
Soundness BS812: Part 3 5.25 6.52 Below 12 %
Flakiness Index BS812: Part 3 7.89% 9.79% Below 20 %
Elongation BS812: Part 3 8.12% 5.35% Below 20 %
Specific Gravity (Coarse) ASTM C127-07 2.611 2.185 Between 2.60 and 2.65
Specific Gravity (Fine) ASTM C128-07 2.644 2.423 -
Water Absorption (Coarse) ASTM C127-07 0.44% 2.69% -
Water Absorption (Fine) ASTM C128-07 1.11% 4.28% -
Angularity Number BS812: Part 3 6.31 8.40 Between 6 and 9
Based on these test results, both types of aggregates satisfy the standard requirements
and so are suitable for use in pavement construction.
4.4 Aggregate gradation
In this study, ASTM D3515 and Asphalt Institute (AI) aggregate gradations were used
to design the HMA and SMA mixtures. Details of these aggregate gradations, including
the percentages of materials meeting the desired gradation, the desired retain, and the
upper and lower boundaries for HMA and SMA asphalt mixtures are given in Tables
4.13 and 4.14 respectively.
A

82
Table 4.13: HMA Aggregate Gradation Based on ASTM D3515
Sieve Size
(mm)
Upper Limit
(%)
Lower Limit
(%)
Desired Passing
(%)
Desired Retain
(%)
12.5 100 …… 100 0
9.5 90 100 95 5
4.75 55 85 70 25
2.36 32 67 50 20
0.3 7 23 15 35
0.075 2 10 6 9
Pan 0 0 0 6
Total 100%
Table 4.14: SMA Aggregate Gradation Based on Asphalt Institute (2007)
Sieve Size
(mm)
Upper Limit
(%)
Lower Limit
(%)
Desired Passing
(%)
Desired Retain
(%)
19 100 100 100 0
12.5 95 85 90 10
9.5 75 20 70 20
4.75 28 20 24 46
2.36 24 16 20 4
0.6 16 12 14 6
0.3 15 12 13 1
0.075 10 10 10 3
Pan 0 0 0 10
Total 100%
An aggregate particle size of 2.36 mm or smaller is considered as fine, while an
aggregate particle size larger than 2.36 mm is defined as coarse. Based on this, the total
amounts of coarse, fine and fillers were 30%, 64% and 6% in the HMA and 76%, 14%
and 10% in the SMA mixtures respectively.
4.5 Binder test results
80/100 penetration grade binder was used to produce the HMA and SMA specimens.
This section sets out the quality controls carried out on the 80/100 asphalt binder to
make sure it met the required specifications.
4.5.1 Penetration
The penetration test was carried out in accordance with ASTM D5. The test results are
presented in Table 4.15 below.

83
Table 4.15: Penetration of binder
No. of samples Penetration result
1 85
2 85
3 84
Average 84.66
The value of 84.66 is within the standard range for 80/100 penetration grade binders, so
this binder is suitable in terms of the penetration test.
4.5.2 Softening point
This test was carried out in accordance with ASTM D 36. Table 4.16 below shows the
results.
Table 4.16: Softening Point of binder
No. of samples Softening Point (°C)
1 47.5
2 48
Average 47.75
Generally, binders with higher softening points will perform better in hot mix asphalt
pavements. The value in this case of 47.25 is however acceptable for an 80/100 binder,
and meets the requirements for the bitumen in question.
4.5.3 Flash and fire point
This test was carried out in accordance with ASTM D92, and the results are shown in
Table 4.17 below.
Table 4.17: Flash and Fire Point of binder
Flash point (°C) Fire point (°C)
289 303
The calculated values show that this binder can be heated up to 289° C without any risk
of ignition.

84
4.5.4 Viscosity
The viscosity test was carried out in accordance with ASTM D 4402. The results are
shown in Table 4.18 below.
Table 4.18: Asphalt Viscosity
No. of samples Viscosity at 135°C (Pa.s) Viscosity at 165°C (Pa.s)
1 0.247 0.106
2 0.260 0.093
Average 0.254 0.099
The average viscosity values of 0.254 at 135°C and 0.099 at 165°C are reasonable for
an 80/100 binder as a viscoelastic material. It means that the material in question will
produce a high stiffness modulus at the service temperature and also be capable of
covering the aggregates with a thin film of asphalt binder.
4.6 Summary of asphalt test results
Table 4.19 below contains a summary of the asphalt binder test results. The values
obtained from this test show that this type of binder can fulfill the standard requirements
and so is suitable for use in pavement construction.
Table 4.19: Summary of Asphalt Test Results
Test Standard used Test results Standard
requirement
Penetration ASTM D5 84.66 84 - 95
Softening point ASTM D36 47.25 47 - 49
Flash point ASTM D92 289 275 - 302
Fire point ASTM D92 303 >302
Viscosity at 135°C ASTM D4402 0.254 -
Viscosity at 165°C ASTM D4402 0.099 -
4.7 OAC determination of HMA and SMA mixtures
The Marshall mix design method was used to determine the Optimum Asphalt Content
(OAC) of the HMA and SMA mixtures. As the RCA content of the asphalt mixtures
increases, their absorption capacity also increases. We therefore selected eight binders
with different percentages of RCA content, from 5% to 8.5%. For each of these binders,
three Marshall specimens were fabricated and tested in terms of density, Marshall
Per
cen
tage
of
Pas
sin
g (%
)

85
stability and air voids, in order to determine the optimum level of binder content for
each asphalt mixture. As described in Chapter three, an OAC measurement was carried
out in accordance with the Marshall mix design method. In order to ascertain the
optimum level of binder for each size and percentage of RCA, the maximums of the
density and stability curves were measured, and these were then taken as two values for
optimum binder content. In addition, a third value was measured from the 4% air void
level curve. Finally, the mean of these measured values was calculated, to produce the
Optimum Asphalt Content value. These tests and the results are described in more detail
below.
4.7.1 OAC of HMA mixtures containing F-RCA
The purpose of the Marshall mix design method is to select the best performing
gradation in terms of stability, density and 4% air voids. Figure 4.1 shows the density,
Marshal stability and VTM values of the HMA mixtures containing F-RCA. Further
details of the Marshall mix design, including tables, graphs and equations, are presented
in Appendix A.
R² = 0.9228
R² = 0.9091
R² = 0.9357
R² = 0.8686
R² = 0.9408
2.200
2.250
2.300
2.350
2.400
2.450
3.5 4 4.5 5 5.5 6 6.5 7 7.5 8 8.5 9
Den
sity
(g
r/c
m3)
Binder Content (%)
(a)

86
Figure 4.1: Density (a), Stability (b) and VTM (c) of the HMA mixtures containing
F-RCA versus binder content
The OAC values of the HMA mixtures containing various percentages of F-RCA were
measured. As Table 4.20 below shows, the OAC values ranged from 5.1% in the control
mix (0% RCA) to 7.3 in the HMA mixtures containing 80% F-RCA. The latter result
probably stems from the higher level of fines in the given HMA mixture. As presented
earlier in Table 4.14 (concerning aggregate gradations), 64% of the HMA mixture
consisted of aggregates with a particle size of 2.36 mm or smaller. As these fine granite
aggregates are replaced by higher proportions of F-RCA, higher levels of binder content
become necessary due to the higher absorption capacity of F-RCA than fine granite
aggregates.
R² = 0.908
R² = 0.8861
R² = 0.8765
R² = 0.9576
R² = 0.9157
7
7.5
8
8.5
9
9.5
10
10.5
3.5 4 4.5 5 5.5 6 6.5 7 7.5 8 8.5 9
Sta
bil
ity
(K
N)
Binder Content (%)
(b)
R² = 0.9826
R² = 0.9525
R² = 0.9878
R² = 0.9441
R² = 0.9811
2.5
3
3.5
4
4.5
5
5.5
6
6.5
3.5 4 4.5 5 5.5 6 6.5 7 7.5 8 8.5 9
VT
M (
%)
Binder Content (%)
(c)
Control Mix 20%F-RCA 40%F-RCA 60%F-RCA 80%-F-RCA

87
Table 4.20: OAC of HMA mixtures containing F-RCA
Mix Design Optimum Asphalt Content (%)
Control Mix (0% RCA) 5.1
20% F-RCA 5.5
40% F-RCA 5.9
60% F-RCA 6.5
80% F-RCA 7.3
4.7.2 OAC of HMA mixtures containing C-RCA
Figure 4.2 below presents the Density, Marshall Stability and VTM results for the HMA
mixtures containing C-RCA, while Table 4.21 shows the calculated optimum asphalt
content for the various HMA mixtures containing C-RCA. Together, these suggest that
the influence of coarse RCA on the optimum binder level of the asphalt mixtures is less
than that of fines. This minor change is because the total amounts of coarse aggregates
in the HMA mixtures was 30% which is less than half of the fines content in the
mixtures.
R² = 0.9243
R² = 0.9091
R² = 0.9144
R² = 0.9516
2.200
2.250
2.300
2.350
2.400
2.450
4 4.5 5 5.5 6 6.5 7 7.5 8 8.5
Den
sity
(g
r/c
m3)
Binder Content (%)
(a)
R² = 0.9699
R² = 0.9652
R² = 0.9159
R² = 0.9697
6.00
6.50
7.00
7.50
8.00
8.50
9.00
9.50
10.00
10.50
4 4.5 5 5.5 6 6.5 7 7.5 8 8.5
Sta
bil
ity
(K
N)
Binder Content (%)
(b)

88
Figure 4.2: Density (a), Stability (b) and VTM (c) of the HMA mixtures containing
C-RCA versus binder content
Table 4.21: OAC of HMA mixtures containing C-RCA
Mix Design Optimum Asphalt Content (%)
Control Mix (0% RCA) 5.1
20% C-RCA 5.4
40% C-RCA 5.5
60% C-RCA 6.2
80% C-RCA 6.8
4.7.3 OAC of HMA mixtures containing M-RCA
Figure 4.3 displays the Marshall properties of the HMA mixtures containing M-RCA,
while Table 4.22 sets out the OAC of these. As the latter shows, as the amount of M-
RCA increased from 20% to 80%, the OAC level increased from 5.4% to 7%. The
lower density and stability and higher VTM of the HMA mixtures containing RCA than
the control mix reflects the higher porosity and lower density of RCA compared to those
of granite aggregates.
R² = 0.9747
R² = 0.9394
R² = 0.9846
R² = 0.9784
2.00
2.50
3.00
3.50
4.00
4.50
5.00
5.50
6.00
4 4.5 5 5.5 6 6.5 7 7.5 8 8.5
VT
M (
%)
Binder Content (%)
(c)
20%C-RCA 40%C-RCA 60%C-RCA 80%C-RCA
R² = 0.9701
R² = 0.9399
R² = 0.9327
R² = 0.9644 2.260
2.280
2.300
2.320
2.340
2.360
2.380
2.400
2.420
2.440
3.5 4 4.5 5 5.5 6 6.5 7 7.5 8 8.5
Den
sity
(g
r/c
m3)
Binder Content (%)
(a)

89
Figure 4.3: Density (a), Stability (b) and VTM (c) of the HMA mixtures containing
M-RCA versus binder content
As demonstrated in Tables 4.12 and 4.13 earlier, RCA materials have a lower specific
gravity and higher water absorption than granite aggregates. As a result, regardless of
the size of the RCA particles, any replacement of virgin granite aggregates with RCA
inevitably raises the need for binder content and hence the OAC level.
Table 4.22: OAC of HMA mixtures containing M-RCA
Mix Design Optimum Asphalt Content (%)
Control Mix (0% RCA) 5.1
20% M-RCA 5.4
40% M-RCA 5.9
60% M-RCA 6.4
80% M-RCA 7.0
R² = 0.9582
R² = 0.8649
R² = 0.9495
R² = 0.9883
6.00
6.50
7.00
7.50
8.00
8.50
9.00
9.50
10.00
3.5 4 4.5 5 5.5 6 6.5 7 7.5 8 8.5
Sta
bsi
ty (
KN
)
Binder Content (%)
(b)
R² = 0.9628
R² = 0.986
R² = 0.9916
R² = 0.9787
2.50
3.00
3.50
4.00
4.50
5.00
5.50
6.00
6.50
3.5 4 4.5 5 5.5 6 6.5 7 7.5 8 8.5
VT
M (
%)
Binder Content (%)
(c)
20%M-RCA 40%M-RCA 60%M-RCA 80%M-RCA

90
4.7.4 OAC of SMA mixtures containing F-RCA
Figure 4.4 shows the Marshall properties of the stone mastic asphalt mixtures
containing F-RCA. Further details, including tables, figures and equations, are provided
in Appendix B. As shown in the aggregate gradation of the various SMA mixtures in
Table 4.14 earlier, the levels of coarse and fine contents were 76% and 14%
respectively. It is reasonable to assume that any replacement of coarse aggregates with
RCA should lead to major changes in the binder content of the SMA mixtures and in
their performance.
R² = 0.9961
R² = 0.9439
R² = 0.9599
R² = 0.9231
R² = 0.9168
2.275
2.285
2.295
2.305
2.315
2.325
4.5 5 5.5 6 6.5 7 7.5
Den
sity
(gr/c
m3)
Binder Content (%)
(a)
R² = 0.9288
R² = 0.78
R² = 0.7443
R² = 0.9453
6.50
7.00
7.50
8.00
8.50
4.5 5 5.5 6 6.5 7 7.5
Sta
bil
ity
(K
N)
Binder Content (%)
(b)

91
Figure 4.4: Density (a), Stability (b) and VTM (c) of the SMA mixtures containing
F-RCA versus binder content
The OAC values of the SMA mixtures containing F-RCA are displayed in Table 4.23,
based on plotted graphs. As mentioned earlier, the level of fines in this specific SMA
mixture was only 14% of the total aggregates present. The fines therefore have less
influence on the Marshall properties of the asphalt mixture. The OAC results reveal that
there was no substantial change between the control samples and the samples containing
80% F-RCA: as the level of F-RCA increased from 0% (in the control mix) to 80%, the
OAC value changed only from 6.2% to 6.5%.
Table 4.23: OAC of SMA mixtures containing F-RCA
Mix Design Optimum Asphalt Content (%)
Control Mix (0% RCA) 6.2
20% F-RCA 6.2
40% F-RCA 6.3
60% F-RCA 6.5
80% F-RCA 6.5
4.7.5 OAC of SMA mixtures containing C-RCA
The Density, Marshall Stability and VTM values of the SMA mixtures containing
various percentages of C-RCA were plotted against the binder content. Figure 4.5 shows
the results. The OAC values, derived from the peak of the density and stability curves
together with the 4% of VTM curves, are meanwhile set out in Table 4.24.
R² = 0.9463
R² = 0.9463
R² = 0.9618
R² = 0.9784
2.50
3.00
3.50
4.00
4.50
5.00
5.50
6.00
6.50
7.00
4.5 5 5.5 6 6.5 7 7.5 V
TM
(%
)
Binder Content (%)
(c)
Control Mix 20%F-RCA 40%F-RCA 60%F-RCA 80%-F-RCA

92
Figure 4.5: Density (a), Stability (b) and VTM (c) of the SMA mixtures containing
C-RCA versus binder content
It is clear from the OAC values of the SMA mixtures containing C-RCA shown in
Table 4.24 that the performance of the SMA mixtures was highly affected by the level
of coarse aggregates. 76% of the SMA mixtures used in this research contained coarse
aggregates. As the C-RCA content increased from 20% to 80%, the OAC values also
increased markedly from 6.4% to 8.9%
R² = 0.9745
R² = 0.9748
R² = 0.9651
R² = 0.8995
2.260
2.270
2.280
2.290
2.300
2.310
2.320
4.5 5 5.5 6 6.5 7 7.5 8 8.5 9 9.5 10
Den
sity
(g
r/c
m3)
Binder Content (%)
(a)
R² = 0.9497
R² = 0.969
R² = 0.9181 R² = 0.9723
5.00
5.50
6.00
6.50
7.00
7.50
8.00
4.5 5 5.5 6 6.5 7 7.5 8 8.5 9 9.5 10
Sta
bil
ity
(K
N)
Binder Content (%)
(b)
R² = 0.9759
R² = 0.9766 R² = 0.9896
R² = 0.9834
2.50
3.00
3.50
4.00
4.50
5.00
5.50
6.00
6.50
7.00
4.5 5 5.5 6 6.5 7 7.5 8 8.5 9 9.5 10
VT
M (
%)
Binder Content (%)
(c)
20%C-RCA 40%C-RCA 60%C-RCA 80%C-RCA

93
Table 4.24: OAC of SMA mixtures containing C-RCA
Mix Design Optimum Asphalt Content (%)
Control Mix (0% RCA) 6.2
20% C-RCA 6.4
40% C-RCA 7.0
60% C-RCA 7.9
80% C-RCA 8.9
4.7.6 OAC of SMA mixtures containing M-RCA
Figure 4.6 shows the Marshall properties of the SMA mixtures containing M-RCA. As
can be seen from Table 4.25, as the mixture of coarse and fine granite aggregates in the
SMA mixtures was replaced with M-RCA, higher levels of binder content were needed.
This is probably due to the higher porosity of the recycled concrete aggregates than the
virgin granite ones, which leads to higher absorption of the binder into the asphalt
mixture. Replacing the granite aggregates with M-RCA up to the level of 40% did not
produce any substantial change in the OAC values of the SMA mixtures; however, as
the M-RCA content increased from 40% to 80%, the OAC values increased
significantly from 6.6% to 7.8%.
R² = 0.9844 R² = 0.977
R² = 0.9793
R² = 0.9153
2.255
2.265
2.275
2.285
2.295
2.305
2.315
4.5 5 5.5 6 6.5 7 7.5 8 8.5 9
Den
sity
(g
r/cm
3)
Binder Content (%)
(a)

94
Figure 4.6: Density (a), Stability (b) and VTM (c) of the SMA mixtures containing
M-RCA versus binder content
Table 4.25: OAC of SMA mixtures containing M-RCA
Mix Design Optimum Asphalt Content (%)
Control Mix (0% RCA) 6.2
20% M-RCA 6.4
40% M-RCA 6.6
60% M-RCA 7.0
80% M-RCA 7.8
4.8 Performance test results
This section presents the performance tests results of the hot mix asphalt and stone
mastic asphalt core samples. A total of 390 core specimens of a 100mm diameter, 156
core specimens of 200mm diameter and 78 beams with the specific dimensions of
380mm × 63.5mm × 50mm were cored and cut out of the HMA and SMA slabs. As
mentioned earlier in Chapter 3, all the slabs were designed with an air void target level
of 4%, except for those used for the moisture susceptibility test, for which the VTM
R² = 0.9476
R² = 0.7774
R² = 0.7329
R² = 0.9884
5.50
6.00
6.50
7.00
7.50
8.00
4.5 5 5.5 6 6.5 7 7.5 8 8.5 9
Sta
bil
ity
(K
N)
Binder Content (%)
(b)
R² = 0.9847
R² = 0.9759
R² = 0.9614
R² = 0.9702
3.00
3.50
4.00
4.50
5.00
5.50
6.00
6.50
7.00
4.5 5 5.5 6 6.5 7 7.5 8 8.5 9
VT
M (
%)
Binder Content (%)
(c)
20%M-RCA 40%M-RCA 60%M-RCA 80%M-RCA

95
design was 6%, in line with the requirements of the relevant standard. The required
number of specimens were cored out of the HMA and SMA slabs and subjected to
different performance tests to evaluate the feasibility of using these types of recycled
concrete aggregates in dense-graded and gap-graded asphalt mixtures. The performance
tests applied to the core specimens of a 100mm diameter and 4% air voids were
Density, Air void, Marshall Stability, Flow, Resilient Modulus. The 100mm diameter
specimens containing 6% air voids were subjected to Moisture Susceptibility and
Indirect Tensile (IDT) Strength tests. The 200mm diameter core specimens were
meanwhile subjected to a wheel tracking test to measure the rut depth and rut rate of the
HMA and SMA mixtures containing RCA; while slab cut beam specimens were used
for a Flexural Beam Fatigue test
4.8.1 Bulk density and air void
Density and VTM tests were carried out in accordance with ASTM D 2726. The bulk
density of the core specimens of 100mm were measured by weighing them first dry,
then submerged in water, and finally in saturated surface dry conditions. The density
was then calculated from the relevant equations. The HMA and SMA core specimens
containing different sizes and percentages of RCA were subjected to this test. The
averages for bulk density and air void for the HMA and SMA specimens are shown in
Figures 4.7 and 4.8 respectively.
Figure 4.7: Average of Bulk Density (a) and VTM (b) of the HMA specimens
containing RCA
R² = 0.9947
R² = 0.9928
R² = 0.9948
2.280
2.300
2.320
2.340
2.360
2.380
2.400
2.420
2.440
2.460
0% 50% 100%
Den
sity
(g
r/c
m3)
RCA
(a) F-RCA C-RCA M-RCA
R² = 0.7381 R² = 0.8083
R² = 0.9626
3.9
3.95
4
4.05
4.1
4.15
0% 20% 40% 60% 80% 100%
VT
M (
%)
RCA
(b) F-RCA C-RCA M-RCA

96
Figure 4.8: Average of Bulk Density (a) and VTM (b) of the SMA specimens
containing RCA
To measure air voids, the HMA and SMA specimens were compacted with a target of
4% VTM content. The calculated VTM values indicate that, regardless of the RCA
content in the HMA and SMA asphalt mixtures, the air void can be kept under control.
The SMA specimens containing 80% C-RCA and 80% M-RCA had only slightly higher
VTM values than the other asphalt specimens, perhaps due to the breaking of the C-
RCA during compaction.
4.8.2 Marshall stability (MS) and flow
This test was carried out in accordance with ASTM D1559. The HMA and SMA core
specimens of 100mm diameter were each conditioned for 40 minutes in a water bath at
60° C and then subjected to Marshall stability and Flow tests. The volumes of the core
specimens were calculated, and the recorded stability values were adjusted using the
ASTM stability correlation ratio shown in Appendix C. The average of the corrected
stability and flow values of the HMA and SMA specimens were also plotted against
their RCA content: the results of this are shown in Figures 4.9 and 4.10 respectively.
R² = 0.9526
R² = 0.9994
R² = 0.9982
2.200
2.220
2.240
2.260
2.280
2.300
2.320
2.340
0% 20% 40% 60% 80% 100%
Den
sity
(g
r/c
m3)
RCA
(a)
F-RCA C-RCA M-RCA
R² = 0.8326
R² = 0.9141
R² = 0.8394
3.85
3.9
3.95
4
4.05
4.1
4.15
0% 20% 40% 60% 80% 100%
VT
M (
%)
RCA
(b)
F-RCA C-RCA M-RCA

97
Figure 4.9: Average of Marshal Stability (a) and Flow (b) of the HMA specimens
containing RCA
Figure 4.10: Average of Marshal Stability (a) and Flow (b) of the SMA specimens
containing RCA
Regardless of the level of RCA content in the asphalt mixtures, the Marshall Stability
values of the HMA specimens were found to be considerably higher than those of the
SMA specimens, due to the dense gradation of the aggregates in the HMA. The
calculated Marshall Stability (MS) values for the SMA and HMA mixtures containing
100% virgin aggregate (VA) were 10.63 and 14.63 KN. The test results indicate that
20% and 40% levels of F-RCA can increase the Marshall stability values of SMA
mixtures to 10.66 and 10.77 KN respectively. The flow values of both types of asphalt
mixture initially increased only gradually as the RCA content increased, but at 80% C-
RCA and M-RCA in the SMA and 80% F-RCA and M-RCA in the HMA specimens,
the flow values began to rise more significantly. According to the Asphalt Institute (AI),
the minimum stability value of SMA and HMA should be 6.2 KN and 9 KN
R² = 0.9631
R² = 0.9828
R² = 0.9872
7
8
9
10
11
12
13
14
15
0% 20% 40% 60% 80% 100%
Sta
bil
ity
(K
N)
RCA
(a)
F-RCA C-RCA M-RCA
R² = 0.992
R² = 0.9949
R² = 0.9653
3
3.5
4
4.5
5
5.5
6
6.5
7
7.5
0% 20% 40% 60% 80% 100%
Flo
w (
mm
)
RCA
(b)
F-RCA C-RCA M-RCA
R² = 0.8918
R² = 0.9925
R² = 0.9797
4
5
6
7
8
9
10
11
12
0% 20% 40% 60% 80% 100%
Sta
bil
ity
(K
N)
RCA
(a)
F-RCA C-RCA M-RCA
R² = 0.9996
R² = 0.991
R² = 0.9931
2
3
4
5
6
7
8
0% 20% 40% 60% 80% 100%
Flo
w (
mm
)
RCA
(b)
F-RCA C-RCA M-RCA

98
respectively. The F-RCA in the SMA and C-RCA in the HMA mixtures did not have
much impact; however, as the level of C-RCA and M-RCA increased to 80% in the
SMA mixtures, the stability values of these fell to 5.23 KN and 5.77 KN (both below
the AI specifications). In the HMA mixtures, on the other hand, almost all the
specimens produced acceptable stability values except for at 80% F-RCA and M-RCA
levels, for which the stability decreased to 7.91 and 8.4 KN.
3.8.3 Voids in Mineral Aggregates (VMA) and Voids Filled with Asphalt (VFA)
In the asphalt mixtures containing 100% VA, the calculated values of Voids in Mineral
Aggregates (VMA) and Voids Filled with Asphalt (VFA) were 15.55 and 73.91% in the
SMA and 15.44 and 73.64% in the HMA mixtures. The tests show that, as the level of
RCA increases in the asphalt mixtures, the VMA and VFA values increase as well.
Figures 4.11 and 4.12 summarize the VMA and VFA values of the HMA and SMA
mixtures containing RCA.
Figure 4.11: Average of VMA (a) and VFA (b) of the HMA specimens containing
RCA
R² = 0.9722
R² = 0.9975
R² = 0.998
15
15.5
16
16.5
17
17.5
18
0% 20% 40% 60% 80% 100%
VM
A (
%)
RCA
(a)
F-RCA C-RCA M-RCA
R² = 0.9543
R² = 0.9222
R² = 0.977
73.00
73.50
74.00
74.50
75.00
75.50
76.00
76.50
77.00
0% 20% 40% 60% 80% 100%
VF
A (
%)
RCA
(b)
F-RCA C-RCA M-RCA
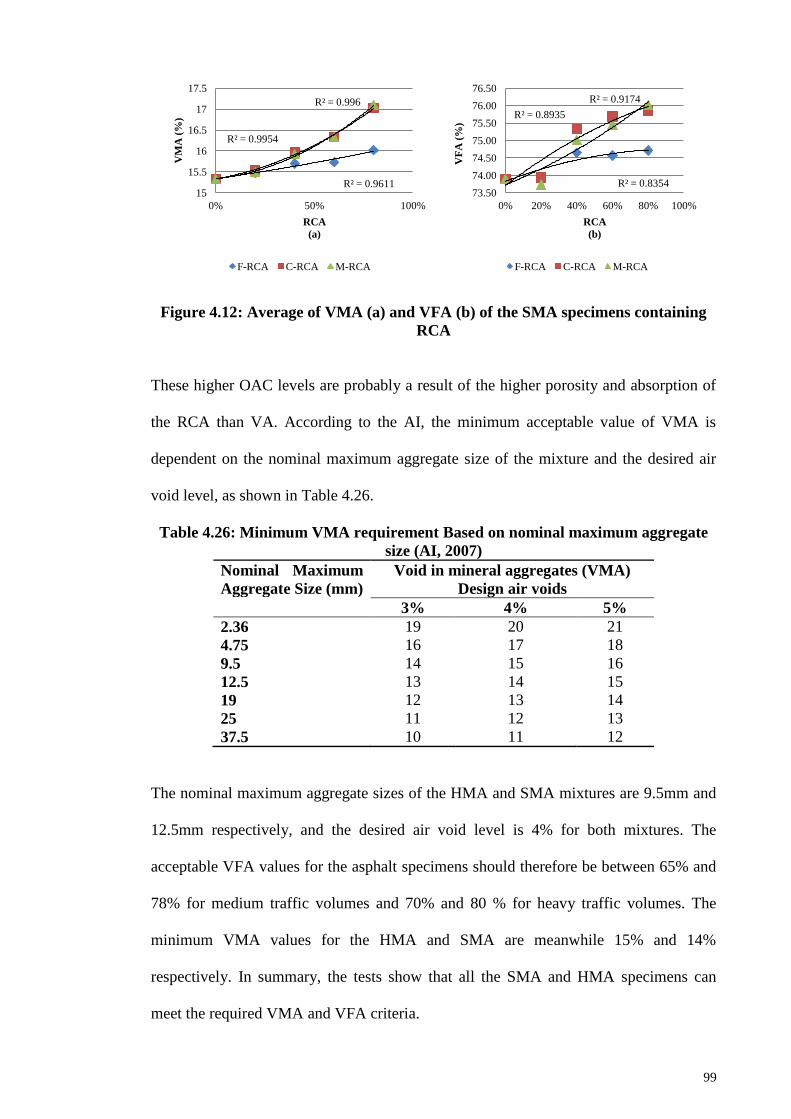
99
Figure 4.12: Average of VMA (a) and VFA (b) of the SMA specimens containing
RCA
These higher OAC levels are probably a result of the higher porosity and absorption of
the RCA than VA. According to the AI, the minimum acceptable value of VMA is
dependent on the nominal maximum aggregate size of the mixture and the desired air
void level, as shown in Table 4.26.
Table 4.26: Minimum VMA requirement Based on nominal maximum aggregate
size (AI, 2007)
Nominal Maximum
Aggregate Size (mm)
Void in mineral aggregates (VMA)
Design air voids
3% 4% 5%
2.36 19 20 21
4.75 16 17 18
9.5 14 15 16
12.5 13 14 15
19 12 13 14
25 11 12 13
37.5 10 11 12
The nominal maximum aggregate sizes of the HMA and SMA mixtures are 9.5mm and
12.5mm respectively, and the desired air void level is 4% for both mixtures. The
acceptable VFA values for the asphalt specimens should therefore be between 65% and
78% for medium traffic volumes and 70% and 80 % for heavy traffic volumes. The
minimum VMA values for the HMA and SMA are meanwhile 15% and 14%
respectively. In summary, the tests show that all the SMA and HMA specimens can
meet the required VMA and VFA criteria.
R² = 0.9611
R² = 0.9954
R² = 0.996
15
15.5
16
16.5
17
17.5
0% 50% 100%
VM
A (
%)
RCA
(a)
F-RCA C-RCA M-RCA
R² = 0.8354
R² = 0.8935
R² = 0.9174
73.50
74.00
74.50
75.00
75.50
76.00
76.50
0% 20% 40% 60% 80% 100%
VF
A (
%)
RCA
(b)
F-RCA C-RCA M-RCA
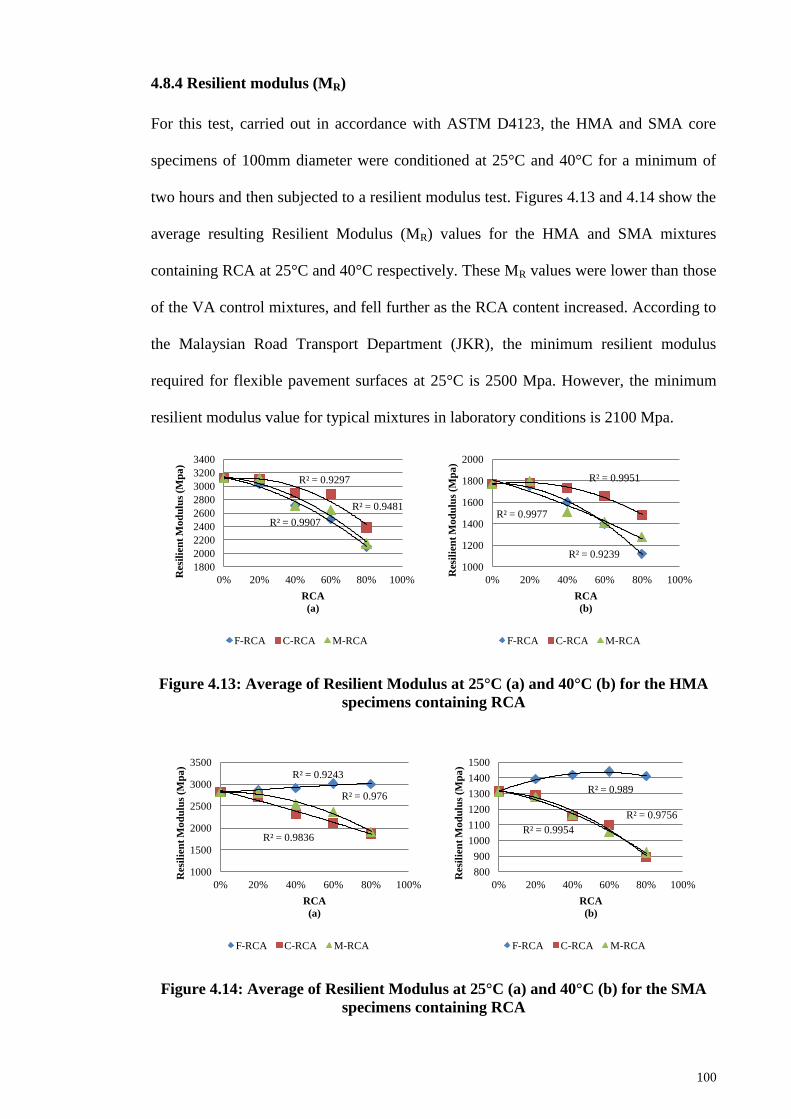
100
4.8.4 Resilient modulus (MR)
For this test, carried out in accordance with ASTM D4123, the HMA and SMA core
specimens of 100mm diameter were conditioned at 25°C and 40°C for a minimum of
two hours and then subjected to a resilient modulus test. Figures 4.13 and 4.14 show the
average resulting Resilient Modulus (MR) values for the HMA and SMA mixtures
containing RCA at 25°C and 40°C respectively. These MR values were lower than those
of the VA control mixtures, and fell further as the RCA content increased. According to
the Malaysian Road Transport Department (JKR), the minimum resilient modulus
required for flexible pavement surfaces at 25°C is 2500 Mpa. However, the minimum
resilient modulus value for typical mixtures in laboratory conditions is 2100 Mpa.
Figure 4.13: Average of Resilient Modulus at 25°C (a) and 40°C (b) for the HMA
specimens containing RCA
Figure 4.14: Average of Resilient Modulus at 25°C (a) and 40°C (b) for the SMA
specimens containing RCA
R² = 0.9907
R² = 0.9297
R² = 0.9481
1800
2000
2200
2400
2600
2800
3000
3200
3400
0% 20% 40% 60% 80% 100%
Resi
lien
t M
od
ulu
s (M
pa
)
RCA
(a)
F-RCA C-RCA M-RCA
R² = 0.9977
R² = 0.9951
R² = 0.9239
1000
1200
1400
1600
1800
2000
0% 20% 40% 60% 80% 100%
Res
ilie
nt
Mo
du
lus
(Mp
a)
RCA
(b)
F-RCA C-RCA M-RCA
R² = 0.9243
R² = 0.976
R² = 0.9836
1000
1500
2000
2500
3000
3500
0% 20% 40% 60% 80% 100%
Resi
lien
t M
od
ulu
s (M
pa
)
RCA
(a)
F-RCA C-RCA M-RCA
R² = 0.989
R² = 0.9756
R² = 0.9954
800
900
1000
1100
1200
1300
1400
1500
0% 20% 40% 60% 80% 100%
Resi
lien
t M
od
ulu
s (M
pa
)
RCA
(b)
F-RCA C-RCA M-RCA

101
The SMA specimens containing 20% and 40% F-RCA produced higher residual
modulus values than the VA control specimens, and the MR values increased slightly to
2860 and 2906 Mpa, while the MR values of the VA-SMA and VA-HMA were 2814
and 3119 Mpa respectively. The reduction of resilient modulus value in the asphalt
mixtures containing RCA are believed to be due to the higher percentage of binder
contents in the asphalt mixtures. In sum, all the HMA and SMA specimens met the
minimum requirements for residual modulus, except the SMA specimens containing
80% C-RCA and 80% M-RCA. The substantial fall in MR values in the SMA mixtures
when the coarse RCA content was increased was probably due to the higher levels of
coarse aggregates in SMA than in the HMA mixtures.
4.8.5 Loaded Wheel Tracking (LWT)
A Loaded Wheel Tracking (LWT) test was carried out, in accordance with the British
Standard (BS 598-110: 1998), to measure the susceptibility of the HMA and SMA
asphalt mixtures to plastic deformation at high temperatures by simulating road tire
pressure on the specimens. Stone Mastic Asphalt is a rut resistance asphalt mixture, so
should generally have higher resistance to permanent deformation (rutting) than hot mix
asphalt mixtures.
4.8.5.1 Wheel tracking depth
Figure 4.15 illustrates the loaded wheel tracking test results and the effect of C-RCA on
the HMA and SMA specimens in terms of permanent deformation. The rut depth values
for SMA mixtures with 0, 20, 40, 60 and 80% C-RCA content after 45 minutes were
1.65, 2.52, 3.63, 4.46 and 6.17mm respectively. The rut depth values for the HMA
mixtures containing the same level of C-RCA content were meanwhile 2.90, 2.91, 3.00,
4.09 and 6.33 mm. Expressing this in percentage terms, as the C-RCA content increased
from 0% (VA mix) to 20, 40, 60 and 80%, the rut depth values increased to 52.7%,

102
120%, 170.3%, 273.9% in the SMA and 0.34%, 3.45%, 41.03% and 118.27% in the
HMA specimens. In other words, the impact of the C-RCA on the SMA specimens was
considerably higher than on the HMA mixtures in terms of wheel tracking depth.
(a) (b)
Figure 4.15: Effect of C-RCA on rut depth of HMA (a) and SMA (b) specimens
Figure 4.16 illustrates the rut depth values of the HMA and SMA specimens containing
F-RCA. SMA mixtures with 0%, 20%, 40%, 60% and 80% F-RCA showed 1.65, 1.60,
1.41, 2.97 and 3.28 mm and HMA specimens showed 2.90, 2.96, 3.31, 4.47 and 7.08
mm rut depths after 45 minutes. Again, in percentage terms this means that, as the F-
RCA content rose from 0% to 80% in the HMA mixtures, the rut depth values increased
to 2.07%, 14.14%, 54.14% and 144.14% respectively. However, the rut depth results for
the SMA mixtures were rather different. With these, the rut depth in fact fell from
1.65mm in VA-SMA to 1.6 and 1.41mm in 20% and 40% F-RCA; but it then increased
to 2.97 and 3.28mm at 60% and 80% F-RCA levels. In other words, up to the 40% level
F-RCA had a positive effect on the rutting resistance of the SMA mixtures. This was
probably due to the higher density and Marshall Stability values of the SMA specimens
containing 20% and 40% F-RCA.
0.00
1.00
2.00
3.00
4.00
5.00
6.00
7.00
0 5 10 15 20 25 30 35 40 45 50
Ru
t D
ep
th (
mm
)
Time (min)
VA-HMA 20% RCA 40% RCA
60% RCA 80% RCA
0.00
1.00
2.00
3.00
4.00
5.00
6.00
7.00
0 5 10 15 20 25 30 35 40 45 50
Ru
t D
ep
th (
mm
)
Time (min)
VA-SMA 20% RCA 40% RCA 60% RCA 80% RCA

103
(a) (b)
Figure 4.16: Effect of F-RCA on rut depth of HMA (a) and SMA (b) specimens
The rut depth values of the HMA and SMA specimens containing M-RCA are shown in
Figure 4.17. As can be seen, the rut depth values of the SMA and HMA specimens
containing M-RCA were lower than the control mixes, and any increase in RCA content
in the asphalt mixtures increased their rut depth resistance values.
The relevant British Standard lays down a maximum allowable rutting rate at 45°C of
4mm (Table 3.1). Although the majority of rut depth values increased when RCA was
added in both the SMA and HMA mixtures, most of the specimens nevertheless met the
standard requirements. The exceptions were the SMA mixtures with 60% and 80% C-
RCA and M-RCA content, and the HMA mixtures with 80% C-RCA and M-RCA
content and 60 and 80% F-RCA content respectively.
(a) (b)
Figure 4.17: Effect of M-RCA on rut depth of HMA (a) and SMA (b) specimens
0.00
1.00
2.00
3.00
4.00
5.00
6.00
7.00
8.00
0 5 10 15 20 25 30 35 40 45 50
Ru
t D
ep
th (
mm
)
Time (min)
VA-HMA 20% RCA 40% RCA
60% RCA 80% RCA
0.00
0.50
1.00
1.50
2.00
2.50
3.00
3.50
0 5 10 15 20 25 30 35 40 45 50
Ru
t d
epth
(m
m)
Time (min)
VA-SMA 20% RCA 40% RCA
60% RCA 80% RCA
0.00
0.50
1.00
1.50
2.00
2.50
3.00
3.50
4.00
4.50
0 5 10 15 20 25 30 35 40 45 50
Ru
t D
ep
th (
mm
)
Time (min)
VA-HMA 20% RCA 40% RCA
60% RCA 80% RCA
0.00
1.00
2.00
3.00
4.00
5.00
6.00
0 5 10 15 20 25 30 35 40 45 50
Ru
t D
ep
th (
mm
)
Time (min)
VA-SMA 20% Mix 40% Mix
60% Mix 80% Mix

104
4.8.5.2 Wheel tracking rate
The wheel tracking rate W or rut rate is the second most important factor to be
considered in rutting studies. The rut rates of the control mixtures (0% RCA) were 0.34
mm/hr for the SMA and 0.40 mm/hr for the HMA. The rut rate values of the SMA and
HMA mixtures containing various levels of RCA are displayed in Figure 4.18. At all
levels of RCA content, the rut rate values of the HMA mixtures were considerably
higher than those of the SMA specimens. At the same time, the rut rate values of most
of the specimens were within the 2mm/hr BS requirement – the exceptions being 60%
and 80% C-RCA in the SMA specimens, whose rut rate values rose to 2.05 and 2.16
mm/hr respectively.
(a) (b)
Figure 4.18: Rut rate values of HMA (a) and SMA (b) mixtures containing RCA
Overall, the mixtures containing higher levels of RCA showed higher rut rates.
However, the differences between the rut rates for VA-SMA and 20% and 40% F-RCA
or VA-HMA and 20% and 40% C-RCA respectively were relatively small; whereas, as
the level of RCA increased beyond 40% to 60% and then 80%, the rut rates rose more
significantly. This is probably caused by the high amount of fines and low amount of
coarse aggregates in HMA, and the same phenomenon in reverse proportions in the
SMA aggregate gradation.
TR

105
4.8.6 Indirect Tensile (IDT) strength
The Indirect Tensile Strength (IDT) of the HMA and SMA specimens was evaluated in
accordance with ASTM D6931. Two types of fillers were used to provide a better
understanding of the impact of fillers on the IDT strength and moisture susceptibility of
the asphalt specimens. The first type was a standard mineral filler (MF) prepared by
sieving granite aggregates. The second was a hydrated limestone powder (HL) which,
based on some tests (Chapter 3), this filler is able to improve the moisture susceptibility
of the asphalt mixtures. The HMA and SMA specimens were tested as both conditioned
(C) and un-conditioned (UC) samples. The test results are presented below.
4.8.6.1 Indirect tensile strength of HMA mixtures
Figure 4.19 shows the average IDT strength values of the HMA specimens containing
F-RCA. These results show the HMA specimen containing 20% F-RCA and HL to be
the optimal mixture, with a UC-IDT strength value of 1075.85 kPa. The average UC-
IDT strengths of the control specimens (100% VA) were 1050.38 kPa and 1055.01 kPa
for the HMA specimens containing MF and HL respectively, both slightly lower than
the optimal value. The results further indicate that utilizing HL instead of MF as filler in
the HMA specimens containing F-RCA does not have much impact on UC-IDT
strength. However, the impact of HL compared with MF on C-IDT strength was more
substantial.
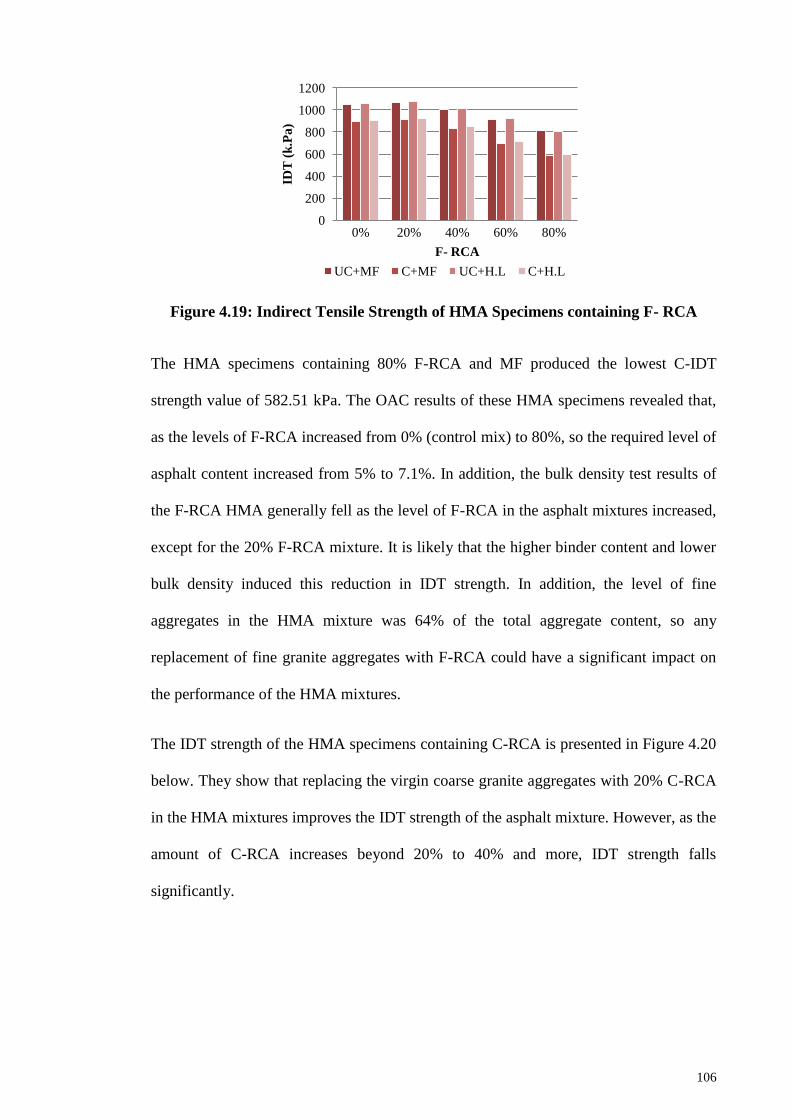
106
Figure 4.19: Indirect Tensile Strength of HMA Specimens containing F- RCA
The HMA specimens containing 80% F-RCA and MF produced the lowest C-IDT
strength value of 582.51 kPa. The OAC results of these HMA specimens revealed that,
as the levels of F-RCA increased from 0% (control mix) to 80%, so the required level of
asphalt content increased from 5% to 7.1%. In addition, the bulk density test results of
the F-RCA HMA generally fell as the level of F-RCA in the asphalt mixtures increased,
except for the 20% F-RCA mixture. It is likely that the higher binder content and lower
bulk density induced this reduction in IDT strength. In addition, the level of fine
aggregates in the HMA mixture was 64% of the total aggregate content, so any
replacement of fine granite aggregates with F-RCA could have a significant impact on
the performance of the HMA mixtures.
The IDT strength of the HMA specimens containing C-RCA is presented in Figure 4.20
below. They show that replacing the virgin coarse granite aggregates with 20% C-RCA
in the HMA mixtures improves the IDT strength of the asphalt mixture. However, as the
amount of C-RCA increases beyond 20% to 40% and more, IDT strength falls
significantly.
0
200
400
600
800
1000
1200
0% 20% 40% 60% 80%
IDT
(k
.Pa
)
F- RCA
UC+MF C+MF UC+H.L C+H.L

107
Figure 4.20: Indirect Tensile Strength of HMA Specimens containing C- RCA
The highest IDT strength value obtained in the test was 1066.59 kPa in the HMA
specimens containing 20% C-RCA and HL as filler, while, the lowest value was 694.85
kPa in the conditioned HMA specimens containing 80% C-RCA and MF. Turning to
the bulk density test, as the amounts of C-RCA increased from 0% (control mix) to 20%
in the HMA mixtures, the average bulk density rose slightly from 2.435 g/cm3 to 2.441
g/cm3 (with little or no OAC change), producing a higher IDT strength value. As the
amount of C-RCA increased from 20% to 80%, the bulk density fell significantly while
the level of binder needed increased from 5.2 % to 6.6 % - thus resulting in a reduction
in IDT strength.
The average IDT strength values of the HMA specimens containing M-RCA are
displayed in Figure 4.21. These show that using HL as filler instead of MF has no
significant effect on the IDT strength properties of the specimens, with the exception of
the specimens containing 20% M-RCA. The average UC-IDT strength of the specimens
containing 20% M-RCA and HL was 1080.49 kPa – higher than the UC-IDT strength of
the HMA specimens containing 100% VA (and HL) or the HMA specimens containing
20% M-RCA (and MF), both which had an average value of 1055.01 kPa.
0
200
400
600
800
1000
1200
0% 20% 40% 60% 80%
IDT
(k
.Pa
)
C- RCA
UC C UC+HL C+H.L

108
Figure 4.21: Indirect Tensile Strength of HMA Specimens containing M- RCA
Finally, the lowest average IDT strength of 634.63 kPa came from the C-IDT in the
HMA specimens containing 80% M-RCA and MF. The IDT Strength of the HMA
mixtures containing M-RCA may have stemmed from the bulk density and OAC values
of the specimens. As the levels of M-RCA increased from 0% to 20% in the HMA
specimens, the bulk density values increased, from 2.435 g/cm3
to 2.441 g/cm3, while
the OAC showed only a small increase of 0.3%. However, as the levels of M-RCA
content increased from 20% to 40%, 60% and 80%, the bulk density values fell to 2.391
g/cm3, 2.360 g/cm
3 and 2.310 g/cm
3 respectively, and the optimum asphalt content
increased to 5.7%, 6.2% and 6.8%.
4.8.6.2 Indirect tensile strength of SMA mixtures
Figure 4.22 below summarizes the results of the indirect tensile strength tests on the
various SMA specimens. These include specimens containing different percentages of
F-RCA; both conditioned and unconditioned specimens; and those containing mineral
filler (MF) or hydrated limestone powder (HL) respectively.
0
200
400
600
800
1000
1200
0% 20% 40% 60% 80%
IDT
(k
Pa
)
M- RCA
UC C UC+HL C+H.L

109
Figure 4.22: Indirect Tensile Strength of SMA Specimens containing F- RCA
The first thing to note is that, while using HL rather than MF filler had no significant
effect on the indirect tensile strength of the unconditioned SMA specimens containing
F-RCA, it did increase the IDT strength of the conditioned specimens. Second, the
unconditioned SMA specimens containing 40% F-RCA had the highest indirect tensile
strength for the mixtures containing both MF and HL. The lowest average IDT strength
was 605.67 kPa for the conditioned specimens containing 80% F-RCA and MF as filler;
while the highest average IDT strength was 858.14 kPa for the SMA specimens
containing 40% F-RCA and HL as filler. In other words, replacing the granite fines with
up to 40% F-RCA improved the IDT strength of the SMA mixtures.
Looking at bulk density, the average bulk density of the SMA specimens increased from
2.317 g/cm3 in the control specimens (100% VA) to 2.328 g/cm
3 in the specimens
containing 40% F-RCA. In contrast, the density of the specimens containing 80% C-
RCA decreased to 2.288 g/cm3. The higher density of the SMA specimens containing
40% F-RCA and lower density of the SMA specimens containing 80% F-RCA
presumably caused their higher and lower IDT strength values. The average IDT
strength values of the SMA specimens containing C-RCA are displayed in Figure 4.23
below.
0
200
400
600
800
1000
0% 20% 40% 60% 80%
IDT
(k
.Pa
)
F- RCA
UC+MF C+MF UC+HL C+H.L

110
Figure 4.23: Indirect Tensile Strength of SMA Specimens containing C- RCA
The SMA specimens containing 100% VA (control mix) and HL as filler produced an
unconditioned IDT strength value of 836.13 kPa, slightly higher than the control
specimens containing MF with a value of 832.66 kPa. 836.13 kPa was therefore the
optimum value in terms of IDT strength. However, as with the SMA specimens
containing 80% F-RCA, the conditioned specimens containing 80% C-RCA produced a
much lower value of 425.01 kPa – the lowest of all those obtained. The bulk density
values of the SMA specimens containing C-RCA fell significantly as the amount of C-
RCA increased in the SMA mixtures. However, the OAC values rose from 6.1% in the
VA-SMA to 8.6% in the SMA specimens containing 80% C-RCA. The higher bitumen
content and lower density may well have caused this. In addition, 76% of the total
aggregates in the SMA specimens were coarse aggregates, and SMA mixtures are
normally more sensitive to the quality of the coarse aggregates than fines or fillers.
Moreover, the LA, AIV and ACV test results of the recycled concrete aggregates were
considerably lower than those for the virgin granite aggregates. The higher C-RCA
content in the SMA mixtures was presumably therefore one of the reasons for the
greater changes in terms of indirect tensile strength values.
0
200
400
600
800
1000
0% 20% 40% 60% 80%
IDT
(k
.Pa
)
C- RCA
UC+MF C+MF UC+HL C+H.L

111
The average IDT strength values of the SMA specimens containing M-RCA are shown
in Figure 4.24 below. These show that replacing VA with M-RCA resulted in lower
IDT strength. The unconditioned SMA specimens containing 100% VA and HL as filler
produced the highest value of 836.13 kPa, slightly higher than the SMA specimens
containing 100% VA and MF with an IDT strength value of 823.66 kPa.
Figure 4.24: Indirect Tensile Strength of SMA Specimens containing M- RCA
In summary, regardless of the RCA particle size, the IDT strength of the asphalt
mixtures generally fell as their RCA content increased – except for the 20% and 40% F-
RCA mixtures, which showed increased IDT strength. In addition, the IDT strength
values fell by much more in the SMA specimens containing C-RCA, due probably to
the higher amounts of coarse aggregates in these SMA mixtures.
4.8.7 Moisture susceptibility
The Tensile Strength Ratio (TSR) of the asphalt specimens was measured as a ratio of
the indirect tensile (IDT) strength of the conditioned to dry specimens. This section
presents the TSR values of the SMA and HMA specimens containing RCA, which
represent the reduction in IDT strength after the specimens were submerged in a 60°C
water bath for 24 hours. This reduction in IDT strength is caused by the loss of adhesive
bonds between the mixture materials due to the presence of water or moisture –
otherwise known as moisture susceptibility or moisture induced damage.
0
200
400
600
800
1000
0% 20% 40% 60% 80%
IDT
(k
.Pa
)
M- RCA
UC+MF C+MF UC+HL C+H.L

112
4.8.7.1 Tensile Strength Ratio of SMA and HMA mixtures containing F-RCA
Figure 4.25 summarizes the TSR values of the SMA and HMA specimens containing F-
RCA. The tests on the SMA specimens containing 0% RCA (control mix) showed that
the TSR values increased from 84% to 91% when HL was used instead of MF in the
asphalt mixtures. In other words, hydrated lime powder considerably improved the
moisture damage resistance of the control SMA mixtures.
Figure 4.25: Tensile Strength Ratio of SMA and HMA Specimens containing F-
RCA
Turning now to the SMA specimens containing F-RCA and MF, as the F-RCA content
of these increased from 0% (control mix) to 60%. The TSR value also increased
slightly, from 84% to 86%, with 60% F-RCA plus MF being the optimum mixture in
terms of moisture resistance. The optimal mixture for the SMA specimens containing F-
RCA and HL, on the other hand, was at 40% F-RCA content; and the TSR values of
these increased from 91% in the control mix to 94% at 40% F-RCA.
In the HMA specimens containing F-RCA, the highest resistance to moisture
susceptibility was achieved by mixtures containing 20% F-RCA, for both MF and HL
fillers. As the F-RCA content increased from 0% to 20%, the TSR increased from 85%
70
72
74
76
78
80
82
84
86
88
90
92
94
96
0% 20% 40% 60% 80% 100%
TS
R (
%)
F- RCA SMA with MF SMA with HL
HMA with MF HMA With HL

113
to 86%, but as the F-RCA content increased from 20% to 80%, the TSR fell from 86%
to 71% in the HMA specimens containing MF and 73% in the HMA specimens
containing HL.
These results show that using HL instead of MF significantly improved the TSR values
of both the SMA and HMA mixtures, although this improvement was more robust in the
SMA than in the HMA mixtures. The levels of fine and filler aggregates were 64% and
6% (of the total aggregate content) in the HMA and 14% and 10% in the SMA
mixtures. The above results for these specimens in terms of moisture susceptibility
could be due to the aggregate gradations as well as improvements in IDT strength
through utilizing hydrated lime powder as filler.
4.8.7.2 Tensile Strength Ratio of SMA and HMA mixtures containing C-RCA
The TSR values of the HMA and SMA specimens containing C-RCA are presented in
Figure 4.26. First of all, in both the SMA and HMA mixtures containing 100% virgin
granite aggregate (control mixes), the TSR values slightly increased when HL was used
instead of MF.
Second, the moisture induced damage test results on the SMA mixtures containing C-
RCA and MF produced little or no difference between the TSR values of VA-SMA and
of SMA containing 20% C-RCA. In other words, replacing the coarse granite
aggregates with up to 20% C-RCA in the SMA mixtures had no significant impact on
the moisture susceptibility of the asphalt mixtures. However, as the C-RCA content
increased from 20% to 40%, the TSR value fell to 81%, only slightly above the
minimum AASHTO requirement. This suggests that the maximum acceptable C-RCA
content in the SMA mixtures in terms of moisture resistance is 40%.
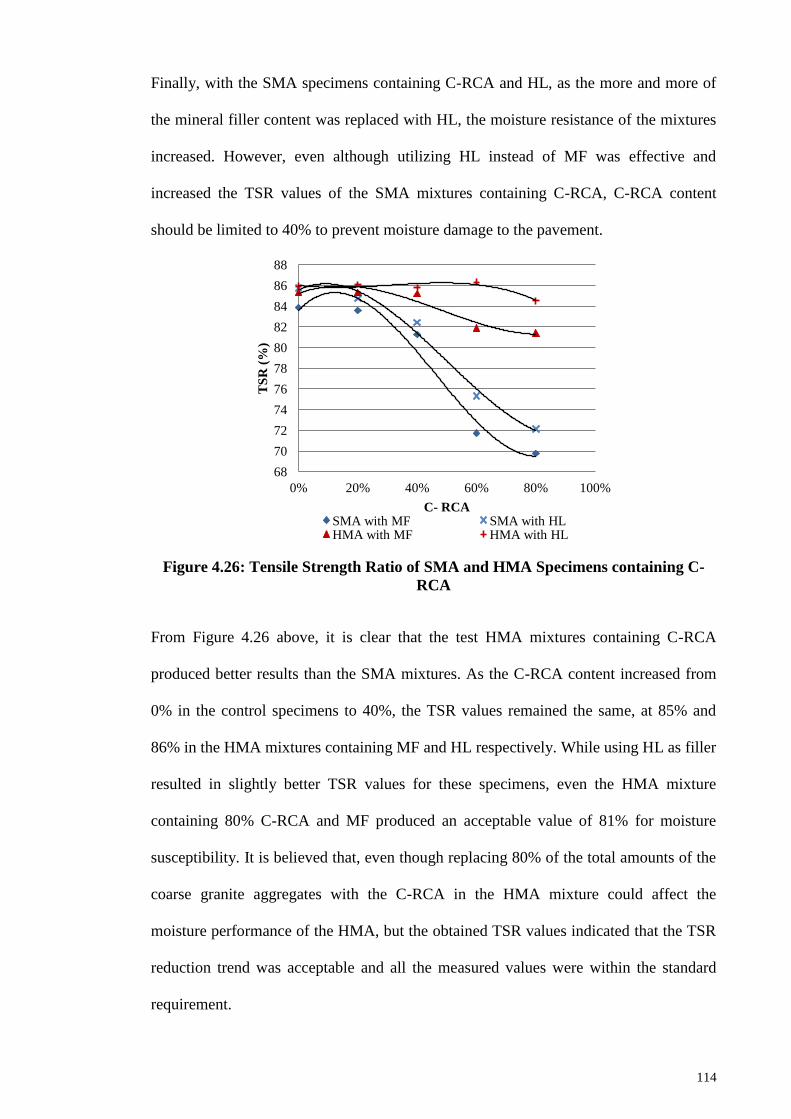
114
Finally, with the SMA specimens containing C-RCA and HL, as the more and more of
the mineral filler content was replaced with HL, the moisture resistance of the mixtures
increased. However, even although utilizing HL instead of MF was effective and
increased the TSR values of the SMA mixtures containing C-RCA, C-RCA content
should be limited to 40% to prevent moisture damage to the pavement.
Figure 4.26: Tensile Strength Ratio of SMA and HMA Specimens containing C-
RCA
From Figure 4.26 above, it is clear that the test HMA mixtures containing C-RCA
produced better results than the SMA mixtures. As the C-RCA content increased from
0% in the control specimens to 40%, the TSR values remained the same, at 85% and
86% in the HMA mixtures containing MF and HL respectively. While using HL as filler
resulted in slightly better TSR values for these specimens, even the HMA mixture
containing 80% C-RCA and MF produced an acceptable value of 81% for moisture
susceptibility. It is believed that, even though replacing 80% of the total amounts of the
coarse granite aggregates with the C-RCA in the HMA mixture could affect the
moisture performance of the HMA, but the obtained TSR values indicated that the TSR
reduction trend was acceptable and all the measured values were within the standard
requirement.
68
70
72
74
76
78
80
82
84
86
88
0% 20% 40% 60% 80% 100%
TS
R (
%)
C- RCA SMA with MF SMA with HL HMA with MF HMA with HL

115
4.8.7.3 Tensile Strength Ratio of SMA and HMA mixtures containing M-RCA
The TSR values of the HMA and SMA mixtures containing different percentages of M-
RCA are displayed in Figure 4.27. These show first of all that, regardless of the M-RCA
content, using HL instead of MF significantly enhanced the moisture resistance of the
asphalt mixtures. In the SMA mixtures containing M-RCA, the optimum value in terms
of tensile strength ratio was 86% for both the control mix and the mixture containing
20% M-RCA and HL; and the TSR values of the SMA specimens containing MF also
increased up to 20% M-RCA content. However, as the M-RCA content increased from
20% to 40%, the TSR values fell from 85% to 82% in the SMA mixtures containing MF
and from 86% to 84% in the mixtures containing HL filler. Moreover, as the M-RCA
content increased further from 40% to 60% and beyond, the TSR values fell even more.
In sum, the M-RCA content should not exceed 40% in the SMA mixtures to optimize
resistance to the moisture damage.
Figure 4.27: Tensile Strength Ratio of SMA and HMA Specimens containing M-
RCA
As Figure 4.27 above shows, there were no significant differences in TSR values
between the HMA control mixes and the mixtures containing 20% M-RCA, for both
MF and HL fillers. Based on the AASHTO standard, flexible pavements should have a
70
72
74
76
78
80
82
84
86
88
0% 20% 40% 60% 80% 100%
TS
R (
%)
M- RCA SMA with MF SMA with HL
HMA with MF HMA with HL
116
minimum TSR value of 80%. Replacing up to 60% of the fine and coarse granite
aggregates with M-RCA in the HMA mixtures comfortably met this moisture
susceptibility. The HMA mixtures containing 60% M-RCA had a TSR value of 80% in
the mixtures using MF as filler and 82% in the mixtures using HL: thus it would be
better to use HL than MF in such mixtures. Regardless of the RCA particle sizes or
content levels, the HMA and SMA mixtures containing HL performed better than the
mixtures containing MF in terms of moisture susceptibility, with lower losses in IDT
strength after conditioning.
4.8.8 Flexural beam fatigue
The flexural beam fatigue test was carried out in accordance with the AASHTO TP-8
standard, which is the standard method for determining the fatigue life of compacted hot
mix asphalt subjected to repeated flexural bending. Both types of asphalt specimens
were tested at 20°C, 500 micro-strains and a frequency of 10Hz. Each test was repeated
three times to verify its accuracy. Under the AASHTO standard, the fatigue specimens
need to be cut and surface trimmed before being used in the test. For this purpose the
HMA and SMA compacted slabs were cut into the specific dimensions of 380mm ×
63.5mm × 50mm.
4.8.8.1 HMA flexural beam fatigue
Figure 4.28 below summarizes the flexural fatigue test results of the HMA specimens
containing various percentages of RCA. Note that the figure shows only the average
stiffness values of each set of specimens plotted against their RCA content levels. Fuller
details and data on the results of these tests on the HMA specimens can be found in
Appendix D. As the graphs show, regardless of the RCA particle size, increasing the
RCA content improved the fatigue performances of the HMA mixtures.

117
Figure 4.28: Average of flexural stiffness of HMA specimens containing RCA
versus fatigue life
Generally, fatigue failure is defined as the number of load cycles a material can bear
before falling to below 50% of its initial stiffness. While the fatigue life of a given mix
does not in practice exactly correspond to the level of stiffness of the mix, measuring
the number of load cycles needed to produce failure (a fall in stiffness of over 50%),
does provide a reasonably correlation with actual fatigue life.
Based on our results, adding RCA generally enhanced the maximum tensile stresses of
the HMA beam specimens, except for at the levels of 80% F-RCA and 80% M-RCA.
As the strain values were constant in this test, a similar trend was observed in the
stiffness values of the HMA beams. As mentioned earlier, RCA materials are much
more absorptive than granite aggregates. Moreover, as RCA particle sizes get smaller,
their level of absorption increases. As a result, higher binder content is needed to
produce acceptable asphalt mixtures.
In the case of our tests, the improvement in fatigue performance of the HMA specimens
could be related to the higher binder content in those containing RCA, which led to
2,000
3,000
4,000
5,000
6,000
7,000
8,000
9,000
0 20000 40000 60000 80000 100000 120000 140000 160000 180000
Sti
ffn
ess
(M
Pa
)
Fatigue Life
VA 20%F-RCA 40%F-RCA 60%F-RCA 80%F-RCA
20%C-RCA 40%C-RCA 60%C-RCA 80%C-RCA 20%M-RCA
40%M-RCA 60%M-RCA 80%M-RCA

118
better flexibility and elasticity (phase angle) and hence better fatigue resistance. The
phase angle represents the visco-elastic behavior of asphalt mixtures. Its value can be
between 0° and 90°. Lower phase angle values indicate higher elasticity in asphalt
mixtures, while higher values represent higher viscosity. To put it another way, 0°
signifies highly elastic materials and 90° highly viscous materials. The elasticity of
bituminous materials has a positive effect on the fatigue performance of asphalt
mixtures. Against that, viscous asphalt mixtures are more resistant to rutting damage
under wheel loads.
In our tests, as the number of pulses increased in the fatigue tests, the phase angle values
slightly increased and reached their highest levels at the terminal stiffness or failure
point (50% of initial stiffness). On the other hand, in most cases lower phase angle
values produced higher fatigue life. Even although the initial stiffness of the HMA beam
specimens containing 40% F-RCA was higher than that of those containing 60% C-
RCA, 60% C-RCA emerged as the optimal value in terms of stiffness because it had a
lower slope of stiffness curve as well as a slightly higher terminal stiffness value. As
shown in the figure 4.28, the average stiffness value of the HMA containing 60% C-
RCA dropped rapidly from the beginning of the test to 10000 cycles, but continued to
resist fatigue beyond 10000 cycles, resulting in a flatter stiffness curve slope and higher
terminal stiffness value. The average values of stiffness and fatigue life of the HMA
control specimen (VA) increased by 30% and 14% respectively by utilizing 60% C-
RCA. Generally, regardless of the RCA particle sizes, the fatigue performance of the
HMA mixtures improved when the RCA content was increased, in terms of both
stiffness values and number of cycles needed to reach terminal stiffness (failure). Only
at the 80% M-RCA and 80% F-RCA levels did the HMA samples exhibit lower fatigue
life than the control mix.

119
While, as just explained, using RCA improved the fatigue life of the HMA mixtures,
RCA levels (of both particle sizes) of up to 40% produced only small differences in
terminal stiffness, and there were no substantial differences in this respect between the
HMA mixtures containing 40% C-RCA, 40% F-RCA and 40% M-RCA. This could be
because, as the RCA content increased in the HMA mixtures, so the OAC levels
increased as well.
The higher binder content increased the elasticity behavior of the asphalt mixtures and
resulted in better fatigue resistance. At the same time, as the F-RCA content increased
in the HMA specimens, the stiffness and fatigue life increased up to 40% content and
then dropped considerably at the 60% and 80% levels. This could be due to the higher
percentages of fines compared to coarse aggregates. According to the aggregate
gradation of the HMA mixtures, 70% (by weight of total mix) of the HMA structure
was made of aggregates with particle sizes of 2.36 mm or less. Given these different
specifications and physical properties of RCA compared to virgin granite aggregates, as
the fine granite aggregates were replaced by F-RCA, this had a more noticeable affect
on the performance of the HMA specimens in this test.
4.8.8.2 SMA flexural beam fatigue
Fuller data on the flexural beam fatigue test on the SMA specimens containing various
sizes and percentages of RCA are provided in Appendix E. Figure 4.29 below presents
the average stiffness values of these SMA specimens against their fatigue life.

120
Figure 4.29: Average of flexural stiffness of SMA specimens containing RCA
versus fatigue life
As can be seen, the SMA specimens showed generally lower fatigue resistance than the
HMA mixtures. Indeed, the HMA specimens displayed almost twice the initial and even
terminal stiffness of the SMA specimens. The likely reason for this is the denser
aggregate gradation of the HMA mixtures, leading to higher density and stability values
and hence better fatigue performance.
Notwithstanding these overall weaker results, and regardless of RCA particle size,
adding RCA content did improve the fatigue performance of the SMA specimens as
well. Again, this is probably due to the fact that, as the granite aggregates were replaced
by RCA, higher binder content was needed, which in turn increased the elasticity of the
asphalt mixtures and led to better fatigue performance. Almost all the specimens
improved in terms of both initial and terminal stress, stiffness and modulus values,
when compared to the control specimen, and these improvements could be directly
related to their levels of RCA content. Only the SMA mixtures containing 80% C-RCA
produced slightly lower results than the control specimens in terms of resistance to
fatigue over 10000 cycles.
1,000
1,500
2,000
2,500
3,000
3,500
4,000
4,500
5,000
0 20000 40000 60000 80000 100000 120000 140000 160000
Sti
ffn
ess
(M
Pa
)
Fatigue Lifge
VA 20%F-RCA 40%F-RCA 60%F-RCA 80%F-RCA
20%C-RCA 40%-C-RCA 60%C-RCA 80%C-RCA 20%M-RCA
40%M-RCA 60%M-RCA 80%M-RCA

121
Although the initial and terminal stiffness values of the SMA specimens containing
20% C-RCA and 40% C-RCA were close to each other and followed very similar
patterns, the specimen containing 20% C-RCA resisted almost 34% longer than the one
containing 40% C-RCA in terms of fatigue life. The stiffness value of the SMA
specimens containing 60% C-RCA was meanwhile slightly lower than that of those
containing 20% C-RCA and 40% C-RCA, but the difference was minor. The SMA
specimens containing 60% C-RCA also followed the same patterns as those with 20%
C-RCA and 40% C-RCA up to 20000 cycles, but the slope of their curves steepened
significantly after 20000 cycles, indicating lower resistance to fatigue and lower fatigue
life. As the C-RCA content increased to 80%, the stiffness values dropped significantly.
The lower impact and crushing values of coarse RCA than coarse granite aggregates
were presumably the reason for this, leading to aggregate fracture under compaction and
degradation and segregation in these SMA mixtures.
As Figure 4.29 also shows, as the fine granite aggregates were replaced with F-RCA,
the fatigue performance of the specimens improved. Adding 20%, 40%, 60% and 80%
F-RCA increased the fatigue life of the SMA mixtures by 56%, 100%, 89% and 89%
respectively. As can be seen there was no considerable change between SMA specimens
containing 60% F-RCA and 80% F-RCA in terms of fatigue life. While the initial
stiffness of the mixture containing 80% F-RCA was higher than that of 60% F-RCA, the
stiffness value of the latter started to drop rapidly after 100000 cycles, ending up lower
than the 80% F-RCA.
Turning now to the SMA specimens containing M-RCA, those containing 40% M-RCA
performed better than the other levels of M-RCA, improving the fatigue life of the VA-
SMA by up to 98%. Meanwhile, although the average initial and terminal stiffness of
the SMA specimens containing 80% M-RCA were lower than those of the specimens
containing 20% M-RCA, both performed similarly in terms of the number of cycles
122
needed to reach 50% of initial stiffness (fatigue life); and both of improved the fatigue
life of the SMA mixtures overall by around 44%. In other words, fatigue life improved
as M-RCA content increased from 0% (VA-SMA) up to 40%; but it fell again when the
level of M-RCA increased to 60%, and reach its lowest point at 80% of M-RCA. The
most likely reason for this is that, as the M-RCA content increased in the SMA
mixtures, the percentage of coarse granite aggregates being replaced by C-RCA
increased as well. As mentioned earlier, stone mastic asphalt consists of 76% coarse
aggregates (by weight of total mix) and so is very sensitive to the specifications and
quality of the coarse aggregates in it. SMA specimens are highly affected by coarse
aggregates due to their lower specific gravity and higher abrasion, impact value and
crushing value than virgin granite aggregates.
4.9 Summary of performance tests
Asphalt pavements (road surfaces) are excellent paving materials if properly designed,
produced and laid. The performance of asphalt mixtures is complex, and depends on
getting the right combination of aggregates, binders and additives. Rutting, moisture
susceptibility and fatigue are the main causes of distress in asphalt pavements. Rutting
is a longitude load deformation that develops in an asphalt pavement under the action of
channelized loading caused by traffic. It is one of the most important causes of failure
in asphalt pavements – which can be due to a failure of the base, sub-base or sub-grade,
poor materials, poor compaction, poor drainage or weak mix design. Mix design
weakness can be due to very high or very low air voids, low viscosity of the binder, low
density, low stability or high asphalt content, all resulting in higher flow or stripping
problems. Stripping is the breaking of the adhesive bond between the aggregates and the
binder due to the presence of moisture or water. Fatigue cracking generally occurs with
loads which are too heavy for the pavement or an unexpectedly high level of passes by
traffic or overweight trucks, and can be aggravated by inadequate pavement drainage or

123
thickness due to poor quality control during construction. Cracks in asphalt pavements
can lead to greater exposure to moisture or water, thermal effects or spalling, which in
turn may cause more damage over time. The moisture susceptibility and fatigue
resistance of asphalt mixtures are therefore further vital specifications for pavement
design.
The basic characteristics and effects of using RCA materials on the properties of HMA
and SMA mixtures have been fully described in earlier sections. This section of the
research focuses only on the allowable RCA content in terms of rutting, fatigue and
moisture susceptibility (the main pavement distresses). Table 4.27 below presents the
maximum allowable RCA content levels for the HMA and SMA mixtures, based on the
standard requirements.
Table 4.27: Maximum allowable RCA content for HMA and SMA mixtures
Test Standard Allowable RCA Content
C-RCA F-RCA M-RCA
SM
A
Rutting BS 598-110 40% 80% 50%
Moisture Susceptibility AASHTO T 283 40% 80% 40%
Fatigue AASHTO TP-8 70% 80% 80%
HM
A
Rutting
BS 598-110
60%
50%
70%
Moisture Susceptibility AASHTO T 283 80% 50% 70%
Fatigue AASHTO TP-8 80% 70% 60%
To summarize, in order to ensure that SMA mixtures are appropriately resistant to the
key distresses of rutting, moisture susceptibility and fatigue cracking, the RCA content
should not exceed 40%, 80% and 40% in SMA mixtures containing C-RCA, F-RCA
and M-RCA respectively. For the HMA mixtures, the maximum recommended levels
are 60% C-RCA, 50% F-RCA and 60% M-RCA.

124
4.10 Analysis of variance (ANOVA)
The main objective of this research was to evaluate the volumetric and mechanical
properties of Dense-Graded Hot Mix Asphalt (HMA) and Gap-Graded Stone Mastic
Asphalt (SMA) mixtures containing recycled concrete aggregates. For this purpose, the
performance of the HMA and SMA mixtures containing various percentages of RCA
were evaluated through a range of tests. In order to compare the differences between the
methods for the research variables, the outcomes of the tests were statistically analyzed
and their significance within certain confidence limits was determined using a single-
way and two-way analysis of variances without replication (ANOVA).
Prior to data analysis, all the data were first subjected to a normality test. The results
showed that all the variables were distributed normally; moreover, the homogeneity test
confirmed that the variances were homogenous. The significance level (α) used in this
research was 0.05. Tables 4.28 and 4.29 below summarize the variance analysis
(ANOVA) results for the HMA and SMA mixtures respectively. Fuller details of the
ANOVA outputs are provided in Appendix F and Appendix G respectively.
Table 4.28: ANOVA outcomes for HMA test results Test SS MS F P-value F critical
OAC 7.1093 1.7773 124.0000 < 0.05 3.8379
Stability 63.9612 15.9903 50.6364 < 0.05 3.8379
Flow 16.3086 4.0772 14.3786 < 0.05 3.8379
Density 0.0204 0.0051 11.7916 < 0.05 3.8379
VTM 0.0229 0.0057 5.9756 < 0.05 3.8379
VMA 5.3502 1.3376 12.7780 < 0.05 3.8379
VFA 10.5456 2.6364 10.5257 < 0.05 3.8379
MR @ 25oC 1.63E+06 4.07E+05 56.7577 < 0.05 3.8379
MR @ 40oC 4.98E+05 1.24E+05 15.2400 < 0.05 3.8379
Dry IDT 6.9100 1.7275 134.8548 < 0.05 3.8379
Wet IDT 10.4383 2.6096 52.7686 < 0.05 3.8379
HL Dry IDT 7.4170 1.8543 93.1321 < 0.05 3.8379
HL Wet IDT 10.8499 2.7125 57.0068 < 0.05 3.8379
TSR 0.0187 0.0047 8.4306 < 0.05 3.8379
HL TSR 0.0174 0.0043 9.0349 < 0.05 3.8379
Rut Depth 18.6368 4.6592 10.4786 < 0.05 3.8379
Rut Rate 0.7740 0.1935 22.1516 < 0.05 3.8379
Fatigue (Stiffness) 2.29E+08 1.91E+07 15.8951 < 0.05 1.7830

125
Table 4.29: ANOVA outcomes for SMA test results Test SS MS F P-value F critical
OAC 4.7627 1.1907 4.8665 < 0.05 3.8379
Stability 27.3967 6.8492 6.0139 < 0.05 3.8379
Flow 20.5763 5.1441 10.7292 < 0.05 3.8379
Density 0.0092 0.0023 6.8039 < 0.05 3.8379
VTM 0.0279 0.0070 15.5539 < 0.05 3.8379
VMA 3.6083 0.9021 14.1228 < 0.05 3.8379
VFA 7.1387 1.7847 14.2487 < 0.05 3.8379
MR @ 25oC 6.24E+05 1.56E+05 5.6394 < 0.05 3.8379
MR @ 40oC 1.20E+05 2.99E+04 7.5139 < 0.05 3.8379
Dry IDT 4.3102 1.0775 16.4854 < 0.05 3.8379
Wet IDT 6.6878 1.6720 9.9955 < 0.05 3.8379
HL Dry IDT 4.4433 1.1108 17.0746 < 0.05 3.8379
HL Wet IDT 6.4186 1.6046 9.8412 < 0.05 3.8379
TSR 0.0250 0.0062 4.5030 < 0.05 3.8379
HL TSR 0.0190 0.0048 3.9276 < 0.05 3.8379
Rut Depth 22.2777 5.5694 15.3416 < 0.05 3.8379
Rut Rate 4.0726 1.0182 12.4756 < 0.05 3.8379
Fatigue (Stiffness) 6.23E+07 5.19E+06 13.7935 < 0.05 1.7878
As the tables show, the measured P-values for both types of asphalt mixtures were
below the significance level of 0.05 (alpha) in terms of volumetric, mechanical and
experimental test results. Moreover, the F ratio values were larger than F Critical, again
for both types of mixture. This confirms that the impact of the RCA materials on the
performance of the HMA and SMA mixtures was significant, at a confidence level of
95%, and that the effects of the various different sizes and percentages of RCA in the
HMA and SMA mixtures were significantly different.
126
CHAPTER V
5 CONCLUSIONS AND RECOMMENDATIONS
5.1 Conclusions
This study presents the results of experiments designed to ascertain the influence of
adding various sizes and percentages of Recycled Concrete Aggregate (RCA) on the
performance of Hot Mix Asphalt (HMA) and Stone Mastic Asphalt (SMA). To that end,
it looked into three main objectives. The first objective was to evaluate the engineering
properties of the materials used, namely granite aggregate, RCA and 80-100 binder. The
second objective was to determine the optimum asphalt content of HMA and SMA
mixtures containing RCA, based on the Marshall mix design method. The third
objective was the most important: to evaluate the performance of the fabricated HMA
and SMA specimens. Finally, the test results were analyzed and verified using the
analysis of variance (ANOVA) method. This section summarizes the overall
conclusions achieved through this research. The key findings are below.
1- The Marshall specimens had a higher air void content than the expected level
(4%), and that this level increased in both the HMA and SMA mixtures,
regardless of the size of the RCA particles, as the RCA content increased. This
was probably because of the aggregates and RCA breaking down during
compaction by the Marshall hammer. The reduction of the number of Marshall
compactor blows from 75 to 50 in the SMA mixtures could be another reason for
the higher air void levels in these. The excess cements attached to the surface of
the RCA could increase the bitumen absorption in the asphalt mixtures and thus
reduce adhesion between the RCA and the binder.
2- During the tests we found that submerging and washing the RCA materials
before using them in the asphalt mixture considerably increased the performance
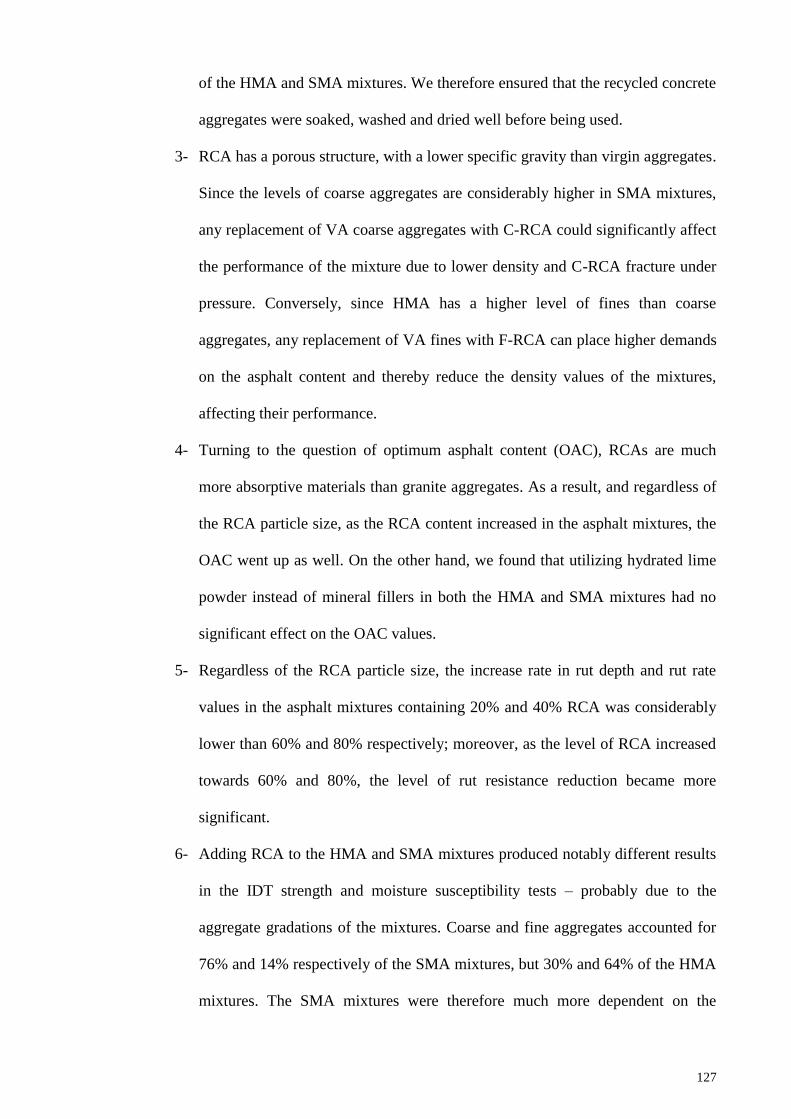
127
of the HMA and SMA mixtures. We therefore ensured that the recycled concrete
aggregates were soaked, washed and dried well before being used.
3- RCA has a porous structure, with a lower specific gravity than virgin aggregates.
Since the levels of coarse aggregates are considerably higher in SMA mixtures,
any replacement of VA coarse aggregates with C-RCA could significantly affect
the performance of the mixture due to lower density and C-RCA fracture under
pressure. Conversely, since HMA has a higher level of fines than coarse
aggregates, any replacement of VA fines with F-RCA can place higher demands
on the asphalt content and thereby reduce the density values of the mixtures,
affecting their performance.
4- Turning to the question of optimum asphalt content (OAC), RCAs are much
more absorptive materials than granite aggregates. As a result, and regardless of
the RCA particle size, as the RCA content increased in the asphalt mixtures, the
OAC went up as well. On the other hand, we found that utilizing hydrated lime
powder instead of mineral fillers in both the HMA and SMA mixtures had no
significant effect on the OAC values.
5- Regardless of the RCA particle size, the increase rate in rut depth and rut rate
values in the asphalt mixtures containing 20% and 40% RCA was considerably
lower than 60% and 80% respectively; moreover, as the level of RCA increased
towards 60% and 80%, the level of rut resistance reduction became more
significant.
6- Adding RCA to the HMA and SMA mixtures produced notably different results
in the IDT strength and moisture susceptibility tests – probably due to the
aggregate gradations of the mixtures. Coarse and fine aggregates accounted for
76% and 14% respectively of the SMA mixtures, but 30% and 64% of the HMA
mixtures. The SMA mixtures were therefore much more dependent on the

128
specifications of the coarse aggregates (i.e. LA abrasion, aggregate impact value
and aggregate crushing value) than a conventional asphalt mixture. Any
replacement of virgin aggregates with RCA would therefore have a particularly
significant effect on the engineering properties of the SMA. In line with this,
replacing the coarse-VA with C-RCA in the SMA and fine-VA with F-RCA in
the HMA mixtures each had the most impact on the performance of the relevant
asphalt specimens.
7- C-RCA and M-RCA had no positive effect on the IDT strength of the SMA
mixtures, but replacing up to 20% VA with RCA did improve the IDT strength
of the HMA specimens. Moreover, using up to 40% F-RCA increased the IDT
strength of the SMA mixtures by increasing their bulk density. Meanwhile,
utilizing up to 60% F-RCA increased the tensile strength and hence the moisture
resistance of the SMA mixtures. Last but not least, while 80% F-RCA content
led to reduced TSR values in the SMA specimens, those containing up to 40%
C-RCA, 40% M-RCA and 80% F-RCA were still able to meet the minimum
AASHTO requirements.
8- Utilizing 20% F-RCA in the HMA mixture containing Mineral Filler (MF)
improved the TSR value of the mixture. Moreover, the HMA specimens
containing up to 40% C-RCA did not show any changes in terms of moisture
induced damage. This suggests that HMA mixtures with up to 80% C-RCA,
60% M-RCA and 40% F-RCA can easily meet the standard requirements in
terms of moisture susceptibility. Using hydrated limestone (HL) powder as filler
had no substantial effect on the IDT strength of the dry specimens, but did
significantly improve the IDT strength of the conditioned HMA and SMA
mixtures, both of which produced higher TSR values and moisture resistance.

129
9- The flexural beam fatigue test results showed substantial improvements in both
types of asphalt mixtures. Generally, the initial stiffness of the asphaltic samples
increased as the RCA content increased in the HMA and SMA mixtures. Since
the strain values remained almost constant (strain controlled test), similar trend
were observed from the relevant tensile stress values as well. We found that, due
to the denser structure of the HMA mixtures and their higher stability values,
their measured initial stiffness was almost twice as high as that of the SMA
specimens. At the same time, almost all of the HMA and SMA specimens
showed higher fatigue resistance than the asphalt mixtures containing virgin
granite aggregates (control mix) except for 80% M-RCA and 80% F-RCA in
HMA, and 80% C-RCA in SMA mixtures, which produced slightly lower results
than the SMA control mix.
10- While our experiments showed that adding RCA to asphalt mixtures does affect
their volumetric and mechanical properties, SMA mixtures with up to 40%
coarse, 80% fine and 40% mixed RCA content, and HMA mixtures with up to
60% coarse, 50% fine and 60% mixed RCA content, can nevertheless
comfortably satisfy the standard requirements, depending of course on the
demands of the particular project and on traffic volume. These findings could
help to promote the re-use and recycling of waste materials, especially RCA, in
road construction, thereby helping to conserve natural resources for future
generations as well as generating economic and environmental benefits.
5.2 Recommendations
Finally, based on the experience gained from this research, we have a number of
recommendations for future research and future researchers.

130
1- We advise against the use of the Marshall impact compactor for asphalt mixtures
containing RCA, particularly for SMA mixtures containing large amounts of
coarse aggregates. This is because such impact compactors can cause the RCA
and the coarse aggregates on the surface to break, such that the desired density
and air voids may not be achieved. The Super-pave gyratory compactor may be
better able to compact asphalt mixtures containing RCA with less breakage and
segregation.
2- It is recommended to submerge and wash the RCA materials before using them
in the asphalt mixtures to reduce the excessive attached cements on the surface
of the crushed aggregates and improve the adhesion between RCA and other
materials in asphalt mixtures.
3- The measured load to failure in the IDT tests was lower than we had expected
for both the HMA and SMA mixtures – largely, we suspect, because we used
unmodified 80/100 (penetration graded) binder to produce the HMA and SMA
specimens. High viscosity or modified binders should improve the performance
of asphalt mixtures containing RCA in this respect, and we therefore recommend
the use of such binders instead of conventional ones.
4- Future studies might try to use recycled concrete aggregates in Open-Graded
Friction Course (OGFC) and porous asphalts in order to evaluate the
performance of these types of mixtures, in addition to the ones we tested.

131
References
AAPA (2000). Stone Mastic Asphalt: Design and Application Guide, Australian
Asphalt Pavement Association, Bitumen Contractors Association,
Implementation Guide No 4, Australia.
AASHTO T-283 (1986). Resistance of compacted bituminous mixture to moisture
induced damage. American Association of State Highway and Transportation
Officials, AASHTO Provisional Standards, USA.
AASHTO TP8 (2002). A Test Standard for Determining the Fatigue Life of Compacted
Hot-Mix Asphalt Subjected to Repeated Flexural Bending. American
Association of State Highway and Transportation Officials, AASHTO
Provisional Standards, USA.
Abo-Qudais, S., & Al-Shweily, H. (2007). Effect of Aggregate Properties on Asphalt
Mixtures Stripping and Creep Behavior. Journal of Construction and Building
Materials, 21 (9):1886-1898.
Aggregates advisory service-UK. (1999). Construction and demolition waste
management practices and their economic impacts. Study for DGXI- European
commission. Digest No. 016.
Ahmadinia, E., Zargar, M., Karim, M. R., & Abdelaziz, M. (2012). Performance
evaluation of utilization of waste polyethylene terephthalate (PET) in stone
mastic asphalt. Journal of Construction and Building Materials, 36:984-989.
Aksoy, K., Samlioglu, K., Tayfur, S., & Ozen, H. (2005). Effects of various additives
on the moisture damage sensitivity of asphalt mixtures. Journal of Construction
and Building Materials, 19 (1): 11- 18.
Anderson, R. M., Christensen, D. W., & Bonaquist, R. (2003). Estimating the rutting
potential of asphalt mixtures using superpave gyratory compaction properties
and indirect tensile strength. Journal of the Association of Asphalt Paving
Technologists, 72: 1-26.
Anjam Kumar, A., & Veeraragavan, A. (2011). Dynamic mechanical characterization of
asphalt concrete mixes with modified asphalt binders. Journal of Materials
Science and Engineering A, 528(21): 6445-6454.
Arabani, M., & Azarnoosh, A. R. (2012). The effect of recycled concrete aggregate and
steel slag on the dynamic properties of asphalt mixtures. Journal of Construction
and Building Materials, 35 (1): 1-7.
Arabani, M., Moghadas Nejad, F., & Azarnoosh, A. R. (2013). Laboratory evaluation of
recycled waste concrete into asphalt mixtures. International Journal of Pavement
Engineering, 14(6): 531-539.
Arm, M. C. (2001). Self-cementing properties of crushed demolished concrete in
unbound layers: results from triaxial tests and field tests. Journal of Waste
Management, 21(3): 235-239.
132
Arulrajah, A., Piratheepan, J., Bo, M. W., & Ali, M. (2012b). Geotechnical properties of
recycled concrete aggregate in pavement sub-base applications. ASTM
Geotechnical Testing Journal, 35(5):1-9.
Arulrajah, A., Piratheepan, J., Bo, M. W., & Sivakugan, N. (2012a). Geotechnical
characteristics of recycled crushed brick blends for pavement sub-base
applications. Canadian Geotechnical Journal, 49(7):796-811.
Asphalt Institute, (1969). Surface treatment and asphalt penetration macadam, manual
series (MS-13). Asphalt Institute (AI), College Park, Maryland, USA.
Asphalt Institute, (2007). The asphalt handbook, manual series No. 4 (MS-4) 7th
Edition, Asphalt Institute (AI), College Park, Maryland, USA.
Asphalt Institute, (1997). Mix Design Methods for Asphalt concrete Manual Series
(MS02), Asphalt Institute (AI), College Park, Maryland, USA.
ASTM C127, (2007). Standard Test Method for Specific Gravity and Absorption of
Coarse Aggregate. Philadelphia, PA, American Society for Testing and
Materials.
ASTM C128, (2007). Standard Test Method for Density, Relative Density (Specific
Gravity), and Absorption of Fine Aggregate. Philadelphia, PA, American
Society for Testing and Materials.
ASTM C131, (2006). Standard Test Method for Resistance to Degradation of Small-
Size Coarse Aggregate by Abrasion and Impact in the Los Angeles Machine.
Philadelphia, PA, American Society for Testing and Materials.
ASTM D1559, (1989). Test Method for Resistance of Plastic Flow of Bituminous
Mixtures Using Marshall Apparatus. American Society for Testing and Material,
West Conshohocken, PA, USA.
ASTM D2041, (2003). Standard Test Method for Theoretical Maximum Specific
Gravity and Density of Bituminous Paving Mixtures, American Society for
Testing and Material, West Conshohocken, PA, USA.
ASTM D2726, (2000). Standard Test Method for Bulk Specific Gravity and Density of
Non-Absorptive Compacted Bituminous Mixtures, American Society for Testing
and Material, West Conshohocken, PA, USA.
ASTM D3203, (2005). Standard Test Method for Percent Air Voids in Compacted
Dense and Open Bituminous Paving Mixtures, American Society for Testing and
Material, West Conshohocken, PA, USA.
ASTM D3381, (2009). Standard Specification for Viscosity-Graded Asphalt Cement for
Use in Pavement Construction, Volume 04.03, American Society for Testing and
Material, West Conshohocken, PA, USA.

133
ASTM D3515, (2001). Standard Specification for Hot-Mixed, Hot-Laid Bituminous
Paving Mixtures, American Society for Testing and Material, West
Conshohocken, PA, USA.
ASTM D36, (1986). Test Method for Softening Point of Bituminous Material, Volume
04.03, Annual Book of ASTM Standards, American Society for Testing and
Material, Philadelphia, USA.
ASTM D4123, (1995). Standard Test Method for Indirect Tension Test for Resilient
Modulus of Bituminous Mixtures (Withdrawn 2003), ASTM International, West
Conshohocken, PA, USA.
ASTM D4402, (1987). Test Method for Viscosity Determinations of Unfilled Asphalts
Using the Brookfield Thermo sell Apparatus, Volume 04.03, Annual Book of
ASTM Standards, American Society for Testing and Material, Philadelphia,
USA.
ASTM D5, (1986). Test Method for penetration of Bituminous Material, Volume 04.03,
Annual Book of ASTM Standards, American Society for Testing and Material
(ASTM), Philadelphia, USA.
ASTM D6931, (2007). Standard Test Method for Indirect Tensile (IDT) Strength of
Bituminous Mixtures, American Society for Testing and Material, West
Conshohocken, PA, USA.
ASTM D92, (1986). Test Method for Flash and Fire Point of Bituminous Material,
Volume 04.03, Annual Book of ASTM Standards, American Society for Testing
and Material, Philadelphia, USA.
ASTM D946, (1999). Standard Specification for Penetration-Graded Asphalt Cement
for Use in Pavement Construction, Volume 04.03, Annual Book of ASTM
Standards, American Society for Testing and Material, Philadelphia, USA.
Baladi, G.Y., & Harichandran, R. S. (1989). Asphalt mix design and indirect test: a new
horizon, ASTM Special Technical Publication, No 1041, USA.
Bardesi, A. (2010). Introducción a las mezclas bituminosas. Curso de Mezclas
Bituminosas: dosificación, fabricación, puesta en obra y control de calidad,
Intevia, Barcelona, Spain.
Beale, M. J., and You Z. (2010). The mechanical properties of asphalt mixtures with
recycled concrete aggregates. Journal of Construction and Building Materials, 24
(3): 230-235.
Bhusal, S., Li, X., & Wen, H. (2011). Evaluation of effects of recycled concrete
aggregate on volumetrics of hot-mix asphalt. Transportation Research Record:
Journal of the Transportation Research Board, (2205), 36-39.
British Standards Institution, (1998). Methods of test for the determination of wheel-
tracking rate and depth. BS 598-110, UK.

134
Brown, E. R. (1990). Density of asphalt concrete-how much is needed? NCAT Research
Report 90-3, Annual Meeting of the Transportation Research Board,
Washington, DC, USA.
Brown, E. R., & Buchanan, M. S. (1999) NCHRP Research Results Digest 237:
Superpave Gyratory Compaction Guidelines, Transportation Research Board,
TRB, National Research Council, Washington, D.C, USA.
Brown, E.R., & L.A. Cooley. (1999). Designing stone matrix asphalt mixtures for rut
resistant pavement. NCHRP Report 425, Transportation Research Board,
Washington, D.C. USA.
Brown, E.R., & Mallick, R.B. (1994), Stone Matrix Asphalt properties Related to
Mixture Design, NCAT Research Report No. 94-02). Alabama: NCAT Auburn
University, USA.
Brown, E.R., Hanson, D. I., & Mallick, R. B. (1996). Evaluation of superpave gyratory
compaction of HMA. Transportation Research Record 1543, Transportation
Research Board, Washington, D.C. USA.
Brown, E.R., Kandhal, P.S., & Zhang, J. (2001), Performance testing for hot mix
asphalt, NCAT Research Report No.01-05, Alabama: NCAT Auburn University,
USA.
Buchanan, M. S., & Brown, E. R. (2001), Effect of superpave gyratorycompactor type
on compacted hot mix asphalt density. Transportation Research Board, National
Research Council, Washington DC, USA.
Bukowski, J. R. (1993). The Future of SMA in America. Asphalt Institute, Lexington,
Ky. USA.
Caro, S., Masad, E., Bhasin, A., & Little, D. N. (2008). Moisture susceptibility of
asphalt mixtures, Part 1: mechanisms. International Journal of Pavement
Engineering, 9 (2): 81-88.
Carswell, J., Cornelius, P & Planque, L. (1997). The effects of mixture variables on the
fatigue performance of bituminous materials. AAPA International Flexible
Pavements Conference, 10th, Perth, Western Australia. Paper 13.
Chowdury A., Button J.W., Kohale V., & Jahn, D. W. (2001), Evaluation of superpave
fine aggregate angularity specification, Report No. 404011-1, International
Center for Aggregate Research, Austin, TX, USA.
Christensen, D. W., & Bonaquist, R. (2002). Use of strength tests for evaluating the rut
resistance of asphalt concrete. Journal of the Association of Asphalt Paving
Technologists, 71: 692- 711.
Christensen, D. W., Bonaquist, R., Anderson, D. A., & Gokhale, S. (2004). Indirect
tensile strength as a simple performance test. Transportation Research Circular:
New Simple Performance Tests for Asphalt Mixes. Transportation Research
Board (TRB), E- C 068: 44-57.

135
Cooley, L. A., Brumfield, J. W., Hicks, G., Mallick, R. B., Mogawer, W. S., Partl,
M., & Poulikakos, L. (2009). NCHRP Report 640: Construction and
Maintenance Practices for Permeable Friction Courses, TRB, National Research
Council, Washington, DC, USA.
CSIR. (2000). Reusing construction and demolition waste. Building and Construction
Technology, Techno Brief.
Epps, J. A., Sebaaly, P. E., Penaranda, J., Maher, M. R., McCann, M. B. & Hand, A. J.
(2000). Compatibility of a test for moisture-induced damage with superpave
volumetric mix design, NCHRP Report No. 444, University of Nevada, USA.
Fabiana, D. A., Conceic, O. L., & Liedi, B. (2011). Laboratory evaluation of recycled
construction and demolition waste for pavements. Journal of Construction and
Building Materials, 25:2972-2979.
FHWA, (2003). Summary of California recycled concrete aggregate review. California
department of transportation (Cal-trans). U.S. Department of Transportation.
Federal Highway Administration.
FHWA, (2004). Transportation applications of recycled concrete aggregates: FHWA
state of the practice national review. IF-05-013. U.S. Department of
Transportation. Federal Highway Administration.
Focus. (2004). Recycled concrete study identifies current uses best practices. U.S.
department of transportation, Federal Highway Administration. Publication No:
FHWA- HRT- 04- 024. U.S. Department of Transportation. Federal Highway
Administration.
Fontes, L. P. T. L., Triches, G., Pais, J. C., & Pereira, P. A. A. (2010). Evaluating
permanent deformation in asphalt rubber mixtures. Journal of Construction and
Building Materials, 24 (7): 1193-1200.
Gartner, W. (1987). Asphalt concrete mix design: Development of more rational
approaches. ASTM Committee D-4 on Road and Paving Material, Bal Harbor
(Florida), USA.
Ghuzlan, K. A., & Carpenter, S. H. (2000), Energy-derived, damage-based failure
criterion for fatigue testing, Transportation Research Record. TRB, 1723, 141-
149. National Research Council, Washington D.C, USA.
Gilpin, R., Robinson, J. R., Menzie, W. D., & Hyun, H. (2004). Recycling of
construction debris as aggregate in the mid- Atlantic region, USA, Journal of
Resources, Conservation and Recycling, 42(3): 275–294.
Golalipour, A., Jamshidi, E., Niazi, Y., Afsharikia, Z., & Khadem, M. (2012). Effect of
aggregate gradation on rutting of asphalt pavements. Procedia-Social and
Behavioral Sciences. 53(3): 440-449.
Gul, W. A., & Guler, M. (2014). Rutting susceptibility of asphalt concrete with recycled
concrete aggregate using revised Marshall Procedure. Construction and Building
Materials, 55, 341-349.

136
Harvey, J., & Tsai, B. (1997). Long-term oven aging effects on fatigue and initial
stiffness of asphalt concrete, Transportation Research Record 1590.
Harvey, J., Lee, T., Sousa, J., Pak, J., & Monismith, C. L. (1994). Evaluation of fatigue
and permanent deformation properties of several asphalt-aggregate fields mixes
using strategic highway research program, Transportation Research Record
1454, 123.
Hassanieh, D. Z. A., Chehab, G. R., Srour, I., & Kassem, H. A. (2016). Recycling
cementitious constituents of construction demolition waste in asphalt mixes: the
case of Lebanon. International Journal of Sustainable Society, 8(2), 109-125.
Huang, W. L., Lin, D. H., Chang, N. B., & Lin, K. S. (2002). Recycling of construction
and demolition waste via a mechanical sorting process. Journal of Resources
Conservation and Recycling, 37(1): 23-37.
Huang, Y. H. (2004). Pavement Analysis and Design, Pearson Prentice Hall, Second
Edition, New Jersey, USA.
Kandhal, P. S. (1998), Intersection rutting rectified, Roads and Bridges, Transportation
Research Board. Des Plaines, IL. 33(5): 20-28.
Kandhal, P. S., & Cooley, L. A. (2002). Evaluation of Permanent Deformation of
Asphalt Mixtures using Loaded Wheel Tester, National Center for Asphalt
Technology. Report 02-08.
Kandhal, P. S., Mallick, R. B & Huner, M. (1999). Development of a new test method
for measuring bulk specific gravity of fine aggregates. Research Report (NCAT
Report No 99-07), Auburn University, USA.
Kenedy, T. W., & Anagnos, J. N. (1984). Wet-dry indirect tensile test for evaluating
moisture susceptibility of asphalt mixtures. Research report 253-8, Center for
Transportation Research, University Of Texas, Texas, USA.
Khaled, R. J., & Krizek, F. (1996). Fiber-reinforced recycled crushed concrete as a
stabilized base course for highway pavements, Northwestern University,
Evanston, IL.
Khan, Z. A., Wahab, H. I., Asi, I., & Ramadhan, R. (1998). Comparative study of
asphalt concrete laboratory compaction methods to simulate field compaction,
Journal of Construction and Building Materials, 12:373-384.
Khodaii, A., Kazemi Tehrani, H., & Haghshenas, H. F. (2012). Hydrated lime effect on
moisture susceptibility of warm mix asphalt. Journal of Construction and
Building Materials, 36(1):165-170.
Khosla, N. P., & Sadasivam, S. (2002). Evaluation of the effects of mixture properties
and compaction methods on the predicted performance of superpave mixtures.
Final Report FHWA/NC/2002-030, North Carolina State University, USA.

137
Kim, Y. R., Pinto, I., & Park, S. W. (2012). Experimental evaluation of anti-stripping
additives in bituminous mixtures through multiple scale laboratory test results.
Journal of Construction and Building Materials, 29(1): 386-393.
Kim, Y., Lim, J., Lee, M., Kown, S., Huang, S., & Wei, L. (2013). Comprehensive
evaluation of polymer-modified SMA mixture produced with new polyethylene
wax-based WMA additive with adhesion promoter. Characteristics of non-
asphalt components of asphalt paving mixtures (AFK 30). Annual Meeting of
the Transportation Research Board (TRB).
Kok, B. V., & Yilmaz, M. (2009). The effects of using lime and styrene–butadiene–
styrene on moisture sensitivity resistance of hot mix asphalt. Journal of
Construction and Building Materials, 23(1):1999-2006.
Kumar, A., & Goetz, W. H. (1997). The gyratory testing machines a design tool and an
instrument for bituminous mixture evaluation, Asphalt Paving Technology,
43:350-371.
Lee, C. H., Du, J. C., & Shen, D. H. (2012). Evaluation of pre-coated recycled concrete
aggregate for hot mix asphalt. Journal of Construction and Building Materials,
28(1):66-71.
Lu, X., & Redelius, P. (2007). Effect of bitumen wax on asphalt mixture performance.
Journal of Construction and Building Materials, 21(11):1961-1970.
Marques, V. D. C., de Queiroz, B. O., de Lacerda, D. M., Gouveia, A. M. D. A., & de
Melo, R. A. (2014). Mechanical Performance of Asphalt Mixtures with Natural
Aggregates and Recycled Aggregates for Surface Course. In Key Engineering
Materials (Vol. 600, pp. 657-666). Trans Tech Publications.
Masad, E., Muhunthan, B., Naga, S., & Thomas, H. (1999). Quantifying laboratory
compaction effects on the internal structure of asphalt concrete, Transportation
Research Record.168: 179-185.
Massad, E., Al-Rousan, T., Button, J. W., Little, D. N., & Tutumluer, E. (2005). Test
methods for characterizing aggregate shape, texture and angularity. Technical
Report NCHRP 4-30A, National Cooperative Highway Research Program,
National Research Council.
Matthews, J. M., Monismith, C. L., & Craus, J. (1993). Investigation of laboratory
fatigue testing procedures for asphalt aggregate mixtures. Journal of
Transportation Engineering, 119(4):634-654.
McGrath, C. (2001). Waste minimization in practice. Journal of Resources Conservation
and Recycling, 32 (3-4): 227-238.
Michael, S., Bruce, A. C., & Andrew, D. (2002), Investigation of recycled martial
asphalt pavement (RAP) mixtures, Center for Transportation Studies, Report No.
MN/RC-2002-15, Minnesota Department of Transportation, USA.

138
Miller. C., Vasconcelos, K., Little, D. N., & Bhasin, A. (2011). Investigating aspects of
aggregate properties that influence asphalt mixtures performance. Research
Report for DTFH61-06-C-00021, Texas A & M University at College Station
and the University of Texas at Austin, Texas, USA.
Mo, L., Huurman, M., Wu, S., & Molenaar, A. A. A. (2009). Raveling investigation of
porous asphalt concrete based on fatigue characteristics of bitumen-stone
adhesion and mortar. Journal of Material and design, 30:170-179.
Moghadas Nejad, F., Azarhoosh, A. R., Hamedi, GH. H., & Azarhoosh, M. J. (2012).
Influence of using nonmaterial to reduce the moisture susceptibility of hot mix
asphalt. Journal of Construction and Building Materials, 31(1):384- 388.
Moghadas Nejad, F., Azarhoosh, A. R., & Hamedi, G. H. (2013). The effects of using
recycled concrete on fatigue behavior of hot mix asphalt. Journal of Civil
Engineering and Management, 19(sup1), S61-S68.
Mroueh, U., & Wahlstram, M. (2002). By-products and recycled materials in earth
construction in Finland. An assessment of applicability. Journal of Resources
Conservation and Recycling, 35(1-2):117-129.
NAPA (1982), Development of Marshall Procedures for Designing Asphalt Paving
Mixtures, Information Series 84, National Asphalt Pavement Association
(NAPA), Lanham, MD.
NCHRP (2001). Appropriate use of waste and recycled materials in the transportation
industry-an information database. Project 4-21, Transportation Research Board,
NRC, CRP-CD-5.
Paranavithana, S., & Mohajerani, A. (2006). Effects of recycled concrete aggregate on
properties of asphalt concrete, Journal of Resource Conservation and Recycling,
48(1):1-12.
Pasandín, A. R., & Perez, I. (2013). Laboratory evaluation of hot-mix asphalt containing
construction and demolition waste. Journal of Construction and Building
Materials, 43 (1): 497-505.
Pasandín, A. R., & Pérez, I. (2014). Effect of ageing time on properties of hot-mix
asphalt containing recycled concrete aggregates. Journal of Construction and
Building Materials, 52: 284-293.
Pasandín, A. R., & Pérez, I. (2014). Mechanical properties of hot-mix asphalt made with
recycled concrete aggregates coated with bitumen emulsion. Construction and
Building Materials, 55, 350-358.
Pasandín, A. R., Pérez, I., Oliveira, J. R., Silva, H. M., & Pereira, P. A. (2015).
Influence of ageing on the properties of bitumen from asphalt mixtures with
recycled concrete aggregates. Journal of Cleaner Production, 101, 165-173.
Peattie, K. R. (1979). The analytical design of flexible pavements, Lecture Notes,
Department of Civil Engineering Symposium, University of Glasgow.

139
Pedersen, (2011). NCHRP report 673. A manual for design of hot mix asphalt with
commentary. National cooperative highway research program. Transportation
Research Board (TRB). Washington, D.C, USA.
Perez, I., Pasandín, A. R., & Gallego, J. (2010a). Impact of construction and demolition
waste aggregates on stripping in hot-mix asphalt. In: Presented at 89th annual
meeting of the transportation research board, Washington, D. C, USA.
Perez, I., Pasandín, A. R., & Gallego, J. (2012b). Stripping in hot mix asphalt produced
by aggregates from construction and demolition waste. Journal of Waste
Management & Research, 30(1):3-11.
Perez, I., Pasandín, A. R., & Medina, L. (2012c). Hot mix asphalt using C&D waste as
coarse aggregates. Journal of Materials & Design, 36(1):840-846.
Perez, P., Agrela, F., Herrador, R., & Ordonez, J. (2013). Application of cement-treated
recycled materials in the construction of a section of road in Malaga, Spain.
Journal of Construction and Building Materials, 44(1):593-599.
Petersen, J. C., Plancher, H., Ensley, E. K., Venable, R. L., & Miyake, G. (1982).
Chemistry of asphalt-aggregate interaction: relationship with pavement
moisture-damage prediction test. Transportation Research Record.
Transportation Research Board (TRB), National Research Council, Washington,
DC, 843:95-104.
Petit, C., Al-Qadi, I. l., & Millien, A. (2004). Cracking in pavements. Mitigation, risk
assessment and prevention. Proceeding of the fifth international RILEM
conference, Limoges, France.
Petrarca, R. W., & Galdiero, V. A. (1984). Summary of Testing of Recycled Crushed
Concrete, Transportation Research Record. Transportation Research Board
(TRB). National Research Council, Washington, DC, 989:19-26.
Pihl, K.A., & Milvang-Jensen, O. (2001). The motivation factors in the development
and sustainment of a well-functioning recycling industry for road and non-road
byproducts in Denmark. In proceedings of the specialty conference on
beneficial use of recycled materials in transportation applications, Arlington,
Virginia. 13-15th
November 2001. University of New Hampshire, Durham,
USA, 19-27.
Poon, C. S., & Chan, D. (2006). Feasible use of recycled concrete aggregates and
crushed clay brick as unbound road sub-base, Journal of Construction and
Building Materials, 20(8):578-585.
Poon, S. C., Shui, Z. H., Lam, L., Fok, H., & Kou, S. C. (2004). Influence of moisture
states of natural and recycled aggregates on the slump and compressive strength
of hardened concrete. Journal of Cement and Concrete, 34(1):31-36.
Roberts, F. L., Kandhal, P. S., Brown, E. R., Lee, D. Y., & Kennedy, T.W. (1996). Hot
mix asphalt materials, mixture, design, and construction (2nd
edition), Lanham,
Maryland: NAPA Education Foundation.
140
Roussat, N., Me´hu, J., Abdelghafour, M., & Brula, P. (2008). Leaching behaviour of
hazardous demolition waste. Journal of Waste Management, 28:2032-2040.
Saad, A. Q., & Mohammad, W. M. (2005). New chemical anti-stripping additives for
bituminous mixtures. Journal of ASTM International, 2(8):1-11.
Sangsefidi, E., Ziari, H., & Mansourkhaki, A. (2014). The effect of aggregate gradation
on creep and moisture susceptibility performance of warm mix asphalt.
International Journal of Pavement Engineering, 15 (2): 133-142.
Satish, C., & Rajan, C. (2013). Performance Characteristics of bituminous concrete with
industrial wastes as filler. Journal of Materials in Civil Engineering,
ASCE, 139(5): 467-475.
Schutzbach, A. M. (1992). Case study of a full-depth asphalt concrete inlay. Flexible
pavement construction, performance and recycling. Transportation Research
Record. Transportation Research Board (TRB). National research council,
Washington, D.C, USA, 1337:42-50.
Shen, D. H., & Du, J. C. (2004). Evaluation of building materials recycling on HMA
permanent deformation. Journal of Construction and Building Materials,
18(1):391-397.
Snyder, M. B., & Bruinsma, J. E. (1996). Review of Studies Concerning Effects of
Unbound Crushed Concrete Bases on PCC Pavement Drainage, Transportation
Research Record. Transportation Research Board. National Research Council,
Washington, DC, 1519:51-58.
Sousa, J. B., Pais, J. C., Prates, M., Barros, R., Langlois, P., & Leclerc, A. M. (1998).
Effect of Aggregate Gradation on Fatigue Life of Asphalt Concrete Mixes.
Transportation Research Record. Journal of the Transportation Research Board.
Volume 1630. Pages 62-68.
Surya, M., Kanta Rao, V. V. L., & Lakshmy, P. (2013). Recycled aggregate concrete for
Transportation Infrastructure. 2nd Conference of Transportation Research Group
of India (2nd CTRG). Procedia - Social and Behavioral Sciences, 104:1158-
1167.
Tapkin, S. (2008). Mechanical evaluation of asphalt-aggregate mixtures prepared with
fly ash as a filler replacement. Canadian Journal of Civil Engineering, 35(1), 27-
40.
Tapkın, S., & Keskin, M. (2013). Rutting Analysis of 100 mm Diameter Polypropylene
Modified Asphalt Specimens Using Gyratory and Marshall Compactors. Journal
of Materials Research, 16(2):546-564.
Tayfur, S., Ozen, H., & Aksoy, A. (2007). Investigation of rutting performance of
asphalt mixtures containing polymer modifiers. Journal of Construction and
Building Materials, 21(2):328-337.
Thomas, K. P., McKay, J. F., & Branthaver, J. F. (2006). Surfactants in Aged Asphalt
and Impact μ on Moisture Susceptibility of Laboratory-prepared Mixes. Journal
of Road Materials and Pavement Design, 7(4):477-490.

141
Tia. M., (2005). Fundamentals and practice of asphalt mixture design procedures to
assure adequate performance, 13th
Conference on Pavement Engineering, Hsin
Chu, Taiwan.
Topal, A., & Sengoz, B. (2005). Determination of fine aggregate angularity in relation
with the resistance to rutting of hot-mix asphalt, Journal of Construction and
Building Materials, 19(2):155-163.
Topal, A., & Sengoz, B. (2008). Evaluations of compacted aggregate resistant test
compared with the fine aggregate angularity standards, Journal of Construction
and Building Materials, 22(5):993-998.
Topal, A., Ozturk, A.U., and Baradan, B. (2006). Use of recycled concrete aggregates in
hot-mix asphalt. In Proceeding of Eight CANMET/ACI International
Conference on Recent Advances in Concrete Technology, SP- 235-20. American
Concrete Institute. 31st May- 3
rd June 2006. Montreal, Quebec, Canada, pp 282-
295.
Vegas, I., Ibañez, J. A., San José, J. T., & Urzelai, A. (2008). Construction demolition
wastes, waelz slag and MSWI bottom ash: a comparative technical analysis as
material for road construction. Journal of Waste Management, 28(3):565-574.
WAPA, (2011). Washington Asphalt Pavement Association. Surface Distresses,
Asphalt Pavement Guide, Retrieved on June 24, 2011, from
http://www.asphaltwa.com/wapa_web/modules/11_guidance/11_surface_distres
s.htm.
White, T. D., Johnson, S. R., & Yzenas, J. J. (2001). Aggregate contribution to hot mix
asphalt (HMA) performance, American Society for Testing and Materials
(ASTM) STP 1412, West Conshohocken, PA.
Witczak, M. W. (2004). NCHRP Project No. 1-28 A, Resilient Modulus for Flexible
Pavement Design, University of Maryland-College Park, Arizona State
University, Tempe, Arizona, USA.
Wong, Y. D., Sun, D. D., & Lai, D. (2007). Value-added utilization of recycled concrete
in hot-mix asphalt. Journal of Waste Management, 27(2):294-301.
Wu, S., Zhong, J., Zhu, J., & Wang, D. (2013). Influence of demolition waste used as
recycled aggregate on performance of asphalt mixture. Journal of Road
Materials and Pavement Design, 14(3):679-688.
Xiao, F., & Amirkhanian, S. N. (2009). Laboratory investigation of moisture damage in
rubberised asphalt mixtures containing reclaimed asphalt pavement.
International Journal of Pavement Engineering, 10(5): 19-328.
Xue, Y., Hou, H., Zhu, S., & Zha, J. (2009). Utilization of municipal solid waste
incineration ash in stone mastic asphalt mixture: pavement performance and
environmental impact. Journal of Construction and Building Materials,
23(2):989-996.

142
List of Publications:
- Pourtahmasb, M. S., Karim, M. R. (2014). Performance evaluation of stone mastic
asphalt and hot mix asphalt mixtures containing recycled concrete aggregate.
Journal of Advances in Materials Science and Engineering. DOI:
http://dx.doi.org/10.1155/2014/863148. (ISI- Cited Publication)
- Pourtahmasb, M. S., Karim, M. R. (2014). Utilization of recycled concrete
aggregates in stone mastic asphalt mixtures. Journal of Advances in Materials
Science and Engineering. DOI: http://dx.doi.org/10.1155/2014/902307. ( ISI- Cited
Publication)
- Pourtahmasb, M. S., Karim, M. R., Shamshirband, S. (2015). Resilient modulus
prediction of asphalt mixtures containing recycled concrete aggregate using an
adaptive neuro-fuzzy methodology. Journal of Construction and building materials.
82: 257-263. DOI: 10.1016/j.conbuildmat.2015.02.030. ( ISI- Cited Publication)
- Pourtahmasb, M. S., Karim, M. R. (2011). Typical types of Hot Mix Asphalt
(HMA) pavements deterioration (distress) and maintenance methods. Transport
Research Conference (TRC), University Science Malaysia (USM), Pinang,
Malaysia.
- Pourtahmasb, M. S., Zargar, M., Ahmadinia, E and Karim, M. R. (2012).
Specifications of aggregates used in stone mastic asphalt and the minimum standard
requirement. International Technical Conference (ITC), Kuala Lumpur, Malaysia.
- Zargar, M., Pourtahmasb, M. S., Ahmadinia, E and Karim, M. R. (2012).
Utilization of Celolose oil palm fibers in Stone Mastic Asphalt (SMA) mixtures.
International Technical Conference (ITC), Kuala Lumpur, Malaysia.
- Pourtahmasb, M. S., Karim, M. R., Almasi, M. H and Mirzapour Munes, S.
(2013). Evaluation of permanent deformation on wearing course of flexible
pavements using, Loaded Wheel Tracking (LWT) Test. Malaysian Universities
Transportation Research Forum and Conference (MUTRFC), University
Kebangsaan Malaysia (UKM), Malaysia.
- Almasi, M. H., Karim, M. R., Mirzapour Munes, S and Pourtahmasb, M. S.
(2013). Feeder bus network design problems. Malaysian Universities Transportation
Research Forum and Conference (MUTRFC), University Kebangsaan Malaysia
(UKM), Malaysia.

143
Appendices
APPENDIX A
Optimum Asphalt Content (OAC) of HMA mixtures containing RCA
0% RCA (HMA)
Density: y = -0.0204 x2 + 0.201 x + 1.942
dx
dy= 0 x = 4.926
Stability: y = -1.0386 x2 + 10.474 x – 16.325
dx
dy= 0 x = 5.042
VTM: y = -1.4833x + 11.713
Y= 4 y = -1.4833x + 11.713= 4 x = 5.20
OAC of the HMA Mixture containing 0% RCA
Property Selected binder content
(%)
Peak of density curve 4.926
Peak of stability curve 5.042
4% air voids, from VTM curve 5.200
OAC 5.1
20% Fine RCA (HMA)
Density: y = -0.0122 x2 + 0.1372 x +2.017
dx
dy= 0 x = 5.623
Stability: y = -0.9181 x2 + 9.2783 x – 13.613
dx
dy= 0 x = 5.053
y = -0.0204x2 + 0.201x + 1.942
R² = 0.9228 2.410
2.415
2.420
2.425
2.430
2.435
2.440
2.445
3.5 4 4.5 5 5.5 6 6.5
Den
sity
(gr/
cm3)
Binder content (%)
y = -1.0386x2 + 10.474x - 16.325
R² = 0.913 8.60
8.80
9.00
9.20
9.40
9.60
9.80
10.00
10.20
10.40
3.5 4 4.5 5 5.5 6 6.5
Sta
bil
ity (
KN
)
Binder contant (%)
y = -1.4833x + 11.713
R² = 0.9826
2.00
3.00
4.00
5.00
6.00
7.00
8.00
3.5 4 4.5 5 5.5 6 6.5
VT
M (
%)
Binder content (%)
y = -0.0122x2 + 0.1372x + 2.017
R² = 0.9091
2.365
2.375
2.385
2.395
2.405
2.415
3.5 4 4.5 5 5.5 6 6.5
Den
sity
(gr/
cm3)
Binder content (%)
y = -0.9181x2 + 9.2783x - 13.613
R² = 0.8861 8.40
8.60
8.80
9.00
9.20
9.40
9.60
9.80
10.00
3.5 4 4.5 5 5.5 6 6.5
Sta
bil
ity (
KN
)
Binder content (%)
y = -1.15x + 10.589
R² = 0.9525
2.00
3.00
4.00
5.00
6.00
7.00
8.00
3.5 4 4.5 5 5.5 6 6.5
VT
M (
%)
Binder content (%)

144
VTM: y = -1.15 x + 10.589
Y= 4 y = -1.15 x + 10.589= 4 x = 5.730
OAC of the HMA Mixture containing 20% F-RCA
Property Selected binder content
(%)
Peak of density curve 5.623
Peak of stability curve 5.053
4% air voids, from VTM curve 5.730
OAC 5.5
40% Fine RCA (HMA)
Density: y = -0.021 x2 + 0.2392 x + 1.7142
dx
dy= 0 x = 5.69
Stability: y = -0.739 x2 + 9.0792 x – 18.878
dx
dy= 0 x = 6.14
VTM: y = -1.262 x + 11.555
Y= 4 y = -1.262 x + 11.555= 4 x = 5.98
OAC of the HMA Mixture containing 40% F-RCA
Property Selected binder content
(%)
Peak of density curve 5.69
Peak of stability curve 6.14
4% air voids, from VTM curve 5.98
OAC 5.9
60% Fine RCA (HMA)
Density: y = -0.0417x2 + 0.5318x + 0.6597
dx
dy= 0 x =6.370
y = -0.021x2 + 0.2392x + 1.7142
R² = 0.9357
2.350
2.360
2.370
2.380
2.390
2.400
2.410
4.5 5 5.5 6 6.5 7 7.5
Den
sity
(gr/
cm3)
Binder content (%)
y = -0.739x2 + 9.0792x - 18.878
R² = 0.8765 7.60
7.80
8.00
8.20
8.40
8.60
8.80
9.00
9.20
4.5 5.5 6.5 7.5
Sta
bil
ity (
KN
)
Binder content (%)
y = -1.262x + 11.555
R² = 0.9878
2.00
2.50
3.00
3.50
4.00
4.50
5.00
5.50
6.00
4.5 5 5.5 6 6.5 7 7.5
VT
M (
%)
Binder content (%)
y = -0.0417x2 + 0.5318x + 0.6597
R² = 0.8686
2.290
2.300
2.310
2.320
2.330
2.340
2.350
2.360
2.370
5 5.5 6 6.5 7 7.5 8
Den
sity
(gr/
cm3)
Binder content (%)
y = -0.679x2 + 9.195x - 22.585
R² = 0.9576 7.20
7.40
7.60
7.80
8.00
8.20
8.40
8.60
8.80
5 5.5 6 6.5 7 7.5 8
Sta
bil
ity (
KN
)
Binder content (%)
y = -1.2133x + 11.882
R² = 0.9441
2.00
3.00
4.00
5.00
6.00
7.00
8.00
5 5.5 6 6.5 7 7.5 8
VT
M (
%)
Binder content (%)

145
Stability: y = -0.679 x2 + 9.195 x - 22.585
dx
dy= 0 x = 6.771
VTM: y = -1.2133x + 11.882
Y= 4 -1.2133x + 11.882 = 4 x = 6.497
OAC of the HMA Mixture containing 60% F-RCA
Property Selected binder content
(%)
Peak of density curve 6.370
Peak of stability curve 6.771
4% air voids, from VTM curve 6.497
OAC 6.5
80% Fine RCA (HMA)
Density: y = -0.0292 x2 + 0.4317 x + 0.6999
dx
dy= 0 x = 7.390
Stability: y = -0.3981 x2 + 5.8261 x – 13.285
dx
dy= 0 x = 7.317
VTM: y = -1.0893 x + 11.998
Y= 4 -1.0893 x + 11.998= 4 x = 7.341
OAC of the HMA Mixture containing 80% F-RCA
Property Selected binder content
(%)
Peak of density curve 7.390
Peak of stability curve 7.317
4% air voids, from VTM curve 7.341
OAC 7.3
y = -0.0292x2 + 0.4317x + 0.6999
R² = 0.9408
2.250
2.260
2.270
2.280
2.290
2.300
2.310
6 6.5 7 7.5 8 8.5 9
Den
sity
(gr/
cm3)
Binder content (%)
y = -0.3981x2 + 5.8261x - 13.285
R² = 0.9157 7.20
7.40
7.60
7.80
8.00
8.20
6 6.5 7 7.5 8 8.5 9
Sta
bil
ity (
KN
)
Binder content (%)
y = -1.0893x + 11.998
R² = 0.9811
2.00
3.00
4.00
5.00
6.00
7.00
8.00
6 6.5 7 7.5 8 8.5 9
VT
M (
%)
Binder content (%)

146
20% Coarse RCA (HMA)
Density: y = -0.0308 x2 + 0.3403 x + 1.4921
dx
dy= 0 x = 5.52
Stability: y = -1.1419 x2 + 12.818 x – 25.777
dx
dy= 0 x = 5.61
VTM: y = -1.2233 x + 10.406
Y= 4 y = -1.2233 x + 10.406= 4 x = 5.23
OAC of the HMA Mixture containing 20% C-RCA
Property Selected binder content
(%)
Peak of density curve 5.52
Peak of stability curve 5.61
4% air voids, from VTM curve 5.23
OAC 5.4
40% Coarse RCA (HMA)
Density: y = -0.0228 x2 + 0.2322 x + 1.8162
dx
dy= 0 x = 5.092
Stability: y = -0.8343 x2 + 9.5118 x – 17.819
dx
dy= 0 x = 5.701
VTM: y = -1.2007x + 10.693
Y= 4 -1.2007x + 10.693= 4 x = 5.575
y = -0.0308x2 + 0.3403x + 1.4921
R² = 0.9243
2.390
2.400
2.410
2.420
2.430
2.440
2.450
4 4.5 5 5.5 6 6.5 7
Den
sity
(gr/
cm3)
Binder content (%)
y = -1.1419x2 + 12.818x - 25.777
R² = 0.9699 8.60
8.80
9.00
9.20
9.40
9.60
9.80
10.00
10.20
10.40
4 4.5 5 5.5 6 6.5 7
Sta
bil
ity (
KN
)
Binder content (%)
y = -1.2233x + 10.406
R² = 0.9747
2.00
3.00
4.00
5.00
6.00
4 4.5 5 5.5 6 6.5 7
VT
M (
%)
Binder content (%)
y = -0.0228x2 + 0.2322x + 1.8162
R² = 0.9091
2.360
2.370
2.380
2.390
2.400
2.410
2.420
4 4.5 5 5.5 6 6.5 7
Den
sity
(gr/
cm3)
Binder content (%)
y = -0.8343x2 + 9.5118x - 17.819
R² = 0.9652
7.80
8.00
8.20
8.40
8.60
8.80
9.00
9.20
9.40
9.60
4 4.5 5 5.5 6 6.5 7
Sta
bil
ity (
KN
)
Binder content (%)
y = -1.2007x + 10.693
R² = 0.9394
2.00
3.00
4.00
5.00
6.00
7.00
4 4.5 5 5.5 6 6.5 7
VT
M (
%)
Binder content (%)

147
OAC of the HMA Mixture containing 40% C-RCA
Property Selected binder content
(%)
Peak of density curve 5.092
Peak of stability curve 5.701
4% air voids, from VTM curve 5.575
OAC 5.5
60% Coarse RCA (HMA)
Density: y = -0.0378 x2 + 0.494 x + 0.7399
dx
dy= 0 x = 6.53
Stability: y = -0.8229 x2 + 10.408 x – 24.473
dx
dy= 0 x = 6.32
VTM: y = -0.8853 x + 9.156
Y= 4 y = -0.8853 x + 9.156= 4 x = 5.82
OAC of the HMA Mixture containing 60% C-RCA
Property Selected binder content
(%)
Peak of density curve 6.53
Peak of stability curve 6.32
4% air voids, from VTM curve 5.82
OAC 6.2
80% Coarse RCA (HMA)
Density: y = -0.0312 x2 + 0.4272 x + 0.8455
dx
dy= 0 x = 6.85
y = -0.0378x2 + 0.494x + 0.7399
R² = 0.9144 2.305
2.315
2.325
2.335
2.345
2.355
2.365
5 5.5 6 6.5 7 7.5 8
Den
sity
(gr/
cm3)
Binder content (%)
y = -0.8229x2 + 10.408x - 24.473
R² = 0.9159 7.20
7.40
7.60
7.80
8.00
8.20
8.40
8.60
8.80
5 5.5 6 6.5 7 7.5 8
Sta
bil
ity (
KN
)
Binder content (%)
y = -0.8853x + 9.156
R² = 0.9846
2.00
3.00
4.00
5.00
6.00
5 5.5 6 6.5 7 7.5 8
VT
M (
%)
Binder content (%)
y = -0.0312x2 + 0.4272x + 0.8455
R² = 0.9516
2.250
2.260
2.270
2.280
2.290
2.300
2.310
2.320
5.5 6 6.5 7 7.5 8 8.5
Den
sity
(gr/
cm3)
Binder content (%)
y = -0.86x2 + 11.703x - 32.236
R² = 0.9697 6.00
6.20
6.40
6.60
6.80
7.00
7.20
7.40
7.60
7.80
5.5 6 6.5 7 7.5 8 8.5
Sta
bil
ity (
KN
)
Binder content (%)
y = -1.2147x + 12.253
R² = 0.9784
2.00
3.00
4.00
5.00
6.00
5.5 6 6.5 7 7.5 8 8.5
VT
M (
%)
Binder content (%)

148
Stability: y = -0.86 x2 + 11.703 x – 32.236
dx
dy= 0 x = 6.80
VTM: y = -1.2147x + 12.253
Y= 4 y = -1.2147x + 12.253= 4 x = 6.79
OAC of the HMA Mixture containing 80% C-RCA
Property Selected binder content
(%)
Peak of density curve 6.85
Peak of stability curve 6.80
4% air voids, from VTM curve 6.79
OAC 6.8
20% Mix RCA (HMA)
Density: y = -0.0262x2 + 0.2764x + 1.6876
dx
dy= 0 x = 5.275
Stability: y = -1.0371 x2 + 10.501 x – 16.633
dx
dy= 0 x = 5.063
VTM: y = -1.1447 x + 10.609
Y= 4 -1.1447 x + 10.609= 4 x = 5.77
OAC of the HMA Mixture containing 20% M-RCA
Property Selected binder content
(%)
Peak of density curve 5.275
Peak of stability curve 5.063
4% air voids, from VTM curve 5.77
OAC 5.4
y = -0.0262x2 + 0.2764x + 1.6876
R² = 0.9701
2.360
2.370
2.380
2.390
2.400
2.410
2.420
2.430
3.5 4 4.5 5 5.5 6 6.5
Den
sity
(gr/
cm3)
Binder content (%)
y = -1.0371x2 + 10.501x - 16.633
R² = 0.9582
8.60
8.80
9.00
9.20
9.40
9.60
9.80
10.00
10.20
3.5 4 4.5 5 5.5 6 6.5
Den
sity
(K
N)
Binder content (%)
y = -1.1447x + 10.609
R² = 0.9628 3.00
4.00
5.00
6.00
7.00
3.5 4 4.5 5 5.5 6 6.5
VT
M (
%)
Binder content (%)
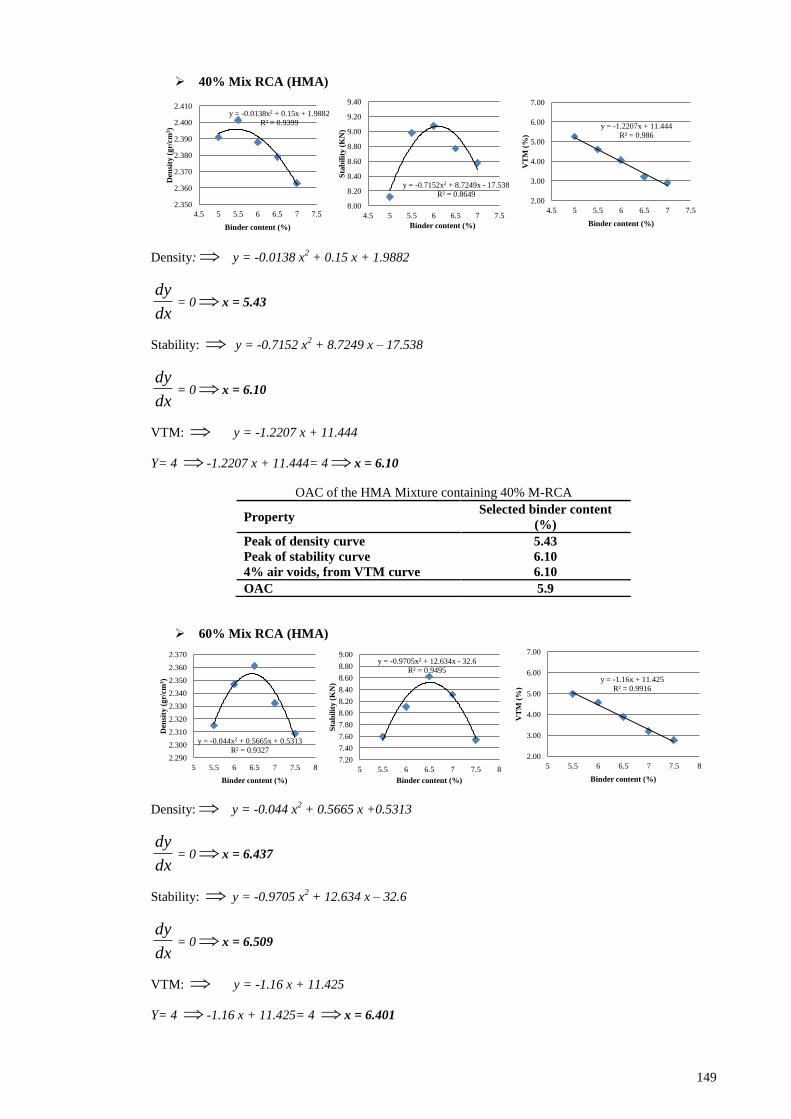
149
40% Mix RCA (HMA)
Density: y = -0.0138 x2 + 0.15 x + 1.9882
dx
dy= 0 x = 5.43
Stability: y = -0.7152 x2 + 8.7249 x – 17.538
dx
dy= 0 x = 6.10
VTM: y = -1.2207 x + 11.444
Y= 4 -1.2207 x + 11.444= 4 x = 6.10
OAC of the HMA Mixture containing 40% M-RCA
Property Selected binder content
(%)
Peak of density curve 5.43
Peak of stability curve 6.10
4% air voids, from VTM curve 6.10
OAC 5.9
60% Mix RCA (HMA)
Density: y = -0.044 x2 + 0.5665 x +0.5313
dx
dy= 0 x = 6.437
Stability: y = -0.9705 x2 + 12.634 x – 32.6
dx
dy= 0 x = 6.509
VTM: y = -1.16 x + 11.425
Y= 4 -1.16 x + 11.425= 4 x = 6.401
y = -0.0138x2 + 0.15x + 1.9882
R² = 0.9399
2.350
2.360
2.370
2.380
2.390
2.400
2.410
4.5 5 5.5 6 6.5 7 7.5
Den
sity
(gr/
cm3)
Binder content (%)
y = -0.7152x2 + 8.7249x - 17.538
R² = 0.8649
8.00
8.20
8.40
8.60
8.80
9.00
9.20
9.40
4.5 5 5.5 6 6.5 7 7.5
Sta
bil
ity (
KN
)
Binder content (%)
y = -1.2207x + 11.444
R² = 0.986
2.00
3.00
4.00
5.00
6.00
7.00
4.5 5 5.5 6 6.5 7 7.5
VT
M (
%)
Binder content (%)
y = -0.044x2 + 0.5665x + 0.5313
R² = 0.9327 2.290
2.300
2.310
2.320
2.330
2.340
2.350
2.360
2.370
5 5.5 6 6.5 7 7.5 8
Den
sity
(gr/
cm3)
Binder content (%)
y = -0.9705x2 + 12.634x - 32.6
R² = 0.9495
7.20
7.40
7.60
7.80
8.00
8.20
8.40
8.60
8.80
9.00
5 5.5 6 6.5 7 7.5 8
Sta
bil
ity (
KN
)
Binder content (%)
y = -1.16x + 11.425
R² = 0.9916
2.00
3.00
4.00
5.00
6.00
7.00
5 5.5 6 6.5 7 7.5 8
VT
M (
%)
Binder content (%)

150
Table 11: OAC of the HMA Mixture with 60% M-RCA
Property Selected binder content
(%)
Peak of density curve 6.437
Peak of stability curve 6.509
4% air voids, from VTM curve 6.401
OAC 6.4
80% Mix RCA (HMA)
Density: y = -0.0253 x2 + 0.3529 x + 1.0695
dx
dy= 0 x = 6.974
Stability: y = -0.8019 x2 + 10.837 x – 28.878
dx
dy= 0 x = 6.757
VTM: y = -1.236 x + 12.996
Y= 4 -1.236 x + 12.996= 4 x = 7.278
OAC of the HMA Mixture containing 80% M-RCA
Property Selected binder content
(%)
Peak of density curve 6.974
Peak of stability curve 6.757
4% air voids, from VTM curve 7.278
OAC 7.0
y = -0.0253x2 + 0.3529x + 1.0695
R² = 0.9644 2.260
2.270
2.280
2.290
2.300
2.310
2.320
5.5 6 6.5 7 7.5 8 8.5
Den
sity
(gr/
cm3)
Binder content (%)
y = -0.8019x2 + 10.837x - 28.878
R² = 0.9883 6.20
6.40
6.60
6.80
7.00
7.20
7.40
7.60
7.80
8.00
5.5 6 6.5 7 7.5 8 8.5 S
tab
ilit
y (
KN
)
Binder content (%)
y = -1.236x + 12.996
R² = 0.9787
2.00
3.00
4.00
5.00
6.00
7.00
5.5 6 6.5 7 7.5 8 8.5
VT
M (
%)
Binder content (%)

151
APPENDIX B
Optimum Asphalt Content (OAC) of SMA mixtures containing RCA
0% RCA (SMA)
Density: y = -0.0133 x2 + 0.1743 x + 1.7468
dx
dy= 0 x = 6.553
Stability: y = -0.6612 x2 + 7.6062 x - 14.072
dx
dy= 0 x = 5.752
VTM: y = -1.6087x + 14.12
Y= 4 y = -1.6087x + 14.12 = 4 x = 6.291
Flow: y = 0.2657 x2 - 2.4252 x + 8.1729
OAC of the SMA Mixture containing 0% RCA
Property Selected binder content
(%)
Peak of density curve 6.553
Peak of stability curve 5.752
4% air voids, from VTM curve 6.291
OAC 6.2
20% Fine RCA (SMA)
Density: y = -0.012 x2 + 0.1591 x + 1.7932
dx
dy= 0 x = 6.629
Stability: y = -0.5914 x2 + 6.8818 x - 12.141
y = -0.0133x2 + 0.1743x + 1.7468
R² = 0.9961
2.280
2.285
2.290
2.295
2.300
2.305
2.310
2.315
2.320
4.5 5 5.5 6 6.5 7 7.5
Den
sity
(gr/
cm3)
Binder content (%)
y = -0.6612x2 + 7.6062x - 14.072
R² = 0.9119
6.60
6.80
7.00
7.20
7.40
7.60
7.80
8.00
8.20
4.5 5 5.5 6 6.5 7 7.5
Sta
bil
ity (
KN
)
Binder contant (%)
y = -1.6087x + 14.12
R² = 0.9455
2.00
3.00
4.00
5.00
6.00
7.00
8.00
4.5 5 5.5 6 6.5 7 7.5
VT
M (
%)
Binder content (%)
y = -0.012x2 + 0.1591x + 1.7932
R² = 0.9439
2.285
2.290
2.295
2.300
2.305
2.310
2.315
2.320
2.325
4.5 5 5.5 6 6.5 7 7.5
Den
sity
(gr/
cm3)
Binder content (%)
y = -0.5914x2 + 6.8818x - 12.141
R² = 0.78
6.80
7.00
7.20
7.40
7.60
7.80
8.00
8.20
4.5 5 5.5 6 6.5 7 7.5
Sta
bil
ity (
KN
)
Binder content (%)
y = -1.6133x + 14.147
R² = 0.944
2.00
3.00
4.00
5.00
6.00
7.00
8.00
4.5 5 5.5 6 6.5 7 7.5
VT
M (
%)
Binder content (%)

152
dx
dy= 0 x = 5.818
VTM: y = -1.6133 x + 14.147
Y= 4 y = -1.6133 x + 14.147= 4 x = 6.290
Flow: y = 0.2914x2 - 2.6958x + 8.865
OAC of the SMA Mixture containing 20% F-RCA
Property Selected binder content
(%)
Peak of density curve 6.629
Peak of stability curve 5.818
4% air voids, from VTM curve 6.290
OAC 6.2
40% Fine RCA (SMA)
Density: y = -0.0085 x2 + 0.1155 x + 1.9218
dx
dy= 0 x = 6.794
Stability: y = -0.7524 x2 + 8.9486 x - 18.465
dx
dy= 0 x = 5.947
VTM: y = -1.6007 x + 14.096
Y= 4 y = -1.6007x + 14.096 = 4 x = 6.307
Flow: y = 0.2933 x2 - 2.7253 x + 9.0493
OAC of the SMA Mixture containing 40% F-RCA
Property Selected binder content
(%)
Peak of density curve 6.794
Peak of stability curve 5.947
4% air voids, from VTM curve 6.307
OAC 6.3
y = -0.0085x2 + 0.1155x + 1.9218
R² = 0.9599
2.285
2.290
2.295
2.300
2.305
2.310
2.315
2.320
4.5 5 5.5 6 6.5 7 7.5
Den
sity
(gr/
cm3)
Binder content (%)
y = -0.7524x2 + 8.9486x - 18.465
R² = 0.7443 7.00
7.20
7.40
7.60
7.80
8.00
8.20
8.40
4.5 5 5.5 6 6.5 7 7.5
Sta
bil
ity (
KN
)
Binder content (%)
y = -1.6007x + 14.096
R² = 0.9463
2.00
3.00
4.00
5.00
6.00
7.00
8.00
4.5 5 5.5 6 6.5 7 7.5
VT
M (
%)
Binder content (%)

153
60% Fine RCA (SMA)
Density: y = -0.0065x2 + 0.0912x + 1.9923
dx
dy= 0 x =7.015
Stability: y = -0.8876 x2 + 10.314 x - 22.078
dx
dy= 0 x = 5.81
VTM: y = -1.2761 x + 12.512
Y= 4 -1.2761 x + 12.512 = 4 x = 6.67
Flow: y = 0.3467 x2 - 3.396 x + 11.172
OAC of the SMA Mixture containing 60% F-RCA
Property Selected binder content
(%)
Peak of density curve 7.015
Peak of stability curve 5.810
4% air voids, from VTM curve 6.670
OAC 6.5
80% Fine RCA (SMA)
Density: y = -0.0106 x2 + 0.1432 x + 1.8263
dx
dy= 0 x = 6.755
Stability: y = -0.5638 x2 + 6.5484 x - 11.599
dx
dy= 0 x = 5.807
y = -0.0065x2 + 0.0912x + 1.9923
R² = 0.9231
2.280
2.285
2.290
2.295
2.300
2.305
2.310
2.315
2.320
4.5 5 5.5 6 6.5 7 7.5
Den
sity
(gr/
cm3)
Binder content (%)
y = -0.8876x2 + 10.314x - 22.078
R² = 0.9354
6.40
6.60
6.80
7.00
7.20
7.40
7.60
7.80
8.00
8.20
4.5 5 5.5 6 6.5 7 7.5
Sta
bil
ity (
KN
)
Binder content (%)
y = -1.2761x + 12.512
R² = 0.9618
2.00
3.00
4.00
5.00
6.00
7.00
8.00
4.5 5 5.5 6 6.5 7 7.5
VT
M (
%)
Binder content (%)
y = -0.0106x2 + 0.1432x + 1.8263
R² = 0.9168
2.270
2.280
2.290
2.300
2.310
2.320
2.330
4.5 5 5.5 6 6.5 7 7.5
Den
sity
(gr/
cm3)
Binder content (%)
y = -0.5638x2 + 6.5484x - 11.599
R² = 0.9453 6.20
6.40
6.60
6.80
7.00
7.20
7.40
7.60
4.5 5 5.5 6 6.5 7 7.5
Sta
bil
ity (
KN
)
Binder content (%)
y = -1.4867x + 14.382
R² = 0.9784
2.00
3.00
4.00
5.00
6.00
7.00
8.00
4.5 5 5.5 6 6.5 7 7.5
VT
M (
%)
Binder content (%)

154
VTM: y = -1.4867 x + 14.382
Y= 4 -1.4867 x + 14.382= 4 x = 6.972
Flow: y = 0.4057 x2 - 4.1139 x + 13.634
OAC of the SMA Mixture containing 80% F-RCA
Property Selected binder content
(%)
Peak of density curve 6.755
Peak of stability curve 5.807
4% air voids, from VTM curve 6.972
OAC 6.5
20% Coarse RCA (SMA)
Density: y = -0.0159 x2 + 0.2039 x + 1.6597
dx
dy= 0 x = 6.412
Stability: y = -0.6462 x2 + 7.5406 x - 14.258
dx
dy= 0 x = 5.835
VTM: y = -1.3853 x + 13.605
Y= 4 y = -1.3853 x + 13.605= 4 x = 6.933
Flow: y = 0.2781 x2 - 2.4265 x + 8.0177
OAC of the SMA Mixture containing 20% C-RCA
Property Selected binder content
(%)
Peak of density curve 6.412
Peak of stability curve 5.835
4% air voids, from VTM curve 6.933
OAC 6.4
40% Coarse RCA (SMA)
y = -0.0159x2 + 0.2039x + 1.6597
R² = 0.9745
2.275
2.280
2.285
2.290
2.295
2.300
2.305
2.310
2.315
4.5 5 5.5 6 6.5 7 7.5
Den
sity
(gr/
cm3)
Binder content (%)
y = -0.6462x2 + 7.5406x - 14.258
R² = 0.9497
6.60
6.80
7.00
7.20
7.40
7.60
7.80
4.5 5 5.5 6 6.5 7 7.5
Sta
bil
ity (
KN
)
Binder content (%)
y = -1.3853x + 13.605
R² = 0.9759
2.00
3.00
4.00
5.00
6.00
7.00
8.00
4.5 5 5.5 6 6.5 7 7.5
VT
M (
%)
Binder content (%)
y = -0.0129x2 + 0.1825x + 1.6583
R² = 0.9748 2.260
2.270
2.280
2.290
2.300
2.310
2.320
5 5.5 6 6.5 7 7.5 8
Den
sity
(gr/
cm3)
Binder content (%)
y = -0.7962x2 + 10.65x - 28.317
R² = 0.969
6.00
6.20
6.40
6.60
6.80
7.00
7.20
7.40
5 5.5 6 6.5 7 7.5 8
Sta
bil
ity (
KN
)
Binder content (%)
y = -1.3233x + 13.492
R² = 0.9766
2.00
3.00
4.00
5.00
6.00
7.00
5 5.5 6 6.5 7 7.5 8
VT
M (
%)
Binder content (%)

155
Density: y = -0.0129 x2 + 0.1825 x + 1.6583
dx
dy= 0 x = 7.073
Stability: y = -0.7962 x2 + 10.65 x - 28.317
dx
dy= 0 x = 6.690
VTM: y = -1.3233 x + 13.492
Y= 4 -1.3233 x + 13.492 = 4 x = 7.173
Flow: y = 0.379 x2 - 3.9863 x + 13.463
OAC of the SMA Mixture containing 40% C-RCA
Property Selected binder content
(%)
Peak of density curve 7.073
Peak of stability curve 6.690
4% air voids, from VTM curve 7.173
OAC 7
60% Coarse RCA (SMA)
Density: y = -0.0114 x2 + 0.1818 x + 1.5693
dx
dy= 0 x = 7.974
Stability: y = -0.36 x2 + 5.584 x – 15.207
dx
dy= 0 x = 7.760
VTM: y = -1.7713 x + 18.337
Y= 4 y = -1.7713 x + 18.337= 4 x = 8.090
Flow: y = 0.219 x2 - 2.2404 x + 9.1779
OAC of the SMA Mixture containing 60% C-RCA
Property Selected binder content
(%)
Peak of density curve 7.974
Peak of stability curve 7.760
4% air voids, from VTM curve 8.090
OAC 7.9
y = -0.0114x2 + 0.1818x + 1.5693
R² = 0.9651
2.260
2.265
2.270
2.275
2.280
2.285
2.290
2.295
6 6.5 7 7.5 8 8.5 9
Den
sity
(gr/
cm3)
Binder content (%)
y = -0.36x2 + 5.584x - 15.207
R² = 0.9181
5.60
5.80
6.00
6.20
6.40
6.60
6.80
6 6.5 7 7.5 8 8.5 9
Sta
bil
ity (
KN
)
Binder content (%)
y = -1.7713x + 18.337
R² = 0.9896
2.00
3.00
4.00
5.00
6.00
7.00
8.00
6 6.5 7 7.5 8 8.5 9
VT
M (
%)
Binder content (%)

156
80% Coarse RCA (SMA)
Density: y = -0.0135 x2 + 0.2344 x + 1.2673
dx
dy= 0 x = 8.681
Stability: y = -0.3429 x2 + 6.1072 x - 20.797
dx
dy= 0 x = 8.905
VTM: y = -1.3907x + 16.861
Y= 4 y = -1.3907x + 16.861= 4 x = 9.248
Flow: y = 0.1933 x2 - 2.1367 x + 9.8667
OAC of the SMA Mixture containing 80% C-RCA
Property Selected binder content
(%)
Peak of density curve 8.681
Peak of stability curve 8.905
4% air voids, from VTM curve 9.248
OAC 8.9
20% Mix RCA (SMA)
Density: y = -0.0097x2 + 0.1306x + 1.8744
dx
dy= 0 x = 6.732
Stability: y = -0.6229 x2 + 7.1623 x - 12.833
dx
dy= 0 x = 5.692
VTM: y = -1.484 x + 13.925
y = -0.0135x2 + 0.2344x + 1.2673
R² = 0.8995
2.250
2.260
2.270
2.280
2.290
2.300
7 7.5 8 8.5 9 9.5 10
Den
sity
(gr/
cm3)
Binder content (%)
y = -0.3429x2 + 6.1072x - 20.797
R² = 0.9723
5.60
5.80
6.00
6.20
6.40
6.60
7 7.5 8 8.5 9 9.5 10
Sta
bil
ity (
KN
)
Binder content (%)
y = -1.3907x + 16.861
R² = 0.9834
3.00
4.00
5.00
6.00
7.00
7 7.5 8 8.5 9 9.5 10
VT
M (
%)
Binder content (%)
y = -0.0097x2 + 0.1306x + 1.8744
R² = 0.9844
2.270
2.280
2.290
2.300
2.310
2.320
2.330
4.5 5 5.5 6 6.5 7 7.5
Den
sity
(gr/
cm3)
Binder content 9%)
y = -0.6229x2 + 7.1623x - 12.833
R² = 0.9476
6.60
6.80
7.00
7.20
7.40
7.60
7.80
8.00
4.5 5 5.5 6 6.5 7 7.5
Den
sity
(K
N)
Binder content (%)
y = -1.484x + 13.925
R² = 0.9847 2.00
3.00
4.00
5.00
6.00
7.00
4.5 5 5.5 6 6.5 7 7.5
VT
M (
%)
Binder content (%)

157
Y= 4 -1.484 x + 13.925 = 4 x = 6.688
Flow: y = 0.2886 x2 - 2.5435 x + 8.287
OAC of the SMA Mixture containing 20% M-RCA
Property Selected binder content
(%)
Peak of density curve 6.732
Peak of stability curve 5.692
4% air voids, from VTM curve 6.688
OAC 6.4
40% Mix RCA (SMA)
Density: y = -0.0111 x2 + 0.1491 x + 1.811
dx
dy= 0 x = 6.716
Stability: y = -0.3905 x2 + 4.767 x - 6.9266
dx
dy= 0 x = 6.104
VTM: y = -1.26 x + 12.723
Y= 4 -1.26 x + 12.723= 4 x = 6.923
Flow: y = 0.3295 x2 - 2.9836 x + 9.5668
OAC of the SMA Mixture containing 40% M-RCA
Property Selected binder content
(%)
Peak of density curve 6.716
Peak of stability curve 6.104
4% air voids, from VTM curve 6.923
OAC 6.6
60% Mix RCA (SMA)
y = -0.0111x2 + 0.1491x + 1.811
R² = 0.977
2.270
2.280
2.290
2.300
2.310
2.320
2.330
4.5 5 5.5 6 6.5 7 7.5
Den
sity
(gr/
cm3)
Binder content (%)
y = -0.3905x2 + 4.767x - 6.9266
R² = 0.7774
6.80
7.00
7.20
7.40
7.60
7.80
8.00
4.5 5 5.5 6 6.5 7 7.5
Sta
bil
ity (
KN
)
Binder content (%)
y = -1.26x + 12.723
R² = 0.9759
2.00
3.00
4.00
5.00
6.00
7.00
4.5 5 5.5 6 6.5 7 7.5
VT
M (
%)
Binder content (%)
y = -0.01x2 + 0.1479x + 1.7594
R² = 0.9793
2.260
2.270
2.280
2.290
2.300
2.310
2.320
5 5.5 6 6.5 7 7.5 8
Den
sity
(gr/
cm3)
Binder content (%)
y = -0.5819x2 + 7.3454x - 15.906
R² = 0.7329
6.20
6.40
6.60
6.80
7.00
7.20
7.40
7.60
5 5.5 6 6.5 7 7.5 8
Sta
bil
ity (
KN
)
Binder content (%)
y = -1.3587x + 13.917
R² = 0.9614
2.00
3.00
4.00
5.00
6.00
7.00
5 5.5 6 6.5 7 7.5 8
VT
M (
%)
Binder content (%)

158
Density: y = -0.01 x2 + 0.1479 x + 1.7594
dx
dy= 0 x = 7.395
Stability: y = -0.5819 x2 + 7.3454 x - 15.906
dx
dy= 0 x = 6.312
VTM: y = -1.3587 x + 13.917
Y= 4 -1.3587 x + 13.917 = 4 x = 7.299
Flow: y = 0.3714 x2 - 3.7646 x + 13.122
OAC of the SMA Mixture containing 60% M-RCA
Property Selected binder content
(%)
Peak of density curve 7.395
Peak of stability curve 6.312
4% air voids, from VTM curve 7.299
OAC 7
80% Mix RCA (SMA)
Density: y = -0.0122 x2 + 0.1974 x + 1.4991
dx
dy= 0 x = 8.09
Stability: y = -0.6476 x2 + 9.449 x - 27.589
dx
dy= 0 x = 7.295
VTM: y = -1.4447 x + 15.794
Y= 4 -1.4447 x + 15.794 = 4 x = 8.164
Flow: y = 0.0752 x2 + 0.0868 x + 0.5915
OAC of the SMA Mixture with 80% M-RCA
Property Selected binder content
(%)
Peak of density curve 8.090
Peak of stability curve 7.295
4% air voids, from VTM curve 8.164
OAC 7.8
y = -0.0122x2 + 0.1974x + 1.4991
R² = 0.9153
2.260
2.270
2.280
2.290
2.300
2.310
2.320
6 6.5 7 7.5 8 8.5 9
Den
sity
(gr/
cm3)
Binder content (%)
y = -0.6476x2 + 9.449x - 27.589
R² = 0.9884
5.80
6.00
6.20
6.40
6.60
6.80
7.00
6 6.5 7 7.5 8 8.5 9
Sta
bil
ity (
KN
)
Binder content (%)
y = -1.4447x + 15.794
R² = 0.9702
2.00
3.00
4.00
5.00
6.00
7.00
6 6.5 7 7.5 8 8.5 9
VT
M (
%)
Binder content (%)

159
APPENDIX C
Marshall Stability correlation ratio (ASTM D1559-82)
Volume of sample (cm3) Approximate thickness of sample (mm) Correction ratio
200-213 25.4 5.56
214-225 27.0 5.00
226-237 28.6 4.55
238-250 30.2 4.17
251-264 31.8 3.85
265-276 33.3 3.57
277-289 34.9 3.33
290-301 36.5 3.03
302-316 38.1 2.78
317-328 39.07 2.50
329-340 41.3 2.27
341-353 42.9 2.08
354-367 44.04 1.92
368-379 46.0 1.79
380-392 47.6 1.67
393-405 49.2 1.56
406-420 50.8 1.47
420-431 52.4 1.39
432-443 54.0 1.32
444-456 55.6 1.25
457-470 57.2 1.19
471-482 58.7 1.14
483-495 60.3 1.09
496-508 61.9 1.04
509-522 63.5 1.00
523-535 65.1 0.96
536-546 66.7 0.93
547-559 68.3 0.89
560-573 69.8 0.86
574-585 71.4 0.83
586-598 73.0 0.81
599-610 74.6 0.79
611-625 76.2 0.76

160
APPENDIX D
Flexural beam fatigue test of HMA specimens
VA
Cycles Stress
(kPa)
Micro
Strain
Stiffness
(MPa)
Modulus
(MPa)
Phase
Angle
(Deg)
Energy
(kPa)
50 3.31E+03 5.11E+02 6.49E+03 5.38E+03 3.24E+01 1.09E+00
500 3.17E+03 5.06E+02 6.26E+03 5.11E+03 3.68E+01 1.07E+00
1000 3.06E+03 4.98E+02 6.15E+03 5.00E+03 3.65E+01 1.07E+00
2000 2.98E+03 5.00E+02 5.95E+03 4.82E+03 3.47E+01 1.05E+00
3000 2.90E+03 5.03E+02 5.77E+03 4.71E+03 3.47E+01 1.04E+00
4000 2.86E+03 5.02E+02 5.69E+03 4.69E+03 3.47E+01 1.03E+00
5000 2.79E+03 5.00E+02 5.58E+03 4.51E+03 3.47E+01 1.03E+00
6000 2.72E+03 4.95E+02 5.49E+03 4.40E+03 3.48E+01 1.01E+00
7000 2.66E+03 4.99E+02 5.32E+03 4.37E+03 3.48E+01 1.01E+00
8000 2.57E+03 5.02E+02 5.12E+03 4.30E+03 3.49E+01 1.01E+00
9000 2.50E+03 5.03E+02 4.98E+03 4.20E+03 3.48E+01 1.00E+00
10000 2.46E+03 4.93E+02 4.98E+03 4.13E+03 3.69E+01 9.90E-01
20000 2.33E+03 5.03E+02 4.64E+03 4.08E+03 3.50E+01 9.70E-01
30000 2.27E+03 5.02E+02 4.51E+03 4.01E+03 3.50E+01 9.70E-01
40000 2.19E+03 5.02E+02 4.36E+03 3.97E+03 3.50E+01 9.50E-01
50000 2.12E+03 5.02E+02 4.23E+03 3.90E+03 3.51E+01 9.50E-01
60000 2.07E+03 5.03E+02 4.11E+03 3.86E+03 3.50E+01 9.30E-01
70000 2.01E+03 5.01E+02 4.01E+03 3.81E+03 3.50E+01 9.30E-01
80000 1.97E+03 4.97E+02 3.97E+03 3.76E+03 3.51E+01 9.10E-01
90000 1.92E+03 4.98E+02 3.86E+03 3.72E+03 3.51E+01 9.10E-01
100000 1.85E+03 4.98E+02 3.70E+03 3.68E+03 3.51E+01 9.00E-01
110000 1.79E+03 4.99E+02 3.58E+03 3.61E+03 3.52E+01 9.00E-01
120000 1.71E+03 5.00E+02 3.42E+03 3.55E+03 3.52E+01 8.80E-01
130000 1.64E+03 5.00E+02 3.29E+03 3.50E+03 3.51E+01 8.60E-01
134985 1.62E+03 4.99E+02 3.24E+03 3.47E+03 3.52E+01 8.50E-01
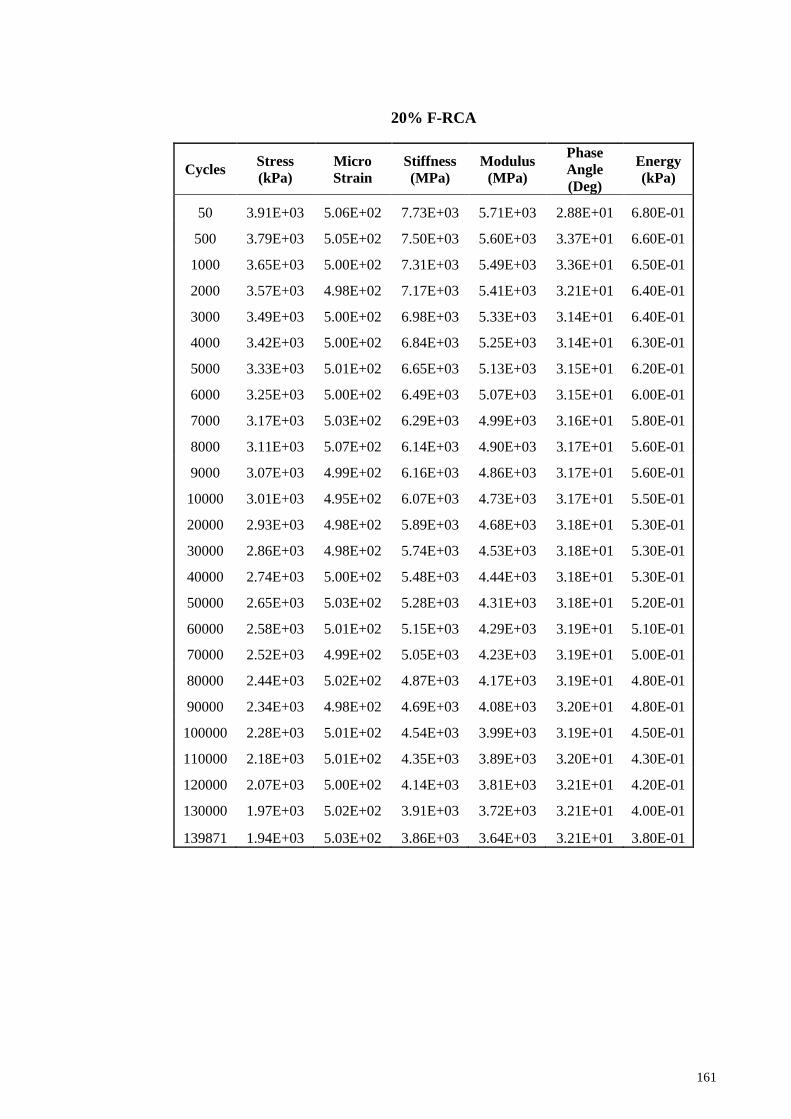
161
20% F-RCA
Cycles Stress
(kPa)
Micro
Strain
Stiffness
(MPa)
Modulus
(MPa)
Phase
Angle
(Deg)
Energy
(kPa)
50 3.91E+03 5.06E+02 7.73E+03 5.71E+03 2.88E+01 6.80E-01
500 3.79E+03 5.05E+02 7.50E+03 5.60E+03 3.37E+01 6.60E-01
1000 3.65E+03 5.00E+02 7.31E+03 5.49E+03 3.36E+01 6.50E-01
2000 3.57E+03 4.98E+02 7.17E+03 5.41E+03 3.21E+01 6.40E-01
3000 3.49E+03 5.00E+02 6.98E+03 5.33E+03 3.14E+01 6.40E-01
4000 3.42E+03 5.00E+02 6.84E+03 5.25E+03 3.14E+01 6.30E-01
5000 3.33E+03 5.01E+02 6.65E+03 5.13E+03 3.15E+01 6.20E-01
6000 3.25E+03 5.00E+02 6.49E+03 5.07E+03 3.15E+01 6.00E-01
7000 3.17E+03 5.03E+02 6.29E+03 4.99E+03 3.16E+01 5.80E-01
8000 3.11E+03 5.07E+02 6.14E+03 4.90E+03 3.17E+01 5.60E-01
9000 3.07E+03 4.99E+02 6.16E+03 4.86E+03 3.17E+01 5.60E-01
10000 3.01E+03 4.95E+02 6.07E+03 4.73E+03 3.17E+01 5.50E-01
20000 2.93E+03 4.98E+02 5.89E+03 4.68E+03 3.18E+01 5.30E-01
30000 2.86E+03 4.98E+02 5.74E+03 4.53E+03 3.18E+01 5.30E-01
40000 2.74E+03 5.00E+02 5.48E+03 4.44E+03 3.18E+01 5.30E-01
50000 2.65E+03 5.03E+02 5.28E+03 4.31E+03 3.18E+01 5.20E-01
60000 2.58E+03 5.01E+02 5.15E+03 4.29E+03 3.19E+01 5.10E-01
70000 2.52E+03 4.99E+02 5.05E+03 4.23E+03 3.19E+01 5.00E-01
80000 2.44E+03 5.02E+02 4.87E+03 4.17E+03 3.19E+01 4.80E-01
90000 2.34E+03 4.98E+02 4.69E+03 4.08E+03 3.20E+01 4.80E-01
100000 2.28E+03 5.01E+02 4.54E+03 3.99E+03 3.19E+01 4.50E-01
110000 2.18E+03 5.01E+02 4.35E+03 3.89E+03 3.20E+01 4.30E-01
120000 2.07E+03 5.00E+02 4.14E+03 3.81E+03 3.21E+01 4.20E-01
130000 1.97E+03 5.02E+02 3.91E+03 3.72E+03 3.21E+01 4.00E-01
139871 1.94E+03 5.03E+02 3.86E+03 3.64E+03 3.21E+01 3.80E-01

162
40% F-RCA
Cycles Stress
(kPa)
Micro
Strain
Stiffness
(MPa)
Modulus
(MPa)
Phase
Angle
(Deg)
Energy
(kPa)
50 4.30E+03 5.05E+02 8.52E+03 5.94E+03 2.72E+01 1.63E+00
500 4.22E+03 5.05E+02 8.36E+03 5.86E+03 3.16E+01 1.58E+00
1000 4.19E+03 5.00E+02 8.37E+03 5.80E+03 3.20E+01 1.58E+00
2000 4.13E+03 4.98E+02 8.29E+03 5.79E+03 3.12E+01 1.57E+00
3000 4.04E+03 4.99E+02 8.11E+03 5.72E+03 3.00E+01 1.55E+00
4000 3.98E+03 5.01E+02 7.94E+03 5.64E+03 3.00E+01 1.55E+00
5000 3.89E+03 4.99E+02 7.80E+03 5.40E+03 3.01E+01 1.52E+00
6000 3.85E+03 5.02E+02 7.67E+03 5.35E+03 3.00E+01 1.52E+00
7000 3.77E+03 5.01E+02 7.53E+03 5.28E+03 2.99E+01 1.50E+00
8000 3.70E+03 4.97E+02 7.44E+03 5.21E+03 2.98E+01 1.49E+00
9000 3.63E+03 4.98E+02 7.28E+03 5.17E+03 2.99E+01 1.47E+00
10000 3.56E+03 5.00E+02 7.11E+03 5.11E+03 2.98E+01 1.46E+00
20000 3.45E+03 4.98E+02 6.93E+03 5.05E+03 2.99E+01 1.45E+00
30000 3.34E+03 5.03E+02 6.64E+03 4.92E+03 2.97E+01 1.42E+00
40000 3.24E+03 5.03E+02 6.45E+03 4.80E+03 2.97E+01 1.42E+00
50000 3.12E+03 5.03E+02 6.20E+03 4.73E+03 2.97E+01 1.39E+00
60000 3.04E+03 5.03E+02 6.04E+03 4.59E+03 2.98E+01 1.37E+00
70000 2.93E+03 5.00E+02 5.87E+03 4.46E+03 2.98E+01 1.35E+00
80000 2.79E+03 4.98E+02 5.61E+03 4.37E+03 3.00E+01 1.32E+00
90000 2.71E+03 4.99E+02 5.43E+03 4.31E+03 3.00E+01 1.30E+00
100000 2.62E+03 4.99E+02 5.25E+03 4.25E+03 3.02E+01 1.27E+00
110000 2.47E+03 4.99E+02 4.95E+03 4.18E+03 3.03E+01 1.26E+00
120000 2.39E+03 5.03E+02 4.75E+03 4.04E+03 3.02E+01 1.24E+00
130000 2.33E+03 5.02E+02 4.64E+03 3.96E+03 3.03E+01 1.21E+00
140000 2.21E+03 5.03E+02 4.38E+03 3.83E+03 3.03E+01 1.19E+00
149898 2.14E+03 5.02E+02 4.26E+03 3.77E+03 3.04E+01 1.18E+00

163
60% F-RCA
Cycles Stress
(kPa)
Micro
Strain
Stiffness
(MPa)
Modulus
(MPa)
Phase
Angle
(Deg)
Energy
(kPa)
50 3.36E+03 5.05E+02 6.65E+03 5.28E+03 3.05E+01 1.18E+00
500 3.15E+03 5.06E+02 6.22E+03 5.04E+03 3.44E+01 1.15E+00
1000 3.07E+03 5.03E+02 6.11E+03 4.99E+03 3.46E+01 1.13E+00
2000 2.97E+03 4.99E+02 5.94E+03 4.90E+03 3.27E+01 1.13E+00
3000 2.88E+03 5.02E+02 5.74E+03 4.86E+03 3.27E+01 1.11E+00
4000 2.84E+03 5.02E+02 5.65E+03 4.74E+03 3.29E+01 1.10E+00
5000 2.77E+03 5.02E+02 5.52E+03 4.63E+03 3.28E+01 1.09E+00
6000 2.72E+03 5.00E+02 5.44E+03 4.50E+03 3.29E+01 1.08E+00
7000 2.66E+03 4.97E+02 5.35E+03 4.40E+03 3.29E+01 1.06E+00
8000 2.59E+03 4.98E+02 5.20E+03 4.35E+03 3.29E+01 1.05E+00
9000 2.54E+03 4.97E+02 5.11E+03 4.20E+03 3.30E+01 1.05E+00
10000 2.50E+03 5.00E+02 4.99E+03 4.07E+03 3.29E+01 1.04E+00
20000 2.34E+03 5.00E+02 4.69E+03 3.95E+03 3.30E+01 1.03E+00
30000 2.29E+03 5.01E+02 4.56E+03 3.88E+03 3.30E+01 1.01E+00
40000 2.22E+03 5.00E+02 4.44E+03 3.80E+03 3.30E+01 9.90E-01
50000 2.18E+03 5.03E+02 4.33E+03 3.72E+03 3.31E+01 9.70E-01
60000 2.14E+03 5.00E+02 4.28E+03 3.66E+03 3.31E+01 9.60E-01
70000 2.08E+03 4.96E+02 4.20E+03 3.63E+03 3.32E+01 9.50E-01
80000 2.02E+03 4.97E+02 4.07E+03 3.58E+03 3.32E+01 9.10E-01
90000 1.97E+03 4.98E+02 3.95E+03 3.50E+03 3.32E+01 8.90E-01
100000 1.91E+03 5.00E+02 3.82E+03 3.49E+03 3.32E+01 8.80E-01
110000 1.86E+03 5.01E+02 3.70E+03 3.45E+03 3.32E+01 8.60E-01
120000 1.79E+03 5.03E+02 3.56E+03 3.41E+03 3.33E+01 8.50E-01
130000 1.74E+03 5.00E+02 3.47E+03 3.38E+03 3.33E+01 8.20E-01
136234 1.67E+03 5.03E+02 3.32E+03 3.29E+03 3.33E+01 8.30E-01

164
80% F-RCA
Cycles Stress
(kPa)
Micro
Strain
Stiffness
(MPa)
Modulus
(MPa)
Phase
Angle
(Deg)
Energy
(kPa)
50 2.36E+03 5.09E+02 4.64E+03 4.16E+03 3.34E+01 5.10E-01
500 2.31E+03 5.08E+02 4.54E+03 3.99E+03 3.75E+01 4.90E-01
1000 2.25E+03 5.05E+02 4.46E+03 3.90E+03 3.74E+01 4.80E-01
2000 2.20E+03 4.99E+02 4.40E+03 3.87E+03 3.62E+01 4.60E-01
3000 2.15E+03 5.03E+02 4.28E+03 3.79E+03 3.57E+01 4.60E-01
4000 2.10E+03 5.04E+02 4.17E+03 3.69E+03 3.57E+01 4.40E-01
5000 2.07E+03 5.04E+02 4.10E+03 3.63E+03 3.57E+01 4.30E-01
6000 2.02E+03 5.03E+02 4.02E+03 3.55E+03 3.58E+01 4.20E-01
7000 1.99E+03 5.00E+02 3.98E+03 3.48E+03 3.59E+01 4.00E-01
8000 1.94E+03 5.03E+02 3.86E+03 3.41E+03 3.58E+01 3.90E-01
9000 1.88E+03 5.02E+02 3.74E+03 3.37E+03 3.59E+01 3.70E-01
10000 1.84E+03 4.97E+02 3.70E+03 3.34E+03 3.59E+01 3.70E-01
20000 1.80E+03 5.00E+02 3.60E+03 3.26E+03 3.60E+01 3.50E-01
30000 1.74E+03 4.95E+02 3.52E+03 3.18E+03 3.60E+01 3.30E-01
40000 1.66E+03 4.97E+02 3.33E+03 3.12E+03 3.62E+01 3.20E-01
50000 1.57E+03 4.99E+02 3.15E+03 3.05E+03 3.62E+01 3.00E-01
60000 1.49E+03 5.03E+02 2.95E+03 2.93E+03 3.62E+01 2.70E-01
70000 1.44E+03 5.03E+02 2.86E+03 2.90E+03 3.63E+01 2.60E-01
80000 1.36E+03 5.02E+02 2.70E+03 2.85E+03 3.63E+01 2.50E-01
90000 1.30E+03 5.01E+02 2.59E+03 2.81E+03 3.64E+01 2.40E-01
100000 1.24E+03 5.02E+02 2.47E+03 2.78E+03 3.63E+01 2.20E-01
109873 1.17E+03 5.03E+02 2.32E+03 2.74E+03 3.63E+01 2.00E-01

165
20% C-RCA
Cycles Stress
(kPa)
Micro
Strain
Stiffness
(MPa)
Modulus
(MPa)
Phase
Angle
(Deg)
Energy
(kPa)
50 3.62E+03 5.09E+02 7.12E+03 5.56E+03 2.59E+01 7.60E-01
500 3.46E+03 5.08E+02 6.81E+03 5.44E+03 2.85E+01 7.40E-01
1000 3.40E+03 5.05E+02 6.74E+03 5.35E+03 2.91E+01 7.40E-01
2000 3.37E+03 5.01E+02 6.72E+03 5.24E+03 2.82E+01 7.20E-01
3000 3.33E+03 5.00E+02 6.66E+03 5.16E+03 2.76E+01 7.10E-01
4000 3.29E+03 5.00E+02 6.58E+03 4.90E+03 2.76E+01 7.00E-01
5000 3.25E+03 5.01E+02 6.50E+03 4.84E+03 2.74E+01 6.90E-01
6000 3.18E+03 5.02E+02 6.33E+03 4.76E+03 2.74E+01 6.70E-01
7000 3.09E+03 4.97E+02 6.22E+03 4.69E+03 2.75E+01 6.60E-01
8000 3.01E+03 4.96E+02 6.07E+03 4.61E+03 2.75E+01 6.40E-01
9000 2.96E+03 4.99E+02 5.94E+03 4.57E+03 2.75E+01 6.20E-01
10000 2.86E+03 5.00E+02 5.71E+03 4.41E+03 2.76E+01 6.00E-01
20000 2.74E+03 5.02E+02 5.46E+03 4.35E+03 2.76E+01 6.00E-01
30000 2.66E+03 4.98E+02 5.33E+03 4.26E+03 2.78E+01 5.80E-01
40000 2.57E+03 5.04E+02 5.10E+03 4.15E+03 2.77E+01 5.70E-01
50000 2.52E+03 5.02E+02 5.02E+03 4.07E+03 2.78E+01 5.50E-01
60000 2.47E+03 4.98E+02 4.97E+03 3.99E+03 2.77E+01 5.30E-01
70000 2.44E+03 4.99E+02 4.89E+03 3.90E+03 2.77E+01 5.20E-01
80000 2.35E+03 5.03E+02 4.68E+03 3.82E+03 2.78E+01 5.10E-01
90000 2.29E+03 5.03E+02 4.54E+03 3.76E+03 2.78E+01 4.80E-01
100000 2.23E+03 5.02E+02 4.44E+03 3.67E+03 2.80E+01 4.50E-01
110000 2.16E+03 5.03E+02 4.29E+03 3.60E+03 2.78E+01 4.40E-01
120000 2.07E+03 5.00E+02 4.13E+03 3.49E+03 2.79E+01 4.30E-01
130000 1.94E+03 5.01E+02 3.88E+03 3.40E+03 2.80E+01 4.10E-01
140000 1.88E+03 5.00E+02 3.76E+03 3.32E+03 2.80E+01 3.80E-01
152723 1.78E+03 4.99E+02 3.56E+03 3.23E+03 2.82E+01 3.50E-01

166
40% C-RCA
Cycles Stress
(kPa)
Micro
Strain
Stiffness
(MPa)
Modulus
(MPa)
Phase
Angle
(Deg)
Energy
(kPa)
50 4.03E+03 5.04E+02 8.00E+03 5.79E+03 2.44E+01 1.56E+00
500 3.87E+03 5.06E+02 7.66E+03 5.66E+03 2.72E+01 1.52E+00
1000 3.81E+03 5.05E+02 7.55E+03 5.51E+03 2.75E+01 1.52E+00
2000 3.78E+03 5.00E+02 7.56E+03 5.46E+03 2.53E+01 1.52E+00
3000 3.73E+03 4.99E+02 7.47E+03 5.36E+03 2.50E+01 1.50E+00
4000 3.67E+03 4.99E+02 7.36E+03 5.22E+03 2.52E+01 1.50E+00
5000 3.64E+03 5.00E+02 7.27E+03 5.17E+03 2.52E+01 1.48E+00
6000 3.59E+03 5.03E+02 7.13E+03 5.03E+03 2.53E+01 1.46E+00
7000 3.55E+03 4.96E+02 7.15E+03 4.97E+03 2.54E+01 1.45E+00
8000 3.51E+03 4.99E+02 7.02E+03 4.90E+03 2.53E+01 1.45E+00
9000 3.46E+03 5.02E+02 6.90E+03 4.76E+03 2.55E+01 1.43E+00
10000 3.41E+03 4.99E+02 6.84E+03 4.69E+03 2.55E+01 1.41E+00
20000 3.30E+03 4.98E+02 6.63E+03 4.60E+03 2.55E+01 1.40E+00
30000 3.25E+03 5.03E+02 6.47E+03 4.55E+03 2.57E+01 1.37E+00
40000 3.16E+03 5.01E+02 6.30E+03 4.47E+03 2.58E+01 1.35E+00
50000 3.03E+03 5.01E+02 6.04E+03 4.35E+03 2.57E+01 1.34E+00
60000 2.94E+03 5.01E+02 5.88E+03 4.26E+03 2.57E+01 1.33E+00
70000 2.85E+03 5.01E+02 5.69E+03 4.12E+03 2.58E+01 1.30E+00
80000 2.77E+03 4.98E+02 5.57E+03 4.08E+03 2.59E+01 1.27E+00
90000 2.64E+03 4.99E+02 5.29E+03 3.99E+03 2.58E+01 1.25E+00
100000 2.54E+03 4.99E+02 5.09E+03 3.93E+03 2.60E+01 1.22E+00
110000 2.43E+03 4.99E+02 4.87E+03 3.86E+03 2.59E+01 1.20E+00
120000 2.33E+03 5.01E+02 4.66E+03 3.81E+03 2.60E+01 1.19E+00
130000 2.25E+03 5.01E+02 4.49E+03 3.68E+03 2.60E+01 1.18E+00
140000 2.14E+03 5.00E+02 4.27E+03 3.59E+03 2.60E+01 1.16E+00
150000 2.07E+03 5.01E+02 4.14E+03 3.51E+03 2.61E+01 1.14E+00
157621 2.01E+03 5.02E+02 4.00E+03 3.42E+03 2.61E+01 1.13E+00

167
60% C-RCA
Cycles Stress
(kPa)
Micro
Strain
Stiffness
(MPa)
Modulus
(MPa)
Phase
Angle
(Deg)
Energy
(kPa)
50 4.29E+03 5.08E+02 8.45E+03 5.89E+03 2.50E+01 1.47E+00
500 4.23E+03 5.05E+02 8.37E+03 5.81E+03 2.78E+01 1.43E+00
1000 4.15E+03 5.00E+02 8.29E+03 5.77E+03 2.80E+01 1.41E+00
2000 4.01E+03 5.00E+02 8.03E+03 5.64E+03 2.65E+01 1.40E+00
3000 3.92E+03 4.99E+02 7.86E+03 5.54E+03 2.64E+01 1.40E+00
4000 3.83E+03 4.98E+02 7.70E+03 5.45E+03 2.65E+01 1.38E+00
5000 3.74E+03 4.96E+02 7.55E+03 5.38E+03 2.65E+01 1.38E+00
6000 3.71E+03 5.00E+02 7.43E+03 5.26E+03 2.67E+01 1.36E+00
7000 3.62E+03 5.00E+02 7.24E+03 5.13E+03 2.66E+01 1.35E+00
8000 3.53E+03 4.98E+02 7.09E+03 5.07E+03 2.67E+01 1.34E+00
9000 3.49E+03 5.03E+02 6.93E+03 5.00E+03 2.67E+01 1.34E+00
10000 3.41E+03 5.02E+02 6.79E+03 4.93E+03 2.69E+01 1.31E+00
20000 3.36E+03 5.05E+02 6.66E+03 4.88E+03 2.69E+01 1.31E+00
30000 3.28E+03 4.98E+02 6.58E+03 4.83E+03 2.67E+01 1.28E+00
40000 3.21E+03 5.00E+02 6.43E+03 4.79E+03 2.69E+01 1.27E+00
50000 3.14E+03 4.99E+02 6.30E+03 4.69E+03 2.69E+01 1.25E+00
60000 3.02E+03 5.01E+02 6.02E+03 4.51E+03 2.68E+01 1.23E+00
70000 2.95E+03 5.01E+02 5.89E+03 4.46E+03 2.68E+01 1.20E+00
80000 2.88E+03 5.01E+02 5.76E+03 4.36E+03 2.69E+01 1.18E+00
90000 2.80E+03 5.01E+02 5.59E+03 4.24E+03 2.70E+01 1.18E+00
100000 2.68E+03 5.01E+02 5.35E+03 4.18E+03 2.70E+01 1.17E+00
110000 2.58E+03 4.97E+02 5.18E+03 4.10E+03 2.72E+01 1.15E+00
120000 2.49E+03 4.99E+02 4.98E+03 4.01E+03 2.71E+01 1.13E+00
130000 2.35E+03 4.98E+02 4.72E+03 3.93E+03 2.72E+01 1.10E+00
140000 2.25E+03 4.98E+02 4.51E+03 3.80E+03 2.73E+01 1.09E+00
153629 2.12E+03 5.02E+02 4.23E+03 3.70E+03 2.73E+01 1.06E+00

168
80% C-RCA
Cycles Stress
(kPa)
Micro
Strain
Stiffness
(MPa)
Modulus
(MPa)
Phase
Angle
(Deg)
Energy
(kPa)
50 3.42E+03 5.09E+02 6.73E+03 5.29E+03 2.53E+01 9.80E-01
500 3.29E+03 5.08E+02 6.48E+03 5.17E+03 2.75E+01 9.50E-01
1000 3.26E+03 5.05E+02 6.46E+03 5.03E+03 2.80E+01 9.40E-01
2000 3.11E+03 5.03E+02 6.18E+03 4.92E+03 2.71E+01 9.30E-01
3000 2.97E+03 4.99E+02 5.95E+03 4.84E+03 2.70E+01 9.30E-01
4000 2.88E+03 5.03E+02 5.72E+03 4.69E+03 2.70E+01 9.20E-01
5000 2.81E+03 5.02E+02 5.59E+03 4.51E+03 2.71E+01 9.00E-01
6000 2.75E+03 5.02E+02 5.48E+03 4.44E+03 2.71E+01 8.80E-01
7000 2.70E+03 5.03E+02 5.36E+03 4.35E+03 2.71E+01 8.70E-01
8000 2.60E+03 4.97E+02 5.23E+03 4.26E+03 2.72E+01 8.60E-01
9000 2.54E+03 4.96E+02 5.13E+03 4.13E+03 2.73E+01 8.50E-01
10000 2.49E+03 4.99E+02 4.98E+03 4.07E+03 2.73E+01 8.40E-01
20000 2.43E+03 5.03E+02 4.82E+03 4.00E+03 2.73E+01 8.20E-01
30000 2.35E+03 4.99E+02 4.71E+03 3.94E+03 2.72E+01 8.00E-01
40000 2.25E+03 5.02E+02 4.47E+03 3.89E+03 2.73E+01 7.80E-01
50000 2.20E+03 5.00E+02 4.40E+03 3.83E+03 2.75E+01 7.60E-01
60000 2.13E+03 5.00E+02 4.26E+03 3.80E+03 2.75E+01 7.40E-01
70000 2.06E+03 5.01E+02 4.12E+03 3.75E+03 2.75E+01 7.20E-01
80000 1.99E+03 5.02E+02 3.97E+03 3.70E+03 2.76E+01 7.00E-01
90000 1.95E+03 5.03E+02 3.88E+03 3.69E+03 2.76E+01 6.90E-01
100000 1.92E+03 5.03E+02 3.82E+03 3.62E+03 2.77E+01 6.80E-01
110000 1.88E+03 5.03E+02 3.74E+03 3.57E+03 2.77E+01 6.60E-01
120000 1.84E+03 4.98E+02 3.69E+03 3.50E+03 2.78E+01 6.30E-01
130000 1.80E+03 5.00E+02 3.59E+03 3.47E+03 2.78E+01 6.20E-01
140000 1.75E+03 5.00E+02 3.51E+03 3.42E+03 2.78E+01 5.90E-01
153376 1.69E+03 5.01E+02 3.36E+03 3.37E+03 2.79E+01 5.60E-01

169
20% M-RCA
Cycles Stress
(kPa)
Micro
Strain
Stiffness
(MPa)
Modulus
(MPa)
Phase
Angle
(Deg)
Energy
(kPa)
50 4.03E+03 5.05E+02 7.99E+03 5.80E+03 2.68E+01 1.29E+00
500 3.73E+03 5.05E+02 7.38E+03 5.68E+03 2.98E+01 1.26E+00
1000 3.69E+03 5.03E+02 7.33E+03 5.49E+03 3.00E+01 1.26E+00
2000 3.59E+03 5.01E+02 7.17E+03 5.40E+03 2.84E+01 1.25E+00
3000 3.53E+03 4.99E+02 7.07E+03 5.35E+03 2.82E+01 1.24E+00
4000 3.45E+03 4.99E+02 6.92E+03 5.25E+03 2.84E+01 1.23E+00
5000 3.39E+03 4.98E+02 6.81E+03 5.15E+03 2.85E+01 1.23E+00
6000 3.31E+03 4.99E+02 6.63E+03 5.07E+03 2.85E+01 1.20E+00
7000 3.23E+03 4.96E+02 6.51E+03 4.96E+03 2.85E+01 1.18E+00
8000 3.16E+03 5.00E+02 6.31E+03 4.82E+03 2.86E+01 1.17E+00
9000 3.10E+03 5.00E+02 6.20E+03 4.79E+03 2.84E+01 1.17E+00
10000 3.02E+03 5.03E+02 6.00E+03 4.72E+03 2.85E+01 1.16E+00
20000 2.88E+03 4.98E+02 5.79E+03 4.67E+03 2.84E+01 1.15E+00
30000 2.81E+03 4.99E+02 5.64E+03 4.60E+03 2.86E+01 1.13E+00
40000 2.74E+03 4.99E+02 5.49E+03 4.53E+03 2.86E+01 1.13E+00
50000 2.69E+03 4.99E+02 5.40E+03 4.46E+03 2.88E+01 1.10E+00
60000 2.64E+03 4.99E+02 5.29E+03 4.38E+03 2.87E+01 1.08E+00
70000 2.58E+03 5.02E+02 5.15E+03 4.23E+03 2.88E+01 1.08E+00
80000 2.52E+03 5.01E+02 5.02E+03 4.14E+03 2.88E+01 1.06E+00
90000 2.47E+03 5.03E+02 4.92E+03 4.10E+03 2.88E+01 1.05E+00
100000 2.39E+03 4.98E+02 4.81E+03 3.99E+03 2.89E+01 1.05E+00
110000 2.31E+03 5.00E+02 4.61E+03 3.90E+03 2.89E+01 1.02E+00
120000 2.24E+03 5.00E+02 4.47E+03 3.86E+03 2.91E+01 9.80E-01
130000 2.17E+03 5.02E+02 4.32E+03 3.79E+03 2.90E+01 9.60E-01
140000 2.13E+03 5.03E+02 4.24E+03 3.70E+03 2.91E+01 9.50E-01
151096 2.00E+03 5.00E+02 3.99E+03 3.63E+03 2.92E+01 9.30E-01

170
40% M-RCA
Cycles Stress
(kPa)
Micro
Strain
Stiffness
(MPa)
Modulus
(MPa)
Phase
Angle
(Deg)
Energy
(kPa)
50 4.06E+03 5.07E+02 8.01E+03 5.78E+03 2.33E+01 1.01E+00
500 3.82E+03 5.04E+02 7.58E+03 5.62E+03 2.58E+01 9.60E-01
1000 3.77E+03 5.04E+02 7.48E+03 5.50E+03 2.65E+01 9.50E-01
2000 3.69E+03 5.03E+02 7.34E+03 5.41E+03 2.52E+01 9.30E-01
3000 3.63E+03 5.00E+02 7.26E+03 5.38E+03 2.52E+01 9.30E-01
4000 3.55E+03 5.00E+02 7.11E+03 5.26E+03 2.51E+01 9.10E-01
5000 3.46E+03 4.98E+02 6.95E+03 5.16E+03 2.52E+01 9.00E-01
6000 3.41E+03 5.00E+02 6.81E+03 5.07E+03 2.50E+01 8.80E-01
7000 3.34E+03 4.96E+02 6.74E+03 4.93E+03 2.50E+01 8.70E-01
8000 3.25E+03 5.01E+02 6.49E+03 4.88E+03 2.52E+01 8.50E-01
9000 3.17E+03 5.00E+02 6.35E+03 4.76E+03 2.51E+01 8.50E-01
10000 3.07E+03 5.02E+02 6.12E+03 4.70E+03 2.51E+01 8.30E-01
20000 3.02E+03 5.00E+02 6.04E+03 4.60E+03 2.50E+01 8.10E-01
30000 2.93E+03 4.99E+02 5.87E+03 4.56E+03 2.52E+01 8.00E-01
40000 2.87E+03 4.99E+02 5.74E+03 4.46E+03 2.52E+01 7.80E-01
50000 2.79E+03 4.99E+02 5.59E+03 4.37E+03 2.54E+01 7.70E-01
60000 2.68E+03 4.97E+02 5.39E+03 4.29E+03 2.53E+01 7.60E-01
70000 2.61E+03 4.98E+02 5.24E+03 4.15E+03 2.52E+01 7.30E-01
80000 2.51E+03 5.00E+02 5.02E+03 4.04E+03 2.53E+01 7.10E-01
90000 2.47E+03 5.01E+02 4.92E+03 3.91E+03 2.53E+01 6.90E-01
100000 2.39E+03 5.03E+02 4.74E+03 3.89E+03 2.54E+01 6.80E-01
110000 2.30E+03 5.02E+02 4.58E+03 3.79E+03 2.54E+01 6.70E-01
120000 2.24E+03 5.00E+02 4.48E+03 3.71E+03 2.54E+01 6.40E-01
130000 2.18E+03 4.97E+02 4.39E+03 3.68E+03 2.55E+01 6.10E-01
140000 2.14E+03 4.96E+02 4.32E+03 3.59E+03 2.56E+01 6.00E-01
150000 2.06E+03 4.99E+02 4.13E+03 3.50E+03 2.56E+01 5.90E-01
159260 2.00E+03 5.00E+02 4.00E+03 3.49E+03 2.57E+01 5.70E-01

171
60% M-RCA
Cycles Stress
(kPa)
Micro
Strain
Stiffness
(MPa)
Modulus
(MPa)
Phase
Angle
(Deg)
Energy
(kPa)
50 3.64E+03 5.11E+02 7.13E+03 5.60E+03 3.00E+01 1.16E+00
500 3.51E+03 5.08E+02 6.91E+03 5.49E+03 3.42E+01 1.13E+00
1000 3.43E+03 5.03E+02 6.82E+03 5.37E+03 3.43E+01 1.13E+00
2000 3.36E+03 5.00E+02 6.72E+03 5.26E+03 3.24E+01 1.11E+00
3000 3.27E+03 4.99E+02 6.56E+03 5.13E+03 3.15E+01 1.10E+00
4000 3.22E+03 4.97E+02 6.47E+03 5.08E+03 3.15E+01 1.09E+00
5000 3.13E+03 5.00E+02 6.26E+03 4.99E+03 3.14E+01 1.08E+00
6000 3.06E+03 5.02E+02 6.09E+03 4.91E+03 3.15E+01 1.06E+00
7000 3.00E+03 4.98E+02 6.02E+03 4.85E+03 3.15E+01 1.06E+00
8000 2.90E+03 4.99E+02 5.82E+03 4.76E+03 3.15E+01 1.04E+00
9000 2.84E+03 5.02E+02 5.65E+03 4.64E+03 3.16E+01 1.04E+00
10000 2.76E+03 5.00E+02 5.53E+03 4.54E+03 3.16E+01 1.02E+00
20000 2.68E+03 5.01E+02 5.34E+03 4.45E+03 3.16E+01 1.01E+00
30000 2.60E+03 5.00E+02 5.20E+03 4.36E+03 3.17E+01 9.98E-01
40000 2.52E+03 5.01E+02 5.04E+03 4.27E+03 3.18E+01 9.89E-01
50000 2.45E+03 5.03E+02 4.86E+03 4.18E+03 3.19E+01 9.80E-01
60000 2.37E+03 4.97E+02 4.77E+03 4.08E+03 3.18E+01 9.70E-01
70000 2.29E+03 4.98E+02 4.60E+03 3.99E+03 3.18E+01 9.60E-01
80000 2.21E+03 4.98E+02 4.45E+03 3.90E+03 3.19E+01 9.40E-01
90000 2.14E+03 5.00E+02 4.28E+03 3.81E+03 3.19E+01 9.20E-01
100000 2.06E+03 5.04E+02 4.09E+03 3.72E+03 3.19E+01 9.00E-01
110000 1.98E+03 5.03E+02 3.94E+03 3.62E+03 3.20E+01 8.80E-01
120000 1.91E+03 5.04E+02 3.78E+03 3.53E+03 3.20E+01 8.50E-01
130000 1.83E+03 5.00E+02 3.66E+03 3.44E+03 3.22E+01 8.30E-01
138798 1.77E+03 4.97E+02 3.56E+03 3.35E+03 3.21E+01 8.20E-01
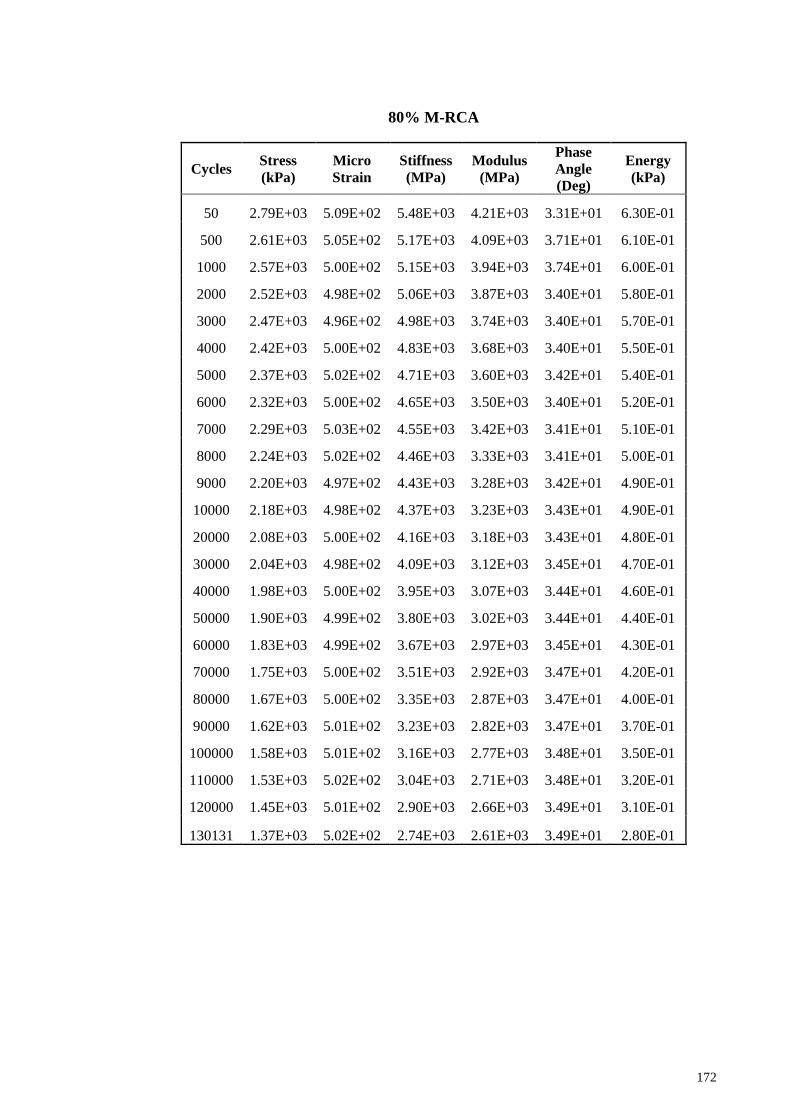
172
80% M-RCA
Cycles Stress
(kPa)
Micro
Strain
Stiffness
(MPa)
Modulus
(MPa)
Phase
Angle
(Deg)
Energy
(kPa)
50 2.79E+03 5.09E+02 5.48E+03 4.21E+03 3.31E+01 6.30E-01
500 2.61E+03 5.05E+02 5.17E+03 4.09E+03 3.71E+01 6.10E-01
1000 2.57E+03 5.00E+02 5.15E+03 3.94E+03 3.74E+01 6.00E-01
2000 2.52E+03 4.98E+02 5.06E+03 3.87E+03 3.40E+01 5.80E-01
3000 2.47E+03 4.96E+02 4.98E+03 3.74E+03 3.40E+01 5.70E-01
4000 2.42E+03 5.00E+02 4.83E+03 3.68E+03 3.40E+01 5.50E-01
5000 2.37E+03 5.02E+02 4.71E+03 3.60E+03 3.42E+01 5.40E-01
6000 2.32E+03 5.00E+02 4.65E+03 3.50E+03 3.40E+01 5.20E-01
7000 2.29E+03 5.03E+02 4.55E+03 3.42E+03 3.41E+01 5.10E-01
8000 2.24E+03 5.02E+02 4.46E+03 3.33E+03 3.41E+01 5.00E-01
9000 2.20E+03 4.97E+02 4.43E+03 3.28E+03 3.42E+01 4.90E-01
10000 2.18E+03 4.98E+02 4.37E+03 3.23E+03 3.43E+01 4.90E-01
20000 2.08E+03 5.00E+02 4.16E+03 3.18E+03 3.43E+01 4.80E-01
30000 2.04E+03 4.98E+02 4.09E+03 3.12E+03 3.45E+01 4.70E-01
40000 1.98E+03 5.00E+02 3.95E+03 3.07E+03 3.44E+01 4.60E-01
50000 1.90E+03 4.99E+02 3.80E+03 3.02E+03 3.44E+01 4.40E-01
60000 1.83E+03 4.99E+02 3.67E+03 2.97E+03 3.45E+01 4.30E-01
70000 1.75E+03 5.00E+02 3.51E+03 2.92E+03 3.47E+01 4.20E-01
80000 1.67E+03 5.00E+02 3.35E+03 2.87E+03 3.47E+01 4.00E-01
90000 1.62E+03 5.01E+02 3.23E+03 2.82E+03 3.47E+01 3.70E-01
100000 1.58E+03 5.01E+02 3.16E+03 2.77E+03 3.48E+01 3.50E-01
110000 1.53E+03 5.02E+02 3.04E+03 2.71E+03 3.48E+01 3.20E-01
120000 1.45E+03 5.01E+02 2.90E+03 2.66E+03 3.49E+01 3.10E-01
130131 1.37E+03 5.02E+02 2.74E+03 2.61E+03 3.49E+01 2.80E-01

173
APPENDIX E
Flexural beam fatigue test of SMA specimens
VA
Cycles Stress
(kPa)
Micro
Strain
Stiffness
(MPa)
Modulus
(MPa)
Phase
Angle
(Deg)
Energy
(kPa)
50 1.57E+03 5.15E+02 3.05E+03 3.00E+03 4.03E+01 5.80E-01
500 1.40E+03 5.03E+02 2.79E+03 2.86E+03 4.53E+01 5.30E-01
1000 1.35E+03 5.01E+02 2.69E+03 2.80E+03 4.54E+01 5.20E-01
2000 1.28E+03 4.99E+02 2.57E+03 2.77E+03 4.31E+01 5.10E-01
3000 1.24E+03 4.99E+02 2.49E+03 2.71E+03 4.51E+01 5.00E-01
4000 1.21E+03 4.99E+02 2.42E+03 2.63E+03 4.46E+01 4.90E-01
5000 1.18E+03 5.01E+02 2.35E+03 2.60E+03 4.52E+01 4.90E-01
6000 1.17E+03 5.02E+02 2.32E+03 2.55E+03 4.45E+01 4.80E-01
7000 1.15E+03 5.00E+02 2.30E+03 2.51E+03 4.50E+01 4.80E-01
8000 1.13E+03 5.00E+02 2.27E+03 2.47E+03 4.47E+01 4.70E-01
9000 1.12E+03 5.00E+02 2.25E+03 2.42E+03 4.44E+01 4.70E-01
10000 1.10E+03 5.01E+02 2.20E+03 2.30E+03 4.54E+01 4.70E-01
20000 1.00E+03 5.02E+02 1.99E+03 2.27E+03 4.44E+01 4.40E-01
30000 9.19E+02 5.02E+02 1.83E+03 2.16E+03 4.38E+01 4.30E-01
40000 8.63E+02 5.02E+02 1.72E+03 2.06E+03 4.26E+01 4.10E-01
50000 8.47E+02 5.03E+02 1.68E+03 1.96E+03 4.26E+01 4.10E-01
60000 8.08E+02 4.99E+02 1.62E+03 1.90E+03 4.33E+01 4.00E-01
70169 7.66E+02 5.03E+02 1.52E+03 1.87E+03 4.37E+01 3.90E-01

174
20% F-RCA
Cycles Stress
(kPa)
Micro
Strain
Stiffness
(MPa)
Modulus
(MPa)
Phase
Angle
(Deg)
Energy
(kPa)
50 2.07E+03 5.08E+02 4.07E+03 3.67E+03 3.45E+01 8.60E-01
500 1.91E+03 5.04E+02 3.79E+03 3.35E+03 3.74E+01 8.20E-01
1000 1.88E+03 5.00E+02 3.76E+03 3.26E+03 3.79E+01 8.00E-01
2000 1.81E+03 5.00E+02 3.62E+03 3.12E+03 3.72E+01 7.40E-01
3000 1.77E+03 4.99E+02 3.55E+03 3.01E+03 3.74E+01 7.10E-01
4000 1.75E+03 5.00E+02 3.50E+03 2.97E+03 3.74E+01 7.00E-01
5000 1.73E+03 4.97E+02 3.48E+03 2.90E+03 3.74E+01 7.00E-01
6000 1.71E+03 5.03E+02 3.40E+03 2.85E+03 3.74E+01 6.70E-01
7000 1.68E+03 5.02E+02 3.35E+03 2.82E+03 3.77E+01 6.60E-01
8000 1.65E+03 5.00E+02 3.30E+03 2.62E+03 3.76E+01 6.60E-01
9000 1.63E+03 4.99E+02 3.27E+03 2.53E+03 3.76E+01 6.50E-01
10000 1.59E+03 4.99E+02 3.19E+03 2.43E+03 3.78E+01 6.50E-01
20000 1.48E+03 4.99E+02 2.97E+03 2.34E+03 3.78E+01 6.40E-01
30000 1.43E+03 4.97E+02 2.87E+03 2.24E+03 3.77E+01 6.40E-01
40000 1.34E+03 4.98E+02 2.69E+03 2.14E+03 3.79E+01 6.30E-01
50000 1.28E+03 5.00E+02 2.56E+03 2.05E+03 3.79E+01 6.30E-01
60000 1.25E+03 5.03E+02 2.49E+03 1.95E+03 3.80E+01 6.30E-01
70000 1.20E+03 5.00E+02 2.39E+03 1.91E+03 3.82E+01 6.10E-01
80000 1.14E+03 5.02E+02 2.27E+03 1.89E+03 3.82E+01 5.90E-01
90000 1.10E+03 5.02E+02 2.18E+03 1.84E+03 3.81E+01 5.90E-01
100000 1.05E+03 4.98E+02 2.11E+03 1.80E+03 3.82E+01 5.90E-01
109677 1.01E+03 4.95E+02 2.04E+03 1.73E+03 3.83E+01 5.70E-01

175
40% F-RCA
Cycles Stress
(kPa)
Micro
Strain
Stiffness
(MPa)
Modulus
(MPa)
Phase
Angle
(Deg)
Energy
(kPa)
50 2.42E+03 5.07E+02 4.77E+03 3.91E+03 2.58E+01 1.09E+00
500 2.27E+03 5.05E+02 4.50E+03 3.49E+03 2.94E+01 1.06E+00
1000 2.23E+03 5.00E+02 4.46E+03 3.37E+03 2.94E+01 1.05E+00
2000 2.15E+03 4.98E+02 4.32E+03 3.29E+03 2.86E+01 1.04E+00
3000 2.10E+03 4.99E+02 4.21E+03 3.21E+03 2.85E+01 1.04E+00
4000 1.97E+03 5.02E+02 3.92E+03 3.17E+03 2.85E+01 1.03E+00
5000 1.95E+03 5.02E+02 3.88E+03 3.10E+03 2.86E+01 1.03E+00
6000 1.92E+03 5.02E+02 3.82E+03 2.94E+03 2.85E+01 1.02E+00
7000 1.88E+03 5.00E+02 3.76E+03 2.88E+03 2.85E+01 1.00E+00
8000 1.84E+03 5.01E+02 3.67E+03 2.75E+03 2.86E+01 1.00E+00
9000 1.81E+03 5.00E+02 3.62E+03 2.70E+03 2.87E+01 9.90E-01
10000 1.78E+03 4.99E+02 3.57E+03 2.68E+03 2.87E+01 9.80E-01
20000 1.76E+03 4.99E+02 3.52E+03 2.62E+03 2.87E+01 9.80E-01
30000 1.69E+03 4.98E+02 3.40E+03 2.57E+03 2.88E+01 9.70E-01
40000 1.63E+03 5.03E+02 3.24E+03 2.52E+03 2.87E+01 9.60E-01
50000 1.57E+03 5.01E+02 3.14E+03 2.47E+03 2.89E+01 9.60E-01
60000 1.51E+03 4.97E+02 3.04E+03 2.39E+03 2.90E+01 9.40E-01
70000 1.49E+03 5.00E+02 2.97E+03 2.32E+03 2.89E+01 9.40E-01
80000 1.44E+03 5.00E+02 2.88E+03 2.26E+03 2.89E+01 9.20E-01
90000 1.42E+03 4.99E+02 2.84E+03 2.20E+03 2.90E+01 9.20E-01
100000 1.38E+03 4.99E+02 2.77E+03 2.13E+03 2.90E+01 9.00E-01
110000 1.35E+03 5.02E+02 2.69E+03 2.10E+03 2.91E+01 9.00E-01
120000 1.31E+03 4.97E+02 2.64E+03 2.04E+03 2.90E+01 8.80E-01
130000 1.28E+03 4.98E+02 2.56E+03 1.98E+03 2.91E+01 8.80E-01
140876 1.20E+03 5.04E+02 2.39E+03 1.93E+03 2.92E+01 8.60E-01

176
60% F-RCA
Cycles Stress
(kPa)
Micro
Strain
Stiffness
(MPa)
Modulus
(MPa)
Phase
Angle
(Deg)
Energy
(kPa)
50 2.35E+03 5.05E+02 4.64E+03 3.55E+03 2.99E+01 9.40E-01
500 2.21E+03 5.04E+02 4.39E+03 3.40E+03 3.26E+01 9.00E-01
1000 2.18E+03 5.00E+02 4.35E+03 3.38E+03 3.27E+01 8.80E-01
2000 2.14E+03 5.00E+02 4.27E+03 3.33E+03 3.24E+01 8.30E-01
3000 2.06E+03 5.01E+02 4.12E+03 3.27E+03 3.17E+01 8.00E-01
4000 2.01E+03 4.99E+02 4.03E+03 3.18E+03 3.17E+01 8.10E-01
5000 1.98E+03 4.98E+02 3.98E+03 3.12E+03 3.17E+01 8.00E-01
6000 1.96E+03 4.97E+02 3.94E+03 3.06E+03 3.18E+01 7.60E-01
7000 1.92E+03 4.98E+02 3.85E+03 3.02E+03 3.18E+01 7.80E-01
8000 1.87E+03 4.98E+02 3.76E+03 2.94E+03 3.17E+01 7.60E-01
9000 1.84E+03 5.01E+02 3.67E+03 2.87E+03 3.18E+01 7.70E-01
10000 1.80E+03 5.01E+02 3.59E+03 2.76E+03 3.19E+01 7.60E-01
20000 1.77E+03 5.00E+02 3.53E+03 2.64E+03 3.19E+01 7.30E-01
30000 1.74E+03 5.01E+02 3.47E+03 2.51E+03 3.19E+01 7.40E-01
40000 1.71E+03 5.00E+02 3.41E+03 2.48E+03 3.19E+01 7.20E-01
50000 1.68E+03 5.03E+02 3.33E+03 2.43E+03 3.20E+01 7.00E-01
60000 1.62E+03 4.98E+02 3.26E+03 2.35E+03 3.19E+01 6.90E-01
70000 1.58E+03 4.99E+02 3.16E+03 2.25E+03 3.20E+01 6.90E-01
80000 1.52E+03 5.02E+02 3.03E+03 2.16E+03 3.21E+01 6.80E-01
90000 1.47E+03 5.01E+02 2.93E+03 2.07E+03 3.21E+01 6.70E-01
100000 1.40E+03 5.03E+02 2.78E+03 1.99E+03 3.20E+01 6.60E-01
110000 1.32E+03 4.97E+02 2.65E+03 1.91E+03 3.21E+01 6.50E-01
120000 1.26E+03 5.02E+02 2.50E+03 1.82E+03 3.22E+01 6.50E-01
130000 1.18E+03 5.02E+02 2.35E+03 1.74E+03 3.23E+01 6.40E-01
132675 1.16E+03 5.00E+02 2.32E+03 1.58E+03 3.23E+01 6.10E-01

177
80% F-RCA
Cycles Stress
(kPa)
Micro
Strain
Stiffness
(MPa)
Modulus
(MPa)
Phase
Angle
(Deg)
Energy
(kPa)
50 2.49E+03 5.07E+02 4.91E+03 3.90E+03 2.99E+01 9.50E-01
500 2.36E+03 5.02E+02 4.71E+03 3.81E+03 3.32E+01 9.40E-01
1000 2.31E+03 5.00E+02 4.62E+03 3.73E+03 3.33E+01 9.20E-01
2000 2.28E+03 4.97E+02 4.58E+03 3.65E+03 3.24E+01 9.20E-01
3000 2.23E+03 4.97E+02 4.49E+03 3.59E+03 3.19E+01 9.10E-01
4000 2.20E+03 4.98E+02 4.41E+03 3.52E+03 3.19E+01 9.10E-01
5000 2.14E+03 4.98E+02 4.30E+03 3.46E+03 3.19E+01 9.10E-01
6000 2.10E+03 5.00E+02 4.20E+03 3.39E+03 3.20E+01 8.90E-01
7000 2.07E+03 5.00E+02 4.14E+03 3.31E+03 3.20E+01 8.90E-01
8000 2.02E+03 5.02E+02 4.02E+03 3.04E+03 3.20E+01 8.80E-01
9000 1.98E+03 5.04E+02 3.92E+03 2.95E+03 3.21E+01 8.80E-01
10000 1.93E+03 4.99E+02 3.86E+03 2.87E+03 3.21E+01 8.70E-01
20000 1.85E+03 5.01E+02 3.70E+03 2.78E+03 3.21E+01 8.70E-01
30000 1.79E+03 5.02E+02 3.56E+03 2.69E+03 3.21E+01 8.50E-01
40000 1.73E+03 4.99E+02 3.47E+03 2.60E+03 3.23E+01 8.40E-01
50000 1.66E+03 4.99E+02 3.33E+03 2.51E+03 3.22E+01 8.40E-01
60000 1.60E+03 4.98E+02 3.22E+03 2.43E+03 3.23E+01 8.20E-01
70000 1.55E+03 5.03E+02 3.09E+03 2.34E+03 3.23E+01 8.20E-01
80000 1.49E+03 5.00E+02 2.98E+03 2.25E+03 3.24E+01 8.00E-01
90000 1.44E+03 5.00E+02 2.88E+03 2.16E+03 3.23E+01 8.00E-01
100000 1.40E+03 5.01E+02 2.80E+03 2.07E+03 3.24E+01 7.80E-01
110000 1.36E+03 5.01E+02 2.72E+03 1.99E+03 3.24E+01 7.80E-01
120000 1.32E+03 5.02E+02 2.63E+03 1.90E+03 3.25E+01 7.60E-01
132467 1.23E+03 5.03E+02 2.45E+03 1.81E+03 3.25E+01 7.60E-01

178
20% C-RCA
Cycles Stress
(kPa)
Micro
Strain
Stiffness
(MPa)
Modulus
(MPa)
Phase
Angle
(Deg)
Energy
(kPa)
50 1.87E+03 5.09E+02 3.67E+03 3.41E+03 3.18E+01 9.00E-01
500 1.80E+03 5.03E+02 3.57E+03 3.38E+03 3.46E+01 9.00E-01
1000 1.71E+03 4.99E+02 3.43E+03 3.30E+03 3.46E+01 8.80E-01
2000 1.67E+03 4.99E+02 3.34E+03 3.22E+03 3.34E+01 8.60E-01
3000 1.58E+03 4.99E+02 3.16E+03 3.16E+03 3.34E+01 8.60E-01
4000 1.52E+03 4.98E+02 3.05E+03 3.05E+03 3.35E+01 8.60E-01
5000 1.49E+03 5.00E+02 2.97E+03 2.97E+03 3.35E+01 8.40E-01
6000 1.45E+03 4.98E+02 2.90E+03 2.83E+03 3.35E+01 8.40E-01
7000 1.41E+03 4.99E+02 2.83E+03 2.76E+03 3.35E+01 8.20E-01
8000 1.40E+03 5.01E+02 2.79E+03 2.66E+03 3.36E+01 8.00E-01
9000 1.37E+03 5.00E+02 2.74E+03 2.57E+03 3.38E+01 7.90E-01
10000 1.33E+03 5.01E+02 2.66E+03 2.44E+03 3.37E+01 7.60E-01
20000 1.30E+03 5.04E+02 2.58E+03 2.34E+03 3.38E+01 7.60E-01
30000 1.25E+03 5.02E+02 2.49E+03 2.29E+03 3.39E+01 7.40E-01
40000 1.21E+03 4.98E+02 2.43E+03 2.23E+03 3.39E+01 7.40E-01
50000 1.17E+03 5.00E+02 2.35E+03 2.18E+03 3.38E+01 7.40E-01
60000 1.14E+03 5.00E+02 2.27E+03 2.12E+03 3.39E+01 7.20E-01
70000 1.10E+03 4.99E+02 2.20E+03 2.07E+03 3.40E+01 7.10E-01
80000 1.06E+03 4.99E+02 2.13E+03 2.03E+03 3.40E+01 6.90E-01
90000 1.03E+03 4.97E+02 2.07E+03 1.97E+03 3.41E+01 6.90E-01
100000 9.90E+02 4.99E+02 1.98E+03 1.92E+03 3.42E+01 6.90E-01
110000 9.53E+02 5.01E+02 1.90E+03 1.86E+03 3.42E+01 6.70E-01
119368 9.19E+02 5.01E+02 1.83E+03 1.83E+03 3.43E+01 6.70E-01

179
40% C-RCA
Cycles Stress
(kPa)
Micro
Strain
Stiffness
(MPa)
Modulus
(MPa)
Phase
Angle
(Deg)
Energy
(kPa)
50 2.06E+03 5.06E+02 4.07E+03 3.67E+03 3.92E+01 7.10E-01
500 1.93E+03 5.02E+02 3.85E+03 3.50E+03 4.37E+01 6.90E-01
1000 1.88E+03 4.99E+02 3.77E+03 3.47E+03 4.38E+01 6.80E-01
2000 1.83E+03 4.98E+02 3.67E+03 3.34E+03 4.34E+01 6.20E-01
3000 1.79E+03 5.00E+02 3.58E+03 3.25E+03 4.31E+01 5.90E-01
4000 1.71E+03 5.00E+02 3.42E+03 3.16E+03 4.30E+01 6.00E-01
5000 1.67E+03 5.00E+02 3.33E+03 3.09E+03 4.26E+01 5.90E-01
6000 1.61E+03 5.03E+02 3.19E+03 3.01E+03 4.28E+01 5.60E-01
7000 1.58E+03 5.03E+02 3.14E+03 2.96E+03 4.25E+01 5.60E-01
8000 1.53E+03 4.97E+02 3.07E+03 2.85E+03 4.25E+01 5.60E-01
9000 1.46E+03 4.98E+02 2.92E+03 2.75E+03 4.22E+01 5.50E-01
10000 1.40E+03 4.97E+02 2.81E+03 2.68E+03 4.22E+01 5.50E-01
20000 1.34E+03 5.00E+02 2.68E+03 2.54E+03 4.23E+01 5.20E-01
30000 1.29E+03 5.01E+02 2.57E+03 2.41E+03 4.25E+01 5.30E-01
40000 1.23E+03 5.02E+02 2.45E+03 2.37E+03 4.25E+01 5.20E-01
50000 1.17E+03 4.99E+02 2.35E+03 2.24E+03 4.27E+01 5.10E-01
60000 1.13E+03 5.02E+02 2.26E+03 2.14E+03 4.26E+01 5.10E-01
70000 1.10E+03 5.00E+02 2.19E+03 2.08E+03 4.27E+01 4.90E-01
80000 1.06E+03 5.00E+02 2.11E+03 2.03E+03 4.28E+01 4.80E-01
89564 1.02E+03 5.03E+02 2.03E+03 1.91E+03 4.28E+01 4.70E-01

180
60% C-RCA
Cycles Stress
(kPa)
Micro
Strain
Stiffness
(MPa)
Modulus
(MPa)
Phase
Angle
(Deg)
Energy
(kPa)
50 1.89E+03 5.08E+02 3.72E+03 3.20E+03 4.05E+01 6.40E-01
500 1.82E+03 5.01E+02 3.63E+03 3.09E+03 4.36E+01 6.20E-01
1000 1.78E+03 5.04E+02 3.52E+03 3.04E+03 4.38E+01 6.20E-01
2000 1.74E+03 5.02E+02 3.46E+03 2.97E+03 4.40E+01 6.00E-01
3000 1.67E+03 4.98E+02 3.35E+03 2.92E+03 4.26E+01 6.00E-01
4000 1.60E+03 5.00E+02 3.20E+03 2.88E+03 4.28E+01 6.00E-01
5000 1.57E+03 5.00E+02 3.15E+03 2.83E+03 4.25E+01 5.90E-01
6000 1.53E+03 5.03E+02 3.05E+03 2.79E+03 4.25E+01 5.70E-01
7000 1.48E+03 4.99E+02 2.97E+03 2.75E+03 4.24E+01 5.50E-01
8000 1.41E+03 4.99E+02 2.83E+03 2.69E+03 4.25E+01 5.50E-01
9000 1.38E+03 4.99E+02 2.76E+03 2.62E+03 4.27E+01 5.20E-01
10000 1.34E+03 4.98E+02 2.69E+03 2.57E+03 4.27E+01 5.20E-01
20000 1.26E+03 5.00E+02 2.53E+03 2.49E+03 4.26E+01 5.00E-01
30000 1.20E+03 4.98E+02 2.41E+03 2.41E+03 4.26E+01 4.70E-01
40000 1.14E+03 4.99E+02 2.28E+03 2.36E+03 4.27E+01 4.60E-01
50000 1.11E+03 5.01E+02 2.21E+03 2.26E+03 4.27E+01 4.60E-01
60000 1.06E+03 5.00E+02 2.11E+03 2.18E+03 4.29E+01 4.40E-01
70000 1.00E+03 5.00E+02 2.01E+03 2.07E+03 4.29E+01 4.30E-01
80000 9.52E+02 5.00E+02 1.90E+03 1.98E+03 4.30E+01 4.20E-01
86850 9.25E+02 4.98E+02 1.86E+03 1.86E+03 4.30E+01 4.10E-01

181
80% C-RCA
Cycles Stress
(kPa)
Micro
Strain
Stiffness
(MPa)
Modulus
(MPa)
Phase
Angle
(Deg)
Energy
(kPa)
50 1.49E+03 5.06E+02 2.94E+03 2.86E+03 4.26E+01 4.40E-01
500 1.36E+03 5.02E+02 2.70E+03 2.69E+03 4.48E+01 4.00E-01
1000 1.30E+03 5.01E+02 2.60E+03 2.63E+03 4.63E+01 3.80E-01
2000 1.26E+03 5.01E+02 2.52E+03 2.57E+03 4.56E+01 3.80E-01
3000 1.21E+03 5.00E+02 2.42E+03 2.49E+03 4.56E+01 3.80E-01
4000 1.16E+03 4.98E+02 2.32E+03 2.43E+03 4.51E+01 3.60E-01
5000 1.11E+03 4.98E+02 2.22E+03 2.38E+03 4.51E+01 3.50E-01
6000 1.01E+03 4.97E+02 2.03E+03 2.30E+03 4.47E+01 3.30E-01
7000 9.75E+02 4.98E+02 1.96E+03 2.27E+03 4.47E+01 3.30E-01
8000 9.42E+02 5.01E+02 1.88E+03 2.15E+03 4.43E+01 3.20E-01
9000 9.19E+02 4.99E+02 1.84E+03 2.09E+03 4.45E+01 3.10E-01
10000 8.96E+02 5.00E+02 1.79E+03 2.04E+03 4.46E+01 3.10E-01
20000 8.70E+02 5.00E+02 1.74E+03 1.90E+03 4.45E+01 3.00E-01
30000 8.46E+02 5.01E+02 1.69E+03 1.82E+03 4.45E+01 3.00E-01
40000 8.13E+02 5.00E+02 1.63E+03 1.77E+03 4.42E+01 2.70E-01
50000 7.84E+02 4.99E+02 1.57E+03 1.69E+03 4.44E+01 2.70E-01
60000 7.63E+02 4.99E+02 1.53E+03 1.63E+03 4.44E+01 2.50E-01
70000 7.44E+02 5.00E+02 1.49E+03 1.55E+03 4.46E+01 2.50E-01
73782 7.38E+02 5.02E+02 1.47E+03 1.50E+03 4.49E+01 2.30E-01

182
20% M-RCA
Cycles Stress
(kPa)
Micro
Strain
Stiffness
(MPa)
Modulus
(MPa)
Phase
Angle
(Deg)
Energy
(kPa)
50 1.98E+03 5.07E+02 3.90E+03 3.42E+03 3.63E+01 7.90E-01
500 1.90E+03 5.03E+02 3.78E+03 3.29E+03 3.94E+01 7.70E-01
1000 1.84E+03 5.00E+02 3.68E+03 3.24E+03 3.98E+01 7.60E-01
2000 1.79E+03 5.00E+02 3.57E+03 3.15E+03 4.04E+01 7.60E-01
3000 1.72E+03 5.02E+02 3.42E+03 3.11E+03 4.04E+01 7.40E-01
4000 1.67E+03 5.01E+02 3.33E+03 3.07E+03 4.02E+01 7.40E-01
5000 1.61E+03 5.00E+02 3.22E+03 2.99E+03 3.96E+01 7.30E-01
6000 1.58E+03 5.00E+02 3.15E+03 2.93E+03 3.96E+01 7.10E-01
7000 1.53E+03 5.01E+02 3.04E+03 2.88E+03 3.97E+01 6.90E-01
8000 1.48E+03 5.00E+02 2.95E+03 2.81E+03 3.96E+01 6.90E-01
9000 1.43E+03 4.98E+02 2.87E+03 2.79E+03 3.99E+01 6.90E-01
10000 1.38E+03 4.99E+02 2.77E+03 2.72E+03 3.98E+01 6.70E-01
20000 1.32E+03 5.01E+02 2.63E+03 2.66E+03 3.98E+01 6.50E-01
30000 1.29E+03 5.00E+02 2.58E+03 2.59E+03 3.99E+01 6.50E-01
40000 1.25E+03 4.98E+02 2.51E+03 2.50E+03 4.00E+01 6.50E-01
50000 1.20E+03 5.03E+02 2.38E+03 2.43E+03 4.00E+01 6.40E-01
60000 1.16E+03 5.02E+02 2.32E+03 2.38E+03 3.99E+01 6.40E-01
70000 1.13E+03 5.01E+02 2.25E+03 2.32E+03 4.00E+01 6.30E-01
80000 1.08E+03 5.01E+02 2.16E+03 2.26E+03 4.02E+01 6.30E-01
90000 1.02E+03 5.00E+02 2.04E+03 2.22E+03 4.03E+01 6.10E-01
101364 9.68E+02 4.97E+02 1.95E+03 2.17E+03 4.03E+01 6.00E-01

183
40% M-RCA
Cycles Stress
(kPa)
Micro
Strain
Stiffness
(MPa)
Modulus
(MPa)
Phase
Angle
(Deg)
Energy
(kPa)
50 2.30E+03 5.05E+02 4.55E+03 3.49E+03 2.78E+01 9.80E-01
500 2.23E+03 5.03E+02 4.43E+03 3.18E+03 3.18E+01 9.50E-01
1000 2.19E+03 4.99E+02 4.38E+03 3.06E+03 3.19E+01 9.30E-01
2000 2.15E+03 4.98E+02 4.31E+03 2.91E+03 3.12E+01 9.20E-01
3000 2.11E+03 4.99E+02 4.22E+03 2.79E+03 3.06E+01 9.20E-01
4000 2.07E+03 4.99E+02 4.14E+03 2.71E+03 3.06E+01 9.00E-01
5000 1.94E+03 5.00E+02 3.87E+03 2.67E+03 3.05E+01 9.00E-01
6000 1.87E+03 5.03E+02 3.71E+03 2.54E+03 3.06E+01 8.90E-01
7000 1.81E+03 5.04E+02 3.59E+03 2.48E+03 3.07E+01 8.70E-01
8000 1.76E+03 5.00E+02 3.51E+03 2.39E+03 3.06E+01 8.70E-01
9000 1.70E+03 4.97E+02 3.43E+03 2.32E+03 3.07E+01 8.70E-01
10000 1.69E+03 4.97E+02 3.40E+03 2.27E+03 3.07E+01 8.50E-01
20000 1.64E+03 4.98E+02 3.30E+03 2.19E+03 3.07E+01 8.30E-01
30000 1.58E+03 5.03E+02 3.14E+03 2.11E+03 3.08E+01 8.30E-01
40000 1.54E+03 4.98E+02 3.10E+03 2.02E+03 3.07E+01 8.30E-01
50000 1.51E+03 5.00E+02 3.02E+03 1.94E+03 3.08E+01 8.00E-01
60000 1.48E+03 5.01E+02 2.95E+03 1.87E+03 3.08E+01 7.80E-01
70000 1.46E+03 4.99E+02 2.93E+03 1.79E+03 3.08E+01 7.50E-01
80000 1.40E+03 4.97E+02 2.82E+03 1.71E+03 3.09E+01 7.50E-01
90000 1.36E+03 5.02E+02 2.71E+03 1.63E+03 3.09E+01 7.10E-01
100000 1.32E+03 5.01E+02 2.64E+03 1.55E+03 3.10E+01 7.10E-01
110000 1.27E+03 5.00E+02 2.55E+03 1.53E+03 3.09E+01 6.90E-01
120000 1.23E+03 5.02E+02 2.44E+03 1.41E+03 3.09E+01 6.80E-01
130000 1.20E+03 4.97E+02 2.41E+03 1.34E+03 3.10E+01 6.80E-01
138971 1.14E+03 5.00E+02 2.28E+03 1.26E+03 3.11E+01 6.40E-01

184
60% M-RCA
Cycles Stress
(kPa)
Micro
Strain
Stiffness
(MPa)
Modulus
(MPa)
Phase
Angle
(Deg)
Energy
(kPa)
50 2.07E+03 5.05E+02 4.09E+03 3.71E+03 3.19E+01 8.80E-01
500 1.98E+03 5.00E+02 3.95E+03 3.57E+03 3.46E+01 8.50E-01
1000 1.93E+03 5.00E+02 3.86E+03 3.49E+03 3.53E+01 8.30E-01
2000 1.86E+03 4.98E+02 3.74E+03 3.40E+03 3.44E+01 8.00E-01
3000 1.84E+03 4.99E+02 3.69E+03 3.25E+03 3.41E+01 8.00E-01
4000 1.80E+03 4.99E+02 3.62E+03 3.19E+03 3.42E+01 7.80E-01
5000 1.79E+03 5.00E+02 3.58E+03 3.12E+03 3.42E+01 7.80E-01
6000 1.75E+03 5.01E+02 3.50E+03 3.06E+03 3.43E+01 7.50E-01
7000 1.72E+03 5.03E+02 3.42E+03 2.96E+03 3.43E+01 7.40E-01
8000 1.70E+03 4.98E+02 3.41E+03 2.85E+03 3.43E+01 7.40E-01
9000 1.66E+03 4.99E+02 3.32E+03 2.77E+03 3.46E+01 7.30E-01
10000 1.62E+03 5.00E+02 3.24E+03 2.68E+03 3.45E+01 6.80E-01
20000 1.58E+03 4.97E+02 3.17E+03 2.59E+03 3.46E+01 6.80E-01
30000 1.52E+03 4.97E+02 3.06E+03 2.50E+03 3.47E+01 6.60E-01
40000 1.47E+03 4.98E+02 2.95E+03 2.42E+03 3.47E+01 6.40E-01
50000 1.43E+03 5.01E+02 2.86E+03 2.33E+03 3.47E+01 6.40E-01
60000 1.39E+03 5.00E+02 2.77E+03 2.24E+03 3.49E+01 6.40E-01
70000 1.33E+03 5.00E+02 2.65E+03 2.15E+03 3.48E+01 6.20E-01
80000 1.27E+03 4.99E+02 2.54E+03 2.06E+03 3.49E+01 6.10E-01
90000 1.20E+03 5.00E+02 2.40E+03 1.98E+03 3.49E+01 6.10E-01
100000 1.14E+03 5.02E+02 2.27E+03 1.89E+03 3.51E+01 6.10E-01
110000 1.09E+03 5.01E+02 2.17E+03 1.80E+03 3.52E+01 5.90E-01
117869 1.02E+03 5.00E+02 2.05E+03 1.71E+03 3.52E+01 5.80E-01
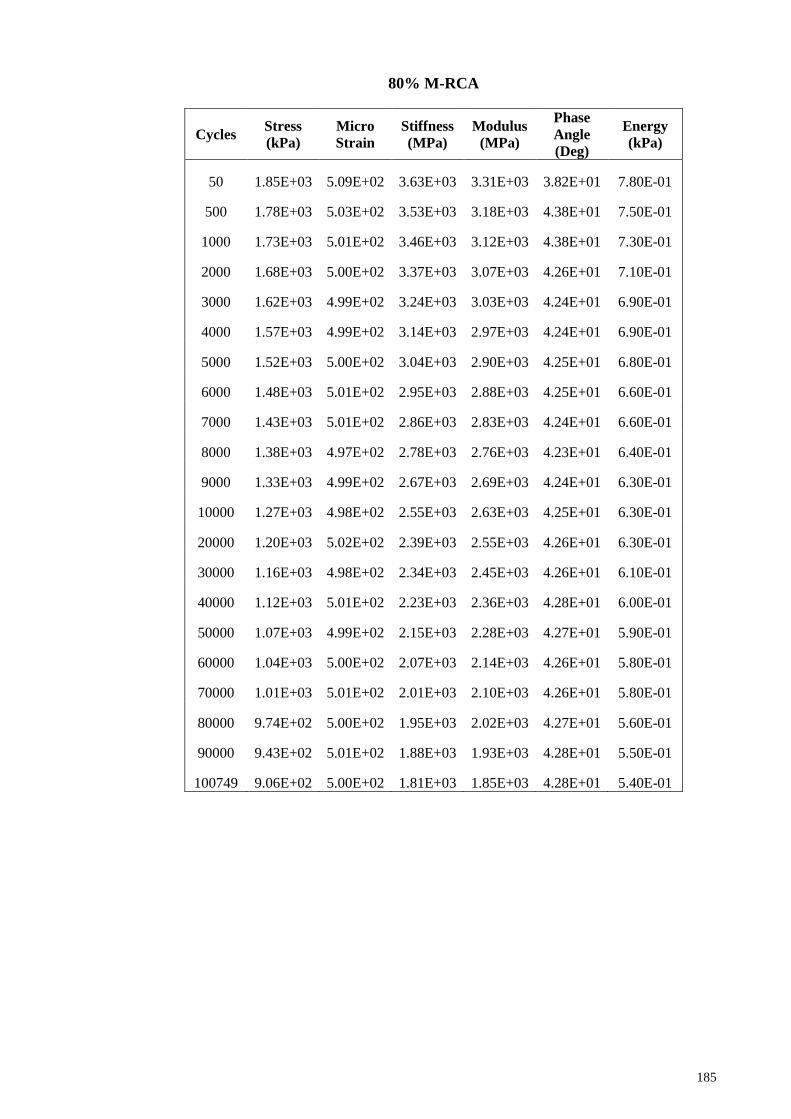
185
80% M-RCA
Cycles Stress
(kPa)
Micro
Strain
Stiffness
(MPa)
Modulus
(MPa)
Phase
Angle
(Deg)
Energy
(kPa)
50 1.85E+03 5.09E+02 3.63E+03 3.31E+03 3.82E+01 7.80E-01
500 1.78E+03 5.03E+02 3.53E+03 3.18E+03 4.38E+01 7.50E-01
1000 1.73E+03 5.01E+02 3.46E+03 3.12E+03 4.38E+01 7.30E-01
2000 1.68E+03 5.00E+02 3.37E+03 3.07E+03 4.26E+01 7.10E-01
3000 1.62E+03 4.99E+02 3.24E+03 3.03E+03 4.24E+01 6.90E-01
4000 1.57E+03 4.99E+02 3.14E+03 2.97E+03 4.24E+01 6.90E-01
5000 1.52E+03 5.00E+02 3.04E+03 2.90E+03 4.25E+01 6.80E-01
6000 1.48E+03 5.01E+02 2.95E+03 2.88E+03 4.25E+01 6.60E-01
7000 1.43E+03 5.01E+02 2.86E+03 2.83E+03 4.24E+01 6.60E-01
8000 1.38E+03 4.97E+02 2.78E+03 2.76E+03 4.23E+01 6.40E-01
9000 1.33E+03 4.99E+02 2.67E+03 2.69E+03 4.24E+01 6.30E-01
10000 1.27E+03 4.98E+02 2.55E+03 2.63E+03 4.25E+01 6.30E-01
20000 1.20E+03 5.02E+02 2.39E+03 2.55E+03 4.26E+01 6.30E-01
30000 1.16E+03 4.98E+02 2.34E+03 2.45E+03 4.26E+01 6.10E-01
40000 1.12E+03 5.01E+02 2.23E+03 2.36E+03 4.28E+01 6.00E-01
50000 1.07E+03 4.99E+02 2.15E+03 2.28E+03 4.27E+01 5.90E-01
60000 1.04E+03 5.00E+02 2.07E+03 2.14E+03 4.26E+01 5.80E-01
70000 1.01E+03 5.01E+02 2.01E+03 2.10E+03 4.26E+01 5.80E-01
80000 9.74E+02 5.00E+02 1.95E+03 2.02E+03 4.27E+01 5.60E-01
90000 9.43E+02 5.01E+02 1.88E+03 1.93E+03 4.28E+01 5.50E-01
100749 9.06E+02 5.00E+02 1.81E+03 1.85E+03 4.28E+01 5.40E-01

186
APPENDIX F
Statistical analysis and NOVA outputs of HMA Specimens
ANOVA: Two-Factor Without Replication (OAC) SUMMARY Count Sum Average Variance
FINE 5 30.3 6.06 0.748 COARSE 5 29 5.8 0.475 MIX 5 29.8 5.96 0.583 0 3 15.3 5.1 0 0.2 3 16.3 5.433333333 0.0033333 0.4 3 17.3 5.766666667 0.0533333 0.6 3 19.1 6.366666667 0.0233333 0.8 3 21.1 7.033333333 0.0633333 ANOVA
Source of Variation SS df MS F P-value F crit
Rows 0.172 2 0.086 6 0.0256 4.45897 Columns 7.109333333 4 1.777333333 124 3.13E-07 3.837853 Error 0.114666667 8 0.014333333
Total 7.396 14
ANOVA: Two-Factor Without Replication (STABILITY)
SUMMARY Count Sum Average Variance FINE 5 56.26 11.252 7.05102 COARSE 5 63.17 12.634 3.95383 MIX 5 57.23 11.446 5.61703
0 3 43.89 14.63 0 0.2 3 39.2 13.0666667 0.858433 0.4 3 36.47 12.1566667 1.172033 0.6 3 30.83 10.2766667 0.885733 0.8 3 26.27 8.75666667 1.146033 ANOVA
Source of Variation SS df MS F P-value F crit
Rows 5.598173333 2 2.79908667 8.863853 0.009349 4.45897 Columns 63.96122667 4 15.9903067 50.63642 1.01E-05 3.837853 Error 2.526293333 8 0.31578667
Total 72.08569333 14
ANOVA : Two-Factor Without Replication (FLOW)
SUMMARY Count Sum Average Variance FINE 5 25.16 5.032 2.28992 COARSE 5 19.52 3.904 0.48598 MIX 5 26.16 5.232 1.86837
0 3 10.05 3.35 0 0.2 3 11.9 3.966667 0.297233 0.4 3 13.88 4.626667 1.029733 0.6 3 16.01 5.336667 1.056933 0.8 3 19 6.333333 1.313633 ANOVA
Source of Variation SS df MS F P-value F crit
Rows 5.126613 2 2.563307 9.039839 0.008854 4.45897 Columns 16.30863 4 4.077157 14.37863 0.001003 3.837853 Error 2.268453 8 0.283557
Total 23.70369 14
ANOVA: Two-Factor Without Replication (DENSITY)
SUMMARY Count Sum Average Variance FINE 5 11.913 2.3826 0.002952 COARSE 5 12.105 2.421 0.000315 MIX 5 11.934 2.3868 0.002688
0 3 7.314 2.438 0 0.2 3 7.283 2.427667 3.73E-05 0.4 3 7.22 2.406667 0.00035 0.6 3 7.123 2.374333 0.001057
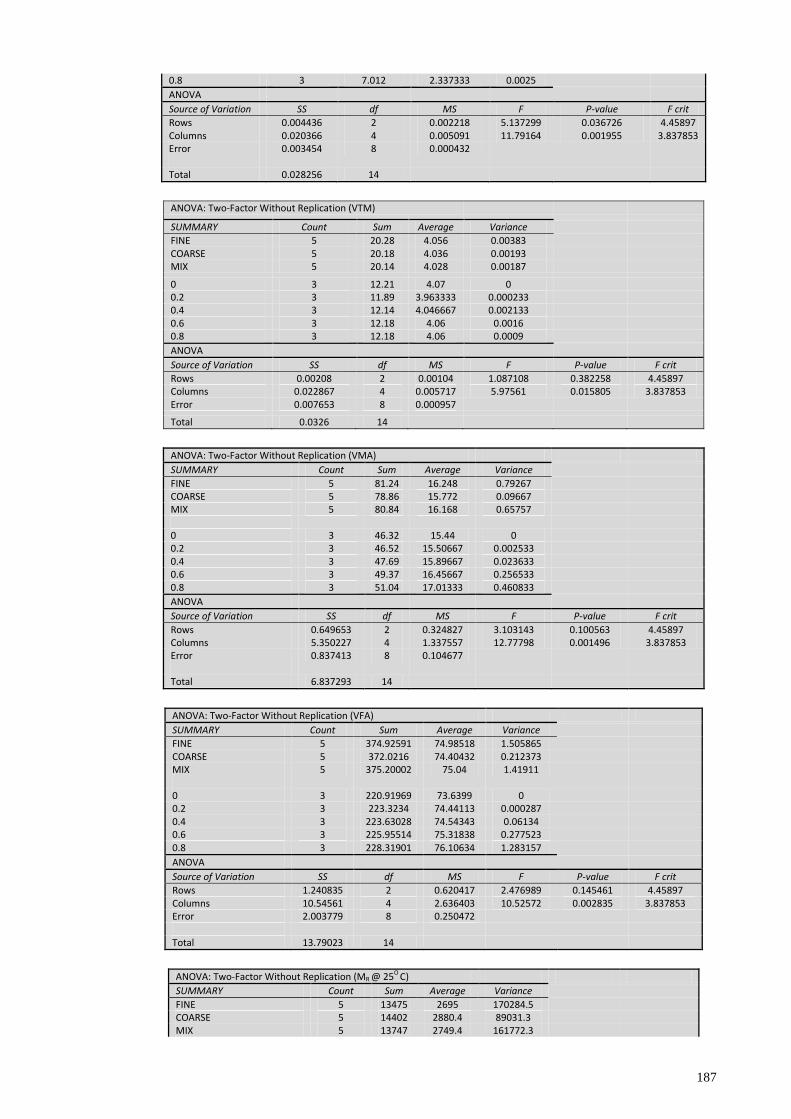
187
0.8 3 7.012 2.337333 0.0025 ANOVA
Source of Variation SS df MS F P-value F crit
Rows 0.004436 2 0.002218 5.137299 0.036726 4.45897 Columns 0.020366 4 0.005091 11.79164 0.001955 3.837853 Error 0.003454 8 0.000432
Total 0.028256 14
ANOVA: Two-Factor Without Replication (VTM)
SUMMARY Count Sum Average Variance FINE 5 20.28 4.056 0.00383 COARSE 5 20.18 4.036 0.00193 MIX 5 20.14 4.028 0.00187 0 3 12.21 4.07 0 0.2 3 11.89 3.963333 0.000233 0.4 3 12.14 4.046667 0.002133 0.6 3 12.18 4.06 0.0016 0.8 3 12.18 4.06 0.0009 ANOVA
Source of Variation SS df MS F P-value F crit
Rows 0.00208 2 0.00104 1.087108 0.382258 4.45897 Columns 0.022867 4 0.005717 5.97561 0.015805 3.837853 Error 0.007653 8 0.000957
Total 0.0326 14
ANOVA: Two-Factor Without Replication (VMA)
SUMMARY Count Sum Average Variance FINE 5 81.24 16.248 0.79267 COARSE 5 78.86 15.772 0.09667 MIX 5 80.84 16.168 0.65757
0 3 46.32 15.44 0 0.2 3 46.52 15.50667 0.002533 0.4 3 47.69 15.89667 0.023633 0.6 3 49.37 16.45667 0.256533 0.8 3 51.04 17.01333 0.460833 ANOVA
Source of Variation SS df MS F P-value F crit
Rows 0.649653 2 0.324827 3.103143 0.100563 4.45897 Columns 5.350227 4 1.337557 12.77798 0.001496 3.837853 Error 0.837413 8 0.104677
Total 6.837293 14
ANOVA: Two-Factor Without Replication (VFA)
SUMMARY Count Sum Average Variance FINE 5 374.92591 74.98518 1.505865 COARSE 5 372.0216 74.40432 0.212373 MIX 5 375.20002 75.04 1.41911
0 3 220.91969 73.6399 0 0.2 3 223.3234 74.44113 0.000287 0.4 3 223.63028 74.54343 0.06134 0.6 3 225.95514 75.31838 0.277523 0.8 3 228.31901 76.10634 1.283157 ANOVA
Source of Variation SS df MS F P-value F crit
Rows 1.240835 2 0.620417 2.476989 0.145461 4.45897 Columns 10.54561 4 2.636403 10.52572 0.002835 3.837853 Error 2.003779 8 0.250472
Total 13.79023 14
ANOVA: Two-Factor Without Replication (MR @ 25O C)
SUMMARY Count Sum Average Variance FINE 5 13475 2695 170284.5 COARSE 5 14402 2880.4 89031.3 MIX 5 13747 2749.4 161772.3

188
0 3 9357 3119 0
0.2 3 9263 3087.667 2366.333 0.4 3 8327 2775.667 11972.33 0.6 3 8042 2680.667 36864.33 0.8 3 6635 2211.667 22874.33 ANOVA
Source of Variation SS df MS F P-value F crit
Rows 90822.53 2 45411.27 6.336588 0.022425 4.45897 Columns 1627020 4 406755.1 56.75771 6.53E-06 3.837853 Error 57332.13 8 7166.517
Total 1775175 14
ANOVA: Two-Factor Without Replication (MR @ 40O C)
SUMMARY Count Sum Average Variance FINE 5 7651 1530.2 74838.7 COARSE 5 8422 1684.4 15070.3 MIX 5 7767 1553.4 50898.8 0 3 5310 1770 0 0.2 3 5332 1777.333 380.3333 0.4 3 4847 1615.667 13116.33 0.6 3 4470 1490 20973 0.8 3 3881 1293.667 32764.33 ANOVA
Source of Variation SS df MS F P-value F crit
Rows 69128.13 2 34564.07 4.231912 0.055749 4.45897 Columns 497891.3 4 124472.8 15.24005 0.000822 3.837853 Error 65339.87 8 8167.483
Total 632359.3 14
ANOVA: Two-Factor Without Replication (DRY IDT)
SUMMARY Count Sum Average Variance FINE 5 41.6 8.32 0.68465 COARSE 5 41.47 8.294 0.52493 MIX 5 41.52 8.304 0.54353
0 3 27.21 9.07 0 0.2 3 26.54 8.846667 0.000133 0.4 3 25.67 8.556667 0.014233 0.6 3 23.42 7.806667 0.010033 0.8 3 21.75 7.25 0.0277 ANOVA
Source of Variation SS df MS F P-value F crit
Rows 0.00172 2 0.00086 0.067135 0.93559 4.45897 Columns 6.90996 4 1.72749 134.8548 2.25E-07 3.837853 Error 0.10248 8 0.01281
Total 7.01416 14
ANOVA: Two-Factor Without Replication (WET IDT)
SUMMARY Count Sum Average Variance FINE 5 33.46 6.692 1.29102 COARSE 5 34.8 6.96 0.539 MIX 5 33.94 6.788 0.87847
0 3 23.22 7.74 1.18E-30 0.2 3 22.43 7.476667 0.000133 0.4 3 21.44 7.146667 0.006033 0.6 3 18.55 6.183333 0.022533 0.8 3 16.56 5.52 0.2613 ANOVA
Source of Variation SS df MS F P-value F crit
Rows 0.184373 2 0.092187 1.864114 0.216486 4.45897 Columns 10.43833 4 2.609583 52.7686 8.63E-06 3.837853 Error 0.395627 8 0.049453
Total 11.01833 14

189
ANOVA: Two-Factor Without Replication (HL DRY IDT)
SUMMARY Count Sum Average Variance FINE 5 41.7 8.34 0.7441 COARSE 5 41.73 8.346 0.55513 MIX 5 41.65 8.33 0.59485
0 3 27.33 9.11 0 0.2 3 26.72 8.906667 0.001733 0.4 3 25.83 8.61 0.0148 0.6 3 23.51 7.836667 0.017733 0.8 3 21.69 7.23 0.0457 ANOVA
Source of Variation SS df MS F P-value F crit
Rows 0.000653 2 0.000327 0.016407 0.98376 4.45897 Columns 7.41704 4 1.85426 93.13209 9.6E-07 3.837853 Error 0.15928 8 0.01991
Total 7.576973 14
ANOVA: Two-Factor Without Replication (HL WET IDT)
SUMMARY Count Sum Average Variance FINE 5 34.07 6.814 1.32383 COARSE 5 35.48 7.096 0.58258 MIX 5 34.53 6.906 0.90123
0 3 23.49 7.83 1.18E-30 0.2 3 22.98 7.66 0.0039 0.4 3 21.84 7.28 0.0112 0.6 3 19 6.333333 0.027433 0.8 3 16.77 5.59 0.2512 ANOVA
Source of Variation SS df MS F P-value F crit
Rows 0.206813 2 0.103407 2.173246 0.176273 4.45897 Columns 10.84991 4 2.712477 57.00676 6.42E-06 3.837853 Error 0.380653 8 0.047582
Total 11.43737 14
ANOVA: Two-Factor Without Replication (TSR)
SUMMARY Count Sum Average Variance FINE 5 3.99765 0.79953 0.003672 COARSE 5 4.190414 0.838083 0.000287 MIX 5 4.072312 0.814462 0.001825
0 3 2.560088 0.853363 1.85E-32 0.2 3 2.535418 0.845139 4.08E-08 0.4 3 2.505971 0.835324 0.000218 0.6 3 2.376905 0.792302 0.000841 0.8 3 2.281994 0.760665 0.003048 ANOVA
Source of Variation SS df MS F P-value F crit
Rows 0.003779 2 0.001889 3.40742 0.08503 4.45897 Columns 0.018699 4 0.004675 8.43062 0.005722 3.837853 Error 0.004436 8 0.000554
Total 0.026913 14
ANOVA: Two-Factor Without Replication (HL TSR)
SUMMARY Count Sum Average Variance FINE 5 4.061562 0.812312 0.003386 COARSE 5 4.245391 0.849078 0.000279 MIX 5 4.130944 0.826189 0.001645
0 3 2.578485 0.859495 1.85E-32 0.2 3 2.580072 0.860024 1.75E-05 0.4 3 2.536717 0.845572 0.000122 0.6 3 2.425629 0.808543 0.001161 0.8 3 2.316994 0.772331 0.002348 ANOVA
Source of Variation SS df MS F P-value F crit

190
Rows 0.003447 2 0.001723 3.581685 0.077478 4.45897 Columns 0.01739 4 0.004348 9.034854 0.004613 3.837853 Error 0.00385 8 0.000481
Total 0.024687 14
ANOVA: Two-Factor Without Replication (RUT DEPTH)
SUMMARY Count Sum Average Variance
FINE 5 20.72 4.144 3.09283
COARSE 5 19.23 3.846 2.17913
MIX 5 16.52 3.304 0.27653
0 3 8.7 2.9 0
0.2 3 8.79 2.93 0.0007
0.4 3 9.29 3.096667 0.034233
0.6 3 12.23 4.076667 0.160133
0.8 3 17.46 5.82 2.4903
ANOVA
Source of Variation SS df MS F P-value F crit
Rows 1.813613 2 0.906807 2.039418 0.192424 4.45897 Columns 18.63684 4 4.65921 10.47861 0.002876 3.837853 Error 3.55712 8 0.44464
Total 24.00757 14
ANOVA: Two-Factor Without Replication (RUT RATE)
SUMMARY Count Sum Average Variance
FINE 5 4.013734 0.802747 0.123218
COARSE 5 2.897198 0.57944 0.04098
MIX 5 3.233359 0.646672 0.046761
0 3 1.2 0.4 4.62E-33
0.2 3 1.428685 0.476228 0.001778
0.4 3 1.908916 0.636305 0.028251
0.6 3 2.629261 0.87642 0.027819
0.8 3 2.977428 0.992476 0.042713
ANOVA
Source of Variation SS df MS F P-value F crit
Rows 0.131243 2 0.065621 7.512651 0.014573 4.45897 Columns 0.773956 4 0.193489 22.15157 0.00022 3.837853 Error 0.069878 8 0.008735
Total 0.975077 14
ANOVA: Single Factor (STIFFNESS VALUE, FATIGUE)
Groups Count Sum Average Variance VA-HMA 25 118699.2423 4747.969694 996005.3288 20%F-RCA-HMA 25 144290.8724 5771.634897 1340370.764 40%F-RCA-HMA 26 171828.5401 6608.790003 1896080.859 60%F-RCA-HMA 25 120318.1017 4812.724068 896134.3158 80%F-RCA-HMA 21 77055.71994 3669.319997 452203.168 20%C-RCA-HMA 26 141455.7409 5440.60542 1164895.463 40%C-RCA-HMA 27 167299.9154 6196.293163 1517538.141 60%C-RCA-HMA 26 169923.8 6535.53077 1556408.722 80%C-RCA-HMA 25 122301.4437 4892.05775 995020.0703 20% M-RCA-HMA 26 151441.4736 5824.672063 1258351.577 40%M-RCA-HMA 27 158687.3935 5877.310871 1443579.054 60%M-RCA-HMA 25 133542.7798 5341.711193 1241896.01 80%M-RCA-HMA 24 99433.47229 4143.061346 643993.6987 ANOVA
Source of Variation SS df MS F P-value F crit
Between Groups 229497052.1 12 19124754.34 15.89505075 2.944E-26 1.78298419 Within Groups 379004616.7 315 1203189.259
Total 608501668.8 327

191
APPENDIX G
Statistical analysis and NOVA outputs of SMA Specimens
ANOVA: Two-Factor Without Replication (OAC)
SUMMARY Count Sum Average Variance
FINE 5 31.7 6.34 0.023
COARSE 5 36.4 7.28 1.257
MIX 5 34 6.8 0.4
0 3 18.6 6.2 0
0.2 3 19 6.333333333 0.0133333
0.4 3 19.9 6.633333333 0.1233333
0.6 3 21.4 7.133333333 0.5033333
0.8 3 23.2 7.733333333 1.4433333
ANOVA
Source of Variation SS df MS F P-value F crit
Rows 2.209333333 2 1.104666667 4.5149864 0.048697 4.45897 Columns 4.762666667 4 1.190666667 4.866485 0.027602 3.837853 Error 1.957333333 8 0.244666667
Total 8.929333333 14
ANOVA: Two-Factor Without Replication (STABILITY)
SUMMARY Count Sum Average Variance FINE 5 51.98 10.396 0.16958 COARSE 5 38.23 7.646 4.94308 MIX 5 39.63 7.926 4.01428
0 3 31.89 10.63 0 0.2 3 29.18 9.72666667 0.661433 0.4 3 25.07 8.35666667 4.369733 0.6 3 22.87 7.62333333 4.653333 0.8 3 20.83 6.94333333 6.322533 ANOVA
Source of Variation SS df MS F P-value F crit
Rows 22.903 2 11.4515 10.05502 0.00656 4.45897 Columns 27.39669333 4 6.84917333 6.013938 0.015523 3.837853
Error 9.111066667 8 1.13888333
Total 59.41076 14
ANOVA: Two-Factor Without Replication (FLOW) SUMMARY Count Sum Average Variance
FINE 5 14.33 2.866 0.29153 COARSE 5 23.46 4.692 3.01342 MIX 5 22.84 4.568 2.79802 0 3 7.05 2.35 0 0.2 3 9.87 3.29 0.5328 0.4 3 12.28 4.093333 1.381733 0.6 3 14.12 4.706667 1.893033 0.8 3 17.31 5.77 3.3156 ANOVA
Source of Variation SS df MS F P-value F crit
Rows 10.41076 2 5.20538 10.85706 0.005254 4.45897 Columns 20.57631 4 5.144077 10.72919 0.002664 3.837853 Error 3.835573 8 0.479447
Total 34.82264 14

192
ANOVA: Two-Factor Without Replication (DENSITY)
SUMMARY Count Sum Average Variance FINE 5 11.557 2.3114 0.000116 COARSE 5 11.296 2.2592 0.001601 MIX 5 11.332 2.2664 0.001248
0 3 6.942 2.314 0 0.2 3 6.888 2.296 0.000409 0.4 3 6.841 2.280333 0.001314 0.6 3 6.78 2.26 0.001669 0.8 3 6.734 2.244667 0.001956 ANOVA
Source of Variation SS df MS F P-value F crit
Rows 0.008003 2 0.004001 11.88005 0.004026 4.45897 Columns 0.009167 4 0.002292 6.803899 0.010896 3.837853 Error 0.002695 8 0.000337
Total 0.019864 14
ANOVA: Two-Factor Without Replication (VTM)
SUMMARY Count Sum Average Variance FINE 5 20.06 4.012 0.00077 COARSE 5 20.07 4.014 0.00453 MIX 5 20.16 4.032 0.00257
0 3 12 4 0 0.2 3 12.15 4.05 0.0004 0.4 3 11.9 3.966667 0.000533 0.6 3 11.98 3.993333 0.000433 0.8 3 12.26 4.086667 0.001033 ANOVA
Source of Variation SS df MS F P-value F crit
Rows 0.001213 2 0.000607 1.35316 0.311745 4.45897 Columns 0.027893 4 0.006973 15.5539 0.000766 3.837853 Error 0.003587 8 0.000448
Total 0.032693 14
ANOVA: Two-Factor Without Replication (VMA)
SUMMARY Count Sum Average Variance FINE 5 78.25 15.65 0.07015 COARSE 5 80.2 16.04 0.4558 MIX 5 80.19 16.038 0.50387
0 3 45.99 15.33 0 0.2 3 46.51 15.50333 0.001233 0.4 3 47.6 15.86667 0.021233 0.6 3 48.39 16.13 0.12 0.8 3 50.15 16.71667 0.365233 ANOVA
Source of Variation SS df MS F P-value F crit
Rows 0.504413 2 0.252207 3.948544 0.064134 4.45897 Columns 3.608293 4 0.902073 14.12285 0.001066 3.837853 Error 0.510987 8 0.063873
Total 4.623693 14
ANOVA: Two-Factor Without Replication (VFA)
SUMMARY Count Sum Average Variance FINE 5 371.79662 74.35932 0.157664 COARSE 5 374.72937 74.94587 0.909849 MIX 5 374.13236 74.82647 0.967672
0 3 221.72211 73.90737 0 0.2 3 221.62974 73.87658 0.013629 0.4 3 224.99412 74.99804 0.115514 0.6 3 225.70377 75.23459 0.345379 0.8 3 226.60861 75.5362 0.506926

193
ANOVA Source of Variation SS df MS F P-value F crit
Rows 0.960878 2 0.480439 3.835764 0.067907 4.45897 Columns 7.138722 4 1.78468 14.24867 0.001035 3.837853 Error 1.00202 8 0.125252
Total 9.101619 14
ANOVA: Two-Factor Without Replication (MR @ 250 C) SUMMARY Count Sum Average Variance
FINE 5 14593 2918.6 7517.8 COARSE 5 11846 2369.2 157590.7 MIX 5 12439 2487.8 138983.2 0 3 8442 2814 0 0.2 3 8388 2796 5008 0.4 3 7757 2585.667 88516.33 0.6 3 7504 2501.333 212354.3 0.8 3 6787 2262.333 408456.3 ANOVA
Source of Variation SS df MS F P-value F crit
Rows 835824.9 2 417912.5 5.639416 0.029651 4.45897 Columns 623521.7 4 155880.4 2.10349 0.017213 3.837853 Error 592845.1 8 74105.63
Total 2052192 14
ANOVA: Two-Factor Without Replication MR @ 400 C)
SUMMARY Count Sum Average Variance FINE 5 6974 1394.8 2399.2 COARSE 5 5752 1150.4 28660.8 MIX 5 5731 1146.2 25837.2
0 3 3939 1313 0 0.2 3 3958 1319.333 3894.333 0.4 3 3737 1245.667 22549.33 0.6 3 3596 1198.667 44210.33 0.8 3 3227 1075.667 84561.33 ANOVA
Source of Variation SS df MS F P-value F crit
Rows 202584.9 2 101292.5 7.513878 0.014566 4.45897 Columns 119743.1 4 29935.77 2.220636 0.015653 3.837853 Error 107845.7 8 13480.72
Total 430173.7 14
ANOVA: Two-Factor Without Replication (DRY IDT)
SUMMARY Count Sum Average Variance FINE 5 34.73 6.946 0.13553 COARSE 5 31.34 6.268 0.58662 MIX 5 31.96 6.392 0.48612
0 3 21.57 7.19 0 0.2 3 20.98 6.993333 0.041033 0.4 3 19.67 6.556667 0.209733 0.6 3 18.74 6.246667 0.351433 0.8 3 17.07 5.69 0.3109 ANOVA
Source of Variation SS df MS F P-value F crit
Rows 1.303293 2 0.651647 9.969606 0.006722 4.45897 Columns 4.310173 4 1.077543 16.48544 0.000626 3.837853 Error 0.522907 8 0.065363
Total 6.136373 14

194
ANOVA: Two-Factor Without Replication (WET IDT)
SUMMARY Count Sum Average Variance FINE 5 29.34 5.868 0.13407 COARSE 5 24.65 4.93 0.9836 MIX 5 25.42 5.084 0.88883
0 3 18.09 6.03 0 0.2 3 17.75 5.916667 0.051633 0.4 3 16.29 5.43 0.2425 0.6 3 14.5 4.833333 0.923433 0.8 3 12.78 4.26 0.7167 ANOVA
Source of Variation SS df MS F P-value F crit
Rows 2.53036 2 1.26518 7.563624 0.014317 4.45897 Columns 6.687827 4 1.671957 9.995456 0.003348 3.837853 Error 1.338173 8 0.167272
Total 10.55636 14
ANOVA: Two-Factor Without Replication (HL DRY IDT)
SUMMARY Count Sum Average Variance FINE 5 34.87 6.974 0.14483 COARSE 5 31.41 6.282 0.61312 MIX 5 32.02 6.404 0.48298
0 3 21.66 7.22 0 0.2 3 21.08 7.026667 0.045033 0.4 3 19.63 6.543333 0.236633 0.6 3 18.85 6.283333 0.347733 0.8 3 17.08 5.693333 0.313033 ANOVA
Source of Variation SS df MS F P-value F crit
Rows 1.364413 2 0.682207 10.48635 0.005813 4.45897 Columns 4.443267 4 1.110817 17.0746 0.000554 3.837853 Error 0.520453 8 0.065057
Total 6.328133 14
ANOVA: Two-Factor Without Replication (HL WET IDT)
SUMMARY Count Sum Average Variance FINE 5 30.19 6.038 0.13587 COARSE 5 25.33 5.066 0.97088 MIX 5 26 5.2 0.824
0 3 18.57 6.19 0 0.2 3 18.07 6.023333 0.056933 0.4 3 16.6 5.533333 0.360033 0.6 3 15.02 5.006667 0.901433 0.8 3 13.26 4.42 0.7213 ANOVA
Source of Variation SS df MS F P-value F crit
Rows 2.774973 2 1.387487 8.509404 0.010454 4.45897 Columns 6.418573 4 1.604643 9.841218 0.003519 3.837853 Error 1.304427 8 0.163053
Total 10.49797 14
ANOVA: Two-Factor Without Replication (TSR)
SUMMARY Count Sum Average Variance FINE 5 4.222352 0.84447 0.00014 COARSE 5 3.902208 0.780442 0.004589 MIX 5 3.949925 0.789985 0.004296
0 3 2.515994 0.838665 0 0.2 3 2.537688 0.845896 7.87E-05 0.4 3 2.482141 0.82738 0.000286 0.6 3 2.306672 0.768891 0.005898 0.8 3 2.23199 0.743997 0.005254

195
ANOVA Source of Variation SS df MS F P-value F crit
Rows 0.011932 2 0.005966 4.299191 0.053963 4.45897 Columns 0.024996 4 0.006249 4.502968 0.033728 3.837853 Error 0.011102 8 0.001388
Total 0.04803 14
ANOVA: Two-Factor Without Replication (HL TSR)
SUMMARY Count Sum Average Variance FINE 5 4.327795 0.865559 0.000131 COARSE 5 4.003511 0.800702 0.003618 MIX 5 4.036994 0.807399 0.003432
0 3 2.572022 0.857341 0 0.2 3 2.571169 0.857056 8.11E-05 0.4 3 2.532793 0.844264 0.000775 0.6 3 2.376993 0.792331 0.005477 0.8 3 2.315322 0.771774 0.004874 ANOVA
Source of Variation SS df MS F P-value F crit
Rows 0.012723 2 0.006362 5.251358 0.034948 4.45897 Columns 0.019032 4 0.004758 3.927595 0.047309 3.837853 Error 0.009691 8 0.001211
Total 0.041446 14
ANOVA: Two-Factor Without Replication (RUT DEPTH)
SUMMARY Count Sum Average Variance FINE 5 10.91 2.182 0.76107 COARSE 5 18.43 3.686 3.06933 MIX 5 17.42 3.484 2.46508
0 3 4.95 1.65 7.4E-32 0.2 3 6.59 2.196667 0.267633 0.4 3 8.4 2.8 1.4673 0.6 3 11.68 3.893333 0.650433 0.8 3 15.14 5.046667 2.398433 ANOVA
Source of Variation SS df MS F P-value F crit
Rows 6.663373 2 3.331687 9.177484 0.00849 4.45897 Columns 22.27769 4 5.569423 15.34157 0.000803 3.837853 Error 2.904227 8 0.363028
Total 31.84529 14
ANOVA: Two-Factor Without Replication (RUT RATE)
SUMMARY Count Sum Average Variance FINE 5 3.07 0.614 0.07588 COARSE 5 6.06 1.212 0.70027 MIX 5 5.18 1.036 0.40523
0 3 1.02 0.34 0 0.2 3 1.66 0.553333 0.014233 0.4 3 2.19 0.73 0.0433 0.6 3 4.61 1.536667 0.342033 0.8 3 4.83 1.61 0.3991 ANOVA
Source of Variation SS df MS F P-value F crit
Rows 0.94444 2 0.47222 5.786183 0.027912 4.45897 Columns 4.072627 4 1.018157 12.47563 0.001621 3.837853 Error 0.652893 8 0.081612
Total 5.66996 14

196
ANOVA: Single Factor (STIFFNESS VALUE, FATIGUE)
Groups Count Sum Average Variance VA-SMA 18 40056.83475 2225.379708 181888.8247 20%F-RCA-SMA 22 66840.25825 3038.193557 372561.9872 40%F-RCA-SMA 25 86557.73013 3462.309205 450011.4984 60%F-RCA-SMA 25 87326.04202 3493.041681 435341.0038 80%F-RCA-SMA 24 88999.99221 3708.333009 550716.3524 20%C-RCA-SMA 23 61351.80865 2667.469941 291177.2242 40%C-RCA-SMA 20 59470.67412 2973.533706 396985.2166 60%C-RCA-SMA 20 55625.91753 2781.295877 358835.1713 80%C-RCA-SMA 19 38353.67459 2018.614452 204160.8905 20% M-RCA-SMA 21 60501.41819 2881.019914 351396.1148 40%M-RCA-SMA 25 83820.58384 3352.823354 488981.7118 60%M-RCA-SMA 23 72311.87904 3143.994741 353742.6938 80%M-RCA-SMA 21 56055.80931 2669.324253 345840.6739 ANOVA
Source of Variation SS df MS F P-value F crit
Between Groups 62288739.43 12 5190728.286 13.79345564 2.87642E-22 1.787750706 Within Groups 102734866.4 273 376318.1918