Fatty Acid Metabolic Remodeling During Type 2 Diabetes ... · Fatty Acid Metabolic Remodeling...
13
Fatty Acid Metabolic Remodeling During Type 2 Diabetes Remission After Bariatric Surgery Thomas Grenier-Larouche, 1,2 Anne-Marie Carreau, 1 Alain Geloën, 3 Frédérique Frisch, 1 Laurent Biertho, 2 Simon Marceau, 2 Stéfane Lebel, 2 Frédéric-Simon Hould, 2 Denis Richard, 2 André Tchernof, 2 and André C. Carpentier 1 Diabetes 2017;66:2743–2755 | https://doi.org/10.2337/db17-0414 Hypertrophic remodeling of white adipose tissues is associated with overexposure of lean organs to circulating triglycerides (TGs) and nonesterified fatty acids (NEFAs), ultimately leading to insulin resistance. Bariatric surgery promotes type 2 diabetes (T2D) remission through a succession of weight loss–dependent and –independent mechanisms. However, the longitudinal contribution of adipocyte size reduction and fatty acid metabolic handling remain unknown. Here we show that severely obese par- ticipants with T2D display hypertriglyceridemia and exces- sive systemic lipolysis during intravenous lipid overload. Three days after biliopancreatic diversion with duodenal switch (DS), whole-body glycerol turnover was normalized and associated with lower HOMA–insulin resistance index. A mean excess weight loss of 84% was achieved 12 months after DS. The smaller subcutaneous adipocyte size pre- dicted better glycemic control in T2D. TG disposal and acyl- carnitine production during lipid overload, along with muscle insulin sensitivity, improved with weight loss. Nevertheless, systemic NEFA fluxes and NEFA spillover remained similar, suggesting that increased NEFA storage capacity per vol- ume of adipose tissue exactly compensated for the de- crease in fat mass during weight loss. In conclusion, T2D remission after DS is mainly associated with greater circu- lating TG disposal, lower systemic lipolysis, and better fatty acid handling by lean tissues. White adipose tissue (WAT) expands through adipocyte hy- pertrophy and hyperplasia (1). Increased fat cell size is linked to WAT dysfunction, characterized by excessive intra- cellular lipolysis, delayed chylomicron clearance, and impaired storage of nonesterified fatty acids (NEFAs) produced by intravascular lipolysis of triglyceride (TG)-rich lipo- proteins. NEFA spillover from adipose tissues toward lean organs contributes to lipotoxicity and insulin resistance, in particular in the heart (2–5). Muscle insulin resistance is also characterized by metabolic inflexibility, described as the incapacity to switch ef ficiently from lipid to glucose oxidation in the postprandial state (6). Medium- and long-chain acyl- carnitines (ACs) are metabolites derived from fatty acid oxidation that cross mitochondrial and plasma membranes to finally reach the systemic circulation. Their plasma levels during fasting and during insulin stimulation have been used as circulating biomarkers of metabolic flexibility in humans (7). Bariatric surgery procedures have been demonstrated to be superior to conventional medical treatment in terms of weight management and glycemic control (8–10). Weight loss induced by bariatric surgeries substantially improves peripheral insulin sensitivity (11), but glucose homeostasis is normalized within the first days after the intervention, before any significant weight loss (8,9,12,13). Several mech- anisms of type 2 diabetes (T2D) remission have been pro- posed, including the effects of caloric restriction (12,14), modifications of gastrointestinal hormone secretion (15,16), changes in bile acid dynamics (17,18), and adaptations of the gut microbiota (19). One hypothesis is that bariatric surgery improves metabolic function in adipose tissue, lead- ing to improved fatty acid metabolism and reduced lean organ lipotoxicity (20). However, the contribution of this mechanism has, to our knowledge, never been examined longitudinally in response to bariatric surgery. To assess 1 Department of Medicine, Division of Endocrinology, Centre de recherche du CHUS, Université de Sherbrooke, Sherbrooke, Québec, Canada 2 Institut Universitaire de Cardiologie et de Pneumologie de Québec, Université Laval, Québec City, Québec, Canada 3 University of Lyon, CARMEN INSERM U1060, INSA-Lyon, Villeurbanne, France Corresponding author: André C. Carpentier, [email protected]. Received 7 April 2017 and accepted 10 August 2017. This article contains Supplementary Data online at http://diabetes .diabetesjournals.org/lookup/suppl/doi:10.2337/db17-0414/-/DC1. © 2017 by the American Diabetes Association. Readers may use this article as long as the work is properly cited, the use is educational and not for profit, and the work is not altered. More information is available at http://www.diabetesjournals .org/content/license. Diabetes Volume 66, November 2017 2743 METABOLISM
Transcript of Fatty Acid Metabolic Remodeling During Type 2 Diabetes ... · Fatty Acid Metabolic Remodeling...
Fatty Acid Metabolic Remodeling During Type 2 DiabetesRemission After Bariatric SurgeryThomas Grenier-Larouche,1,2 Anne-Marie Carreau,1 Alain Geloën,3 Frédérique Frisch,1 Laurent Biertho,2
Simon Marceau,2 Stéfane Lebel,2 Frédéric-Simon Hould,2 Denis Richard,2 André Tchernof,2 andAndré C. Carpentier1
Diabetes 2017;66:2743–2755 | https://doi.org/10.2337/db17-0414
Hypertrophic remodeling of white adipose tissues isassociated with overexposure of lean organs to circulatingtriglycerides (TGs) and nonesterified fatty acids (NEFAs),ultimately leading to insulin resistance. Bariatric surgerypromotes type 2 diabetes (T2D) remission through asuccession of weight loss–dependent and –independentmechanisms. However, the longitudinal contribution ofadipocyte size reduction and fatty acid metabolic handlingremain unknown. Here we show that severely obese par-ticipants with T2D display hypertriglyceridemia and exces-sive systemic lipolysis during intravenous lipid overload.Three days after biliopancreatic diversion with duodenalswitch (DS), whole-body glycerol turnover was normalizedand associated with lower HOMA–insulin resistance index.Amean excessweight loss of 84%was achieved 12monthsafter DS. The smaller subcutaneous adipocyte size pre-dicted better glycemic control in T2D. TG disposal and acyl-carnitine production during lipid overload, alongwithmuscleinsulin sensitivity, improved with weight loss. Nevertheless,systemic NEFA fluxes and NEFA spillover remained similar,suggesting that increased NEFA storage capacity per vol-ume of adipose tissue exactly compensated for the de-crease in fat mass during weight loss. In conclusion, T2Dremission after DS is mainly associated with greater circu-lating TG disposal, lower systemic lipolysis, and better fattyacid handling by lean tissues.
White adipose tissue (WAT) expands through adipocyte hy-pertrophy and hyperplasia (1). Increased fat cell size islinked to WAT dysfunction, characterized by excessive intra-cellular lipolysis, delayed chylomicron clearance, and impaired
storage of nonesterified fatty acids (NEFAs) producedby intravascular lipolysis of triglyceride (TG)-rich lipo-proteins. NEFA spillover from adipose tissues towardlean organs contributes to lipotoxicity and insulin resistance,in particular in the heart (2–5). Muscle insulin resistance isalso characterized by metabolic inflexibility, described as theincapacity to switch efficiently from lipid to glucose oxidationin the postprandial state (6). Medium- and long-chain acyl-carnitines (ACs) are metabolites derived from fatty acidoxidation that cross mitochondrial and plasma membranesto finally reach the systemic circulation. Their plasma levelsduring fasting and during insulin stimulation have beenused as circulating biomarkers of metabolic flexibility inhumans (7).
Bariatric surgery procedures have been demonstrated tobe superior to conventional medical treatment in terms ofweight management and glycemic control (8–10). Weightloss induced by bariatric surgeries substantially improvesperipheral insulin sensitivity (11), but glucose homeostasisis normalized within the first days after the intervention,before any significant weight loss (8,9,12,13). Several mech-anisms of type 2 diabetes (T2D) remission have been pro-posed, including the effects of caloric restriction (12,14),modifications of gastrointestinal hormone secretion (15,16),changes in bile acid dynamics (17,18), and adaptations ofthe gut microbiota (19). One hypothesis is that bariatricsurgery improves metabolic function in adipose tissue, lead-ing to improved fatty acid metabolism and reduced leanorgan lipotoxicity (20). However, the contribution of thismechanism has, to our knowledge, never been examinedlongitudinally in response to bariatric surgery. To assess
1Department of Medicine, Division of Endocrinology, Centre de recherche duCHUS, Université de Sherbrooke, Sherbrooke, Québec, Canada2Institut Universitaire de Cardiologie et de Pneumologie de Québec, UniversitéLaval, Québec City, Québec, Canada3University of Lyon, CARMEN INSERM U1060, INSA-Lyon, Villeurbanne, France
Corresponding author: André C. Carpentier, [email protected].
Received 7 April 2017 and accepted 10 August 2017.
This article contains Supplementary Data online at http://diabetes.diabetesjournals.org/lookup/suppl/doi:10.2337/db17-0414/-/DC1.
© 2017 by the American Diabetes Association. Readers may use this article aslong as the work is properly cited, the use is educational and not for profit, and thework is not altered. More information is available at http://www.diabetesjournals.org/content/license.
Diabetes Volume 66, November 2017 2743
METABOLISM
the contribution of WAT metabolic function to T2D remis-sion, we measured glucose tolerance, b-cell function, insulinsensitivity, and NEFA and glycerol metabolism in a fastedstate and during a euglycemic-hyperinsulinemic clamp(EHC) without and with i.v. fat loading (HI). PlasmaAC concentrations were quantified as surrogates ofmetabolic flexibility and incomplete fatty acid oxida-tion. Subcutaneous adipocyte size distribution was de-termined.
RESEARCH METHODS AND DESIGN
Study DesignWe selected 17 severely obese participants scheduled forlaparoscopic biliopancreatic diversion with duodenal switch(DS) at the Institut Universitaire de Cardiologie et dePneumologie de Québec (IUCPQ). Twelve patients diag-nosed with T2D according to American Diabetes Asso-ciation guidelines (21) and treated with diet, metformin,or a sulfonylurea, as monotherapy or in combination, andfive metabolically healthy participants (normal fastingglucose, normal glucose tolerance during a 75-g oral glu-cose tolerance test, and TG,1.7 mmol/L) were included inthis study. The protocol was approved by the IUCPQ ethicsreview board. All participants provided written informedconsent. Each subject completed a 6-h stable isotopic tracerinfusion study (2) and a stepwise i.v. glucose tolerancetest (22) on two consecutive days before DS (45 6 8 days),3–4 days after DS, and 3 and 12 months after DS (Supple-mentary Fig. 1). Partial remission of diabetes was de-fined as HbA1c ,6.5% and fasting plasma glucose (FPG)between 5.6 and 6.9 mmol/L. Complete remission wasdefined as FPG,5.6 mmol/L in the absence of active phar-macological treatment, according to American Diabetes Asso-ciation criteria (23). Two patients did not complete themetabolic studies scheduled 12 months after DS because ofpregnancy (n =1) and diagnosis of low-grade breast cancer(n =1) after the 3-month follow-up visit.
Six-Hour Isotopic Tracer Infusion Study (Protocol A)After a 12-h fasting period, body composition was mea-sured by DEXA and bioimpedance; a percutaneous biopsy ofsuperficial subcutaneous WAT was taken (see ADIPOCYTE CELL
SIZING). A primed, continuous i.v. perfusion of [1,1,2,3,3-d5]-glycerol (priming dose, 1.28 mmol/kg fat-free mass [FFM];infusion rate, 0.1 mmol/kg FFM/min) and a continuousperfusion of [U-13C]-palmitate in 25% human albumin (in-fusion rate, 0.0125 mmol/kg FFM/min) were started andmaintained over 6 h. A high dose of insulin (1.2 mIU/kg/min)was perfused 120 min later, and glucose levels were moni-tored every 5 min and a 20% dextrose perfusion adjusted toachieve stable euglycemia (5 mmol/L). The EHC was main-tained over 4 h, and 20% Intralipid (40 mL/h) mixedwith [9,10-3H(N)]-triolein (200 mCi/h) was coinfusedwith a low dose of unfractionated heparin over the last2 h of the EHC (referred to as EHC+HI). Blood sampleswere obtained during the last 30 min of each experimental
condition in order to measure hormone and metabolitelevels and tracer enrichment, and to isolate chylomicron-like particles by ultracentrifugation (24).
Stepwise, Graded i.v. Glucose Perfusion Study (Protocol B)The morning after a 12-h fast, and after a 30-minbaseline period, the glucose perfusion rate was graduallyincreased to 2, 4, and 8 mg/kg/min and maintained for40 min at each step. After these intervals, the 20%dextrose perfusion was adjusted to maintain a steadyhyperglycemic state at 10 mmol/L for 2 h. Serial bloodsamples were obtained during the last 30 min of eachglucose perfusion period.
Laboratory Procedures and AssaysPlasma levels of glucose, insulin, C-peptide, leptin, glucose-dependent insulinotropic peptide, total glucagon-like pep-tide 1, and total and high–molecular weight adiponectinwere quantified, as previously described (12). A colorimetricassay (Cayman Chemical, Ann Arbor, MI) was used to quan-tify b-hydroxybutyrate (b-OHB) plasma levels. Plasma con-centrations and isotopic enrichment of glycerol, palmitate,oleate, and linoleate were determined as previously described(3,24). Chylomicron-like particles were isolated from plasmasamples obtained during the EHC+HI by ultracentrifugation(40,000g, 40 min) (3,24). Total TGs, oleate content, andtritium activity were quantified in order to calculate[9,10-3H(N)]-triolein-specific activity within the TG fraction.NEFAs were isolated from plasma using Oasis solid-phaseextraction columns. Tritium activity in the NEFA fractionwas quantified by liquid scintillation (25). Long-chain ACs andmedium-chain ACs (MCACs) were quantified using a liquidchromatograph coupled to a tandem mass spectrometer(Quattro micro; Waters).
Adipocyte Cell SizingPercutaneous biopsies of adipose tissue (;50 mg) wereobtained under local anesthesia, fixed in collidine-hydrochloride osmium tetroxide solution, and digested in8 M urea solution. Adipocyte diameter was measured with aBeckman Coulter Multisizer 4 (26). The frequency of each celldiameters was calculated and locally weighted scatterplotsmoothing regression was applied to generate a cell sizedistribution.
Surgical ProceduresA standard laparoscopic biliopancreatic diversion with DS wasperformed in all participants, as previously described (27).
CalculationsWhole-body rates of appearance of palmitate (Rapalmitate),total NEFA flux (RaNEFA), and glycerol (Raglycerol) were cal-culated as described (24). Fractional extraction (FE) rateswere obtained by dividing the rate of appearance by theplasma concentration of the tracee. NEFA plasma appear-ance from intravascular lipolysis of exogenous TG-richparticles (i.e., RaNEFA-spillover) was calculated as the productof the whole-body RaNEFA and the ratio of oleate-specific
2744 Fatty Acid Metabolism After Bariatric Surgery Diabetes Volume 66, November 2017
activity in the NEFA and TG pool (28). HOMA of insulinresistance (HOMA-IR) index, peripheral insulin sensitivityindex (Si), and insulin secretion rate (ISR) were calculated aspreviously described (22). Adipose tissue insulin resistanceindex was calculated by multiplying fasting Raglycerol by fast-ing insulin levels (nmol/L). Insulin clearance was calculatedas the ISR divided by the plasma insulin level during thesteady-state hyperglycemic clamp.
Statistical AnalysisNormality of distribution was assessed according to Shapiro-Wilks criteria, and non–normally distributed data were log-transformed before statistical analyses were performed. Theeffects of group, time, and interaction were analyzed bytwo-way ANOVA. Multiple comparisons within the samegroup were performed with the Dunnett post hoc test usingthe presurgical values as the control. The effect of insulin(fasting vs. clamp) and lipid perfusion (clamp vs. clamp + HI)were analyzed by one-way ANOVA.
RESULTS
Weight Loss and Concentrations of Incretin HormonesDuring FastingAnthropometric and metabolic measurements are shown inTable 1. Three months after DS, patients with T2D andnormoglycemic (NG) patients achieved a similar meanexcess weight loss of 37.1% and 35.6%, respectively (Table 1).A reduction in fat mass and FFM was observed duringthis first phase of weight loss. Both groups continued to losefat mass between the 3rd and the 12th months after DS,whereas FFM remained stable (Table 1). A similar excessweight loss of 83.2% and 84.9% was finally observed inpatients with T2D and NG patients 12 months after DS(Table 1).
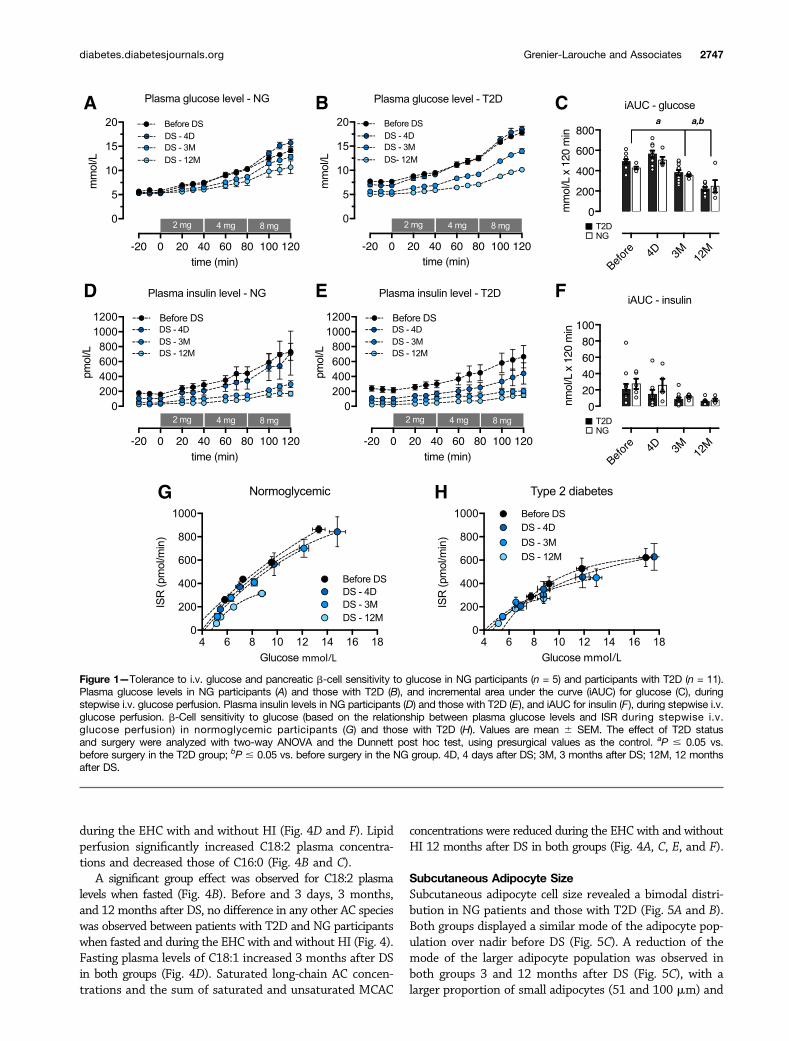
Glucose Homeostasis, Insulin Sensitivity, and b-CellFunctionAntidiabetes medication was discontinued at surgery in allpatients with T2D. Complete diabetes remission (23) wasachieved in 7 of 11 (63.4%) and 8 of 9 (88.9%) patientswith T2D by 3 and 12 months after DS, respectively (Table 1).All other patients achieved partial remission. In patientswith T2D, FPG, insulin, C-peptide, and HOMA-IR decreased3 days after the surgery, followed by further decline to NGlevels 12 months after DS (Table 1). The adipose tissueinsulin resistance index rapidly decreased 3 days after DSin both groups and remained lower than the baseline value3 and 12 months after DS (Table 1). Peripheral insulinsensitivity (Si) did not significantly change 3 days afterDS but increased gradually in both groups up to 12 monthsafter DS (Table 1). Tolerance of i.v. glucose and pancreaticb-cell sensitivity to glucose was assessed during a stepwisei.v. glucose perfusion. Glucose excursion remained similarto baseline values 3 days after DS but gradually declined inboth groups up to 12 months after DS (Fig. 1A–C). Incre-mental area under the glucose curve during i.v. glucoseperfusion also improved in patients with T2D 3 and
12 months, but not 3 days, after DS (Fig. 1C). Plasmainsulin levels were gradually reduced in both groups, but wefound no significant change in incremental area under thecurve for insulin levels (Fig. 1D–F). b-Cell sensitivity to i.v.glucose perfusion, assessed by the relationship betweenISR and glucose levels, did not change in both groupsover the first year after DS (Fig. 1G and H). Dispositionindex (DI) remained lower in participants with T2D thanin NG participants but increased significantly in theformer group 3 and 12 months after DS compared withbefore surgery (Table 1). Insulin clearance, measured dur-ing the steady state of the hyperglycemic clamp, in-creased in T2D, reaching a plateau 3 months after DS(Table 1).
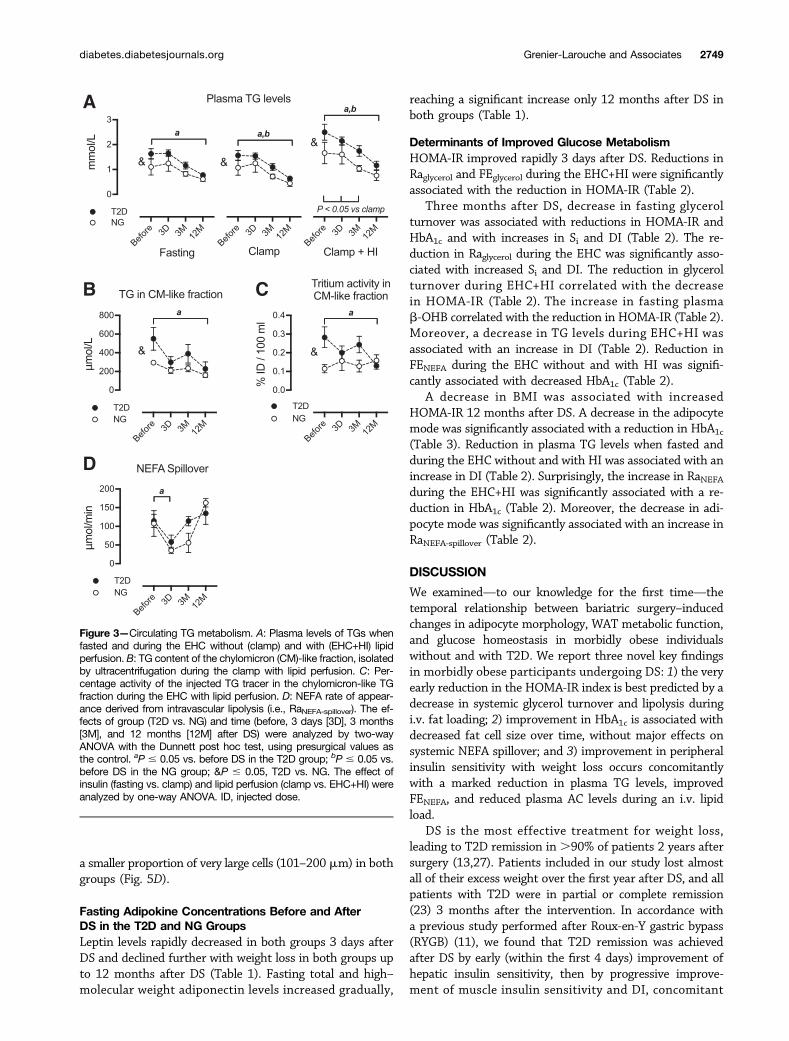
Systemic Lipid FluxesBefore and 3 days, 3 months, and 12 months after DS,no difference was observed between participants with T2Dand NG participants with regard to NEFA and glycerolplasma levels (Fig. 2A and B), rates of appearance (Fig. 2Cand D), and FE (Fig. 2E and F) when fasted and duringthe EHC. Plasma levels of b-OHB, the most abundantketone body, were also similar between groups (Fig. 2G).However, Raglycerol and FE of glycerol (FEglycerol) duringEHC+HI were higher in patients with T2D than in NGpatients before the DS (Fig. 2D and F). This was associatedwith higher plasma TGs (Fig. 3A), chylomicron-like parti-cle TG content (Fig. 3B), and TG radiotracer concentra-tion (Fig. 3C) during EHC+HI in patients with T2D thanin NG patients. RaNEFA-spillover was similar between groups(Fig. 3D).
The high glycerol fluxes observed during the EHC+HI inT2D significantly dropped 3 days after DS and tended tostabilize at these levels 3 and 12 months after DS (Fig. 2Dand E). Surprisingly, RaNEFA (Fig. 2C) did not significantlydrop concomitantly 3 days after DS. However, FE of NEFAs(FENEFA) (Fig. 2E) decreased 3 days after DS in patients withT2D, but during the EHC+HI FENEFA gradually increasedover 12 months toward levels higher than those beforeDS in both patients with T2D and NG patients. Fastingb-OHB rapidly increased 3 days after DS in both groups(Fig. 2G) and remained increased 3 months after DS inpatients with T2D (Fig. 2G). However, b-OHB plasma levelsreturned to preoperative levels 12 months after DS (Fig.2G). Plasma TG concentrations declined in all conditionsstudied and in both groups after DS (Fig. 3A). Twelvemonths after DS, the high chylomicron-like particle TGlevels observed in patients with T2D during the EHC+HIbefore DS decreased to levels found in NG patients (Fig. 3Band C). RaNEFA-spillover decreased significantly 3 days afterDS in patients with T2D but increased to preoperative levels3 and 12 months after DS (Fig. 3D).
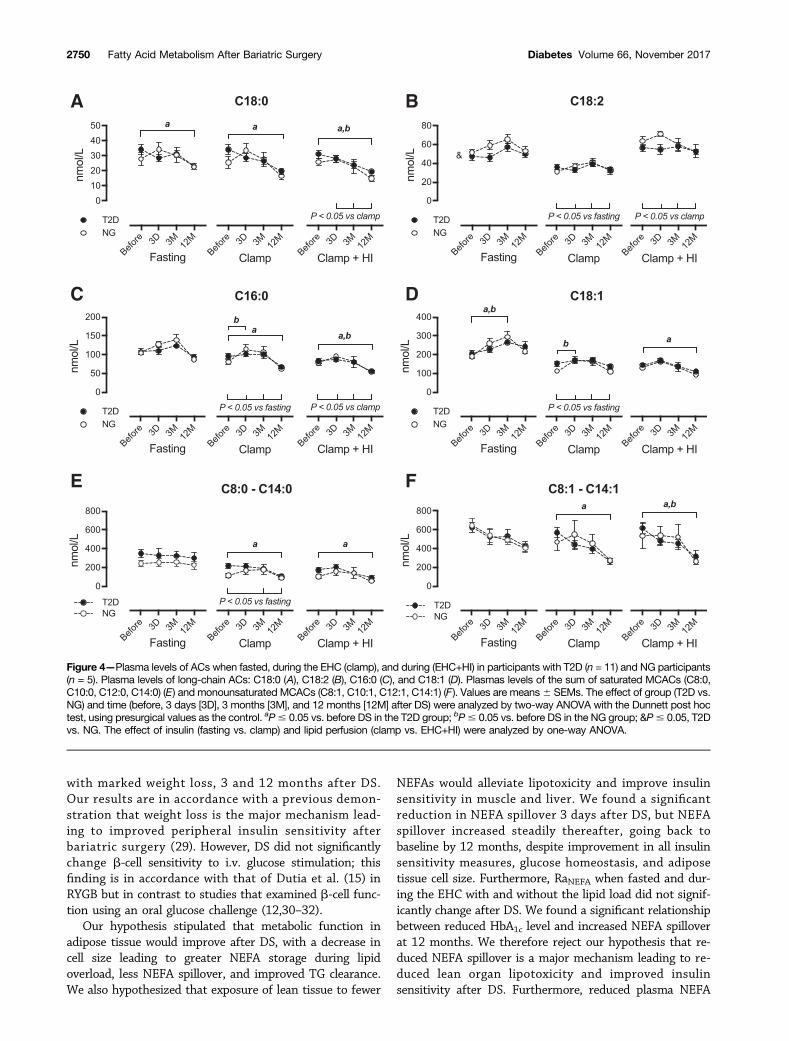
AC ProfileLong-chain AC species (Fig. 4B–D) and saturated MCACspecies (Fig. 4E) were reduced by insulin perfusion. How-ever, C18:0 and unsaturated MCACs remained unchanged
diabetes.diabetesjournals.org Grenier-Larouche and Associates 2745
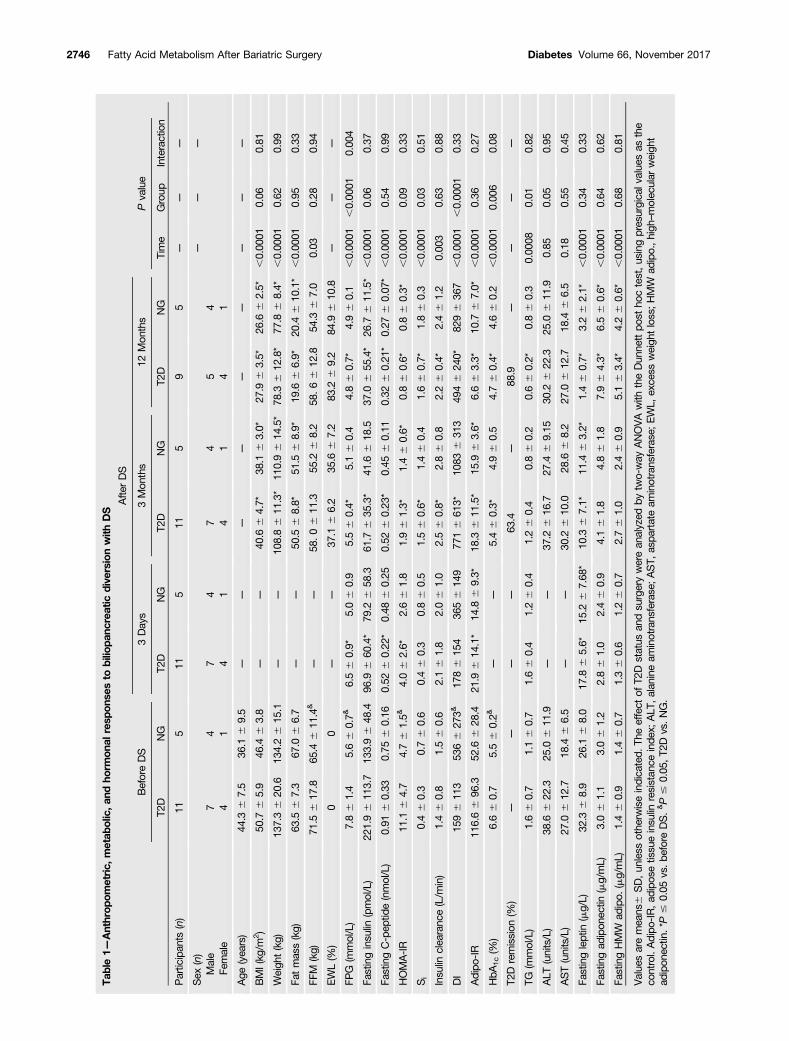
Table1—
Anthrop
ometric,
metab
olic,a
ndho
rmon
alresp
onse
sto
bilio
panc
reatic
dive
rsionwith
DS
BeforeDS
Afte
rDS
Pvalue
3Days
3Mon
ths
12Mon
ths
Time
Group
Interaction
T2D
NG
T2D
NG
T2D
NG
T2D
NG
Partic
ipan
ts(n)
115
115
115
95
——
—
Sex
(n)
——
—
Male
74
74
74
54
Female
41
41
41
41
Age
(yea
rs)
44.3
67.5
36.1
69.5
——
——
——
——
—
BMI(kg
/m2)
50.7
65.9
46.4
63.8
——
40.6
64.7*
38.1
63.0*
27.9
63.5*
26.6
62.5*
,0.00
010.06
0.81
Weigh
t(kg)
137.36
20.6
134.26
15.1
——
108.86
11.3*
110.96
14.5*
78.3
612
.8*
77.8
68.4*
,0.00
010.62
0.99
Fatmass(kg)
63.5
67.3
67.0
66.7
——
50.5
68.8*
51.5
68.9*
19.6
66.9*
20.4
610
.1*
,0.00
010.95
0.33
FFM
(kg)
71.5
617
.865
.46
11.4
&—
—58
.06
11.3
55.2
68.2
58.66
12.8
54.3
67.0
0.03
0.28
0.94
EWL(%
)0
0—
—37
.16
6.2
35.6
67.2
83.2
69.2
84.9
610
.8—
——
FPG
(mmol/L)
7.86
1.4
5.66
0.7&
6.56
0.9*
5.06
0.9
5.56
0.4*
5.16
0.4
4.86
0.7*
4.96
0.1
,0.00
01,0.00
010.00
4
Fastinginsu
lin(pmol/L)
221.96
113.7
133.96
48.4
96.9
660
.4*
79.2
658
.361
.76
35.3*
41.6
618
.537
.06
55.4*
26.7
611
.5*
,0.00
010.06
0.37
FastingC-pep
tide(nmol/L)
0.91
60.33
0.75
60.16
0.52
60.22
*0.48
60.25
0.52
60.23
*0.45
60.11
0.32
60.21
*0.27
60.07
*,0.00
010.54
0.99
HOMA-IR
11.1
64.7
4.76
1.5&
4.06
2.6*
2.66
1.8
1.96
1.3*
1.46
0.6*
0.86
0.6*
0.86
0.3*
,0.00
010.09
0.33
Si
0.46
0.3
0.76
0.6
0.46
0.3
0.86
0.5
1.56
0.6*
1.46
0.4
1.66
0.7*
1.86
0.3
,0.00
010.03
0.51
Insu
linclea
ranc
e(L/m
in)
1.46
0.8
1.56
0.6
2.16
1.8
2.06
1.0
2.56
0.8*
2.86
0.8
2.26
0.4*
2.46
1.2
0.00
30.63
0.88
DI
1596
113
5366
273&
1786
154
3656
149
7716
613*
1083
631
349
46
240*
8296
367
,0.00
01,0.00
010.33
Adipo
-IR
116.66
96.3
52.6
628
.421
.96
14.1*
14.8
69.3*
18.3
611
.5*
15.9
63.6*
6.66
3.3*
10.7
67.0*
,0.00
010.36
0.27
HbA
1c(%
)6.66
0.7
5.56
0.2&
——
5.46
0.3*
4.96
0.5
4.76
0.4*
4.66
0.2
,0.00
010.00
60.08
T2D
remission
(%)
——
——
63.4
—88
.9—
——
—
TG(m
mol/L)
1.66
0.7
1.16
0.7
1.66
0.4
1.26
0.4
1.26
0.4
0.86
0.2
0.66
0.2*
0.86
0.3
0.00
080.01
0.82
ALT
(units/L)
38.6
622
.325
.06
11.9
——
37.2
616
.727
.46
9.15
30.2
622
.325
.06
11.9
0.85
0.05
0.95
AST(units/L)
27.0
612
.718
.46
6.5
——
30.2
610
.028
.66
8.2
27.0
612
.718
.46
6.5
0.18
0.55
0.45
Fastingleptin
(mg/L)
32.3
68.9
26.1
68.0
17.8
65.6*
15.2
67.68
*10
.36
7.1*
11.4
63.2*
1.46
0.7*
3.26
2.1*
,0.00
010.34
0.33
Fastingad
ipon
ectin
(mg/mL)
3.06
1.1
3.06
1.2
2.86
1.0
2.46
0.9
4.16
1.8
4.86
1.8
7.96
4.3*
6.56
0.6*
,0.00
010.64
0.62
FastingHMW
adipo.
(mg/mL)
1.46
0.9
1.46
0.7
1.36
0.6
1.26
0.7
2.76
1.0
2.46
0.9
5.16
3.4*
4.26
0.6*
,0.00
010.68
0.81
Value
saremea
ns6
SD,un
less
othe
rwiseindica
ted.
Theeffect
ofT2
Dstatus
andsu
rgerywerean
alyzed
bytw
o-way
ANOVAwith
theDun
nettpo
stho
ctest,us
ingpresurgica
lvalue
sas
the
control.Adipo
-IR,ad
ipos
etissu
einsu
linresistan
ceinde
x;ALT
,alanine
aminotrans
ferase;A
ST,
aspa
rtateam
inotrans
ferase;EWL,
exce
ssweigh
tloss;HMW
adipo.,high
–molec
ular
weigh
tad
ipon
ectin
.*P
#0.05
vs.b
eforeDS.&P#
0.05
,T2
Dvs.NG.
2746 Fatty Acid Metabolism After Bariatric Surgery Diabetes Volume 66, November 2017
during the EHC with and without HI (Fig. 4D and F). Lipidperfusion significantly increased C18:2 plasma concentra-tions and decreased those of C16:0 (Fig. 4B and C).
A significant group effect was observed for C18:2 plasmalevels when fasted (Fig. 4B). Before and 3 days, 3 months,and 12 months after DS, no difference in any other AC specieswas observed between patients with T2D and NG participantswhen fasted and during the EHC with and without HI (Fig. 4).Fasting plasma levels of C18:1 increased 3 months after DSin both groups (Fig. 4D). Saturated long-chain AC concen-trations and the sum of saturated and unsaturated MCAC
concentrations were reduced during the EHC with and withoutHI 12 months after DS in both groups (Fig. 4A, C, E, and F).
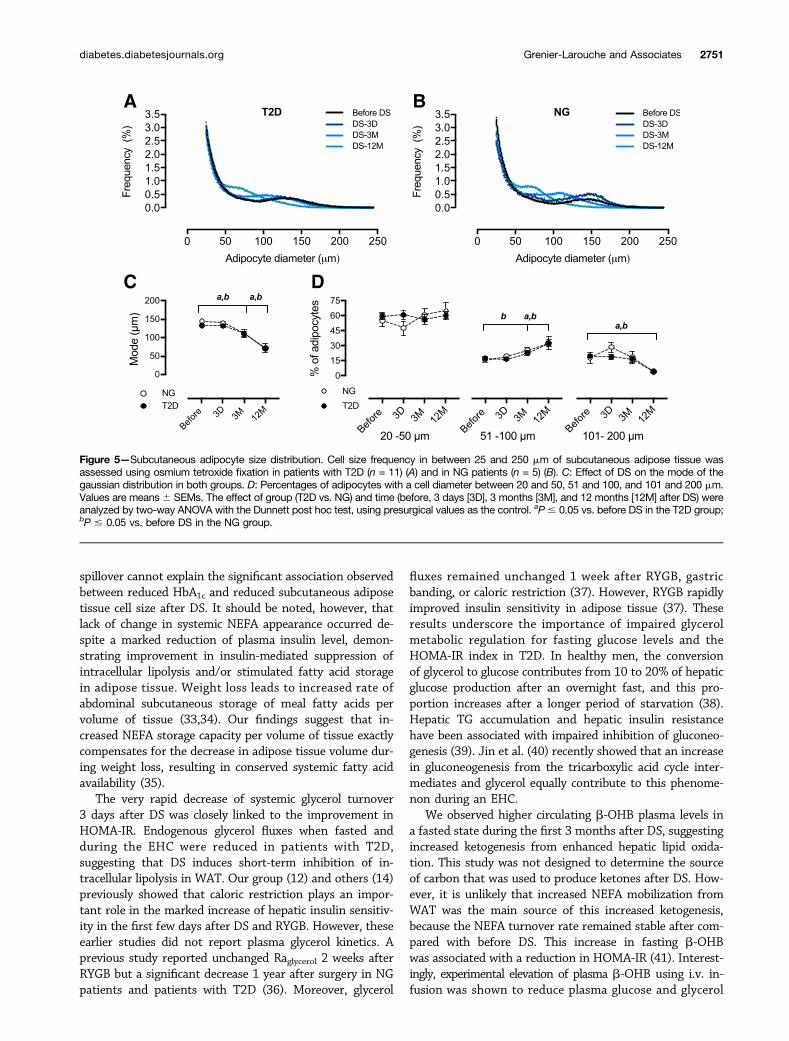
Subcutaneous Adipocyte SizeSubcutaneous adipocyte cell size revealed a bimodal distri-bution in NG patients and those with T2D (Fig. 5A and B).Both groups displayed a similar mode of the adipocyte pop-ulation over nadir before DS (Fig. 5C). A reduction of themode of the larger adipocyte population was observed inboth groups 3 and 12 months after DS (Fig. 5C), with alarger proportion of small adipocytes (51 and 100 mm) and
Figure 1—Tolerance to i.v. glucose and pancreatic b-cell sensitivity to glucose in NG participants (n = 5) and participants with T2D (n = 11).Plasma glucose levels in NG participants (A) and those with T2D (B), and incremental area under the curve (iAUC) for glucose (C), duringstepwise i.v. glucose perfusion. Plasma insulin levels in NG participants (D) and those with T2D (E), and iAUC for insulin (F), during stepwise i.v.glucose perfusion. b-Cell sensitivity to glucose (based on the relationship between plasma glucose levels and ISR during stepwise i.v.glucose perfusion) in normoglycemic participants (G) and those with T2D (H). Values are mean 6 SEM. The effect of T2D statusand surgery were analyzed with two-way ANOVA and the Dunnett post hoc test, using presurgical values as the control. aP # 0.05 vs.before surgery in the T2D group; bP # 0.05 vs. before surgery in the NG group. 4D, 4 days after DS; 3M, 3 months after DS; 12M, 12 monthsafter DS.
diabetes.diabetesjournals.org Grenier-Larouche and Associates 2747
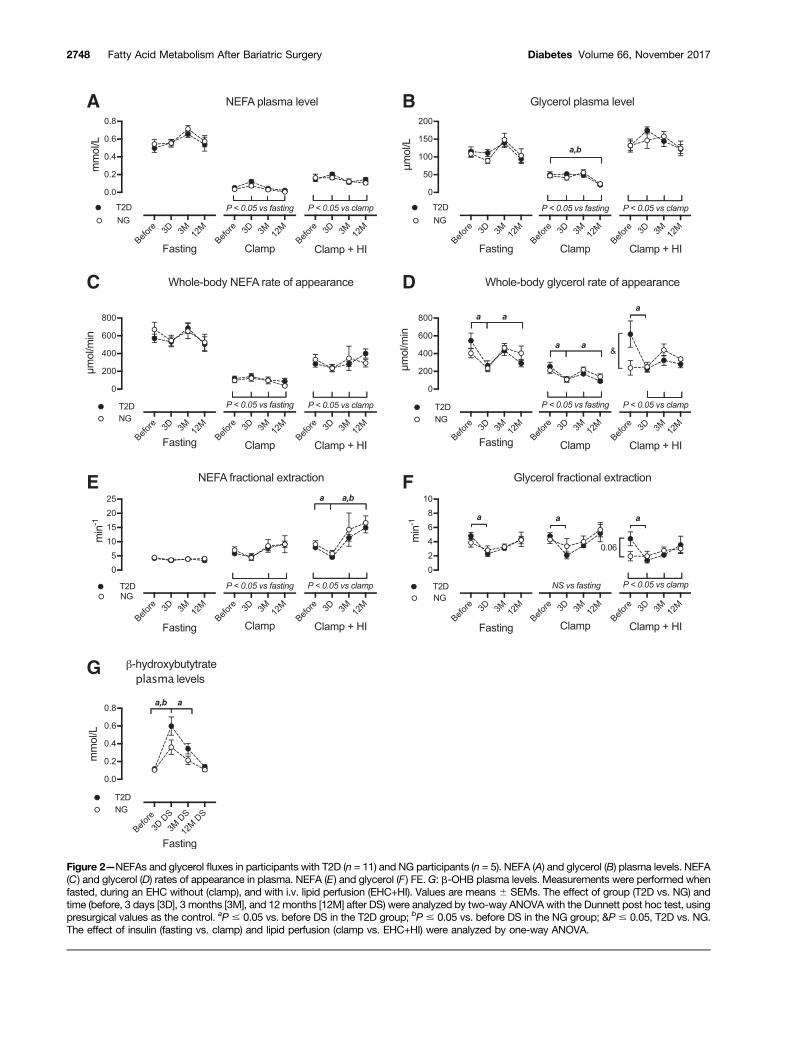
Figure 2—NEFAs and glycerol fluxes in participants with T2D (n = 11) and NG participants (n = 5). NEFA (A) and glycerol (B) plasma levels. NEFA(C) and glycerol (D) rates of appearance in plasma. NEFA (E) and glycerol (F) FE.G: b-OHB plasma levels. Measurements were performed whenfasted, during an EHC without (clamp), and with i.v. lipid perfusion (EHC+HI). Values are means 6 SEMs. The effect of group (T2D vs. NG) andtime (before, 3 days [3D], 3 months [3M], and 12 months [12M] after DS) were analyzed by two-way ANOVA with the Dunnett post hoc test, usingpresurgical values as the control. aP # 0.05 vs. before DS in the T2D group; bP # 0.05 vs. before DS in the NG group; &P # 0.05, T2D vs. NG.The effect of insulin (fasting vs. clamp) and lipid perfusion (clamp vs. EHC+HI) were analyzed by one-way ANOVA.
2748 Fatty Acid Metabolism After Bariatric Surgery Diabetes Volume 66, November 2017
a smaller proportion of very large cells (101–200 mm) in bothgroups (Fig. 5D).
Fasting Adipokine Concentrations Before and AfterDS in the T2D and NG GroupsLeptin levels rapidly decreased in both groups 3 days afterDS and declined further with weight loss in both groups upto 12 months after DS (Table 1). Fasting total and high–molecular weight adiponectin levels increased gradually,
reaching a significant increase only 12 months after DS inboth groups (Table 1).
Determinants of Improved Glucose MetabolismHOMA-IR improved rapidly 3 days after DS. Reductions inRaglycerol and FEglycerol during the EHC+HI were significantlyassociated with the reduction in HOMA-IR (Table 2).
Three months after DS, decrease in fasting glycerolturnover was associated with reductions in HOMA-IR andHbA1c and with increases in Si and DI (Table 2). The re-duction in Raglycerol during the EHC was significantly asso-ciated with increased Si and DI. The reduction in glycerolturnover during EHC+HI correlated with the decreasein HOMA-IR (Table 2). The increase in fasting plasmab-OHB correlated with the reduction in HOMA-IR (Table 2).Moreover, a decrease in TG levels during EHC+HI wasassociated with an increase in DI (Table 2). Reduction inFENEFA during the EHC without and with HI was signifi-cantly associated with decreased HbA1c (Table 2).
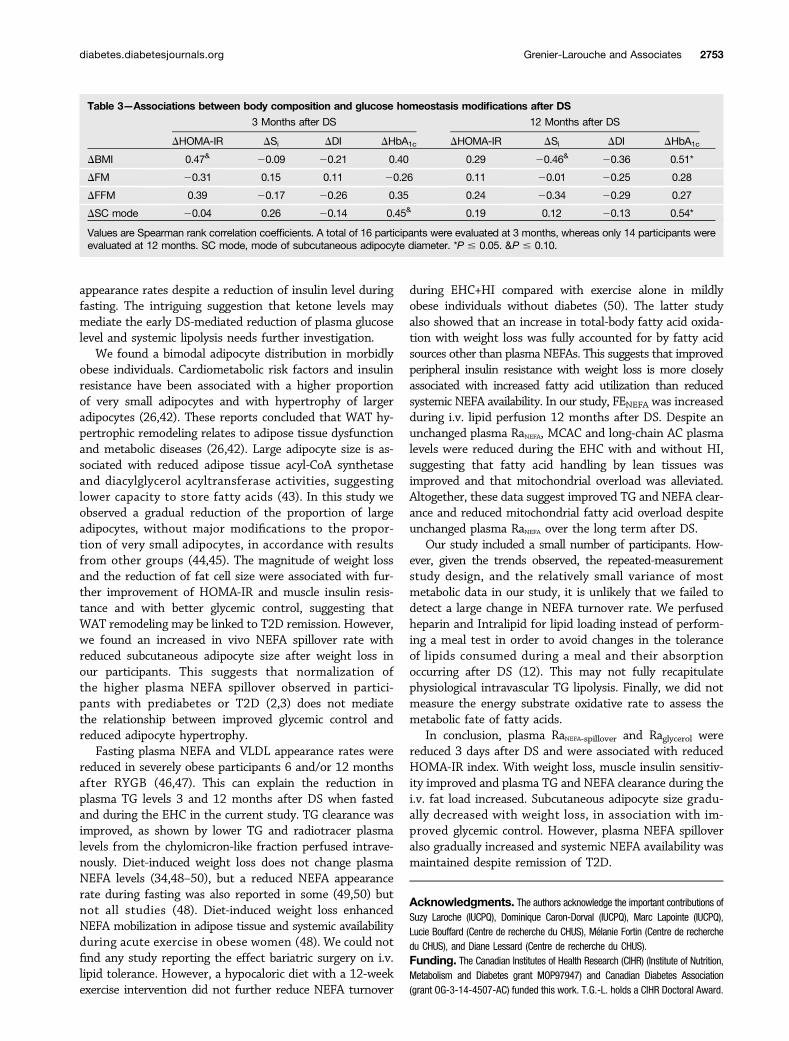
A decrease in BMI was associated with increasedHOMA-IR 12 months after DS. A decrease in the adipocytemode was significantly associated with a reduction in HbA1c(Table 3). Reduction in plasma TG levels when fasted andduring the EHC without and with HI was associated with anincrease in DI (Table 2). Surprisingly, the increase in RaNEFAduring the EHC+HI was significantly associated with a re-duction in HbA1c (Table 2). Moreover, the decrease in adi-pocyte mode was significantly associated with an increase inRaNEFA-spillover (Table 2).
DISCUSSION
We examined—to our knowledge for the first time—thetemporal relationship between bariatric surgery–inducedchanges in adipocyte morphology, WAT metabolic function,and glucose homeostasis in morbidly obese individualswithout and with T2D. We report three novel key findingsin morbidly obese participants undergoing DS: 1) the veryearly reduction in the HOMA-IR index is best predicted by adecrease in systemic glycerol turnover and lipolysis duringi.v. fat loading; 2) improvement in HbA1c is associated withdecreased fat cell size over time, without major effects onsystemic NEFA spillover; and 3) improvement in peripheralinsulin sensitivity with weight loss occurs concomitantlywith a marked reduction in plasma TG levels, improvedFENEFA, and reduced plasma AC levels during an i.v. lipidload.
DS is the most effective treatment for weight loss,leading to T2D remission in.90% of patients 2 years aftersurgery (13,27). Patients included in our study lost almostall of their excess weight over the first year after DS, and allpatients with T2D were in partial or complete remission(23) 3 months after the intervention. In accordance witha previous study performed after Roux-en-Y gastric bypass(RYGB) (11), we found that T2D remission was achievedafter DS by early (within the first 4 days) improvement ofhepatic insulin sensitivity, then by progressive improve-ment of muscle insulin sensitivity and DI, concomitant
Figure 3—Circulating TG metabolism. A: Plasma levels of TGs whenfasted and during the EHC without (clamp) and with (EHC+HI) lipidperfusion. B: TG content of the chylomicron (CM)-like fraction, isolatedby ultracentrifugation during the clamp with lipid perfusion. C: Per-centage activity of the injected TG tracer in the chylomicron-like TGfraction during the EHC with lipid perfusion. D: NEFA rate of appear-ance derived from intravascular lipolysis (i.e., RaNEFA-spillover). The ef-fects of group (T2D vs. NG) and time (before, 3 days [3D], 3 months[3M], and 12 months [12M] after DS) were analyzed by two-wayANOVA with the Dunnett post hoc test, using presurgical values asthe control. aP # 0.05 vs. before DS in the T2D group; bP # 0.05 vs.before DS in the NG group; &P # 0.05, T2D vs. NG. The effect ofinsulin (fasting vs. clamp) and lipid perfusion (clamp vs. EHC+HI) wereanalyzed by one-way ANOVA. ID, injected dose.
diabetes.diabetesjournals.org Grenier-Larouche and Associates 2749
with marked weight loss, 3 and 12 months after DS.Our results are in accordance with a previous demon-stration that weight loss is the major mechanism lead-ing to improved peripheral insulin sensitivity afterbariatric surgery (29). However, DS did not significantlychange b-cell sensitivity to i.v. glucose stimulation; thisfinding is in accordance with that of Dutia et al. (15) inRYGB but in contrast to studies that examined b-cell func-tion using an oral glucose challenge (12,30–32).
Our hypothesis stipulated that metabolic function inadipose tissue would improve after DS, with a decrease incell size leading to greater NEFA storage during lipidoverload, less NEFA spillover, and improved TG clearance.We also hypothesized that exposure of lean tissue to fewer
NEFAs would alleviate lipotoxicity and improve insulinsensitivity in muscle and liver. We found a significantreduction in NEFA spillover 3 days after DS, but NEFAspillover increased steadily thereafter, going back tobaseline by 12 months, despite improvement in all insulinsensitivity measures, glucose homeostasis, and adiposetissue cell size. Furthermore, RaNEFA when fasted and dur-ing the EHC with and without the lipid load did not signif-icantly change after DS. We found a significant relationshipbetween reduced HbA1c level and increased NEFA spilloverat 12 months. We therefore reject our hypothesis that re-duced NEFA spillover is a major mechanism leading to re-duced lean organ lipotoxicity and improved insulinsensitivity after DS. Furthermore, reduced plasma NEFA
Figure 4—Plasma levels of ACs when fasted, during the EHC (clamp), and during (EHC+HI) in participants with T2D (n = 11) and NG participants(n = 5). Plasma levels of long-chain ACs: C18:0 (A), C18:2 (B), C16:0 (C), and C18:1 (D). Plasmas levels of the sum of saturated MCACs (C8:0,C10:0, C12:0, C14:0) (E) and monounsaturated MCACs (C8:1, C10:1, C12:1, C14:1) (F). Values are means6 SEMs. The effect of group (T2D vs.NG) and time (before, 3 days [3D], 3 months [3M], and 12 months [12M] after DS) were analyzed by two-way ANOVA with the Dunnett post hoctest, using presurgical values as the control. aP# 0.05 vs. before DS in the T2D group; bP# 0.05 vs. before DS in the NG group; &P# 0.05, T2Dvs. NG. The effect of insulin (fasting vs. clamp) and lipid perfusion (clamp vs. EHC+HI) were analyzed by one-way ANOVA.
2750 Fatty Acid Metabolism After Bariatric Surgery Diabetes Volume 66, November 2017
spillover cannot explain the significant association observedbetween reduced HbA1c and reduced subcutaneous adiposetissue cell size after DS. It should be noted, however, thatlack of change in systemic NEFA appearance occurred de-spite a marked reduction of plasma insulin level, demon-strating improvement in insulin-mediated suppression ofintracellular lipolysis and/or stimulated fatty acid storagein adipose tissue. Weight loss leads to increased rate ofabdominal subcutaneous storage of meal fatty acids pervolume of tissue (33,34). Our findings suggest that in-creased NEFA storage capacity per volume of tissue exactlycompensates for the decrease in adipose tissue volume dur-ing weight loss, resulting in conserved systemic fatty acidavailability (35).
The very rapid decrease of systemic glycerol turnover3 days after DS was closely linked to the improvement inHOMA-IR. Endogenous glycerol fluxes when fasted andduring the EHC were reduced in patients with T2D,suggesting that DS induces short-term inhibition of in-tracellular lipolysis in WAT. Our group (12) and others (14)previously showed that caloric restriction plays an impor-tant role in the marked increase of hepatic insulin sensitiv-ity in the first few days after DS and RYGB. However, theseearlier studies did not report plasma glycerol kinetics. Aprevious study reported unchanged Raglycerol 2 weeks afterRYGB but a significant decrease 1 year after surgery in NGpatients and patients with T2D (36). Moreover, glycerol
fluxes remained unchanged 1 week after RYGB, gastricbanding, or caloric restriction (37). However, RYGB rapidlyimproved insulin sensitivity in adipose tissue (37). Theseresults underscore the importance of impaired glycerolmetabolic regulation for fasting glucose levels and theHOMA-IR index in T2D. In healthy men, the conversionof glycerol to glucose contributes from 10 to 20% of hepaticglucose production after an overnight fast, and this pro-portion increases after a longer period of starvation (38).Hepatic TG accumulation and hepatic insulin resistancehave been associated with impaired inhibition of gluconeo-genesis (39). Jin et al. (40) recently showed that an increasein gluconeogenesis from the tricarboxylic acid cycle inter-mediates and glycerol equally contribute to this phenome-non during an EHC.
We observed higher circulating b-OHB plasma levels ina fasted state during the first 3 months after DS, suggestingincreased ketogenesis from enhanced hepatic lipid oxida-tion. This study was not designed to determine the sourceof carbon that was used to produce ketones after DS. How-ever, it is unlikely that increased NEFA mobilization fromWAT was the main source of this increased ketogenesis,because the NEFA turnover rate remained stable after com-pared with before DS. This increase in fasting b-OHBwas associated with a reduction in HOMA-IR (41). Interest-ingly, experimental elevation of plasma b-OHB using i.v. in-fusion was shown to reduce plasma glucose and glycerol
Figure 5—Subcutaneous adipocyte size distribution. Cell size frequency in between 25 and 250 mm of subcutaneous adipose tissue wasassessed using osmium tetroxide fixation in patients with T2D (n = 11) (A) and in NG patients (n = 5) (B). C: Effect of DS on the mode of thegaussian distribution in both groups. D: Percentages of adipocytes with a cell diameter between 20 and 50, 51 and 100, and 101 and 200 mm.Values are means6 SEMs. The effect of group (T2D vs. NG) and time (before, 3 days [3D], 3 months [3M], and 12 months [12M] after DS) wereanalyzed by two-way ANOVA with the Dunnett post hoc test, using presurgical values as the control. aP# 0.05 vs. before DS in the T2D group;bP # 0.05 vs. before DS in the NG group.
diabetes.diabetesjournals.org Grenier-Larouche and Associates 2751
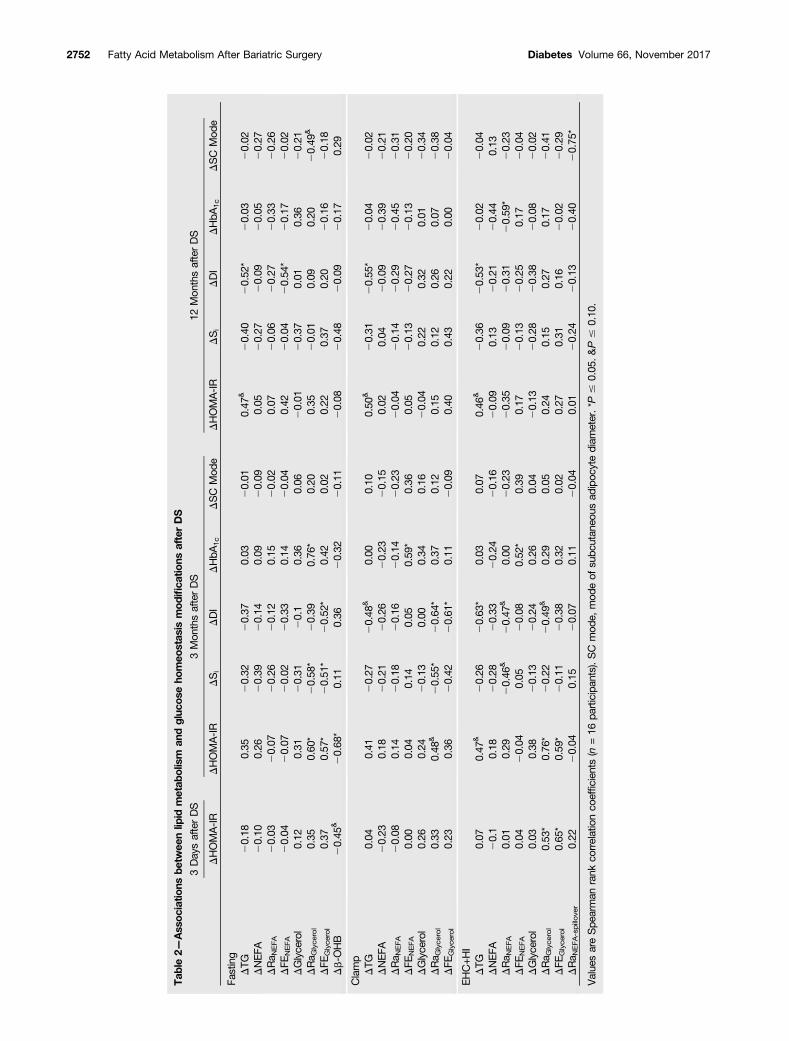
Table2—
Ass
ociatio
nsbe
twee
nlip
idmetab
olism
andgluc
oseho
meo
stas
ismodifica
tions
afterDS
3DaysafterDS
3Mon
thsafterDS
12Mon
thsafterDS
DHOMA-IR
DHOMA-IR
DSi
DDI
DHbA
1c
DSC
Mod
eDHOMA-IR
DSi
DDI
DHbA
1c
DSC
Mod
e
Fasting
DTG
20.18
0.35
20.32
20.37
0.03
20.01
0.47
&20.40
20.52
*20.03
20.02
DNEFA
20.10
0.26
20.39
20.14
0.09
20.09
0.05
20.27
20.09
20.05
20.27
DRa N
EFA
20.03
20.07
20.26
20.12
0.15
20.02
0.07
20.06
20.27
20.33
20.26
DFE
NEFA
20.04
20.07
20.02
20.33
0.14
20.04
0.42
20.04
20.54
*20.17
20.02
DGlyce
rol
0.12
0.31
20.31
20.1
0.36
0.06
20.01
20.37
0.01
0.36
20.21
DRa G
lyce
rol
0.35
0.60
*20.58
*20.39
0.76
*0.20
0.35
20.01
0.09
0.20
20.49
&
DFE
Glyce
rol
0.37
0.57
*20.51
*20.52
*0.42
0.02
0.22
0.37
0.20
20.16
20.18
Db-O
HB
20.45
&20.68
*0.11
0.36
20.32
20.11
20.08
20.48
20.09
20.17
0.29
Clamp
DTG
0.04
0.41
20.27
20.48
&0.00
0.10
0.50
&20.31
20.55
*20.04
20.02
DNEFA
20.23
0.18
20.21
20.26
20.23
20.15
0.02
0.04
20.09
20.39
20.21
DRa N
EFA
20.08
0.14
20.18
20.16
20.14
20.23
20.04
20.14
20.29
20.45
20.31
DFE
NEFA
0.00
0.04
0.14
0.05
0.59
*0.36
0.05
20.13
20.27
20.13
20.20
DGlyce
rol
0.26
0.24
20.13
0.00
0.34
0.16
20.04
0.22
0.32
0.01
20.34
DRa G
lyce
rol
0.33
0.48
&20.55
*20.64
*0.37
0.12
0.15
0.12
0.26
0.07
20.38
DFE
Glyce
rol
0.23
0.36
20.42
20.61
*0.11
20.09
0.40
0.43
0.22
0.00
20.04
EHC+H
IDTG
0.07
0.47
&20.26
20.63
*0.03
0.07
0.46
&20.36
20.53
*20.02
20.04
DNEFA
20.1
0.18
20.28
20.33
20.24
20.16
20.09
0.13
20.21
20.44
0.13
DRa N
EFA
0.01
0.29
20.46
&20.47
&0.00
20.23
20.35
20.09
20.31
20.59
*20.23
DFE
NEFA
0.04
20.04
0.05
20.08
0.52
*0.39
0.17
20.13
20.25
0.17
20.04
DGlyce
rol
0.03
0.38
20.13
20.24
0.26
0.04
20.13
20.28
20.38
20.08
20.02
DRa G
lyce
rol
0.53
*0.76
*20.22
20.49
&0.29
0.05
0.24
0.15
0.27
0.17
20.41
DFE
Glyce
rol
0.65
*0.59
*20.11
20.38
0.32
0.02
0.27
0.31
0.16
20.02
20.29
DRa N
EFA-spillover
0.22
20.04
0.15
20.07
0.11
20.04
0.01
20.24
20.13
20.40
20.75
*
Value
sareSpe
arman
rank
correlationco
efficien
ts(n
=16
participan
ts).SC
mod
e,mod
eof
subc
utan
eous
adipoc
ytediam
eter.*P
#0.05
.&P#
0.10
.
2752 Fatty Acid Metabolism After Bariatric Surgery Diabetes Volume 66, November 2017
appearance rates despite a reduction of insulin level duringfasting. The intriguing suggestion that ketone levels maymediate the early DS-mediated reduction of plasma glucoselevel and systemic lipolysis needs further investigation.
We found a bimodal adipocyte distribution in morbidlyobese individuals. Cardiometabolic risk factors and insulinresistance have been associated with a higher proportionof very small adipocytes and with hypertrophy of largeradipocytes (26,42). These reports concluded that WAT hy-pertrophic remodeling relates to adipose tissue dysfunctionand metabolic diseases (26,42). Large adipocyte size is as-sociated with reduced adipose tissue acyl-CoA synthetaseand diacylglycerol acyltransferase activities, suggestinglower capacity to store fatty acids (43). In this study weobserved a gradual reduction of the proportion of largeadipocytes, without major modifications to the propor-tion of very small adipocytes, in accordance with resultsfrom other groups (44,45). The magnitude of weight lossand the reduction of fat cell size were associated with fur-ther improvement of HOMA-IR and muscle insulin resis-tance and with better glycemic control, suggesting thatWAT remodeling may be linked to T2D remission. However,we found an increased in vivo NEFA spillover rate withreduced subcutaneous adipocyte size after weight loss inour participants. This suggests that normalization ofthe higher plasma NEFA spillover observed in partici-pants with prediabetes or T2D (2,3) does not mediatethe relationship between improved glycemic control andreduced adipocyte hypertrophy.
Fasting plasma NEFA and VLDL appearance rates werereduced in severely obese participants 6 and/or 12 monthsafter RYGB (46,47). This can explain the reduction inplasma TG levels 3 and 12 months after DS when fastedand during the EHC in the current study. TG clearance wasimproved, as shown by lower TG and radiotracer plasmalevels from the chylomicron-like fraction perfused intrave-nously. Diet-induced weight loss does not change plasmaNEFA levels (34,48–50), but a reduced NEFA appearancerate during fasting was also reported in some (49,50) butnot all studies (48). Diet-induced weight loss enhancedNEFA mobilization in adipose tissue and systemic availabilityduring acute exercise in obese women (48). We could notfind any study reporting the effect bariatric surgery on i.v.lipid tolerance. However, a hypocaloric diet with a 12-weekexercise intervention did not further reduce NEFA turnover
during EHC+HI compared with exercise alone in mildlyobese individuals without diabetes (50). The latter studyalso showed that an increase in total-body fatty acid oxida-tion with weight loss was fully accounted for by fatty acidsources other than plasma NEFAs. This suggests that improvedperipheral insulin resistance with weight loss is more closelyassociated with increased fatty acid utilization than reducedsystemic NEFA availability. In our study, FENEFA was increasedduring i.v. lipid perfusion 12 months after DS. Despite anunchanged plasma RaNEFA, MCAC and long-chain AC plasmalevels were reduced during the EHC with and without HI,suggesting that fatty acid handling by lean tissues wasimproved and that mitochondrial overload was alleviated.Altogether, these data suggest improved TG and NEFA clear-ance and reduced mitochondrial fatty acid overload despiteunchanged plasma RaNEFA over the long term after DS.
Our study included a small number of participants. How-ever, given the trends observed, the repeated-measurementstudy design, and the relatively small variance of mostmetabolic data in our study, it is unlikely that we failed todetect a large change in NEFA turnover rate. We perfusedheparin and Intralipid for lipid loading instead of perform-ing a meal test in order to avoid changes in the toleranceof lipids consumed during a meal and their absorptionoccurring after DS (12). This may not fully recapitulatephysiological intravascular TG lipolysis. Finally, we did notmeasure the energy substrate oxidative rate to assess themetabolic fate of fatty acids.
In conclusion, plasma RaNEFA-spillover and Raglycerol werereduced 3 days after DS and were associated with reducedHOMA-IR index. With weight loss, muscle insulin sensitiv-ity improved and plasma TG and NEFA clearance during thei.v. fat load increased. Subcutaneous adipocyte size gradu-ally decreased with weight loss, in association with im-proved glycemic control. However, plasma NEFA spilloveralso gradually increased and systemic NEFA availability wasmaintained despite remission of T2D.
Acknowledgments. The authors acknowledge the important contributions ofSuzy Laroche (IUCPQ), Dominique Caron-Dorval (IUCPQ), Marc Lapointe (IUCPQ),Lucie Bouffard (Centre de recherche du CHUS), Mélanie Fortin (Centre de recherchedu CHUS), and Diane Lessard (Centre de recherche du CHUS).Funding. The Canadian Institutes of Health Research (CIHR) (Institute of Nutrition,Metabolism and Diabetes grant MOP97947) and Canadian Diabetes Association(grant OG-3-14-4507-AC) funded this work. T.G.-L. holds a CIHR Doctoral Award.
Table 3—Associations between body composition and glucose homeostasis modifications after DS
3 Months after DS 12 Months after DS
DHOMA-IR DSi DDI DHbA1c DHOMA-IR DSi DDI DHbA1c
DBMI 0.47& 20.09 20.21 0.40 0.29 20.46& 20.36 0.51*
DFM 20.31 0.15 0.11 20.26 0.11 20.01 20.25 0.28
DFFM 0.39 20.17 20.26 0.35 0.24 20.34 20.29 0.27
DSC mode 20.04 0.26 20.14 0.45& 0.19 0.12 20.13 0.54*
Values are Spearman rank correlation coefficients. A total of 16 participants were evaluated at 3 months, whereas only 14 participants wereevaluated at 12 months. SC mode, mode of subcutaneous adipocyte diameter. *P # 0.05. &P # 0.10.
diabetes.diabetesjournals.org Grenier-Larouche and Associates 2753
A.-M.C. received awards from the Fonds de recherche du Québec - Santé/Ministèrede la santé et des services sociaux (FRQS/MSSS), Canadian Diabetes Association,and Endocrine Fellow Foundation.Duality of Interest. L.B. and A.T. have received funding from Johnson &Johnson Medical Companies for research on bariatric surgery. D.R. has received theCIHR-Merck Frosst Research Chair on Obesity. A.C.C. has received the GSK Chair inDiabetes of the Université de Sherbrooke. No other potential conflicts of interestrelevant to this article were reported.Author Contributions. T.G.-L. performed all the metabolic studies, collectedand analyzed data, and wrote the manuscript. A.-M.C. performed metabolic studiesand critically reviewed the manuscript. A.G. performed cell-sizing experiments andcritically reviewed the manuscript. F.F. collected data, provided expertise on sampleanalysis, and critically reviewed the manuscript. L.B., S.M., S.L., and F.-S.H.managed medical issues; performed DS, percutaneous adipose tissues biopsies, andpostoperative follow-up; and critically reviewed the manuscript. D.R., A.T., and A.C.C.designed the study and critically reviewed the manuscript. A.C.C. is the guarantor ofthis work and, as such, had full access to all the data in the study and takesresponsibility for the integrity of the data and the accuracy of the data analysis.
References1. Tchernof A, Després J-P. Pathophysiology of human visceral obesity: an up-date. Physiol Rev 2013;93:359–4042. Brassard P, Frisch F, Lavoie F, et al. Impaired plasma nonesterified fatty acidtolerance is an early defect in the natural history of type 2 diabetes. J Clin EndocrinolMetab 2008;93:837–8443. Normand-Lauzière F, Frisch F, Labbé SM, et al. Increased postprandial non-esterified fatty acid appearance and oxidation in type 2 diabetes is not fully estab-lished in offspring of diabetic subjects. PLoS One 2010;5:e10956.4. Kunach M, Noll C, Phoenix S, et al. Effect of sex and impaired glucose toleranceon organ-specific dietary fatty acid metabolism in humans. Diabetes 2015;64:2432–24415. Jensen MD, Sarr MG, Dumesic DA, Southorn PA, Levine JA. Regional uptake ofmeal fatty acids in humans. Am J Physiol Endocrinol Metab 2003;285:E1282–E12886. Muoio DM. Metabolic inflexibility: when mitochondrial indecision leads tometabolic gridlock. Cell 2014;159:1253–12627. Consitt LA, Koves TR, Muoio DM, Nakazawa M, Newton CA, Houmard JA.Plasma acylcarnitines during insulin stimulation in humans are reflective of age-related metabolic dysfunction. Biochem Biophys Res Commun 2016;479:868–8748. Carlsson LMS, Peltonen M, Ahlin S, et al. Bariatric surgery and prevention oftype 2 diabetes in Swedish obese subjects. N Engl J Med 2012;367:695–7049. Schauer PR, Bhatt DL, Kirwan JP, et al.; STAMPEDE Investigators. Bariatricsurgery versus intensive medical therapy for diabetes–3-year outcomes. N EnglJ Med 2014;370:2002–201310. Schauer PR, Bhatt DL, Kirwan JP, et al.; STAMPEDE Investigators. Bariatricsurgery versus intensive medical therapy for diabetes - 5-year outcomes. N EnglJ Med 2017;376:641–65111. Bojsen-Møller KN, Dirksen C, Jørgensen NB, et al. Early enhancements ofhepatic and later of peripheral insulin sensitivity combined with increased post-prandial insulin secretion contribute to improved glycemic control after Roux-en-Ygastric bypass. Diabetes 2014;63:1725–173712. Plourde C-É, Grenier-Larouche T, Caron-Dorval D, et al. Biliopancreaticdiversion with duodenal switch improves insulin sensitivity and secretion throughcaloric restriction. Obesity (Silver Spring) 2014;22:1838–184613. Mingrone G, Panunzi S, De Gaetano A, et al Bariatric-metabolic surgery versusconventional medical treatment in obese patients with type 2 diabetes: 5 yearfollow-up of an open-label, single-centre, randomised controlled trial. Lancet 2015;386:964–97314. Isbell JM, Tamboli RA, Hansen EN, et al. The importance of caloric restriction inthe early improvements in insulin sensitivity after Roux-en-Y gastric bypass surgery.Diabetes Care 2010;33:1438–144215. Dutia R, Brakoniecki K, Bunker P, et al Limited recovery of b-cell function aftergastric bypass despite clinical diabetes remission. Diabetes 2013;63:1214–1223
16. Holter MM, Dutia R, Stano SM, et al. Glucose metabolism after gastric bandingand gastric bypass in individuals with type 2 diabetes: weight loss effect. DiabetesCare 2017;40:7–1517. Flynn CR, Albaugh VL, Cai S, et al. Bile diversion to the distal small intestinehas comparable metabolic benefits to bariatric surgery. Nat Commun 2015;6:771518. Albaugh VL, Flynn CR, Cai S, Xiao Y, Tamboli RA, Abumrad NN. Early increasesin bile acids post Roux-en-Y Gastric bypass are driven by insulin-sensitizing, sec-ondary bile acids. J Clin Endocrinol Metab 2015;100:E1225–E123319. Tremaroli V, Karlsson F, Werling M, et al. Roux-en-Y gastric bypass and verticalbanded gastroplasty induce long-term changes on the human gut microbiomecontributing to fat mass regulation. Cell Metab 2015;22:228–23820. Carpentier AC, Bourbonnais A, Frisch F, Giacca A, Lewis GF. Plasma non-esterified fatty acid intolerance and hyperglycemia are associated with intravenouslipid-induced impairment of insulin sensitivity and disposition index. J Clin EndocrinolMetab 2010;95:1256–126421. American Diabetes Association. Standards of Medical Care in Diabetes—2017.Diabetes Care 2016;40(Suppl. 1):S1–S13522. Carpentier A, Mittelman SD, Lamarche B, Bergman RN, Giacca A, Lewis GF.Acute enhancement of insulin secretion by FFA in humans is lost with prolonged FFAelevation. Am J Physiol 1999;276:E1055–E106623. Buse JB, Caprio S, Cefalu WT, et al. How do we define cure of diabetes?Diabetes Care 2009;32:2133–213524. Carpentier AC, Frisch F, Cyr D, et al. On the suppression of plasma non-esterified fatty acids by insulin during enhanced intravascular lipolysis in humans.Am J Physiol Endocrinol Metab 2005;289:E849–E85625. Noll C, Kunach M, Frisch F, et al. Seven-day caloric and saturated fat restrictionincreases myocardial dietary fatty acid partitioning in impaired glucose-tolerantsubjects. Diabetes 2015;64:3690–369926. Michaud A, Laforest S, Pelletier M, et al. Abdominal adipocyte populations inwomen with visceral obesity. Eur J Endocrinol 2016;174:227–23927. Marceau P, Biron S, Hould F-S, et al. Duodenal switch: long-term results. ObesSurg 2007;17:1421–143028. Almandoz JP, Singh E, Howell LA, et al. Spillover of fatty acids during dietary fatstorage in type 2 diabetes: relationship to body fat depots and effects of weight loss.Diabetes 2013;62:1897–190329. Bradley D, Conte C, Mittendorfer B, et al. Gastric bypass and banding equallyimprove insulin sensitivity and b cell function. J Clin Invest 2012;122:4667–467430. Dutia R, Brakoniecki K, Bunker P, et al. Limited recovery of b-cell function aftergastric bypass despite clinical diabetes remission. Diabetes 2014;63:1214–122331. Martinussen C, Bojsen-Møller KN, Dirksen C, et al. Immediate enhancement offirst-phase insulin secretion and unchanged glucose effectiveness in patients withtype 2 diabetes after Roux-en-Y gastric bypass. Am J Physiol Endocrinol Metab2015;308:E535–E54432. Salinari S, Bertuzzi A, Asnaghi S, Guidone C, Manco M, Mingrone G. First-phaseinsulin secretion restoration and differential response to glucose load dependingon the route of administration in type 2 diabetic subjects after bariatric surgery.Diabetes Care 2009;32:375–38033. Santosa S, Hensrud DD, Votruba SB, Jensen MD. The influence of sex andobesity phenotype on meal fatty acid metabolism before and after weight loss. AmJ Clin Nutr 2008;88:1134–114134. Labbé SM, Noll C, Grenier-Larouche T, et al. Improved cardiac function anddietary fatty acid metabolism after modest weight loss in subjects with impairedglucose tolerance. Am J Physiol Endocrinol Metab 2014;306:E1388–E139635. Noll C, Carpentier AC. Dietary fatty acid metabolism in prediabetes. Curr OpinLipidol 2017;28:1–1036. Camastra S, Gastaldelli A, Mari A, et al. Early and longer term effects of gastricbypass surgery on tissue-specific insulin sensitivity and beta cell function in morbidlyobese patients with and without type 2 diabetes. Diabetologia 2011;54:2093–210237. Gastaldelli A, Iaconelli A, Gaggini M, et al. Short-term effects of laparoscopicadjustable gastric banding versus Roux-en-Y gastric bypass. Diabetes Care 2016;39:1925–1931
2754 Fatty Acid Metabolism After Bariatric Surgery Diabetes Volume 66, November 2017
38. Baba H, Zhang XJ, Wolfe RR. Glycerol gluconeogenesis in fasting humans.Nutrition 1995;11:149–15339. Jin ES, Szuszkiewicz-Garcia M, Browning JD, Baxter JD, Abate N, Malloy CR.Influence of liver triglycerides on suppression of glucose production by insulin inmen. J Clin Endocrinol Metab 2015;100:235–24340. Jin ES, Sherry AD, Malloy CR. An oral load of [13C3]glycerol and blood NMRanalysis detect fatty acid esterification, pentose phosphate pathway, and glycerolmetabolism through the tricarboxylic acid cycle in human liver. J Biol Chem 2016;291:19031–1904141. Mikkelsen KH, Seifert T, Secher NH, Grøndal T, van Hall G. Systemic, cerebraland skeletal muscle ketone body and energy metabolism during acute hyper-D-b-hydroxybutyratemia in post-absorptive healthy males. J Clin Endocrinol Metab2015;100:636–64342. McLaughlin T, Sherman A, Tsao P, et al. Enhanced proportion of small adiposecells in insulin-resistant vs insulin-sensitive obese individuals implicates impairedadipogenesis. Diabetologia 2007;50:1707–171543. Hames KC, Koutsari C, Santosa S, Bush NC, Jensen MD. Adipose tissue fatty acidstorage factors: effects of depot, sex and fat cell size. Int J Obes 2015;39:884–88744. Singh P, Somers VK, Romero-Corral A, et al. Effects of weight gain and weightloss on regional fat distribution. Am J Clin Nutr 2012;96:229–233
45. Ge F, Walewski JL, Torghabeh MH, et al. Facilitated long chain fatty acid uptakeby adipocytes remains upregulated relative to BMI for more than a year after majorbariatric surgical weight loss. Obesity (Silver Spring) 2016;24:113–12246. Klein S, Mittendorfer B, Eagon JC, et al. Gastric bypass surgery improvesmetabolic and hepatic abnormalities associated with nonalcoholic fatty liver disease.Gastroenterology 2006;130:1564–157247. Magkos F, Fabbrini E, McCrea J, Patterson BW, Eagon JC, Klein S. Decrease inhepatic very-low-density lipoprotein-triglyceride secretion after weight loss is in-versely associated with changes in circulating leptin. Diabetes Obes Metab 2010;12:584–59048. Kanaley JA, Cryer PE, Jensen MD. Fatty acid kinetic responses to exercise.Effects of obesity, body fat distribution, and energy-restricted diet. J Clin Invest 1993;92:255–26149. Blaak EE, Wolffenbuttel BH, Saris WH, Pelsers MM, Wagenmakers AJ. Weightreduction and the impaired plasma-derived free fatty acid oxidation in type 2 diabeticsubjects. J Clin Endocrinol Metab 2001;86:1638–164450. Solomon TPJ, Haus JM, Marchetti CM, Stanley WC, Kirwan JP. Effects ofexercise training and diet on lipid kinetics during free fatty acid-induced insulinresistance in older obese humans with impaired glucose tolerance. Am J PhysiolEndocrinol Metab 2009;297:E552–E559
diabetes.diabetesjournals.org Grenier-Larouche and Associates 2755