FARSTAD SHIPPING ASA - Solstad Farstad · Underwriter, Regional Manager Vesta Forsikring AS, Marine...
49
FARSTAD SHIPPING ASA ANNUAL REPORT 1999
Transcript of FARSTAD SHIPPING ASA - Solstad Farstad · Underwriter, Regional Manager Vesta Forsikring AS, Marine...

FA R S TA D S H I P P I N G A S A
A N N U A L R E P O RT 1 9 9 9

2
Farstad Shipping ASA
IThe Board of Directors 4
Report of the Board of Directors 5
Profit and loss account 10
Balance sheet 11
Cash flow statement 12
Notes to the financial statement 13
Auditor’s report 20
II1999 Positive - Negative 22
Organisation and administration 24
Main financial figures 26
Analytical information 28
Shareholder matters 30
Strategy 31
The Market for offshore supply vessels
Fleet structure 32
Brazil 34
Far East / Australia 36
North Sea 38
Other markets 41
Health, Safety and Environment 42
Training - recruitment 45
Fleet gallery 46
The Farstad fleet - employment 47
Glossary 49
Finance calendar
Result for 1. quarter 10. May Annual General Meeting 10. MayPayment to shareholders 29. May Result for 1. halfyear 22. Aug.Result for 3. quarter 31. Oct.
(subject to change)

Farstad Shipping’s strategy is to be along-term, important internationaloperator of large, modern offshoreservice vessels. Farstad Shipping ASAhas concentrated its business in that partof the market which demands the largestand most advanced share of tonnage, i.e.anchor handling tug supply (AHTS)vessels with horse power greater than10,000 BHP and platform supply vessels(PSV’s) with a cargo capacity greaterthan 2,000 DWT.
In 1973, Farstad Shipping ASA began itsoffshore activity as one of the pioneers inthe North Sea. At that time the companyacquired its first supply vessel, a modelUT 704 AHTS vessel, which was,incidentally, the Ulstein Group’s firstdesign. The company has, up to today,contracted a total of 28 vessels. Inaddition, the purchase and sale oftonnage at favourable times has beendecisive in the building up of today’sbusiness.The company has been listed on thestock exchange since 1988. In 1993, thecompany became a fully integratedshipping company when all of theoperator functions were incorporatedinto the company. Farstad Shipping hasconsolidated its international effortthrough collaboration with P&O,Australia (IOS), and the Brazilianoffshore company, Petroserv. (BrazilianOffshore Services).
The company’s fleet consists of 35 ships,whereof 16 are PSV’s and 18 AHTSvessels and one vessel for laying offlexible pipelines. Of these 2 PSV’s and 7AHTS vessels are jointly owned, via apartnership company, with P&O,Australia (Farstad’s owns a 50% share),whilst 1 AHTS vessel is chartered to thiscompany on a bareboat charter.The company’s business is run fromAalesund, Aberdeen and Macaé (Brazil)with 50 employees in all. Vessels in theFar East and Australia are run by P&OMaritime Services in Melbourne. Thenumber of sailors was by the yearendapproximately 750.The company’s vessels are run in linewith our customers’ expectations of highquality. They are operated at a level thatexceeds the requirements of national andinternational regulations with respect tosafety and the conservation of theenvironment. The vessels undergoplanned maintenance programmes thatare set up according to recommendationsfrom equipment suppliers’, classificationcompanies and the authorities, as well asthe company’s own experience. Thecompany will maintain a long-termchartering profile.The number of shareholders isapproximately 2,500. The company’sshare price at the end of the year wasNOK 25.50. This gives the company amarket capitalisation of approximatelyNOK 1,156 million.
T H I S I S F A R S T A D S H I P P I N G A S A
3
Financial development Farstad Shipping
The Farstad Fleet10 AHTS>10000 BHP
12 PSV>2000 DWT
2 PSV<2000 DWT
1 Pipelayer flexible
pipes
IOS-Fleet
8 AHTS> 10000 BHP
2 PSV>2000 DWT
*) Cash flow (CF) is defined as the result before tax and sales of vessels + depreciation + change concerning the revaluation of foreign currency liabilities
AHTS
PSV
1992 1993 1994 1995 1996 1997 1998 1999
1000
800
600
400
200
0
100
80
60
40
20
0
(mill. NOK)
Freight income Cash flow*) CF-margin
%
Farstad Shipping ASA
4
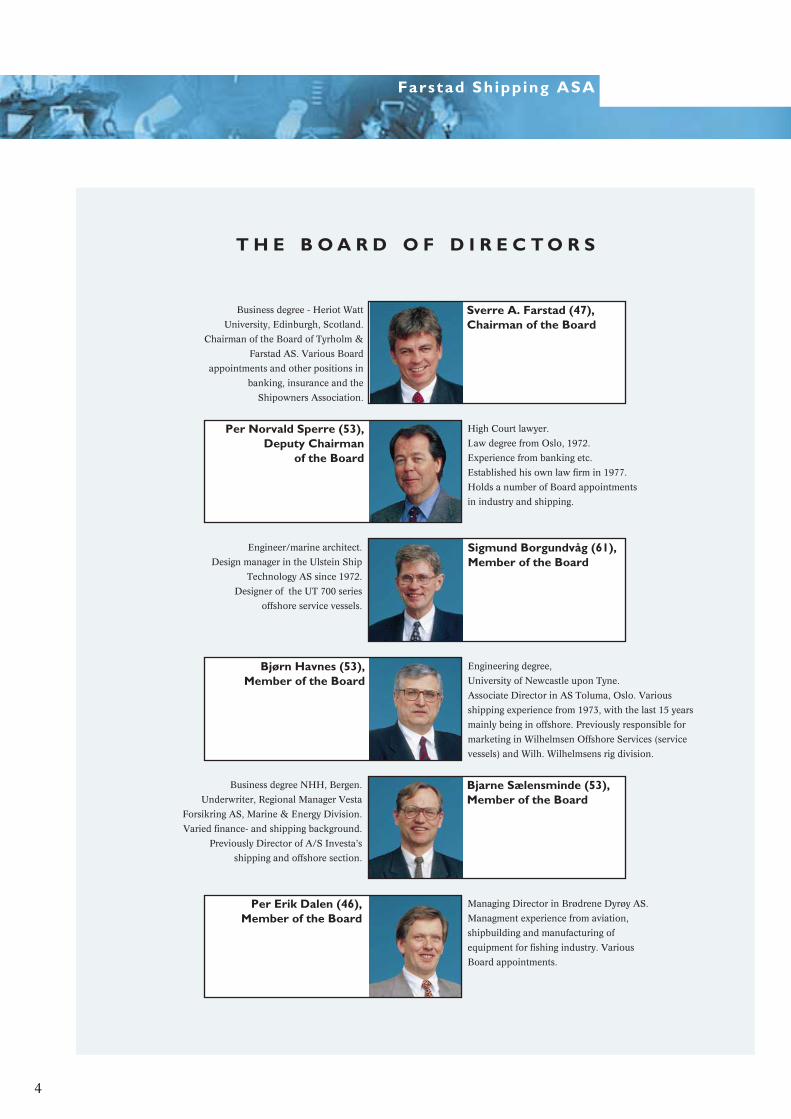
T H E B O A R D O F D I R E C T O R S
Sigmund Borgundvåg (61), Member of the Board
Engineer/marine architect.
Design manager in the Ulstein Ship
Technology AS since 1972.
Designer of the UT 700 series
offshore service vessels.
Managing Director in Brødrene Dyrøy AS.
Managment experience from aviation,
shipbuilding and manufacturing of
equipment for fishing industry. Various
Board appointments.
Per Erik Dalen (46),Member of the Board
High Court lawyer.
Law degree from Oslo, 1972.
Experience from banking etc.
Established his own law firm in 1977.
Holds a number of Board appointments
in industry and shipping.
Per Norvald Sperre (53), Deputy Chairman
of the Board
Engineering degree,
University of Newcastle upon Tyne.
Associate Director in AS Toluma, Oslo. Various
shipping experience from 1973, with the last 15 years
mainly being in offshore. Previously responsible for
marketing in Wilhelmsen Offshore Services (service
vessels) and Wilh. Wilhelmsens rig division.
Bjørn Havnes (53), Member of the Board
Bjarne Sælensminde (53), Member of the Board
Business degree NHH, Bergen.
Underwriter, Regional Manager Vesta
Forsikring AS, Marine & Energy Division.
Varied finance- and shipping background.
Previously Director of A/S Investa’s
shipping and offshore section.
Business degree - Heriot Watt
University, Edinburgh, Scotland.
Chairman of the Board of Tyrholm &
Farstad AS. Various Board
appointments and other positions in
banking, insurance and the
Shipowners Association.
Sverre A. Farstad (47), Chairman of the Board

Development 1999Following two very good years, 1999 wasa weaker year for the supply vesselcompanies. Reduced demand for supplyvessels combined with the effect of thelast few years’ large number of new buildorders, led to a large drop in rates. Inaddition, several companies experiencedhaving long-term contracts cancelled.The result of this negative marketdevelopment was that a large number ofvessels were laid up. Farstad Shippingalso chose to lay up a vessel.Developments in the market after thethird quarter provide hope that themarket is in the process of turning.Farstad Shipping particularly noticed thiswhen it came to the activity in the FarEast/Australia.Farstad Shipping ASA presents a resultthat, to a certain degree, bears the markof these market conditions. In addition,the result is negatively influenced by anunrealised currency exchange lossconnected with the company’s mortgageliabilities. Approximately 75% of thecompany’s earnings are in foreigncurrencies, therefore the generalexchange rate upturns for USD, GBPand AUD are positive for the company’sactivities.The operation of the vessels in 1999 hasbeen satisfactory and without majorincidents. The fleet was expanded by 4new vessels, which were all delivered bythe shipyards on time and within budget.
Result and dividendFarstad Shipping achieved an operatingincome of NOK 801.5 million in 1999(NOK 768.7 in 1998). No vessel saleshave been carried out during 1999,whilst the operating income for 1998includes a sales profit of NOK 60.2million. The increase in freight earningsmust be seen in the context of anincrease in the number of vessels in thefleet.The recorded result before tax was NOK86.0 million. The equivalent result for1998 was NOK 258.7 million. Thegroup’s cash flow *) during the periodwas NOK 292.8 million versus NOK309.3 million for the same period in1998. The cash flow per share was NOK6.46 (NOK 6.82).Operating costs for the period were NOK426.5 million (NOK 347.6 million). Themain reason for the increased costs wasthe increase in the number of ships. Theoperating result before depreciation and
finance in 1999, excluding sales profits,was NOK 374.9 million (NOK 359.1million). Ordinary depreciation comes toNOK 159.6 million (NOK 118.9 million).Net finance costs come to NOK 129.3million (NOK 43.3 million). Thisincludes an unrealised disagio of NOK47.3 million (disagio of NOK 6.3million), a consequence of the exchangerate adjustment of the company’s foreigncurrency mortgage liabilities. The foreigncurrency liabilities are serviced byincome from long-term charter contractsin foreign currency. The board will propose to the share-holders’ meeting that the parent com-pany’s surplus of NOK 16,203,426 beused in the following manner:
Transferred from other shareholders’ equity 29,125,944.00Dividend per share NOK 1.00 45,329,370.00
*) Cash flow is defined as the result before taxand sales of vessels + depreciation + changeconcerning the revaluation of foreign currencyliabilities
1993 1994 1995 1996 1997 1998 19990
2
4
6
8
10(NOK)
Excl. gain on sales Incl. gain on sales
REPORT OF THE BOARD OF
DIRECTORS
Cash flow per share (before tax)
5
0
50
100
150
200
250
1.quarter
2.quarter
3.quarter
4.quarter
(mill. NOK)
Operating incomeexcl. profit on sale offixed assets
Cash flowexcl. tax and profit onsale of fixed assets
0
10
20
30
40
50
Norwegian British Brazil Far East/Australia
Total
%
1998 1999
Operating result (EBIT) in % of freight income sorted by region

Financing and capital structureMortgage liabilities were repaid by NOK127.5 million (NOK 155.7 in 1998)during the period. Interest bearingmortgage liabilities were, as per31.12.99, NOK 1,693.1 million (NOK1,045.4 million). Of the company’smortgage liabilities at the end of lastyear: 38.4% was in USD, 18.8% in GBP,2.1% in AUD and 40.7% in NOK.Interest bearing current assets at thechange of the year came to NOK 199.6million (NOK 141.2 million).The group’s recorded shareholders’equity was, as per 31.12.99, NOK1,223.7 million (NOK 1,188.5 million),equivalent to NOK 27.00 (NOK 26.22)per share. At the end of last year, thecompany obtained estimates for themarket values of the vessels (charterparty free) from three shipbrokers. The
average of these valuation estimatesgives a value adjusted shareholders’equity of NOK 44.05 (NOK 48.72) pershare. There has been a fall in the valueof the fleet of approx. 12% during 1999.AdministrationWith the exception of the vessels inAsia/the Pacific Ocean region, thecompany’s vessels are operated from theoffice in Aalesund, by a staff of 30, andAberdeen, by a staff of 11. In total thereare 521 sailors attached to these offices.The operation of the vessels in Brazil isco-ordinated via our newly established,joint venture company in Macaè,Brazilian Offshore Services (BOS). Thiscompany has 7 members of staff and 76sailors serving on our vessels in Brazil.In Asia/the Pacific Ocean region, theoperation of the vessels is handled by
P&O Maritime Services, Melbourne.Approximately 154 sailors are serving onour vessels in this region.Shareholder mattersDuring the year, the share price hasclimbed from NOK 21.00 to NOK 25.50at the end of 1999. This gives thecompany a market capitalisation ofapprox. NOK 1,156 million (NOK 951million). A dividend of NOK 1 was paidout in 1999. An equivalent amount issuggested as dividend in 2000. The company’s board has the power ofattorney to expand the share capital byissuing up to 6 million shares, withoutthe right of first refusal for presentshareholders. This authority is validuntil the shareholder’s meeting in 2000.In addition, the board has the power ofattorney to purchase up to 10% of ourown shares. This power of attorney isvalid until 30.06.2000. None of theboard’s power of attorneys have beenused in 1999.The FleetThe Farstad fleet now consists of 25vessels. In addition, 9 vessels are ownedthrough IOS, the partnership companywith P&O, Australia (Farstad’s share50%), as well as one vessel that ischartered to IOS on a bareboat charter.Kværner Govan, Glasgow, delivered theplatform vessels (PSV’s) Far Strider andFar Supplier on 12th January and 12thMarch respectively. Immediatelyfollowing delivery, both vessels started5-year charters with Amerada Hess andASCo UK respectively. In August, FarSupplier was terminated from itscontract with ASCo. The vessel entereda 2-year contract with ASCo Norwaytogether with Far Spirit to serviceBP/Amoco locations in the Norwegiansector.The contract that Far Scotsman had wasterminated in July. The vessel was laidup due to expectations about the fallingmarket, and remain laid up for the restof the year.The anchor handling vessel (AHTS) FarSovereign was delivered by LangstenSlip og Båtbyggeri AS on 25th June. Acollaboration agreement with EMC(European Marine Contractors) wassigned for this vessel. However, becauseof the market conditions the partiesagreed in September to allow the vesselto go to Brazil to start the contract that
6
Farstad Shipping ASA
From the naming ceremony of Far Star in the Geirangerfjord
with Lady Sponsor Birte Mikkelsen, flanked by representatives from yard and ship-owner.

had been signed for Far Santana(AHTS). This vessel was delivered byUlstein Verft AS on 25th February 2000and went directly to Brazil to start its7.5-year contract with Petrobras. UponFar Santana’s arrival Far Sovereignreturned to work in the North Sea.Far Star (PSV) was delivered fromBrattvaag Skipsverft AS on 19th August.The vessel then entered a 10-yearcontract with Norsk Hydro.Far Sky and Far Senior (AHTS’) left theNorth Sea in the middle of November tostart 6 months work for BP/Amoco offthe coast of Trinidad.Up to 5 of our vessels were withoutemployment for periods during thesecond and third quarter in the FarEast/Australia. In the North Sea it wasduring the third quarter in particularthat we noticed the poor market. With 3AHTS vessels on the spot market,reduced rates on three contracts and onevessel laid up, the resulting effects wereconsiderable, but not unexpected.Health, Safety and EnvironmentFarstad Shipping has maintained overthe last few years’ strong commitment tomaking people aware of health, safetyand environmental issues (HSE)onboard the vessels and in the onshoreoperational organisations. Our require-ments for vessel operation are on a levelthat exceeds the requirements innational and international regulationswith respect to safety and conservationof the environment. Furthermore, thismandatory has given our customers’expectations of high quality. The boardbelieves that the significant effort beingmade on HSE will strengthen thecompany’s competitive edge.The project that was set in motionconcerning the inspection of equipmentand systems, the millennium change-over, uncovered only a few minorproblem areas. The changeover to theyear 2000 went without problems of anykind.There has also been significant trainingactivity for staff, focusing on HSEimprovements, during 1999. Activitiesinclude the reporting of unwantedevents (including potential accidents), athorough investigation of the
circumstances, and a discussion ofexperiences that involves causes, costsand effective steps to take to preventsuch events from recurring. This is aneffective tool, and one that gives theCompany an opportunity to limit losses and improve operational safety. Inaddition, it encourages the crew toreport hazards, which in turn can helphighlight the hazards. Because thereporting now is performed in a moreobjective manner, the "individual at
fault" risk is eliminated, and the sailingcrew has a better incentive to reportpossible hazards to people, equipmentand machinery.The operation of the company during1999 has not caused serious personalinjuries, substantial equipment damageor significant pollution of the environ-ment. The board acknowlegdes that thework environment onboard and onshoreis good.In 1999, the company had an absencedue to sickness rate of 1.4% and aninjury at sea rate of 0.3%.Market conditionsThe North SeaThe Norwegian and British sectors arestill the most important markets forFarstad Shipping. About 59% of thecompany’s freight earnings in 1999 camefrom these markets. The North Sea’sshare of freight earnings has been fallingfor the last few years.The market balance for supply vessels inthe North Sea has, during 1999,experienced a decline for the first time insix years. During the first half of theyear, the demand for supply vessels wason a par with the first six months of1998. However, the average utilisationrate fell due to increased availability oftonnage. During the third quarter, theNorth Sea market was further affectedby the increasing tonnage surplus, whilst
the fourth quarter experienced asignificant drop in demand. Thisproduced a further reduction in theutilisation rate. The drop in the fourthquarter was, however, limited as a resultof the net departure of tonnage from the North Sea. While the average utilisationrate for the first half of the year wasapprox. 89% (95% in the first half of1998) it fell to approx. 85% (97%)during the third quarter and 82% (93%)in the fourth quarter.
The fact that the drop in demand hasnot been greater in the North Sea is dueto the stable demand that is associatedwith the operation and maintenance ofexisting installations. Exploration relatedactivity, which is very dependent on theoil price, makes up a steadily smallershare of the accumulated demand forsupply vessels in the North Sea, and in1999 came to just 5%.The good market conditions of the lastfew years have contributed to asignificant number of new build orders.Market developments in 1999 havecontributed to an almost full stop in thenew build order activity.
REPORT OF THE BOARD OF
DIRECTORS
7
60
80
70
100
90
%
1998 1999 E-2000
Average utilisation rateNorth Sea
J F M A M J J A S O N D
From the naming cermony of Far Supplier in Glasgow with Lady Sponsor Ruth Maxwell

8
BrazilDespite big problems in the Brazilianeconomy in the beginning of 1999,activity in this region has been stable.Brazil still has ambitions of being one ofthe pioneering countries when it comesto oil activity in deep waters. Theopening of Brazilian fields to foreign oilcompanies will underpin this further.Following Far Sovereign going toPetrobras on contract at the end ofSeptember, Farstad has 7 vessels thatoperate in this region. In 1999, approx.28% of Farstad’s freight earnings camefrom vessels that work in Brazil. FarCenturion, Far Crusader, Far Sailor, FarSea – all AHTS vessels – have, togetherwith Far Sleipner (PSV), been on
contract to Petrobras the whole year.Lochnagar, which has been on contractto DSND (Søndenfjeldske) has alsoworked for Petrobras, laying flexible oilpipelines.Farstad wishes to consolidate and deve-lop our position further in the Brazilianmarket through the establishment ofBOS.Australia and Southeast AsiaApproximately 15% of Farstad’s incomein 1999 came from freight earnings fromthis region. At the end of 1999, twoPSV’s and six AHTS vessels wereworking in this region.The drop in the oil price affected theactivity in this region as early as the lastsix months of 1998. Activity has beenlow throughout the whole of 1999. Afterthe bottom was reached in the thirdquarter, activity gradually began to riseduring the fourth quarter.
The partnership with P&O gives usposition to meet the increased activity inthe region. One example is the award ofcharter conracts from Shell to IOS inconnection with the development of theMalampaya field off the coast of thePhilippines.West Africa and Latin AmericaA co-operation agreement was signedwith Tidewater in September concerningmarket collaboration in West Africa andLatin America (except Brazil) for ourAHTS vessels. So far the collaborationhas resulted in contracts for Far Seniorand Far Sky in Trinidad & Tobago.Shipping taxationIn 1996, the Norwegian Parliament,‘Stortinget’, passed a new tax law forNorwegian Shipping Companies. Thenew taxation system gave Norwegianshipping companies satisfactory generalconditions; compared with generalconditions in countries that Norwegianshipping competes with.Unfortunately, in every budget dis-cussion since the arrangement wasintroduced, Parliament has managed tosow doubt about the stability of theindustry’s general terms by repeatedreductions in the arrangement. It is ofgreat importance that capital intenseindustries’, such as shipping havegeneral conditions that are predictableand stable. The fact that more and morenew countries have introduced generalconditions for shipping that are morecompetitive than the Norwegian onesdoes not make things better. Should thissituation continue, we must expect thatthe positive development thatNorwegian shipping has experiencedduring the last few years, will do anabout turn.
Farstad Shipping ASA
Aalesund, 13 March 2000 The Board of Farstad Shipping ASA
Per Erik Dalen
Sverre A. FarstadChairman
Terje J.K.AndersenManaging Director
Per Norvald SperreDeputy Chairman
Bjarne Sælensminde
Sigmund Borgundvåg
Bjørn Havnes
Future outlookThere is a clear correlation between theoil companies’ earnings and thecompanies’ exploration and investmentactivities. Reduced earnings, resultingfrom low oil prices, led to substantialcuts in the oil companies’ explorationactivities in 1999. This resulted in asignificant number of rigs being laid up.In addition, large cost reductioncampaigns were set in motion in the oilcompanies. Many of these weremotivated by a need to document gainsfrom collaborations and mergers.Given the background of thedevelopment of the oil price during 1999and into 2000, we have seen more andmore signs that exploration activity isundergoing an increase again. While atthe beginning of 2000 there are, on aglobal basis, 96 semis working, this isexpected to increase to about 110 nearthe end of summer. The North Sea, WestAfrica, the East/Australia and Brazil areexpected to be responsible for the
increase. Similarly, the number ofjackups is expected to increase from 265to 300. In this case, it is the Gulf ofMexico in particular that is expected tocontribute to the growth. The abovementioned development means that thedemand for supply vessels in Brazil, theFar East, Australia and West Africa mustbe expected to increase in the monthsahead.The market balance in 1999 was stronglyaffected by the many new builds thatcame out. While it is not expected thatthe demand in 2000 will be big enoughto absorb the surplus tonnage, themarkets outside of the North Sea,however, have in the last few monthstaken tonnage away from the North Seato a greater degree than was expected.When the utilisation rate in the NorthSea approaches 90%, it is usuallyreflected by a rise in rates. At the end ofthe first quarter we have experiencedutilisation rates at this level and anequivalent strong rise in rates. With
expectations of a continued net declinein the tonnage in the North Sea we areentitled to hope that the market mayrecover faster than what was expectedjust a few months ago.The Farstad fleet at the start of 2000 wascontractually covered, through signedcharter agreements, calculated atapprox. 90% during the first half of theyear and approx. 75% for the secondhalf.The going concern statementThe financial statements are presentedbased on the assumption of goingconcern. The Board of Directors confirmthat the assumption is present based onthe company’s solid equity capital andchartering position of the vessels.
9
REPORT OF THE BOARD OF
DIRECTORS

Farstad Shipping ASA
PARENT COMPANY FARSTAD SHIPPING ASA (NOK 1000) GROUP
Operating income:Freight incomeOther incomeProfit on sale of fixed assets
Total operating income
Operating expenses:Crewing expenses vesselsOther operating expenses vesselsAdministration
Total operating expenses
Operating profit before depreciation
Depreciation
Operating result
Financial items:Financial incomeFinancial expenses
Net financial items
Pre-tax profit
Taxes
Profit of the year
Profit per. share (NOK)
1999
-35,576
38
35,614
--
(38,293)
(38,293)
(2,679)
(2,355)
(5,034)
22,659(1,422)
21,237
16,203
-
16,203
0.36
1999
795,8445,492
154
801,490
(231,946)(148,423)
(46,117)
(426,486)
375,004
(159,638)
215,366
28,958(158,294)
(129,336)
86,030
(5,576)
80,454
1.77
1998
703,0523,648
62,005
768,705
(184,671)(122,528)
(40,430)
(347,629)
421,076
(118,893)
302,183
32,747(76,181)
(43,434)
258,749
(1,844)
256,905
5.67
1997
597,376907
75,117
673,400
(142,920)(99,644)(32,389)
(274,953)
398,447
(124,470)
273,977
22,076(55,634)
(33,558)
240,419
102,361
342,780
5.30
1998
-28,250
315,910
344,160
-4
(34,974)
(34,970)
309,190
(1,989)
307,201
16,878(405)
16,473
323,674
-
323,674
7.14
NOTE
17
14
20
7
17
22
11
4
12
18
5
125
10
P R O F I T A N D L O S S
A C C O U N T

Terje J.K.AndersenManaging director
Farstad Shipping ASA
1999
4,7272,583,487
39,04960,202
675
650
2,688,790
154,57751,50531,367
155,463
392,912
3,081,702
1998
6,3031,830,998
42,591206,430
675
650
2,087,647
119,18928,81721,257
112,175
281,438
2,369,085
1997
7,8791,549,407
36,589114,610
275
425
1,709,185
58,14933,56111,171
156,414
259,295
1,968,480
FARSTAD SHIPPING ASA (NOK 1000) GROUP
ASSETSFixed assets:GoodwillVessels etc.Deferred maintenance costContracts newbuildingsOther long-term receivablesReceivables from Group companiesShares
Total fixed assets
Current assets:Account receivables, freight incomeOther short-term receivables Other securitiesBank deposits
Total current assets
Total assets
PARENT COMPANY
NOTE
77
10
66
3 6
16
7
1999
45,329198,396980,023
1,223,748
1261,693,066
1,693,192
38,10245,32981,331
164,762
1,857,954
3,081,702
1998
45,329198,396944,832
1,188,557
2,0681,045,402
1,047,470
37,37445,32950,355
133,058
1,180,528
2,369,085
1997
45,329211,509720,036
976,874
1,411875,937
877,348
25,34745,32943,582
114,258
991,606
1,968,480
1998
6,3031,710
--
1,425207,156
1,473,586
1,690,180
39,0039,326
21,25762,516
132,102
1,822,282
1999
4,7272,195
--
675164,039
1,473,686
1,645,322
5,92229,10231,36771,239
137,630
1,782,952
1998
45,329198,396
1,459,583
1,703,308
2,068-
2,068
8,15445,32963,423
116,906
118,974
1,822,282
1999
45,329198,396
1,430,457
1,674,182
126-
126
27,43345,32935,882
108,644
108,770
1,782,952
EQUITY AND LIABILITIESEquity capital:Share capitalShare premium reserveOther equity
Total equity capital
Liabilities:Long-term liabilities:Other long-term liabilitiesInterest-bearing mortgage debt
Total long-term liabilities
Short-term liabilities:Debt to suppliersAllocated dividendsOther short-term liabilities
Total short-term liabilities
Total liabilities
Total equity and liabilities
NOTE
1999
1216
8
9
13
11
B A L A N C E
S H E E T
Per Erik Dalen
Sverre A. FarstadChairman
Per Norvald SperreDeputy Chairman
Bjarne Sælensminde
Sigmund Borgundvåg
Bjørn Havnes
Aalesund, 13. March 2000 The Board of Farstad Shipping ASA

Farstad Shipping ASA
1999
16,203-
(38)2,355
-33,08119,279
(1,942)-
(47,378)
21,560
186(1,415)
(36)43,867
-
42,602
---
(45,329)-
(45,329)
18,833
83,773
102,606
1999
86,030(5,204)
(154)159,638
8,252(35,388)
728
(1,942)47,257
7,120
266,337
400(764,906)
(36)--
(764,542)
724,438(127,506)
-(45,329)
-
551,603
53,398
133,432
186,830
1998
258,749(348)
(62,005)118,893
24,069(61,040)12,027
657(6,296)9,330
294,036
120,139(578,136)
(225)-
(400)
(458,622)
331,506(155,744)
-(45,329)
-
130,433
(34,153)
167,585
133,432
1998
323,674-
(315,910)1,989
-(11,012)(6,310)
657-
37,369
30,457
571,740(956)
(431,725)671,638
(400)
810,297
-(708,606)(131,128)(45,329)
-
(885,063)
(44,309)
128,082
83,773
1997
240,419(109)
(75,117)124,470
16,796(5,409)2,201
4043,394
(14,226)
292,823
127,415(578,886)
--
(500)
(451,971)
326,446(163,230)
--
(33,997)
129,219
(29,929)
197,514
167,585
CASH FLOW FROMOPERATING ACTIVITY:Pre-tax profitPaid taxes this periodProfit on sale of fixed assetsOrdinary depreciationsPeriodical maintenance costsChanges in debtorsChanges in creditorsDiscrepancies pension costs/paymentsfrom pension fundsUnrealised foreign exchange loss/(gain)Changes in prepayments and accruals
Net cash flow from operation activity
CASH FLOW FROMINVESTMENT ACTIVITY:Sale of fixed assets (sales price)Investments in fixed assets/ contracts newbuildingsPurchase of sharesChanges in long-term receivablesOther investments
Net cash flow from investment activity
CASH FLOW FROMFINANCE ACTIVITY:New long-term debtRepayment of debtResult 1997, transferred to subsidiariesDividendsRepayment of equity capital
Net cash flow from finance activity
Changes in liquidity over the year
Liquid assets at 01.01
Liquid assets at 31.12
FARSTAD SHIPPING ASA (NOK 1000 ) GROUP PARENT COMPANY
A
B
C
A + B + C
C A S H F L O W S TAT E M E N T
12

Accounting principles – new accounting actThe financial statement is presented in compliancewith the Norwegian Companies Act, the NorwegianAccounting Act of 1998 and Norwegian generallyaccepted accounting principles.The company has, according to the new accountingact, changed its principles for calculation of foreigncurrency mortgage debt. The debt is now calculatedto NOK using the exchange rate at the end of theyear. Previously, the mortgage debt in NOK wascalculated using the highest of the exchange rate atthe drawdown date and the exchange rate by year-end. As a result of the change, a latent currencyprofit of NOK 16,441 was added to income in 1998,and it also resulted in a corresponding increase incompany equity by the end of 1998.The former legal reserve is now transferred to sharepremium reserve. The former general reserve istransferred to other equity. The profit and lossaccount and balance sheet is restructured incompliance with the new Accounting Act of 1998.Figures for previous years are changed according tothe above mentioned change of principles.Principles of consolidationThe consolidated financial statements include theparent company Farstad Shipping ASA and thesubsidiaries specified in note 6. In the consolidatedstatements, all inter-company balances andtransactions are eliminated. The cost of acquiringshares in subsidiaries is eliminated against equity inthe subsidiary at the time of acquisition or at the timeof establishment. The cost method is used for thiselimination. The profit and loss statement (P&L) for a foreignsubsidiary is calculated to NOK at the averageexchange rate for the year. The balance sheet iscalculated to NOK according to the exchange rate atthe end of the year. Equity in foreign currency isadjusted to the exchange rate by year-end. This isposted directly to the equity.Costs- and revenue recognitionFreight income is posted when it is earned. Incomeand costs related to the operation of the vessels areentered according to the accruals principle based onthe number of days the contract lasts before and afterthe end of the accounting period.Valuation and presentation of current assetsShort-term shareholdings and other securities are nottreated as a portfolio, and are valued to the lowest ofcost price and market value. The value of tradereceivables and other short-term receivables are facevalue reduced by expected future losses.Ownership of the general partnership (ANS)Farstads share of this general company, see note 4,are entered using the principle of proportionalconsolidation (gross method). Accordingly, FarstadShipping’s share of the parent company’s assets,debts and margins are included in Farstad Shipping’sfinancial statements, respectively. Balance sheetitems, costs and income between the general
company and Farstad Shipping are eliminatedproportionally to the extent of Farstad Shippingsshare of ownership in this company.Sale of vesselsProfit from sale of vessels is included in operatingincome, due to the perception that these transactionsare part of the regular business operations.Depreciation of vesselsVessels and portion of vessels in ANS are valued inthe consolidated balance sheet at cost, lessaccumulated depreciation. The cost of the vessels orthe portion of the vessels in ANS follows a straight-line depreciation schedule over 25 years. Thisprinciple was changed in 1998. Prior years’depreciation expense of the fleet was based on auseful life of 20 years from the time ofpossession/acquisition. The effect of this change wasa reduction in depreciation expense of NOK 30million compared to the previous depreciationschedule. Smaller investments, alterations andinvestments necessitated by new charter contractsare normally depreciated in a straight line over 5years, unless there are conditions that dictate alonger or shorter useful life of that particularinvestment.GoodwillWith the acquisition of the management companiesSverre Farstad & Co AS and Farstad UK Ltd. in1993, the goodwill value of NOK 15.8 million hasbeen added to the balance sheet. This will bedepreciated by 10% annually, in that the aquisition isanticipated to have value for the Company for atleast ten years. Construction ContractsPaid instalments for newbuildings are entered asfixed assets as each payment take place. Investmentsthat are not included in the contract, such asinspection costs, and other related costs and rebatesduring construction, will be recorded as fixed assets.For details, see note 10. Pension costs and obligationsThe Company is financing its pension obligations to223 employees through two group pension plans.The Company has separate arrangements with fiveindividuals, for whom the Company pays the annualpremiums. These premiums are recorded as pensioncosts as they incur.The net present value of the future obligations of thegroup pension plans is calculated based on insuranceaccounting principles. The estimated obligation forthe employees on shore is recorded as a debt on thebalance sheet. The current year’s change in netpension obligation then becomes a pension cost inthe financial statements. Estimates of the pensionobligation to the sailing crew currently indicate over-financing. This is not included on the balance sheet.For details, please see note 12.Maintenance costsPeriodic maintenance is capitalized, and posted tooperating costs during the period until the next
Farstad Shipping ASA
N O T E S ( N O K 1 0 0 0 )
NOTE
1NOTE
1Accounting principles
13
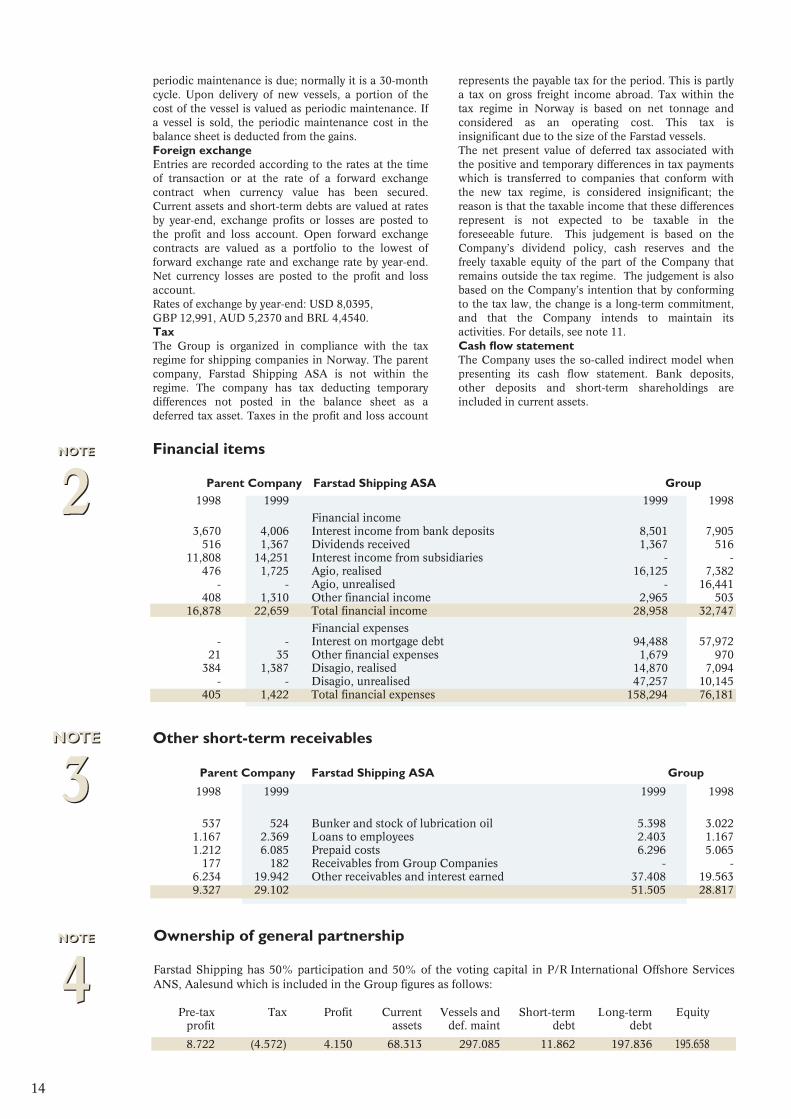
Financial items
Ownership of general partnership
NOTE
2NOTE
2
NOTE
4NOTE
4
Parent Company Farstad Shipping ASA Group1998 1999 1999 1998
Financial income 3,670 4,006 Interest income from bank deposits 8,501 7,905
516 1,367 Dividends received 1,367 51611,808 14,251 Interest income from subsidiaries - -
476 1,725 Agio, realised 16,125 7,382- - Agio, unrealised - 16,441
408 1,310 Other financial income 2,965 50316,878 22,659 Total financial income 28,958 32,747
Financial expenses - - Interest on mortgage debt 94,488 57,972
21 35 Other financial expenses 1,679 970384 1,387 Disagio, realised 14,870 7,094
- - Disagio, unrealised 47,257 10,145405 1,422 Total financial expenses 158,294 76,181
Farstad Shipping has 50% participation and 50% of the voting capital in P/R International Offshore ServicesANS, Aalesund which is included in the Group figures as follows:
Pre-tax Tax Profit Current Vessels and Short-term Long-term Equityprofit assets def. maint debt debt
8.722 (4.572) 4.150 68.313 297.085 11.862 197.836 195.658
periodic maintenance is due; normally it is a 30-monthcycle. Upon delivery of new vessels, a portion of thecost of the vessel is valued as periodic maintenance. Ifa vessel is sold, the periodic maintenance cost in thebalance sheet is deducted from the gains.Foreign exchangeEntries are recorded according to the rates at the timeof transaction or at the rate of a forward exchangecontract when currency value has been secured.Current assets and short-term debts are valued at ratesby year-end, exchange profits or losses are posted tothe profit and loss account. Open forward exchangecontracts are valued as a portfolio to the lowest offorward exchange rate and exchange rate by year-end.Net currency losses are posted to the profit and lossaccount.Rates of exchange by year-end: USD 8,0395, GBP 12,991, AUD 5,2370 and BRL 4,4540.TaxThe Group is organized in compliance with the taxregime for shipping companies in Norway. The parentcompany, Farstad Shipping ASA is not within theregime. The company has tax deducting temporarydifferences not posted in the balance sheet as adeferred tax asset. Taxes in the profit and loss account
represents the payable tax for the period. This is partlya tax on gross freight income abroad. Tax within thetax regime in Norway is based on net tonnage andconsidered as an operating cost. This tax isinsignificant due to the size of the Farstad vessels.The net present value of deferred tax associated withthe positive and temporary differences in tax paymentswhich is transferred to companies that conform withthe new tax regime, is considered insignificant; thereason is that the taxable income that these differencesrepresent is not expected to be taxable in theforeseeable future. This judgement is based on theCompany’s dividend policy, cash reserves and thefreely taxable equity of the part of the Company thatremains outside the tax regime. The judgement is alsobased on the Company’s intention that by conformingto the tax law, the change is a long-term commitment,and that the Company intends to maintain itsactivities. For details, see note 11.Cash flow statementThe Company uses the so-called indirect model whenpresenting its cash flow statement. Bank deposits,other deposits and short-term shareholdings areincluded in current assets.
Other short-term receivablesNOTE
3NOTE
3 Parent Company Farstad Shipping ASA Group
1998 1999 1999 1998
537 524 Bunker and stock of lubrication oil 5.398 3.0221.167 2.369 Loans to employees 2.403 1.1671.212 6.085 Prepaid costs 6.296 5.065
177 182 Receivables from Group Companies - -6.234 19.942 Other receivables and interest earned 37.408 19.5639.327 29.102 51.505 28.817
14
NOTE
6NOTE
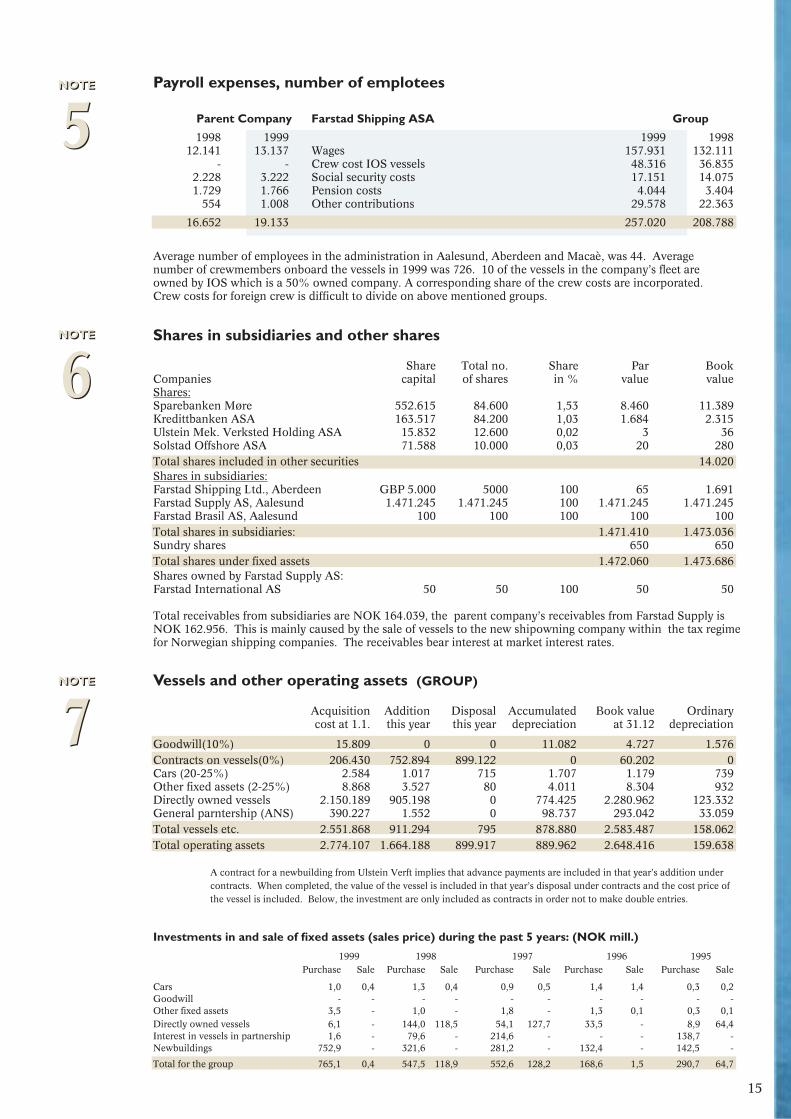
6Shares in subsidiaries and other shares
Share Total no. Share Par BookCompanies capital of shares in % value value Shares:Sparebanken Møre 552.615 84.600 1,53 8.460 11.389Kredittbanken ASA 163.517 84.200 1,03 1.684 2.315Ulstein Mek. Verksted Holding ASA 15.832 12.600 0,02 3 36Solstad Offshore ASA 71.588 10.000 0,03 20 280Total shares included in other securities 14.020Shares in subsidiaries:Farstad Shipping Ltd., Aberdeen GBP 5.000 5000 100 65 1.691Farstad Supply AS, Aalesund 1.471.245 1.471.245 100 1.471.245 1.471.245Farstad Brasil AS, Aalesund 100 100 100 100 100Total shares in subsidiaries: 1.471.410 1.473.036Sundry shares 650 650Total shares under fixed assets 1.472.060 1.473.686Shares owned by Farstad Supply AS:Farstad International AS 50 50 100 50 50
Total receivables from subsidiaries are NOK 164.039, the parent company’s receivables from Farstad Supply isNOK 162.956. This is mainly caused by the sale of vessels to the new shipowning company within the tax regimefor Norwegian shipping companies. The receivables bear interest at market interest rates.
NOTE
7NOTE
7Vessels and other operating assets (GROUP)
Acquisition Addition Disposal Accumulated Book value Ordinary cost at 1.1. this year this year depreciation at 31.12 depreciation
Goodwill(10%) 15.809 0 0 11.082 4.727 1.576Contracts on vessels(0%) 206.430 752.894 899.122 0 60.202 0Cars (20-25%) 2.584 1.017 715 1.707 1.179 739Other fixed assets (2-25%) 8.868 3.527 80 4.011 8.304 932Directly owned vessels 2.150.189 905.198 0 774.425 2.280.962 123.332General parntership (ANS) 390.227 1.552 0 98.737 293.042 33.059Total vessels etc. 2.551.868 911.294 795 878.880 2.583.487 158.062Total operating assets 2.774.107 1.664.188 899.917 889.962 2.648.416 159.638
A contract for a newbuilding from Ulstein Verft implies that advance payments are included in that year’s addition under contracts. When completed, the value of the vessel is included in that year’s disposal under contracts and the cost price of the vessel is included. Below, the investment are only included as contracts in order not to make double entries.
Investments in and sale of fixed assets (sales price) during the past 5 years: (NOK mill.)
1999 1998 1997 1996 1995 Purchase Sale Purchase Sale Purchase Sale Purchase Sale Purchase Sale
Cars 1,0 0,4 1,3 0,4 0,9 0,5 1,4 1,4 0,3 0,2Goodwill - - - - - - - - - -Other fixed assets 3,5 - 1,0 - 1,8 - 1,3 0,1 0,3 0,1Directly owned vessels 6,1 - 144,0 118,5 54,1 127,7 33,5 - 8,9 64,4Interest in vessels in partnership 1,6 - 79,6 - 214,6 - - - 138,7 - Newbuildings 752,9 - 321,6 - 281,2 - 132,4 - 142,5 -
Total for the group 765,1 0,4 547,5 118,9 552,6 128,2 168,6 1,5 290,7 64,7
Average number of employees in the administration in Aalesund, Aberdeen and Macaè, was 44. Averagenumber of crewmembers onboard the vessels in 1999 was 726. 10 of the vessels in the company’s fleet areowned by IOS which is a 50% owned company. A corresponding share of the crew costs are incorporated.Crew costs for foreign crew is difficult to divide on above mentioned groups.
NOTE
5NOTE
5Payroll expenses, number of emplotees
Parent Company Farstad Shipping ASA Group
1998 1999 1999 1998 12.141 13.137 Wages 157.931 132.111
- - Crew cost IOS vessels 48.316 36.8352.228 3.222 Social security costs 17.151 14.0751.729 1.766 Pension costs 4.044 3.404
554 1.008 Other contributions 29.578 22.363
16.652 19.133 257.020 208.788
15

Tax situationNOTE
11NOTE
11 Parent Company Farstad Shipping ASA Group
1998 1999 1999 1998Calculation of taxable profit:
323,674 16,203 Operating income before taxes1,458 (1,238) Permanent discrepancies
(315,873) - Profit sale of vessels within the Group
Changes in temporary discrepancies related to:657 (1,942) Current assets / short-term liabilities
1,571 1,684 Fixed assets / long-term liabilities(11,487) (7,935) Reversed from correction income
- (6,772) Loss to be carried forward
0 0 Taxable profit
Calculation of deferred tax. Specification of discrepancies:(2,068) (126) Current assets / short-term liabilities (126) (2,068)6,457 4,773 Fixed assets 4,773 6,457
(1,587) (2,955) Unused dividend tax credit (2,955) (1,587)(13,659) (6,887) Loss carried forward (6,887) (13,659)(7,935) - Correction income - (7,935)
(18,792) (5,195) Calculation base for deferred taxes (5,195) (18,792)
5,262 1,455 Deferred tax 1,455 5,262
Specification of taxes in profit and loss account:- - Taxes payable abroad 5,576 1,844
0 0 Total tax costs 5,576 1,844
NOTE
9NOTE
9Development in the Company’ share capital and equity (parent company)
Date Farstad Shipping ASA Number of Share- Share pre- Othershares capital mium reserve equity
01.01.1999 45.329.370 45.329 198.396 1.459.58331.12.1999 Profit of the year 16.20331.12.1999 Allocated to divedends (45.329)
Total parent company 45.329.370 45.329 198.396 1.430.457
Other short-term liabilitiesNOTE
8NOTE
8 Parent Company Farstad Shipping ASA Group
1998 1999 1999 1998
18,004 20,314 Tax deductions, holiday pay, VAT, etc 20,444 18,015- - Estimated taxes payable 2,736 1,644
4,455 2,305 Accrued expenses 4,461 6,914- - Accrued interest on mortgage debt 27,617 16,966
40,786 7,180 Liabilities to Group companies - -178 6,083 Other short-term liabilities 26,073 6,816
63,423 35,882 81,331 50,355
NOTE
10NOTE
10Contract newbuilding
The Company has 1 vessel in order due to be delivered February 2000 from Ulstein Verft. Total investmentis approximately NOK 298.000, whereof NOK 60.202 is capitalized as fixed assets per 31.12.99 for paidinstalments to Ulstein Verft, inspection costs and owners suppliers. Longterm financing is expected to be 80% of the investment.
16
NOTE
12NOTE
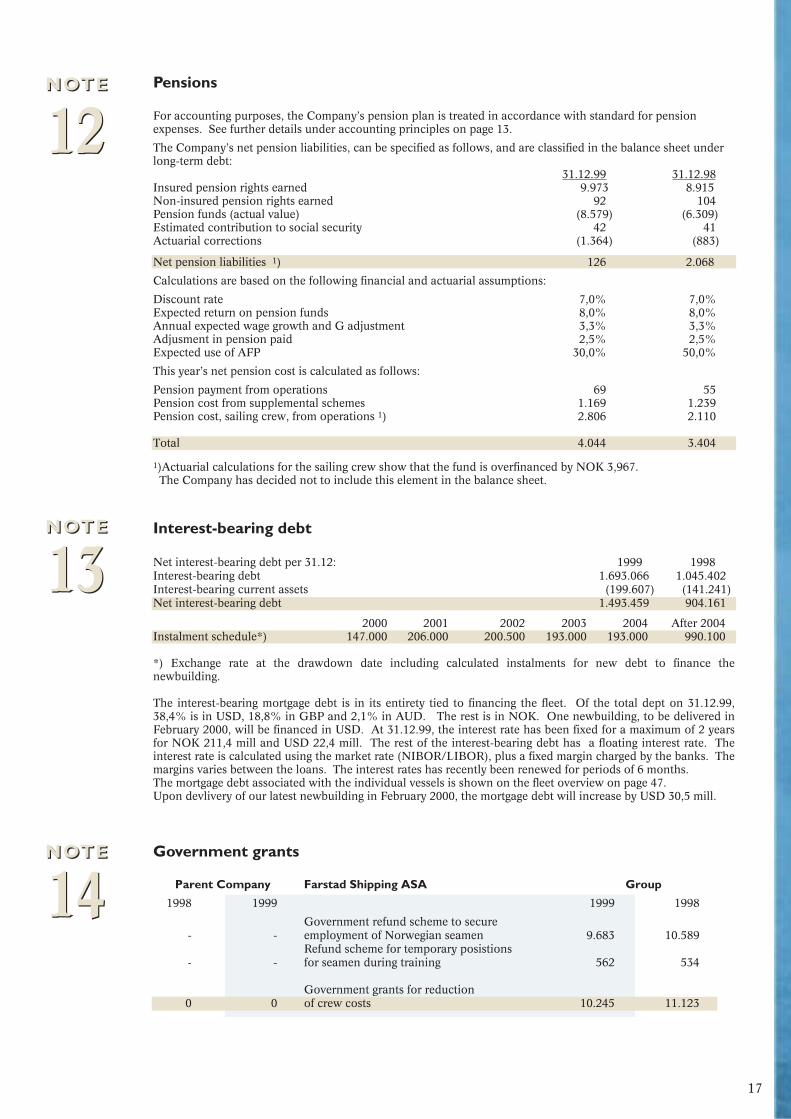
12Pensions
For accounting purposes, the Company’s pension plan is treated in accordance with standard for pensionexpenses. See further details under accounting principles on page 13.
The Company’s net pension liabilities, can be specified as follows, and are classified in the balance sheet under long-term debt:
31.12.99 31.12.98Insured pension rights earned 9.973 8.915Non-insured pension rights earned 92 104Pension funds (actual value) (8.579) (6.309)Estimated contribution to social security 42 41Actuarial corrections (1.364) (883)
Net pension liabilities 1) 126 2.068
Calculations are based on the following financial and actuarial assumptions:
Discount rate 7,0% 7,0%Expected return on pension funds 8,0% 8,0%Annual expected wage growth and G adjustment 3,3% 3,3%Adjusment in pension paid 2,5% 2,5%Expected use of AFP 30,0% 50,0%
This year’s net pension cost is calculated as follows:
Pension payment from operations 69 55Pension cost from supplemental schemes 1.169 1.239Pension cost, sailing crew, from operations 1) 2.806 2.110
Total 4.044 3.404
1)Actuarial calculations for the sailing crew show that the fund is overfinanced by NOK 3,967. The Company has decided not to include this element in the balance sheet.
NOTE
13NOTE
13Interest-bearing debt
Net interest-bearing debt per 31.12: 1999 1998Interest-bearing debt 1.693.066 1.045.402Interest-bearing current assets (199.607) (141.241)Net interest-bearing debt 1.493.459 904.161
2000 2001 2002 2003 2004 After 2004Instalment schedule*) 147.000 206.000 200.500 193.000 193.000 990.100
*) Exchange rate at the drawdown date including calculated instalments for new debt to finance thenewbuilding.
The interest-bearing mortgage debt is in its entirety tied to financing the fleet. Of the total dept on 31.12.99,38,4% is in USD, 18,8% in GBP and 2,1% in AUD. The rest is in NOK. One newbuilding, to be delivered inFebruary 2000, will be financed in USD. At 31.12.99, the interest rate has been fixed for a maximum of 2 yearsfor NOK 211,4 mill and USD 22,4 mill. The rest of the interest-bearing debt has a floating interest rate. Theinterest rate is calculated using the market rate (NIBOR/LIBOR), plus a fixed margin charged by the banks. Themargins varies between the loans. The interest rates has recently been renewed for periods of 6 months.The mortgage debt associated with the individual vessels is shown on the fleet overview on page 47. Upon devlivery of our latest newbuilding in February 2000, the mortgage debt will increase by USD 30,5 mill.
NOTE
14NOTE
14Government grants
Parent Company Farstad Shipping ASA Group
1998 1999 1999 1998
Government refund scheme to secure - - employment of Norwegian seamen 9.683 10.589
Refund scheme for temporary posistions- - for seamen during training 562 534
Government grants for reduction0 0 of crew costs 10.245 11.123
17

NOTE
15NOTE
15Off-balance financial instruments
In order to secure the currency exchange rate of short-term receivables and freight income in foreign currency, at31.12.99 the Company has entered into the following agreements:
a) Forward agreements for an amount of GBP 20,8 million due from January 2000 to May 2003.Forward rates varies between NOK 12.00 and 13.42.
b) Forward agreements for an amount of USD 20.5 million due from January 2000 to March 2001.Forward rates varies between NOK 7.94 and 8.17
To secure the planned financing of a newbuilding in USD the Company has per 31.12.99 entered into forwardagreement to buy USD 30.5 million, due date 25.02.00,at an average forward rate of NOK 7,7664. For alteration ofmortgage-debt in NOK the Company has bought GBP 7.0 million through forward exchange contracts whichterminates 31.01.01 to an average exchange rate of NOK 12.5950.
Mortgages and guarantee liabilitiesNOTE
16NOTE
16 Farstad Shipping ASA Parent Company Group
Mortgages: Debt and accrued interest secured by mortgages 0 1.720.683
Security includes:Bank deposits - 23.979Account receivables - 150.138Vessels, at book value - 2.574.004
0 2.748.121
In addition the Company has assigned future freight income, and any insurance payment as security for debt. Taxesowed on behalf of employees, NOK 4.806, are commited resourced deposited into separate account, but areincluded in bank deposits.
Guarantee:Guarantee liabilities not included in the balance sheet 1.522.167 207.627
Mortgage debt has been transferred from Farstad Shipping to Farstad Supply as a part of the adaptation to the newtax regime for Shipping Companies. Farstad Shipping remains as guarantor for this debt, amounting to NOK1,521,772 at 31.12.99.
NOTE
17NOTE
17Result sorted by business segments
Freight Operating Operating Depreciation Operating Book value income costs profit I(EBDIT) profit II (EBIT) vessels*)
AHTS 398.745 213.308 185.437 78.106 107.331 1.384.075PSV incl. Lochnagar 397.099 213.178 183.921 78.285 105.636 1.228.978Total vessels 795.844 426.486 369.358 156.391 212.967 2.613.053Norwegian sector 207.231 113.629 93.602 39.657 53.945 789.576British sector 246.175 124.845 121.330 42.122 79.207 497.733Brazil 220.554 105.934 114.620 44.819 69.800 795.304Far East/Australia 117.670 77.917 39.754 28.798 10.956 244.077Other markets 4.214 4.160 54 994 (940) 286.363Total sector 795.844 426.486 369.358 156.391 212.967 2.613.053
For 1999 the investment has been NOK 317.974 in new ATHS vessels and NOK 442.637 in new PSV’s. Totalinvestment NOK 760.611. Operating profit (EBIT) for Farstad Shipping are NOK 215.366. The difference ofNOK 2.366 is divided between other revenues NOK 5.492, sales of fixed assets NOK 154 and other depreciationNOK 3.247.
In 1999, some of the vessels have had activity in more than one area. When allocating costs/ revenues for eachgeographical area, consideration has been made to actual revenues. However, the vessels’ operating costs areprorated. The depreciation is allocated using the same principle as other costs. The administration overheadcosts related to the entity as a whole are allocated equally between the vessels.
*) The book value breakdown per vessel by geographical location was determined using the end of 1999 as basis.Book value as of 31.12.99 was used, and includes the individual vessel’s accrued periodic maintenance costs asof that date.
18
NOTE
18NOTE
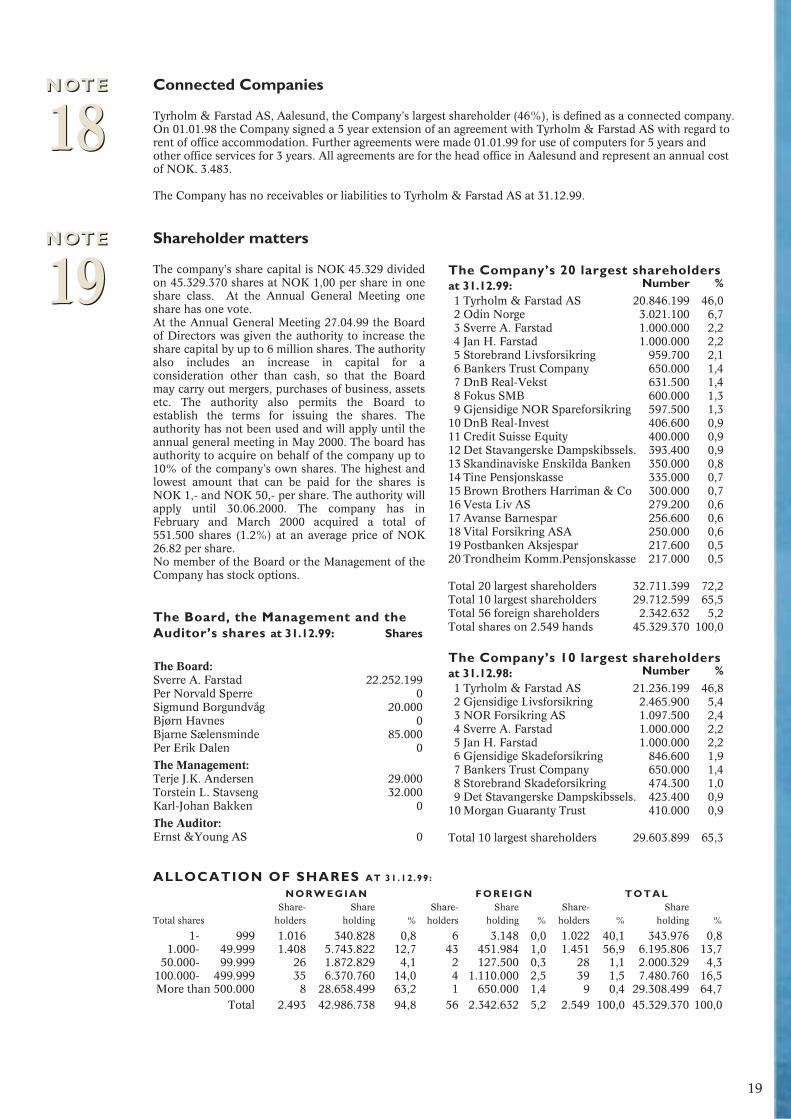
18Connected Companies
Tyrholm & Farstad AS, Aalesund, the Company’s largest shareholder (46%), is defined as a connected company.On 01.01.98 the Company signed a 5 year extension of an agreement with Tyrholm & Farstad AS with regard torent of office accommodation. Further agreements were made 01.01.99 for use of computers for 5 years andother office services for 3 years. All agreements are for the head office in Aalesund and represent an annual costof NOK. 3.483.
The Company has no receivables or liabilities to Tyrholm & Farstad AS at 31.12.99.
The Company’s 20 largest shareholdersat 31.12.99: Number %1 Tyrholm & Farstad AS 20.846.199 46,02 Odin Norge 3.021.100 6,73 Sverre A. Farstad 1.000.000 2,24 Jan H. Farstad 1.000.000 2,25 Storebrand Livsforsikring 959.700 2,16 Bankers Trust Company 650.000 1,47 DnB Real-Vekst 631.500 1,48 Fokus SMB 600.000 1,39 Gjensidige NOR Spareforsikring 597.500 1,3
10 DnB Real-Invest 406.600 0,911 Credit Suisse Equity 400.000 0,912 Det Stavangerske Dampskibssels. 393.400 0,913 Skandinaviske Enskilda Banken 350.000 0,814 Tine Pensjonskasse 335.000 0,715 Brown Brothers Harriman & Co 300.000 0,716 Vesta Liv AS 279.200 0,617 Avanse Barnespar 256.600 0,618 Vital Forsikring ASA 250.000 0,619 Postbanken Aksjespar 217.600 0,520 Trondheim Komm.Pensjonskasse 217.000 0,5
Total 20 largest shareholders 32.711.399 72,2Total 10 largest shareholders 29.712.599 65,5Total 56 foreign shareholders 2.342.632 5,2 Total shares on 2.549 hands 45.329.370 100,0
The Company’s 10 largest shareholdersat 31.12.98: Number %1 Tyrholm & Farstad AS 21.236.199 46,82 Gjensidige Livsforsikring 2.465.900 5,43 NOR Forsikring AS 1.097.500 2,44 Sverre A. Farstad 1.000.000 2,25 Jan H. Farstad 1.000.000 2,26 Gjensidige Skadeforsikring 846.600 1,97 Bankers Trust Company 650.000 1,48 Storebrand Skadeforsikring 474.300 1,09 Det Stavangerske Dampskibssels. 423.400 0,9
10 Morgan Guaranty Trust 410.000 0,9
Total 10 largest shareholders 29.603.899 65,3
The Board, the Management and theAuditor’s shares at 31.12.99: Shares
The Board:Sverre A. Farstad 22.252.199Per Norvald Sperre 0Sigmund Borgundvåg 20.000Bjørn Havnes 0Bjarne Sælensminde 85.000Per Erik Dalen 0
The Management:Terje J.K. Andersen 29.000Torstein L. Stavseng 32.000Karl-Johan Bakken 0
The Auditor:Ernst &Young AS 0
ALLOCATION OF SHARES AT 31.12.99:
N O R W E G I A N F O R E I G N T O T A LShare- Share Share- Share Share- Share
Total shares holders holding % holders holding % holders % holding %
1- 999 1.016 340.828 0,8 6 3.148 0,0 1.022 40,1 343.976 0,81.000- 49.999 1.408 5.743.822 12,7 43 451.984 1,0 1.451 56,9 6.195.806 13,7
50.000- 99.999 26 1.872.829 4,1 2 127.500 0,3 28 1,1 2.000.329 4,3100.000- 499.999 35 6.370.760 14,0 4 1.110.000 2,5 39 1,5 7.480.760 16,5More than 500.000 8 28.658.499 63,2 1 650.000 1,4 9 0,4 29.308.499 64,7
Total 2.493 42.986.738 94,8 56 2.342.632 5,2 2.549 100,0 45.329.370 100,0
NOTE
19NOTE
19Shareholder matters
The company’s share capital is NOK 45.329 dividedon 45.329.370 shares at NOK 1,00 per share in oneshare class. At the Annual General Meeting oneshare has one vote.At the Annual General Meeting 27.04.99 the Boardof Directors was given the authority to increase theshare capital by up to 6 million shares. The authorityalso includes an increase in capital for aconsideration other than cash, so that the Boardmay carry out mergers, purchases of business, assetsetc. The authority also permits the Board toestablish the terms for issuing the shares. Theauthority has not been used and will apply until theannual general meeting in May 2000. The board hasauthority to acquire on behalf of the company up to10% of the company’s own shares. The highest andlowest amount that can be paid for the shares isNOK 1,- and NOK 50,- per share. The authority willapply until 30.06.2000. The company has inFebruary and March 2000 acquired a total of551.500 shares (1.2%) at an average price of NOK26.82 per share.No member of the Board or the Management of theCompany has stock options.
19
NOTE
20NOTE
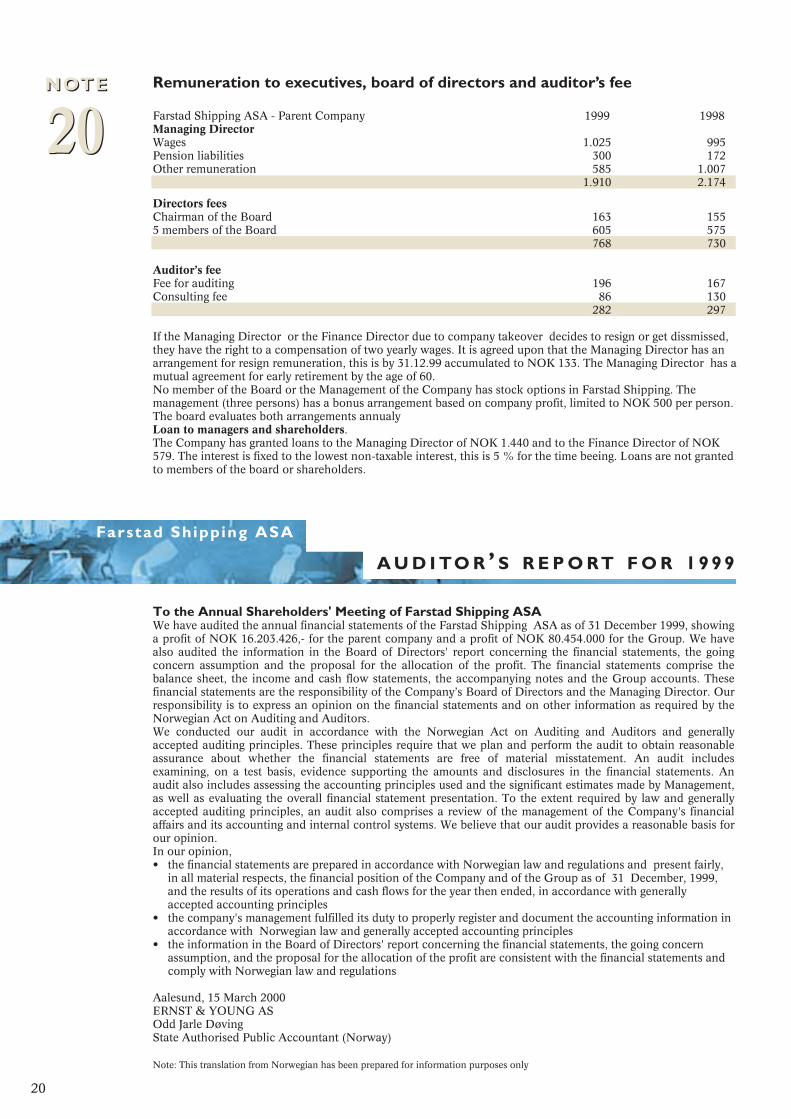
20Remuneration to executives, board of directors and auditor’s fee
Farstad Shipping ASA - Parent Company 1999 1998Managing DirectorWages 1.025 995 Pension liabilities 300 172 Other remuneration 585 1.007
1.910 2.174
Directors feesChairman of the Board 163 1555 members of the Board 605 575
768 730
Auditor’s feeFee for auditing 196 167Consulting fee 86 130
282 297
If the Managing Director or the Finance Director due to company takeover decides to resign or get dissmissed,they have the right to a compensation of two yearly wages. It is agreed upon that the Managing Director has anarrangement for resign remuneration, this is by 31.12.99 accumulated to NOK 133. The Managing Director has amutual agreement for early retirement by the age of 60.No member of the Board or the Management of the Company has stock options in Farstad Shipping. Themanagement (three persons) has a bonus arrangement based on company profit, limited to NOK 500 per person.The board evaluates both arrangements annualy Loan to managers and shareholders.The Company has granted loans to the Managing Director of NOK 1.440 and to the Finance Director of NOK579. The interest is fixed to the lowest non-taxable interest, this is 5 % for the time beeing. Loans are not grantedto members of the board or shareholders.
Farstad Shipping ASA
To the Annual Shareholders' Meeting of Farstad Shipping ASAWe have audited the annual financial statements of the Farstad Shipping ASA as of 31 December 1999, showinga profit of NOK 16.203.426,- for the parent company and a profit of NOK 80.454.000 for the Group. We havealso audited the information in the Board of Directors' report concerning the financial statements, the goingconcern assumption and the proposal for the allocation of the profit. The financial statements comprise thebalance sheet, the income and cash flow statements, the accompanying notes and the Group accounts. Thesefinancial statements are the responsibility of the Company’s Board of Directors and the Managing Director. Ourresponsibility is to express an opinion on the financial statements and on other information as required by theNorwegian Act on Auditing and Auditors.We conducted our audit in accordance with the Norwegian Act on Auditing and Auditors and generallyaccepted auditing principles. These principles require that we plan and perform the audit to obtain reasonableassurance about whether the financial statements are free of material misstatement. An audit includesexamining, on a test basis, evidence supporting the amounts and disclosures in the financial statements. Anaudit also includes assessing the accounting principles used and the significant estimates made by Management,as well as evaluating the overall financial statement presentation. To the extent required by law and generallyaccepted auditing principles, an audit also comprises a review of the management of the Company's financialaffairs and its accounting and internal control systems. We believe that our audit provides a reasonable basis forour opinion.In our opinion,• the financial statements are prepared in accordance with Norwegian law and regulations and present fairly,
in all material respects, the financial position of the Company and of the Group as of 31 December, 1999, and the results of its operations and cash flows for the year then ended, in accordance with generally accepted accounting principles
• the company's management fulfilled its duty to properly register and document the accounting information in accordance with Norwegian law and generally accepted accounting principles
• the information in the Board of Directors' report concerning the financial statements, the going concern assumption, and the proposal for the allocation of the profit are consistent with the financial statements and comply with Norwegian law and regulations
Aalesund, 15 March 2000ERNST & YOUNG ASOdd Jarle Døving State Authorised Public Accountant (Norway)
Note: This translation from Norwegian has been prepared for information purposes only
A U D I TO R ’ S R E P O RT F O R 1999
20
II

Positive
• Major increase in the oil price
• No fatalities
• High operational quality
• Received HSE award from SAGA Petroleum
• Large percentage of term contracts
• Delivery of four new vessels in time and within budget
22
Farstad Shipping ASA

H I G H L I G H T S I N 1999
• Falling demand for supply vessels
• Cancellation of two term contracts
• One vessel laid up
• Large increase in crew costs
• Unstable working conditions- additional changes in the
taxation rules for shipping companies
• Increase in international interest rates
• Low share price
Negative
23

Mike GibbonSafety & Personnel Manager
Richard StablesAccountant
John R. MaxwellGeneral & Chartering Manager
Trevor ReidShip Manager
George GrantShip Manager
Jim WattShip Manager
Magnar GjerdeQuality/Safety Manager
Sylvi L. EliassenChartering Manager
Idar GjerdeFinance Manager
Hallkjell DahleFinance Manager IOS
Rolf SynnesCrewing Manager
Jan H. FarstadTechnical Manager
Felipe MeiraGeneral Manager
Marco MeloPurchaser
Nadimo NakhleOperations Supervisor
Carlos Temke and Aristido Reichert are employed by Petroserv, but are offering services to BOS according to a seperate agreement.
Adriana MonteiroAdministration Supervisor
24
Farstad Shipping ASA
Farstad Shipping ASAThe company’s headquarter is inAalesund. The company had at theyear-end 30 employees. This officeoperates 16 of the company’s vesselswith a crew of 328. In addition theoffice is responsible for supervising theconstruction and later operation of onevessel. The operation includes oneAHTS trading the North Sea and oneAHTS in Brazil, both owned by IOS.The vessels located in Brazil areoperated in coopertion with BOS.
Torstein L. StavsengFinance Director
Terje J. K. AndersenManaging Director
Karl-Johan BakkenDirector Market/Operation
Aalesund harbour
Aberdeen harbour
Macaé harbour

Farstad Shipping Ltd. The company is our managing office inAberdeen, with a total of 11 employees.The office is responsible for operating 9supply vessels and Lochnagar, whichwas reconstructed to a pipelaying vesselfor flexible pipes in 1998. The vessel isnow working in Brazil and are operatedin cooperation with DSND ConsubS.A. In total the office hasresponsibility of 193 sailors, most ofwhom is British. The office had thesupervision of construction of twoPSV’s built for Farstad in Glasgow in1998/99.BOS Navegacao LtdaBOS (Brazilian Offshore Services) wasestablished in June 1999 to operate,crew and market the Farstad vessels inBrazil. Also other shipping companies(Sealion and Solstad) have contractedBOS for their local operations. Thecompany now operates 11 vessels. The
company’s office is centrally situatednear the Petrobras base in Macae. BOShas 7 employees. 76 crew members areserving on the Farstad vessels. BOS is a joint venture company on a50/50 basis with Petroserv S.A.Petroserv is a Brazilian offshore servicecompany with long traditions withinthe Brazilian oil industry.Farstad Supply ASFarstad Supply is the ship owningcompany of the Farstad Group. Thecompany was founded in 1997, as aresult of the company’s efforts to adaptto the new tax regime for shippingcompanies. In the beginning of 2000,the Company owned 24 vessels, and 1vessel on order for delivery 25 February2000. The company has no employees.
P/R International Offshore Services ANSIOS owns 9 vessels. In addition it hasone vessel on a bare-boat contract. Thecompany was in March 2000 awarded a5-year coctract (+ 15 years options) fora vessel to be built by a South Koreanyard. The project is described on page37.The company has no employees.Farstad Shipping is the businessmanager for IOS. P&O Maritime Services in Melbourneis responsible for the operation of the 8vessels that IOS currently have in theFar East/Australia.Farstad International AS and Farstad Brasil ASThese companies have no functionbesides beeing the owner of IOS andBOS respectively.
Farstad Shipping ASA
P&O AUSTRALIA
100%
50%50%
FARSTAD SUPPLY AS
P/R INTERNATIONAL OFFSHORE SERVICES ANS
FARSTAD INTERNATIONAL AS
100%PETROSERV
50%50%
BOS NAVEGAÇÃO LTDA
FARSTAD BRASIL AS
100%
FARSTAD SHIPPING LTD.
25
A D M I N I S T R AT I O N A N D O R G A N I S AT I O N
100%

M A I N F I N A N C I A L F I G U R E S
1995
442.8
72.2
(220.0)
295.0
(116.9)
178.1
(35.2)
142.9
1,271.6
311.8
1,583.5
705.3
822.1
56,.1
238.1
255.8
248.1
1,583.5
705.3
44.5%
1,224.4
736.3
1999
801.3
0.2
(426.5)
375.0
(159.6)
215.4
(129.3)
86.0
2,688.8
392.9
3,081.7
1,223.7
1,693.2
164.8
186.8
228.2
287.3
3,081.7
1,223.7
39.7%
2,613.1
1,693.1
1998
706.7
62.0
(347.6)
421.1
(118.9)
302.2
(43.4)
258.7
2,087.7
281.4
2,369.1
1,188.6
1,047.5
133.1
133.4
148.4
369.5
2,369.1
1,188.6
50.2%
1,866.2
1,045.4
1997
598.3
75.1
(275.0)
398.5
(124.5)
274.0
(33.6)
240.4
1,709.2
259.3
1,968.5
976.9
877.3
114.3
167.6
145.0
368.3
1,968,.5
976.9
49.6%
1,579.0
875.9
1996
458.8
0.2
(242.5)
216.5
(120.1)
96.4
(37.9)
58.6
1,319.8
273.6
1,593.4
713.5
813.9
66.0
197.5
207.7
180.0
1,593.4
713.5
44.8%
1,264.7
710.8
FARSTAD SHIPPING ASA - GROUP
Farstad Shipping ASA
26
PROFIT AND LOSS ACCOUNT (NOK mill.)
Operating income ex. sale of fixed assets
Profit on sale of fixed assets
Operating expenses
Operating profit before depreciation
Depreciation
Operating profit
Net financial items
Pre-tax profit
BALANCE SHEET
Current assets
Fixed assets
Total assets
Short-term liabilities
Long-term liabilities
Equity capital
LIQUIDITY
Liquid assets
Working capital (1)
Cash flow (2)
CAPITAL
Total assets
Equity capital
Equity ratio (3)
FLEET
Book value of vessels, interest in vessels
Mortgage debt

Farstad Shipping ASA
1999
45.3
25.50
1,155.9
26.80
19.00
1.77
1.77
6.34
6.34
1.00
-1.00
1998
45.3
21.00
951.9
43.00
19.80
5.67
4.30
8.15
6.78
1.00
-1.00
1997
45.3
42.00
1,903.8
50.50
24.00
5.30
3.65
8.12
6.47
1.00
-1.00
1996
79.3
24.25
1,099.2
24.50
14.95
1.30
1.30
3.97
3.97
0.75
0.00
1995
113.3
14.95
677.7
15.50
12.30
3.14
1.54
5.47
3.88
0.75
0.00
DEFINITIONS:(1) Current assets - short-term liabilities.(2) Pre-tax profit - taxes paid + depreciation + change in revaluation of liabilities.(3) Equity capital as a % of total assets.(4) Total share outstanding x share price at 31.12.(5) Pre-tax profit - taxes paid, divided by average number of shares outstanding.(6) (2) divided by the average shares outstanding.(7) For 1995 and 1996 by write-downs of the share capital in 1996 and 1997.(8) 01.01. of the year shown in the actual column.
1. quarter 2. quarter 3. quarter 4. quarter 1. quarter 2. quarter 3. quarter 4. quarter
O P E R A T I N G I N C O M E(excl. profit on sales)
C A S H F L O W(before tax and profit on sales of vessels)
19981997
199619951994
mill. NOK mill. NOK
1999 19981997
199619951994
1999
100
80
60
40
20
0
250
200
150
100
50
0
S H A R E K E Y F I G U R E S
27
(NOK)
Share capital (NOK mill.)
Market price at 31.12
Market capitalisation (4) (NOK mill.)
Share price high
Share price low
Earning per share including sales profit (5)
Earning per share excluding sales profit
Cash flow per share including sales profit (6)
Cash flow per share excluding sales profit
Dividend per share (7)
RISK-amount (8)

31.12.9631.12.9531.12.9431.12.9331.12.92
Far ScandiaUT 705
Far ScotsmanME 202
Far SeaME 303 II
Far CrusaderME 303
Development in value of vesselsPSV AHTS
Value of vessels vs. mortgage
MortgageBook valueMarket value
mill. NOK
mill. NOK
150
120
90
60
30
0
3500
3000
2500
2000
1500
1000
500
031.12.92 31.12.93 31.12.94 31.12.95 31.12.96 31.12.97 31.12.98 31.12.99
92 93 94 95 96 97 98 99
Value adjustedequity
TOTAL PER SHARE
mill. NOK NOK2500
2000
1500
1000
500
0
50
40
30
20
10
01 2 3 4 1 2 3 4 1 2 3 4 1 2 3 4
1996 1997 1998 1999
Development inEBIT-margins
%
50
40
30
20
10
0
Total Per share(NOK mill.) (NOK)
Market value vessels 3.385,9 74,70Book value vessels 2.613,1 57,65
Excess value vessels 772,8 17,05
Book equity 1.223,8 27,00
Value adjusted equity 1.996,6 44,05
Value adjusted equity (VAE)AT 31.12.99
30.06.9931.12.9831.12.97 31.12.99
Business SegmentsNote 17 on page 18 is presentingfinancial details for the differentbusiness segments. In addition, somefinancial information is also givenwhen presenting the various marketson the pages 32 - 41. The allocation ofcosts and revenues, as well as withbalance sheet items, is associated withuncertainties. Analysis of profitabilityby business segment do not always givethe real picture of a certain segment.Other factors should be taken intoconsideration. These are; the differentneeds and requirements with respect totonnage that exist in each individualmarket, the useful financial life of eachvessel differs between markets, the ageof the fleet, the duration ofcharterparties, operational risk, taxregulations, the need for a localpartner, differences in administrativeand marketing services rendered.Value adjusted equityat 31.12.99
Estimated VAE has declined byapproximately 10% compared to thevalue on Dec. 31 1998. At the end of1999, VAE was estimated at NOK 2.0Bn. The market value of the Company(share price multiplied by number ofshares outstanding) increased duringthe same period by approx. 20%. Themarket value declined in 1998 by 50%.At the end of 1999, market value wasNOK 1,156 million.The market value of vessels The market value of the fleet iscalculated by averaging estimates from3 independent Norwegian ship brokersat the end of 1999. For a detailed tableof the value estimates for each vessel,
28
Farstad Shipping ASA

please turn to page 47. The brokers’assessments assume that the vessels arewithout charter and available forimmediate sale. Values are presentedin NOK by the brokers. The development of vessels’ valuesduring the last few years are shown onpage 28, represented by two vesselsbuilt in 1983 (Far Scotsman and FarCrusader) and two vessels built in 1991.While the market value for the Farstadfleet fell in 1998 by 7% on average, themarket values given at the end of 1999indicate a further decrease of 12%.Due to the current market outlook,market values are not expected todecline any further.Variation in brokers’ estimates The brokers have submitted their valueestimates using a high-low range. Theaverage of the high end of the estimatesgives a fleet market value of NOK3,483.8 million, equivalent to NOK46.20 per share. The average of the lowend of the range gives values of NOK3,288.1 million for the fleet and NOK41.90 per share. A 10% change in fleet valuecorresponds to a change in VAE ofNOK 7.50 per share.Excess valueEstimates of the value adjusted equitydoes not take into consideration otheradditional values in the company thanthe excess values of the vessels. Thevalue estimates assume that vessels canbe sold individually. There are noadjustments for excess values that arederived from charter contracts alreadyin service. There are no adjustmentsfor excess values tied to vessels underconstruction. Thus, no adjustments aremade for changes in value which couldderive from a sale of the fleet, or a saleof the whole company as a goingconcern. Goodwill is valued at NOK 4.7 million.This balance comes from the 1993acquisition of Sverre Farstad & Co.A/S and Farstad Shipping Ltd. Noadjustments of this goodwill is includedin the valuation of Farstad Shipping.The last years’ acquisition trend hasclearly demonstrated that buyers are
willing to pay a considerable premiumabove fair market value of the fleetwhen gaining control of an entirecompany.TaxesValue adjusted equity after tax is notcalculated. Farstad Shipping has, fromthe tax year 1997 and onward, adaptedto the new tax regime for Norwegianshipping companies. Anyhow, thecompany would not have reached anormal tax position for many years dueto a substantial investment program.However, the transitional regulationsmade it advantageous to adopt to thenew tax law as of 1997. The companyviews this adaptation as a long-termeffort.Farstad Shipping’s tax position in thefuture depends upon the resultsachieved in those subsidiaries that arenot included in the new regulations, theextent of activities on the Australiancontinental shelves and continentalshelves having a withholding taxsystem. For details on the company’stax position at the end of 1999, pleaserefer to note 11 in the financialstatements.Interest and exchange rateFor further details we refer to note 13on page 17. To the right you will find afigure presenting the company’s mainlenders and the estimated mortgagesorted by currency at the end of year2000. The interest risk exposure at thebeginning of 2000 is estimated to beNOK 0.13 per share for every 1.0% p.a.change in US interest rates. Theequivalent effect for 1.0% p.a. changein Norwegian rates is NOK 0.09 pershare. For a similar change in Britishrates, the effect would be NOK 0.06 pershare. Interest rate exposure is reducedon a continuous basis through hedgingactivities. The company expects the followingbreakdown in its estimated freightrevenues for 2000, sorted by currency:NOK approximately 25%, GBP approx-imately 30%, USD approximately 38%,and AUD approximately 7%. Anincreasing part of the total freightincome is in foreign currencies. To
hedge this development a larger part ofthe company’s debt has been swoppedto corresponding currencies during thelatest years. The currency riskassociated with the portion of revenuesthat does not have an offsetting cost, isreduced through the use of hedginginstruments. The effect on the cashflow of currency fluctuations is at anytime depending on the actual forwardagreements entered into. On generelterms, strong foreign currencies (USD,AUD, GBP) are positive for thecompanies activities. Note 15 on page18 presents the forward agreementsentered into at the year end.
Mortgage sorted by currencyEstimate at 31.12.2000
*)incl. 50% of the debt in IOS, based onexchangerates at 31.12.99
Mortgage*) sorted by lender
Sp. Møre MeesPierson
CBK/IOS DNB CBK
USD AUD
GBP NOK
A N A LY T I C A L I N F O R M AT I O N
29
33,3% 35,1%
7,3%9,6%
14,7%
31,5%
47,8%
1,8%18,9%
Farstad Shipping ASA
Payment to shareholders(NOK per share)
1993 1994 1995 1996 1997 1998 1999
Oslo Stock Exchange index
1,00
0,80
0,60
0,40
0,20
0,00
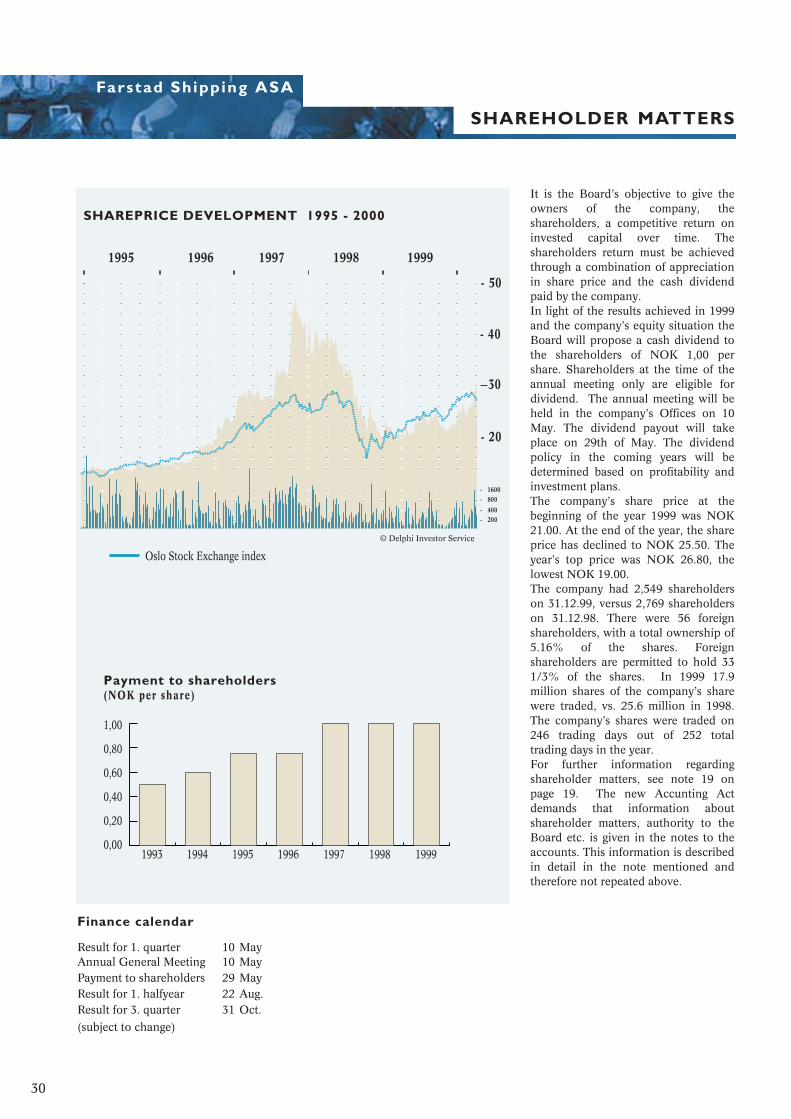
It is the Board’s objective to give theowners of the company, theshareholders, a competitive return oninvested capital over time. Theshareholders return must be achievedthrough a combination of appreciationin share price and the cash dividendpaid by the company.In light of the results achieved in 1999and the company’s equity situation theBoard will propose a cash dividend tothe shareholders of NOK 1,00 pershare. Shareholders at the time of theannual meeting only are eligible fordividend. The annual meeting will beheld in the company’s Offices on 10May. The dividend payout will takeplace on 29th of May. The dividendpolicy in the coming years will bedetermined based on profitability andinvestment plans.The company’s share price at thebeginning of the year 1999 was NOK21.00. At the end of the year, the shareprice has declined to NOK 25.50. Theyear’s top price was NOK 26.80, thelowest NOK 19.00.The company had 2,549 shareholderson 31.12.99, versus 2,769 shareholderson 31.12.98. There were 56 foreignshareholders, with a total ownership of5.16% of the shares. Foreignshareholders are permitted to hold 331/3% of the shares. In 1999 17.9million shares of the company’s sharewere traded, vs. 25.6 million in 1998.The company’s shares were traded on246 trading days out of 252 totaltrading days in the year. For further information regardingshareholder matters, see note 19 onpage 19. The new Accunting Actdemands that information aboutshareholder matters, authority to theBoard etc. is given in the notes to theaccounts. This information is describedin detail in the note mentioned andtherefore not repeated above.
SHAREHOLDER MATTERS
Finance calendar
Result for 1. quarter 10 May Annual General Meeting 10 MayPayment to shareholders 29 May Result for 1. halfyear 22 Aug.Result for 3. quarter 31 Oct.
(subject to change)
30
SHAREPRICE DEVELOPMENT 1995 - 2000
- 50
- 40
30
- 20
- 800- 1600
- 400- 200
© Delphi Investor Service
1995 1996 1997 1998 1999

Farstad Shipping ASA
StrategyOn a global basis, the accumulated fleetof supply vessels consists of 1600 - 1700units: somewhat dependent on what isdefined as being a supply vessel. In thelast few years, developments on aglobal basis have carried oil activitiesfrom shallow waters to deeper waters.The deepwater fields’ sizes have led tothe fact that these are priority areas forthe oil companies. This has led to achange in the requirements for enginecapacities and, not least, the winchcapacities of AHTS vessels, in order tobe able to operate safely and efficientlyin the bad weather and demandingconditions of deeper waters.The oil companies’ focus on costs hasled to a significant rationalisation of thetransport activity to oil installations inthe North Sea. This has occurredthrough increased co-operationbetween the oil companies. The co-operation occurs either directlybetween the com-panies or vialogistics/base companies. This has ledto a development in the direction ofusing fewer, but larger, PSV’s with largedeck areas and large tank capacitiesthat allow the simultaneous transportof many different types of cargo. One isalso now seeing an increase in the needfor larger PSV’s outside of the NorthSea too.For many years, Farstad Shipping hasconcentrated its efforts in that part ofthe market that demands the largestand most advanced tonnage. This has,amongst other things, led to the factthat we have built 8 large AHTS vesselsand 8 large PSV’s during the last 10years. An important part of our strategyhas also been to sell the older part ofthe tonnage, partly as a consequence ofdevelopments in the market and partlyin order to finance the renewal of thefleet.Proximity to the maritime industries inthe north west of Norway provides thecompany with good opportunities forco-operation with shipyards andequipment suppliers on the furtherdevelopment of vessels and vesselequipment. The company has activelyengaged itself in this development withthe aim of increasing safety andadapting to the changing needs of the customer. The commitment of oursailors, as well as the company’s abilityto use its experience and competence,has been central to this development.
The company’s international effort hasled to the fact that only 26% of 1999earnings came from the Norwegiansector. This internationalisation haspartly occurred in co-operation withothers and partly by our own initiative.The established operational structuremeans that the company has a relativelylarge amount of flexibility with a viewto moving vessels between the variousmarkets.The company’s vessels in the North Seaare operated from Aalesund or fromour wholly owned subsidiary inAberdeen. In 1999, the British sectorwas responsible for 31% of our income.
The activity in the Far East andAustralia occurs under the auspices ofIOS (International Offshore Services) ajoint venture between Farstad andP&O, Australia. Vessels in this regionare operated by P&O from Melbourne.Today, IOS has 8 vessels in this region.In 1999, this region was responsible for15% of Farstad’s income.In 1999, our efforts in Brazil werefurther consolidated by theestablishment of BOS (BrazilianOffshore Services), a company that isowned on a 50 – 50 basis with theBrazilian offshore company Petroserv.BOS is an operating company that wasestablished in order to follow up ouroperations, and possibly othercompanies’ vessels in Brazil. At the endof 1999, 7 of our vessels were engagedin Brazil. In 1999, 28% of our earningscame from this market.We chose to enter into a marketcollaboration with Tidewater in 1999 inorder to ease access to some othermarkets. This resulted with two of ourAHTS vessels securing contracts inTrinidad/Tobago in December 1999.The company will maintain a long-termchartering profile with the objective ofreducing exposure to short-term swingsin the demand for supply vessels.
STRATEGY
31
0
20
40
60
80
100
1995 1996 1997 1998 E-20001999
%
Norway UK Brazil
Far East/Autralia Other
Freight income Farstad ShippingSorted by region
DWT BHP

0 20 40 60 80
0 10 20 30 40 50 60
China
Canada
Mexico-Gulf
West-Africa
Far East/Australia
Brazil
North Sea
0 5 10 15 20
Brazil
Arabian-Gulf
China
Canada
Singapore
North Sea
US-Gulf
0 20 40 60 80 100 120
Canada
Mediteranien
Far East/Australia
South America
Mexico-Gulf
North Sea
Source: Petrodata
Sorted by CompanyAHTS>10.000 BHP og PSV>2.000 DWT
World-wide per December 99
Number of newbuildings per region
AHTS>10.000 BHP per region
PSV>2.000 DWT per region
Fleet structureThe years 1997 and 1998 were markedby large changes in ownership in theindustry. A very good market forsupply vessels led to the high pricing ofsupply company shares. This, combin-ed with good access to capital, wasdecisive for these changes being able totake place. American companies inparticular were active, which led to thefact that companies like Trico Marine,Gulf Offshore, Seacor and Tidewateralso became important players in theNorth Sea market when it comes tolarge supply vessels. There has beenlittle restructuring activity within theindustry during 1999.
Another consequence of the goodmarket in 1997 and 1998 was a largenumber of new orders. At the end of1998, there were still 80 large supplyvessels on order, despite the fact thatduring the course of 1998approximately 30 large supply vesselswere delivered. To a certain degree thisordering also continued in 1999 and2000. At the start of 2000, still morethan 40 vessels are on order. Most ofthe new builds will be delivered during
32
OtherToisa
MøksterSecundaOlympic
EddaSeamar
Taubåtkomp.Eidesvik
SwireHvide Marine
DOFSeacorHavila
SolstadTidewater
StirlingTrico Marine
Edison ChuoestGulf
Farstad/IOSMærsk
Newbuildings AHTSNewbuildings PSV
AHTSPSV
Newbuildings
Feb. 98Jan. 99
Dec. 99
Feb. 98Jan. 99
Dec. 99
Farstad Shipping ASA

the course of 2000. Approximately halfof the vessels on order are being built inthe USA for American companies.These are not expected to influence themarket situation outside of the Gulf ofMexico to any significant degree.The fall in the oil price in 1998 led to astrong reduction in the activities of theoil companies on a global basis as aconsequence of extensive cost cuttings.This, together with the delivery of alarge number of new builds, led to thefact that the market situation wasdifficult for the supply industry during1999. The result was a significant fall inrates and a large number of vessels incirculation. In addition, there was astrong fall in the prices for supply vesselcompanies shares. The fact that the oilprice fall was short-lived gives reason tobelieve that the feared crisis in thesupply industry will have more the formof a correction than a long-term crisis.There is therefore little to indicate thatthe downturn will force structuralchanges in the industry. Only a fewcompanies have so far had financialproblems.The North Sea is still the mostimportant market for large supplyvessels. This particularly applies to thelarge platform vessels. On a global basisthere were 109 large PSV’s in 1998, 90of these (82.5%) were in the North Sea.In the beginning of 1999, the global fleethad increased to 114 units, of which101 (88.6%) were in the North Sea. Atthe start of 2000 the number of units ona global basis has risen to 140.However, the number of units in theNorth Sea is almost unchanged (102units – equivalent to 74% of the totalfleet). This development must also beseen in connection with the fact thatsome PSV’s have been converted andthereby removed from the supplymarket. Several of the Norwegiansupply vessel companies have in the lastfew years chosen to concentrate onother areas as well as the traditionalsupply activity. This development willprobably continue.
The Gulf of Mexico has, notunexpectedly, seen the greatest growthin the number of PSV’s. Additionally,Brazil in particular has shown increasedinterest in large PSV’s at the beginningof a rationalisation process concerningtransport to and from oil installations.The market in the American part of theGulf of Mexico is reserved for Americanbuilt vessels. American supply vessel
companies now have 17 large PSV’sunder construction in the USA. Most ofthese are reported to have long-termemployment and are therefore expectedto remain in the Gulf of Mexico. Only 6large PSV’s are under constructionoutside the Gulf of Mexico.The North Sea’s relative share of theglobal fleet is also reducing when itcomes to large AHTS vessels. Thishowever is a development that has beengoing on for many years. In thebeginning of 1998 there were 115 largeAHTS vessels on a global basis. 54 ofthese (47%) were in the North Sea. Oneyear later the global fleet had risen to133 units, of which 60 (45%) were inthe North Sea. At the start of 2000 thenumber of units has risen to 149 on aglobal basis, of which 61 units (41%)are in the North Sea.
In the last few years, global oil activityhas increased significantly in deeper andmore demanding ocean areas. Of the 16new AHTS vessels that were deliveredin 1999, no less than 14 of them have anengine power output of more than15,000 hp. These were built to meet thisincreased activity. At the start of 2000there are still 18 large AHTS vesselsunder construction.
The restoration of the market balance inthe North Sea will be dependent onwhether the markets in Brazil, WestAfrica and the East/Australia continueto absorb surplus tonnage from theNorth Sea. At the same time it isimportant that the positive developmentin the Gulf of Mexico continues so thatthe new tonnage that was/is being builtfor this region finds work in the region.With today’s high oil prices there isreason to be optimistic that both mayoccur.
33
THE MARKET FOR OFFSHORE SUPPLY VESSELS
Lady Sandra towing the world largest FPSO «Northern Endeavor»

Source: Petrodata
The Market in BrazilIn 1994, Brazil chose to tie its currencyto the USD. Pressure increased onother overvalued currencies followingthe collapse of several fixed-rateregimes in Asia in 1997. This led to asignificant devaluation of the currencyat the beginning of 1999 as Brazil wasforced to introduce a new currencypolicy. They now adjust policyaccording to a target inflation rate thatprovides a more flexible exchange ratesystem. With regained trust and astabilised exchange rate the centralbank has started to lower the interestrates. The interest rate has come downfrom 42% to 19%. Inflation is expectedto fall further, from approximately 6%this year to 4% for 2001. Growth ofapproximately 3% in 2000, and 4.3%next year, is expected.Petrobras, which up to today has beenin a monopoly situation in Brazil,
produces, at the start of 2000,approximately 1.1 million barrels of oila day. Approximately 80% of thisproduction takes place offshore – ashare which is increasing. Petrobrashas ambitions of increasing this to
approximately 1.3 million barrels thisyear and 1.85 million barrels per day bythe end of 2005. Petrobras’ mostimportant area is the Campos Basin.75% of production takes places hereand 80% of the discovered reserves
34
Vessels in the region sorted by ownerper December 99
Development of the Brazilian currency, REAL
ToisaAugusta
HavilaWorkships
GulfTidewater
SolstadFinarge
Farstad/IOSMærsk
AHTS > 10000 HK
PSV > 2000 DWT
0 2 4 6 8 10
Farstad Shipping ASA
Result per sector Brasil
1999 1998
Freight income 220.554 154.037
Operation- and administration costs 105.934 87.434
Operating profit before depreciation (EDBIT) 114.620 66.603
Depreciation 44.819 28.284
Operating profit vessels (EBIT) 69.801 38.319
EDBIT % 52,0% 43,2%
EBIT % 31,6% 24,9%
Far Santana arrivesBrazil
The base of Macaé

exist in this area. The newestproductions fields are Marlin South andRoncador, which are expected to beable to produce up to 500,000 barrelsper day.As far as exploration activity goes, thishas also been expanded in the last fewyears to the area known as the "SantosBasin". A very promising find was madehere at the end of September 1999 at adepth of about 1,600 metres.A change in the law in 1997 opened upthe possibility of giving concessions toforeign oil companies on Brazilianfields. In addition, Petrobras was givenpermission to enter into co-operationwith international partners on alreadyallocated blocks. In total, Petrobras hassigned partnership contracts for 30 of itsblocks.The internationalisation process becameeven more visible with the setting up ofthe ANP (the Brazilian Oil Directorate)and the launching of the firstinternational bidding round in 1998.The bidding round resulted in the factthat 11 international oil companiesobtained concessions for 1 block ormore. Amerada Hess, Elf, Texaco, Shell,Mobil and Esso have now madeexploration programmes in Brazilpublic, with start-ups in summer/autumn 2000. The activity will takeplace at varying depths, however asignificant proportion will take place atdepths of more than 1,000 metres andthe deepest at almost 3,000 metres.In total, 4–6 new exploration rigs areexpected to arrive in the area during thecourse of this year. It is still uncertainwhat demand this will mean when itcomes to supply vessels. This will partlydepend on the collaboration contractsthat the new oil companies enter intowith Petrobras as far as the use of theirbases and vessels are conserned.Today, Petrobras charters around 100supply vessels, counting both small andlarge. A significant proportion of this isolder tonnage and vessels that are toosmall in relation to today’s needs. Thisis tonnage that shall be replaced over aperiod of time. There is a strong desirefrom the authorities’ side that therenewal shall have a strong Braziliancomponent. This means Brazilian built
tonnage and operation of the vessels bycompanies with Brazilian content. In ashort while Petrobras is expected to askfor tenders for 21 new vessels of variouscategories that will replace oldertonnage. Some of these will be mediumlarge AHTS vessels.About 30% of Farstad Shipping’s freightincome during 2000 is expected to comefrom activities in Brazil. Our vessels,five AHTS, one PSV and one cablelaying vessel, and carrying out taskswithin supplying, anchor handling, con-struction, underwater pipe laying andmaintenance in the fields in the CamposBasin, and operate out of the Petrobrasbase in Macaè, approximately 200 kmnorth east of Rio de Janeiro.
THE MARKET FOR OFFSHORE SUPPLY VESSELS
35
Employees in BOS

Real GDP Growth (%)
0 2 4 6 8
Vessels in the region sorted by owner per December 99
OtherGulf
TidewaterStirling
SwireSeacor
KinesiskMærsk
Farstad/IOS
Indonesia
Thailand
Malaysia
South-Korea
Japan
China
Australia
AHTS > 10000 HKPSV > 2000 DWT
1997 1998 1999
Source: Petrodata
The Market in Far East /Australia
Throughout 1999 the economies of thisregion exhibited substantial resiliencein recovering from the financial crisisthat beset the region in 1997. Rapidlyreturning to the status of the fastestgrowing region in the world, therecovery has been aided by thestrengthening of intra-regional tradeand improved financial management. Strong positive growth has returned tomany countries, including significantly
South Korea, Thailand, Malaysia andSingapore. China and Australia havemaintained consistently strong growthin recent years.In the northern regions, Chinacontinu-es to make the transition to amore open economy; however theWorld’s second largest economy, inJapan, remains relatively stagnant, with
little sign of improvement in the nearterm.The populous Indonesian archipelagois confronted with a range of economicand social issues as the newGovernment endeavours to improvethe social and business environment.Improvement in Indonesia is beingaided by external influences (partnersin the region and the IMF), howeverthe road to recovery will be longercompared to the experience of its
Lady Audrey
The naming of Lady Kari-Ann,
Lady SponsorKari-Ann Farstad
36
Farstad Shipping ASA
Result per sector Far East/Australia
1999 1998
Freight income 117.670 96.374
Opration- og administrations cost 77.916 48.707
Operating result before depreciation (EDBIT) 39.754 47.667
Depreciatin 28.798 21.868
Operating result vessels (EBIT) 10.956 25.799
EDBIT % 33,8% 49,5%
EBIT % 9,3% 26,8%
-15 -12 -9 -6 -3 0 3 6 9 12
Source: Deutsche Bank
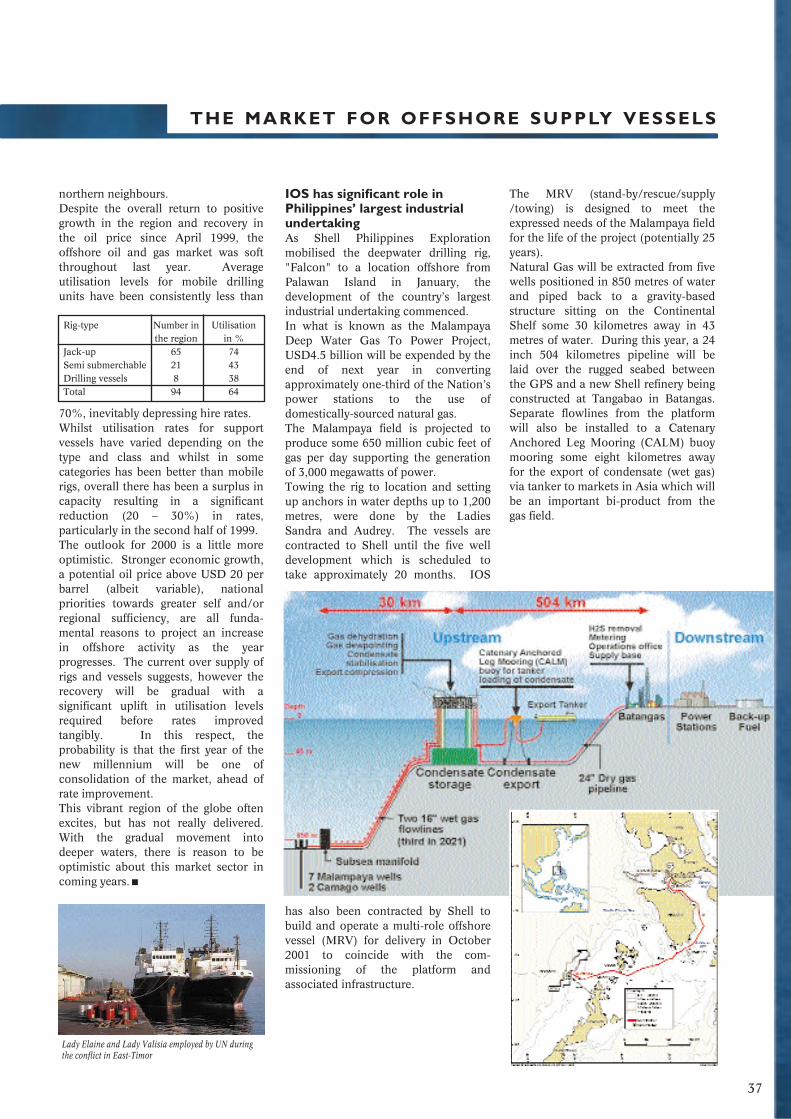
IOS has significant role in Philippines’ largest industrial undertaking As Shell Philippines Explorationmobilised the deepwater drilling rig,"Falcon" to a location offshore fromPalawan Island in January, thedevelopment of the country’s largestindustrial undertaking commenced.In what is known as the MalampayaDeep Water Gas To Power Project,USD4.5 billion will be expended by theend of next year in convertingapproximately one-third of the Nation’spower stations to the use ofdomestically-sourced natural gas.The Malampaya field is projected toproduce some 650 million cubic feet ofgas per day supporting the generationof 3,000 megawatts of power.Towing the rig to location and settingup anchors in water depths up to 1,200metres, were done by the LadiesSandra and Audrey. The vessels arecontracted to Shell until the five welldevelopment which is scheduled totake approximately 20 months. IOS
has also been contracted by Shell tobuild and operate a multi-role offshorevessel (MRV) for delivery in October2001 to coincide with the com-missioning of the platform andassociated infrastructure.
The MRV (stand-by/rescue/supply/towing) is designed to meet theexpressed needs of the Malampaya fieldfor the life of the project (potentially 25years). Natural Gas will be extracted from fivewells positioned in 850 metres of waterand piped back to a gravity-basedstructure sitting on the ContinentalShelf some 30 kilometres away in 43metres of water. During this year, a 24inch 504 kilometres pipeline will belaid over the rugged seabed betweenthe GPS and a new Shell refinery beingconstructed at Tangabao in Batangas.Separate flowlines from the platformwill also be installed to a CatenaryAnchored Leg Mooring (CALM) buoymooring some eight kilometres awayfor the export of condensate (wet gas)via tanker to markets in Asia which willbe an important bi-product from thegas field.
northern neighbours. Despite the overall return to positivegrowth in the region and recovery inthe oil price since April 1999, theoffshore oil and gas market was softthroughout last year. Averageutilisation levels for mobile drillingunits have been consistently less than
70%, inevitably depressing hire rates.Whilst utilisation rates for supportvessels have varied depending on thetype and class and whilst in somecategories has been better than mobilerigs, overall there has been a surplus incapacity resulting in a significantreduction (20 – 30%) in rates,particularly in the second half of 1999. The outlook for 2000 is a little moreoptimistic. Stronger economic growth,a potential oil price above USD 20 perbarrel (albeit variable), nationalpriorities towards greater self and/orregional sufficiency, are all funda-mental reasons to project an increasein offshore activity as the yearprogresses. The current over supply ofrigs and vessels suggests, however therecovery will be gradual with asignificant uplift in utilisation levelsrequired before rates improvedtangibly. In this respect, theprobability is that the first year of thenew millennium will be one ofconsolidation of the market, ahead ofrate improvement.This vibrant region of the globe oftenexcites, but has not really delivered.With the gradual movement intodeeper waters, there is reason to beoptimistic about this market sector incoming years.
Lady Elaine and Lady Valisia employed by UN duringthe conflict in East-Timor
THE MARKET FOR OFFSHORE SUPPLY VESSELS
37
Rig-type Number in Utilisationthe region in %
Jack-up 65 74Semi submerchable 21 43Drilling vessels 8 38Total 94 64

No. of AHTS>10.000 BHP
No. ofnewbuildings
AHTS in the North Sea sorted by ownerper December 99
Other
Eidesvik
DOF
Farstad/IOS
Gulf
Swire
Havila
Trico Marine
Solstad
Mærsk
0 5 10 15 20
No. of PSV>2.000 DWT
No. ofnewbuildings
PSV in the North Sea sorted by ownerper December 99
OtherOlympicSolstad
EidesvikSeatruck
ToisaSeacorMærsk
EddaDOF
HavilaTidewater
Trico MarineFarstadStirling
Gulf Offshore
0 5 10 15 20
North Sea marketThe Market BalanceAt the start of 1999, it was expectedthat the average utilisation rate during1999 for all of the North Sea tonnagewould be as low as 79%. The fact thatit was actually 87% is due to that factthat the increase in tonnage has been
lower than what one might have fearedwhen one saw the number of vessels onorder at the start of 1999. Vessels havegone to other markets to a greaterdegree than expected. As a com-parison, the average utilisation rate in1998 was not less than 95%.
During the first six months of 1999, theaverage utilisation rate fell fromapprox. 95% in the first half of 1998 toapprox. 89%. While demand during thefirst half of 1999 was on a par with thefirst half of 1998, the market fellbecause of increased access to tonnage.The market was further affected duringthe third quarter by increasing surplustonnage. In addition, demand fell byapprox. 5% compared to the sameperiod in 1998. This gave utilisationrates of approx. 85% compared to 97-
100
80
60
40
20
0
Demand UtilisationSupply
%Boat-years
Development in demand for offshore supply vessels
1992 1993 1994 1995 1996 1997 1998 1999 E-00
300
250
200
150
100
50
0
Boat-years
Term demand sorted by activity
1992 1993 1994 1995 1996 1997 1998 1999 E-00
250
200
150
100
50
0
38
Production Construction Drilling
Boat-years
Term demand sorted by sector
200
150
100
50
0
UK-sector Norwegian sector North Sea others
Spot1994 1995 1996 1997 1998 1999 E-00
Farstad Shipping ASA
Result per sector Norwegian sector British sector
1999 1998 1999 1998
Freight income 207.231 159.163 246.175 293.477
Operation- and administrations cost 113.628 76.439 124.846 135.047
Operating result before depreciation (EDBIT) 93.603 82.724 121.329 158.430
Depreciation 39.657 29.101 42.122 36.733
Operating resulr vessels (EBIT) 53.946 53.623 79.207 121.697
EDBIT % 45,2% 52,0% 49,3% 54,0%
EBIT % 26,0% 33,7% 32,2% 41,5%
Source: Petrodata

98% for the same period in 1998. The market balance worsened furtherduring the fourth quarter and theaverage utilisation rate ended up as 82%for the quarter (93% during the fourthquarter 1998). However, the fall duringthe fourth quarter was caused bydemand since the reduction of tonnagefrom the North Sea was greater than theinflux of tonnage.When the utilisation rate in the marketis lower than 90%, it often hassignificant effects on the rates. Everymonth in 1998 had an averageutilisation rate of over 90%. Only twomonths (January and May) hadutilisation rates of 90% or more during1999. The fall in the level of ratesthroughout 1999 has however beensignificant.The prognosis for the North Sea marketindicates that 2000 will also be weak.The average utilisation rate is expectedto be as low as 83% for 2000. This fall isdue to supply. However, recentdevelopments provide hope that duringthe spring/summer there may be periodswhere the utilisation rate rises toaround 90%. This is realistic if thereduction in tonnage trend in the NorthSea continues, and if one avoidsbringing laid up vessels back into themarket too early.Development in the demand foroffshore service vesselsDespite a bad market for offshoreservice vessels in 1999, demand in theNorth Sea only fell by 5 boat-years from1998 to 1999. This is equivalent to2.5%. The primary reason for the factthat the fall was not greater was therelatively stable demand that productionrelated activities involve, as well as aconstruction season that was somewhatmore extensive than expected. Neitheris a large fall in demand expected in2000. Today’s prognosis indicates a fallin demand of about 2% during 2000.If one looks at the short-term contractmarket in isolation, then demand in theNorth Sea has fallen by 12 boat-years(7,5%) during 1999, from 158 to 146boat-years. It is in the British sector thatdemand has fallen. Demand has fallenby about 15% in the short-term contractmarket during 1999, from 95 to 70 boat-years. The Norwegian sector hasactually had higher activity during 1999compared to 1998. Some downturn in
demand is expected in the short-termcontract market, in both the Norwegianand the British sectors, during 2000.As is evident from the above there hasbeen a clear change in demandthroughout 1999 in that a smaller shareof the demand came in the form ofshort-term contracts. While short-termcontracts made up 81% of the demandin 1997 and 1998, this share fell to76.8% in 1999. It is expected to fallfurther in 2000 to approx. 74%.Such a change was made possible by theincrease in available tonnage, and thishas also caused the dramatic fall in the
rates compared to 1997 and 1998. Inaddition to the rate fall, severalcompanies, including Farstad Shipping,experienced the cancellation of long-term charter contracts. This led to afurther increase in available tonnage. Attimes, the level of rates fell to belowoperating levels. In these prevailingmarket conditions the newest and besttonnage was preferred ahead of olderand smaller tonnage. The consequenceof this is that 20 or so vessels have beenlaid up.At times, Farstad Shipping has had 2 to3 vessels available on the 1999 spotmarket in the North Sea that have thusbeen affected by these marketdevelopments. It was decided to lay upone platform vessel in July. At the startof 2000, Farstad Shipping had novessels in the North Sea spot market.More on the short-term contract marketApproximately 80% of the short-termcontract market is covered by what, inthis context, are called large PSV’s andAHTS vessels. The comparable share in1993 was 62%. The growth has beencaused by the largest PSV’s(DWT>3,000). Today, these have 36%of the short-term contract market.
Supplying production fields andemergency servicesThe demand from fields in productioncame to 115 boat-years in 1999, only 1boat-year less than in 1998. Productionrelated activity in 1999 accounted forapprox. 78% (73% in 1998) of theaccumulated demand in the short-termcontract market. In 1991/1992, thisshare was approx. 50%. Some reductionin demand is expected for 2000, thoughit will still be high in a historicalperspective. Production related activityis also expected to remain at aconsistently high level in the years to
come.Supply services for production fieldsconsist of the transport of general cargo,primarily in containers, as deck cargo. Amodern supply vessel also transports alarge number of different products suchas methanol, drilling fluids, brine, waterand fuel. In addition, dry bulk cargoeslike cement, barite and bentonite aretransported.Producing oil fields use large AHTSvessels for emergency standby services.This is because the vessels, in additionto tug and anchor handling functions,have equipment that make them wellsuited for fire extinguishing, rescue andoil recovery.Construction activityDemand related to the development ofnew fields and infrastructure such asflow lines sub sea developments andloading buoys came to 21 boat-years in1999 (26 boat-years in 1998). Again itwas pipe laying activity, particularly inthe Norwegian sector, that wasresponsible for maintaining the level ofactivity in this area in 1999. Pipe layingactivity is expected to be noticeablylower in 2000. Field development isexpected to contribute to the fact that
THE MARKET FOR OFFSHORE SUPPLY VESSELS
39

demand, as measured in boat-years,will maintain a 1999 level during 2000.This activity is expected to take placeduring the second and third quarter.
During the last few years, the demandfor offshore telecommunications cablelaying has been increasing. This hasalso been an important contributor tomaintaining a high utilisation rate forlarge PSV’s during 1999.Exploration activitiesAs a consequence of significantimprovements in productivity andlogistics, the number of offshore servicevessels involved in supportingexploration activities has fallensignificantly in the last few years. The
fall was further exacerbated in 1999 bythe oil companies’ cost reductions, withthe consequent reduced rig activity.Whilst demand for supply vessels forthis type of activity in 1992 came to 61boat-years, it came to just 10 boat-yearsin 1999, a fall of 6 boat-years from1998. Demand in this area has almosthalved since 1997. A further reductionin demand is expected during 2000.Future developments will depend onthe number of rigs engaged inexploration activities and, not least,
where the rigs are active geographically.As per today, approximately 20 rigs arelaid up in the North Sea. Exploration indeeper and more distant waters willinvolve greater vessel demand than ifthe rigs are used connected to existinginfrastructure. AHTS vessels are mostoften only used for moving the rig inareas with good infrastructure. Duringthe drilling phase, chartered supplyvessels that serve both permanentproduction installations and movableexploration rigs supply the rig. Thismeans that the vessel demand per rig-year in the North Sea is now down tobelow 0.3 boat-years. Using the rig inmore remote areas will, in many cases,mean a need for two AHTS vessels.The spot marketDemand in the spot market hastraditionally made up about 20–25% ofthe accumulated demand. However, thetough market conditions during 1997and 1998 led to the spot market’s shareof the accumulated demand falling tounder 20%. This happened because attimes there was no available tonnageon the spot market. It is expected thatthe percentage share will be over 25%during 2000.Emergency services for the UKCoastguardEmergency Towing Vessel (ETV)During the last few years, in theautumn and winter months (October toMarch), HM Coastguard has chartered3 large AHTS vessels as ETV’s for thebusiest and most exposed areas alongthe British coastline. This winter two ofthese are Farstad vessels. FarstadShipping’s partner in this operation isthe salvage company: Howard SmithSalvage Ltd. Far Turbot has beenstationed in Dover, while Far Minarahas been based in Falmouth and patrolthe South West Approaches.
40
Far Turbot at exercise for the HM Coastguard. Photo: Sean Chapman
A working situation onboard the Far Grip
Farstad Shipping ASA

THE MARKET FOR OFFSHORE SUPPLY VESSELS
Other marketsNorth AmericaThe American part of the Gulf ofMexico is reserved for American builtvessels. American supply vesselcompanies have, particularly during thelast few years, ordered a large numberof large PSV’s and some AHTS vessels.There are now 17 large PSV’s and 1AHTS vessel being built. Most of theseare reported to have long-termemployment and are expected,therefore, to remain in the Gulf ofMexico.When it comes to the Canadianmarket, this is also, in principle,reserved for locally built tonnage.However, externally built tonnage cangain access to the market by paying a25% import duty, based on the vessel’smarket value.As is shown by the graph the activity inthis region has increased significantlythroughout 1999. The number ofjackups in work has increased by about50% since April 1999. A furtherincrease is expected. We have not seenthe same development when it comesto semis, however there is still greatuncertainty with respect to the oilcompanies’ plans for 2000.West AfricaThe market in West Africa is alsoshowing clear signs of improvement.The upturn here is later arriving thanthe one we have seen in the Gulf. Atthe moment Farstad does not have anyvessels in this region. We have,however, entered into a collaborationwith Tidewater where they will marketour large AHTS vessels in this region.The greatest activity can be found inNigeria and Algeria. Large deepwaterfields have been found in both of thesecountries that will be developed withfloating production vessels. Othercountries in this region also appear tobe interesting deepwater regions, whichmeans that West Africa, except forBrazil, will be the deepwater regionthat will increase the most in the nextfew years.MediterraneanThis has traditionally been a smallmarket with the focus on shallowwaters. There are now plans for thedrilling of test wells in deep water inthe inner part, particularly off the coastof Egypt.
41
No. of AHTS>10.000 BHP
No. of PSV>2.000 DWT
AHTS>10.000 BHP and PSV>2.000 DWT in Canadasorted by owner per December 99
Atlantic
Havila
Secunda
Mærsk
0 2 4 6 8
No. of AHTS>10.000 BHP
No. of PSV>2.000 DWT
Newbuildings
No. of AHTS>10.000 BHP
No. of PSV>2.000 DWT
AHTS>10.000 BHP and PSV>2.000 DWT in the Gulf of Mexicosorted by owner per December 99
Astro
Ensco
Cal Dive
Tidewater
Sea Mar
Hvide
Gulf
Trico
Seacor
Edison Chou
0 5 10 15 20 25
AHTS>10.000 BHP og PSV>2.000 DWT in Africasorted by owner per December 99
Semco
Tidewater
Eidesvik
Surf
Hvide
Mærsk
0 2 4 6 8
Development in rig activity
150
120
90
60
30
25
20
15
10
0
Jackups North-America
04 06 08 10 12 02 04 06 08 10 1205 07 09 11 01 03 05 07 09 11
1999 2000
Semis North-America
Jackups West-Africa
Semis West-Africa

Health, Safety and Environmentin Farstad Shipping1988: Start of incident registration1990: Start of NCR registration 1994: Company was ISO 9002 certified1997: Company office and one vessel
ISM certified2000: ISM certification of North Sea
vessels2001: ISM certification of Brazil based
vesselsThe company’s vessels are operated inline with our customers’ expectations ofhigh quality. They are operated at a levelthat exceeds the requirements ofnational and international regulationswith respect to safety and theconservation of the environment. Thevessels undergo planned maintenanceprogrammes that are set up according torecommendations from equipmentsuppliers’, classification companies andthe authorities, as well as the company’sown experience.Farstad Shipping has introduced its ownrequirements, routines and systems thatfocus on preventative measures in orderto prevent and limit harm to people,equipment and the environment.Improvements can be achieved throughcontinuous and systematic reporting andthe following up of symptoms, incidentsand accidents.Through the management’s policy andan active commitment from all the links
in the chain, the company is equipped totake on the environmental challengesthat we see today and of the future andwe will work together to build up "ourculture" in order to minimise theenvironmental dangers in the vulnerablemaritime environment that surrounds usall.
Presented SAGAs HMS awardThe focus on Health, Safety andEnvironment (HSE) is steadily in-creasing. Shipping companies have for along time, as suppliers to the oilcompanies, been required to prioritisework with HSE. The requirements forcompanies’ systems and that these arefollowed up, are becoming steadilystronger. The presentation of SAGA’sHSE award is an important message toour staff that what is being done is beingnoticed, and will be an importantstimulant for future HSE efforts, withinFarstad Shipping.
The reason SAGA stated for thepresentation of its HSE awardto Farstad Shipping were thecompany’s many years ofsystematic work within Health,Safety and Environment, thecompany’s quality system andreporting procedures, as well as
new initiatives and newly developedequipment for improving the safety andwork environment onboard. SAGAparticularly mentioned the ship’s bridgesimulator in Trondheim, the DPsimulator at the polytechnic inAalesund and the development of a newtype of crane/deck manipulator forAHTS vessels.
HSE report 1999 Examples of measures that were im-plemented in 1999 with the aim ofimproving HSE are:
- A study of the company’s damage/ loss/accident statistics presented at the captain and chief engineer con- ference with a subsequent survey about the circumstanses and the causes, and where to improve.
- Internal committee formed to analysethe above further.
- Media training course for the management/office staff.
- Continual training of sea staff and updating of records
- The company’s reports ware copied to CD and distributed to the vessels.
- The aft bridge manouevering chair with integrated controls that was developed in 1998 together with a co-pilot chair for training purposes.
- Collaboration agreement (June 1999) with "Regatta" concerning the development of a new type of work-lifejacket for use offshore.
- Support for the development of an "offshore crane stabiliser unit". The idea being that the hands-free loading/unloading of deck cargo offshore or at base will improve the safety of the crews on the vessels.
- Agreement with Franzefoss Gjen-vinning A/S concerning the sorting ofwaste/rubbish disposal/rubbish regi-stration and training of vessel crews.
- Installation of waste disposal units onall new builds delivered in 1999.
- No problems in connection with the Y2K question. Cost approx. NOK 2 million.
- A "Check list for dealing with critical situations" was prepared for all of thevessels in connection with the company’s Y2K project.
Over: Farstad Shipping was present-ed SAGA’s Health, Safety and En-vironment award for 1998. ManagingDirector Terje J.K. Andersen re-ceives the award from ManagingDirector Diderik Schnitler, SAGA.The presentation of the award tookplace on 12th April 1999 at SAGA’soffices in Stavanger.
42
Farstad Shipping ASA
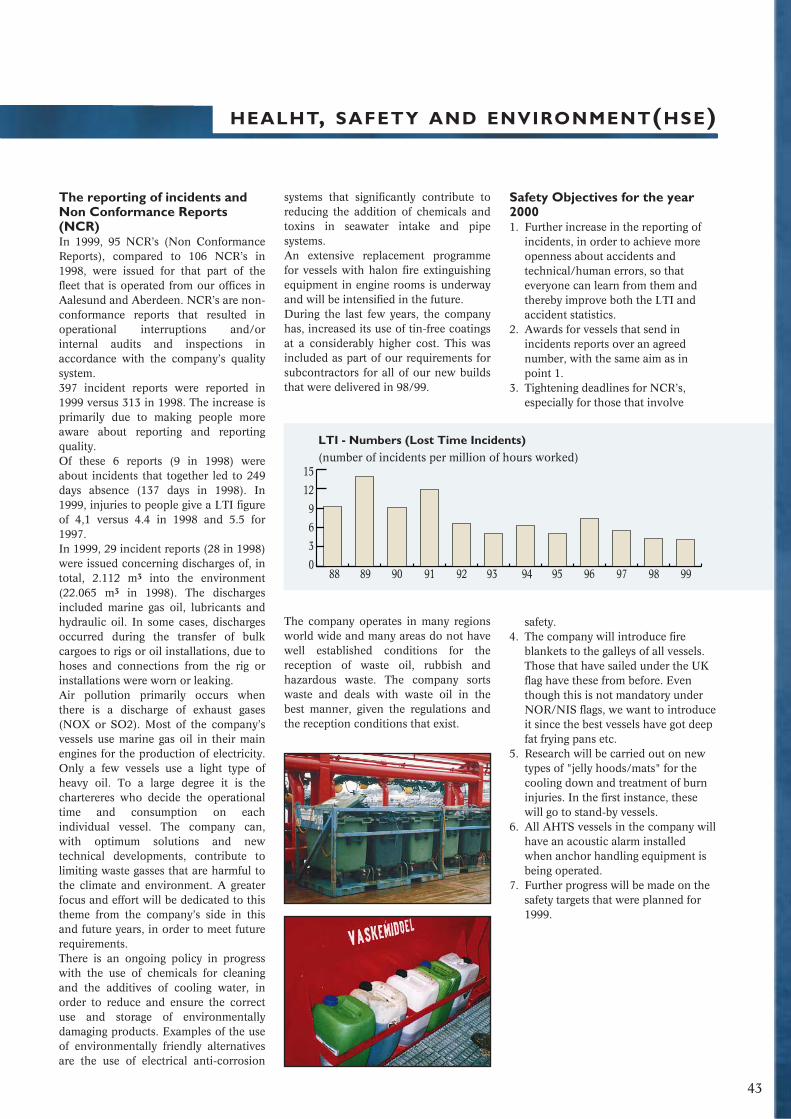
HEALHT, SAFETY AND ENVIRONMENT(HSE)
The reporting of incidents andNon Conformance Reports (NCR)In 1999, 95 NCR’s (Non ConformanceReports), compared to 106 NCR’s in1998, were issued for that part of thefleet that is operated from our offices inAalesund and Aberdeen. NCR’s are non-conformance reports that resulted inoperational interruptions and/orinternal audits and inspections inaccordance with the company’s qualitysystem.397 incident reports were reported in1999 versus 313 in 1998. The increase isprimarily due to making people moreaware about reporting and reportingquality. Of these 6 reports (9 in 1998) wereabout incidents that together led to 249days absence (137 days in 1998). In1999, injuries to people give a LTI figureof 4,1 versus 4.4 in 1998 and 5.5 for1997.In 1999, 29 incident reports (28 in 1998)were issued concerning discharges of, intotal, 2.112 m3 into the environment(22.065 m3 in 1998). The dischargesincluded marine gas oil, lubricants andhydraulic oil. In some cases, dischargesoccurred during the transfer of bulkcargoes to rigs or oil installations, due tohoses and connections from the rig orinstallations were worn or leaking.Air pollution primarily occurs whenthere is a discharge of exhaust gases(NOX or SO2). Most of the company’svessels use marine gas oil in their mainengines for the production of electricity.Only a few vessels use a light type ofheavy oil. To a large degree it is thechartereres who decide the operationaltime and consumption on eachindividual vessel. The company can,with optimum solutions and newtechnical developments, contribute tolimiting waste gasses that are harmful tothe climate and environment. A greaterfocus and effort will be dedicated to thistheme from the company’s side in thisand future years, in order to meet futurerequirements. There is an ongoing policy in progresswith the use of chemicals for cleaningand the additives of cooling water, inorder to reduce and ensure the correctuse and storage of environmentallydamaging products. Examples of the useof environmentally friendly alternativesare the use of electrical anti-corrosion
systems that significantly contribute toreducing the addition of chemicals andtoxins in seawater intake and pipesystems.An extensive replacement programmefor vessels with halon fire extinguishingequipment in engine rooms is underwayand will be intensified in the future.During the last few years, the companyhas, increased its use of tin-free coatingsat a considerably higher cost. This wasincluded as part of our requirements forsubcontractors for all of our new buildsthat were delivered in 98/99.
The company operates in many regionsworld wide and many areas do not havewell established conditions for thereception of waste oil, rubbish andhazardous waste. The company sortswaste and deals with waste oil in thebest manner, given the regulations andthe reception conditions that exist.
Safety Objectives for the year20001. Further increase in the reporting of
incidents, in order to achieve more openness about accidents and technical/human errors, so that everyone can learn from them and thereby improve both the LTI and accident statistics.
2. Awards for vessels that send in incidents reports over an agreed number, with the same aim as in point 1.
3. Tightening deadlines for NCR’s, especially for those that involve
safety.4. The company will introduce fire
blankets to the galleys of all vessels. Those that have sailed under the UK flag have these from before. Even though this is not mandatory under NOR/NIS flags, we want to introduceit since the best vessels have got deep fat frying pans etc.
5. Research will be carried out on new types of "jelly hoods/mats" for the cooling down and treatment of burn injuries. In the first instance, these will go to stand-by vessels.
6. All AHTS vessels in the company willhave an acoustic alarm installed when anchor handling equipment is being operated.
7. Further progress will be made on the safety targets that were planned for 1999.
43
LTI - Numbers (Lost Time Incidents)(number of incidents per million of hours worked)
88 89 90 91 92 93 94 95 96 97 98 99
15
12
9
6
3
0

Ship-bridge simulator
Bridge-/ manouevering chair on the port side
Deck Crane - Far Santana
Deck manipulator - Far Senior
Dynamic positioning (DP)
44
Measures implemented toimprove HSE1992: Development of the first VAR
generator for improved fuel
consumption
1996: Tank cleaning system for mud
tanks
1996: Initiative taken for the develop-
ment of ship’s bridge simulator
for supply vessels
1997: Development of the bridge –
manoeuvring chair
1998: Development of deck mani-
pulator
1999: Collaboration on the develop-
ment of simulators for dynamic
positioning
1999: Development of co-pilot chair
1999: Development of deck crane
Farstad Shipping ASA

Recruitement, training(Education) and qualifications EmployeesThe vessels of the Farstad fleet areregistered in different ship registers, asfollows: 10 in Norsk Ordinært Skips-register (NOR), 14 in Norsk Inter-nasjonalt Skipsregister (NIS), and 11 inthe Isle of Man ship register (IOM).The vessels are registered in differentship registers due to the requirementsfor local manning during operations onforeign continental shelves. Vesselswhich are registered in NOR cannotemploy local crew on local terms. Thecompany has 751 sailing co-workersfrom 16 countries, of which 293 arefrom Norway, 127 from Great Britain,112 from Australia, 76 from Brazil, and148 from various other countries.InternationalizationThe internationalization which hastaken place within our company overthe past years has lead to a strongerfocus on co-operation and com-munication between co-workers onshore and on board the vessels, withinand between the geographic areas inwhich the vessels are operating. Thiswill also have high priority in the future.Training and qualificationsThe STCW 95 Convention (Standard forTraining, Certificates and Watchkeepingfor Seafarers), with national adjust-ments, stipulate new national andinternational requirements for training.Among other things the convention hasrequirements in connection with thefact that all maritime officer certificateshave to be renewed by February 1st2002. The convention also stipulatesconsiderable requirements to supple-mentary training, such as personal life-saving techniques/rescue vessels, per-sonal safety, care and attention forhuman life and the environment,protection against fire and fireextinguishing, as well as first aid andmedical treatment.
By the end of 1999 the company has, toa high degree, carried out the trainingrequirements set forth by STCW 95 sothat the maritime certificates shall bevalid from February 2000. Thecompany’s sailing co-workers have, in1999, been through 26 different coursesand supplementary training, amountingto more than 2500 "course days" at atotal cost of approximately NOK 3,5million. The company will also in year2000 carry out an intensivetraining/supplementary training pro-
gramme according to our ownrequirements as well as therequirements of our charterers and theauthorities.Courses and supplementary training isdivided into two categories. Onecategory focuses on personal safetywithin protection/environment, fire,first aid, "new on board", life-boats. Theother category focuses on training in theuse of equipment on board (main-tenance systems, operation of winches,dynamic positioning, oil contingencyplan, computer training etc.).RecruitementThe recruitement work done throughcentral and local activities have lead toa considerable supply of young peopleseeking education and training withinthe maritime industries. The industryhas arranged apprenticeships andtraining positions in order to ensure asupply of young people seeking amaritime education.
In 1999 our company has had expensesof NOK 6,5 million for recruitement ofapprentices and junior officers, as wellas for training of certified instructors.The state refund contribution receivedby our company is in its entirety used tocover the costs of recruitementpositions and training. The state refundcontribution programme has lead to aconsiderable increase in the number ofNorwegian seamen and a recruitementwhich had not been possible to carryout without this programme.
HEALTH, SAFETY AND ENVIRONMENT(HSE)
45
Development in training positions
1992 1993 1994 1995 1996 1997 1998 1999 2000 2001 2002
15
12
9
6
3
0
No. of trainees Left or continued education
From training to ordinary positions Need for new employees 1999 - 2002
From the left: Captain Alf Giske, ElectricanJostein Ringstad, Chief Engineer EinarStorhaug, Captain Terje Giske, Mrs ElseMarie Furnes (posthumously to CaptainJostein Furnes), and Sverre A. Farstadreceiving the «Norges Vel» Medal for morethan 30 years of service with the sameemployer.
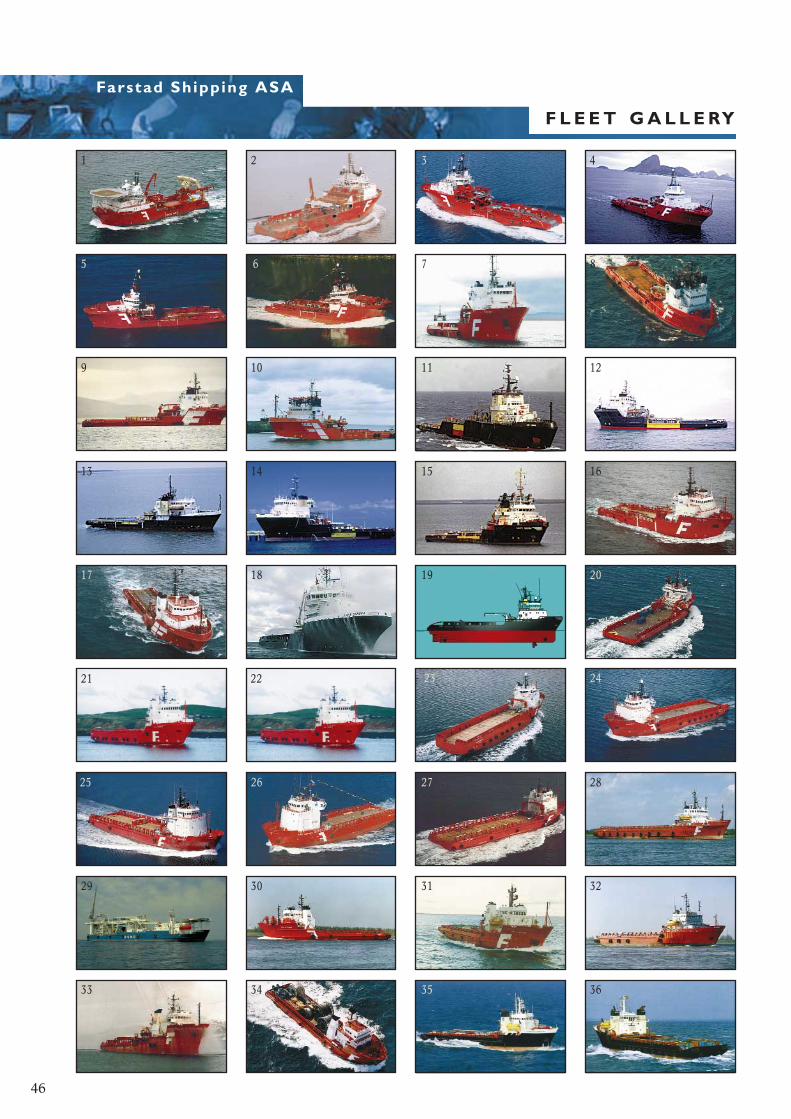
Farstad Shipping ASA
5
1 2 3 4
5 6 7 8
9 10 11 12
13 14 15
19
16
17 18 20
2221 23 24
25 26 27 28
29 30 31 32
35 3633 34
F L E E T G A L L E RY
46
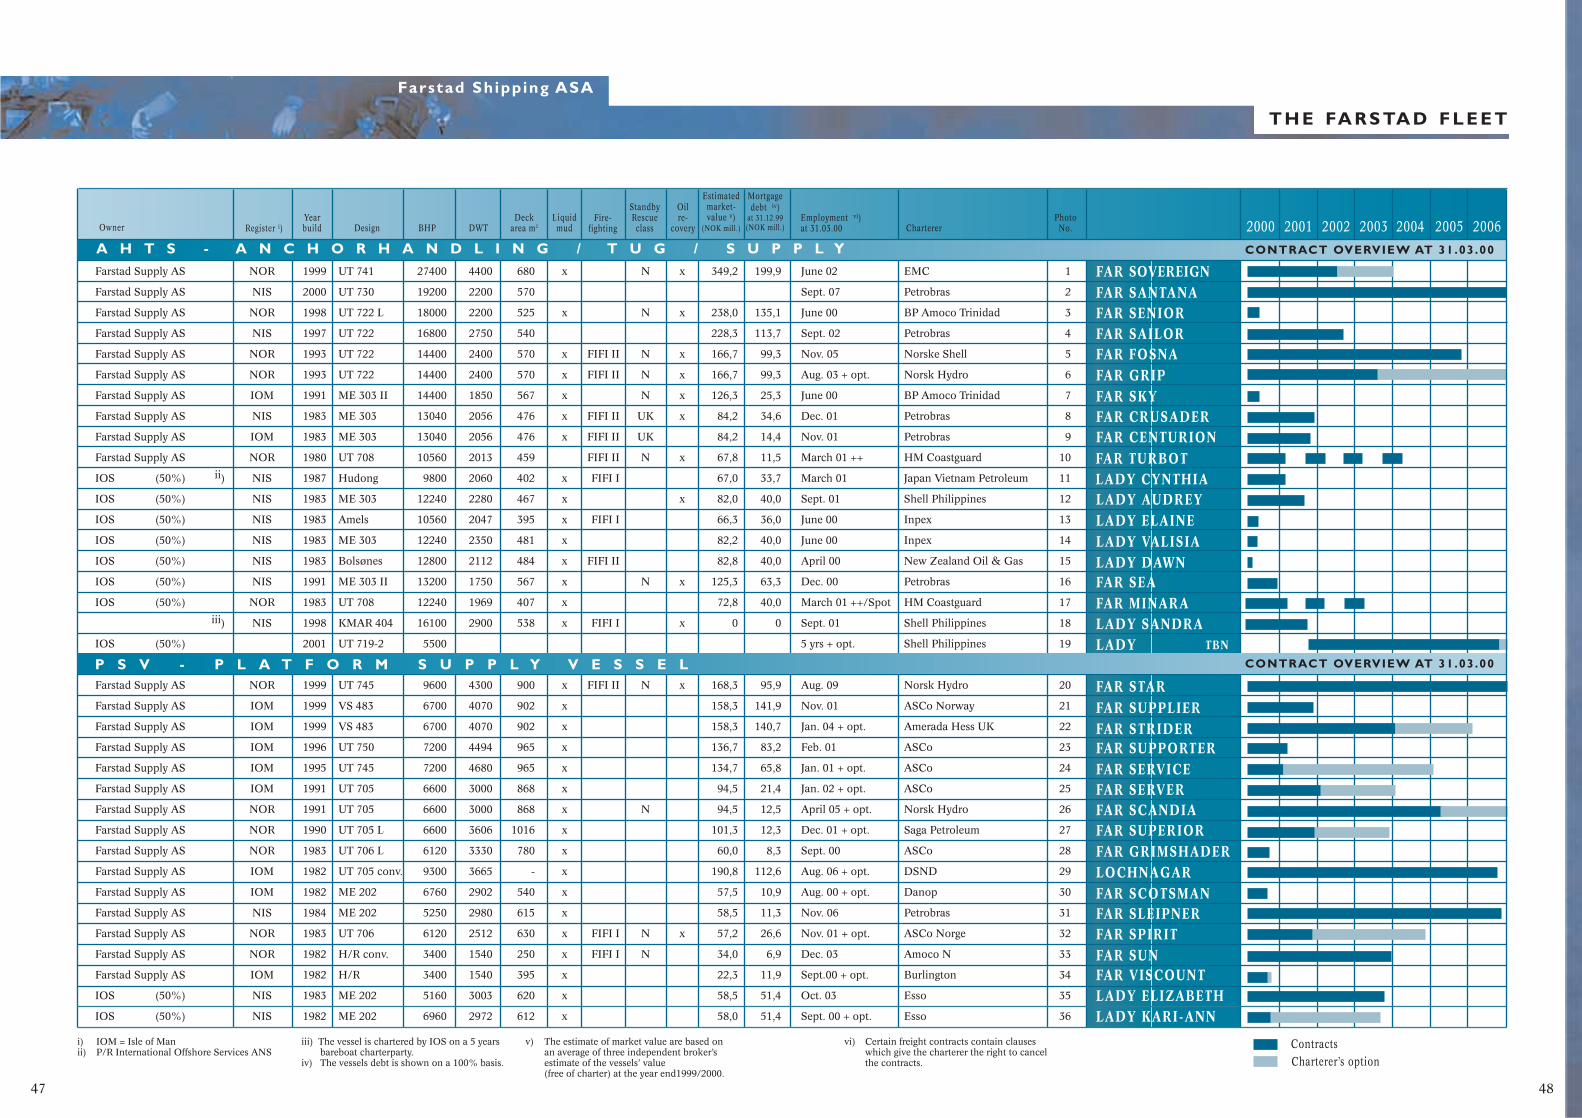
Mortgagedebt iv)
at 31.12.99 (NOK mill.)
Estimated market-value v)
(NOK mill.)Register i) Yearbuild Design BHP DWT
Deckarea m2
Liquid mud
Fire-fighting
Standby Rescue class
Oilre-
covery Owner
FAR SOVEREIGNFAR SANTANAFAR SENIORFAR SAILORFAR FOSNAFAR GRIPFAR SKYFAR CRUSADER
LADY AUDREYLADY ELAINELADY VALISIALADY DAWNFAR SEAFAR MINARA
FAR CENTURIONFAR TURBOT
LADY SANDRALADY TBN
LADY CYNTHIA
FAR SERVICEFAR SUPPORTERFAR STRIDERFAR SUPPLIERFAR STAR
FAR SERVERFAR SCANDIA
LOCHNAGARFAR SCOTSMANFAR SLEIPNERFAR SPIRITFAR SUNFAR VISCOUNTLADY ELIZABETHLADY KARI-ANN
FAR SUPERIOR FAR GRIMSHADER
ContractsCharterer’s option
Employment vi) at 31.03.00 Charterer
Photo No. 2000 2001 2002 2003 2004 2005 2006
A H T S - A N C H O R H A N D L I N G / T U G / S U P P L Y CONTRACT OVERVIEW AT 31.03.00
i) IOM = Isle of Manii) P/R International Offshore Services ANS
iii) The vessel is chartered by IOS on a 5 years bareboat charterparty.
iv) The vessels debt is shown on a 100% basis.
v) The estimate of market value are based on an average of three independent broker’s estimate of the vessels’ value (free of charter) at the year end1999/2000.
Farstad Supply AS NOR 1999 UT 741 27400 4400 680 x N x 349,2 199,9 June 02 EMC 1
Farstad Supply AS NIS 2000 UT 730 19200 2200 570 Sept. 07 Petrobras 2
Farstad Supply AS NOR 1998 UT 722 L 18000 2200 525 x N x 238,0 135,1 June 00 BP Amoco Trinidad 3
Farstad Supply AS NIS 1997 UT 722 16800 2750 540 228,3 113,7 Sept. 02 Petrobras 4
Farstad Supply AS NOR 1993 UT 722 14400 2400 570 x FIFI II N x 166,7 99,3 Nov. 05 Norske Shell 5
Farstad Supply AS NOR 1993 UT 722 14400 2400 570 x FIFI II N x 166,7 99,3 Aug. 03 + opt. Norsk Hydro 6
Farstad Supply AS IOM 1991 ME 303 II 14400 1850 567 x N x 126,3 25,3 June 00 BP Amoco Trinidad 7
Farstad Supply AS NIS 1983 ME 303 13040 2056 476 x FIFI II UK x 84,2 34,6 Dec. 01 Petrobras 8
Farstad Supply AS IOM 1983 ME 303 13040 2056 476 x FIFI II UK 84,2 14,4 Nov. 01 Petrobras 9
Farstad Supply AS NOR 1980 UT 708 10560 2013 459 FIFI II N x 67,8 11,5 March 01 ++ HM Coastguard 10
IOS (50%) ii) NIS 1987 Hudong 9800 2060 402 x FIFI I 67,0 33,7 March 01 Japan Vietnam Petroleum 11
IOS (50%) NIS 1983 ME 303 12240 2280 467 x x 82,0 40,0 Sept. 01 Shell Philippines 12
IOS (50%) NIS 1983 Amels 10560 2047 395 x FIFI I 66,3 36,0 June 00 Inpex 13
IOS (50%) NIS 1983 ME 303 12240 2350 481 x 82,2 40,0 June 00 Inpex 14
IOS (50%) NIS 1983 Bolsønes 12800 2112 484 x FIFI II 82,8 40,0 April 00 New Zealand Oil & Gas 15
IOS (50%) NIS 1991 ME 303 II 13200 1750 567 x N x 125,3 63,3 Dec. 00 Petrobras 16
IOS (50%) NOR 1983 UT 708 12240 1969 407 x 72,8 40,0 March 01 ++/Spot HM Coastguard 17
iii) NIS 1998 KMAR 404 16100 2900 538 x FIFI I x 0 0 Sept. 01 Shell Philippines 18
IOS (50%) 2001 UT 719-2 5500 5 yrs + opt. Shell Philippines 19
Farstad Supply AS NOR 1999 UT 745 9600 4300 900 x FIFI II N x 168,3 95,9 Aug. 09 Norsk Hydro 20
Farstad Supply AS IOM 1999 VS 483 6700 4070 902 x 158,3 141,9 Nov. 01 ASCo Norway 21
Farstad Supply AS IOM 1999 VS 483 6700 4070 902 x 158,3 140,7 Jan. 04 + opt. Amerada Hess UK 22
Farstad Supply AS IOM 1996 UT 750 7200 4494 965 x 136,7 83,2 Feb. 01 ASCo 23
Farstad Supply AS IOM 1995 UT 745 7200 4680 965 x 134,7 65,8 Jan. 01 + opt. ASCo 24
Farstad Supply AS IOM 1991 UT 705 6600 3000 868 x 94,5 21,4 Jan. 02 + opt. ASCo 25
Farstad Supply AS NOR 1991 UT 705 6600 3000 868 x N 94,5 12,5 April 05 + opt. Norsk Hydro 26
Farstad Supply AS NOR 1990 UT 705 L 6600 3606 1016 x 101,3 12,3 Dec. 01 + opt. Saga Petroleum 27
Farstad Supply AS NOR 1983 UT 706 L 6120 3330 780 x 60,0 8,3 Sept. 00 ASCo 28
Farstad Supply AS IOM 1982 UT 705 conv. 9300 3665 - x 190,8 112,6 Aug. 06 + opt. DSND 29
Farstad Supply AS IOM 1982 ME 202 6760 2902 540 x 57,5 10,9 Aug. 00 + opt. Danop 30
Farstad Supply AS NIS 1984 ME 202 5250 2980 615 x 58,5 11,3 Nov. 06 Petrobras 31
Farstad Supply AS NOR 1983 UT 706 6120 2512 630 x FIFI I N x 57,2 26,6 Nov. 01 + opt. ASCo Norge 32
Farstad Supply AS NOR 1982 H/R conv. 3400 1540 250 x FIFI I N 34,0 6,9 Dec. 03 Amoco N 33
Farstad Supply AS IOM 1982 H/R 3400 1540 395 x 22,3 11,9 Sept.00 + opt. Burlington 34
IOS (50%) NIS 1983 ME 202 5160 3003 620 x 58,5 51,4 Oct. 03 Esso 35
IOS (50%) NIS 1982 ME 202 6960 2972 612 x 58,0 51,4 Sept. 00 + opt. Esso 36
P S V - P L A T F O R M S U P P L Y V E S S E L CONTRACT OVERVIEW AT 31.03.00
T H E FA R S TA D F L E E T
Farstad Shipping ASA
vi) Certain freight contracts contain clauses which give the charterer the right to cancel the contracts.
47 48

Offshore Supply vessels:PSV:Platform supply vessel.Ship specially designed for transportationof suppliers and equipment to/from offshore installations.Transporting individual items mainly in containers ondeck, in addition to a variety of differentproducts (dry and wet) in separate tanks.Also transporting pipes to pipe-laying activities.
AHTS:Anchor Handling Tug Supply Vessel.Offshore Supply vessel specially designedto provide anchor handling services andtow offshore platforms, barges and production modules/vessels.The AHTS is equipped for fire fighting, rescue opera-tions and oil recovery.
MOSV:Multifunctional Offshore Service Vessel:Ship which can provide not only anchorhandling and supply services but also advanced offshore services such as layingflexible pipes, trenching the seabed,operating ROVs and installation work onthe seabed (eg installing permanent mooring systems).
Farstad Shipping ASA
G L O S S A RY
Words and phrasesASA: Public limited company in Norway
AUD: Australian dollar
Bareboat agreement: Agreement regarding chartering of a vessel where the
operating costs are the charterers responsibility.
Charterer: The company paying for the assignment.
BHP: Brake Horse Power, measure of engine power.
Bollard Pull: A tug’s pulling power in tonnes.
BRL: Brazilian Real, the currency of Brazil.
Boat-year: Use of one vessel for one year.
Charter party (CP): Contract for hireing a ship.
DNV: Det Norske Veritas. Classification company.
Controlling and approving the vessels technical condi-
tion, security and quality according to the company’s
own ruels and the national laws.
DPS: Dynamic positioning system: Used to hold a vessel
and/or other floating installation in an exact position.
DWT: Dead Weight Tonnes. The vessels carrying capacity me
asured in tonnes of cargo and suppliers.
FAR: The company code on the Oslo Stock Exchange.
Fi-Fi: Fire fighting, classification for fire fighting equipment
GBP: Great Britain Pounds
IMO: International Maritime Organization - The UN’s
advisory committee
IOM: Isle of Man
ISM: International Safety Management Code
ISO: International Standards Organization
Jackup: Jackup drilling/production platform.
LIBOR: London Interbank Offered Rate
Moonpool: An opening in the hull of a vessel for operating ROVs
and laying flexible pipes (MOSVs) or drilling
(drillships).
NIS: Norwegian International Shipping Register.
NOK: Norwegian krone.
NOR: Norwegian Ordinary Shipping Register.
ROV: Remotely Operated Vehicles: submarine unit used for
inspection and maintenance work.
Semi submersible: Semi submersible drilling/production platform.
Spot rate: Rates for single assignments based on the current
market situation.
Stand-By: Vessel specially equipped for emergency rescue
operations close to an offshore installation.
STCW: Standard of Training, Certification and Watchkeeping
(international convention).
USD: American dollar.
49

FARSTAD SHIPPING ASA
P.O. Box 1301, 6001 Ålesund
Notenesgt.14
Norway
Tel: +47 70 12 44 60
Fax: +47 70 12 85 30
Tlx: 42 755 TYFAR N
e-mail: [email protected]
FARSTAD SHIPPING LTD.
Farstad House, Badentoy Avenue.
Badentoy Park, Portlethen,
Aberdeen AB12 4YB Scotland
Tel: +44 1 224 784 000
Fax: +44 1 224 783 340
Tlx: 73310
e-mail: [email protected]
IOS
(International Offshore Services)
c/o P&O Maritime Services Pty Ltd.
GPO Box 88 A, Melbourne, 3001
99 Queensbridge Street
Southbank, Victoria, 3006
Tel: +61 3 9254 1666
Fax: +61 3 9686 9268
e-mail: [email protected]
BOS Navegacao LTDA
(Brazilian Offshore Services)
Rua Abilio Moreira de Miranda,
606 Parque Valentina Miranda
CEP 27915-250 Macae - RJ, Brasil
Tel: +55 24 762 1959
Fax: +55 24 762 0593
e-mail: [email protected]
©V
isue
ll-
04.0
0